targets and indicators for chronic disease prevention in ... · targets and indicators for chronic...
TRANSCRIPT

Targets and indicators for chronic disease prevention in Australia
Technical paper No. 2015-08
November 2015Kevin McNamara, Andrew Knight, Michael Livingston,
Kypros Kypri, Jonathan Malo, Lyn Roberts, Sonya Stanley,
Carley Grimes, Bruce Bolam, Michelle Gooey, Mike Daube,
Sharleen O’Reilly, Stephen Colagiuri, Anna Peeters,
Penny Tolhurst, Philip Batterham, James Dunbar,
& Maximilian de Courten
ISBN 978-0-9944893-0-2
Targets and indicators for chronic disease prevention in Australia Technical paper No. 2015-08
November 2015
ii
Acknowledgements
The Australian Health Policy Collaboration sincerely thanks all members of the working groups who contributed to this report; Dr Jason Leung, and Associate Professor John Glover. The assistance of staff from the Australian Bureau of Statistics and Australian Institute of Health and Welfare in responding to technical queries regarding indicators is also gratefully acknowledged.
The Australian Health Policy Collaboration
The Australian Health Policy Collaboration was established at Victoria University in 2015 to build from the work of the health program at the Mitchell Institute over the previous two years. The Collaboration is an independent think tank that aims to attract much required attention to the critical need for substantial and urgent health policy reform focused on addressing chronic disease on a national scale.
Suggested Citation
McNamara, K, Knight, A, Livingston, M, Kypri, K, Malo, J, Roberts, L, Stanley, S, Grimes, C, Bolam, B, Gooey, M, Daube, M, O’Reilly, S, Colagiuri, S, Peeters, A, Tolhurst, P, Batterham, P, Dunbar, JA & De Courten, M (2015), Targets and indicators for chronic disease prevention in Australia, Australian Health Policy Collaboration technical paper No. 2015-08, AHPC, Melbourne.
Targets and indicators for chronic disease prevention in Australia Technical paper No. 2015-08
November 2015
iii
Targets and indicators for chronic disease prevention in Australia
Technical paper No. 2015-08
November 2015Kevin McNamara, Andrew Knight, Michael Livingston,
Kypros Kypri, Jonathan Malo, Lyn Roberts, Sonya Stanley,
Carley Grimes, Bruce Bolam, Michelle Gooey, Mike Daube,
Sharleen O’Reilly, Stephen Colagiuri, Anna Peeters,
Penny Tolhurst, Philip Batterham, James Dunbar,
& Maximilian de Courten
ISBN 978-0-9944893-0-2

Targets and indicators for chronic disease prevention in Australia Technical paper No. 2015-08
November 2015
iv
Targets and indicators for chronic disease prevention in Australia Technical paper No. 2015-08
November 2015
v
Table of Contents v
Foreword vii
List of Abbreviations viii
List of Figures ix
List of Tables x
1. Introduction 1
1.1 Process 1 1.2 Overarching themes 2 1.3 Proposed targets and indicators 42. Mortality and morbidity, and high-risk populations 8
2.1 Key findings 8 2.2 Introduction 8 2.3 Relevance of WHO targets 10 2.4 Proposed Australian target and indicators and feasibility 10 2.5 Discussion 14 Key data sources and references 163. Alcohol 18
3.1 Key findings 18 3.2 Introduction 18 3.3 Relevance of WHO targets 20 3.4 The case for reforming Australian healthcare funding 20 3.5 Discussion 21 References 224. Physical inactivity 25
4.2 Introduction 26 4.3 Relevance of WHO targets 26 4.4 Proposed Australian target and indicators and feasibility 27 4.5 Discussion 28 4.6 Acknowledgement 29 References 295. Salt 31
5.1 Key findings 31 5.2 Introduction 32 5.3 Salt intake in Australia 32 5.4 Policy initiatives to reduce salt intake of Australians 33 5.5 Proposed Australian target, indicators and feasibility 34 5.6 Discussion 35 References 35
Table of Contents
Targets and indicators for chronic disease prevention in Australia Technical paper No. 2015-08
November 2015
vi
6. Tobacco 37
6.1 Key findings 376.2 Introduction 376.3 Relevance of WHO targets 386.4 Proposed Australian target and indicators and feasibility 386.5 Discussion 406.6 Key data sources 41References 41
7. Diabetes and obesity 44
7.1 Key findings 447.2 Current rates of obesity in Australia 447.3 Prevalence of diabetes 467.4 Equity of risk 467.5 Proposed Australian targets and indicators and their assessment 477.6 Policy initiatives to address obesity and diabetes rates in Australians 477.7 Discussion 47References 48
8. Mental Health 51
8.1 Key findings 518.2 Introduction 528.3 Relevance of WHO targets 548.4 Proposed Australian target and indicators and feasibility 548.5 Discussion 55Key data sources and references 56
9. Conclusion 59
References 60Appendix One: Working Group members 61
Appendix Two: the case for strengthening salt regulation in Australia 64
Targets and indicators for chronic disease prevention in Australia Technical paper No. 2015-08
November 2015
vii
Foreword
The aim of the Australian Health Policy Collaboration (AHPC) is to contribute to a whole of population approach in policies, funding, institutional arrangements and service models to better prevent and manage chronic diseases in Australia. AHPC works to improve health outcomes through evidence-based research, particularly for socioeconomically disadvantaged Australians.
In earlier work, the Collaboration has outlined how leadership and vision by experts had led Australia into a long standing road safety strategy, reducing the harm to our population from preventable driving, road and vehicle design risks.
We have the historical lessons and recent experiences of public health strategies to prevent infectious diseases and protect our population from potential epidemics. We know the significant health benefits of leadership by health experts and governments over recent decades to reduce tobacco use. We have benefitted from the leadership of experts and stakeholders and investment by governments in achieving national commitment to the prevention and management of HIV-AIDS.
The work set out in this report aims to provide similar leadership in the face of preventable chronic diseases and their impact on the Australian population.
We have established a national coalition of effort through both the operations of seven working groups presented in this report, and the organisations that have supported our statement of commitment to prevention.
We have produced targets and indicators that can support, guide and track progress towards a substantial change in the health of our nation.
We will now work with others to develop leading health indicators that will have the most immediate impact on improving the health of Australians and our communities – and we invite federal, state and local government, health organisations and service providers to engage with this work and thereby access the output from a substantial coalition of experts, to improve their range of options, their policies and their investments.
And we will also work to demonstrate the cost-benefits of investment by governments and the community in prevention.
We thank all those who have committed their time and their knowledge voluntarily to this work. It is a measure of the national significance of chronic diseases that so many experts have been willing to contribute to this report and to take it to policy makers and the public in forthcoming months.
We anticipate that this work will promote debate in the policy community and encourage new action on chronic diseases and their prevention.
Rosemary Calder Director Australian Health Policy Collaboration
Targets and indicators for chronic disease prevention in Australia Technical paper No. 2015-08
November 2015
viii
List of Abbreviations
ABS Australian Bureau of Statistics
ASSAD Australian School Students Alcohol and Drug Survey
AHS Australian Health Survey
APCC Australian Primary Care Collaboratives
ATSI Aboriginal and Torres Strait Islander
BMI Body mass index
COAG Council of Australian Governments
COPD chronic obstructive pulmonary disease
CRESP Centre of Research Excellence in Suicide Prevention
CVD cardiovascular disease(s)
GP general practitioner
HILDA Household Income and Labour Dynamics in Australia
HPV Human Papillomavirus Virus
IOTF International Obesity Taskforce
NAIP National Alcohol Indicators Project
NATSIHS National Aboriginal and Torres Strait Islander Health Survey
NBCSP National Bowel Cancer Screening Program
NCD Noncommunicable Disease
NDSHS National Drug Strategy Household Survey
NHS National Health Survey
NMHC National Mental Health Commission
NMHPSC National Mental Health Performance Subcommitee
NMHPMS National Mental Health Plan Measurement Strategy
NPHS National Preventive Health Strategy
NPHT National Preventative Health Taskforce
NSMHWB National Survey of Mental Health and Wellbeing
NTS National Tobacco Strategy
SES socioeconomic status
WHO World Health Organization
Targets and indicators for chronic disease prevention in Australia Technical paper No. 2015-08
November 2015
ix
List of Figures
3.1A: Prevalence of monthly risky episodic drinking among Australians aged 15 years and over by gender, 2001-2013 19
3.1B: Alcohol-related Emergency Department presentations per 1,000 persons, aged 15 years and older, by gender, 2005-06 – 2011-12 (all states excluding Tasmania) 19
4.1: Prevalence of sufficient physical activity from state- and territory-based surveys in Australia, 2001 to 2013 26
4.2: Physical activity trends in Western Australia, 1999 to 2009 27
5.1: Sources of salt in the Australian diet 32
5.2: Trend in daily salt intake amongst men and women aged 18 years and over determined via 24-hour urine collection 33
5.3: Baseline assessment of salt intake using data from men and women aged 25 to 78 years within the Victorian Health Monitor survey (2011) and the equivalent salt intake to be achieved by 2025 34
6.1: Prevalence of daily smoking among Australians aged 14 years and above with linear trend indicated 39
6.2: Prevalence of daily smoking among Australian children and adolescents aged 12–17 years and above, with linear trend indicated 39
7.1: Prevalence of overweight/obesity in Australian adults, aged 18 years and over 45
7.2: Prevalence of overweight/obesity in Australian children aged 5–17 45
7.3: Prevalence of self-reported diabetes, age 18 years and over 46
8.1: Average annual suicide rates per 100,000 population by five-year period 52
Targets and indicators for chronic disease prevention in Australia Technical paper No. 2015-08
November 2015
x
List of Tables
1.1: WHO targets and AHPC working groups 3
1.2: Targets and indicators proposed for implementation in Australia 5
1.3: Additional targets and indicators proposed for implementation in Australia 7
2.1: WHO morbidity target and indicator 8
2.2: Proposed Australian targets and indicators for reduction of premature mortality in noncommunicable disease 11
2.3: Proposed Australian targets and indicators for reduction of premature mortality in noncommunicable disease (not currently available) 12
2.4: Proposed health service delivery sub-indicators to achieve health targets 13
3.1: WHO alcohol target and indicators 18
3.2: Indicators for monitoring Australia’s progress in reducing the harmful use of alcohol 20
4.1: WHO physical inactivity target and indicators 25
4.2: Physical activity guidelines and recommendations in Australia (Australian Government Department of Health 2014) 25
4.3: Prevalence of insufficiently active persons in Australia 2011/12 and corresponding WHO targets by age group 27
5.1: WHO salt target and indicator 31
6.1: WHO tobacco target and indicators 37
7.1: WHO diabetes and obesity target and indicators 44
8.1: Selected WHO mental health targets and indicators 51
8.2: Proposed Australian mental health targets and indicators 55
1
Targets and indicators for chronic disease prevention in Australia Technical paper No. 2015-07
November 2015
1. Introduction
The burden of chronic diseases is a major public policy challenge that threatens the health of individuals and communities and Australia’s future economic prosperity. We have an unacceptably high rate of risk factors for chronic diseases, including obesity, physical inactivity, alcohol misuse and poor nutrition. Action is urgently required in relation to modifiable risk factors that contribute to disease and disability in Australia. This paper proposes a set of national chronic disease targets and indicators as a means of measuring progress and enhancing accountability for action.
Chronic diseases are responsible for nine out of ten deaths in Australia. Many Australians living with chronic diseases such as diabetes, mental illness and cancer, experience reduced quality of life and disability over many years. Chronic diseases result in a significant economic burden because of the combined effects of healthcare costs and lost productivity. It has been estimated that eliminating chronic diseases could increase the workforce by 10 per cent and boost the productivity of the Australian economy correspondingly (Business Council of Australia 2011).
Australia is a party to the World Health Organization’s (WHO) Global Action Plan for the Prevention and Control of Noncommunicable Diseases (NCDs) 2013-2020 (2013a). The Global Action Plan aims to reduce the burden of NCDs by 2025, through action on nine targets measured by 25 indicators of performance (WHO 2013). WHO states that all countries need to set national NCD targets; develop and implement policies to attain them; and establish a monitoring framework to track progress. Following a UN General Assembly Review, countries committed to action including:
• by 2015, set national NCD targets for 2025, consistent with voluntary global targets;
• by 2015, develop national NCD multisectoral plans to achieve the national targets;
• by 2016, implement policies and interventions to reduce NCD risk factors and underlying social determinants; and
• report on progress in attaining the global targets, using the established indicators in the global monitoring framework.
A recent progress report (WHO 2014) notes that while some countries are making progress, most are not on course to meet the global NCD targets. The AHPC has auspiced a project that relates to the WHO 25 x 25 approach, and proposes national chronic disease targets and associated indicators for 2025.
1.1 Process
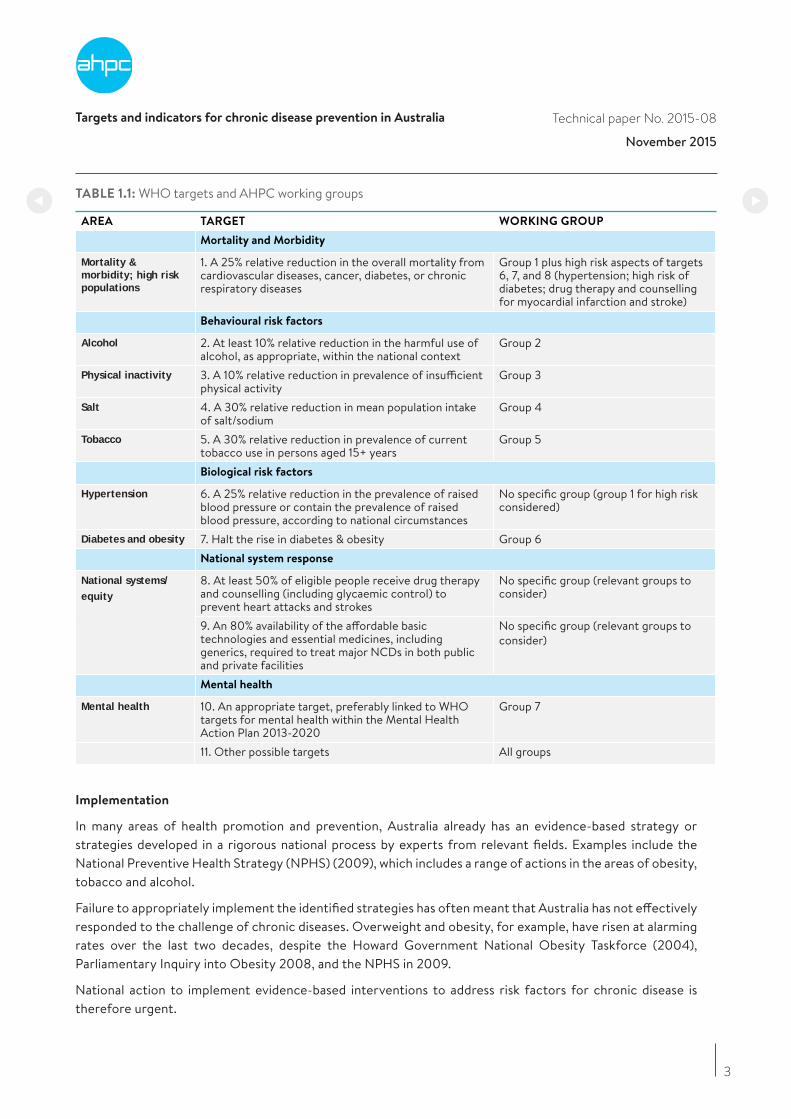
The AHPC supported project established seven working groups to review the suitability of the WHO 25x25 targets and indicators for Australia. In contrast to the WHO approach, this work included mental health, in recognition that mental health is a significant area of chronic disease affecting a substantial proportion of the Australian population (Table 1.1).
The purpose of the working groups was to tailor or develop chronic disease targets and indicators for Australia consistent with their subject area/topic (for example, salt or obesity). Six of the groups drew on the Global Action Plan, and the mental health group drew on the WHO Mental Health Action Plan 2013-2020 global targets and indicators (WHO 2013b). The working groups utilised relevant national policy documents, and consulted and collaborated with key stakeholders in health, including non-government organisations, academics, implementers, and policymakers.
Targets and indicators for chronic disease prevention in Australia Technical paper No. 2015-08
November 2015
2
Groups worked to a common set of terms of reference. These included criteria for selecting indicators, namely that chronic disease indicators must:
• be relevant1;
• be applicable across population groups;
• be technically sound (valid, reliable, sensitive (to change over time) and robust);
• be feasible to collect and report;
• lead to action (at various population levels, for example, individual, community, organisation/agency);
• be timely2; and
• be marketable (AIHW 2011).
The groups met between September and November 2015, and each had a designated chair and a rapporteur. Participation was voluntary and AHPC gratefully acknowledges the time and effort of all members of the working groups. Membership of the groups is listed in Appendix One.
1.2 Overarching themes
Most of the working groups focused on a specific risk factor or disease, but common themes emerged that are significant to all risk factors. These are outlined below.
Health surveillance
Accurate monitoring of chronic diseases and related risk factors requires a national commitment to regular collection of risk factor data for chronic diseases (including anthropometric, biomedical and environmental measures). The Australian Health Survey (AHS) carried out in 2011/12 provided a baseline for more comprehensive health surveillance than has previously been available nationally, and instituting this survey at five-yearly intervals was strongly supported by the working groups. Regular surveillance is needed to assess changes over time, and to provide current information about health needs and risk factors that can inform future policy and planning.
The AHS expanded the traditional National Health Survey (NHS) and National Aboriginal and Torres Strait Islander Health Survey (NATSIHS) to collect information on physical activity and nutrition behaviours, anthropometric and biomedical measures of nutrition status and chronic disease risk in the general and Aboriginal and Torres Strait Islander (ATSI) populations. The 2011-13 AHS was the first survey since 1995 to gather information about the nutritional status of Australians. From 2014/15 the AHS will revert to its traditional form, that is, the NHS and NATSIHS (http://www.health.gov.au/nutritionmonitoring).
More broadly, improved data collection about risk factors would assist assessment of progress. Collection of alcohol sales data, for example, is mandatory in WA and NT. National collection of this data would substantially improve surveillance and the capacity to assess effects of policy changes.
In some areas, further development of indicators or improved regular data collection is needed. In mental health, work that commenced with the Fourth National Mental Health Plan Measurement Strategy should be progressed, for example, collection and reporting of employment and education indicators for consumers of specialised mental health services. Another example is salt, where data collection could be improved through use of 24-hour urine collection samples.
1 The indicator covers an area or subject of key importance in terms of: the impact on health outcomes, and/or a significant area of health system policy focus. Reporting against this indicator is likely to help decision-makers identify opportunities for improvement. Adapted from COAG (2011). 2 Timely measures have information available frequently enough, and with sufficient currency, to have value in making decisions.
Targets and indicators for chronic disease prevention in Australia Technical paper No. 2015-08
November 2015
3
TABLE 1.1: WHO targets and AHPC working groups
AREA TARGET WORKING GROUP
Mortality and Morbidity
Mortality & morbidity; high risk populations
1. A 25% relative reduction in the overall mortality from cardiovascular diseases, cancer, diabetes, or chronic respiratory diseases
Group 1 plus high risk aspects of targets 6, 7, and 8 (hypertension; high risk of diabetes; drug therapy and counselling for myocardial infarction and stroke)
Behavioural risk factors
Alcohol 2. At least 10% relative reduction in the harmful use of alcohol, as appropriate, within the national context
Group 2
Physical inactivity 3. A 10% relative reduction in prevalence of insufficient physical activity
Group 3
Salt 4. A 30% relative reduction in mean population intake of salt/sodium
Group 4
Tobacco 5. A 30% relative reduction in prevalence of current tobacco use in persons aged 15+ years
Group 5
Biological risk factors
Hypertension 6. A 25% relative reduction in the prevalence of raised blood pressure or contain the prevalence of raised blood pressure, according to national circumstances
No specific group (group 1 for high risk considered)
Diabetes and obesity 7. Halt the rise in diabetes & obesity Group 6National system response
National systems/ equity
8. At least 50% of eligible people receive drug therapy and counselling (including glycaemic control) to prevent heart attacks and strokes
No specific group (relevant groups to consider)
9. An 80% availability of the affordable basic technologies and essential medicines, including generics, required to treat major NCDs in both public and private facilities
No specific group (relevant groups to consider)
Mental health
Mental health 10. An appropriate target, preferably linked to WHO targets for mental health within the Mental Health Action Plan 2013-2020
Group 7
11. Other possible targets All groups
Implementation
In many areas of health promotion and prevention, Australia already has an evidence-based strategy or strategies developed in a rigorous national process by experts from relevant fields. Examples include the National Preventive Health Strategy (NPHS) (2009), which includes a range of actions in the areas of obesity, tobacco and alcohol.
Failure to appropriately implement the identified strategies has often meant that Australia has not effectively responded to the challenge of chronic diseases. Overweight and obesity, for example, have risen at alarming rates over the last two decades, despite the Howard Government National Obesity Taskforce (2004), Parliamentary Inquiry into Obesity 2008, and the NPHS in 2009.
National action to implement evidence-based interventions to address risk factors for chronic disease is therefore urgent.
Targets and indicators for chronic disease prevention in Australia Technical paper No. 2015-08
November 2015
4
Equity
The disproportionate effect of chronic diseases and risk factors on disadvantaged groups needs to be measured – through appropriate sub-indicators – and addressed. Chronic diseases and their risk factors and determinants have a social gradient, and occur more often and with greater effect among socioeconomically disadvantaged Australians. In 2011/12, people living in areas of lowest socioeconomic status (SES) were 2.3 times as likely to smoke as those living in the highest (ABS 2013).
Many indicators of chronic disease can be analysed by selected population characteristics, such as SES or location. The working groups supported consideration of equity through sub-indicators that examine ATSI status, SES, geographic location, and where possible, mental illness.
Disadvantaged groups may require tailored interventions (such as smoking cessation programs for people with mental illness). Without such interventions, inequity can be exacerbated. For example, while the prevalence of current smokers in Australia has decreased over time, the disparity between the highest and lowest quintiles of SES has increased (Leung & Tolhurst 2015).
Clinical data collection and linkage
Improved prevention and management of chronic diseases would be aided by improved data collection and linkage, both in primary care and more broadly. Primary care has an important role in assessing, preventing and managing chronic diseases and associated risk factors. Data, including patient health outcomes data, need to be collected and used to continually improve primary health care. This is important not just to measure national progress against targets, but also to assist with quality improvement at a local level.
Performance data should be regularly fed back to clinicians, and acts as both a motivational tool and an educational tool to demonstrate the efficacy of their efforts. A uniform approach to the collection of clinical outcomes in general practice to improve patient care is a national priority.
1.3 Proposed targets and indicators
The seven working groups proposed targets and indicators for their subjects. In some cases, the WHO target and indicators were adopted; in others, the WHO approach was amended or extended.
The full set of targets and indicators that are proposed for implementation in Australia now are listed in Table 1.2. The working groups supported the development of additional targets or indicators as per Table 1.3. Many of the indicators in Table 1.3 are not currently feasible to collect and report nationally, and further development would be required to implement them.

Targets and indicators for chronic disease prevention in Australia Technical paper No. 2015-08
November 2015
TABLE 1.2: Targets and indicators proposed for implementation in Australia
FRAMEWORK
ELEMENT
PROPOSED
AUSTRALIAN TARGET
PROPOSED AUSTRALIAN INDICATORS
Mortality and Morbidity
Premature mortality from noncommunicable disease
1. 25% reduction in the overall mortality from cardiovascular diseases, cancer, chronic respiratory diseases and diabetes
• Unconditional probability of dying between ages of 30 and 70 years from cardiovascular diseases, cancer, diabetes, or chronic respiratory diseases
• Age-standardised rates of unplanned admission for patients aged between 30 and 70 years admitted to hospital with a primary diagnosis of cardiovascular diseases, cancer, diabetes, or chronic respiratory diseases
• Age-standardised rates of unplanned readmission for patients aged between 30 and 70 years admitted to hospital with an initial primary diagnosis of cardiovascular diseases, cancer, diabetes, or chronic respiratory diseases
a. 25% reduction in the overall mortality from cardiovascular diseases and diabetes
• Unconditional probability of dying between ages of 30 and 70 from cardiovascular diseases
• Unconditional probability of dying between ages of 30 and 70 from diabetes
• Age-standardised average blood pressure among patients with chronic kidney disease, and percent of adults aged 18 years or more with elevated blood pressure (≥ 140/90 mmHg)
b. 25% reduction in the overall mortality from chronic respiratory diseases
c. Elimination of asthma deaths in adults aged under 65 years
• Unconditional probability of dying between ages of 30 and 70 from chronic obstructive pulmonary disease
• Unconditional probability of dying between ages of 30 and 70 from asthma
• Percent of patients aged 30-70 years who are readmitted within 28 days of discharge following a hospital admission related to asthma or COPD
d. 25% reduction in the overall mortality from cancer
• Unconditional probability of dying between ages of 30 and 70 from cancer
• One-year survival rates for individuals diagnosed with the following cancers (individual indicators): lung, breast, colorectal, cervix, melanoma and prostate
e. Reduction in the national suicide rate by 10% by 20203
• The suicide rate as an age-standardised rate per 100,000 population
Behavioural risk factors
Harmful use of alcohol
2. At least 10% relative reduction in the harmful use of alcohol, with regard to:
• Per capita consumption; and
• Heavy episodic drinking; and
• Alcohol-related morbidity and mortality
• Apparent consumption of pure alcohol per capita (aged 15+), based on excise data, import clearances and sales data from Australian produced wine.
• Heavy episodic drinking: Proportion of the population (aged 15+) reporting monthly or more frequent episodes of drinking where 5 or more standard drinks were consumed in a single occasion
• Heavy episodic drinking among adolescents: Proportion of the adolescent (12-17 yo) population reporting at least one drinking occasion where 5 or more standard drinks were consumed in the previous week.
• Long-term risky drinking: Proportion of the population (aged 15+) reporting average alcohol consumption of more than two standard drinks per day over the past year. (gender split)
• Emergency department presentations: Presentations for injury (S & T ICD-10 codes) to Australian Emergency Departments (excluding Tasmania) at any of the following times: Fridays, 22:00 to 23:59; Saturdays, 0:00 to 3:59; 22:00 to 23:59; Sundays, 0:00 to 3:59 and 18:00 to 23:59). Rate per 100,000 population. (gender and age (<30, 30+)
• Hospital admissions for alcohol use disorders: Hospital admissions with primary diagnoses of ICD-9-CM codes; 291.0-291.9, 303.0-303.9, 305.0 and ICD-10-AM codes; F10.0-F10.9. Rate per 100,000 population. (gender split)
• Alcoholic liver disease deaths: Mortality rates with primary cause of alcoholic liver cirrhosis (ICD-9-CM codes: 571.0, 571.1, 571.2, 571.3 ICD-10-AM codes: K70.0, K70.1, K70.2, K70.3, K70.4 and K70.9) (gender split)
5

Targets and indicators for chronic disease prevention in Australia Technical paper No. 2015-08
November 2015
Physical inactivity 3. A 10% relative reduction in prevalence of insufficient physical activity
• Prevalence of insufficiently physically active children and adolescents aged 5–17 years defined as less than 60 minutes of activity daily
• Prevalence of insufficiently physically active adults aged 18+ is based on a physical activity recommendation of 150 minutes from five or more sessions per week. (Updated guidelines have removed the sessions requirement and thus the baseline prevalence and WHO target will need to be updated according to estimates based on the new guidelines.)
Salt/sodium intake 4. A 30% relative reduction in mean population intake of salt/sodium
• Age-standardised mean population intake of sodium expressed as salt grams per day
Tobacco use 5a 30% relative reduction in prevalence of current tobacco use in persons aged 14+ years
• Adults: Age-standardised prevalence of daily smokers aged 14 years and older from National Drug Strategy Household Survey (NDSHS) (also group 1)
• Adolescents: daily smoking prevalence (in the seven days prior to the survey) for adolescents aged 12–17 years
5b Reduce smoking rates of adults over 18 years with a mental illness by 30% by 2020 and 60% by 2025
• The proportion of the population with mental illness who report being smokers compared with the smoking rates for the population without mental illness
Biological risk factors
Raised blood
Pressure
6. A 25% relative reduction in the prevalence of raised blood pressure
• Age-standardised average blood pressure and percent of adults aged 18 years or more with elevated blood pressure (≥ 140/90 mmHg) (also group 1)
Diabetes and
obesity
7. Halt the rise in obesity
• Age-standardised prevalence of normal weight, overweight and obesity class I, II, III in persons 18 years or older (also group 1)
• Prevalence of normal weight, overweight and obesity in children and adolescents (also group 1)
• Age-standardised proportion of total energy intake from discretionary foods in persons aged 18 years or older and in children (2–17 years)
• Prevalence of breastfeeding and exclusive breastfeeding 8. Halt the rise in new
diabetes• Age-standardised incidence and prevalence of diabetes in persons
25–65yrsAdditional indicators
• Age-standardised average total cholesterol levels for adults aged 18 years or more, and percent with total cholesterol ≥ 5.0 mmol/L
Mental ill-health 9. Improve employment rates of adults over 18 with mental illness, and participation rates of young people with mental illness in education and employment, halving the employment and education gap by 2025
• Participation rates by people with mental illness of working age in employment: general population
• Participation rates by young people aged 16-30 with mental illness in education and employment: General population
Note: indicted in bold were regarded as core by the mortality & morbidity working group or were nominated by multiple groups
6
3. WHO set targets and indicators relevant to mental health in the WHO Global Mental Health Action Plan 2013-2020, which contains six global targets and indicators for achievement by 2020

Targets and indicators for chronic disease prevention in Australia Technical paper No. 2015-08
November 2015
TABLE 1.3: Additional targets and indicators proposed for development and implementation in Australia
AREA PROPOSED AUSTRALIAN
TARGET
FUTURE INDICATOR
Cardiovascular
disease and
diabetes
25% reduction in the overall mortality from cardiovascular diseases and diabetes
• Percent of adults aged 45–74 years, (or 35–74 years for ATSI people) assessed as having high, moderate or low levels of overall CVD risk, based on the Australian 5-year score
• Percent of adults aged 45–74 years, (or 35–74 years for ATSI people) with a 5-year risk of a cardiovascular event of 15% or more, including those with established CVD, being treated with both antihypertensive and lipid-lowering medicines (and for glycaemic control if relevant)
• Age-adjusted survival rates at 12 months after an acute coronary eventCancer 25% reduction in the overall
mortality from cancer• Disease staging at diagnosis for the following cancers (individual
indicators): lung, breast, colorectal, cervix, melanoma and prostateAlcohol 20% relative reduction in the harmful
use of alcohol, with regard to:• Per capita consumption• Heavy episodic drinking• Alcohol-related morbidity and
mortality
• Indicators as per table 1.2
Physical
inactivity
A 10% relative reduction in prevalence of insufficient physical activity
• Presence of a national physical activity plan• Existence of an adequate surveillance system to monitor and track
physical inactivity levels• Presence of national guidelines to improve physical activity
across the lifespan and in a range of settings such as schools, workplaces and communities
• Existence of a coordinated mechanism (task force, coalition) to address physical inactivity
• Strength training recommendations for adults and older Australians• Prevalence of children meeting screen-based activity recommendations• Prevalence of adults meeting recommendations related to daily sitting
time, according to future evidence-based guidelines in this areaMental health Reduction in the national suicide
rate• Rates of self-harm (admissions and presentations)
Improve employment rates of adults over 18 with mental illness, and participation rates of young people with mental illness in education and employment
• Proportion of state and territory mental health consumers aged 16–64 years who are employed (as defined by standard ABS definition)
• Proportion of state and territory mental health consumers aged 16–30 years who are employed (as defined by standard ABS definition) and/or are enrolled for study in a formal secondary or tertiary qualification
Improve the physical health of people with mental illness and reduce the life expectancy gap
• Excess under 75 mortality rate in adults with serious mental illness
References
Australian Bureau of Statistics (2013), Australian Health Survey: first results, 2011-12, ABS cat. no. 4364.0.55.001, Canberra, ABS.Australian Institute of Health and Welfare (AIHW) (2011), Key indicators of progress for chronic disease and associated determinants: data report, cat. no. PHE 142, Canberra, AIHW.Business Council of Australia (2011), Selected facts and statistics on Australia’s healthcare sector, Melbourne, BCA.Council of Australian Governments (COAG) (2011), National performance and accountability framework, Sydney, National Health Performance Authority.Leung, J & Tolhurst, P (2015), Suitability of the WHO 25 x 25 chronic disease targets and indicators for Australia, Australian Health Policy Collaboration Technical Paper 2015-03, Melbourne, Australian Health Policy Collaboration. World Health Organization (2013a), Global Action Plan for the Prevention and Control of Noncommunicable Diseases 2013-2020, Geneva, WHO. World Health Organization (2013b), Mental Health Action Plan 2013-2020, Geneva, WHO. World Health Organization (2014), Global status report on noncommunicable diseases 2014, Geneva, WHO.
7
Targets and indicators for chronic disease prevention in Australia
Kevin McNamara and Andrew Knight
Technical paper No. 2015-08
November 2015
2. Mortality and morbidity, and high-risk populations
Kevin McNamara and Andrew Knight
The key WHO target and indicator for reducing mortality are listed below in Table 2.1. This chapter has been produced as part of a project to tailor or develop NCD targets and indicators for Australia that align with the WHO’s Global Action Plan for the Prevention and Control of NCDs 2013–2020. This Working Group focused on indicators for reducing premature mortality from NCDs and mechanisms for achieving this.
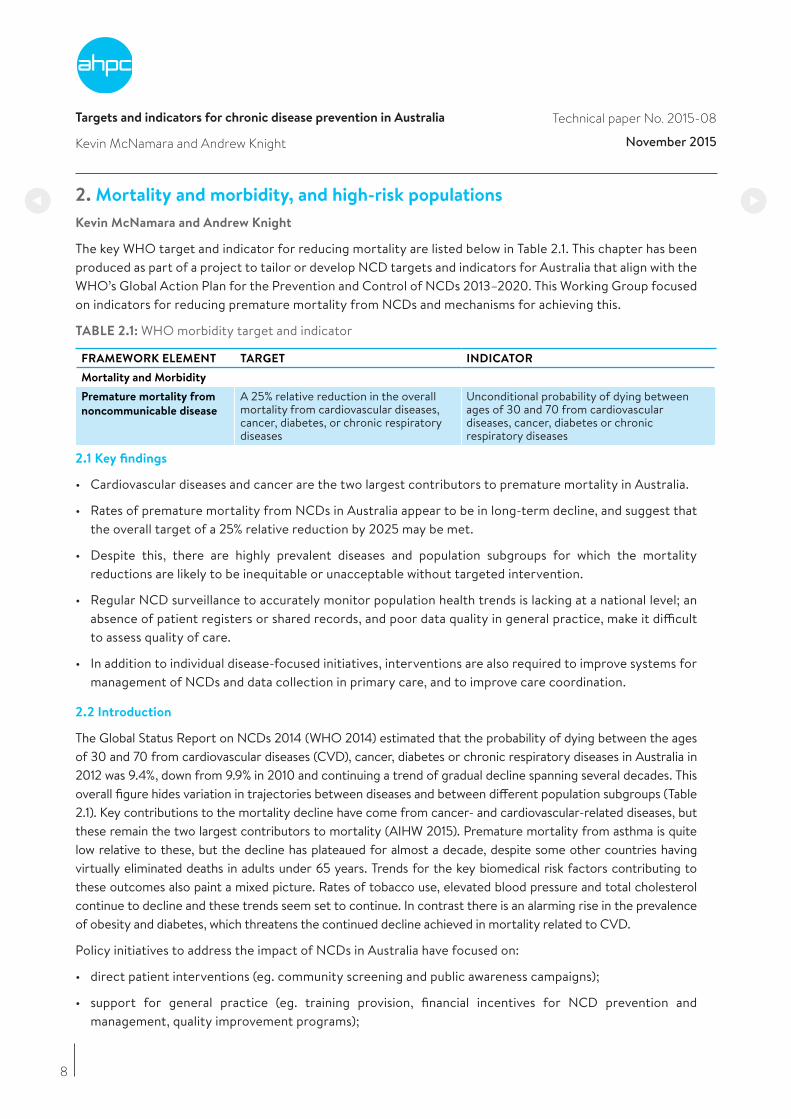
TABLE 2.1: WHO morbidity target and indicator
FRAMEWORK ELEMENT TARGET INDICATOR
Mortality and Morbidity
Premature mortality from
noncommunicable disease
A 25% relative reduction in the overall mortality from cardiovascular diseases, cancer, diabetes, or chronic respiratory diseases
Unconditional probability of dying between ages of 30 and 70 from cardiovascular diseases, cancer, diabetes or chronic respiratory diseases
2.1 Key findings
• Cardiovascular diseases and cancer are the two largest contributors to premature mortality in Australia.
• Rates of premature mortality from NCDs in Australia appear to be in long-term decline, and suggest that the overall target of a 25% relative reduction by 2025 may be met.
• Despite this, there are highly prevalent diseases and population subgroups for which the mortality reductions are likely to be inequitable or unacceptable without targeted intervention.
• Regular NCD surveillance to accurately monitor population health trends is lacking at a national level; an absence of patient registers or shared records, and poor data quality in general practice, make it difficult to assess quality of care.
• In addition to individual disease-focused initiatives, interventions are also required to improve systems for management of NCDs and data collection in primary care, and to improve care coordination.
2.2 Introduction
The Global Status Report on NCDs 2014 (WHO 2014) estimated that the probability of dying between the ages of 30 and 70 from cardiovascular diseases (CVD), cancer, diabetes or chronic respiratory diseases in Australia in 2012 was 9.4%, down from 9.9% in 2010 and continuing a trend of gradual decline spanning several decades. This overall figure hides variation in trajectories between diseases and between different population subgroups (Table 2.1). Key contributions to the mortality decline have come from cancer- and cardiovascular-related diseases, but these remain the two largest contributors to mortality (AIHW 2015). Premature mortality from asthma is quite low relative to these, but the decline has plateaued for almost a decade, despite some other countries having virtually eliminated deaths in adults under 65 years. Trends for the key biomedical risk factors contributing to these outcomes also paint a mixed picture. Rates of tobacco use, elevated blood pressure and total cholesterol continue to decline and these trends seem set to continue. In contrast there is an alarming rise in the prevalence of obesity and diabetes, which threatens the continued decline achieved in mortality related to CVD.
Policy initiatives to address the impact of NCDs in Australia have focused on:
• direct patient interventions (eg. community screening and public awareness campaigns);
• support for general practice (eg. training provision, financial incentives for NCD prevention and management, quality improvement programs);
8
Targets and indicators for chronic disease prevention in Australia Technical paper No. 2015-08
November 2015
9
• health systems (eg. guideline development, funding of new healthcare models to improve access); and
• public health policy (legislation, taxation, research funding).
The overall impact of such policy initiatives is clear in certain areas. For example, Australia has had significant success at reducing rates of tobacco use through combined legislation to reduce tobacco advertising, increased taxation on tobacco, public awareness campaigns and funding of support programs for smoking cessation. The Australian Primary Care Collaboratives (APCC) have involved about 20% of Australian general practices and have delivered significant improvements to the quality of care for several key diseases including CVD, diabetes and chronic obstructive pulmonary disease (COPD) (Brown et al. 2014). By contrast, other initiatives such as general practice funding for CVD and diabetes risk assessments have disappointing levels of uptake.
In contrast to overall improvements in NCD outcomes, inequalities in health outcomes and service access remain high for key social groups such as ATSI people, rural and remote communities, some migrant populations, those with mental illnesses and those from low-SES backgrounds.
Several areas of opportunity exist for the health system to improve performance and contribute towards further reducing mortality rates. Screening rates for bowel, breast and cervical cancer are suboptimal. Current efforts towards a national bowel cancer screening strategy and the introduction of new Human Papillomavirus Virus (HPV) vaccine strategies provide clear opportunities for improvement. Likewise, the experiences of countries such as Finland demonstrate that elimination of asthma mortality for young adults is feasible through early and intensive treatment of acute attacks with anti-inflammatory inhalers. Because treatment of COPD is largely palliative in its late stages, earlier identification and prevention through smoking cessation have the greatest potential for mortality reduction. Analysis of data from the AHS suggests that 22% of all Australian adults – 3.7 million people – have one or more CVD (AIHW 2014a). In 2011/12, an estimated 4.6 million adult Australians (32%) had hypertension; this includes 3.1 million with uncontrolled hypertension and 1.5 million whose blood pressure was controlled by medication (AIHW 2015). It is estimated that a minority of general practitioners (GPs) approach cardiovascular risk management based on absolute risk, as indicated by guidelines. The AusHEART study found entrenched evidence-practice gaps existed in primary and secondary prevention of CVD for older Australians (Heeley et al. 2010). A broad range of policy initiatives would enable replication of the success of local and international quality improvement programs.
Ensuring reliable population trend data will be one of the biggest challenges faced, both to monitor performance nationally against targets and to support local improvements to care. Various surveillance studies have been performed using different protocols over the past couple of decades to allow estimates of trends. The AHS (2011–13) was the most recent national survey to measure the prevalence of most key risk factors and NCDs of interest. Commitment to further biomedical surveillance is lacking. General practice data is often used to measure quality of care, and for proxy measures of disease prevalence, but the quality of general practice data is generally inadequate and there is no national approach to the extraction and analysis of general practice data. An absence of patient registers has made it difficult to establish denominators for primary care monitoring. Alternative sources of primary care data are practices participating in the NPS Medicinewise Medicine Insight program (2132 GPs in 516 practices, with over 3.5 million patients) and the APCC. Practices participating in these programs are probably higher-performing than their peers and some data might be unrepresentative. Data quality is variable for key interventions around screening and immunisations. Where centralised data collection exists (eg. Australian Childhood Immunisation Register) strong improvements have been achieved and quality should be acceptable. Other interventions (eg. bowel cancer screening) suffer from data fragmentation as a result of uncoordinated data collection where service delivery occurs in several settings. Mortality data collected by Births, Deaths and Marriage Registries for national aggregation are considered robust.
Kevin McNamara and Andrew Knight
10
Targets and indicators for chronic disease prevention in Australia
Kevin McNamara and Andrew Knight
Technical paper No. 2015-07
November 2015
2.3 Relevance of WHO targets
The Working Group considered the overall WHO target of 25% reduction in mortality, and associated indicators, were largely appropriate and feasible for CVD, diabetes and cancer. However, the group felt that we should aim to exceed this goal as it relates to asthma, and work towards the elimination of premature deaths from asthma in young adults. With COPD, it is not considered feasible to achieve a 25% mortality reduction for those patients who are already at an advanced stage of the disease. Australian data for this condition was not considered robust relative to other countries. Age-standardised incidence rates (25–64 years) for diabetes were considered more appropriate indicators than prevalence, as improved care, which will increase detection and survival for patients with diabetes, will result in increased prevalence.
Some indicators may need adaptation for greater relevance to the Australian setting. Adult prevalence of elevated blood pressure (≥ 140/90 mmHg), elevated total cholesterol (≥ 5.0 mmol/L), and mean blood pressure/total cholesterol are appropriate indicators of population health, but treatment advised in Australian guidelines is advocated from an absolute cardiovascular risk perspective. Therefore estimates of mean absolute cardiovascular risk, and prevalence of low, medium and high-risk categories were considered more relevant for practitioners. Assessment of five-year absolute cardiovascular risk, endorsed in Australia, would be more appropriate locally than the WHO-proposed 10-year risk score (NVDPA 2012). Australian guidelines recommend screening to commence at 45 years (for non-ATSI patients), slightly at odds with the 40 years proposed by WHO. Adapted indicators for individual risk factors could be collected in addition or as an alternative to the WHO-proposed indicators. Additional targets suggested by the Working Group involved measures of access to stroke care units, end-stage kidney disease treatments, and rehabilitation units for cardiac disease, stroke and chronic obstructive pulmonary disease. Of these additional process measures, only rehabilitation access indicators were considered appropriate as indicators for secondary prevention.
2.4 Proposed Australian target and indicators and feasibility
The Working Group chose indicators that directly relate to mortality outcomes (Table 2.2), biomedical risk factors that cause these outcomes (Table 2.2), and evidence-based interventions to modify these outcomes (Table 2.3). Final selection considered the feasibility of accurate data collection and the evidence for improved outcomes from health service interventions. Separate targets and indicators were chosen for each of the disease areas in recognition of varying trends in mortality (Table 2.2). Age-standardised prevalence of tobacco use is a valid indicator of progress across all major disease groups, and has been added to the overall indicators. Upper age limits are recommended for several targets and indicators, acknowledging the increased potential for multiple concurrent morbidities in individual patients to make mortality and hospitalisation data unreliable. To ensure that intervention efforts support a reduction in health inequalities, it is recommended that variation in all targets and indicators should be examined according to location (metro, rural and remote), socioeconomic strata, and ethnicity (particularly ATSI status). Readmission within 28 days following a hospital admission for the conditions of interest was also advocated for because of its utility as a marker of integration between primary, secondary and tertiary care, and quality of care during hospitalisation.
Cardiovascular disease and diabetes indicators are largely in keeping with the recommendations of WHO. Body mass index (BMI) and waist circumference are additionally endorsed as indicators of patient self-management that would be more feasible to collect than health behaviours. Survival at 12 months after an acute coronary syndrome is important as it is one of the key markers of health inequality between the ATSI population and the general Australian population.
Six common cancers were put forward as areas of focus: lung, breast, colorectal, cervix, melanoma and prostate. The specific list was developed based on incidence, mortality, state/national screening programs and
11
Targets and indicators for chronic disease prevention in Australia
Kevin McNamara and Andrew Knight
Technical paper No. 2015-07
November 2015
prevention opportunities. Blood and ovarian cancers were omitted owing to the lack of effective screening options. Survival at one year following cancer diagnosis is as an accepted marker for early diagnosis, recognition by GPs, and timeliness of treatment. It is recommended for inclusion as a proxy indicator for quality of care. State and national data for one-year survival should be readily available. For lung cancer, tobacco control is the best prevention strategy. Screening of groups at high risk of lung cancer (eg. family members, heavy smokers) was rejected as an expensive option that may result in an unacceptably high number of false positive results.
An Australian Centre for Asthma Monitoring (ACAM 2014) report identified 10 feasible indicators for asthma, nine of which would directly impact on mortality (only prevalence would remain unchanged). A systematic review of effective interventions to reduce hospitalisations in asthma identified regular medication reviews, an asthma action plan, and patient self-management as useful (Gibson & Powell 2004). National COPD indicators are only more recently developed, and the included outcome measures, developed by the APCC’s COPD Wave, may be more directly relevant to mortality. It was felt that the preventable nature of any asthma death in younger patients (<65 years) should merit any such death becoming a sentinel event for further investigation.
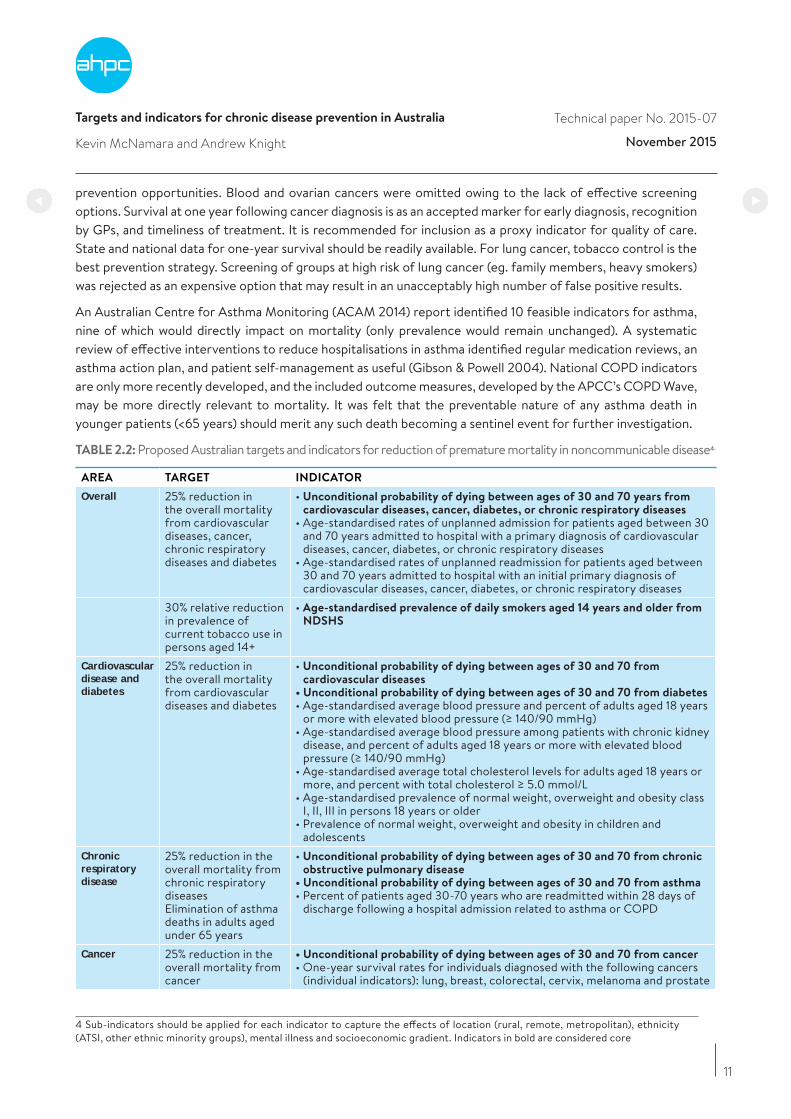
TABLE 2.2: Proposed Australian targets and indicators for reduction of premature mortality in noncommunicable disease4.
AREA TARGET INDICATOR
Overall 25% reduction in the overall mortality from cardiovascular diseases, cancer, chronic respiratory diseases and diabetes
• Unconditional probability of dying between ages of 30 and 70 years from cardiovascular diseases, cancer, diabetes, or chronic respiratory diseases
• Age-standardised rates of unplanned admission for patients aged between 30 and 70 years admitted to hospital with a primary diagnosis of cardiovascular diseases, cancer, diabetes, or chronic respiratory diseases
• Age-standardised rates of unplanned readmission for patients aged between 30 and 70 years admitted to hospital with an initial primary diagnosis of cardiovascular diseases, cancer, diabetes, or chronic respiratory diseases
30% relative reduction in prevalence of current tobacco use in persons aged 14+
• Age-standardised prevalence of daily smokers aged 14 years and older from NDSHS
Cardiovascular disease and diabetes
25% reduction in the overall mortality from cardiovascular diseases and diabetes
• Unconditional probability of dying between ages of 30 and 70 from cardiovascular diseases
• Unconditional probability of dying between ages of 30 and 70 from diabetes• Age-standardised average blood pressure and percent of adults aged 18 years
or more with elevated blood pressure (≥ 140/90 mmHg)• Age-standardised average blood pressure among patients with chronic kidney
disease, and percent of adults aged 18 years or more with elevated blood pressure (≥ 140/90 mmHg)
• Age-standardised average total cholesterol levels for adults aged 18 years or more, and percent with total cholesterol ≥ 5.0 mmol/L
• Age-standardised prevalence of normal weight, overweight and obesity class I, II, III in persons 18 years or older
• Prevalence of normal weight, overweight and obesity in children and adolescents
Chronic respiratory disease
25% reduction in the overall mortality from chronic respiratory diseasesElimination of asthma deaths in adults aged under 65 years
• Unconditional probability of dying between ages of 30 and 70 from chronic obstructive pulmonary disease
• Unconditional probability of dying between ages of 30 and 70 from asthma• Percent of patients aged 30-70 years who are readmitted within 28 days of
discharge following a hospital admission related to asthma or COPD
Cancer 25% reduction in the overall mortality from cancer
• Unconditional probability of dying between ages of 30 and 70 from cancer• One-year survival rates for individuals diagnosed with the following cancers
(individual indicators): lung, breast, colorectal, cervix, melanoma and prostate
4 Sub-indicators should be applied for each indicator to capture the effects of location (rural, remote, metropolitan), ethnicity (ATSI, other ethnic minority groups), mental illness and socioeconomic gradient. Indicators in bold are considered core
12
Targets and indicators for chronic disease prevention in Australia
Kevin McNamara and Andrew Knight
Technical paper No. 2015-07
November 2015
Systemic improvements to primary care would support improvements in prevention. Australia’s health system is fragmented, difficult to navigate, and there are challenges in coordinating care across multiple providers. The following system enablers would contribute to reduced mortality and morbidity from chronic diseases:
• guidelines and incentives for management of multimorbidity;
• further development of a centralised system for documenting delivery of key screening and immunisation interventions across multiple health settings and all age groups; and
• development of registers for COPD, asthma, diabetes and CVD in every general practice.
These issues and enablers are discussed further below.
Immunisations and attendance at self-management interventions are relevant indicators for the quality of preventative care, but inclusion is contingent on improvements in data quality. Because multiple providers exist for screening and immunisation, it is not possible to determine the number receiving appropriate care without a central point of documentation. The Australian Childhood Immunisation Register is to be expanded to a whole-of-life register from September 2016, which will aid long-term monitoring. The national HPV register will be expanded to become the Australian School Vaccination Register from 2017, and will capture all adolescent vaccinations given through school programs (DoH 2015). Expansion of the two registers is a welcome development that will assist in improving immunisation rates and targeting efforts to identify and support low-coverage areas. The proposed centralised cancer screening register is a much-needed initiative which will enable improvements in this area.
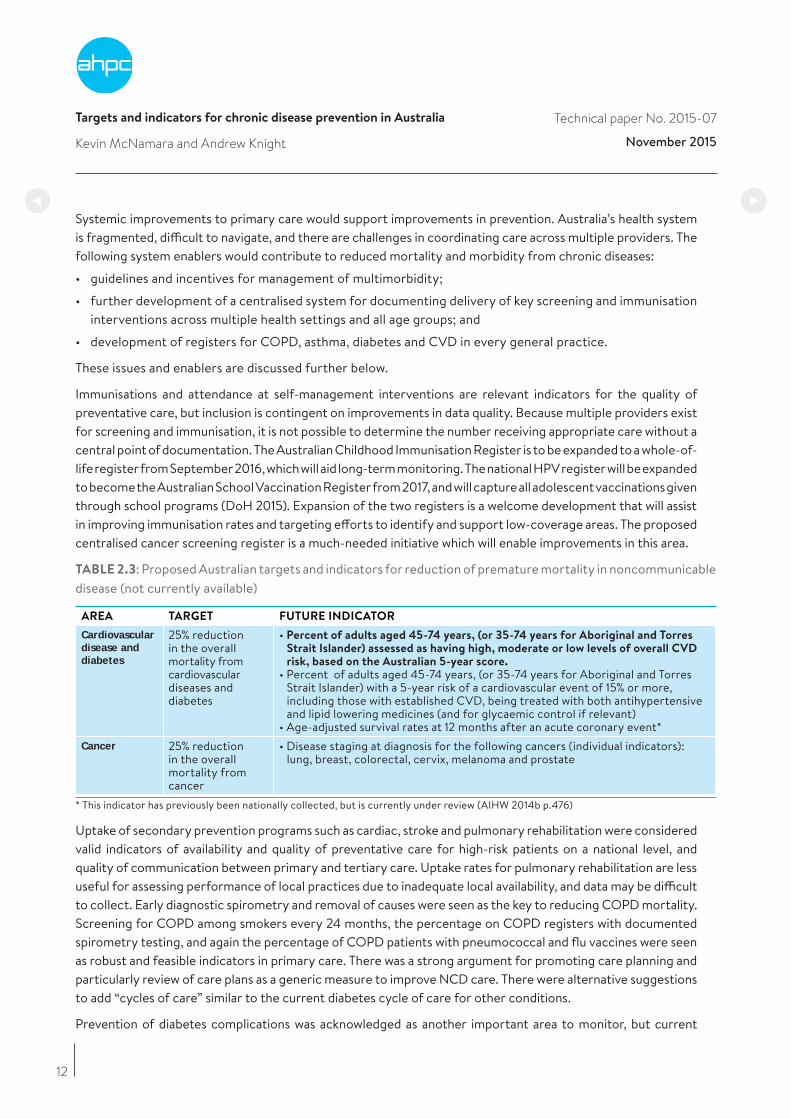
TABLE 2.3: Proposed Australian targets and indicators for reduction of premature mortality in noncommunicable disease (not currently available)
AREA TARGET FUTURE INDICATOR
Cardiovascular disease and diabetes
25% reduction in the overall mortality from cardiovascular diseases and diabetes
• Percent of adults aged 45-74 years, (or 35-74 years for Aboriginal and Torres Strait Islander) assessed as having high, moderate or low levels of overall CVD risk, based on the Australian 5-year score.
• Percent of adults aged 45-74 years, (or 35-74 years for Aboriginal and Torres Strait Islander) with a 5-year risk of a cardiovascular event of 15% or more, including those with established CVD, being treated with both antihypertensive and lipid lowering medicines (and for glycaemic control if relevant)
• Age-adjusted survival rates at 12 months after an acute coronary event*Cancer 25% reduction
in the overall mortality from cancer
• Disease staging at diagnosis for the following cancers (individual indicators): lung, breast, colorectal, cervix, melanoma and prostate
* This indicator has previously been nationally collected, but is currently under review (AIHW 2014b p.476)
Uptake of secondary prevention programs such as cardiac, stroke and pulmonary rehabilitation were considered valid indicators of availability and quality of preventative care for high-risk patients on a national level, and quality of communication between primary and tertiary care. Uptake rates for pulmonary rehabilitation are less useful for assessing performance of local practices due to inadequate local availability, and data may be difficult to collect. Early diagnostic spirometry and removal of causes were seen as the key to reducing COPD mortality. Screening for COPD among smokers every 24 months, the percentage on COPD registers with documented spirometry testing, and again the percentage of COPD patients with pneumococcal and flu vaccines were seen as robust and feasible indicators in primary care. There was a strong argument for promoting care planning and particularly review of care plans as a generic measure to improve NCD care. There were alternative suggestions to add “cycles of care” similar to the current diabetes cycle of care for other conditions.
Prevention of diabetes complications was acknowledged as another important area to monitor, but current

13
Targets and indicators for chronic disease prevention in Australia
Kevin McNamara and Andrew Knight
Technical paper No. 2015-07
November 2015
state of general practice data collection makes measurement difficult. Collection of absolute risk data is indicated for the ATSI population from age 35 years, reflecting national guidelines for CVD risk assessment. It is acknowledged that cardiovascular health checks for this population are warranted from a younger age. Measurement of renal function is recommended as chronic kidney disease is a highly under-diagnosed condition. In 2011/12, an estimated 1.7 million Australian adults (10% of the population) had biomedical signs of the disease, but only one in ten of this group self-reported that they had the condition (AIHW 2014).
The OECD recently noted that Australia is marked out from its peers by a surprising lack of data on the quality and outcomes of care, particularly for primary health care. They further noted that there are few indicators promoting quality of clinical care and patient outcomes, and there is little opportunity for GPs to be benchmarked against their peers (2015). A range of health service sub-indicators are proposed (Table 2.4) to improve data and health outcomes.
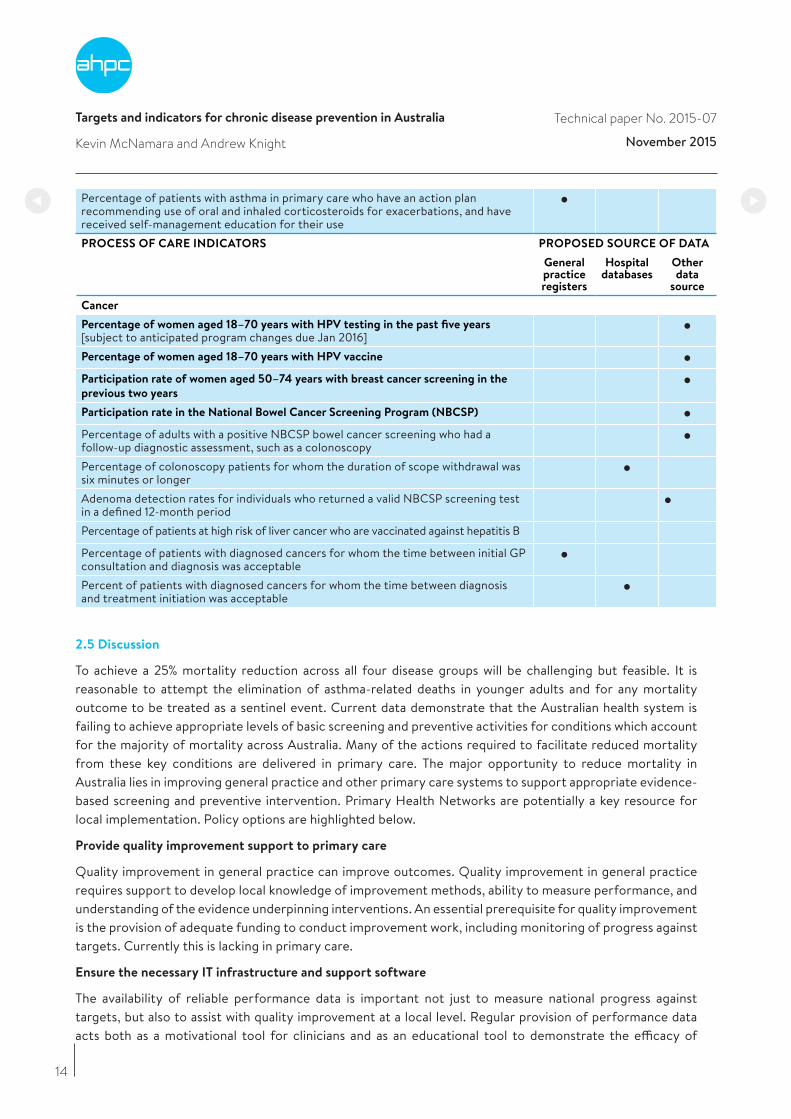
TABLE 2.4 Proposed health service delivery sub-indicators to achieve health targets
PROCESS OF CARE INDICATORS PROPOSED SOURCE OF DATA
General practice registers
Hospital databases
Other data
source
Overall
Percentage of patients with diabetes, cancer, COPD and CVD who have been screened for depression since diagnosisPercentage of eligible patients with any of respiratory disease, diabetes or CVD who have been administered flu vaccine and pneumococcal vaccine in the previous twelve monthsPercentage of patients for whom appropriate elements of cycles of care have been implemented in the previous twelve months:CVD (or at high risk)Diabetes (or at high risk)AsthmaCOPD (or at high risk)Percentage of adults readmitted within 28 days of a hospital discharge following an admission related to diabetes, COPD, diabetes or cancerPercentage of adult patients who receive an integrated health check5
Percentage of patients with an NCD who have had a General Practice Management Plan reviewed in the previous 12 monthsCardiovascular disease and diabetes
Percentage of patients aged 45 years or more (excluding ATSI) who have had a CVD absolute risk assessment in the past two yearsPercentage of ATSI patients aged 35 years or more who have had a CVD absolute risk assessment in the past yearPercentage of adult patients who have had a diabetes risk assessment
Percentage of patients who attend cardiac rehabilitation within six months of an acute coronary eventRespiratory
Percentage of smokers screened for COPD within the preceding 24 months
Percentage of patients with COPD documented as ever having spirometry testing
Percentage of COPD patients with both pneumococcal and flu vaccine up to date
Percentage of smokers with COPD for whom smoking status is reviewed annually
Percentage of patients with COPD who have ever attended pulmonary rehabilitation
5 Integrated health checks are comprehensive health assessments that simultaneously assess risk status for several diseases – suggested to assess diabetes risk, absolute CVD risk, and kidney function as a minimum -– acknowledging the overlapping risk factors for many conditions. These may be performed as a single episode of care or in a planned manner over a cycle of care
14
Targets and indicators for chronic disease prevention in Australia
Kevin McNamara and Andrew Knight
Technical paper No. 2015-07
November 2015
Percentage of patients with asthma in primary care who have an action plan recommending use of oral and inhaled corticosteroids for exacerbations, and have received self-management education for their usePROCESS OF CARE INDICATORS PROPOSED SOURCE OF DATA
General practice registers
Hospital databases
Other data
source
Cancer
Percentage of women aged 18–70 years with HPV testing in the past five years [subject to anticipated program changes due Jan 2016]Percentage of women aged 18–70 years with HPV vaccine
Participation rate of women aged 50–74 years with breast cancer screening in the
previous two years
Participation rate in the National Bowel Cancer Screening Program (NBCSP)
Percentage of adults with a positive NBCSP bowel cancer screening who had a follow-up diagnostic assessment, such as a colonoscopyPercentage of colonoscopy patients for whom the duration of scope withdrawal was six minutes or longerAdenoma detection rates for individuals who returned a valid NBCSP screening test in a defined 12-month periodPercentage of patients at high risk of liver cancer who are vaccinated against hepatitis B
Percentage of patients with diagnosed cancers for whom the time between initial GP consultation and diagnosis was acceptablePercent of patients with diagnosed cancers for whom the time between diagnosis and treatment initiation was acceptable
2.5 Discussion
To achieve a 25% mortality reduction across all four disease groups will be challenging but feasible. It is reasonable to attempt the elimination of asthma-related deaths in younger adults and for any mortality outcome to be treated as a sentinel event. Current data demonstrate that the Australian health system is failing to achieve appropriate levels of basic screening and preventive activities for conditions which account for the majority of mortality across Australia. Many of the actions required to facilitate reduced mortality from these key conditions are delivered in primary care. The major opportunity to reduce mortality in Australia lies in improving general practice and other primary care systems to support appropriate evidence-based screening and preventive intervention. Primary Health Networks are potentially a key resource for local implementation. Policy options are highlighted below.
Provide quality improvement support to primary care
Quality improvement in general practice can improve outcomes. Quality improvement in general practice requires support to develop local knowledge of improvement methods, ability to measure performance, and understanding of the evidence underpinning interventions. An essential prerequisite for quality improvement is the provision of adequate funding to conduct improvement work, including monitoring of progress against targets. Currently this is lacking in primary care.
Ensure the necessary IT infrastructure and support software
The availability of reliable performance data is important not just to measure national progress against targets, but also to assist with quality improvement at a local level. Regular provision of performance data acts both as a motivational tool for clinicians and as an educational tool to demonstrate the efficacy of
Targets and indicators for chronic disease prevention in Australia
Kevin McNamara and Andrew Knight
Technical paper No. 2015-08
November 2015
their efforts. Variation in general practice software systems makes the standardisation of data collection fields and decision support difficult. Results from the TORPEDO and GASP studies (Peiris et al. 2015, Ram & McNaughton 2014), designed to manage cardiovascular risk and asthma respectively, underscore the potential for tailored decision support systems to achieve improved quality of care. A uniform approach to the collection of clinical outcomes in general practice to improve patient care is a pressing national priority. Appropriate software, training and financial support is needed if this essential capacity is to become part of Australian general practice.
Introduce levers to drive appropriate health professional behaviours
The experience of other countries, and of Australian programs such as ESSENCE and the APCC, suggest that both incentives and sanctions are required at a macro level to encourage best practice in general practice. ESSENCE (Essential Service Standards for Equitable National Cardiovascular carE for Aboriginal and Torres Strait Islander people) is an evidence-based approach to cardiovascular care. Currently, it is estimated that a small minority of practices maintain data at an adequate quality. Financial incentives are undoubtedly required to enable high-quality data provision, but uptake by reluctant practices might also require sanctions such as:
• restricting practice incentive payments or MBS item access to practices which submit quality data to PHNs; and
• ‘stretch targets’ (eg. for screening or immunisation) whereby health professionals are paid for exceptional performances for indicators that are directly linked to mortality outcomes.
Implement systems for sharing patient information and develop patient registers for key NCDs
Two further key barriers have been identified to optimal performance monitoring in primary care.
• The absence of patient registers at a practice level means the absence of clear target groups for intervention or denominators to accurately determine the prevalence of intervention delivery.
• The absence of data regarding the completion of interventions in other health settings. For example, screening and immunisation is carried out in diverse settings such as workplaces, community centres, pharmacies and hospitals, but agreed systems may not exist for communication of information about the screening or care people receive. Bowel cancer screening outside the NBCSP is an example. This situation can also result in duplication of care and uncoordinated care.
The Working Group recommends that general practice registers be developed and implemented for CVD, diabetes, asthma, and COPD. We also recommend that electronic systems and protocols be developed and implemented to allow the sharing of information across health settings, improved coordination of care, and measurement of performance from the overall health system.
Engage communities, including all relevant health and social care professionals
All Australians have a right to expect that certain standards of healthcare will be available to them regardless of their SES, ethnicity or physical location. There is a risk that health initiatives will widen health inequalities if access issues are not concurrently addressed, hence outcomes for targets and indicators should be assessed for equity. Conversely, effective systems for identifying and managing risks of NCDs improve equity. An equitable approach will require:
• a coordinated national response from a wide range of health and social care professionals to minimise the access barriers faced by underserved or marginalised communities;
• investment in appropriate IT infrastructure, multidisciplinary guidelines and incentives for collaboration;
• workforce redesign to promote receptivity to innovation, appropriate role substitution and integrated,
15
Targets and indicators for chronic disease prevention in Australia
Kevin McNamara and Andrew Knight
Technical paper No. 2015-08
November 2015
team-based care; and
• community health promotion initiatives to meet the needs of different social contexts for care.
Awareness-raising through public campaigns, with local GP champions advocating to their communities, may have a valuable role in encouraging the most at-risk individuals to engage in preventative healthcare. The near-elimination of premature asthma deaths in Finland, accompanied by declines in disability, hospitalisation and asthma costs, was the result of a 10-year primary care program involving local multidisciplinary networks of health professionals, led by physicians (Haahtela et al. 2006). Similar models seem feasible in Australia for chronic disease management if sustained stakeholder and financial support is provided for development and implementation of a multidisciplinary action program. The key interventions to improve general practice screening rates for cancer are audit and feedback, GP endorsement letters, and electronic reminders for opportunistic intervention with patients who come for appointments. These interventions need to be combined on a system level (Emery et al. 2014), and are equally relevant to reduction in mortality from CVD and diabetes. There is reasonable evidence that local GP endorsement of invitations to attend screening and get vaccinations has a positive effect on uptake, even if the GPs themselves are not involved. General practice has not been engaged to date as much as it might be. The scale and complexity of change needed to meet targets and indicators across all disease groups requires an immediate and collective initiative.
Key data sources and references
Australian Bureau of Statistics (ABS) (2013), Australian Health Survey: Biomedical Results for Chronic Diseases, 2011-12, 4364.0.55.005, http://www.abs.gov.au/ausstats/[email protected]/Lookup/4364.0.55.005Chapter1052011-12
Australian Centre for Asthma Monitoring (ACAM) (2009), Refining national asthma indicators: Delphi survey and correlation analysis, cat. no. ACM 15, Canberra, AIHW.
Australian Institute of Health and Welfare (AIHW) (2015), Australian Burden of Disease Study: fatal burden of disease 2010, Australian Burden of Disease Study series no. 1, cat. no. BOD 1, Canberra, AIHW.
Australian Institute of Health and Welfare (AIHW) (2014b), Australia’s Health 2014, Australia’s health series no. 14, cat. no. AUS 178, Canberra, AIHW.
Australian Institute of Health and Welfare (AIHW) (2014a), Cardiovascular disease, diabetes and chronic kidney disease – Australian facts: Prevalence and incidence, Cardiovascular, diabetes and chronic kidney disease series no. 2, cat. no. CDK 2, Canberra, AIHW.
Brown, V, Fuller, J, Ford, D & Dunbar, JA (2014), The enablers and barriers for the uptake, use and spread of primary health care collaboratives in Australia, APHCRI Centre of Research Excellence in Primary Health Care Microsystems, The University of Queensland (UQ), Brisbane, UQ.
Department of Health (DoH) (2015), Update: Expansion of Australia’s Immunisation Registers, http://www.immunise.health.gov.au/internet/immunise/publishing.nsf/Content/523BCE12C8BCA187CA257EE700118E99/$File/Factsheet-%20Immunisation-Registers-Expansion-23102015.pdf
Emery, JD, Shaw, K, Williams, B, Mazza, D, Fallon-Ferguson, J, Varlow, M & Trevena LJ (2014), The role of primary care in early detection and follow-up of cancer, Nature Reviews Clinical Oncology, vol. 11, pp. 38–48, doi:10.1038/nrclinonc.2013.212
Gibson, PG & Powell H (2004), Written action plans for asthma: an evidence-based review of the key components. Thorax, vol. 59, no.2, pp. 94-99, doi:10.1136/thorax.2003.011858.
Haahtela, T, Tuomisto, LE, Pietinalho, A, Klaukka, T, Erhola, M, Kaila, M, Nieminen, MM, Kontula, E & Laitinen LA (2006), A 10 year asthma programme in Finland: major change for the better. Thorax, vol. 61, no. 8, pp. 663-70.
Heeley, E, Peiris, D, Patel, A, Cass, A, Weekes, A, Morgan, C, Anderson, C & Chalmers J (2010), Cardiovascular
16
Targets and indicators for chronic disease prevention in Australia
Kevin McNamara and Andrew Knight
Technical paper No. 2015-08
November 2015
risk perception and evidence-practice gaps in Australian general practice (the AusHEART study), Medical Journal of Australia, vol. 192, no. 5, 254-9.
National Vascular Disease Prevention Alliance (NVDPA) (2012), Guidelines for the management of absolute cardiovascular disease risk, https://strokefoundation.com.au/~/media/strokewebsite/resources/treatment/absolutecvd_gl_webready.ashx?la=en
OECD (2015), OECD Reviews of Health Care Quality: Australia 2015: Raising Standards, Paris, OECD Publishing.
Peiris, D, Usherwood, T, Panaretto, K, Harris, M, Hunt, J, Redfern, J, (2015), Effect of a computer-guided, quality improvement program for cardiovascular disease risk management in primary health care: the Treatment of Cardiovascular Risk Using Electronic Decision Support Cluster-Randomized Trial, Circulation: Cardiovascular Quality and Outcomes, doi 10.1161/circoutcomes.114.001235.
Ram, FS & McNaughton, W (2014), Giving Asthma Support to Patients (GASP): a novel online asthma education, monitoring, assessment and management tool, Journal of Primary Health Care, vol. 6 no. 3, pp. 238-44.
World Health Organization (2014), Global status report on noncommunicable diseases 2014, Geneva, WHO.
17
Targets and indicators for chronic disease prevention in Australia
Michael Livingston and Kypros Kypri
Technical paper No. 2015-08
November 2015
18
3. Alcohol
Michael Livingston and Kypros Kypri
The WHO target and indicators relevant to harmful use of alcohol are provided in Table 3.1.
TABLE 3.1: WHO alcohol target and indicators
FRAMEWORK
ELEMENT
TARGET INDICATORS
Harmful use of
alcohol
At least a 10% reduction in the harmful use of alcohol nationally by 2025 (from 2011 levels)
• Total (recorded and unrecorded) alcohol per capita (aged 15+ yearsold) consumption within a calendar year in litres of pure alcohol, asappropriate, within the national context
• Age-standardised prevalence of heavy episodic drinking amongadolescents and adults, as appropriate, within the national context
• Alcohol-related morbidity and mortality among adolescents andadults, as appropriate, within the national context
3.1 Key findings
• Per capita alcohol consumption and the prevalence of risky drinking in Australia have declined, but ratesof harms remain high and appear to be increasing in some population groups.
• The WHO indicators need to be expanded and made more specific to ensure that Australia cancomprehensively monitor trends in alcohol consumption and related harms.
• The WHO targets of a 10% relative reduction in per capita alcohol consumption, the prevalence of heavyepisodic drinking, and rates of morbidity and mortality are achievable within a comprehensive public-health-oriented policy framework.
• Policies focusing on the price, physical availability and promotion of alcohol have the strongest evidencebase for reducing population levels of harmful alcohol consumption. Australian governments need to actdecisively to ensure Australia reaches the WHO targets.
3.2 Introduction
The recent Global Burden of Disease study ranked alcohol consumption as the sixth leading risk factor for death and disability globally (GBD 2013 Risk Factors Collaborators 2015). Some conditions, such as alcoholic liver disease are, by definition, wholly attributable to alcohol consumption. However, alcohol is a cross-cutting risk factor, causally implicated in more than 200 medical conditions (WHO 2014). Accordingly, one of the challenges in monitoring alcohol-related morbidity and mortality is the large number and variety of conditions partly attributable to alcohol consumption. For example, recent estimates suggest that globally, 8% of breast cancer and hypertensive deaths, 7% of ischaemic heart disease deaths, 11% of haemorrhagic stroke deaths and 22% of suicide deaths are attributable to alcohol consumption (WHO 2014).
Divergent trends
The most recent study examining alcohol’s contribution to the burden of disease in Australia estimated that, in 2010, 5,554 deaths and 157,132 hospital admissions were attributable to alcohol consumption (Gao et al. 2014). Per capita consumption in Australia has averaged around 10 litres of pure alcohol per person since the early 1990s. It steadily increased between 2000 and 2008, but declined from 10.8 litres in 2008 to 9.7 litres in 2014 (ABS 2015). Similarly, survey-based estimates of both long-term and short-term risky drinking have declined recently (see Figure 3.1a), with particularly sharp declines among young people (AIHW 2014). In contrast, trends in most indicators of alcohol-related harm have been stable or increasing (Lensvelt et al.
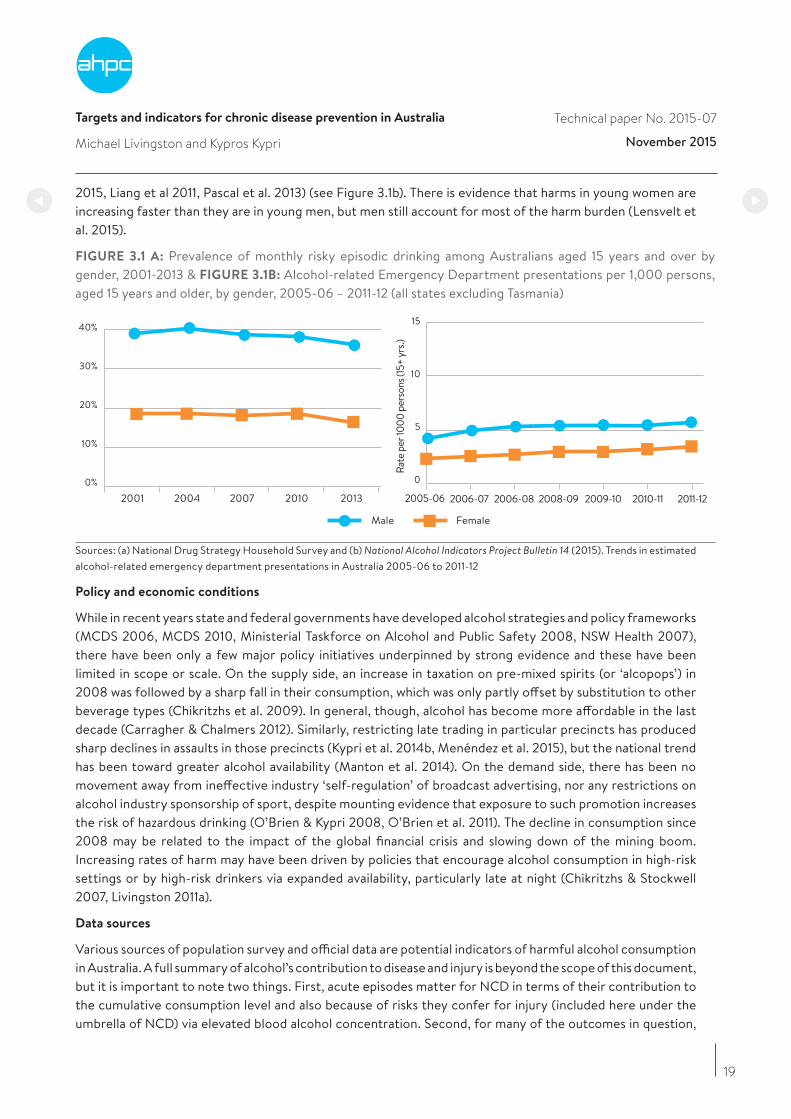
19
Targets and indicators for chronic disease prevention in Australia
Michael Livingston and Kypros Kypri
Technical paper No. 2015-07
November 2015
2015, Liang et al 2011, Pascal et al. 2013) (see Figure 3.1b). There is evidence that harms in young women are increasing faster than they are in young men, but men still account for most of the harm burden (Lensvelt et al. 2015).
FIGURE 3.1 A: Prevalence of monthly risky episodic drinking among Australians aged 15 years and over by gender, 2001-2013 & FIGURE 3.1B: Alcohol-related Emergency Department presentations per 1,000 persons, aged 15 years and older, by gender, 2005-06 – 2011-12 (all states excluding Tasmania)
2001 2004 2007 2010
Male Female
2013 2005-06 2006-07 2006-08 2008-09 2009-10 2010-11 2011-120% 0
Rate
per
1000
per
sons
(15+
yrs
.)
5
10
15
10%
20%
30%
40%
Sources: (a) National Drug Strategy Household Survey and (b) National Alcohol Indicators Project Bulletin 14 (2015). Trends in estimated alcohol-related emergency department presentations in Australia 2005-06 to 2011-12
Policy and economic conditions
While in recent years state and federal governments have developed alcohol strategies and policy frameworks (MCDS 2006, MCDS 2010, Ministerial Taskforce on Alcohol and Public Safety 2008, NSW Health 2007), there have been only a few major policy initiatives underpinned by strong evidence and these have been limited in scope or scale. On the supply side, an increase in taxation on pre-mixed spirits (or ‘alcopops’) in 2008 was followed by a sharp fall in their consumption, which was only partly offset by substitution to other beverage types (Chikritzhs et al. 2009). In general, though, alcohol has become more affordable in the last decade (Carragher & Chalmers 2012). Similarly, restricting late trading in particular precincts has produced sharp declines in assaults in those precincts (Kypri et al. 2014b, Menéndez et al. 2015), but the national trend has been toward greater alcohol availability (Manton et al. 2014). On the demand side, there has been no movement away from ineffective industry ‘self-regulation’ of broadcast advertising, nor any restrictions on alcohol industry sponsorship of sport, despite mounting evidence that exposure to such promotion increases the risk of hazardous drinking (O’Brien & Kypri 2008, O’Brien et al. 2011). The decline in consumption since 2008 may be related to the impact of the global financial crisis and slowing down of the mining boom. Increasing rates of harm may have been driven by policies that encourage alcohol consumption in high-risk settings or by high-risk drinkers via expanded availability, particularly late at night (Chikritzhs & Stockwell 2007, Livingston 2011a).
Data sources
Various sources of population survey and official data are potential indicators of harmful alcohol consumption in Australia. A full summary of alcohol’s contribution to disease and injury is beyond the scope of this document, but it is important to note two things. First, acute episodes matter for NCD in terms of their contribution to the cumulative consumption level and also because of risks they confer for injury (included here under the umbrella of NCD) via elevated blood alcohol concentration. Second, for many of the outcomes in question,

20
Targets and indicators for chronic disease prevention in Australia
Michael Livingston and Kypros Kypri
Technical paper No. 2015-07
November 2015
alcohol interacts with other causal factors. For example, trends in incidence and mortality from colorectal cancer (of which 10% is estimated to be attributable to alcohol) are also influenced by changes in diet and obesity. For these reasons, we require indicators that (1) capture both the acute and chronic risks of alcohol consumption and (2) have high alcohol-attributable fractions (for the morbidity and mortality indicators) to ensure that changes over time are likely to have been driven by changes in alcohol consumption.
3.3 Relevance of WHO targets
The WHO targets of 10% reductions in per-capita consumption, heavy episodic drinking and alcohol-related morbidity and mortality are appropriate but they lack the necessary specificity for surveillance. The targets are presented as a set of alternatives in the WHO documents, but we argue that Australia should aim to achieve all three: reducing overall consumption, risky drinking and rates of alcohol-related harm.
3.4 The case for reforming Australian healthcare funding
We provide a set of indicators for measuring alcohol consumption and related harm in Table 3.2. In addition to the complexity of alcohol’s action on the body and as an agent in the aetiology of injury and other acute harms, the recent disjunction in trends (illustrated in Figures 3.1a and 3.1b) highlights the need for a suite of indicators to reduce the risk of invalid inferences about trends.
A 10% reduction in each of these indicators between 2010 and 2025 is not ambitious enough given the extent of alcohol-related harm in Australia, and evidence for effective countermeasures. The consumption indicators are already trending towards these targets, but there is no guarantee that these trends will continue without appropriate policy support. Concerted effort by federal and state governments will be necessary to ensure that reductions in alcohol-related morbidity and mortality are achieved. A future target of a 20% reduction in the indicators is supported by the working group.
TABLE 3.2: Indicators for monitoring Australia’s progress in reducing the harmful use of alcohol
INDICATOR DESCRIPTION SUB-GROUPS SOURCE*
Per capita consumption Consumption of pure alcohol per person aged >15 years, based on excise data, import clearances and sales of Australian-produced wine.
NA ABS
Heavy episodic drinking Proportion of the population aged >15 years reporting monthly or more frequent episodes where >5 drinks were consumed
Gender NDSHS
Heavy episodic drinking,
adolescents
Proportion of 12–17 years olds reporting at least one drinking occasion in the previous week where >5 drinks were consumed.
Gender ASSAD
Long-term risky drinking Proportion of the population aged >15 years reporting average alcohol consumption of more than 14 standard drinks per week
Gender NDSHS
Emergency department
presentations
Presentations for injury to Australian Emergency Departments on Friday, Saturday and Sunday nights
Gender and age (<30, >30 years)
NAIP
Hospital admissions for
alcohol use disorders
Hospital admissions for Alcohol Use Disorder Gender NAIP
Alcoholic liver disease
deaths
Mortality rates with primary cause of alcoholic liver cirrhosis
Gender ABS
*ABS: Australian Bureau of Statistics; NDSHS: National Drug Strategy Household Survey; ASSAD: Australian School Students Alcohol and Drug Survey; NAIP: National Alcohol Indicators Project

21
Targets and indicators for chronic disease prevention in Australia
Michael Livingston and Kypros Kypri
Technical paper No. 2015-07
November 2015
3.5 Discussion
There is a well-established evidence base identifying policy actions likely to reduce alcohol consumption and related harms (Babor et al. 2010). The three key policy approaches relate to pricing, physical availability and promotion.
Pricing
There is robust research evidence from many countries, including Australia, that increasing the price of alcohol reduces alcohol consumption and related harms (Wagenaar et al. 2009, Wagenaar et al. 2010). Modifying the price of the cheapest beverages is likely to produce the largest health gains (Gruenewald et al. 2006). This can be achieved both through modifying the tax rates applied to alcohol and via a mandated minimum unit price (Purshouse et al. 2010, Stockwell et al. 2013). The current policy allows for wine to be sold for less than $0.30 per standard drink (The Australia Institute 2015) such that wine has become the beverage of choice of our heaviest drinkers (Gray et al. 1999).
Physical availability
Restricting the physical availability of alcohol, either via limiting the number of outlets in proximity to people’s homes or the times of day at which alcohol can be sold, are effective means of reducing alcohol-related harm (Babor et al. 2010). In Australia, there is particularly strong evidence that liberalising pub trading hours increases alcohol-related harm (Chikritzhs & Stockwell 2002, Chikritzhs & Stockwell 2006) and that restrictions on late-night trading by pubs and bars reduces harm (Kypri et al. 2014b, Menéndez et al. 2015). There is growing evidence that expansion of the packaged liquor market has had negative impacts on population health, eg. via increased rates of chronic disease and family violence (Livingston 2011a, Livingston 2011b). In relation to harms among young adults, there is evidence that increasing the minimum legal purchase age to 20 or 21 years is an effective policy (Dejong & Blanchette 2014, Kypri et al. 2014a).
Promotion
Exposure to alcohol advertising among children and adolescents is associated with early initiation to drinking and with the volume consumed (Anderson et al. 2009). Alcohol is widely promoted in Australia, with children and adolescents exposed to intensive advertising via traditional media outlets (Carr et al. 2015, O’Brien et al. 2015, Pettigrew et al. 2012) and the internet (Carah et al. 2015). Furthermore, the current ‘self-regulation’ of alcohol advertising content in Australia is ineffective (Alcohol Advertising Review Board 2015, Jones et al. 2008). Government regulation of the volume, timing, context (eg., sport), and medium of advertising, is necessary to reduce harmful alcohol consumption.
Population groups of concern
Some population groups (eg., young people, people in remote communities, dependent drinkers) are at particularly high risk of alcohol-related harm. It is important to note that the strategies outlined above are effective at reducing harm among these groups as well as in the population as a whole. For example, there is increasing evidence that sales restrictions in remote and regional communities reduce rates of injury (Margolis et al. 2011, Western Australian Drug and Alcohol Office 2015) and that price policies are effective at reducing consumption among heavy drinkers and young people (Grossman et al. 1994, Wagenaar et al. 2009).
Treatment for alcohol use disorder
The treatment system should be adequately resourced to provide high-quality care for patients with alcohol use disorder. Given the relatively small number of people seeking treatment and the wide distribution of harm from alcohol consumption, treatment should not be relied upon to address this problem. The emphasis on policy must be on the price, physical availability and promotion of alcohol for population level improvements to occur.
22
Targets and indicators for chronic disease prevention in Australia
Michael Livingston and Kypros Kypri
Technical paper No. 2015-07
November 2015
Better data
A noteworthy outcome of the Working Group’s deliberations was recognition of the need for commitment by the Commonwealth and State governments to improve the quality of data used for outcome and risk factor surveillance in relation to alcohol. Mandated alcohol sales data at the outlet level is achievable (eg., it is collected in WA and NT) and would substantially improve surveillance and the capacity to estimate the effects of policy changes.
References
Alcohol Advertising Review Board (2015), Alcohol Advertising Review Board Annual Report 2014/15, Perth, McCusker Centre for Action on Alcohol and Youth, 2015.
Anderson, P, de Bruijn, A, Angus, K, Gordon, R & Hastings G (2009), Impact of alcohol advertising and media exposure on adolescent alcohol use: a systematic review of longitudinal studies, Alcohol and Alcoholism, vol. 44, no. 3, pp. 229-43.
Australian Bureau of Statistics (ABS) (2015), Apparent consumption of alcohol, Australia, 2013-14, Canberra, ABS, 2015.
Australian Institue of Health and Welfare (AIHW) (2014), National Drug Strategy Household Survey 2013 - Supplementary Tables, Canberra, AIHW.
Babor, T, Caetano, R, Casswell, S, Edwards, G, Giesbrecht, N, Graham, K, Grube, JW, Hill, L, Holder, H, Homel, R, Livingston, M, Österberg, E, Rehm, J, Room, R & Rossow, I (2010), Alcohol: No Ordinary Commodity: Research and Public Policy (2nd edition), Oxford, Oxford University Press.
Carah, N, Brodmerkel, S & Shaul M (2015), Breaching the code: alcohol, Facebook and self-regulation, Canberra, Foundation for Alcohol Research and Education.
Carr, S, O’Brien, KS, Ferris, J, Room, R, Livingston, M, Vandenberg, B, Donovan, RJ & Lynott, D (2015), Child and adolescent exposure to alcohol advertising in Australia’s major televised sports, Drug and Alcohol Review, doi: 10.1111/dar.12326.
Carragher N & Chalmers, J (2012), What are the options? Pricing and taxation policy reforms to redress excessive alcohol consumption and related harms in Australia, Sydney, Bureau of Crime Statistics and Research.
Chikritzhs, N, Dietze, PM, Allsop, SJ, Daube, MM, Hall, WD & Kypri, K (2009), The “alcopops” tax: heading in the right direction, Medical Journal of Australia, vol. 190, no. 6, pp. 294-5.
Chikritzhs, T & Stockwell, T (2002), The impact of later trading hours for Australian public houses (hotels) on levels of violence, Journal of Studies on Alcohol, vol. 63, pp. 591-9.
Chikritzhs, T & Stockwell, T (2007), The impact of later trading hours for hotels (public houses) on breath alcohol levels of apprehended impaired drivers, Addiction, vol. 102, no. 10, pp. 1609.
Chikritzhs, T & Stockwell, T (2006), The impact of later trading hours for hotels on levels of impaired driver road crashes and driver breath alcohol levels, Addiction, vol. 101, no. 9, pp. 1254-64.
Dejong, W & Blanchette J (2014), Case closed: research evidence on the positive public health impact of the age 21 minimum legal drinking age in the United States, Journal of Studies on Alcohol and Drugs, s17, pp. 108-15.
GBD 2013 Risk Factors Collaborators (2015), Global, regional, and national comparative risk assessment of 79 behavioural, environmental and occupational, and metabolic risks or clusters of risks in 188 countries, 1990–2013: a systematic analysis for the Global Burden of Disease Study 2013, Lancet, S0140-6736(15)00128-2.
23
Targets and indicators for chronic disease prevention in Australia
Michael Livingston and Kypros Kypri
Technical paper No. 2015-07
November 2015
Gao, C, Ogeil, R & Lloyd, B (2014), Alcohol’s burden of disease in Australia, Canberra, Foundation for Alcohol Research and Education and VicHealth in collaboration with Turning Point.
Gray, D, Chikritzhs, T & Stockwell, T (1999), The Northern Territory’s cask wine levy: health and taxation policy implications. Australian and New Zealand Journal of Public Health, vol. 23, no. 6, pp. 651-3.
Grossman, M, Chaloupka, FJ, Saffer, H & Laixuthai, A (1994), Effects of alcohol price policy on youth: a summary of economic research, Journal of Research on Adolescence, vol. 4, no. 2, pp. 347-64.
Gruenewald, PJ, Ponicki, WR, Holder, HD & Romelsjö, A (2006), Alcohol prices, beverage quality, and the demand for alcohol: quality substitutions and price elasticities, Alcoholism: Clinical and Experimental Research, vol. 30, no. 1, pp. 96-105.
Jones, SC, Hall, D & Munro, G (2008), How effective is the revised regulatory code for alcohol advertising in Australia? Drug and Alcohol Review, vol. 27, no. 1, pp. 29-38.
Kypri, K, Davie, G, McElduff, P, Connor, J & Langley J (2014), Effects of lowering the minimum alcohol purchasing age on weekend assaults resulting in hospitalization in New Zealand, American Journal of Public Health, vol. 104, no. 8, pp. 1396-401.
Kypri, K, McElduff, P & Miller P, (2014), Restrictions in pub closing times and lockouts in Newcastle, Australia five years on. Drug and Alcohol Review, vol. 33, no. 3, pp. 323-6.
Lensvelt, E, Gilmore, W, Gordon, E, Hobday, M, Liang, W & Chikritzhs, T (2015), Trends in estimated alcohol-related emergency department presentations in Australia, 2005-06 to 2011-12, Perth, National Drug Research Institute, Curtin University.
Liang, W, Chikritzhs, T, Pascal, R & Binns, CW (2011), Mortality rate of alcoholic liver disease and risk of hospitalisation for alcoholic liver cirrhosis, alcoholic hepatitis, and alcoholic liver failure in Australia between 1993 and 2005, Internal Medicine Journal, vol. 41, no. 1a, pp. 34-41.
Livingston, M (2011), A longitudinal analysis of alcohol outlet density and domestic violence. Addiction, vol. 106, no. 5, pp. 919-25.
Livingston, M (2011), Alcohol outlet density and harm: comparing the impacts on violence and chronic harms, Drug and Alcohol Review, vol. 30, no. 5, pp. 515-23.
Manton, E, Room, R, Giorgi, C & Thorn, M (eds), (2014), Stemming the tide of alcohol: liquor licensing and the public interest, Canberra, Foundation for Alcohol Research and Education.
Margolis, SA, Ypinazar, VA, Muller, R & Clough, A (2011), Increasing alcohol restrictions and rates of serious injury in four remote Australian Indigenous communities, Medical Journal of Australia, vol. 194, no. 10, pp. 503-6.
Menéndez, P, Weatherburn, D, Kypri, K & Fitzgerald, J (2015), Lockouts and last drinks, Sydney, Bureau of Crime Statistics and Research.
Ministerial Council on Drug Strategy (MCDS) (2006), National Alcohol Strategy 2006–2009, Canberra, MCDS.
Ministerial Council on Drug Strategy (MCDS) (2010), The National Drug Strategy 2010–2015: A framework for action on alcohol, tobacco, illegal and other drugs, Canberra, MCDS.
Ministerial Taskforce on Alcohol and Public Safety (2008), Victoria’s Alcohol Action Plan – 2008-–2013. Melbourne, Victorian Government.
24
Targets and indicators for chronic disease prevention in Australia
Michael Livingston and Kypros Kypri
Technical paper No. 2015-07
November 2015
NSW Health (2007), Drug and Alcohol Plan 2006–2010: a plan for the NSW Health Drug and Alcohol Program, Sydney, NSW Health.
O’Brien, KS, Carr, S, Ferris, J, Room, R, Miller, P, Livingston, M, Kypri, K & Lynott, D (2015), Alcohol advertising in sport and non-sport TV in Australia, during children’s viewing times, PLoS One, vol. 10, no. 8, e0134889.
O’Brien KS & Kypri K (2008), Alcohol industry sponsorship and hazardous drinking among sportspeople, Addiction, vol. 103, no. 12, pp. 1961-6.
O’Brien, KS, Miller, PG, Kolt, GS, Martens, MP & Webber, A (2011), Alcohol industry and non-alcohol industry sponsorship of sportspeople and drinking. Alcohol and Alcoholism, vol. 46, no. 2, pp. 210-3.
Pascal, R, Liang, W, Gilmore, W & Chikritzhs, T (2013), Risks of alcohol-attributable hospitalisation and death in Australia over time: Evidence of divergence by region, age and sex, Australasian Medical Journal, vol. 6, no. 3, pp. 134-51.
Pettigrew, S, Roberts, M, Pescud, M, Chapman, K, Quester, P & Miller, C (2012), The extent and nature of alcohol advertising on Australian television, Drug and Alcohol Review, vol. 31, no. 6, pp. 797-802.
Purshouse, RC, Meier, PS, Brennan, A, Taylor, KB & Rafia R (2010), Estimated effect of alcohol pricing policies on health and health economic outcomes in England: an epidemiological model, Lancet, vol. 375, no. 9723, pp. 1355-64.
Stockwell, T, Zhao, J, Martin, G, Macdonald, S, Vallance, K, Treno, A, Ponicki, W, Tu, A & Buxton, J (2013), Minimum alcohol prices and outlet densities in British Columbia, Canada: estimated impacts on alcohol-attributable hospital admissions, American Journal of Public Health, vol. 103, no. 11, pp. 2014-20.
The Australia Institute (2015), The Goon Show - How the tax system works to subsidise cheap wine and alcohol consumption, Canberra, The Australia Institute.
Wagenaar, AC, Salois, MJ & Komro KA (2009), Effects of beverage alcohol price and tax levels on drinking: a meta-analysis of 1003 estimates from 112 studies, Addiction, vol. 104, no. 2, pp. 179-90.
Wagenaar, AC, Tobler, AL & Komro KA (2010), Effects of alcohol tax and price policies on morbidity and mortality: a systematic review, American Journal of Public Health, vol. 100, no. 11, pp. 2270-8.
Western Australian Drug and Alcohol Office (2015), The impact of liquor restrictions in Halls Creek, Perth, WA Drug and Alcohol Office.
World Health Organisation (WHO) (2014), Global Status Report on Alcohol and Health, 2014 Edition, Geneva, WHO.
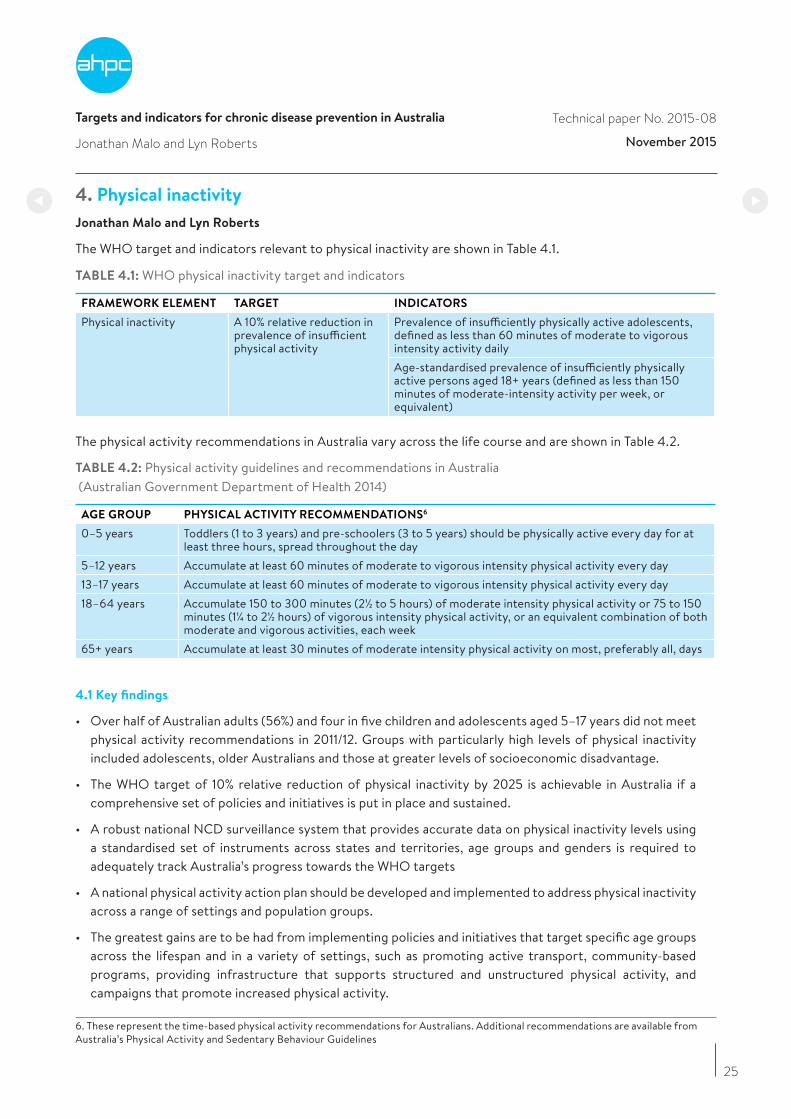
Targets and indicators for chronic disease prevention in Australia
Jonathan Malo and Lyn Roberts
Technical paper No. 2015-08
November 2015
25
4. Physical inactivity
Jonathan Malo and Lyn Roberts
The WHO target and indicators relevant to physical inactivity are shown in Table 4.1.
TABLE 4.1: WHO physical inactivity target and indicators
FRAMEWORK ELEMENT TARGET INDICATORS
Physical inactivity A 10% relative reduction in prevalence of insufficient physical activity
Prevalence of insufficiently physically active adolescents, defined as less than 60 minutes of moderate to vigorous intensity activity dailyAge-standardised prevalence of insufficiently physically active persons aged 18+ years (defined as less than 150 minutes of moderate-intensity activity per week, or equivalent)
The physical activity recommendations in Australia vary across the life course and are shown in Table 4.2.
TABLE 4.2: Physical activity guidelines and recommendations in Australia (Australian Government Department of Health 2014)
AGE GROUP PHYSICAL ACTIVITY RECOMMENDATIONS6
0–5 years Toddlers (1 to 3 years) and pre-schoolers (3 to 5 years) should be physically active every day for at least three hours, spread throughout the day
5–12 years Accumulate at least 60 minutes of moderate to vigorous intensity physical activity every day13–17 years Accumulate at least 60 minutes of moderate to vigorous intensity physical activity every day18–64 years Accumulate 150 to 300 minutes (2½ to 5 hours) of moderate intensity physical activity or 75 to 150
minutes (1¼ to 2½ hours) of vigorous intensity physical activity, or an equivalent combination of both moderate and vigorous activities, each week
65+ years Accumulate at least 30 minutes of moderate intensity physical activity on most, preferably all, days
4.1 Key findings
• Over half of Australian adults (56%) and four in five children and adolescents aged 5–17 years did not meet physical activity recommendations in 2011/12. Groups with particularly high levels of physical inactivity included adolescents, older Australians and those at greater levels of socioeconomic disadvantage.
• The WHO target of 10% relative reduction of physical inactivity by 2025 is achievable in Australia if a comprehensive set of policies and initiatives is put in place and sustained.
• A robust national NCD surveillance system that provides accurate data on physical inactivity levels using a standardised set of instruments across states and territories, age groups and genders is required to adequately track Australia’s progress towards the WHO targets
• A national physical activity action plan should be developed and implemented to address physical inactivity across a range of settings and population groups.
• The greatest gains are to be had from implementing policies and initiatives that target specific age groups across the lifespan and in a variety of settings, such as promoting active transport, community-based programs, providing infrastructure that supports structured and unstructured physical activity, and campaigns that promote increased physical activity.
6. These represent the time-based physical activity recommendations for Australians. Additional recommendations are available from Australia’s Physical Activity and Sedentary Behaviour Guidelines

Targets and indicators for chronic disease prevention in Australia
Jonathan Malo and Lyn Roberts
Technical paper No. 2015-08
November 2015
26
4.2 Introduction
Physical inactivity is among the leading contributors to the burden of disease in Australia (Begg et al. 2007) and has been estimated to contribute a similar proportion to global premature mortality as smoking and obesity (Lee et al. 2012). The majority of the disease burden from physical inactivity arises from ischaemic heart disease, type 2 diabetes and stroke (Begg et al. 2007).
The most recent results of the AHS demonstrate that the vast majority of Australians are not sufficiently physically active for good health (ABS 2013a). Levels of physical activity vary considerably according to age, sex, location, education, and levels of disadvantage. Older Australians (aged 65+ years), children and adolescents (aged 5–17 years), and the most socioeconomically disadvantaged make up groups with some of the highest levels of insufficient physical activity in Australia. As the proportion of older people in Australia continues to increase, the burden of disease attributable to physical inactivity will likely follow.
There has been limited standardisation of physical activity surveillance in Australia over the past 30 years (Bauman & Chau 2015). Changes to survey questions have led to varying estimates of the national prevalence of physical inactivity, although some states have maintained consistent and standardised monitoring of physical activity prevalence (Figure 4.1). More recently, use of accelerometers to objectively measure physical activity has added precision, but also complexity, to the epidemiological methods with which physical activity is measured. Updates to physical activity recommendations and guidelines have also made it challenging to assess trends in the prevalence of meeting guidelines.
FIGURE 4.1: Prevalence of sufficient physical activity from state- and territory-based surveys in Australia, 2001 to 2013
2001
NSW QLD WA VIC SA ACT
2002 2003 2004 2005 2006 2007 2008 2009 2010 2011 2012 201340
45
50
55
60
65
Source: Monitoring population trends through physical activity surveillance – a chequered history in Australia (Bauman & Chau 2015, p. 7).
4.3 Relevance of WHO targets
The WHO target of a 10% relative reduction in prevalence of insufficiently active children and adults is relevant to Australia. Investment in increasing physical activity across the life course provides many health benefits and would also contribute towards Australia’s progress towards other WHO targets related to obesity, diabetes, high blood pressure and premature mortality from NCD (Lee et al. 2012, Warburton et al. 2006), in addition to the well-recognised benefits of physical activity for psychological wellbeing and mental health (U.S. Department of Health and Human Services 1996).
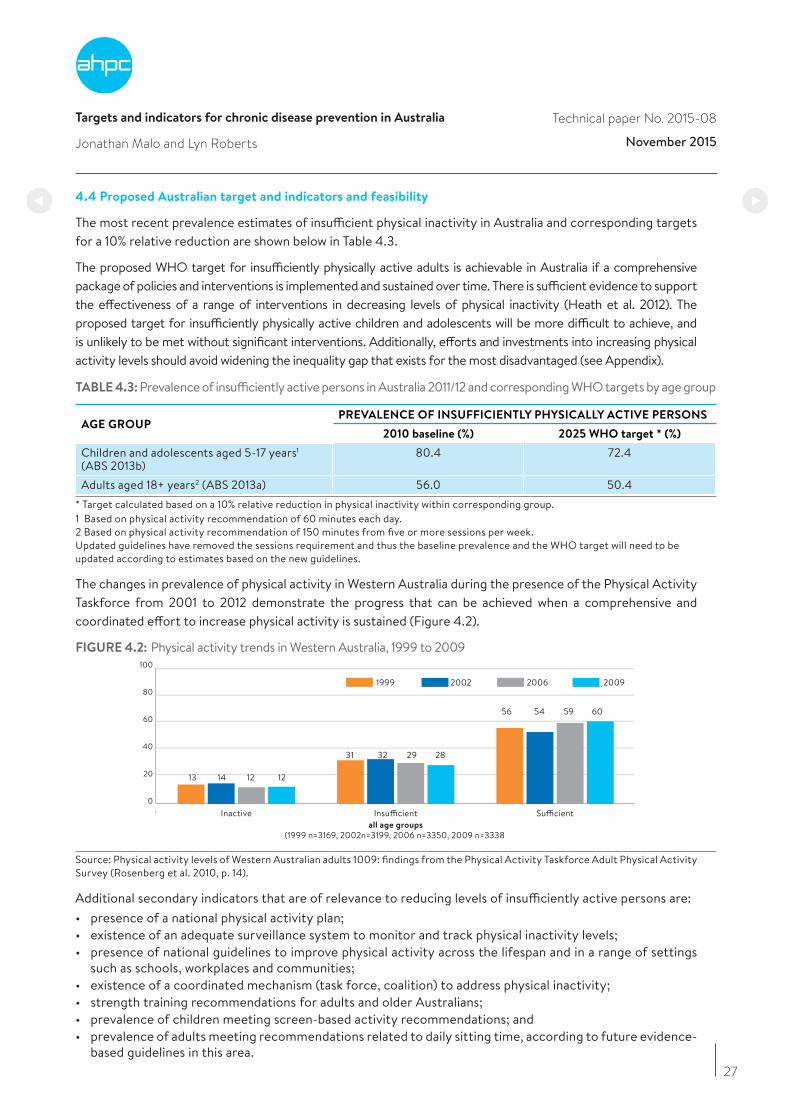
Targets and indicators for chronic disease prevention in Australia
Jonathan Malo and Lyn Roberts
Technical paper No. 2015-08
November 2015
27
4.4 Proposed Australian target and indicators and feasibility
The most recent prevalence estimates of insufficient physical inactivity in Australia and corresponding targets for a 10% relative reduction are shown below in Table 4.3.
The proposed WHO target for insufficiently physically active adults is achievable in Australia if a comprehensive package of policies and interventions is implemented and sustained over time. There is sufficient evidence to support the effectiveness of a range of interventions in decreasing levels of physical inactivity (Heath et al. 2012). The proposed target for insufficiently physically active children and adolescents will be more difficult to achieve, and is unlikely to be met without significant interventions. Additionally, efforts and investments into increasing physical activity levels should avoid widening the inequality gap that exists for the most disadvantaged (see Appendix).
TABLE 4.3: Prevalence of insufficiently active persons in Australia 2011/12 and corresponding WHO targets by age group
AGE GROUPPREVALENCE OF INSUFFICIENTLY PHYSICALLY ACTIVE PERSONS
2010 baseline (%) 2025 WHO target * (%)
Children and adolescents aged 5-17 years1 (ABS 2013b)
80.4 72.4
Adults aged 18+ years2 (ABS 2013a) 56.0 50.4* Target calculated based on a 10% relative reduction in physical inactivity within corresponding group. 1 Based on physical activity recommendation of 60 minutes each day. 2 Based on physical activity recommendation of 150 minutes from five or more sessions per week. Updated guidelines have removed the sessions requirement and thus the baseline prevalence and the WHO target will need to be updated according to estimates based on the new guidelines.
The changes in prevalence of physical activity in Western Australia during the presence of the Physical Activity Taskforce from 2001 to 2012 demonstrate the progress that can be achieved when a comprehensive and coordinated effort to increase physical activity is sustained (Figure 4.2).
FIGURE 4.2: Physical activity trends in Western Australia, 1999 to 2009
Inactive Insufficientall age groups
(1999 n=3169, 2002n=3199, 2006 n=3350, 2009 n=3338
Sufficient
1999 2002 2006 2009
13
31 32 29 28
56 54 59 60
14 12 12
0
20
40
60
80
100
13 14 12 12
Source: Physical activity levels of Western Australian adults 1009: findings from the Physical Activity Taskforce Adult Physical Activity Survey (Rosenberg et al. 2010, p. 14).
Additional secondary indicators that are of relevance to reducing levels of insufficiently active persons are:• presence of a national physical activity plan;• existence of an adequate surveillance system to monitor and track physical inactivity levels;• presence of national guidelines to improve physical activity across the lifespan and in a range of settings
such as schools, workplaces and communities; • existence of a coordinated mechanism (task force, coalition) to address physical inactivity;• strength training recommendations for adults and older Australians;• prevalence of children meeting screen-based activity recommendations; and • prevalence of adults meeting recommendations related to daily sitting time, according to future evidence-
based guidelines in this area.
Targets and indicators for chronic disease prevention in Australia
Jonathan Malo and Lyn Roberts
Technical paper No. 2015-08
November 2015
28
4.5 Discussion
In order to adequately monitor physical activity trends, progress the development, and assess the impact of policies and initiatives, measurement of physical activity needs to be standardised and maintained across all states and territories, using similar methods and with prevalence estimates based on the same metrics.
Physical activity should be promoted throughout all stages of life and in a variety of settings. The following are the most valuable opportunities to increase physical activity levels in Australia, and should form the key initiatives of a national physical activity plan (GAPA ISPAH 2012, National Heart Foundation of Australia 2015).
Active children and schools
• Mandate delivery of high quality physical education lessons and active curricula for all ages (kindergarten to Year 12).
• Work with local government to enhance neighbourhood infrastructure and physical environments to support children to play safely, to walk and cycle.
• Engage staff, students, parents and communities in supporting the above policies and programs.
Active workers and workplaces
• Provide targeted education and programs for workplaces to promote physical activity to support workers’ physical and mental health.
• Support businesses to invest in evidence-based policies and programs that increase physical activity. • Provide fringe benefits tax exemption for workplace packaging of sporting and health club memberships,
bicycle purchases and public transport use.
Active older people and aged care
• Support delivery of accessible and affordable evidence-based physical activity programs, delivered by a range of community organisations and primary care providers to help seniors stay well and manage existing health problems.
• Introduce policy mechanisms to mandate the delivery of physical activity programs in aged-careservices and settings and account for the mobility and functional capabilities of older Australians when designing spaces and places.
• Engage staff of aged care facilities, carers and communities in supporting the above policies and programs.
Active transport
• Ensure walk/cycle-to-school /education programs are supported and promoted by all local governments and for all age groups.
• Develop and fund a national walking and cycling strategy embracing walking, cycling and public transport to improve health and decrease traffic congestion.
• Provide financial or tax incentives to encourage employees to walk, cycle or take public transport to work. • Work with state, territory and local governments to enhance laws that protect vulnerable road users.
• Develop and implement policies that promote land use for footpaths, bikeways and public transport.
Active cities and communities
• Support local government infrastructure and program funding that promotes active living across the lifespan, with a particular focus on reducing inequity.
• Implement national urban design policies that enable active living for all ages and abilities.• Assist local government to create and expand regional rail trails, cycle routes and walking/hiking tracks to
promote tourism and recreation.• Improve attractiveness, safety and conduct public education to increase awareness of local facilities and
parks.

Targets and indicators for chronic disease prevention in Australia
Jonathan Malo and Lyn Roberts
Technical paper No. 2015-08
November 2015
29
• Support whole-of-community and targeted (for those at risk) approaches to increasing physical activity that engage multiple sectors across a range of settings for all ages.
• Support and implement community sport systems that provide a range of traditional and non-traditional sporting opportunities for all ages, genders and sociocultural backgrounds.
• Engage sporting organisations and athletes to promote participation in sport at all levels.
Active health care
• Fund evidence-based physical activity and lifestyle modification programs for people with or at risk of chronic disease.
• Establish referral pathways and subsidies for GPs and allied health professionals (eg. exercise physiologists) to educate and refer patients into evidence-based physical activity and lifestyle modification programs.
• Promote physical activity as part of behavioural risk screening in primary care settings and support community-based programs to support behaviour change related to physical activity.
Public education and campaigns
• Fund national education programs to encourage more active families, workers and seniors.• Support and sustain paid and non-paid forms of media to support ‘Move More – Sit Less’ initiatives, raise
awareness, increase knowledge, shift community norms and values to motivate population groups to be active, and promote a physically active culture in Australia.
4.6 Acknowledgement
The Working Group would like to acknowledge the ‘Move More, Sit Less’: Australia needs a funded National Physical Activity Action Plan communiqué and work undertaken by the National Heart Foundation of Australia in developing a framework and advocating for a National Physical Activity Action Plan.
References
Australian Bureau of Statistics (ABS) (2013a), Australian Health Survey: Physical Activity, 2011-2012, Table 1: summary activity indicators by age then sex, persons aged 18 years and over, cat. no.4364.0.55.004. Canberra, ABS.
Australian Bureau of Statistics (ABS) (2013b), Australian Health Survey: Physical Activity, 2011-2012, Table 2: summary activity indicators by age then sex, children aged 5-17 years, cat. no.4364.0.55.004, Canberra, ABS.
Australian Government Department of Health (2014), Australia’s Physical Activity and Sedentary Behaviour Guidelines, http://www.health.gov.au/internet/main/publishing.nsf/content/health-pubhlth-strateg-phys-act-guidelines#npa05.
Bauman, A & Chau, J (2015), Monitoring population trends through physical activity surveillance – a chequered history in Australia, Australasian Epidemiologist, vol. 22, pp. 5-8.
Begg, S, Vos, T, Barker, B, Stevenson, C, Stanley, L & Lopez, A (2007), The burden of disease and injury in Australia 2003, Canberra, AIHW.
Global Advocacy for Physical Activity (GAPA) the Advocacy Council of the International Society for Physical Activity (ISPAH) 2012. Non-communicable disease prevention: investments that work for physical activity, British Journal of Sports Medicine, vol. 46, pp. 709-712.
Heath, GW, Parra, DC, Sarmiento, OL, Andersen, LB, Owen, N, Goenka, S, Montes, F & Brownson, RC (2012), Physical Activity 3: Evidence-based intervention in physical activity: lessons from around the world, Lancet, vol. 380, pp. 272-81.
Lee, I-M, Shiroma, EJ, Lobelo, F, Puska, P, Blair, SN & Katzmarzyk, PT (2012), Effect of physical inactivity on major non-communicable diseases worldwide: an analysis of burden of disease and life expectancy, Lancet, vol. 380, pp. 219-229.
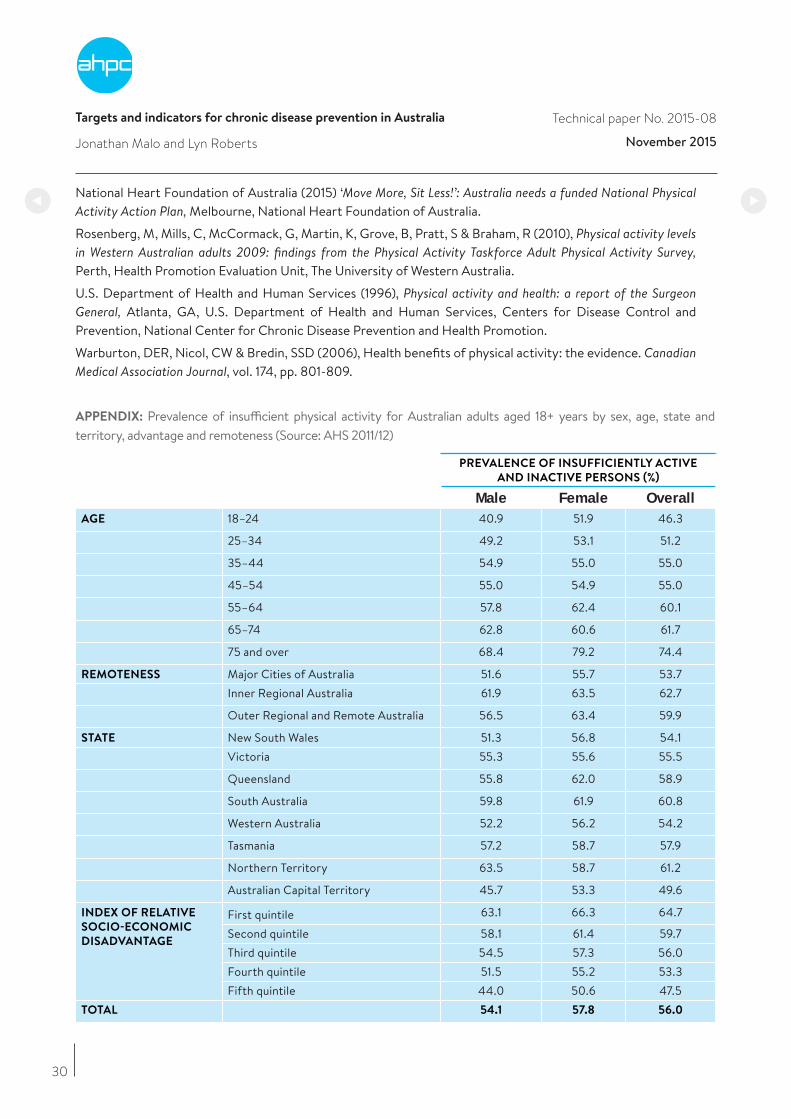
Targets and indicators for chronic disease prevention in Australia
Jonathan Malo and Lyn Roberts
Technical paper No. 2015-08
November 2015
30
National Heart Foundation of Australia (2015) ‘Move More, Sit Less!’: Australia needs a funded National Physical Activity Action Plan, Melbourne, National Heart Foundation of Australia.
Rosenberg, M, Mills, C, McCormack, G, Martin, K, Grove, B, Pratt, S & Braham, R (2010), Physical activity levels in Western Australian adults 2009: findings from the Physical Activity Taskforce Adult Physical Activity Survey, Perth, Health Promotion Evaluation Unit, The University of Western Australia.
U.S. Department of Health and Human Services (1996), Physical activity and health: a report of the Surgeon General, Atlanta, GA, U.S. Department of Health and Human Services, Centers for Disease Control and Prevention, National Center for Chronic Disease Prevention and Health Promotion.
Warburton, DER, Nicol, CW & Bredin, SSD (2006), Health benefits of physical activity: the evidence. Canadian Medical Association Journal, vol. 174, pp. 801-809.
APPENDIX: Prevalence of insufficient physical activity for Australian adults aged 18+ years by sex, age, state and territory, advantage and remoteness (Source: AHS 2011/12)
PREVALENCE OF INSUFFICIENTLY ACTIVE
AND INACTIVE PERSONS (%)
Male Female OverallAGE 18–24 40.9 51.9 46.3
25–34 49.2 53.1 51.2
35–44 54.9 55.0 55.0
45–54 55.0 54.9 55.0
55–64 57.8 62.4 60.1
65–74 62.8 60.6 61.7
75 and over 68.4 79.2 74.4
REMOTENESS Major Cities of Australia 51.6 55.7 53.7Inner Regional Australia 61.9 63.5 62.7
Outer Regional and Remote Australia 56.5 63.4 59.9
STATE New South Wales 51.3 56.8 54.1Victoria 55.3 55.6 55.5
Queensland 55.8 62.0 58.9
South Australia 59.8 61.9 60.8
Western Australia 52.2 56.2 54.2
Tasmania 57.2 58.7 57.9
Northern Territory 63.5 58.7 61.2
Australian Capital Territory 45.7 53.3 49.6
INDEX OF RELATIVE
SOCIO-ECONOMIC
DISADVANTAGE
First quintile 63.1 66.3 64.7
Second quintile 58.1 61.4 59.7Third quintile 54.5 57.3 56.0Fourth quintile 51.5 55.2 53.3Fifth quintile 44.0 50.6 47.5
TOTAL 54.1 57.8 56.0

Targets and indicators for chronic disease prevention in Australia
, and Bruce Bolam
Technical paper No. 2015-08
November 2015
31
5. Salt
Carley Grimes and Bruce Bolam
The WHO target and indicator relevant to dietary salt intake are in Table 5.1.
TABLE 5.1: WHO salt target and indicator
FRAMEWORK ELEMENT TARGET INDICATOR
Salt/sodium intake A 30% relative reduction in mean population intake of salt/sodium
Age-standardised mean population intake of sodium expressed as salt grams per day
A high salt intake contributes to the development of high blood pressure, which is a major risk factor for heart disease and stroke. High blood pressure afflicts one in three Australian adults (AIHW 2015). In Australia, heart disease and stroke are the leading underlying causes of death. In 2010, high blood pressure was responsible for 58% of all stroke deaths and 46% of heart disease deaths. High blood pressure also contributes to dementia, which is the fourth leading cause of overall burden of disease and the third leading cause of disability burden in Australia (AIHW 2012a, 2012b). Research by VicHealth (Victorian Health Promotion Foundation) found six times more deaths in Victoria were attributable to high salt than to road crashes (Trieu & Webster 2015).
Population salt reduction is recognised as one of the most effective and cost-effective strategies to improve population health (Cobiac et al. 2012). Reducing population salt intake is predicted to lead to significant falls in blood pressure and reduces the risk of cardiovascular diseases at 1-2% of the cost of a clinical hypertension program. Given the high intakes of salt in Australian adults and children coupled with the significant burden of high blood pressure in Australia, the WHO target is highly relevant (AIHW 2005, He & MacGregor 2011).
5.1 Key findings
• Reducing mean salt intake by 30% by 2025 is challenging but entirely feasible for Australia and would be oneof the most cost-effective, efficient and equitable ways to improve population health over the next decade.
• Salt intake of Australian adults and children is well above the recommended daily upper level.
• Available data suggests a small decrease in population salt intake, but this trend needs to be acceleratedto reach the WHO target for salt reduction.
• Reducing population salt intake by 30% would result in 3500 fewer deaths a year from strokes and heartattacks and save millions of dollars to the healthcare system.
• Dementia is also linked with high blood pressure so can be addressed by population salt reduction.
• Processed foods are the major contributor to high salt intakes, and specific targets for reductions of saltlevels in foods are required to drive effective reformulation.
• Some progress has been made through a voluntary approach to salt reduction, but the use of progressivetargets and stronger government-led monitoring and oversight is required to increase effectiveness andprovide a level playing field for the food industry in Australia.
• Monitoring needs to include regular assessment of population salt intake. Ideally this activity would beintegrated into a national NCD surveillance system based on the AHS, including anthropometric andbiomedical measurements (with urine samples to measure salt intake) conducted every five years.
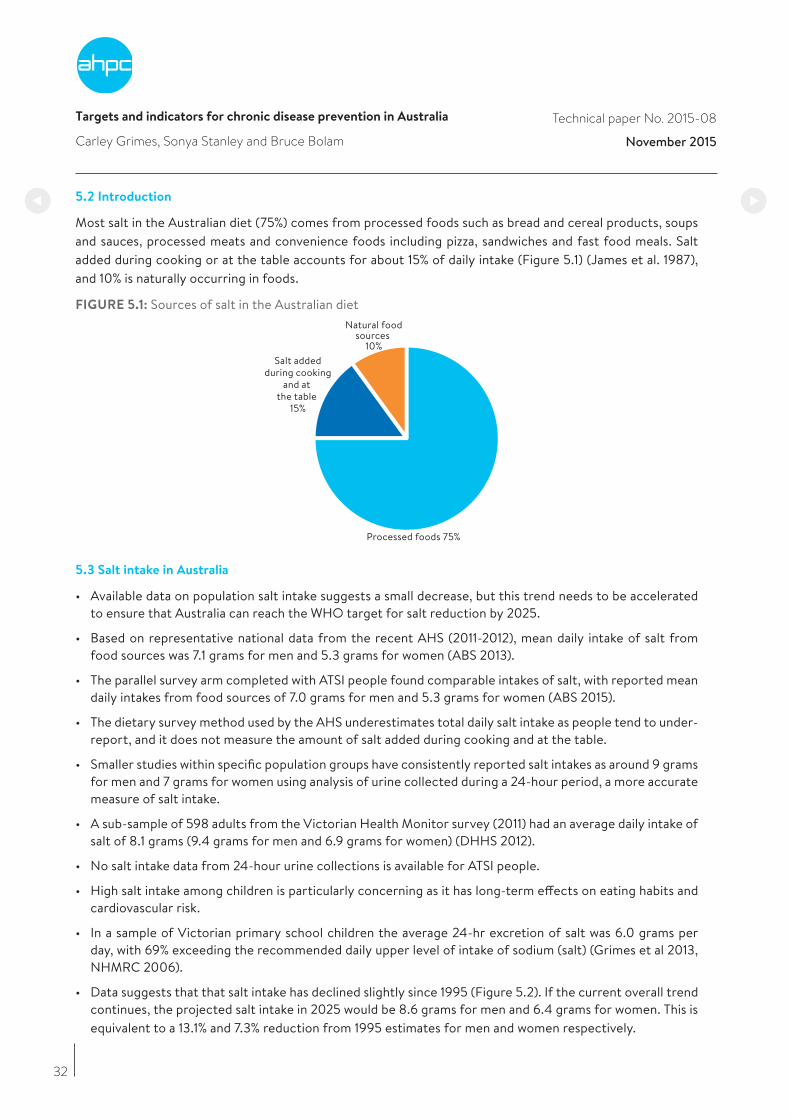
Targets and indicators for chronic disease prevention in Australia
and Bruce Bolam
Technical paper No. 2015-08
November 2015
32
5.2 Introduction
Most salt in the Australian diet (75%) comes from processed foods such as bread and cereal products, soups and sauces, processed meats and convenience foods including pizza, sandwiches and fast food meals. Salt added during cooking or at the table accounts for about 15% of daily intake (Figure 5.1) (James et al. 1987), and 10% is naturally occurring in foods.
FIGURE 5.1: Sources of salt in the Australian dietNatural food
sources 10%
Salt addedduring cooking
and at the table
15%
Processed foods 75%
5.3 Salt intake in Australia
• Available data on population salt intake suggests a small decrease, but this trend needs to be acceleratedto ensure that Australia can reach the WHO target for salt reduction by 2025.
• Based on representative national data from the recent AHS (2011-2012), mean daily intake of salt fromfood sources was 7.1 grams for men and 5.3 grams for women (ABS 2013).
• The parallel survey arm completed with ATSI people found comparable intakes of salt, with reported meandaily intakes from food sources of 7.0 grams for men and 5.3 grams for women (ABS 2015).
• The dietary survey method used by the AHS underestimates total daily salt intake as people tend to under-report, and it does not measure the amount of salt added during cooking and at the table.
• Smaller studies within specific population groups have consistently reported salt intakes as around 9 gramsfor men and 7 grams for women using analysis of urine collected during a 24-hour period, a more accuratemeasure of salt intake.
• A sub-sample of 598 adults from the Victorian Health Monitor survey (2011) had an average daily intake ofsalt of 8.1 grams (9.4 grams for men and 6.9 grams for women) (DHHS 2012).
• No salt intake data from 24-hour urine collections is available for ATSI people.
• High salt intake among children is particularly concerning as it has long-term effects on eating habits andcardiovascular risk.
• In a sample of Victorian primary school children the average 24-hr excretion of salt was 6.0 grams perday, with 69% exceeding the recommended daily upper level of intake of sodium (salt) (Grimes et al 2013,NHMRC 2006).
• Data suggests that that salt intake has declined slightly since 1995 (Figure 5.2). If the current overall trendcontinues, the projected salt intake in 2025 would be 8.6 grams for men and 6.4 grams for women. This isequivalent to a 13.1% and 7.3% reduction from 1995 estimates for men and women respectively.

Targets and indicators for chronic disease prevention in Australia
Carley Grimes and Bruce Bolam
Technical paper No. 2015-08
November 2015
33
5.4 Policy initiatives to reduce salt intake of Australians
In 2009, the Federal Government launched its Food and Health Dialogue with a remit to improve the health of the Australian food supply through voluntary partnerships between the food industry, government and non-government public health organisations. In its first four years, this initiative resulted in the development of voluntary salt reduction targets for nine food categories. The targets adopted are less ambitious than those used internationally, and extending salt reduction targets to other food categories has been slow. In 2014, the Federal Government launched the Health Star Rating system. This front-of-pack labelling scheme uses stars to rate the nutritional profile of packaged foods, including salt, across a small number of food categories.
The Federal Government launched the Healthy Food Partnership in November 2015 with government, industry and preventative health agencies to “work on strategies to educate consumers on fresh produce, appropriate portion sizes and accelerate efforts to reformulate foods to make it healthier.” The Healthy Food Partnership will complement the Health Star Ratings system, so there is renewed opportunity for a greater reduction of salt in processed foods.
Research commissioned in 2015 with 590 consumers revealed the majority of participants support industry-level change to reduce the salt content of processed foods and community education on salt reduction (Trieu & Webster 2015). Currently there is no parallel public awareness campaign to influence consumer behaviour relating to salt specifically and no agreed mechanism for monitoring national changes in salt intake. In 2015, VicHealth instigated a state-level partnership to advance action on salt reduction and launched its strategy, which may provide a model for further national action (Webster et al. 2015).
FIGURE 5.2: Trend in daily salt intake amongst men and women aged 18 years and over determined via 24-hour urine collections (Beard et al, 1997, Land et al, 2014, Nowson et al, 2015)
SALT
INTA
KE (g
/d)
1995
9.99.4 8.9
8.48.1
6.9
7.6
6.4
1998 2001 2004 2007 2010 2013 2016 2019 2022 2025
MEN WOMEN ALL
0
2
4
6
8
10
6.9
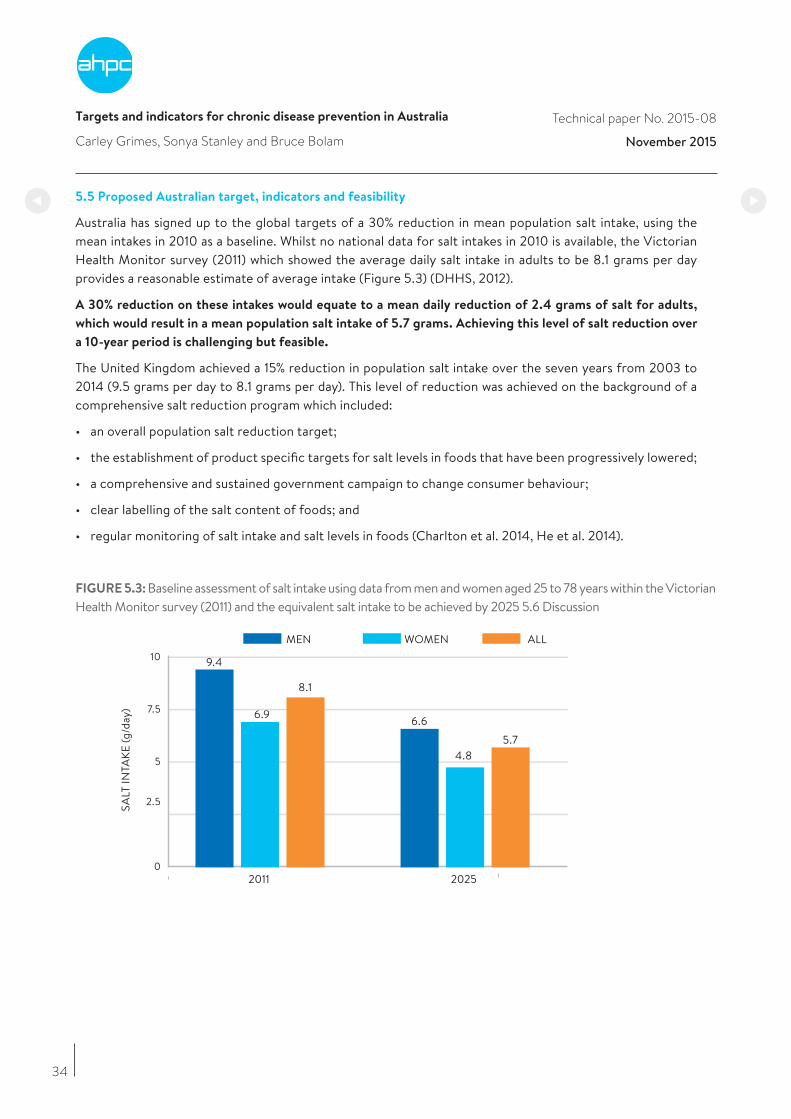
Targets and indicators for chronic disease prevention in Australia
Carley Grimes and Bruce Bolam
Technical paper No. 2015-08
November 2015
34
5.5 Proposed Australian target, indicators and feasibility
Australia has signed up to the global targets of a 30% reduction in mean population salt intake, using the mean intakes in 2010 as a baseline. Whilst no national data for salt intakes in 2010 is available, the Victorian Health Monitor survey (2011) which showed the average daily salt intake in adults to be 8.1 grams per day provides a reasonable estimate of average intake (Figure 5.3) (DHHS, 2012).
A 30% reduction on these intakes would equate to a mean daily reduction of 2.4 grams of salt for adults,
which would result in a mean population salt intake of 5.7 grams. Achieving this level of salt reduction over
a 10-year period is challenging but feasible.
The United Kingdom achieved a 15% reduction in population salt intake over the seven years from 2003 to 2014 (9.5 grams per day to 8.1 grams per day). This level of reduction was achieved on the background of a comprehensive salt reduction program which included:
• an overall population salt reduction target;
• the establishment of product specific targets for salt levels in foods that have been progressively lowered;
• a comprehensive and sustained government campaign to change consumer behaviour;
• clear labelling of the salt content of foods; and
• regular monitoring of salt intake and salt levels in foods (Charlton et al. 2014, He et al. 2014).
FIGURE 5.3: Baseline assessment of salt intake using data from men and women aged 25 to 78 years within the Victorian Health Monitor survey (2011) and the equivalent salt intake to be achieved by 2025 5.6 Discussion
2011
SALT
INTA
KE (g
/day
)
2025
WOMEN ALLMEN
9.4
6.9
8.1
6.6
5.74.8
31
0
2.5
5
7.5
10
6 9
Targets and indicators for chronic disease prevention in Australia
Carley Grimes and Bruce Bolam
Technical paper No. 2015-08
November 2015
35
5.6 Discussion
Achieving the global target for salt reduction in Australia will be challenging but is entirely feasible. The UK has demonstrated what can be achieved, and there are now many other countries implementing novel salt reduction strategies from which Australia can learn. It will require a concerted drive to increase consumer awareness and a comprehensive program of food reformulation that reduces the level of salt added to processed foods and meals. While there has been some progress through existing initiatives, efforts to reduce population salt intake require government leadership to bring together food industry, consumers and public health in collective action. Achieving the WHO target of a 30% reduction would result in 3500 fewer deaths each year from strokes and heart attacks along with tens of millions of dollars of savings to the healthcare system.
The foundation of a policy and regulatory framework needs to be strengthened for a comprehensive approach to salt reduction in Australia. A responsive, regulatory approach should be introduced progressively to ensure Australia is on track to achieve the global salt reduction target, and is outlined in Appendix Two (at the end of this report).
The recent introduction of the national Health Star Rating System, the Healthy Food Partnership and the implementation of menu labelling (nutrition information) initiatives in several Australian states increase information to consumers on the salt content in processed foods. These initiatives need to be complemented by a well-resourced and sustained marketing campaign and supported by government initiatives to change consumer behaviour.
Together with a renewed commitment to reformulation and consumer education, a progressive approach to salt reduction in Australia will include a comprehensive program with regular and transparent monitoring of salt intake and salt levels in foods. These initiatives will ensure that Australia is on track to achieve the global salt reduction target and thus reap the benefits of this cost-effective, efficient and equitable way to reduce the chronic disease burden in Australia over the next decade.
References
Australian Bureau of Statistics (ABS) (2013), Australian Health Survey: Updated Results 2011 – 2012, ABS cat. no. 4364.0.55.003, http://www.abs.gov.au/AUSSTATS/[email protected]/Lookup/33C64022ABB5ECD5CA257B8200179437?opendocument
Australian Bureau of Statistics (ABS) (2015), Australian Aboriginal and Torres Strait Islander Health Survey: Nutrition Results – Food and Nutrients, 2012–13, ABS cat. no. 4727.0.55.005, http://www.abs.gov.au/AUSSTATS/[email protected]/Lookup/4727.0.55.005Main+Features12012-13?OpenDocument.
Australian Institute of Health and Welfare (AIHW) (2012a), Risk factors, diseases and deaths: high blood pressure, Canberra, AIHW, http://www.aihw.gov.au/high-blood-pressure/
Australian Institute of Health and Welfare (AIHW) (2012b), Dementia in Australia, cat. no. AGE 70, Canberra, AIHW, http://www.aihw.gov.au/publication-detail/?id=10737422958
Australian Institute of Health and Welfare (AIHW) (2015), Cardiovascular disease, diabetes and chronic kidney disease – Australian facts: risk factors, cat. no. CDK 004, Canberra, AIHW.
Australian Institute of Health and Welfare (AIHW) (2005), Health system expenditure on disease and injury in Australia 2000-01 (2nd ed.), http://www.aihw.gov.au/publication-detail/?id=6442467716.
Beard, TC, Woodward, DR, Ball, PJ, Hornsby, H, von Witt, RJ & Dwyer, T (1997), The Hobart Salt Study 1995: few meet national sodium intake target. Medical Journal Of Australia, vol. 166, no. 8, pp. 404-7.

Targets and indicators for chronic disease prevention in Australia
Carley Grimes and Bruce Bolam
Technical paper No. 2015-08
November 2015
36
Charlton, K, Webster, J & Kowal, P (2014), To legislate or not to legislate? A comparison of the UK and South African approaches to the development and implementation of salt reduction programs. Nutrients, vol. 6, no. 9, pp. 3672-95.
Cobiac, LJ, Magnus, A, Lim, S, Barendregt, JJ, Carter, R & Vos, T (2012), Which interventions offer best value for money in primary prevention of cardiovascular disease? PLoS One, vol. 7, no. 7, e41842. doi:10.1371/journal.pone.0041842
Department of Health and Human Services (DHHS), (2012), Victorian Health Monitor Report, DHHS, https://www2.health.vic.gov.au/getfile/?sc_itemid=%7bCAD8D721-DFA2-4320-8496-0EBE07AAB567%7d&title=Victorian%20Health%20Monitor%20report
Grimes, CA, Riddell, LJ, Campbell, KJ & Nowson, CA (2013), Dietary salt intake assessed by 24 h urinary sodium excretion in Australian schoolchildren aged 5–13 years, Public Health Nutrition, vol. 16, no. 10, pp. 1789, 1795.
He, FJ & MacGregor, GA (2011), Salt reduction lowers cardiovascular risk: meta-analysis of outcome trials, Lancet, vol. 30, no. 378(9789), pp. 380-2.
He, FJ, Pombo-Rodrigues, S & Macgregor, GA (2014), Salt reduction in England from 2003 to 2011: its relationship to blood pressure, stroke and ischaemic heart disease mortality, BMJ Open, vol. 4, no. 4, e004549.
James, PT, Ralph, A & Sanchez-Castillo, CP (1987), The dominance of salt in manufactured food in the sodium intake of affluent societies, Lancet, vol. 329, pp. 426-9.
Land, MA, Webster, J, Christoforou, A, Praveen, D, Jeffery, P, Chalmers, J, Smith, W, Woodward, M, Barzi, F, Nowson, C, Flood, V & Neal, B (2014), Salt intake assessed by 24 h urinary sodium excretion in a random and opportunistic sample in Australia, BMJ Open, vol. 4, no. 1, e003720.
National Health and Medical Research Council (NHMRC) (2006), Nutrient Reference Values for Australia and New Zealand, Commonwealth of Australia, https://www.nrv.gov.au/nutrients/sodium
Nowson, CA, Lim, K, Grimes, CA, O’Halloran, S, Land, M, Webster, J, et al. (under review), Dietary salt intake and discretionary salt use in two general population samples in Australia, 2011.
Trieu, K & Webster, J (2015), Economic business case for salt reduction action in Victoria, World Health Organization Collaborating Centre on Population Salt Reduction, Food Policy Division, The George Institute for Global Health, report prepared for VicHealth, https://www.vichealth.vic.gov.au/media-and-resources/publications/state-of-salt
Webster, J, Trieu, K, Dunford, E, Nowson, C, Jolly, KA, Greenland, R, Reimers, J & Bolam, B (2015), Salt reduction in Australia: from advocacy to action, Cardiovascular and Diagnostic Therapy, vol. 5, no. 3, pp. 207-18.
Targets and indicators for chronic disease prevention in Australia
Michelle Gooey and Mike Daube
Technical paper No. 2015-08
November 2015
6. Tobacco
Michelle Gooey and Mike Daube
This report has been produced as part of a project to tailor or develop chronic disease targets and indicators for Australia. This Working Group focused on tobacco use. The WHO targets/indicators and the Australian indicators relevant to tobacco are shown in Table 6.1:
TABLE 6.1: WHO tobacco target and indicators
Framework Element Target WHO Indicators Relevant Australian indicatorsBEHAVIOURAL RISK FACTORS
Tobacco A 30% relative reduction in prevalence of current tobacco use in persons aged 15+ years
• Adults: Age-standardisedprevalence of current tobaccouse among persons aged 18 yearsand over
• Adolescents: Prevalence ofcurrent tobacco use amongadolescents (10-19 year olds oraccording to country definition)
• Adults: prevalence of dailysmokers aged 14 years andolder
• Adolescents: daily smokingprevalence (in the sevendays prior to the survey)for adolescents aged 12 – 17years
6.1 Key findings
• Although smoking in Australia has decreased over recent decades, in 2013 12.8% of Australians continuedto smoke daily.
• Some disadvantaged groups have a substantially higher smoking prevalence than the general population.
• Determined and sustained action is required to ensure that smoking prevalence in both adults andchildren continues to decline and that the WHO target is met. Recommended policy actions include acomprehensive approach, with continuing increases in tobacco taxation to make tobacco products moreexpensive; strong, well-funded and sustained media campaigns; minimising exposure to passive smoking;targeted interventions for vulnerable groups; comprehensive tobacco product regulation; encouragement and support for smokers to quit; and continuing research contributing to a strong evidence base for action.
• Vigilance is required to ensure that potential obstacles and disrupters to the continued reduction ofsmoking are addressed.
• Data relating to tobacco use could be strengthened in Australia by improving their reliability in relation tovulnerable populations and increasing availability of indicators of government activity.
6.2 Introduction
Tobacco smoking is Australia’s leading preventable cause of death and disease (Begg et al, 2007), estimated to cause the deaths of over 15,000 Australians annually (Begg et al. 2007, Collins & Lapsley 2008). A recent report concluded that approximately two thirds of Australian smokers are likely to die as a result of their smoking (Banks et al. 2015). The total cost of smoking in Australia was estimated to be $31.5 billion in 2004–05 (Collins & Lapsley 2008).
Over recent decades, there has been a significant decline in the prevalence of smoking in Australia in both adults and children (Department of Health 2015). Contributors to this decline have included a series of tobacco control measures such as bans on tobacco advertising and promotion (including at point of sale), tobacco tax increases, strong public education/mass media programs, smoke-free measures, graphic health warnings and plain packaging, and continuing advocacy and mass media coverage of the harms of smoking. Australia is recognised as a world leader in tobacco control. It is important to recognise that this has occurred as a result of great commitment and
37
Targets and indicators for chronic disease prevention in Australia
Michelle Gooey and Mike Daube
Technical paper No. 2015-08
November 2015
38
collaborative approaches by many groups over many years.
However, it is not all positive news. Significant numbers of Australians continue to smoke: in 2013, 12.8% of Australians were estimated to smoke daily (AIHW, 2014). Of especial concern, considerable inequities in smoking prevalence are seen across the Australian population, with some disadvantaged populations having substantially higher smoking prevalence than the general population. For example, it is estimated that people with mental illness consume 42% of all cigarettes smoked in Australia (Access Economics 2007). ATSI people report a high prevalence of smoking, at 42% (ABS 2014). Other groups with relatively high rates of smoking include those who live in the most disadvantaged areas and those who live in remote/very remote areas (22.9% and 24.6% current smoker prevalence respectively) (AIHW 2014).
Australia has a vast array of high-quality data used to track trends in tobacco use (ANPHA 2013a). The following would further strengthen our ability to measure activity and tobacco use:
• more reliable data in vulnerable populations (such as those with mental illness);
• indicators of government activity across national and State/Territory governments and all agencies (i.e.not only Health); and
• ensuring there is an adequate baseline for judging progress – despite the amount of robust data available,it is not always available for use or accessible in a timely manner.
6.3 Relevance of WHO targets
The Working Group considers the WHO target to be relevant to Australia as a starting point. The target set by the National Tobacco Strategy (NTS) in 2012 is to reduce the national adult daily smoking rate to 10 per cent of the population by 2018 (Intergovernmental Committee on Drugs, 2012). This is more ambitious than the WHO target, and if achieved, the WHO target will also be comfortably achieved.
6.4 Proposed Australian target and indicators and feasibility
While strongly supporting the NTS target, for the purposes of this project the Tobacco Working Group has adopted the WHO target – that is, a 30% relative reduction in prevalence of current tobacco use in persons aged 18+ years between 2010 and 2025, with an adjustment: the population group to be used will be 14+ years. This population has been chosen because it is measured as part of the NDSHS, which is the leading survey of drug use in Australia and has been conducted every three years since 1995.
In 2010, the prevalence of daily smokers aged 14 years and older in Australia was 15.1% (AIHW 2014). A 30% relative reduction in tobacco use in 2025 equates to a prevalence of 10.6%. The Working Group believes that this target is achievable, particularly in the context of recent trends and the NTS target. Encouragingly, an analysis of recent daily smoking rates shows that Australia is currently on track to meet the WHO target of a 30% relative reduction in tobacco use in 2025, based on smoking prevalence rates for Australians aged 14 years and older (Figure 6.1) (AIHW 2014). Further, the most recent NDSHS showed that in 2013, the prevalence of daily smokers aged 14 years and older was 12.8% – a 15% relative reduction from 2010 (AIHW 2014).
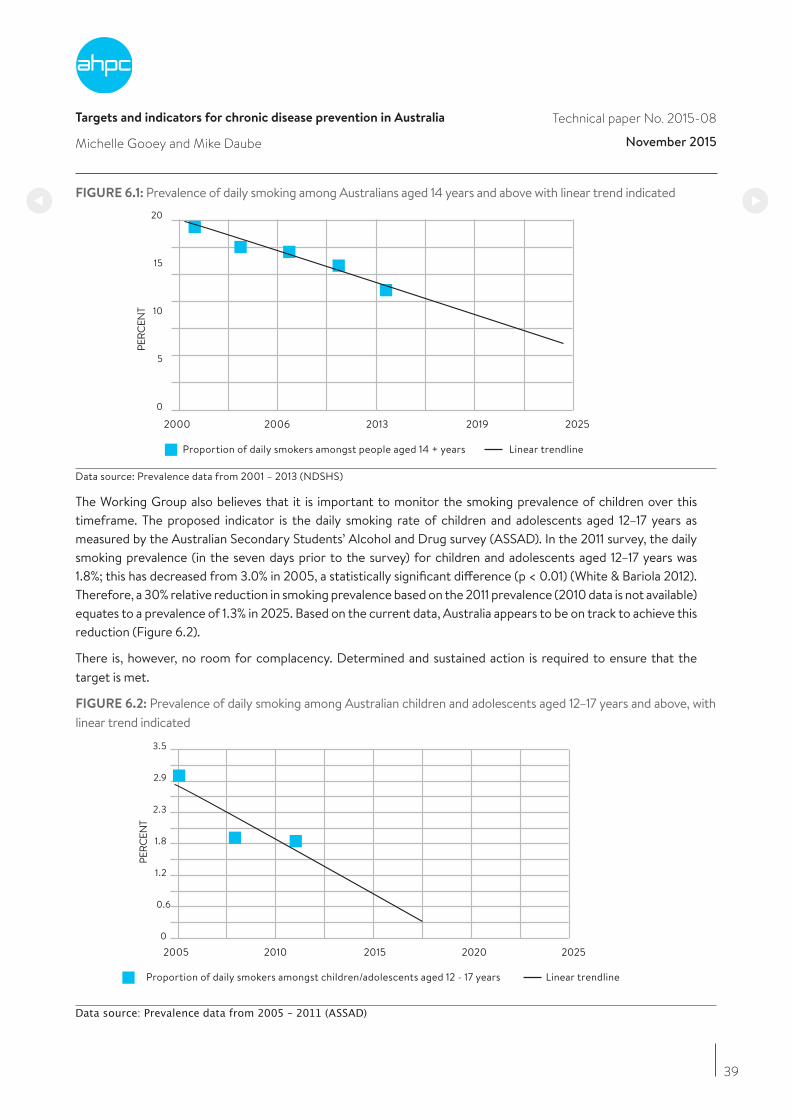
Targets and indicators for chronic disease prevention in Australia
Michelle Gooey and Mike Daube
Technical paper No. 2015-08
November 2015
39
FIGURE 6.1: Prevalence of daily smoking among Australians aged 14 years and above with linear trend indicated
2000
Proportion of daily smokers amongst people aged 14 + years Linear trendline
2006 2013 2019 2025
0
PERC
ENT
5
10
15
20
Data source: Prevalence data from 2001 – 2013 (NDSHS)
The Working Group also believes that it is important to monitor the smoking prevalence of children over this timeframe. The proposed indicator is the daily smoking rate of children and adolescents aged 12–17 years as measured by the Australian Secondary Students’ Alcohol and Drug survey (ASSAD). In the 2011 survey, the daily smoking prevalence (in the seven days prior to the survey) for children and adolescents aged 12–17 years was 1.8%; this has decreased from 3.0% in 2005, a statistically significant difference (p < 0.01) (White & Bariola 2012). Therefore, a 30% relative reduction in smoking prevalence based on the 2011 prevalence (2010 data is not available) equates to a prevalence of 1.3% in 2025. Based on the current data, Australia appears to be on track to achieve this reduction (Figure 6.2).
There is, however, no room for complacency. Determined and sustained action is required to ensure that the target is met.
FIGURE 6.2: Prevalence of daily smoking among Australian children and adolescents aged 12–17 years and above, with linear trend indicated
2005
Proportion of daily smokers amongst children/adolescents aged 12 - 17 years Linear trendline
2010 2015 2020 20250
PERC
ENT
0.6
1.2
1.8
2.3
2.9
3.5
Data source: Prevalence data from 2005 – 2011 (ASSAD)
Targets and indicators for chronic disease prevention in Australia
Michelle Gooey and Mike Daube
Technical paper No. 2015-08
November 2015
40
6.5 Discussion
The Tobacco Working Group endorses the overarching principles articulated within the National Tobacco Strategy (NTS) (Intergovernmental Committee on Drugs, 2012) and by the National Preventative Health Taskforce (NPHT) (National Preventative Health Taskforce 2009) for the continued reduction of tobacco use in Australia. These areas for action are consistent with the WHO MPOWER measures, which are designed to assist the effective implementation of tobacco control at a country level (WHO 2013a).
Both the NTS and the NPHT emphasise that certain populations – such as ATSI people, people with mental illnesses and people from low socioeconomic areas – are priority groups and will require attention and support to complement other measures in the recommended comprehensive approach. It is noted that a smoking reduction target has been recommended specifically for Australian adults with a mental illness (Expert Reference Group to COAG Working Group on Mental Health Reform 2013).
In 2012, taxes in Australia contributed 60.3% of the cost of a packet of the most sold brand of cigarettes, less than in many other countries including New Zealand (74.5%) and Ireland (79.0%) (WHO 2013b). Since 1 December 2013, there have been three scheduled 12.5% excise tax increases in Australia. The final planned increase is due to be implemented on 1 September 2016 (Department of Health, 2014). As noted recently by the Director-General of the WHO, “raising taxes on tobacco products is one of the most effective – and cost-effective – ways to reduce consumption of products that kill” (WHO 2015), highlighting the critical importance of price in reducing smoking, and reducing tobacco-related inequities (Hill et al. 2014, Hiscock et al. 2012, Thomas et al. 2008). The Working Group strongly advocates continuing increases in tobacco taxation to increase the cost of cigarettes in Australia.
The measures currently in place to regulate the contents of tobacco products and disclosure of ingredients (WHO 2014) are very limited in scope. Weaknesses in the current approach include controls on flavourings and additives used to make tobacco products more palatable and attractive to children and novice smokers, independent testing of tobacco product ingredients and clear and appropriate provision of information. Regulation on the contents of tobacco products should be fast-tracked and comprise a comprehensive suite of regulatory controls on product ingredients supported by an appropriate system for measuring, testing and reporting on the contents and emissions of tobacco products. The Working Group stressed that this should be done by government, without tobacco industry involvement, and with any public information coming from government, not tobacco companies.
The Working Group noted the value of continuing research in ensuring that future action to reduce smoking is evidence-based. They noted a recently developed tobacco research agenda (ANPHA 2013b), with scope for further work also including exploring the cost of pharmaceutical cessation aids compared to other methods for quitting.
The Working Group noted that there are important current and potential obstacles and disrupters to the continued reduction of smoking:
• The tobacco industry, associated lobbyists and supporters have been and will continue to be significant disrupters to tobacco control efforts, seeking to oppose and undermine any effective tobacco control measures and to promote both their own products and ineffective and counterproductive alternative approaches. On the basis of experience over time and recently, the industry can be expected to employ strategies including:
o lobbying and public relations activities;
o political donations;
o support for industry groups and private “think tanks”;
Targets and indicators for chronic disease prevention in Australia
Michelle Gooey and Mike Daube
Technical paper No. 2015-08
November 2015
41
o legal processes at state, national and international levels;
o false and misleading claims about possible negative impacts of tobacco control measures such as price or plain packaging; and
o price and product manipulation.
• End of the current specific commitment to tax excise increases.
• Insufficient government commitment to mass media activity despite compelling evidence of the importance of this component of the strategy (summarised by the NTS position that “mass media campaigns are highly effective components of tobacco control programs, second only to price increases”).
• It is vital to ensure a strong focus on reducing smoking among disadvantaged groups such as people with mental illness, ATSI people and people with low SES.
• Increasing concerns about tobacco industry involvement in and promotion of alternative nicotine delivery products, both to maintain and renormalise smoking behaviour, and to circumvent Article 5.3 of the Framework Convention on Tobacco Control (WHO 2003).
• A perception that tobacco has been “done” – when it remains the major preventable cause of death and disease globally (Dobbs et al. 2014).
Therefore, the Working Group strongly believes there must be a renewed sense of urgency around action on tobacco control across all governments, health departments and all other relevant government agencies, as well as among health organisations and the wider community.
6.6 Key data sources
Title Web reference
National Drug Strategy Household Survey (2013), Feb 2015 edition
http://www.aihw.gov.au/publication-detail/?id=60129549469
Australian secondary school students’ use of tobacco, alcohol, and over-the counter and illicit substances in 2011
http://www.nationaldrugstrategy.gov.au/internet/drugstrategy/Publishing.nsf/content/BCBF6B2C638E1202CA257ACD0020E35C/$File/National%20Report_FINAL_ASSAD_7.12.pdf
Tobacco Indicators Baseline Data: Reporting under the National Tobacco Strategy 2012-2018
http://www.aihw.gov.au/WorkArea/DownloadAsset.aspx?id=60129552719
References
Access Economics (2007), Smoking and mental illness: costs, Melbourne, Sane Australia, https://www.sane.org/images/PDFs/0712_info_smokecosts.pdfAustralian Bureau of Statistics (ABS) (2014), Australian Aboriginal and Torres Strait Islander Health Survey: Updated Results, 2012–13, cat. no. 4727.0.55.006, http://www.abs.gov.au/ausstats/[email protected]/Lookup/4727.0.55.006main+features12012-13Australian Institute of Health and Welfare (AIHW) (2014), National Drug Strategy Household Survey detailed report: 2013, Canberra, AIHW, drug statistics series no. 28, cat no. PHE 183.Australian National Preventive Health Agency (ANPHA), (2013a), Australia’s tobacco related datasets, Canberra, ANPHA, http://health.gov.au/internet/anpha/publishing.nsf/Content/tobacco-datasetsAustralian National Preventive Health Agency (ANPHA) (2013b), A priority-driven research agenda for tobacco control in Australia, https://health.gov.au/internet/anpha/publishing.nsf/Content/A27B1B3A44327688CA257B96000165E9/$File/Web%20resolution_a%20priority%20reasearch%20agency%20tobacco%20control.pdf
Targets and indicators for chronic disease prevention in Australia
Michelle Gooey and Mike Daube
Technical paper No. 2015-08
November 2015
42
Banks, E, Joshy, G, Weber, MF, Liu, B, Grenfell, R, Egger, S, Paige, E, Lopez, AD, Sitas, F & Beral, V (2015), Tobacco smoking and all-cause mortality in a large Australian cohort study: findings from a mature epidemic with current low smoking prevalence, BMC Medicine, vol. 13, no. 38, doi: 10.1186/s12916-015-0281-z.
Begg, S, Vos, T, Barker, B, Stevenson, C, Stanley, L & Lopez A (2007), The burden of disease and injury in Australia 2003, Canberra, AIHW.
Collins, D & Lapsley, H (2008), The cost of tobacco, alcohol and illicit drug abuse to Australian society in 2004/05, Department of Health and Ageing, Commonwealth of Australia.
Department of Health (2014), Taxation: the history of tobacco excise arrangements in Australia since 1901, http://www.health.gov.au/internet/main/publishing.nsf/content/tobacco-tax
Department of Health (2015), Tobacco key facts and figures, http://www.health.gov.au/internet/main/publishing.nsf/content/tobacco-kff.
Dobbs, R, Sawers, C, Thompson, F, Manyika, J, Woetzel, J, Child, P, McKenna S & Spatharou, A (2014), Overcoming obesity: An initial economic analysis, McKinsey Global Institute.
Expert Reference Group to COAG Working Group on Mental Health Reform (2013), Final Report: Expert Reference Group to COAG Working Group on Mental Health Reform on National Targets and Indicators for mental health reform, http://www.mentalhealthcommission.gov.au/media/80181/250913 - ERG final report to WGMHR.pdf
Hill, S, Amos, A, Clifford, D & Platt, S (2014), Impact of tobacco control interventions on socioeconomic inequalities in smoking: review of the evidence. Tobacco Control, vol. 23, e89–e97.
Hiscock, R, Bauld, L, Fidler, J & Munafo, M (2012), Socioeconomic status and smoking: a review, Annals of the New York Academy of Sciences, vol. 1248, pp. 107-23.
Intergovernmental Committee on Drugs (2012), National Tobacco Strategy 2012–2018, Canberra, Commonwealth of Australia.
National Preventative Health Taskforce (NPHT) (2009), Australia: The Healthiest Country by 2020 – National Preventative Health Strategy – the roadmap for action, Barton, Australian Capital Territory, NPHT.
Thomas, S, Fayter, D, Misso, K, Ogilvie, D, Petticrew, M, Sowden, A, Whitehead, M & Worthy, G (2008), Population tobacco control interventions and their effects on social inequalities in smoking: systematic review, Tobacco Control, vol. 17, no. 4, pp. 230–7, doi: 10.1136/tc.2007.023911
White, V & Bariola, E (2012), Australian secondary school students’ use of tobacco, alcohol, and over-the counter and illicit substances in 2011, Melbourne, Cancer Council Victoria.
World Health Organization (WHO) (2003), WHO Framework Convention on Tobacco Control, Geneva, WHO.
World Health Organization (WHO) (2013a), Tobacco Free Initiative (TFI): MPOWER, http://www.who.int/tobacco/mpower/en/
World Health Organization (WHO) (2013b), Tobacco taxes and prices, in WHO report on the global tobacco epidemic, 2013: enforcing bans on tobacco advertising, promotion and sponsorship, Geneva, WHO.
World Health Organization (WHO) (2014), Australian progress report on Implementation of the Framework Convention on Tobacco Control 2014, http://apps.who.int/fctc/implementation/database/sites/implementation/files/documents/reports/australia_2014_report_final.pdf.
World Health Organization (WHO) (2015), The economic and health benefits of tobacco taxation, Geneva, WHO, http://ash.org/wp-content/uploads/2015/07/WHO-Tobacco-Taxation-Report.pdf
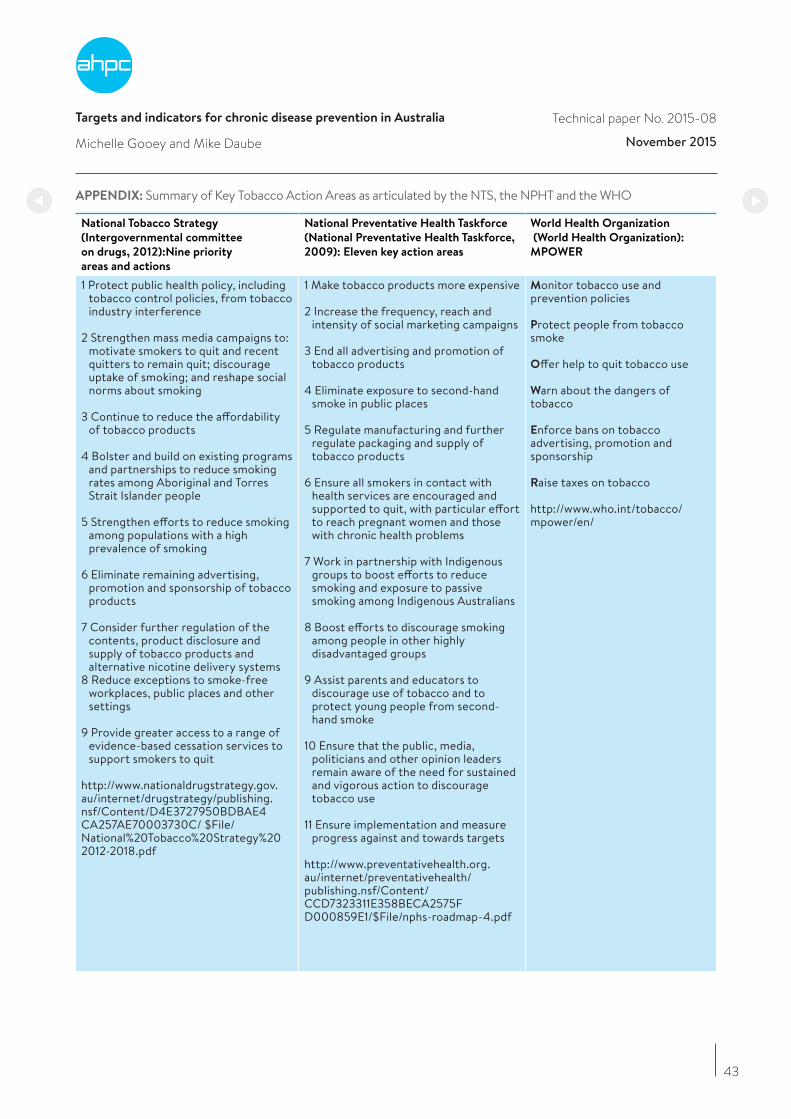
Targets and indicators for chronic disease prevention in Australia
Michelle Gooey and Mike Daube
Technical paper No. 2015-08
November 2015
43
APPENDIX: Summary of Key Tobacco Action Areas as articulated by the NTS, the NPHT and the WHO
National Tobacco Strategy
(Intergovernmental committee
on drugs, 2012):Nine priority
areas and actions
National Preventative Health Taskforce
(National Preventative Health Taskforce,
2009): Eleven key action areas
World Health Organization
(World Health Organization):
MPOWER
1 Protect public health policy, including tobacco control policies, from tobacco industry interference
2 Strengthen mass media campaigns to: motivate smokers to quit and recent quitters to remain quit; discourage uptake of smoking; and reshape social norms about smoking
3 Continue to reduce the affordability of tobacco products
4 Bolster and build on existing programs and partnerships to reduce smoking rates among Aboriginal and Torres Strait Islander people
5 Strengthen efforts to reduce smoking among populations with a high prevalence of smoking
6 Eliminate remaining advertising, promotion and sponsorship of tobacco products
7 Consider further regulation of the contents, product disclosure and supply of tobacco products and alternative nicotine delivery systems
8 Reduce exceptions to smoke-free workplaces, public places and other settings
9 Provide greater access to a range of evidence-based cessation services to support smokers to quit
http://www.nationaldrugstrategy.gov.au/internet/drugstrategy/publishing.nsf/Content/D4E3727950BDBAE4 CA257AE70003730C/ $File/National%20Tobacco%20Strategy%202012-2018.pdf
1 Make tobacco products more expensive
2 Increase the frequency, reach and intensity of social marketing campaigns
3 End all advertising and promotion of tobacco products
4 Eliminate exposure to second-hand smoke in public places
5 Regulate manufacturing and further regulate packaging and supply of tobacco products
6 Ensure all smokers in contact with health services are encouraged and supported to quit, with particular effort to reach pregnant women and those with chronic health problems
7 Work in partnership with Indigenous groups to boost efforts to reduce smoking and exposure to passive smoking among Indigenous Australians
8 Boost efforts to discourage smoking among people in other highly disadvantaged groups
9 Assist parents and educators to discourage use of tobacco and to protect young people from second-hand smoke
10 Ensure that the public, media, politicians and other opinion leaders remain aware of the need for sustained and vigorous action to discourage tobacco use
11 Ensure implementation and measure progress against and towards targets
http://www.preventativehealth.org.au/internet/preventativehealth/publishing.nsf/Content/ CCD7323311E358BECA2575F D000859E1/$File/nphs-roadmap-4.pdf
Monitor tobacco use and prevention policies
Protect people from tobacco smoke
Offer help to quit tobacco use
Warn about the dangers of tobacco
Enforce bans on tobacco advertising, promotion and sponsorship
Raise taxes on tobacco
http://www.who.int/tobacco/mpower/en/
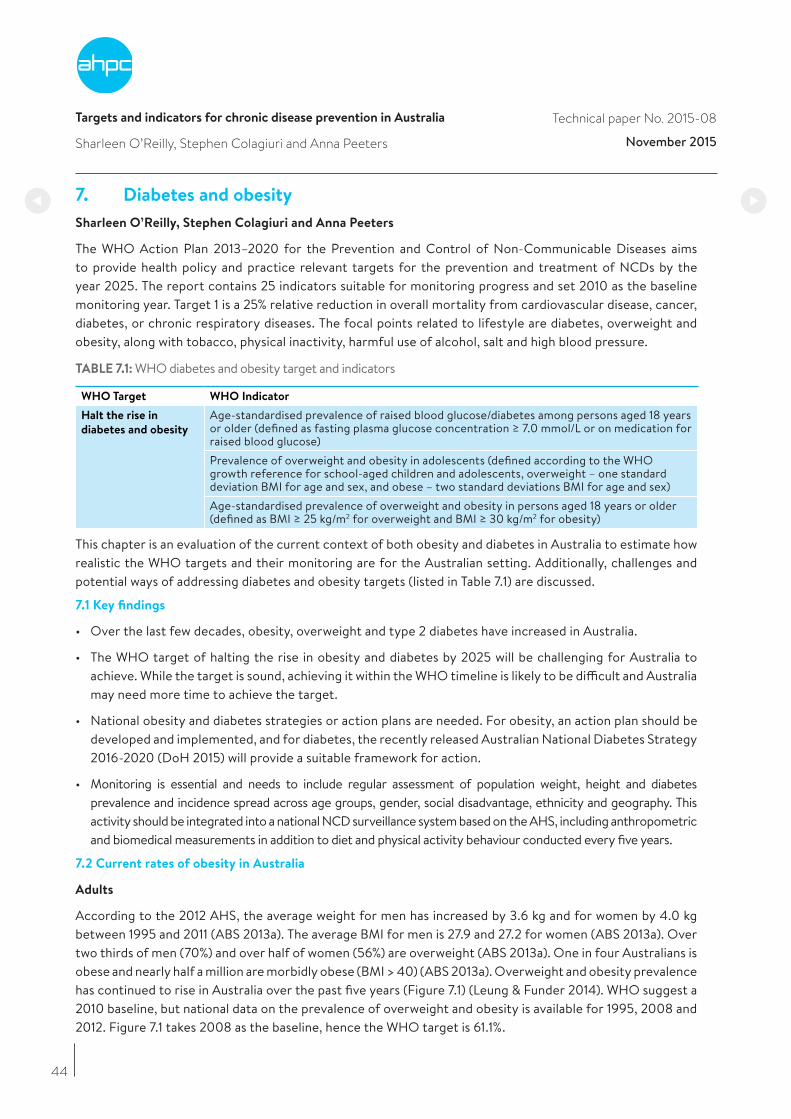
Targets and indicators for chronic disease prevention in Australia
Sharleen O’Reilly, Stephen Colagiuri and Anna Peeters
Technical paper No. 2015-08
November 2015
7. Diabetes and obesity
Sharleen O’Reilly, Stephen Colagiuri and Anna Peeters
The WHO Action Plan 2013–2020 for the Prevention and Control of Non-Communicable Diseases aims to provide health policy and practice relevant targets for the prevention and treatment of NCDs by the year 2025. The report contains 25 indicators suitable for monitoring progress and set 2010 as the baseline monitoring year. Target 1 is a 25% relative reduction in overall mortality from cardiovascular disease, cancer, diabetes, or chronic respiratory diseases. The focal points related to lifestyle are diabetes, overweight and obesity, along with tobacco, physical inactivity, harmful use of alcohol, salt and high blood pressure.
TABLE 7.1: WHO diabetes and obesity target and indicators
WHO Target WHO Indicator
Halt the rise in
diabetes and obesity
Age-standardised prevalence of raised blood glucose/diabetes among persons aged 18 years or older (defined as fasting plasma glucose concentration ≥ 7.0 mmol/L or on medication for raised blood glucose)Prevalence of overweight and obesity in adolescents (defined according to the WHO growth reference for school-aged children and adolescents, overweight – one standard deviation BMI for age and sex, and obese – two standard deviations BMI for age and sex)Age-standardised prevalence of overweight and obesity in persons aged 18 years or older (defined as BMI ≥ 25 kg/m2 for overweight and BMI ≥ 30 kg/m2 for obesity)
This chapter is an evaluation of the current context of both obesity and diabetes in Australia to estimate how realistic the WHO targets and their monitoring are for the Australian setting. Additionally, challenges and potential ways of addressing diabetes and obesity targets (listed in Table 7.1) are discussed.
7.1 Key findings
• Over the last few decades, obesity, overweight and type 2 diabetes have increased in Australia.
• The WHO target of halting the rise in obesity and diabetes by 2025 will be challenging for Australia to achieve. While the target is sound, achieving it within the WHO timeline is likely to be difficult and Australia may need more time to achieve the target.
• National obesity and diabetes strategies or action plans are needed. For obesity, an action plan should be developed and implemented, and for diabetes, the recently released Australian National Diabetes Strategy 2016-2020 (DoH 2015) will provide a suitable framework for action.
• Monitoring is essential and needs to include regular assessment of population weight, height and diabetes prevalence and incidence spread across age groups, gender, social disadvantage, ethnicity and geography. This activity should be integrated into a national NCD surveillance system based on the AHS, including anthropometric and biomedical measurements in addition to diet and physical activity behaviour conducted every five years.
7.2 Current rates of obesity in Australia
Adults
According to the 2012 AHS, the average weight for men has increased by 3.6 kg and for women by 4.0 kg between 1995 and 2011 (ABS 2013a). The average BMI for men is 27.9 and 27.2 for women (ABS 2013a). Over two thirds of men (70%) and over half of women (56%) are overweight (ABS 2013a). One in four Australians is obese and nearly half a million are morbidly obese (BMI > 40) (ABS 2013a). Overweight and obesity prevalence has continued to rise in Australia over the past five years (Figure 7.1) (Leung & Funder 2014). WHO suggest a 2010 baseline, but national data on the prevalence of overweight and obesity is available for 1995, 2008 and 2012. Figure 7.1 takes 2008 as the baseline, hence the WHO target is 61.1%.
44
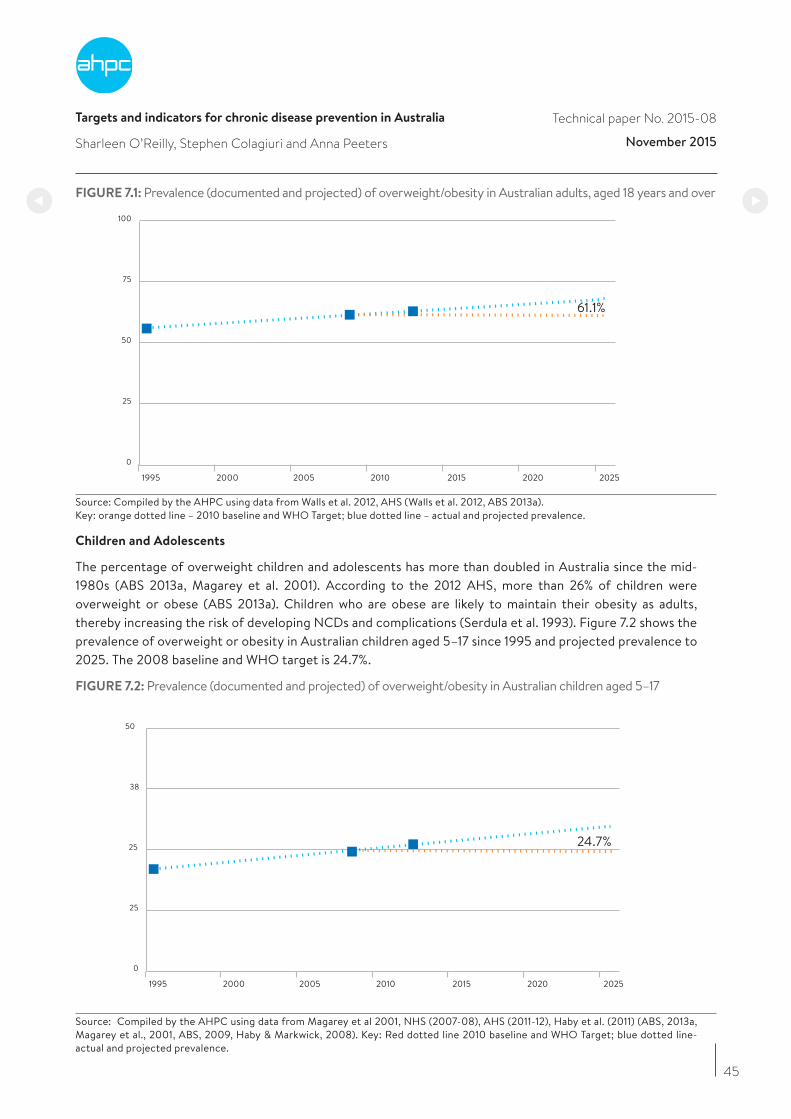
Targets and indicators for chronic disease prevention in Australia
Sharleen O’Reilly, Stephen Colagiuri and Anna Peeters
Technical paper No. 2015-08
November 2015
FIGURE 7.1: Prevalence (documented and projected) of overweight/obesity in Australian adults, aged 18 years and over
1995 2000 2010 2015 2020 2025
0
25
50
75
100
2005
Source: Compiled by the AHPC using data from Walls et al. 2012, AHS (Walls et al. 2012, ABS 2013a). Key: orange dotted line – 2010 baseline and WHO Target; blue dotted line – actual and projected prevalence.
Children and Adolescents
The percentage of overweight children and adolescents has more than doubled in Australia since the mid-1980s (ABS 2013a, Magarey et al. 2001). According to the 2012 AHS, more than 26% of children were overweight or obese (ABS 2013a). Children who are obese are likely to maintain their obesity as adults, thereby increasing the risk of developing NCDs and complications (Serdula et al. 1993). Figure 7.2 shows the prevalence of overweight or obesity in Australian children aged 5–17 since 1995 and projected prevalence to 2025. The 2008 baseline and WHO target is 24.7%.
FIGURE 7.2: Prevalence (documented and projected) of overweight/obesity in Australian children aged 5–17
1995 2000 2010 2015 2020 2025
0
25
25
38
50
2005
Source: Compiled by the AHPC using data from Magarey et al 2001, NHS (2007-08), AHS (2011-12), Haby et al. (2011) (ABS, 2013a, Magarey et al., 2001, ABS, 2009, Haby & Markwick, 2008). Key: Red dotted line 2010 baseline and WHO Target; blue dotted line- actual and projected prevalence.
45
61.1%
24.7%

Targets and indicators for chronic disease prevention in Australia
Sharleen O’Reilly, Stephen Colagiuri and Anna Peeters
Technical paper No. 2015-08
November 2015
7.3 Prevalence of diabetes
Diabetes results in premature mortality and a range of complications including heart disease, stroke, chronic kidney disease, vision loss and amputations (Stratton et al. 2000). The risk of type 2 diabetes increases with increasing weight, even within the normal BMI range, but the greatest increase is seen in obese individuals (Flegal et al. 2012, Ogden et al. 2007).
The prevalence of measured raised blood glucose/diabetes among adults aged 18+ in Australia was 4.8% in 2010 (compiled by the AHPC using AHS data (ABS 2013a)), and is therefore the 2025 WHO Target for diabetes prevalence.
Figure 7.3 shows the prevalence of self-reported diabetes in Australians aged 18 years and over between 2001 and 2011–12 and projected to 2023–24. Self-reported estimates may underestimate prevalence, as some people may not be aware they have diabetes (AIHW 2014).
7.4 Equity of risk
High levels of disparity exist for both obesity and diabetes when prevalence is examined by SES, location, and ethnicity (ABS 2013a, ABS 2013b). Australians living in rural and remote areas have higher rates of overweight/obesity (69% and 70% respectively) than urban Australians (60%) (ABS 2013a). Australians at greatest disadvantage as measured by SES are almost twice as likely to be obese (23%) as those at least disadvantage (13%) (ABS 2009). On the basis of 2012–13 NATSIHS information, two-thirds (66%) of ATSI adults were overweight or obese and they were three times as likely as non-Indigenous people to have diabetes/high sugar levels (ABS 2014b). Figure 7.3 shows the prevalence of self-reported diabetes in Australians aged 18 years and over between 2001 and 2011–12 and projected to 2023–24.
FIGURE 7.3: Prevalence of self-reported diabetes, age 18 years and over
2.9
4.2
5.2
6.7
8.0
2001 2004-05 2007-08 2011=12 2014-15 2017-18 2021-22 2023-24
Source: Compiled by the AHPC using data from ABS (NHS and AHS) (ABS 2013a, AIHW 2011a). Key: Blue dotted line, actual self-report and projected prevalence.
46
Targets and indicators for chronic disease prevention in Australia
Sharleen O’Reilly, Stephen Colagiuri and Anna Peeters
Technical paper No. 2015-08
November 2015
7.5 Proposed Australian targets and indicators and their assessment
Target Indicators Data needed to track progress
Halt the rise in obesity • Age-standardised prevalence of normal weight, overweight and obesity class I, II, III in persons 18 years or older
• Regular national measurement of children and adults through the AHS with data collection at five-year intervals (or more often)
• Prevalence of normal weight, overweight and obesity in children and adolescents
• Use cut-points for childhood growth curves as specified by both WHO and IOTF
• Age-standardised proportion of total energy intake from discretionary foods in persons aged 18 years or older and in children and adolescents (2–17 years)
• National Nutrition and Physical Activity Survey (AHS) measured regularly at five-year intervals. Use ABS-defined list of discretionary foods
• Prevalence of breastfeeding and exclusive breastfeeding
• National Infant Feeding Survey with ongoing data collection at regular five-year intervals
Halt the rise in new
diabetes
• Age-standardised incidence and prevalence of diabetes in persons 25-65yrs
• The AHS, with data collection at five-year intervals or more often. The National Diabetes Service Scheme could also provide suitable information with improved data quality
Note: the targets include stabilisation of obesity and diabetes rates both for the total population and for selected socio-demographic groups. Incidence of diabetes is not confirmed as currently available.
7.6 Policy initiatives to address obesity and diabetes rates in Australians
The 2012 National Healthcare Agreement included performance benchmarks for reducing the age-adjusted prevalence rate for type 2 diabetes to 2000 levels (equivalent to a national prevalence of 7.1%) by 2023 and for increasing by five percentage points (over the 2009 baseline) by 2018 the proportion of Australian adults and Australian children at a healthy body weight. These benchmarks are due for review, and in the meantime the Australian Government is a signatory to the WHO targets.
The Australian National Diabetes Strategy 2016–2020 was recently released (DoH 2015). Currently there is no clear policy framework for ongoing action on obesity, but in 2014 a collaborative process commenced to develop a national consensus statement on obesity prevention policies in Australia. The intention is to support a common agenda and to engage the Federal government to increase action on obesity prevention.
7.7 Discussion
The key population-based strategy to halt the rise in obesity and diabetes is preventing weight gain in adults and unhealthy weight gain in children. This requires action over a variety of policy areas (summarised in the Appendix). The target for diabetes and obesity will be very challenging for Australia to achieve, but is a worthwhile goal that will have significant population health benefits. The WHO timeline of 2025 is ambitious. Monitoring is essential to this endeavour; reporting will not be possible without an ongoing commitment for a nationally representative data collection occurring at least every five years. Similarly, reporting standards need to be agreed to ensure relevant data results from these collections.
47
Targets and indicators for chronic disease prevention in Australia
Sharleen O’Reilly, Stephen Colagiuri and Anna Peeters
Technical paper No. 2015-08
November 2015
48
References
Australian Bureau of Statistics (ABS) (2009), National Health Survey: Summary of results, 2007–2008, Canberra, ABS.
Australian Bureau of Statistics (ABS) (2013a), Australian Health Survey: Updated Results 2011–2012, Canberra, ABS.
Australian Bureau of Statistics (ABS) (2013b), Profiles of Health, Australia, 2011–13, Canberra, ABS.
Australian Bureau of Statistics (ABS) (2014), Australian Aboriginal and Torres Strait Islander Health Survey: First Results, Australia, 2012–13, Canberra, ABS.
Australian Institute of Health and Welfare (AIHW) (2011a), Diabetes prevalence in Australia: detailed estimates for 2007–08, Canberra, AIHW.
Australian Institute of Health and Welfare AIHW (2011b), 2010 Australian National Infant Feeding Survey: indicator results, Canberra, AIHW.
Australian Institute of Health and Welfare (AIHW) (2014), Cardiovascular disease, diabetes and chronic kidney disease – Australian facts: Prevalence and incidence, Cardiovascular, diabetes and chronic kidney disease series no. 2, cat. no. CDK 2, Canberra, AIHW.
Department of Health (DoH) (2015), The Australian National Diabetes Strategy 2016–2020, Canberra, Commonwealth of Australia, http://www.health.gov.au/internet/main/publishing.nsf/Content/nds-2016-2020
Flegal, K, Carroll, MD, Kit, BK & Ogden, CL (2012), Prevalence of obesity and trends in the distribution of body mass index among US adults, 1999–2010. Journal of the American Medical Association, vol. 307, no. 5, pp. 491–497.
Haby, M & Markwick, A (2008), Future prevalence of overweight and obesity in Australian children and adolescents, 2005–2025, Melbourne, Department of Human Services.
Leung, J & Funder, J (2014), Obesity: a national epidemic and its impact on Australia, in J. Funder (Ed.), No Time to Weight, Sydney, Obesity Australia.
Magarey, AM, Daniels, LA & Boulton, TJC (2001), Prevalence of overweight and obesity in Australian children and adolescents: reassessment of 1985 and 1995 data against new standard international definitions, Medical Journal of Australia, vol. 174, no. 11, pp. 561-564.
National Diabetes Strategy Advisory Group (2015), A strategic framework for action: Consultation paper for the development of the Australian National Diabetes Strategy, Canberra, Department of Health.
Ogden, CL, Yanovski, SZ, Carroll, MD & Flegal, KM (2007), The epidemiology of obesity. Gastroenterology, vol. 132, no. 6, pp. 2087-102.
Serdula, MK, Ivery, D, Coates, RJ, Freedman, DS, Williamson, DF & Byers, T (1993), Do obese children become obese adults? A review of the literature, Preventive Medicine, vol. 22, no. 2, pp. 167-77.
Stratton, IM, Adler, AI, Neil, HA, Matthews, DR, Manley, SE, Cull, CA, Hadden, D, Turner, RC & Holman, RR (2000), Association of glycaemia with macrovascular and microvascular complications of type 2 diabetes (UKPDS 35): prospective observational study, British Medical Journal, vol. 321, no. 7258, pp. 405-412.
Walls, HL, Magliano, DJ, Stevenson, CE, Backholer, K, Mannan, HR, Shaw, JE & Peeters, A (2012), Projected progression of the prevalence of obesity in Australia, Obesity, vol. 20, no. 4, pp. 872-878.
Targets and indicators for chronic disease prevention in Australia
Sharleen O’Reilly, Stephen Colagiuri and Anna Peeters
Technical paper No. 2015-08
November 2015
49
APPENDIX: The Roadmap for Action: Obesity in Australia – A need for urgent action, in Australia: the healthiest country by 2020, National Preventative Health Taskforce (2009)
• Key action area 1: Drive environmental changes throughout the community that increase levels of physicalactivity and reduce sedentary behaviour.
• Key action area 2: Drive change within the food supply to increase the availability and demand for healthier food products, and decrease the availability and demand for unhealthy food products.
• Key action area 3: Embed physical activity and healthy eating in everyday life.
• Key action area 4: Encourage people to improve their levels of physical activity and healthy eating throughcomprehensive and effective social marketing.
• Key action area 5: Reduce exposure of children and others to marketing, advertising, promotion andsponsorship of energy-dense nutrient-poor foods and beverages.
• Key action area 6: Strengthen, skill and support primary healthcare and public health workforce to supportpeople in making healthy choices.
• Key action area 7: Address maternal and child health, enhancing early life and growth patterns.
• Key action area 8: Support low-income communities to improve their levels of physical activity and healthy eating.
• Key action area 9: Reduce obesity prevalence and burden among Indigenous Australians.
• Key action area 10: Build the evidence base, monitor and evaluate effectiveness of actions.
Additional action areas for diabetes
• Reduce the prevalence of modifiable risk factors in the general population.
• Identify and provide prevention programmes to people with pre-diabetes.
• Enhance early life and growth patterns through maternal, family and child health.
Infrastructure needed to support policy action
• Establish a National Preventive Health Agency.
• Create a web-based clearing house for organisational plans and achievements and conduct periodicsurveys of barriers and enablers to action.
• Establish a national report card, recognition and awards scheme.
• Undertake a workforce audit and develop a workforce strategy.
• Establish prevention as a priority for the Health Workforce Australia Agency.
• Implement and extend the National Health Risk Survey program.
• Develop a National Strategic Framework for preventive health research supported by a strategic researchfund, research register, and network of research centres.

Targets and indicators for chronic disease prevention in Australia
Sharleen O’Reilly, Stephen Colagiuri and Anna Peeters
Technical paper No. 2015-08
November 2015
50
Additional details for indicators
Prevalence of overweight and obesity in children and adolescents
The focus for this sub-group of the population will be on “halting unhealthy weight gain”, not halting the rise in weight as weight gain is appropriate for growing children.
Age-standardised proportion of total energy intake from discretionary foods
Age-specific targets for reduction in discretionary food intake would be calculated by taking the recommended maximum serves of discretionary foods for each age group and gender set out in the Australian Dietary Guidelines and multiplying this by 600kJ (maximum defined energy content of one serve of discretionary foods) and dividing this by the age and gender specific estimated energy requirement set out in the Nutrient Reference Values for Australians. This will provide the maximum proportion of energy from discretionary foods in the diet recommended by the Australian Dietary Guidelines. (Source: https://www.nhmrc.gov.au/_files_nhmrc/publications/attachments/n55a_australian_dietary_guidelines_summary_131014.pdf, page 41.)
Nationally agreed indicators for breastfeeding
For the detailed questions used to acquire the data for the indicator “Prevalence of breastfeeding and exclusive breastfeeding using nationally agreed indicator questions”, see AIHW (2011b). These questions have been used nationally to measure breastfeeding rates and are suitable for ongoing monitoring of breastfeeding practices.
Targets and indicators for chronic disease prevention in Australia
Penny Tolhurst and Philip Batterham
Technical paper No. 2015-08
November 2015
51
8. Mental Health
Penny Tolhurst and Philip Batterham
This chapter has been produced as part of a project to tailor or develop chronic disease targets and indicators for Australia. The WHO target and indicators relevant to mental health are from the WHO Global Mental Health Action Plan 2013–2020 (WHO 2013), which contains six global targets and indicators (see Appendix). The two that were considered most relevant, service coverage and suicide rate, are in the table below.
TABLE 8.1: Selected WHO mental health targets and indicators
Target Indicator Means of verification
Service coverage for severe mental disorders will have increased by 20% (by the year 2020)
Proportion of persons with a severe mental disorder [psychosis; bipolar affective disorder; moderate-severe depression] who are using services [%]
Numerator: Cases of severe mental disorder in receipt of services, derived from routine information systems or, if unavailable, a baseline and follow-up survey of health facilities in one or more defined geographical areas of a countryDenominator: Total cases of severe mental disorder in the sampled population, derived from national surveys or, if unavailable, subregional global prevalence estimates
The rate of suicide in countries will be reduced by 10% (by the year 2020)
Number of suicide deaths per year per 100,000 population
Routine annual registration of deaths due to suicide (baseline year: 2012 or 2013)
8.1 Key findings
• Mental illness and suicide are significant public health concerns. The 2007 National Survey of Mental Health and Wellbeing (NSMHWB) estimated that 20% of the adult population (3.2 million people) had experienced a common mental disorder in the previous 12 months (ABS 2008). Over the five-year period from 2009–2013, the average number of suicide deaths per year was 2,461.
• The WHO target of a 10% reduction in the suicide rate by 2020 is achievable in Australia if a systemic approach to suicide prevention is implemented.
• Service coverage is a less relevant measure of population mental health in Australia than measures of social inclusion. Measures of social inclusion such as rates of employment of people with mental illness reflect an area of importance to consumers, families, and society. Measures of the physical health of people with mental illness are also important due to disparities in physical health outcomes.
• Health surveillance in relation to mental health is continuing to develop, as are performance indicators. The Fourth National Mental Health Plan Measurement Strategy (NMHPMS 2011) identified a set of indicators to monitor progress, but not all indicators have data sources or agreed targets. Continuing this work is essential to better focus prevention and improvement efforts. The further development of employment and education indicators relating to state and territory mental health consumers is supported, as is development of national data on self-harm (including people treated but not admitted).
• A systems approach to suicide prevention should be implemented and evaluated, and if successful rolled out more broadly.
• Evidence-based approaches to supporting people with mental illness to obtain and sustain employment or educational opportunities should be further implemented and evaluated, and the evidence base should be further developed.
• Promising approaches to reducing smoking rates among people with mental illness should be further investigated, implemented and evaluated.
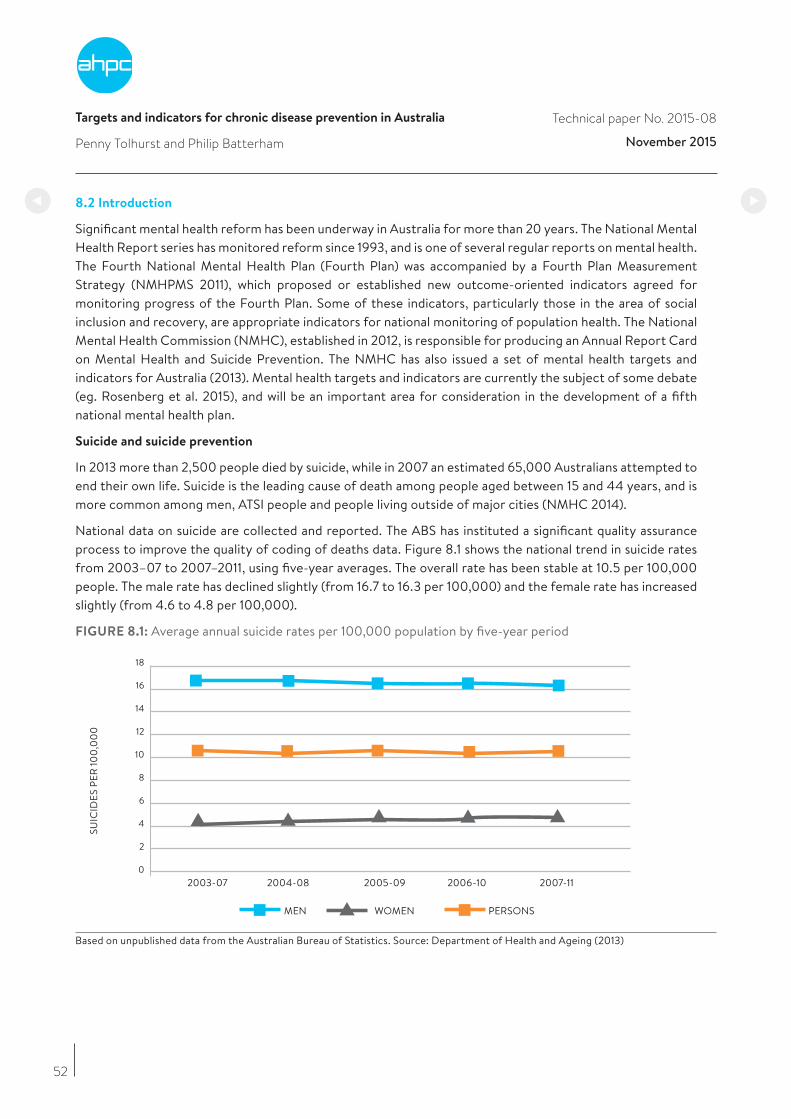
Targets and indicators for chronic disease prevention in Australia
Penny Tolhurst and Philip Batterham
Technical paper No. 2015-08
November 2015
52
8.2 Introduction
Significant mental health reform has been underway in Australia for more than 20 years. The National Mental Health Report series has monitored reform since 1993, and is one of several regular reports on mental health. The Fourth National Mental Health Plan (Fourth Plan) was accompanied by a Fourth Plan Measurement Strategy (NMHPMS 2011), which proposed or established new outcome-oriented indicators agreed for monitoring progress of the Fourth Plan. Some of these indicators, particularly those in the area of social inclusion and recovery, are appropriate indicators for national monitoring of population health. The National Mental Health Commission (NMHC), established in 2012, is responsible for producing an Annual Report Card on Mental Health and Suicide Prevention. The NMHC has also issued a set of mental health targets and indicators for Australia (2013). Mental health targets and indicators are currently the subject of some debate (eg. Rosenberg et al. 2015), and will be an important area for consideration in the development of a fifth national mental health plan.
Suicide and suicide prevention
In 2013 more than 2,500 people died by suicide, while in 2007 an estimated 65,000 Australians attempted to end their own life. Suicide is the leading cause of death among people aged between 15 and 44 years, and is more common among men, ATSI people and people living outside of major cities (NMHC 2014).
National data on suicide are collected and reported. The ABS has instituted a significant quality assurance process to improve the quality of coding of deaths data. Figure 8.1 shows the national trend in suicide rates from 2003–07 to 2007–2011, using five-year averages. The overall rate has been stable at 10.5 per 100,000 people. The male rate has declined slightly (from 16.7 to 16.3 per 100,000) and the female rate has increased slightly (from 4.6 to 4.8 per 100,000).
FIGURE 8.1: Average annual suicide rates per 100,000 population by five-year period
2003-07 2004-08 2006-10
SUIC
IDES
PER
100,
00
0
2005-09 2007-11
MEN WOMEN PERSONS
0
2
4
6
8
10
12
14
16
18
Based on unpublished data from the Australian Bureau of Statistics. Source: Department of Health and Ageing (2013)
Targets and indicators for chronic disease prevention in Australia
Penny Tolhurst and Philip Batterham
Technical paper No. 2015-08
November 2015
53
Although self-harm prevalence or incidence would also be an important indicator of population mental health, national data on self-harm are limited, and complicated by the need to potentially link repeat episodes to a single individual. Where harm results in a hospital admission, data are available on a state-by-state basis, but if a person presents to hospital with self-harm but is not admitted, national data are not currently available. Several reports have discussed problems with statistics for suicide and self-harm, and expressed concern that the data are affected by errors, perhaps more than most other causes, due to difficulty in ascertaining the true motivation for actions and the effects of social stigma (AIHW 2014). People may choose not to disclose that their injuries resulted from intentional self-harm, or may be unable to do so because of the nature of their injuries or because their motives were unclear. In children these issues can be even more difficult to assess.
Surveillance of population mental health
Surveillance is crucial for mental health, as it is the foundation for well-informed, evidence-based decision making on mental illness policy, service provision and prevention. The NSMHWB, conducted during 1997 and 1998, provided the first comprehensive source of information on the distribution and type of mental health problems in the Australian population. The NSMHWB was repeated in 2007. The NHS includes a mental health component, and specialised national psychosis surveys were carried out first in 1997/8 and again in 2010 (the Survey of High Impact Psychosis).
An ongoing commitment to mental health surveillance in Australia is essential. Regular surveillance is needed to assess changes over time, and provide current information about mental health needs and service utilisation in the community that can inform future policy and planning. Refinements in surveying methodology are also needed to identify common risk factors that may act as determinants of mental health and wellbeing (DoHA 2005).
Performance indicators established in the Fourth Plan Measurement Strategy were an important step in measuring and reporting performance in health and other relevant portfolios. Information on education and employment participation, for example, are important in assessing social inclusion and recovery. Further development of these indicators, and related data sources and targets will provide information that can support better outcomes for people with mental illness.
Service coverage
Population coverage by mental health services is a challenge for governments, and measuring coverage is difficult. Most Australians who meet diagnostic criteria for mental illness do not experience a need for professional assistance of any kind (DoHA 2013). States and territories focus on delivering services to people with severe mental illness. The percentage of people seen by state and territory mental health services has remained relatively stable, fluctuating between 1.5 and 1.6% over the period 2006-07 to 2010-2011 (DoHA 2013). During this period there was significant growth in the number of people seen by Medicare-funded mental health services (a rise from 3.1% of the population to 6.9% in 2010–2011). The population treatment rate for mental disorders in Australia is estimated to have increased from 37% in 2006–07 to 46% in 2009–10, a remarkable increase by international standards (Whiteford et al. 2014). If Medicare Benefits Schedule settings remain unchanged, the treatment rate is expected to continue to rise, but as Whiteford et al. noted, increased access to services is not sufficient to ensure good outcomes for those with mental disorders.
Quality of service could be a more appropriate indicator than service coverage, but there are few national data sources available that adequately assess quality of care. Such an indicator may require patient-reported outcomes, which are not feasible to implement nationally at present. Indicators such as restraint and seclusion rates may be too simplistic to adequately indicate quality, and adequate measurement of such outcomes is subject to limitations such as the context and data source.
Targets and indicators for chronic disease prevention in Australia
Penny Tolhurst and Philip Batterham
Technical paper No. 2015-08
November 2015
54
8.3 Relevance of WHO targets
The National Mental Health Report 2013 posits that suicides are the starkest indicator of the mental health of a nation. In Australia, suicide is the 14th leading cause of death overall, but is the leading cause of death for people aged 15–44. The national suicide rate is a relevant and appropriate indicator of population health.
Service coverage is less relevant, as measurement is difficult, and many Australians do not feel they need professional assistance for mental health issues. Measures of social inclusion, such as employment and education participation rates, better reflect outcomes for people with mental illness and are more feasible to collect regularly through the NHS. The Fourth Plan Measurement Strategy notes that a range of evidence highlights that people with mental illness are over-represented in national unemployment statistics, and that untreated mental illness is a major contributor to lost economic productivity. Similarly for adolescents and young people, the onset of mental illness can disrupt education, and the transition from school to work. The Fourth Plan Measurement Strategy proposes additional complementary measures of participation in employment and education:
• proportion of state and territory mental health consumers aged 16–64 years who are employed (as defined by standard ABS definition); and
• proportion of state and territory mental health consumers aged 16–30 years who are employed (as defined by standard ABS definition) and/or are enrolled for study in a formal secondary or tertiary qualification.
These additional measures would provide a way to monitor the social inclusion of people with severe and persistent mental illness, for whom education and employment related outcomes are often compromised. In Australia, the proportion of people with schizophrenia and employed based on studies in 1998 and 2003 were 19% and 16% respectively (Waghorn et al. 2012). In contrast, the employment rates for healthy working age Australians in 1998 and 2003 were 74% and 77% (Waghorn et al. 2012).
The WHO targets do not encompass the physical health of people with mental illness, although people with mental illness often experience poor physical health. Consistent with international findings (eg. WHO 2014, Osborn et al. 2007), a Western Australian study has shown the substantial impact of mental illness on life expectancy in that state (Lawrence et al. 2013). Mental illness was found to be associated with large increased risks of morbidity and mortality, and almost 80% of excess deaths were associated with physical health conditions, particularly heart disease, respiratory disease and cancer.
Targeting the life expectancy gap for people with mental illness is a worthwhile goal, and occurs in countries such as the United Kingdom (Department of Health (UK) 2013). In Australia, however, there is no ongoing data collection to facilitate accurate and timely measurement of this gap. A more feasible, measurable target is a reduction in the smoking rate for people with mental illness. Smoking rates are significantly higher among people with a mental illness, particularly among those with a serious mental illness (Scollo & Winstanley 2015). Smoking is a major determinant of physical health inequality in this population, and is partially responsible for increased mortality of people with serious mental illness. Data on both smoking and self-reported mental illness are routinely collected in the NHS, enabling verification of change in this indicator.
8.4 Proposed Australian target and indicators and feasibility
The Working Group proposes Australian Chronic Disease Targets and Indicators for mental health as shown in the following table.
Targets and indicators for chronic disease prevention in Australia
Penny Tolhurst and Philip Batterham
Technical paper No. 2015-08
November 2015
TABLE 8.2: Proposed Australian mental health targets and indicators
Target Indicators Means of verification Comment
Avoidable harm
1 Reduction in the national suicide rate by 10% by 2020
Number of suicide deaths per year per 100,000 population (WHO). The suicide rate as an age-standardised rate per 100,000 population (NMHC)
Routine annual registration of deaths due to suicide. National data is collected and reported
The suggested WHO baseline year is 2012 or 2013. The suicide rate was 10.9 per 100,000 for 2013. From this baseline, the target would be 9.8 per 100,000 (reflecting ~265 fewer deaths based on current population)
Social inclusion and recovery
2 Improve employment rates of people aged 16–64 with mental illness, halving the employment gap by 2025
Participation rates by people with mental illness of working age in employment: general population
Reported in the most recent National Mental Health Report.Data source is the NHS
The Fourth Plan definition of ‘working age’ is ‘proportion of population aged 16–64 years with mental illness who are employed (as defined by standard ABS definition)’
In 2011–12, 62% of working age Australians with a self-reported mental illness were employed, vs 80% of those without a mental illness. Significant variation across states (DoHA 2013)
3 Improve participation rates of young people with mental illness in education and employment, halving the participation gap by 2025
Participation rates by young people aged 16–30 with mental illness in education and employment: general population
Data source is the NHS. Reported in the most recent National Mental Health Report
In 2011–12, 79% of Australians aged 16–30 years with a mental illness were employed and/or enrolled in study towards a formal secondary or tertiary qualification, vs 90% of their same-age peers (DoHA 2013)
Physical health of people with poor mental health4 Reducing smoking rates
of adults over 18 years with a mental illness by 30% by 2020 and by 60% by 2025
The proportion of the population with mental illness who report being smokers compared with the smoking rates for the population without mental illness (NMHC)
NHS In 2004/5, 32% of adults who reported a mental/ behavioural problem were daily smokers, vs 21% of all adults (ABS 2006). In 2011/12, 28% of adults with a mental /behavioural problem were daily smokers, vs 16% of all adults (ABS 2013). The target daily smoking rate for adults with a mental illness for 2020 is 19.25% and for 2025 11%
8.5 Discussion
The global health targets for mental health include reducing suicide prevalence by 10% by 2020 and increasing service coverage for severe mental disorders. Reducing suicide prevalence consistent with the WHO target is challenging but feasible. The service coverage target is less relevant for Australia than measures of social inclusion and the physical health of people with mental illness.
Despite a large amount of research and literature in the area, suicide prevention remains an inexact process based on insufficient evidence (De Leo 2002). Australia was one of the first countries to develop a national suicide prevention strategy. In 1998, the year prior to the National Suicide Prevention Strategy commencing, the age-standardised suicide rate sat at 14.3 per 100,000 (ABS 2000); however, in the last 10 years, suicide rates have not lowered significantly.
55
7. Target 1 is sourced from WHO. Indicators 2 and 3 are from the Fourth Plan Measurement Strategy. Although tracking of indicators 2 and 3 is occurring, no target has yet been set. Target 4 is adapted from the NMHC National Targets and Indicators for Mental Health Reform 8. The Fourth Plan Measurement Strategy notes that the NHS will be supplemented by the Household Income and Labour Dynamics in Australia (HILDA) survey in the intervening years between NHS collections. However, HILDA has been found to introduce a major source of inconsistency in trend monitoring (Personal communication from Chair, NMHPSC, 4/11/15)
Targets and indicators for chronic disease prevention in Australia
Penny Tolhurst and Philip Batterham
Technical paper No. 2015-08
November 2015
56
The Centre of Research Excellence in Suicide Prevention (CRESP) and the Black Dog Institute have proposed a systems approach to suicide prevention. This multisectoral, community-based approach draws on successful international examples (CRESP 2015). It includes interventions to be jointly implemented, such as greater training of GPs in assessment and treatment of patients at risk of suicide; school-based interventions; and more adequate coordination and assertion of care after a suicide attempt (particularly in emergency departments). A policy approach that applies multiple strategies nationally is likely to be most effective, but this requires coordination between state and federal governments, in partnership with a rigorous evaluation process.
Similarly, several approaches to increasing engagement of people with mental illness in employment have been demonstrated to be effective. Individual Placement and Support is a well-defined, evidence-based vocational intervention for people with severe mental illnesses (Williams et al. 2015). It uses principles of rapid job placement in positions matched to individual preferences with ongoing job support. International evidence demonstrates that such supported employment can significantly improve employment outcomes for people with severe mental illnesses, including in Australia. However, this will require further improvements to disability employment services. Interventions to actively improve educational outcomes for people living with mental illness are undeveloped in Australia (Ennals et al. 2013). Supported education consists of programs and courses designed to provide pathways and supports for reengagement in education. Further research is needed to build evidence of effectiveness. Identifying and supporting programs with the greatest evidence for increasing positive outcomes in education and employment should be prioritised.
People with mental illness have smoking rates that are higher than the general population. However, there is little data available on smoking prevalence over time for this group. In Australia, 35–40% of adult smokers have a mental health disorder (Jorm 1999), and it is estimated that more than 42% of all cigarettes are smoked by people with mental illness (Access Economics 2007). Tobacco programs and policies specific to people with mental illness may be required to maximise impact. However, research suggests the quit rate for people with mental illness in response to pharmacological and psychoeducational interventions is similar to that of the general population (el-Guebaly et al. 2002). Attention should also be given to prevention, and encouraging young people with mental health problems not to commence smoking.
Population mental health indicators with regard to suicide, education, training and employment participation, and smoking, would provide key information on how Australia is progressing in a range of areas. A systemic approach to suicide prevention, and evidence-based approaches to employment, education and tobacco programs for people with mental illness would support Australia in achieving the global mental health target for suicide and improvements in the social inclusion and physical health of people with mental illness.
Key data sources and references
Access Economics (2007), Smoking and mental illness: costs, Melbourne, SANE Australia.
Australian Bureau of Statistics (ABS) (2000), Suicides, Australia, 1921 to 1998, ABS, Canberra
Australian Bureau of Statistics (ABS) (2006), 2004-05 National Health Survey: Summary of results, 2006, ABS cat. no. 4364.0, Canberra, ABS.
Australian Bureau of Statistics (ABS) (2008), National survey of mental health and wellbeing: summary of results, Australia, 2007, ABS cat. no. 4326.0, Canberra, ABS
Australian Bureau of Statistics (ABS) (2013), Australian Health Survey 2011-2012, Canberra, ABS
Australian Institute of Health and Welfare (AIHW) (2014), Suicide and hospitalised self-harm in Australia: trends and analysis, Injury research and statistics series no. 93, Cat. No. INJCAT 169, Canberra, AIHW.
Targets and indicators for chronic disease prevention in Australia
Penny Tolhurst and Philip Batterham
Technical paper No. 2015-08
November 2015
57
Centre of Research Excellence in Suicide Prevention (CRESP) and Black Dog Institute (2015), National Suicide Prevention Summit 2015, Background information.
De Leo, D (2002), Why are we not getting any closer to preventing suicide? British Journal of Psychiatry, vol. 181, pp. 372-374.
Department of Health (UK) (2013), No health without mental health: Mental health dashboard, https://www.gov.uk/government/uploads/system/uploads/attachment_data/file/265388/Mental_Health_Dashboard.pdf, accessed 9/8/15
Department of Health and Ageing (2005), National Mental Health Information Priorities (2nd ed.), Commonwealth of Australia, Canberra.
Department of Health and Ageing (2013), National Mental Health Report 2013: Tracking progress of mental health reform in Australia 1993-2011, Commonwealth of Australia, Canberra
el-Guebaly, N, Cathcart, J, Currie, S, Brown, D & Gloster, S (2002), Smoking cessation approaches for persons with mental illness or addictive disorders, Psychiatric Services, vol. 53, no. 9, pp. 1166-70.
Ennals, P, Fossey, E, Harvey, C & Killackey, E (2013), Postsecondary education: Kindling opportunities for people with mental illness, Asia-Pacific Psychiatry, vol. 6, no. 2, pp. 115-9
Jorm, A (1999), Association between smoking and mental disorders: results from an Australian National Prevalence Survey, Australian and New Zealand Journal of Public Health 1999, vol. 23, no. 3, pp. 245-8.
Lawrence, D; Hancock, J; Kisely, S (2013), The gap in life expectancy from preventable physical illness in psychiatric patients in Western Australia: retrospective analysis of population-based registers, British Medical Journal, 346:f2539
National Mental Health Commission Expert Reference Group to COAG Working Group on Mental Health Reform on Targets and Indicators for mental health reform (2013), Final Report, September 2013. http://www.mentalhealthcommission.gov.au/media/80181/250913%20-%20ERG%20final%20report%20to%20WGMHR.pdf (accessed September 2015)
National Mental Health Commission (NHMC) (2014), The National Review of Mental Health Programmes and Services, Sydney, NMHC,
National Mental Health Performance Subcommittee (NMHPSC) (2011), Fourth National Mental Health Plan Measurement Strategy First Edition- May 2011: Proposed data sources, specifications and targets for the Fourth Plan Progress Indicators, Commonwealth of Australia, Canberra
Osborn, D, Levy, G, Nazareth, I, Petersen, I, Islam, A & King, M (2007), Relative risk of cardiovascular and cancer mortality in people with severe mental illness from the United Kingdom’s General Practice Research Database, Archives of General Psychiatry, vol. 64, pp. 1123–1131.
Rosenberg, P, Hickie, I, McGorry, P, Salvador-Carulla, L, Burns, J, Christensen, H, Mendoza, J, Rosen, A, Russell, L & Sinclair, S (2015), Using accountability for mental health to drive reform, Medical Journal of Australia, vol. 203, no. 8, pp. 328-30.
Scollo, M & Winstanley, M (2015), Tobacco in Australia: Facts and issues,. Melbourne, Cancer Council Victoria, www.TobaccoInAustralia.org.au
Waghorn, G, Saha, S, Harvey, C, Morgan, V, Waterreus, A, Bush, R, Castle, D, Galletly, C, Stain, H, Neil, A, McGorry, P & McGrath, J (2012) ‘Earning and learning’ in those with psychotic disorders: The second Australian national survey of psychosis, Australian and New Zealand Journal of Psychiatry, vol. 46, no. 8, pp. 774-785.
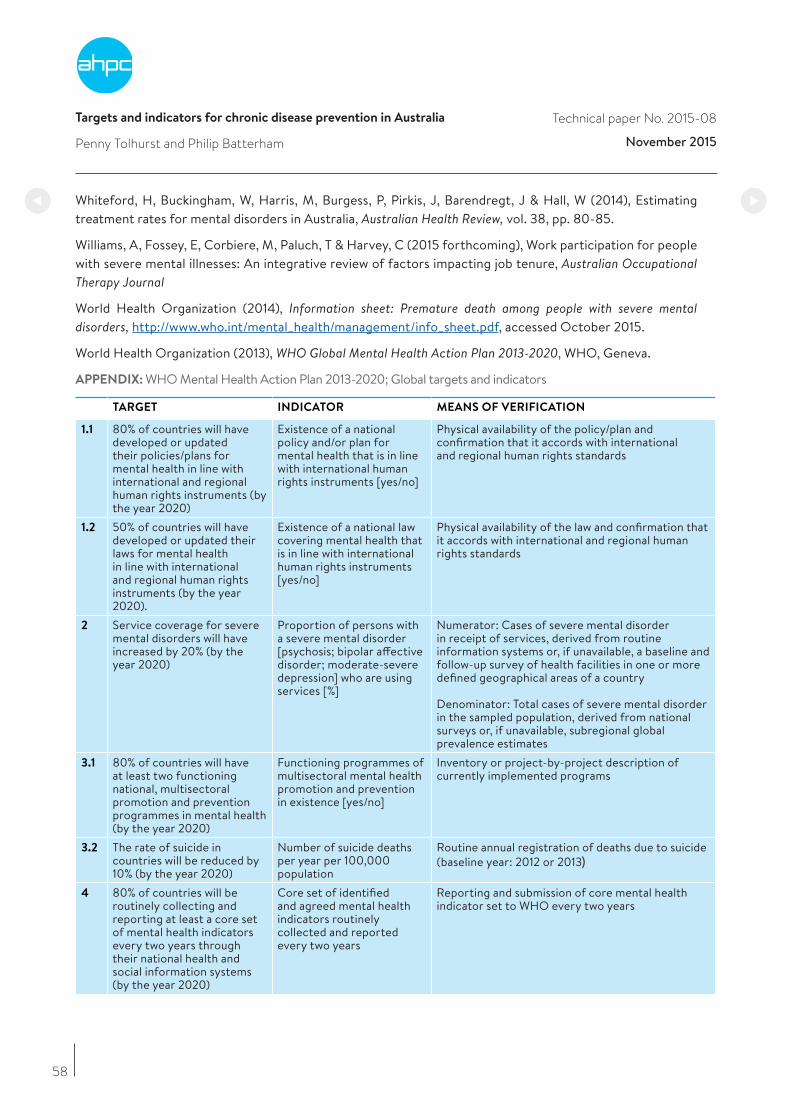
Targets and indicators for chronic disease prevention in Australia
Penny Tolhurst and Philip Batterham
Technical paper No. 2015-08
November 2015
58
Whiteford, H, Buckingham, W, Harris, M, Burgess, P, Pirkis, J, Barendregt, J & Hall, W (2014), Estimating treatment rates for mental disorders in Australia, Australian Health Review, vol. 38, pp. 80-85.
Williams, A, Fossey, E, Corbiere, M, Paluch, T & Harvey, C (2015 forthcoming), Work participation for people with severe mental illnesses: An integrative review of factors impacting job tenure, Australian Occupational Therapy Journal
World Health Organization (2014), Information sheet: Premature death among people with severe mental disorders, http://www.who.int/mental_health/management/info_sheet.pdf, accessed October 2015.
World Health Organization (2013), WHO Global Mental Health Action Plan 2013-2020, WHO, Geneva.
APPENDIX: WHO Mental Health Action Plan 2013-2020; Global targets and indicators
TARGET INDICATOR MEANS OF VERIFICATION
1.1 80% of countries will have developed or updated their policies/plans for mental health in line with international and regional human rights instruments (by the year 2020)
Existence of a national policy and/or plan for mental health that is in line with international human rights instruments [yes/no]
Physical availability of the policy/plan and confirmation that it accords with international and regional human rights standards
1.2 50% of countries will have developed or updated their laws for mental health in line with international and regional human rights instruments (by the year 2020).
Existence of a national law covering mental health that is in line with international human rights instruments [yes/no]
Physical availability of the law and confirmation that it accords with international and regional human rights standards
2 Service coverage for severe mental disorders will have increased by 20% (by the year 2020)
Proportion of persons with a severe mental disorder [psychosis; bipolar affective disorder; moderate-severe depression] who are using services [%]
Numerator: Cases of severe mental disorder in receipt of services, derived from routine information systems or, if unavailable, a baseline and follow-up survey of health facilities in one or more defined geographical areas of a country
Denominator: Total cases of severe mental disorder in the sampled population, derived from national surveys or, if unavailable, subregional global prevalence estimates
3.1 80% of countries will have at least two functioning national, multisectoral promotion and prevention programmes in mental health (by the year 2020)
Functioning programmes of multisectoral mental health promotion and prevention in existence [yes/no]
Inventory or project-by-project description of currently implemented programs
3.2 The rate of suicide in countries will be reduced by 10% (by the year 2020)
Number of suicide deaths per year per 100,000 population
Routine annual registration of deaths due to suicide (baseline year: 2012 or 2013)
4 80% of countries will be routinely collecting and reporting at least a core set of mental health indicators every two years through their national health and social information systems (by the year 2020)
Core set of identified and agreed mental health indicators routinely collected and reported every two years
Reporting and submission of core mental health indicator set to WHO every two years
Targets and indicators for chronic disease prevention in Australia Technical paper No. 2015-08
November 2015
59
9. Conclusion
Effective policies and programs are urgently required to address risk factors for chronic diseases in Australia. Risk factors including physical inactivity, obesity, poor nutrition, smoking and alcohol misuse contribute to a range of chronic diseases which are the major causes of death and illness in Australia. These diseases are a global issue, and Australia is falling behind in implementing policies to protect its population and improve health.
Australia is expected to report to the WHO on its commitments under the WHO Global Action Plan. These commitments include:
• by 2015, setting national NCD targets for 2025, consistent with voluntary global targets; and
• by 2016, implementing policies and interventions to reduce NCD risk factors and underlying social determinants.
This report proposes a set of chronic disease targets and indicators for Australia, consistent with the first commitment above. The key focus is on population-based approaches to prevention, but the report also includes prevention among individuals at high risk. The proposed targets and indicators include mental health, and have been established by working groups with expertise in each area, based on the best available evidence.
Nationally, Australia addresses some risk factors better than others. Tobacco control is an area where Australia has performed well in world terms. Initiatives such as the introduction of plain packaging with graphic health warnings have formed part of a suite of measures to reduce smoking prevalence. Following Australia’s lead, Ireland and the United Kingdom have legislated to introduce plain packaging, with France, Norway, South Africa and Canada also committed to legislation. While further action is required, the success with tobacco and the fall in smoking prevalence reflects a great deal of coordinated action, using policy levers including taxation, regulation of sales and advertising, and community education.
In other areas, Australia’s performance is of major concern, and a sustained, comprehensive approach is required. In 2011/12, 63% of adults, or 10.8 million people, were overweight or obese, making us one of the most overweight nations in the world. Obesity carries significant health risks, and for many Australians, overweight or obesity is accompanied by additional risk factors such as hypertension or physical inactivity. Salt intake is another area of concern, and Australia is falling behind countries such as Britain in this area.
Chronic diseases are expensive, and monitoring both diseases and risk factors is essential to avert future costs and harms. Health spending on diabetes has been predicted to rise by 400% between the 2002-03 and 2032-33 financial years, reaching $7 billion (DHS 2011). The rising burden of diabetes is largely due to rising rates of overweight and obesity. Regular national health surveillance, including measures of height and weight, and biomedical measures such as blood glucose, blood pressure and cholesterol levels, is an essential investment to assess Australia’s progress with regard to risk factors and chronic diseases. To be effective, policy and programs must be based on comprehensive health surveillance at five-year intervals.
To address inequities, both monitoring and interventions need to be planned with the needs of disadvantaged groups in mind. Measurement is essential to promote and maintain national progress in the prevention and response to chronic disease, and development of adequate and effective data collection and analysis must be a high priority for governments and health agencies. Examples of areas where action is needed are alcohol sales data, employment and education participation for people using specialised mental health services, and cancer staging at diagnosis.
For the millions of Australians living with chronic diseases, improvements in primary and integrated care are key to improving health outcomes. The prevention of complications, through interventions such as effective, systematic screening and treatment and the use of cardiac and pulmonary rehabilitation programs, can

Targets and indicators for chronic disease prevention in Australia Technical paper No. 2015-08
November 2015
60
reduce the impact of chronic diseases. Australia’s health system is complex and difficult to navigate; more help is required to assist people and carers to obtain the appropriate services at the right time. Australia has the opportunity to act on prevention, and to invest in highly cost-effective policies and programs. National strategies need to be effectively implemented in a range of areas to comprehensively address risk factors and chronic diseases. Over time, Australian governments have not given adequate or sustained attention to keeping their population well, and this must now change if Australia is to have a thriving population and economy.
It is important for the nation and governments to commit to a long-term strategy to achieve the targets and indicators established in this report. A broad-based collaborative effort between Commonwealth, state and territory and local governments will be essential, and engagement of public, private and not for profit organisations, community organisations and business and industry will be critical. Key indicators should be agreed, tracked, measured and reported on regularly throughout that strategy. Underpinning this is a need to ensure the infrastructure exists for reliable and regular collection of the selected indicators.
The US Department of Health and Human Services has established 10 Leading Health Indicators to guide actions to improve the health of individuals, communities and the nation to promote and influence personal and professional engagement in health improvements, to provide the basis for public health priority-setting and decision-making, and to provide measures of local outcomes for investments in health improvements (US DHHS 2015). The targets and indicators established in this report provide such a platform for Australia.
AHPC will work with the experts and organisations who have contributed to this report, and with governments and other organisations, to promote national commitment to and accountability for chronic disease prevention, using the targets and indicators contained in this report. Consideration of indicator infrastructure and data collection will be included. The work will encompass development of a national health report card, highlighting high-priority health indicators and targets for immediate policy focus and ongoing measurement and reporting. Selecting a subset of leading indicators across a range of important risk factors and conditions will be challenging and requires a collaborative approach. It is, however, essential if Australia is to put in place effective prevention of chronic diseases by 2025.
References
Department of Human Services (DHS) (2011), Future prevalence of overweight and obesity in Australian children and adolescents, 2005-2025. Melbourne DHS
U.S. Department of Health and Human Services (DHHS) (2015), Leading Health Indicators, Office of Disease Prevention and Health Promotion, http://www.healthypeople.gov/2020/Leading-Health-Indicators

Targets and indicators for chronic disease prevention in Australia Technical paper No. 2015-08
November 2015
61
Appendix One: Working Group member
Working Group 1 – Mortality, morbidity and high-risk populations
Chair Dr Andrew Knight, Fairfield General Practice Unit, UNSW and Clinical Adviser, Improvement Foundation
Rapporteur Dr Kevin McNamara, Senior Research Fellow, Deakin & Flinders Universities, Adjunct Senior
Lecturer, School of Pharmacy, Monash University
Prof. Alex Brown, Deputy Director, SAHMRI, Adelaide
Mr Bill Stavreski, National Director, Data and Evaluation, National Heart Foundation
Dr Christine Connors, General Manager Primary Health Care, NT Dept. of Health
Dr Dale Ford, Improvement Foundation, Adelaide
Dr Erin Lalor, CEO, National Stroke Foundation.
Prof. Ian Olver, Director, Sansom Institute, University of South Australia
Ms Jan Chaffey, Camp Hill Healthcare, Brisbane and Life Member of Australian Association of
Practice Management
A/Prof. John Rasa, CEO, Networking Health Victoria
Prof. Jon Emery, Professor of Primary Care Cancer Research, University of Melbourne
Ms Karen Booth, Australian Primary HealthCare Nurses Association
Prof. Mark Harris, Director, Centre for Primary Care and Equity, UNSW
Dr Mark Morgan, Hills Medical Practice, Adelaide
Prof. Nigel Stocks, Head of Discipline of General Practice, University of Adelaide
Dr Rob Grenfell, National Medical Director, BUPAA/Prof. Ron Tomlins, President International Primary Care Respiratory Group and University of Sydney
Prof. Sabina Knight, Director, Mt Isa Centre for Rural and Remote Health, JCU
Dr Steve Bunker, Clinical Research Adviser, Medibank Private
Working Group 2 – Alcohol
Chair Prof. Kypros Kypri, Senior Brawn Fellow, School of Medicine and Public Health, Newcastle University
Rapporteur Dr Michael Livingston, NHMRC Early Career Research Fellow, National Drug and Alcohol Research Centre, UNSW.
A/Prof. Kerry O’Brien, School of Social Sciences, Monash University
Prof. Maree Teesson, Director, NHMRC Centre of Research Excellence in Mental Health and Substance Use (CREMS National Drug & Alcohol Research Centre, UNSW
Mr Michael Thorn, CEO, Foundation for Alcohol Research and Education, Canberra
A/Prof. Peter Miller, Principal Research Fellow, School of Psychology, Deakin University
Prof. Robin Room, Centre for Alcohol Policy Research, La Trobe University
Prof. Steve Allsop, Director, National Drug Research Institute, Curtin University
Prof. Tanya Chikritzhs, National Drug Research Institute, Curtin University
Targets and indicators for chronic disease prevention in Australia Technical paper No. 2015-08
November 2015
Working Group 3 - Physical Inactivity
Chair Dr Lyn Roberts AO, Principal Adviser, VicHealth
Rapporteur Dr Jonathan Malo, Public Health Medicine Advanced Trainee, VicHealth
Prof. Adrian Bauman, Sesquicentenary Professor of Public Health, Boden Institute, University of Sydney
Prof. Fiona Bull MBE, Director, Centre for the Built Environment and Health, UWA
Prof. Jo Salmon, Director, Centre for Physical Activity and Nutrition Research, Deakin University
Prof. Phil Morgan, Deputy Director, PRC for Physical Activity and Nutrition, University of Newcastle
Prof. Stuart Biddle, Program Leader, Active Living and Public Health ISEAL, Victoria University
Prof. Timothy Olds, Alliance for Research in Exercise Nutrition and Activity (ARENA), University of South Australia
Adjunct Prof. Trevor Shilton, National Active Living Lead, National Heart Foundation of Australia
Prof. Wendy Brown, Director, Centre for Research on Exercise, Physical Activity and Health, University of Queensland
Working Group 4 – Salt
Chair Dr Bruce Bolam, Executive Manager, WHO Collaborating Centre for Excellence in Health Promotion, VicHealth
Rapporteur Dr Carley Grimes, Postdoctoral Research Fellow, Deakin University
Ms Sonya Stanley, Principal Program Officer, VicHealth
Prof. Bruce Neal, Senior Director, The George Institute, University of Sydney
Prof. Caryl Nowson, Chair of Nutrition and Ageing, Centre for Physical Activity and Nutrition Research Deakin University
Dr Jacqui Webster, Centre Director,
Ms Kellie-Ann Jolly, Director of Cardiovascular Programs, Victoria National Heart Federation, VICMr Scott Stirling, Advocacy Manager National Stroke Foundation
Working Group 5 – Tobacco
Chair Prof Mike Daube AO, Professor of Health Policy, Curtin University
Rapporteur Dr Michelle Gooey, Principal Program Officer VicHealth
Mr Todd Harper, CEO, Cancer Council Victoria
Dr Sarah White Director, QUIT Victoria, Cancer Council Victoria
Ms Kate Purcell, Director, Purcell Consulting NSW
62
Targets and indicators for chronic disease prevention in Australia Technical paper No. 2015-08
November 2015
Working group 6 – Obesity and diabetes
Chair Prof. Stephen Colagiuri, Boden Institute, University of Sydney
Co-chair Prof. Anna Peters, School of Health & Social Development, Deakin University
Rapporteur Dr Sharleen O’Reilly, NHMRC Fellow, School of Physical Activity and Nutrition Research, Deakin University
Prof. Boyd Swinburn, Alfred Deakin Professor, Deakin University and School of Population Health, University of Auckland
Prof. David Crawford, Centre for Physical Activity and Nutrition Research, Deakin University
Prof. Helena Teede, Monash Partners Academic Health Sciences Centre, Monash University
Ms Jane Martin, Executive Manager, Obesity Policy Coalition, Cancer Council Victoria
Dr Julie Brimblecombe, Nutrition Program Lead Menzies School of Health Research, Darwin
Prof. Louise Baur AM, Professor of Paediatrics & Child Health, Associate Dean and Head, The Children’s Hospital at Westmead Clinical School, University of Sydney and The Children’s Hospital, Westmead
Prof. Stephen Simpson AC, Director, Charles Perkins Institute, University of Sydney and Obesity Australia
Prof. Steve Allender, Co-Director WHO Collaborating Centre for Obesity Prevention, Deakin University
Prof. Timothy Gill, Research Programs Director, Boden Institute, University of Sydney
Working group 7 – Mental Health
Chair Dr Philip Batterham, Fellow in Mental Health Research, National Institute for Mental Health Research, Australian National University
Rapporteur Ms Penny Tolhurst, Manager, Chronic Disease Program, Australian Health Policy Collaboration
Prof. Carol Harvey, University of Melbourne, Director, Psychosocial Research Centre/Northwestern Mental Health
Prof. Helen Herrman, Director Research, Orygen and Director, WHO Collaborating Centre for Mental Health
Prof. Jane Pirkis Director, Centre for Mental Health, School of Population and Global Health, University of Melbourne
Prof. Philip Burgess, Professor of Mental Health Services Research, School of Public Health, University of Queensland
Dr Tim Coombs, Director of Nursing, Mental Health, Illawarra Shoalhaven Local Health District
63

Targets and indicators for chronic disease prevention in Australia Technical paper No. 2015-08
November 2015
64
Appendix Two: the case for strengthening salt regulation in Australia
Excess consumption of salt substantially increases blood pressure, and greatly increases the risk of CVD – the leading cause of death and disease burden in Australia.1
Around 75% of the salt Australians eat comes from processed foods and ready-made meals.2 With over three quarters of salt added to food prior to sale, reducing the average level of salt in the food supply is a direct and effective way to reduce the adverse health effects of Australia’s excessive salt intake. Product reformulation delivers benefits across the entire population without relying on individual behaviour change.
In 2009, the Australian Government established the Food and Health Dialogue (FHD), recognising the need to assist Australians to improve their diet. FHD provides a platform for collaborative action between government, the food industry and public health groups, primarily through a voluntary reformulation program. In its first four years, the Dialogue set voluntary salt reduction targets in nine categories of commonly consumed foods, including breads, breakfast cereals and processed meats, which together provide around one fifth of Australian adult’s daily salt intake.3 While the Dialogue has laudable goals, the mechanism developed to achieve them has proved inadequate.
Many of the targets adopted are less ambitious than those used internationally, and little objective information on progress has been reported. Planned supporting education campaigns have not been implemented, and there has been no government-led approach to monitoring the extent to which population exposure to salt has changed, and overall health impacts.4 Independent evaluation suggests some modest but encouraging results have been achieved, but progress towards meeting the targets is incomplete, and differs substantially between food companies.5 In November 2015, the federal government launched the Healthy Food Partnership (HFP) with government, industry and preventative health agencies to ‘work on strategies to educate consumers on fresh produce, appropriate portion sizes and accelerate efforts to reformulate foods to make it healthier’. The HFP will complement the Health Star Ratings system so there is renewed opportunity for a greater reduction of salt in processed foods.
Australia’s lack of progress stands in contrast to stronger voluntary initiatives and an increasing number of mandatory approaches adopted elsewhere, including:
• Finland: salt reduction efforts have been ongoing since the 1970s, but the effectiveness of the nationalprogram is largely attributed to a legal requirement that ‘high salt!’ warning labels appear on productscontaining more than a specified amount of salt. Features of the comprehensive program include strongmedia support that has built consumer awareness, and widespread promotion and consumer acceptabilityof the reduced-sodium salt ‘Pansalt’. Over a 30-year period there has been a one third decrease in averagesalt intake, a fall in average blood pressure of more than 10-mm Hg and a 75-80% decrease in both strokeand coronary heart disease mortality in under-65s.6
• United Kingdom: a comprehensive program has facilitated progressive reformulation by industry. Theinitiative includes an overall population salt reduction target, specific reformulation targets in 85 foodcategories, monitoring roles for both government and civil society, improved front-of-pack labelling, anda supporting consumer awareness campaign using ‘Sid the Slug’ in the first year. Following a review ofprogress, targets were revised and lowered, and the program extended to caterers and retailers. Althoughofficially ‘voluntary’, successive health ministers have clearly signalled their willingness to legislate ifnecessary, proving an important additional incentive for industry compliance.7 The program achieved a15% reduction in population salt intake over the period 2003–2011 and new targets established for 2017continue to drive progress.
Targets and indicators for chronic disease prevention in Australia Technical paper No. 2015-08
November 2015
65
• United States: the National Salt Reduction Initiative is a partnership of more than 90 state and local healthauthorities and national health organisations, coordinated by the New York City Health Department. Thegoal is to reduce American’s salt intake by 20% over five years. Voluntary targets have been set in 62categories of packaged food and 25 categories of restaurant food to guide industry salt reductions for2012 and 2014. Separate databases for packaged and restaurant foods track sales and nutrition data tomonitor progress, and the NYC Heath Department monitors changes in population sodium intake using 24-hour urinary analysis, with a 2010 survey providing a baseline to assess progress.8 New York City recentlycomplemented this work by passing regulation requiring display of a ‘salt-shaker’ warning symbol on chainrestaurant menus where salt content of a menu item exceeds an entire day’s recommended intake.9
• Argentina: in 2013, the government adopted a law on mandatory maximum levels of sodium in meatproducts, breads, soups, seasoning mixes and tinned foods.10 Large companies were required to meettargets by December 2014, small and medium companies by June 2015. Sanctions for producers andimporters include significant fines and potential business closure. The law also applies to salt in restaurantdishes, provides for awareness campaigns, requires health messages on restaurant menus about excessivesalt consumption, and introduction of low-sodium salts in restaurants. Outcome reporting occurs at threelevels – population intake, food industry compliance, and with bakers specifically. Public opinion surveysare also part of monitoring and evaluation.11
• South Africa: adopted salt reduction legislation in 2013 underpinned by local research and supported bya consumer awareness campaign. A stepped approach gives food manufacturers until June 2016 to meettargets in 13 food categories, and another three years to meet more stringent targets by 2019. 12
While still too early to fully assess the comparative effectiveness of these recent legislative approaches, known benefits include creation of a level playing field for the food industry so as not to disadvantage progressive companies, and additional incentives for industry compliance through inclusion of meaningful sanctions. Parallel evidence from a trans-fat regulatory context supports mandatory measures as more effective and cost-effective, than voluntary approaches.13 Modelling has also suggested a mandatory approach is likely to be more cost-effective in Australia.14
A responsive regulatory approach to population salt reduction for Australia
The successful international examples support a spectrum of regulatory approaches to salt reduction in Australia, rather than simply as a dichotomy of ‘voluntary’ or ‘mandatory’ programs. The relatively small impact of the FHD has created urgent impetus for the HFP to renew action on reformulation as part of a comprehensive salt reduction strategy. While a mandatory approach is likely to be most effective, the political and practical challenges of developing legislation suggest a ‘responsive regulatory’ approach would facilitate both immediate and progressive action. Drawing on regulatory theory and key elements successful programs elsewhere, the Australian government could build upon the existing FHD framework through the HFP by progressively employing additional regulatory ‘tools’ and ‘scaffolds’ to ensure effective progress. 15, 16
We call on the Commonwealth Government progressively strengthen the regulatory approach to salt reduction in Australia by:
• An immediate declaration of renewed government leadership
o A formal and unambiguous declaration of government leadership and commitment to achieving theglobal targets for salt reduction that the Australian government signed up to in 2013 should be made.This announcement must create a credible expectation that government will escalate levels of regulation if voluntary efforts fail.
Targets and indicators for chronic disease prevention in Australia Technical paper No. 2015-08
November 2015
66
• Setting clear targets and timelines
o The number of salt reduction targets set by the FHD should be increased by the HFP to cover additionalprocessed food categories that contribute significantly to population salt intake, and extended toinclude restaurant and fast foods.
o Timelines should be set for regular review and revision of food category salt reduction targets according to progress made.
o Targets should be aligned with international best-practice, such as those currently adopted in the United Kingdom for 2017.
o International collaboration and/or technology-sharing could be considered to accelerate progress.
• Increasing industry incentives for compliance
o Collective accountability on food manufacturers and retailers, with industry commitments and regularprogress reports made publicly available ensure voluntary efforts remain on track. This could beaccomplished through a new HFP website, with appropriate publicity given for positive outcomes aswell as lack of progress made.
o Consideration should be given to increasing the weighting attributed to salt content in determiningproduct ratings under Australia’s new front-of-pack Health Star labelling initiative – increasing thepotential for salt reduction to add star value for industry.
o Government should outline how and when regulation will be escalated Potential regulatory ‘tools’ thatcould be progressively applied to incentivise industry include warning label requirements on packagedfoods or menus, and codification of targets into the Australia New Zealand Food Standards Code.
• Improving monitoring and evaluation
o Effective monitoring will regularly review food industry compliance, changes in food composition across the food supply, and draw on overall improved monitoring of population salt intake.
o As an essential component of a comprehensive salt reduction strategy, accurate baseline data onpopulation sodium intake is essential to demonstrate progress.
o Monitoring should be led by government, with civil society and public health organizations delegated anappropriate supporting role to enhance transparency and accountability.
• Supporting reformulation activities with concurrent consumer education and awareness campaigns
o These should align with existing campaigns, including those around Australia’s new front-of-pack HealthStar Rating system, and nutrition menu labelling on fast-food menu boards.
Conclusion
The Australian government signed up the global targets to reduce population salt intake by 30% by 2025 acknowledging the potential to save 3500 lives a year through reductions in heart disease and strokes. The FHD provides one vehicle through which this could be achieved, but the process seems to have stalled. Furthermore, the parallel initiatives that would be required to ensure that population salt intake can be effectively reduced in Australia have not been initiated. A responsive, regulatory approach outlined above should be introduced progressively to address these gaps and ensure that Australia is on track to achieve the global salt reduction target. Australia will thus reap the benefits of this cost-effective, efficient and equitable way to reduce the chronic disease burden over the next decade.
Targets and indicators for chronic disease prevention in Australia Technical paper No. 2015-08
November 2015
67
References
1. Australian Bureau of Statistics. 3303.0 - Causes of Death, Australia, 2012 (ABS, Canberra, 2014).
2. Webster, J.L., Dunford, E.K. & Neal, B.C. A systematic survey of the sodium contents of processed foods.The American Journal of Clinical Nutrition 91, 413-420 (2010).
3. Keogh, J.B., Lange, K., Hogarth, R. & Clifton, P.M. Foods contributing to sodium intake and urinarysodium excretion in a group of Australian women. Public Health Nutr 16, 1837-1842 (2013).
4. Elliott, T., et al. A systematic interim assessment of the Australian government’s food and health dialogue. Med J Aust 200, 92-95 (2014).
5. Trevena H, Neal B, Dunford E & Wu, J. An Evaluation of the Effects of the Australian Food and Health 7Dialogue Targets on the Sodium Content of Bread, Breakfast Cereals, and Processed Meats. Nutrients2014, 6, 1-x manuscripts; doi:10.3390/nu60x000x (in press) (2014).
6. Karppanen, H. & Mervaala, E. Sodium intake and hypertension. Progress in cardiovascular Diseases 49, 59-75 (2006).
7. He, F.J., Brinsden, H.C. & MacGregor, G.A. Salt reduction in the United Kingdom: a successful experiment in public health. Journal of human hypertension 28, 345-352 (2014).
8. Levings, J., et al. Progress toward sodium reduction in the United States. Revista Panamericana de SaludPública 32, 301-306 (2012).
9. Benjamin Mueller, M.G. New York City Health Board Backs Warning on Menu Items With High Salt. inNew York Times (NY, NY, 2015).
10. LEY 26.905 Promoción de la reducción del consumo de sodio en la población (Buenos Aires, 2013).
11. Ministerio de Salud, A. Argentine Initiative to Reduce Salt Consumption: ‘Less Salt, More Life’. (PanAmerican Health Organization, 2012).
12. Foodstuffs, Cosmetics and Disinfectants Act, 1972, Regulations relating to the Reduction of Sodium inCertain Foodstuffs and Related Matters (ed. Health, D.o.) (2013).
13. Downs, S.M., Thow, A.M. & Leeder, S.R. The effectiveness of policies for reducing dietary trans fat: asystematic review of the evidence. Bulletin of the World Health Organization 91, 262-269h (2013).
14. Cobiac, L.J., Vos, T. & Veerman, J.L. Cost-effectiveness of interventions to reduce dietary salt intake.Heart 96, 1920-1925 (2010).
15. Magnusson, R. & Reeve, B. ‘Steering’Private Regulation? A New Strategy for Reducing Population SaltIntake in Australia. Sydney Law Review 36, 255-289 (2014).
16. Magnusson, R. & Reeve, B. Food Reformulation, Responsive Regulation, and “Regulatory Scaffolding”:Strengthening Performance of Salt Reduction Programs in Australia and the United Kingdom. Nutrients7, 5281-5308 (2015).

AUSTRALIANHEALTH POLICYCOLLABORATION
300 Queen Street, Melbourne, Victoria+61 3 9919 1820vu.edu.au/ahpc