task based video quality assessment of hvec · video streams allow security personnel to maintain...
TRANSCRIPT


Intentionally Blank
Public Safety Communications Technical Report
Task-Based Video Quality Assessment
of High-efficiency Video Coding
DHS-TR-PSC-14-02
March 2015
Reported
for:
The Office for Interoperability and
Compatibility by the Department of
Commerce’s Public Safety
Communications Research Program

Intentionally Blank

Public Safety Communications Technical Report Publication Notice
U.S. Department of Homeland Security Assessing Video Quality for Public Safety Applications Using Visual Acuity
DHS-TR-PSC-14-02 March 2015 v
Publication Notice
Disclaimer
The views and opinions of authors expressed herein do not necessarily reflect those of the
U.S. government.
Reference herein to any specific commercial products, processes, or services by trade name,
trademark, manufacturer, or otherwise does not necessarily constitute or imply its
endorsement, recommendation, or favoring by the U.S. government.
The information and statements contained herein shall not be used for the purposes of
advertising, nor to imply the endorsement or recommendation of the U.S. government.
With respect to documentation contained herein, neither the U.S. government nor any of its
employees make any warranty, express or implied, including but not limited to the
warranties of merchantability and fitness for a particular purpose. Further, neither the
U.S. government nor any of its employees assume any legal liability or responsibility for the
accuracy, completeness, or usefulness of any information, apparatus, product, or process
disclosed; nor do they represent that its use would not infringe privately owned rights.
Contact Information
Please send comments or questions to: [email protected]

Publication Notice Public Safety Communications Technical Report
U.S. Department of Homeland Security Assessing Video Quality for Public Safety Applications Using Visual Acuity
DHS-TR-PSC-14-02 vi September 2014
Intentionally Blank

Public Safety Communications Technical Report Contents
U.S. Department of Homeland Security Assessing Video Quality for Public Safety Applications Using Visual Acuity
DHS-TR-PSC-14-02 March 2015 vii
Contents Disclaimer ........................................................................................................................... v
Contact Information ........................................................................................................... v
1 Introduction .......................................................................................................................11
2 Targets, Scenario Groups and Processed Scenes ..............................................................13
2.1 Targets ..................................................................................................................... 13
2.2 Scenario Groups ....................................................................................................... 13
2.3 Processed Scenes ...................................................................................................... 14
3 Test Design ........................................................................................................................15
3.1 Test Size ................................................................................................................... 15
3.2 Viewers ..................................................................................................................... 15
3.3 Test Environment and Software .............................................................................. 15
4 Results ...............................................................................................................................18
4.1 Best-Case Recognition Rates ................................................................................... 18
4.2 Recognition Rates and Lighting .............................................................................. 19
4.3 Recognition Rates and Target Distance .................................................................. 20
4.4 Recognition Rates and Motion ................................................................................. 20
4.5 Comparison between H.264 and H.265 Coding Performance ................................. 22
5 Recommendations ..............................................................................................................27
6 Limitation, Conclusion, and Future Work ........................................................................28
7 References ..........................................................................................................................29
Appendix A Source Scenes ...................................................................................................31
Appendix B Processed Scenes ..............................................................................................38
Appendix C Notes on Experimental Design ........................................................................40
C.1 Randomization ...................................................................................................................40
C.2 Data Analysis .....................................................................................................................40
Appendix D Viewer Instructions ..........................................................................................42
Appendix E Data Tables .......................................................................................................44
Tables Table 1. Summary of Scenario Groups ...................................................................................14 Table 2. Hypothetical Reference Circuits ...............................................................................14 Table 3. Recommended Minimum Bit Rates for H.265 Encoding by Scenario Group and
Resolution. ...............................................................................................................................27 Table 4. Summary of Scenario Groups ...................................................................................33 Table 5. Field-of-View and Camera Distance Measurements ................................................34 Table 6. Target Sizes in Pixels ................................................................................................34 Table 7. Encoder Bit Rates ......................................................................................................38 Table 8. Software Settings for H.264 Encoding ......................................................................38 Table 9. H.265 Video Data ......................................................................................................44 Table 10. H.264 Video Data ....................................................................................................48

Contents Public Safety Communications Technical Report
U.S. Department of Homeland Security Assessing Video Quality for Public Safety Applications Using Visual Acuity
DHS-TR-PSC-14-02 viii March 2015
Figures Figure 1. Generalized Use Class Concept ...............................................................................12 Figure 2. Test Software Example ............................................................................................16 Figure 3. Example of Randomly Placed Response Buttons ....................................................17 Figure 4. Recognition Rates for Large Moving Targets in Bright Indoor Lighting ...............18 Figure 5. Recognition Rates for Large Stationary Targets in Dim Indoor Lighting .............18 Figure 6. Recognition Rates for Large Stationary Targets in Daylight .................................19 Figure 7. Recognition Rates for Large Stationary Targets in Dark Indoor Lighting ............20 Figure 8. Recognition Rates for Small Stationary Targets in Daylight .................................20 Figure 9. Recognition Rates for Small Moving Targets in Daylight ......................................20 Figure 10. Recognition Rates for Large Moving Targets in Daylight ....................................21 Figure 11. Recognition Rates for Large Moving Targets in Dim Indoor Lighting .................21 Figure 12. Recognition Rates for Large Moving Targets in Dark Indoor Lighting ..............22 Figure 13. H.265 and H.264 Recognition Rates for Large Moving Targets in Bright Indoor
Lighting ...................................................................................................................................23 Figure 14. H.265 and H.264 Recognition Rates for Large Stationary Targets in Dim Indoor
Lighting ...................................................................................................................................23 Figure 15. H.265 and H.264 Recognition Rates for Large Stationary Targets in Daylight ..24 Figure 16. H.265 and H.264 Recognition Rates for Large Stationary Targets in Dark Indoor
Lighting ...................................................................................................................................24 Figure 17. H.265 and H.264 Recognition Rates for Small Stationary Targets in Daylight ..25 Figure 18. H.265 and H.264 Recognition Rates for Small Moving Targets in Daylight........25 Figure 19. H.265 and H.264 Recognition Rates for Large Moving Targets in Daylight........26 Figure 20. H.265 and H.264 Recognition Rates for Large Moving Targets in Dim Indoor
Lighting ...................................................................................................................................26 Figure 21. H.265 and H.264 Recognition Rates for Large Moving Targets in Dark Indoor
Lighting ...................................................................................................................................27 Figure 22. Spatial and Temporal Perceptual Information .....................................................32 Figure 23. Test Targets, as Seen in Training Sequences .......................................................36 Figure 24. H.264 Data (9 Charts) ...........................................................................................46

Public Safety Communications Technical Report
U.S. Department of Homeland Security Assessing Video Quality for Public Safety Applications Using Visual Acuity
DHS-TR-PSC-14-02 March 2015 9
Abbreviations
AVC Advanced Video Coding
CIF Common Intermediate Format (352 x 288 pixels)
DHS Department of Homeland Security
GUC Generalized Use Class
HRC Hypothetical Reference Circuit
HD High Definition
HEVC High-efficiency Video Coding
ITS Institute for Telecommunication Sciences
ITU-T International Telecommunications Union, Telecommunication
Standardization Sector
OIC Office for Interoperability and Compatibility
PSCR Public Safety Communications Research program
VGA Video Graphics Array (640 x 480 pixels)

Public Safety Communications Technical Report
U.S. Department of Homeland Security Assessing Video Quality for Public Safety Applications Using Visual Acuity
DHS-TR-PSC-14-02 10 March 2015
Abstract
This report details a laboratory study investigating the effects of various scene parameters
and network conditions on the ability of viewers to discriminate among objects in recorded
video. It is intended to be used both to make minimum bit rate recommendations for
encoding of video used in public safety contexts and to compare the encoding performance of
the H.265 High-efficiency Video Coding (HEVC) standard to that of H.264 Advanced Video
Coding (AVC) using the results of a previous study conducted by the Public Safety
Communications Research (PSCR) program. The scene content parameters under study in
this test are target size, motion, and lighting. Network conditions include resolution
reduction and H.265 HEVC encoding at a variety of bit rates. Recognition rates are
calculated and presented as percentages of correctly recognized objects within a particular
set of videos, adjusted to account for the probability of correct guesses. As in the previous
PSCR study, the task-based subjective tests described here follow the methods outlined in
International Telecommunications Union, Telecommunication Standardization Sector (ITU-
T) Recommendation P.912.
Keywords: H.265, HEVC, H.264, AVC, task-based video quality, subjective test methods

Public Safety Communications Technical Report
U.S. Department of Homeland Security Assessing Video Quality for Public Safety Applications Using Visual Acuity
DHS-TR-PSC-14-02 March 2015 11
1 Introduction
Housed within the Department of Commerce Labs in Boulder, Colorado, the Public Safety
Communications Research program (PSCR), is a joint effort between the National Institute
of Standards and Technology/ Communication Technology Laboratory and the National
Telecommunications and Information Administration/ Institute for Telecommunication
Sciences, and works in conjunction with the Department of Homeland Security Office for
Interoperability and Compatibility (DHS OIC). The PSCR conducted a study to evaluate the
performance of the new H.265 High-efficiency Video Coding (HEVC) standard and to
compare it against that of the currently ubiquitous H.264 Advanced Video Coding (AVC)
standard.
Throughout this report, two previous DHS reports will be frequently referenced:
Video Quality Tests for Object Recognition Applications (DHS10-LIVE) – September
2010
The goal of the study detailed in this report was to research the connection between
certain scene content and network parameters within H.264-encoded video clips and
viewer performance during object recognition tasks. Clips were presented in “real
time”; participants were unable to use playback controls and saw each clip only once
(U.S. Department of Homeland Security 2010).
Recorded-Video Quality Tests for Object Recognition Tasks (DHS11-RECORDED) –
September 2011
This experiment was similar in design and goal to its predecessor above, but subjects
this time were allowed to pause and replay clips, as well as to step back and forth
through them frame by frame (U.S. Department of Homeland Security 2011).
From this point on, these studies will be referred to as DHS10-LIVE and DHS11-
RECORDED respectively. The results of DHS11-RECORDED are used in this report to
compare the effects of H.264 encoding to those of H.265 encoding.
Many public safety practitioners make regular use of live and recorded video to complete
various objectives. Video streams allow security personnel to maintain constant
surveillance of a number of areas at once, medical personnel to remotely treat patients, and
hazardous device responders to defuse explosives from a safe distance. As noted in previous
PSCR reports, a common thread between these and other public safety video applications is
the need to effectively identify particular targets within a given video stream.
Of course, minimum levels of video quality are necessary to properly perform object
identification tasks, and some tasks demand more in terms of quality than others.
However, it is important to balance quality with cost and with efficient use of network
bandwidth. To this end, knowing how a certain encoded bit rate (speaking in terms of
bandwidth) will affect video quality and the ability of practitioners to complete their tasks
is very important.

Public Safety Communications Technical Report
U.S. Department of Homeland Security Assessing Video Quality for Public Safety Applications Using Visual Acuity
DHS-TR-PSC-14-02 12 March 2015
It is necessary to consider that the performance of a viewer trying to complete a task may
vary greatly depending on the content of the video. An encoder may not be able to retain
sufficient information at a certain bit rate for a viewer to make correct identifications of
objects in all situations. Taking this into consideration, the Video Quality in Public Safety
working group included in their report, “Defining Video Quality Requirements: A Guide for
Public Safety”, the concept of generalized use classes (GUCs) (U.S. Department of
Homeland Security 2010). As Figure 1 illustrates, a GUC is defined by the target size,
lighting level, amount of motion in a particular scene, desired discrimination level, and
whether the video will be viewed live or recorded.
Figure 1. Generalized Use Class Concept
The major concentration of this test focuses on network conditions and the effect of these
conditions on video quality across a number of environments and situations. The
parameters under study are compression with H.265 HEVC and resolution reduction to
both Common Intermediate Format (CIF) (288x352) and Video Graphics Array (VGA)
(640x480) formats. The results of this study are then used to calculate recognition rates
that are compared to those of DHS11-RECORDED to illustrate the relative capabilities of
H.265 HEVC versus H.264 AVC and to provide recommendations for video quality in the
arena of public safety.
The test design described here is nearly identical to the one against which its results are
being compared, and both tests comply with the recommendations set forth in ITU-T P.912
(ITU-T 2008). The previous test compared the recognition rates of viewers watching various
scenes in recorded settings (where they are able to pause the video and step back and forth,
frame by frame) against those in which the viewer must make discriminations in scenes
using live feeds. It was found in DHS11-RECORDED that there was little difference in
recognition rates of recorded-video viewers and live-video viewers (U.S. Department of
Homeland Security 2011).
Results of this study and DHS11-RECORDED are represented as recognition rates—the
percentage of properly identified objects, after adjusting for the probability of correct
guesses.

Public Safety Communications Technical Report
U.S. Department of Homeland Security Assessing Video Quality for Public Safety Applications Using Visual Acuity
DHS-TR-PSC-14-02 March 2015 13
2 Targets, Scenario Groups and Processed Scenes
2.1 Targets
Seven objects are used as targets for the object recognition task in this study. They are the
following:
Gun
Electroshock weapon
Hand-held mobile radio
Mug
Soda can
Flashlight
Cell phone
2.2 Scenario Groups
ITU-T P.912 laid out the concept of scenario groups, which are defined as “a collection of
scenes of the same basic scenario with very slight differences between the scenes.” In each
scenario group, a unique video is made to present each object (ITU-T 2008). No other details
are changed. Because of the similarities of the videos within a scenario group, the video
tests the participants’ ability to identify targets across several bit rates and resolutions.
Two rates of motion, four levels of lighting, and two object sizes were employed in
combination with one another to create the resultant 14 scenario groups shown in Table 1.
To reduce the size of the study and limit viewer fatigue, small objects were not used in dark
lighting situations, and stationary objects were not filmed under bright, indoor light (U.S.
Department of Homeland Security 2011). It is not likely that these scenario groups would
have generated particularly useful data as the identification of stationary bright-light
targets would be excessively easy, and identification of small, dark-light targets
unnecessarily difficult. Scenes with flashlights were also omitted from dark-light, walking
scenario groups.
To vary motion between scenario groups, objects were placed on pedestals in the
“stationary” videos, and objects in motion were carried by an actor in each “moving-object”
scene. The actor was filmed walking from both the left and right side of the screen,
creating, in effect, two separate scenario groups, but the data was combined during analysis
to calculate generalized recognition rates for motion in each context. The actor held all
items in a neutral, non-contextual manner to avoid providing information about the nature
of the object through body language.
All daylight scenes were filmed at the same sunny rural location, and all indoor scenes were
filmed at an underground shooting range operated by a local law enforcement agency.
Object size was varied by changing the distance of the actor and pedestal from the camera,
and these distances were specifically decided upon prior to filming the clips.
Public Safety Communications Technical Report
U.S. Department of Homeland Security Assessing Video Quality for Public Safety Applications Using Visual Acuity
DHS-TR-PSC-14-02 14 March 2015
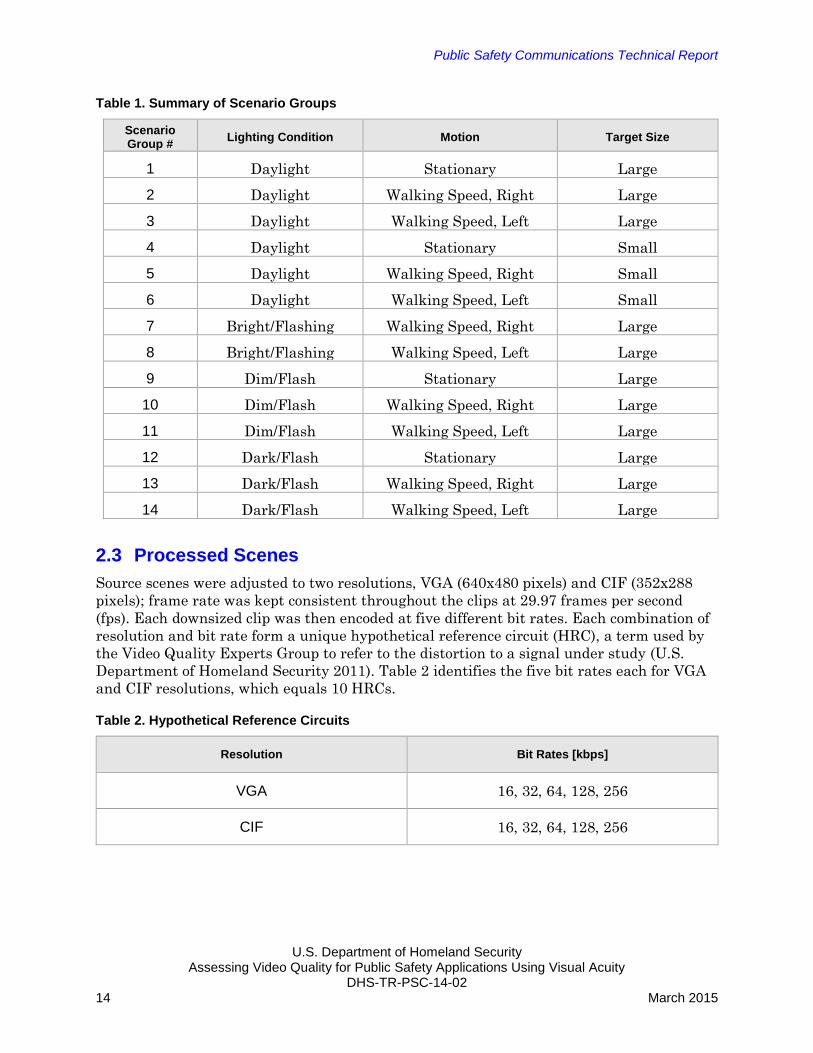
Table 1. Summary of Scenario Groups
Scenario Group #
Lighting Condition Motion Target Size
1 Daylight Stationary Large
2 Daylight Walking Speed, Right Large
3 Daylight Walking Speed, Left Large
4 Daylight Stationary Small
5 Daylight Walking Speed, Right Small
6 Daylight Walking Speed, Left Small
7 Bright/Flashing Walking Speed, Right Large
8 Bright/Flashing Walking Speed, Left Large
9 Dim/Flash Stationary Large
10 Dim/Flash Walking Speed, Right Large
11 Dim/Flash Walking Speed, Left Large
12 Dark/Flash Stationary Large
13 Dark/Flash Walking Speed, Right Large
14 Dark/Flash Walking Speed, Left Large
2.3 Processed Scenes
Source scenes were adjusted to two resolutions, VGA (640x480 pixels) and CIF (352x288
pixels); frame rate was kept consistent throughout the clips at 29.97 frames per second
(fps). Each downsized clip was then encoded at five different bit rates. Each combination of
resolution and bit rate form a unique hypothetical reference circuit (HRC), a term used by
the Video Quality Experts Group to refer to the distortion to a signal under study (U.S.
Department of Homeland Security 2011). Table 2 identifies the five bit rates each for VGA
and CIF resolutions, which equals 10 HRCs.
Table 2. Hypothetical Reference Circuits
Resolution Bit Rates [kbps]
VGA 16, 32, 64, 128, 256
CIF 16, 32, 64, 128, 256

Public Safety Communications Technical Report
U.S. Department of Homeland Security Assessing Video Quality for Public Safety Applications Using Visual Acuity
DHS-TR-PSC-14-02 March 2015 15
3 Test Design
3.1 Test Size
The clips presented to viewers in this study comprised of 14 scenario groups, 7 objects, and
10 HRCs. Taking into consideration the exclusion of the flashlight from two scenario
groups, 96 source videos were filmed. Upon completion of the transformations to each
resolution and encoding at the various desired bit rates, 960 videos were created for use in
the test. Each clip was between five and nine seconds long.
Because viewer fatigue can degrade a viewer’s performance, each participant only viewed
420 videos within the main part of the experiment, along with four videos presented as part
of the practice test designed to familiarize him or her with the test software. Before the
test, clips of the objects up close and on a pedestal were also displayed clearly to
participants showing them which objects they were to identify during the test.
A Python script was used to randomly distribute the selection of videos viewed by each
participant. While each viewer saw fewer than half of the total videos created for this study,
every viewer was presented with three clips from each combination of the 14 scenario
groups and 10 HRCs.
3.2 Viewers
This test was conducted using 38 participants. Each participant had a background in law
enforcement, firefighting, or emergency medical service. The mean, median, and standard
deviation in years of experience for the group were 20.65, 20, and 9.63 years respectively, so
it follows that around 80-percent of participants had at least 10 years of experience in their
field, with the least experienced person in the test having had 3.5 years of experience.
Several participants had 30 years of experience or more.
The Snellen and Ishihara tests were utilized to test every participant for vision acuity and
color perception. Viewers with impaired acuity or color deficiencies were not excluded
automatically, although additional analysis was performed on the results of their tests to
determine whether their responses varied significantly from those of the other participants.
One participant had strong deutan red-green deficiency and another tested positive for
strong deutan red-green deficiency with general weakness of color vision, but nothing was
found to suggest that either of their results corrupted the data as a whole.
3.3 Test Environment and Software
The software used on this test was the same as that used in DHS11-RECORDED, with one
slight difference outlined below. A survey file for each viewer was inputted into the test
software, and used to display videos in a predetermined unique order. All survey files were
created using a Python script, which randomly distributed the selection and order of videos,
while presenting three videos from each HRC-scenario group combination.

Public Safety Communications Technical Report
U.S. Department of Homeland Security Assessing Video Quality for Public Safety Applications Using Visual Acuity
DHS-TR-PSC-14-02 16 March 2015
Using the software, viewers are able to pause, replay, and step back and forth through each
clip frame by frame. No restriction was placed on participants’ use of these features, but use
of all playback features was recorded precisely by the software to make possible future
analysis of each participant’s behavior, if necessary.
Figure 2. Test Software Example

Public Safety Communications Technical Report
U.S. Department of Homeland Security Assessing Video Quality for Public Safety Applications Using Visual Acuity
DHS-TR-PSC-14-02 March 2015 17
Viewers were not presented an option for unsure or I don't know, and were forced to make
their best educated guess to progress to the next video. Figure 3 shows a screenshot of the
test software. The primary difference in the operation of the testing software between this
study and DHS11-RECORDED was that each survey file created for this test mandated a
randomly selected order in which the response buttons appeared at the bottom of the
window. This was done to reduce, as much as possible, response bias resulting from viewers
clicking the same button every time they were unsure of an answer (U.S. Department of
Homeland Security 2011).
Figure 3. Example of Randomly Placed Response Buttons
Viewing conditions followed the recommendations in ITU-T P.910 with one notable
exception, in that viewing distance and angle were not controlled, as practitioners in real-
world situations will inevitably position themselves in a way relative to the screen that
would optimize their identification task performance. It is reasonable to assume that given

Public Safety Communications Technical Report
U.S. Department of Homeland Security Assessing Video Quality for Public Safety Applications Using Visual Acuity
DHS-TR-PSC-14-02 18 March 2015
the approximate image height of five inches, their viewing distance fell within the one to
eight picture heights recommended by ITU-T P.910 (ITU-T 1999).
4 Results
The charts in this section exhibit the results for each scenario group used in this study. The
left-facing and right-facing videos for each group that included motion were combined into
larger resulting groups, and the results of these are, therefore, based on twice as many
samples as the stationary scenes. Recognition rates are given as the percentage of correct
responses after adjusting for the probability of correct guesses, and are displayed in
ascending order of bit rate in each chart. Information on both the data and analysis is
located in the appendices.
4.1 Best-Case Recognition Rates
The following charts show the scenario groups with the highest overall recognition rates for
each HRC. Unsurprisingly, H.265 HEVC is most effective in situations with limited motion
and bright lighting.
Figure 4. Recognition Rates for Large Moving Targets in Bright Indoor Lighting
Figure 5. Recognition Rates for Large Stationary Targets in Dim Indoor Lighting

Public Safety Communications Technical Report
U.S. Department of Homeland Security Assessing Video Quality for Public Safety Applications Using Visual Acuity
DHS-TR-PSC-14-02 March 2015 19
4.2 Recognition Rates and Lighting
While reviewing Figure 4, Figure 5, and
Figure 6, it is clear that brighter lighting
has a strong positive impact on the
performance of participants. Holding
motion and target size constant, we see
that recognition rates of objects in daylight
saw little decline based on HRC. All
daylight recognition rates shown in Figure
6, save one, were above 80 percent, and five
were above 90 percent.
As expected, recognition rates declined as
lighting was lowered. When lighting was
made dim, it was only for bit rates of 64
kbps or greater that 80-percent recognition
rates were achieved, and the recognition rate of only one HRC actually exceeded 90 percent.
Finally, in dark lighting conditions, recognition rates never reached the level of 60 percent,
although 50 percent was observed in four HRCs.
A saturation effect is visible in Figure 4, Figure 5, and Figure 6, much like what was
observed in DHS10-LIVE (U.S. Department of Homeland Security 2010). This is to say that
recognition rates for large, stationary targets in daylight were near 90-percent at bit rates
as low as 16 kbps and increases in bit rate did not yield significant improvement at any
point. The same can be said for recognition rates of large, stationary objects in dim lighting,
although the threshold of saturation is slightly higher than in daylight. As discussed in
DHS11-RECORDED, these results imply that lighting conditions affect recognition rates in
ways that cannot simply be compensated for by increasing coding bit rate (U.S. Department
of Homeland Security 2011).
Figure 6. Recognition Rates for Large Stationary Targets in Daylight

Public Safety Communications Technical Report
U.S. Department of Homeland Security Assessing Video Quality for Public Safety Applications Using Visual Acuity
DHS-TR-PSC-14-02 20 March 2015
4.3 Recognition Rates and Target Distance
Changes in target size, by way of adjusting
the distance of targets from the camera,
had strong effects on recognition rates.
Observing Figure 7 and Figure 8, we see a
pronounced difference in viewer
performance at lower bit rates when target
size is reduced. Unlike Figure 7, however,
Figure 8 shows fewer signs of saturation
indicating that increases in coding bit rates
might yield higher rates of recognition.
Figure 8 and Figure 9 show a comparable
drop in recognition rates as target size is
reduced, although neither scenario group
actually saw recognition rates that differed
significantly from zero in three of the lower-
bit-rate HRCs. It must be mentioned that the near-zero recognition rates for moving targets
in the daylight setting indicate that actual performance differed insignificantly from the
probability of correctly guessing all answers in those HRCs (i.e., there were no identifiable
objects in those clips).
4.4 Recognition Rates and Motion
While Figure 4 shows that a scenario group with motion can yield ideal recognition rates
over 90 percent, this does not hold true for most situations. Consistent reductions in
recognition rates of 10- to 20-percentage points for any given HRC are seen when
Figure 7. Recognition Rates for Large Stationary Targets in Dark Indoor Lighting
Figure 8. Recognition Rates for Small Stationary Targets in Daylight
Figure 9. Recognition Rates for Small Moving Targets in Daylight

Public Safety Communications Technical Report
U.S. Department of Homeland Security Assessing Video Quality for Public Safety Applications Using Visual Acuity
DHS-TR-PSC-14-02 March 2015 21
comparing the charts below to their stationary counterparts. Lower-bit-rate HRCs saw even
greater differences in recognition.
Motion, above all other conditional changes, had the greatest negative impact on viewers’
ability to identify objects. For example, recognition rates all approach or exceed 90 percent
in Figure 6, but when motion is introduced in Figure 10, rates for only one HRC exceed 90
percent, while rates for seven HRCs are below 80 percent and four do not exceed 40 percent.
This same kind of degradation is also illustrated by comparing Figure 8 to Figure 9, Figure
5 to Figure 11, and Figure 7 to Figure 11. It must be pointed out that in Figure 12,
recognition rates of 50 percent were not achieved, and it may be inferred based on the
results of this test and (U.S. Department of Homeland Security 2011) that it is unlikely
that an increase in bit rate would provide any major increase in viewer performance.
Figure 10. Recognition Rates for Large Moving Targets in Daylight
Figure 11. Recognition Rates for Large Moving Targets in Dim Indoor Lighting

Public Safety Communications Technical Report
U.S. Department of Homeland Security Assessing Video Quality for Public Safety Applications Using Visual Acuity
DHS-TR-PSC-14-02 22 March 2015
4.5 Comparison between H.264 and H.265 Coding Performance
The overarching purpose of this test was to
compare the differences in performance of
viewers executing object recognition tasks
using videos encoded with H.265 HEVC
and H.264 AVC. The key difference
between this test and the one against which
its results are being compared is that clips
used for this test were encoded according to
the H.265 HEVC (whereas DHS11-
RECORDED employed H.264 AVC).
Charts in Figure 13 through Figure 21
provide a side-by-side comparison between
H.265 HEVC results and corresponding
H.264 AVC results from DHS11-RECORDED for each scenario group presented in the same
order as in the four subsections immediately preceding this one. The test scenes, testing
methods, and testing conditions were identical to DHS11-RECORDED, and the same
number of viewers were tested (U.S. Department of Homeland Security 2011).
Immediately it is apparent that the previous test used clips of much higher bit rates than
the ones used in this test. During the design of this test, it was determined that clips
encoded at bit rates of 512 kbps and above using H.265 HEVC would not likely produce
valuable data for most scenario groups. As H.265 HEVC has been purported to produce
equivalent quality to H.264 AVC encoded videos with 30- to 60-percent reduction in coding
bit rates, we decided to lower the floor on bit rates used for this test. Thus, while the
previous test used clips encoded only as low as 64 kbps for CIF and 128 kbps for VGA, clips
of both resolutions were encoded at 16 kbps and 32 kbps in this test.
As evidenced by the first four sets of charts, H.265 HEVC performs well for large objects at
all tested levels of light. It even handily outperformed H.264 AVC in the indoor, bright
light, walking scenario group. Recognition rates of 90 percent, or greater, were maintained
in the daylight, stationary, large target scenario all the way down to 16 kbps (VGA), and
performance at 64 kbps (VGA) using H.265 HEVC in the dark, stationary, large object
category was nearly as good as 256 kbps (VGA) using H.264 AVC.
It is interesting to note that H.265 HEVC underperformed H.264 AVC in all daylight
scenario groups. We propose that this may be the result of increased background detail in
the outdoor scenes, as opposed to the relatively limited level of background detail in the
indoor scenes. The effect is particularly pronounced when motion is introduced, and is at its
most severe when employing small targets. These results show that clips produced at the
lower-two bit rates provided insufficient information for viewers to make even educated
guesses, let alone true correct recognitions. Further study on the relationship between
spatial complexity of the source material and the performance of H.265 HEVC is required.
Figure 12. Recognition Rates for Large Moving Targets in Dark Indoor Lighting

Public Safety Communications Technical Report
U.S. Department of Homeland Security Assessing Video Quality for Public Safety Applications Using Visual Acuity
DHS-TR-PSC-14-02 March 2015 23
Alternately, coding according to H.265 HEVC produced, for the most part, better results in
the indoor scenario groups than coding with H.264 AVC. These scenes had both limited
background detail and higher contrast between the actor, target, and the surrounding
environment, which resulted in performance closer to what is reputed for the standard. The
results for these groups appear as translations along the bit rate axis of their corresponding
results from DHS11-RECORDED with less delineation in performance based on resolution
(U.S. Department of Homeland Security 2011). Whereas there was a fairly pronounced
difference in recognition rates of CIF-resized videos in the H.264 AVC tests, resolution
seemed to matter little when coding with H.265 HEVC, except at the lowest bit rate.
After reviewing these results, the use of 16 kbps and 32 kbps encoding seems impractical in
most situations, and is effectively unusable in daylight.
Figure 13. H.265 and H.264 Recognition Rates for Large Moving Targets in Bright Indoor Lighting
Figure 14. H.265 and H.264 Recognition Rates for Large Stationary Targets in Dim Indoor Lighting

Public Safety Communications Technical Report
U.S. Department of Homeland Security Assessing Video Quality for Public Safety Applications Using Visual Acuity
DHS-TR-PSC-14-02 24 March 2015
Figure 15. H.265 and H.264 Recognition Rates for Large Stationary Targets in Daylight
Figure 16. H.265 and H.264 Recognition Rates for Large Stationary Targets in Dark Indoor Lighting

Public Safety Communications Technical Report
U.S. Department of Homeland Security Assessing Video Quality for Public Safety Applications Using Visual Acuity
DHS-TR-PSC-14-02 March 2015 25
Figure 17. H.265 and H.264 Recognition Rates for Small Stationary Targets in Daylight
Figure 18. H.265 and H.264 Recognition Rates for Small Moving Targets in Daylight

Public Safety Communications Technical Report
U.S. Department of Homeland Security Assessing Video Quality for Public Safety Applications Using Visual Acuity
DHS-TR-PSC-14-02 26 March 2015
Figure 19. H.265 and H.264 Recognition Rates for Large Moving Targets in Daylight
Figure 20. H.265 and H.264 Recognition Rates for Large Moving Targets in Dim Indoor Lighting

Public Safety Communications Technical Report
U.S. Department of Homeland Security Assessing Video Quality for Public Safety Applications Using Visual Acuity
DHS-TR-PSC-14-02 March 2015 27
Figure 21. H.265 and H.264 Recognition Rates for Large Moving Targets in Dark Indoor Lighting
5 Recommendations
Table 3 shows the recommendations for minimum bit rates based on filmed scenario group
and file resolution. Recommendations are made for both 50- and 90-percent rates of correct
recognition based on the results of this test.
Table 3. Recommended Minimum Bit Rates for H.265 Encoding by Scenario Group and Resolution.
Scenario
Bit rate for 90-percent recognition (kbps)
Bit rate for 50-percent recognition (kbps)
VGA CIF VGA CIF
Daylight, stationary, large
target 16* 128 16* 16*
Daylight, stationary,
small target N/A N/A 16* 32
Daylight, moving, large
target 256 N/A 64 64
Daylight, moving, small
target N/A N/A 128 256
Bright and flashing
lighting, moving, large
target
64 32 32 32
Dim and flashing lighting,
stationary, large target 256 N/A 16* 32

Public Safety Communications Technical Report
U.S. Department of Homeland Security Assessing Video Quality for Public Safety Applications Using Visual Acuity
DHS-TR-PSC-14-02 28 March 2015
Table 3. Recommended Minimum Bit Rates for H.265 Encoding by Scenario Group and Resolution.
Scenario
Bit rate for 90-percent recognition (kbps)
Bit rate for 50-percent recognition (kbps)
VGA CIF VGA CIF
Dim and flashing lighting,
moving, large target N/A N/A 64 32
Dark with flashing lights,
stationary, large target N/A N/A 128 128
Dark with flashing lights,
moving, large target N/A N/A N/A N/A
*A lower bit rate may also meet this criteria; the minimum bit rate tested sufficiently exceeded criteria.
It is worth noting that while encoders are typically effective in matching output bit rate to
the bit rate requested by the user, the output bit rates of various videos of different lengths
and having different characteristics may vary slightly from those requested. Users encoding
video for use in public safety fields may benefit from checking that the resultant bit rates of
encoded files or streams match those desired.
6 Limitation, Conclusion, and Future Work
As the source videos in this test were the same used in DHS11-RECORDED and DHS10-
LIVE, this test was limited in the same ways described in those studies. Bright, indoor
scenes with stationary objects and dark lighting scenes with small objects were not
included in either test. To provide recommendations for a greater proportion of recognition
rates exceeding 90 percent, it would be useful to run tests using clips of higher bit rates
encoded according to H.265 HEVC, particularly in scenes with small targets and motion;
however, the observed saturation effects caused by issues in the original, uncompressed
scenes may prevent subjects from achieving 90-percent recognition at any bit rate.
Daylight scenario groups resulted in generally poor viewer performance when movement
was added or the object size was reduced. The large moving targets in the scenario group
represented by Figure 10 resulted in similar recognition rates to H.264 AVC at 256 kbps,
but rates of the rest of the HRCs were considerably lower than expected relative to the
results of DHS11-RECORDED (U.S. Department of Homeland Security 2011). The fact that
the coding techniques of H.265 HEVC provide no improvement over those of H.264 AVC
implies that H.264 HEVC may have achieved a nearly optimal representation of the spatial
complexity of these scenes, while leaving some room for improvement on the indoor scenes
that may have been less spatially complex. Further study is required.
For indoor scenes, H.265-encoded videos produced same-or-better recognition rates
compared to the H.264-encoded videos. In fact, the majority of the scenario group/HRC
combinations in H.265 HEVC produced similar recognition rates as HRCs of twice the bit
rates of clips encoded according to H.264 AVC. This observation of the indoor performance

Public Safety Communications Technical Report
U.S. Department of Homeland Security Assessing Video Quality for Public Safety Applications Using Visual Acuity
DHS-TR-PSC-14-02 March 2015 29
is very useful for general recognition tasks and allows for more effective bit rate
recommendations than can be provided for outdoor scenes.
Due to the relative novelty of the H.265 HEVC standard (resulting in the fairly recent
release of available codecs), more research should be done on the performance of the
standard under various parameters and with various encoders.
7 References American National Standards Institute. "American National Standard Method for Measuring the
Intelligibility of Speech Over Communications Systems." S3.2. American National Standards Institute, 1989.
Fraunhofer HHI. Wavefronts for HEVC Parallelism. Fraunhofer Heinrich Hertz Institute. n.d. http://www.hhi.fraunhofer.de/fields-of-competence/image-processing/research-groups/multimedia-communications/wavefronts-for-hevc-parallelism.html (accessed 2014).
ITU-T. "Subjective video quality assessment methods for multimedia applications." Recommendation P.910, Geneva, 1999.
ITU-T. "Subjective video quality assessment methods for recognition tasks." Recommendation P.912, Geneva, 2008.
Johnson, N., S. Kotz, and A. Kemp. In Univariate Discrete Distributions, 129. New York: Wiley, 1992. U.S. Department of Homeland Security. "Defining Video Quality Requirements: A Guide for Public
Safety." Recommendation Report, 2010. U.S. Department of Homeland Security. "Recorded-Video Quality Tests for Object Recognition Tasks."
Technical Report, 2011. U.S. Department of Homeland Security. "Video Quality Tests for Object Recognition Applications." Public
Safety Communications Technical Report, 2010. Video Quality in Public Safety Working Group. "Defining Video Quality Requirements: A Guide for Public
Safety." July 2010. http://www.safecomprogram.gov/SiteCollectionDocuments/3aVideoUserRequirementGuidedoc.pdf (accessed September 2014).

Public Safety Communications Technical Report
U.S. Department of Homeland Security Assessing Video Quality for Public Safety Applications Using Visual Acuity
DHS-TR-PSC-14-02 30 March 2015
Intentionally Blank

Public Safety Communications Technical Report Appendix A Source Scenes
U.S. Department of Homeland Security Assessing Video Quality for Public Safety Applications Using Visual Acuity
DHS-TR-PSC-14-02 March 2015 31
Appendix A Source Scenes
All clips presented to participants of this test used original test sequences recorded for a
previous study conducted by the PSCR program with support from DHS OIC (U.S.
Department of Homeland Security 2010). This appendix closely resembles a corresponding
appendix of DHS11-RECORDED, describing certain characteristics of the course scenes in
greater detail than described in DHS10-LIVE (U.S. Department of Homeland Security
2010).
The scenes used in this test were created using the concept of scenario groups, a collection
of slightly varying scenes based on the same general situation, a concept introduced in ITU-
T P.912 (ITU-T 2008). The goal of scenario groups is to minimize scene memorization and
visual cues so viewer performance can be effectively measured. In a given scenario group,
all variables aside from the target being displayed are held constant, and seven objects are
presented in each scenario group.
The objects used as targets for the identification tests in this study are:
Gun;
Electroshock weapon;
Hand-held mobile radio;
Mug;
Soda can;
Flashlight; and
Cell phone.
The objects in the scenes were filmed both resting on a pedestal and carried by a person
walking. To test two views of the object as it is carried, the person, carrying the object in
their left hand, was filmed in both a walking-left and walking-right scenario. The actor did
not hold the object in a way that would imply the nature of the object (i.e., the actor did not
hold the phone to her ear or the gun in a position to shoot).
Two locations were used for the scenes. The first was a sunny, outdoor rural setting. All
indoor scenes were shot in an underground shooting range at a law enforcement agency
under various lighting conditions. The lighting conditions represented were: outdoor
daylight, indoor bright light, indoor dim light, and indoor nearly, dark conditions. The
lighting in the scenes filmed in the underground shooting range was affected by a flashing
law-enforcement light bar. Light levels for the indoor dim and indoor dark scenes were
measured using a handheld photometer made by Quantum Instruments. Pointed in the
same general direction as the camera, the photometer registered a 3.1 lux for the indoor
dim scenes, and a 2.2 lux for the indoor dark scenes.
ITU-T Recommendation P.910, in accordance with the recommendations in ITU-T P.912
for test scene selection, suggests that the test scenes with motion levels of walking and
stationary positions contain the full range of temporal and spatial information of

Appendix A Source Scenes Public Safety Communications Technical Report
U.S. Department of Homeland Security Assessing Video Quality for Public Safety Applications Using Visual Acuity
DHS-TR-PSC-14-02 32 March 2015
interest (ITU-T 1999). To reiterate, this test only used the two levels of motion and the
two locales to create all of the scenario groups; thus, the perceptual information of
interest, temporal and spatial, is limited. A plot of this information can be seen in
Figure 22. The spatial and temporal information was calculated in accordance to ITU-T
P.910 (U.S. Department of Homeland Security 2010).
Figure 22. Spatial and Temporal Perceptual Information
Notice that the legend in Figure 22 also refers to a “target size” (i.e., large, small). In
this test, target size variance was simulated by the distance of the camera during
filming, and only used for the outdoor daylight scenario. This was so both “small” and
“large” targets were represented. For the indoor scenes, there was only one camera
distance used, and the target size within all indoor clips was the same as the large-
target outdoor scenes.
To keep the test at a relatively reasonable size, some lighting level, motion level, and target
size combinations were omitted; this was in addition to omitting scenario groups with
indoor lighting and small targets. Overall, 14 scenario groups were selected. Each scenario
group is comprised of scenes with each of the seven objects, save two exceptions. The
exceptions being the scenario groups where there is dark lighting with a carried object, in
which the flashlight was not used as an object. Hence, the total number of test scenes was
96.

Public Safety Communications Technical Report Appendix A Source Scenes
U.S. Department of Homeland Security Assessing Video Quality for Public Safety Applications Using Visual Acuity
DHS-TR-PSC-14-02 March 2015 33
From here, the combinations of scenario groups and target objects can be described as
“clips.” Most clips had a length of five seconds, and the clips with the daylight/walking
scenario and the indoor dim/stationary scenario had varying lengths. Indoor dim/stationary
groups had lengths of four seconds, daylight/walking/large groups lasted for six seconds,
and daylight/walking/small groups were nine seconds long. The reason for the duration
difference is due to the time needed to fully walk across the varying fields of view.
All clips were filmed with a Panasonic AJ-HPX3700 in 1080p high definition (HD). The
Panasonic AJ-HPX3700 is considered a broadcast-quality camera. The two recording
formats this camera supports are AVC-Intra 100/50 and DVCPRO HD.
Table 4. Summary of Scenario Groups
Scenario Group #
Lighting Condition Motion Target Size
1 Daylight Stationary Large
2 Daylight Walking Speed, Right Large
3 Daylight Walking Speed, Left Large
4 Daylight Stationary Small
5 Daylight Walking Speed, Right Small
6 Daylight Walking Speed, Left Small
7 Bright/Flashing Walking Speed, Right Large
8 Bright/Flashing Walking Speed, Left Large
9 Dim/Flash
(Lighting: 3.1 Lux) Stationary Large
10 Dim/Flash
(Lighting: 3.1 Lux) Walking Speed, Right Large
11 Dim/Flash
(Lighting: 3.1 Lux) Walking Speed, Left Large
12 Dark/Flash
(Lighting: 2.2 Lux) Stationary Large
13 Dark/Flash
(Lighting: 2.2 Lux) Walking Speed, Right Large

Appendix A Source Scenes Public Safety Communications Technical Report
U.S. Department of Homeland Security Assessing Video Quality for Public Safety Applications Using Visual Acuity
DHS-TR-PSC-14-02 34 March 2015
Table 4. Summary of Scenario Groups
Scenario Group #
Lighting Condition Motion Target Size
14 Dark/Flash
(Lighting: 2.2 Lux) Walking Speed, Left Large
The following is information about the field of view based on the various target sizes, and
the pixel measured sizes of the stationary target scenario groups.
The horizontal field-of-view as seen by the camera at the distance of the target was
measured for each scenario group. These measurements are shown in Table 5.
Table 5. Field-of-View and Camera Distance Measurements
Scenario Group # Field-of-View Distance from Camera
1 23’ 6” 35’ 9”
2-3 32’ 7” 35’ 9”
4 48’ 11” 48’
5-6 58’ 8” 48’
7-14 12’ 8” 17’ 2”
The pixel sizes of the objects in the stationary scenario groups were measured in still
frames. All frames that these measurements were done in came from clips that were down-
converted to the 640x480 resolution. All of these sizes are shown in Table 6. Along with
sizes, Table 6 also states the color of the object.
Table 6. Target Sizes in Pixels
Object Color Size [pixels]
Scenario Group 9
Size [pixels]
Scenario Group 1
Size [pixels]
Scenario Group 4
Cell Phone Red 282 100 23
Flashlight Black 466 105 44
Soda White and Red 355 111 36
Mug White 335 145 42
Electroshock Weapon
Yellow 439
158 38

Public Safety Communications Technical Report Appendix A Source Scenes
U.S. Department of Homeland Security Assessing Video Quality for Public Safety Applications Using Visual Acuity
DHS-TR-PSC-14-02 March 2015 35
Table 6. Target Sizes in Pixels
Object Color Size [pixels]
Scenario Group 9
Size [pixels]
Scenario Group 1
Size [pixels]
Scenario Group 4
Gun Black 568 204 78
Radio Black 677 283 77
The still frames of the targets are shown in Figure 23. These still frames are from the
training sequence software.

Appendix A Source Scenes Public Safety Communications Technical Report
U.S. Department of Homeland Security Assessing Video Quality for Public Safety Applications Using Visual Acuity
DHS-TR-PSC-14-02 36 March 2015
Figure 23. Test Targets, as Seen in Training Sequences
Public Safety Communications Technical Report Appendix A Source Scenes
U.S. Department of Homeland Security Assessing Video Quality for Public Safety Applications Using Visual Acuity
DHS-TR-PSC-14-02 March 2015 37
Intentionally Blank

Appendix B Processed Scenes Public Safety Communications Technical Report
U.S. Department of Homeland Security Assessing Video Quality for Public Safety Applications Using Visual Acuity
DHS-TR-PSC-14-02 38 March 2015
Appendix B Processed Scenes
All raw HD videos were resized to VGA (640x480) and CIF (352x288) formats using a
Lanczos filter. Frame rate was constant throughout all scenes at 29.97 fps.
Table 7. Encoder Bit Rates
Resolution Bit Rates (kbps)
CIF 16, 32, 64, 128, 256
VGA 16, 32, 64, 128, 256
Clips for this study were encoded according to the H.265 HEVC standard using the x265
codec. To ensure that videos were presented consistently to all subjects and to avoid
potential technical issues, videos were decoded using the H.265 HEVC reference decoder
and remultiplexed to AVI files before the test was conducted.
We enabled wavefront parallel processing (WPP) because it is marketed as a key feature of
H.265 HEVC. It has been introduced in an effort to make parallelism an important part of
the H.265 HEVC standard, as opposed to something of an afterthought in H.264 AVC
(which used slicing for parallel processing at a cost to coding quality). Detailed explanation
of WPP is outside the scope of this paper, but more information can be found at (Fraunhofer
HHI n.d.).
Table 8. Software Settings for H.264 Encoding
Parameter Setting
Preset Default
Level Default
Frame Rate 29.97 fps
Audio Off
Motion Search Method Hex
B-Frame Max 4
Wavefront Parallel Processing Enabled

Public Safety Communications Technical Report Appendix B Processed Scenes
U.S. Department of Homeland Security Assessing Video Quality for Public Safety Applications Using Visual Acuity
DHS-TR-PSC-14-02 March 2015 39
Intentionally Blank
Appendix C Notes on Experimental Design Public Safety Communications Technical Report
U.S. Department of Homeland Security Assessing Video Quality for Public Safety Applications Using Visual Acuity
DHS-TR-PSC-14-02 40 March 2015
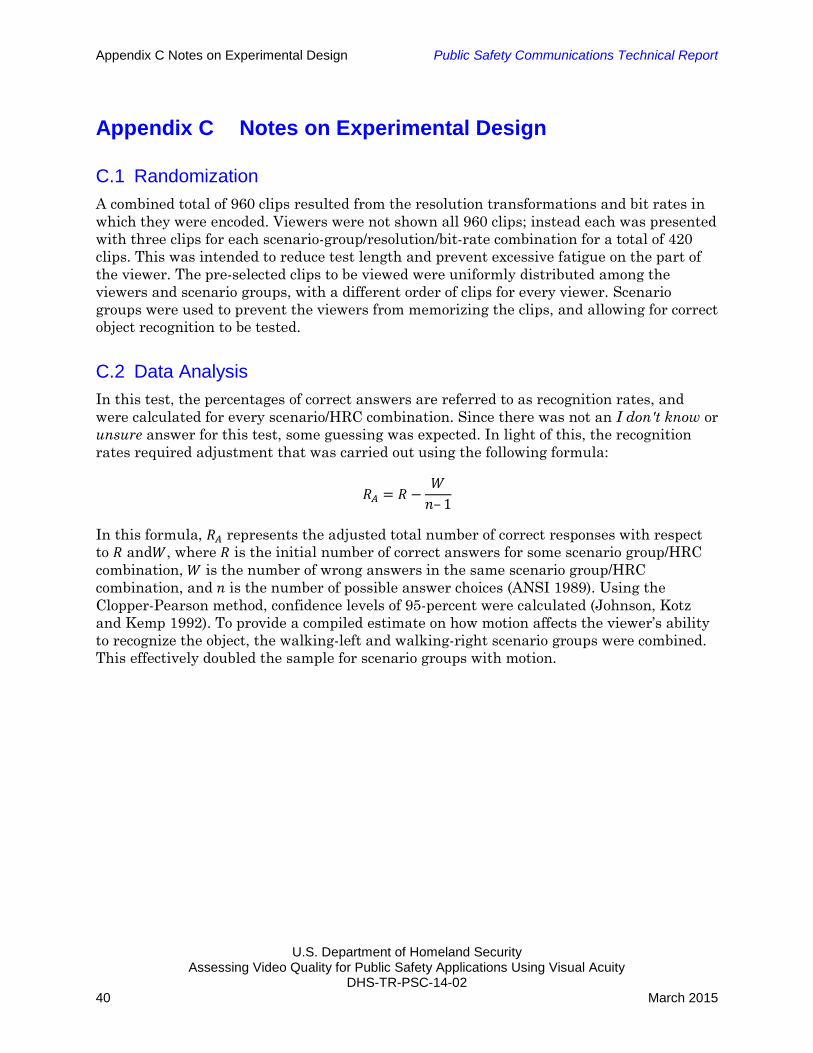
Appendix C Notes on Experimental Design
C.1 Randomization
A combined total of 960 clips resulted from the resolution transformations and bit rates in
which they were encoded. Viewers were not shown all 960 clips; instead each was presented
with three clips for each scenario-group/resolution/bit-rate combination for a total of 420
clips. This was intended to reduce test length and prevent excessive fatigue on the part of
the viewer. The pre-selected clips to be viewed were uniformly distributed among the
viewers and scenario groups, with a different order of clips for every viewer. Scenario
groups were used to prevent the viewers from memorizing the clips, and allowing for correct
object recognition to be tested.
C.2 Data Analysis
In this test, the percentages of correct answers are referred to as recognition rates, and
were calculated for every scenario/HRC combination. Since there was not an I don't know or
unsure answer for this test, some guessing was expected. In light of this, the recognition
rates required adjustment that was carried out using the following formula:
𝑅𝐴 = 𝑅 −𝑊
𝑛– 1
In this formula, 𝑅𝐴 represents the adjusted total number of correct responses with respect
to 𝑅 and𝑊, where 𝑅 is the initial number of correct answers for some scenario group/HRC
combination, 𝑊 is the number of wrong answers in the same scenario group/HRC
combination, and 𝑛 is the number of possible answer choices (ANSI 1989). Using the
Clopper-Pearson method, confidence levels of 95-percent were calculated (Johnson, Kotz
and Kemp 1992). To provide a compiled estimate on how motion affects the viewer’s ability
to recognize the object, the walking-left and walking-right scenario groups were combined.
This effectively doubled the sample for scenario groups with motion.

Public Safety Communications Technical Report Appendix C Notes on Experimental Design
U.S. Department of Homeland Security Assessing Video Quality for Public Safety Applications Using Visual Acuity
DHS-TR-PSC-14-02 March 2015 41
Intentionally Blank

Appendix D Viewer Instructions Public Safety Communications Technical Report
U.S. Department of Homeland Security Assessing Video Quality for Public Safety Applications Using Visual Acuity
DHS-TR-PSC-14-02 42 March 2015
Appendix D Viewer Instructions
Viewers received the following text as instruction.
Thanks for coming in today to participate in our study. This study concerns the
quality of video images for use in Public Safety applications. As a likely user of next-
generation devices for Public Safety applications, we are interested in whether the
videos to be presented are of sufficient quality to be used by you to perform several
different potential tasks.
Today’s study examines video used in a recorded, real-time situation, and the ability
to use this video to make real time decisions on how to respond to an incident. This
study does not apply to video which has been recorded for later examination. The
applications currently being focused on are related to object recognition. You will be
asked to answer specific questions regarding content in the video.
Scene Description Response
Person walking by, holding an object
Lighting scenario
Indoor flashing lights
Indoor, dark, flashing lights
Outdoor, daytime
Multiple choice: Identify the object from
a list
Stationary objects
Lighting scenario
Indoor flashing lights
Indoor, dark, flashing lights
Outdoor, daytime
Multiple choice: Identify the object from
a list
Each scene will be approximately 5 to 9 seconds long. While the clip is playing, you
may pause or step backward or forward frame by frame. You may replay each clip as
many times as you wish. You will then be asked to answer the question relating to the
scene as described in the table above. The test software will record your answers, as
well as when you paused, replayed, or stepped through frames of the clip; it will also
record the total time you spent on each clip. *Please wait for the video clip to
finish playing before answering the question, and please do not close the
media player window at any time during the test.
Multiple Choice Instructions
Please choose the answer that most closely matches what you saw in the video. For
this study there is no “other” or “I don’t know” option; therefore, please select the
answer you believe to be most likely.
You will be asked to participate in one viewing session which is approximately 90
minutes long. Practice videos will be presented to help you get familiar with the scene

Public Safety Communications Technical Report Appendix D Viewer Instructions
U.S. Department of Homeland Security Assessing Video Quality for Public Safety Applications Using Visual Acuity
DHS-TR-PSC-14-02 March 2015 43
material and rating process, as well as a clip showing the objects you might see in the
videos. You may take a break at any time during the session.

Appendix E Data Tables Public Safety Communications Technical Report
U.S. Department of Homeland Security Assessing Video Quality for Public Safety Applications Using Visual Acuity
DHS-TR-PSC-14-02 44 March 2015
Appendix E Data Tables
Note: In Table 9, targets detected and percent correct have been adjusted to account for
guesses made by participants in the study.
Table 9. H.265 Video Data
Scenario Groups
Bit Rate (kbps)
16 32 64 128 256
Resolution CIF VGA CIF VGA CIF VGA CIF VGA CIF VGA
Daylight Stationary
Large
Targets Present
114 114 114 114 114 114 114 114 114 114
Targets Identified
74.33 104.6
7
101.1
7
107.0
0
95.33 102.3
3
104.6
7
102.33 108.1
7
107.0
0
Percent Correct
65.21 91.81 88.74 93.86 83.63 89.77 91.81 89.77 94.88 93.86
Bright Walking Large
Targets Present
228 228 228 228 228 228 228 228 228 228
Targets Identified
111.33 79.83 211.6
7
196.5
0
223.3
3
225.6
7
226.8
3
225.67 226.8
3
222.1
7
Percent Correct
48.83 35.02 92.84 86.18 97.95 98.98 99.49 98.98 99.49 97.44
Daylight Walking Large
Targets Present
228 228 228 228 228 228 228 228 228 228
Targets Identified
1.67 -0.67* 88.00 15.67 148.6
7
148.6
7
177.8
3
197.67 202.3
3
211.6
7
Percent Correct
0.73 -0.29* 38.60 6.87 65.20 65.20 78.00 86.70 88.74 92.84
Dim Stationary
Large
Targets Present
114 114 114 114 114 114 114 114 114 114
Targets Identified
52.17 69.67 79.00 82.50 101.1
7
94.17 98.83 102.33 98.83 103.5
0
Percent Correct
45.76 61.11 69.30 72.37 88.74 82.60 86.70 89.77 86.70 90.79

Public Safety Communications Technical Report Appendix E Data Tables
U.S. Department of Homeland Security Assessing Video Quality for Public Safety Applications Using Visual Acuity
DHS-TR-PSC-14-02 March 2015 45
Table 9. H.265 Video Data
Scenario Groups
Bit Rate (kbps)
16 32 64 128 256
Resolution CIF VGA CIF VGA CIF VGA CIF VGA CIF VGA
Dark Stationary
Large
Targets Present
114 114 114 114 114 114 114 114 114 114
Targets Identified
2.00 14.83 32.33 32.33 51.00 56.83 59.17 66.17 67.33 67.33
Percent Correct
1.75 13.01 28.36 28.36 44.74 49.85 51.90 58.04 59.06 59.06
Daylight Stationary
Small
Targets Present
114 114 114 114 114 114 114 114 114 114
Targets Identified
30.00 62.67 63.83 56.83 83.67 76.67 80.17 88.33 86.00 93.00
Percent Correct
26.32 54.97 55.99 49.85 73.39 67.25 70.32 77.49 75.44 81.58
Daylight Walking Small
Targets Present
228 228 228 228 228 228 228 228 228 228
Targets Identified
1.67 -6.50* 56.50 5.17 79.83 76.33 99.67 137..0
0
127.6
7
142.8
3
Percent Correct
0.73 -2.85* 24.78 2.27 35.01 33.48 43.71 60.01 55.99 62.65
Dim Walking Large
Targets Present
228 228 228 228 228 228 228 228 228 228
Targets Identified
63.50 57.67 120.6
7
105.5
0
149.8
3
139.3
3
165.0
0
165.00 180.1
7
179.0
0
Percent Correct
27.85 25.29 52.92 46.27 65.72 61.11 72.37 72.37 79.02 78.51
Dark Walking Large
Targets Present
228 228 228 228 228 228 228 228 228 228
Targets Identified
19.17 14.50 57.67 44.83 69.33 64.67 83.33 100.83 95.00 96.17

Appendix E Data Tables Public Safety Communications Technical Report
U.S. Department of Homeland Security Assessing Video Quality for Public Safety Applications Using Visual Acuity
DHS-TR-PSC-14-02 46 March 2015
Table 9. H.265 Video Data
Scenario Groups
Bit Rate (kbps)
16 32 64 128 256
Resolution CIF VGA CIF VGA CIF VGA CIF VGA CIF VGA
Percent Correct
8.41 6.36 25.29 19.66 30.41 28.36 36.55 44.23 41.67 42.18
*These results imply the average viewer had worse performance, than if they simply guessed.
Note: In Figure 24 and Table 10, targets detected and percent correct have been adjusted to
account for guesses made by participants in the study. Also target sizes such as “large” and
“small” are used, and these descriptions correlate to target distances “close” and “small”
respectively.
Figure 24. H.264 Data (9 Charts)

Public Safety Communications Technical Report Appendix E Data Tables
U.S. Department of Homeland Security Assessing Video Quality for Public Safety Applications Using Visual Acuity
DHS-TR-PSC-14-02 March 2015 47

Appendix E Data Tables Public Safety Communications Technical Report
U.S. Department of Homeland Security Assessing Video Quality for Public Safety Applications Using Visual Acuity
DHS-TR-PSC-14-02 48 March 2015
Table 10. H.264 Video Data
Scenario Groups
Bit Rate (kbps)
64 128 256 512 1024 1536
Resolutio
n CIF CIF VGA CIF VGA CIF VGA CIF VGA VGA
Daylight Stationary Large
Targets Present
114 114 114 114 114 114 114 114 114 114
Targets Identified
101.1
6
101.1
6
108.1
6
109.3
3
111.6
6
110.5
0
112.8
3
111.6
6
110.5
0
112.8
2
Percent Correct
88.74 88.74 94.88 95.90 97.95 96.92 98.97 97.95 96.92 98.97
Bright Walking Large
Targets Present
228 228 228 228 228 228 228 228 228 228
Targets Identified
211.6
6
226.8
3
217.5
0
226.8
3
224.5
0
226.8
3
226.8
3
228.0
0
226.8
3
226.8
3
Percent Correct
92.83 99.48 95.39 99.48 98.46 99.48 99.48 100.0
0
99.48 99.48
Daylight Walking Large
Targets Present
228 228 228 228 228 228 228 228 228 228
Targets Identified
179.0
0
209.3
3
214.0
0
217.5
0
218.6
6
215.1
6
222.1
6
218.6
6
221.0
0
224.5
0
Percent Correct
78.5 91.81 93.85 95.39 95.90 94.37 97.44 95.90 96.92 98.46
Dim Stationary Large
Targets Present
114 114 114 114 114 114 114 114 114 114
Targets Identified
87.16 93.00 82.50 102.3
3
97.66 102.3
3
101.1
6
98.83 98.83 101.1
6
Percent Correct
76.46 81.57 72.36 89.76 85.67 89.76 88.74 86.69 86.69 88.74
Dark Stationary Large
Targets Present
114 114 114 114 114 114 114 114 114 114
Targets Identified
32.33 54.50 40.50 70.83 60.33 74.33 77.83 73.16 83.66 84.83

Scenario Groups
Bit Rate (kbps)
64 128 256 512 1024 1536
ResolutionCIF CIF VGA CIF VGA CIF VGA CIF VGA VGA
Public Safety Communications Technical Report Appendix E Data Tables
U.S. Department of Homeland Security Assessing Video Quality for Public Safety Applications Using Visual Acuity
DHS-TR-PSC-14-02 March 2015 49
Percent Correct
28.36 47.80 35.52 62.13 52.92 65.20 68.27 64.18 73.39 74.41
Daylight Stationary Small
Targets Present
114 114 114 114 114 114 114 114 114 114
Targets Identified
63.83 83.66 97.66 93.00 103.5
0
100.0
0
105.8
3
98.83 108.1
6
105.8
3
Percent Correct
55.99 73.39 85.67 81.57 90.78 97.71 92.83 86.69 9488 92.83
Daylight Walking Small
Targets Present
228 228 228 228 228 228 228 228 228 228
Targets Identified
96.16 139.3
3
152.1
6
154.5
0
176.6
6
158.0
0
189.5
0
160.3
3
200.0
0
198.8
3
Percent Correct
42.18 61.11 66.73 67.76 77.48 69.29 83.11 70.32 87.71 87.20
Dim Walking Large
Targets Present
228 228 228 228 228 228 228 228 228 228
Targets Identified
84.50 139.3
3
118.3
3
174.3
3
170.8
3
202.3
3
186.0
0
210.5
0
201.1
6
201.1
6
Percent Correct
37.06 61.11 51.60 76.46 74.92 88.74 81.57 92.32 88.23 88.23
Dark Walking Large
Targets Present
228 228 228 228 228 228 228 228 228 228
Targets Identified
55.33 76.33 44.83 111.3
3
83.33 131.1
6
113.6
6
128.8
3
126.5
0
118.3
3
Percent Correct
24.26 33.47 19.66 48.83 36.54 57.52 49.85 56.50 55.48 51.90