task force on the future of off-track betting in new york
TRANSCRIPT

Task Force on the Future of Off-Track Betting
In New York State
A Report to
The Governor and
The Legislature
Of the State of New York
Regarding
The Optimal Utilization of the State's Regional Off-Track Betting System
to Raise Revenues for State and Local Governments and
Strengthen The Racing and Breeding Industries in New York.
January 13, 2010

Table of Contents
Page
I. EXECUTIVE SUMMARY 1-3
II. INTRODUCTION 4
A. Status of Off-Track Betting in New York State 5-7
B. The Stake Holders 8-10
C. Market Conditions 11
D. Regulatory Framework 12-13
E. Profits and Losses 14
i. New York City Off-Track Betting Corporation 15-16
ii. Other New York OTBs 16-17
iii. GASB 45 17-18
iv. The New York Racing Association Inc. 18-19
v. Other New York Tracks 19
III FACTS AND FIGURES
A. Legislative History 20-22
B. Regulatory Framework in Other Jurisdictions 23
C. Report on Racing Data 24
D. Advance Deposit Wagering (ADW)
i. A Short History of the Growth of ADWs 25
ii. ADWs and New York State 26
E. OTB Distributions
I. Distributions to Municipalities 27-28
a. Capital OTB
b. Catskill OTB
c. Nassau OTB
d. New York City OTB
e. Suffolk OTB
f. Western OTB
i
Table of Contents (continued)
IV. THE OFF-TRACK BETTING CORPORATION’S POSITION
A. Organizational Structure 29
B. Assets, Liabilities and Undistributed Benefits 29-30
(aka Balance Sheet)
C. Section 516 Net Revenues (aka Profit and (Loss)) 30
D. Legislative Proposals 30
E. Summary of Comments Received 31
a.
V. CONCLUSION 32
VI. RECOMMENDATIONS 33-37
A. Legislative
B. Non-Legislative
VII. TASK FORCE MEMBERS 38
VIII. ATTACHMENTS
I. Summary of Survey of Other States/Jurisdictions
Handling of OTBs 39
II. Total Handle By Regional Off-Track Betting Corporations
Since Inception 40
III. Summary of Rates Paid by Off-Track Betting Corporations
For Taking Bets on Various Tracks’ Races 41
IV. New York State Race Tracks Video Gaming Statistics 42-54
V. New York State Regional Off-Track Betting Corporations 55-112
Financial Analysis for 2004 – 2008
Uniform Quarterly Report Summaries for 2004 – 2008
of:
Income Statement Comparison by year
Balance Sheet Comparison by year
Income Statement five year summary by OTB
Balance Sheet five year summary by OTB
ii

Table of Contents (continued)
VI. New York State Race Tracks 113-140
Annual Report Summaries for 2004 – 2008 of:
Income Statement Comparison by year
Balance Sheet Comparison by year
Income Statement five year summary by Track
Balance Sheet five year summary by Track
VII. Off-Track Betting Corporations Summary of Operations 141
VIII. Minutes of Meeting of the May 14, 2009 Task Force on the
Future of Off-Track Betting in New York State 142-145
IX. Minutes of Meeting of the June 24, 2009 Task Force on the
Future of Off-Track Betting in New York State 146-149
X. Minutes of Meeting of the July 30, 2009 Task Force on the
Future of Off-Track Betting in New York State 150-154
XI. Minutes of Meeting of the August 20, 2009 Task Force on
the Future of Off-Track Betting in New York State 155-159
XII. Minutes of Meeting of the October 5, 2009 Task Force on
the Future of Off-Track Betting in New York State 160-163
XIII. Summary of Comments Received From Bettors & Fans 164-168
XIV. Summary of Comments Received From Breeders 169
XV. Summary of Comments Received From Horsemen 170-171
XVI. Summary of Comments Received From Municipalities 172-177
XVII. Summary of Comments Received From OTBs 178-186
XVIII. Summary of Comments Received From Totalisator Providers 187-188
XIX. Summary of Comments Received From The Tracks 189-193
iii

I. Executive Summary
The Governor and Legislature directed the Task Force on the Future of Off-Track
Betting to study the State’s off-track betting system and make recommendations to
improve its operations and increase revenues for state and local governments (Chapter
115 of the Laws of 2008). Racing is of critical importance to the State. Its economic
value to the State has been quantified by a wide variety of economic experts when
estimating the size of the farms, the total value of New York State agribusiness, travel
and tourism generated by racing and breeding and other equine related businesses.
Regardless of the precise value of the industry, just considering the inputs alone, it is
fair to say the industry is vital to the State.
Horse racing has been labeled as a dying sport by many, however, nationally more is
wagered on horse racing in North America then is spent on movie tickets. The reality is
racing is vital to the State and while the business trends are decidedly negative, the
situation is still one that can be fixed.
The State’s off-track betting corporations have been experiencing significant declines
in benefits distributed to localities over the past several years as less money is being
wagered with them. As the OTBs struggle with less revenue being generated from
wagering, operating costs are increasing and their financial viability continues to
deteriorate. The problems the OTBs are experiencing are further exacerbated by the
current extended recession the country has been in for over three years. This overall
decline threatens the entire off track betting system, whose viability is closely
correlated with the overall health of the racing industry in New York State.
Currently the State’s off-track betting system accepts over $1.8 billion of bets annually
which is approximately 18% of the total amount wagered on horse racing in the United
States.
The New York Racing Association (NYRA) also relies on the NYS OTB system.
Approximately 22% of the total amount wagered annually on NYRA races occurs at a
NYS OTBs. In addition a total of $710 million is bet at the NYS OTBs on all New
York races in total every year.
In order to conduct a thorough review, the Task Force held several meetings throughout
the State, solicited comments from all industry participants and local governments and
performed a complete analysis of the State’s off-track betting system finances and
operations. There was broad participation with the only notable exception being
NYCOTB who presented absolutely no information. This was particularly ironic since
the Task Force was formed, in part, because of their inability to stay solvent.
While each stakeholder stressed changes that were of most importance to their
particular group, the single most frequent recommendation from all of the State’s
industry participants was to regulate out-of-state account wagering providers. In
addition, the OTBs and the participating municipalities called for an end to the
maintenance of effort, hold harmless and other statutory payments as well as
authorization for them to conduct video gaming. The tracks and others called for the
consolidation of OTBs. Most joined in recommending the creation of a statewide racing
1

television channel, statewide marketing program, statewide totalisator and an account /
internet wagering platform. The bettors’ / fans’ most frequent re-occurring
recommendation was a call to improve customer service.
The Task Force recommendations are based on the testimony presented, the facts that
were assembled and included in the appendixes and each member’s personal
experience.
Summary of Recommendations
The recommendations have been compiled by the Task Force as both legislative and
non-legislative.
Legislative
1. Amend the Racing Law to centralize and consolidate repetitive business
functions that currently compete against each group (all the OTBs and tracks),
under one central office owned / operated by the regional OTBs. Marketing,
televised racing channel, account wagering/ internet and totalisator operations
need to be consolidated to provide cost efficiencies and produce a cohesive state
wide approach for the benefit of all participants.
2. Amend the Racing Law to require out-of-state advance deposit wagering
operators who accept wagers from New York residents to be licensed by the
State and to pay similar statutory amounts that New York State operators are
required to pay.
3. Amend the Racing Law that currently mandates some payments and leaves some to
negotiation, to set a single rate for each NYS track that the OTBs would pay. This
would eliminate the distinction on what the tracks charge for exporting their
simulcast signal to out of state purchasers as well. Those entities and states which
refuse to pay the higher rates would be denied access to the total NYS platform.
(OTBs, NYS tracks and all licensed ADWs). This move would increase the value
of the signal and the NYS platform.
4. Amend the Racing Law to give participating municipalities the option to lock
into payments they currently receive at hold harmless levels of 2008 revenues
but to relinquish control of the regional OTB’s or keep benefit distribution as it
is. Those municipalities that “opt in” would be guaranteed payments based upon
a base year, ensuring continuity in their budgetary process.
5. Amend the Racing Law to allow the OTBs to carry forward and carry back
reported quarterly losses incurred in the same fiscal year.
6. Amend the Racing Law to eliminate the restrictions on in-home simulcasting as
currently provided for under Section 1003 and allow unrestricted in-home
simulcasting to tracks and OTBs including the authority for internet video
streaming.
7. Amend the Racing Law to eliminate the maintenance of effort and hold
harmless payments to those tracks with video gaming operations that have been
in operation for twenty-four months or more.
2

8. Amend the Racing Law to eliminate dark day payments to those tracks with
video gaming operations that have been in operation for twenty-four months or
more.
9. Amend the Racing Law to require the OTBs to prominently display and give
preference in all branches and simulcasting (including in-home) to all live NYS
races.
10. Amend the Racing Law Section 527.5-a to eliminate the payment of one half of
one percent of regular and multiple bets to tracks which have had video gaming
operations for twenty-four months or more for capital improvements.
11. Amend the Racing Law to clarify the Racing and Wagering Board’s regulatory
authority over NYCOTB to ensure that regulatory actions are consistently
applied and that there is no bias, real or perceived, shown in deference to any
entity.
12. Should the above recommendations not be implemented, then privatizing the
off-track betting corporation’s branch operations should be seriously
considered. Revenues from the sale / franchise agreements should be allocated
to the participating municipalities and the private operator will be required to
continue payments to the participating municipalities. A central statewide entity
owned by the participating municipalities would continue to operate and
manage marketing, a televised racing channel, account wagering/ internet and
totalisator operations.
Non-Legislative
13. Streamline management – Significant savings must be achieved now by
consolidating and streamlining management operations.
14. Reduce Cost – It is imperative that the OTBs, particularly New York City OTB,
reduce branch and corporate expenses especially employee benefits.
15. The Task Force recommends that the OTBs adopt uniform reporting standards
for GASB 45 expenses and determine how this liability will be funded.
16. Co-opetition - While the OTB and the tracks are competing for the same racing
dollar both entities have a decided common goal of promoting racing that mutually
benefit each other. Combining and unifying marketing efforts would provide a
benefit to both organizations. The larger the number of people who follow racing,
the greater the benefit to each group. This common goal can be supported even in a
competitive framework.
17. Marketing / Promotion & Customer Service – Work with the three largest cable
operators to have statewide conformity on a channel platform. Set the same two
channels aside throughout the State for marketing / promotion and customer
service. A cohesive marketing and customer service plan must be initiated
immediately.
3

II. Introduction
The Task Force on the Future of Off-Track Betting was created by Section 26 of Chapter
115 of the Laws of 2008 as part of sweeping reform to begin to overhaul Off-Track
Betting in New York State1. The money generated by off-track betting (OTB) directly
funds the racing and breeding industries, as well as local municipalities, all of which have
become reliant on this revenue. With a troubled economy and rapidly decreasing handle,
the financial stability of the OTBs continues to erode and adversely affect the racing and
breeding industry as well as the local municipalities it is meant to support.
The Task Force was charged to analyze and make recommendations concerning the
optimal utilization of the state's regional off-track betting system with an emphasis on the
system's capability to raise revenues for state and local governments and strengthen the
racing and breeding industries in New York. To do this, comments, suggestions and
recommendations were solicited from representatives of each of the state's regional off-
track betting corporations, representatives of local governments, thoroughbred and
harness racetrack operators, horsemen and breeders, operators of video lottery terminals
at various tracks, totalisator companies serving the pari-mutuel industry, the New York
State American Federation of Labor-Congress of Industrial Organizations, out of state
advance deposit wagering providers as well as fans and bettors.
In addition to soliciting written comments the Task Force also held a series of five public
meetings throughout the State to provide opportunity for individuals to present and
discuss various issues. The meetings focused on the current and future pari-mutuel
marketplace with respect to off-track wagering, legislative and regulatory issues, the
industry's changing competitive environment, the economic contributions of the racing
and breeding industries to New York and its communities as well as the necessity for
regulation of out-of-state advance deposit wagering providers that are engaged in the
business of accepting pari-mutuel wagering on horse racing from persons within New
York State.
1 Mayor Bloomberg was considering closing New York City Off-Track Betting Corporation due to its large
operating losses. Included in the same chapter amendment that created the Task Force the State took over
operations of New York City Off-Track Betting Corporation and changed statutes to provide more
revenues for operations from surcharge.
4

Status of Off-Track Betting in New York State
The above chart shows that from 1971, the year off-track betting began operations in
New York, statewide handle exploded from approximately $1.7 billion to approximately
$2.7 billion by 1976. That’s a 59% increase in just a little over five years. During this
same time on track handle at the States’ racetracks remained fairly constant. Off-track
betting was clearly bringing new money into the system but attendance at the tracks
began to decline dramatically.
Pari-mutuel handle in New York State continued a steady upward trend through 1986
when the State hit its all time high of about $3.4 billion. Beginning in 1986, the tracks
began to experience sharp declines in pari-mutuel handle from which they have never
recovered. However, off-track betting handle continued to be fairly strong up to 2001.
Figures obtained from the Jockey Club Fact Book report total US handle in 2008 at $13.6
billion. Comparing this to 1999 reported handle, adjusted for inflation, there is 22%
decrease over the past ten years. There is a 33% decrease in New York State Handle
during this same time period, which is a much worse decline when compared to national
trends. However, since New York State accounts for almost 18% of the reported total US
handle it is obvious that New York trends will have a significant impact on the total
national trends. Therefore, by removing New York handle from the US figures the rest of
the nation reports only a 20% decrease in handle, adjusted for inflation. In comparing the
5

New York ten year trends to the rest of the country, the decrease in New York’s handle,
adjusted for inflation, is 45% worse then the rest of the nation2. (See Table I)
TABLE I
With the decrease in handle the OTBs are experiencing a similar decrease in revenues,
while expenses continue to increase, resulting in less net revenue available to distribute to
participating municipalities.
Distributions to OTB’s participating municipalities have been declining sharply over the
past five years3 as handle continues to decline and expenses increase. New York City
2 John Signor, President of Capital OTB, disagrees with this comparison and refers to Charles Vickery’s,
economic analysis regarding this matter. Mr. Vickery believes that the trends in this chart are skewed by
removing NYS from the reported national handle. The analysis they presented reports that NY handle
trends follow national trends by removing ADW handle from their calculation. They believe that the
growth in ADW handle reported in Oregon during this time period should be considered.
6

Off-Track Betting Corporation has not been timely paying statutory amounts for the past
several years and filed for bankruptcy protection on December 3, 2009.
The current recession the country is experiencing further underscores the urgency of the
matter as businesses, local governments and the State search for money to fund their
operations.
3 Distributions to the participating municipalities of Western Regional Off-Track Betting have been
increasing during this time due to the video gaming operations that began at Batavia Downs in May 2005.
7
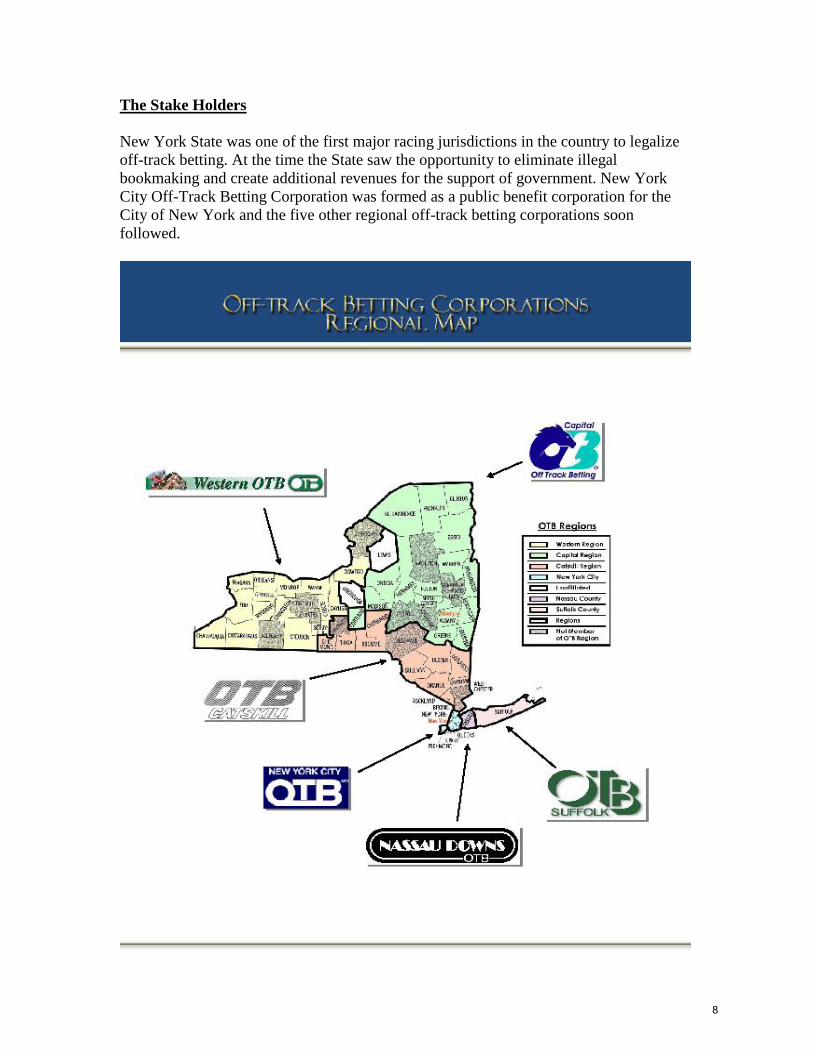
The Stake Holders
New York State was one of the first major racing jurisdictions in the country to legalize
off-track betting. At the time the State saw the opportunity to eliminate illegal
bookmaking and create additional revenues for the support of government. New York
City Off-Track Betting Corporation was formed as a public benefit corporation for the
City of New York and the five other regional off-track betting corporations soon
followed.
8

The following chart lists all the OTBs and tracks in New York State.
Regional Off-Track
Betting Corporations
Harness Tracks
Thoroughbred Tracks
Capital OTB Batavia Downs Finger Lakes Race Track
Catskill OTB Buffalo Raceway Aqueduct Raceway - NYRA
Nassau OTB Monticello Raceway Belmont Park - NYRA
New York City OTB Saratoga Raceway Saratoga Racecourse -
NYRA
Suffolk OTB Tioga Downs
Western OTB Vernon Downs
Yonkers Raceway
With the creation of the off-track betting corporations local municipalities who elected to
participate in the off-track betting regions now became partners in the business and began
to receive net revenues from the OTB operations and eventually surcharge income as
well. There are 51 local governments that participate with the regional off-track betting
corporations.
9

Participating Municipalities / Counties By OTB Capital Catskill Nassau New York City Suffolk Western
Albany County Broome County Nassau County City of New York Suffolk County Cattaraugus County
City of Albany Chemung County Cayuga County
City of Schenectady Chenango County Chataugua County
Schenectady County Dutchess County City of Buffalo
Clinton County Orange County Erie County
Columbia County Putnam County Genesee County
Cortland County Rockland County Livingston County
Essex County Sullivan County City of Rochester
Franklin County Tioga County Monroe County
Fulton County Ulster County Niagara County
Greene County Orleans County
Herkimer County Oswego County
Madison County Schulyer County
Montgomery County Seneca County
Oneida County Steuben County
Rensselaer County Wayne County
City of Rensselaer Wyoming County
City of Troy
St. Lawrence County
Warren County
Washington County
With on track handle and attendance being depleted, the New York harness and
thoroughbred tracks, breeding funds and horsemen have steadily become dependent on
the States regional off-track betting corporations.
In addition to localities, the OTBs also support two breeding funds:
The Agriculture and New York State Horse Breeding Development Fund receives
approximately $4.5 million annually from the OTBs which is 24% of its revenue
(10% from NYCOTB alone) that is used to fund the harness breeding program.
The NYS Thoroughbred Breeding and Development Fund receives approximately
$8.7 million annually from the OTBs which is 74% of its revenue (38% from
NYCOTB alone) that funds the thoroughbred breeding program.
10

Market Conditions
Pari-mutuel wagering on harness and thoroughbred racing is on a decline largely because
competition for New Yorker’s decreasing amount of disposable income continues to
grow from casino gaming and other forms of entertainment. This decline has led to
OTB’s failure to grow handle, which has had disastrous effects on their organizations.
Part of the decline is due to the availability of VLT’s at New York tracks. Its ironic that
one of the very reasons the industry blames for its decline in handle was authorized to
save the State’s racetracks. Video gaming revenues pump millions of dollars into purses,
breeding programs4 and renovations to the aging track facilities.
The amount bet at various video gaming outlets at the tracks in New York has increased
from $2.4 billion in 2004 to $11.5 billion in 2009, with $6 billion being bet at Yonkers
alone. In 2008 video gaming provided approximately $18.7 million to purses in the State.
These figures are sure to dramatically increase when video gaming operations begin at
Aqueduct. See ATTACHMENT IV for a summary of video gaming statistics at the New
York Tracks from 2004 to 2008.
Despite the cash infusion that video gaming has brought, management of the various New
York track’s continue to ineffectively deal with further attritions in their handle and
attendance as younger individuals continue their migration to other forms of
entertainment and gambling5.
The industry responded to these challenges by expanding account wagering services
offered via telephone with internet and other wireless wagering opportunities. Advanced
deposit wagering companies (“ADWs”) began to open in “regulatory friendly”
jurisdictions to offer interactive and convenient wagering opportunities. These companies
have little overhead expenses and a benign to non-existent regulatory framework. These
two factors along with pricing arbitrage (buy the signal at a negotiated rate and “rebating”
some of the difference back to the customers) have laid the ground work for impressive
growth. In 2006 the State authorized internet wagering but the regional off-track betting
corporations have been slow in developing and offering this service, while the out-of-
state ADWs continue to aggressively market their services. A description of the history of
ADWs can be found later in the report in Section III, D.
4 The Agriculture and New York State Horse Breeding Development Fund revenues have been strong
because of money coming in from the harness tracks video gaming operations. The Thoroughbred Breeding
and Development Fund, however, has been experiencing significant declines in revenues while waiting for
video gaming operations to begin at Aqueduct. (see note 5) 5 The New York Racing Association (“NYRA”) is the only remaining New York racing entity that does not
have video gaming machines at any of its three facilities. While authorized for video gaming machines
since 2001, Aqueduct racecourse has yet to begin operations as a lengthy and complicated vendor selection
process continues. NYRA also operates Saratoga, the largest New York racing facility that draws young
fans and continues to enjoy good attendance.
11

Regulatory Framework
The State’s constitution generally prohibits gambling except for certain forms that serve
the public interest. Gambling on horse racing is one of those exceptions, to provide a
reasonable amount of revenue for the support of government. The conduct of gambling is
therefore illegal unless specifically authorized by the Constitution, under State law and
regulated. The main governing statute for off-track betting in New York State can be
found in Article V and Article X of the Racing, Pari-Mutuel Wagering and Breeding
Laws. The off-track betting corporations are allowed to operate under a plan of operation
approved by the New York State Racing and Wagering Board6 (“The Board”). Any
changes or amendments to the plan must be approved by the Board before they may be
implemented.
Section 1003.2 of the Racing Law provides that the corporation’s plan of operation must
include:
a. A feasibility study denoting the revenue earnings expected from the simulcast
facility and the costs expected to operate such facility. No feasibility study
shall be received for a simulcast facility that is applying to renew its license.
The form of the feasibility study shall be prescribed by the board and may
include:
(i) the number of simulcast races to be displayed;
(ii) the types of wagering to be offered;
(iii) the level of attendance expected and the area from which such
attendance will be drawn;
(iv) the level of anticipated wagering activity;
(v) the source and amount of revenues expected from other than
pari-mutuel wagering;
(vi) the cost of operating the simulcast facility and the identification
of costs to be amortized and the method of amortization of such
costs;
(vii) the amount and source of revenues needed for financing the
simulcast facility;
(viii) the probable impact of the proposed operation on revenues to
local government;
b. The security measures to be employed to protect the facility, to control
crowds, to safeguard the transmission of the simulcast signals and to control
the transmission of wagering data to effectuate common wagering pools;
c. The type of data processing, communication and transmission equipment to be
utilized;
d. The description of the management groups responsible for the operation of the
simulcast facility;
e. The system of accounts to maintain a separate record of revenues collected by
the simulcast facility, the distribution of such revenues and the accounting of
costs relative to the simulcast operation;
6 New York State Racing, Pari-Mutuel Wagering and Breeding Law Section 1003.
12

f. The location of the facility and a written confirmation from appropriate local
officials that the location of such facility and the number of patrons expected
to occupy such facility are in compliance with all applicable local ordinances;
and
g. The written agreements and letters of consent between specified parties
pursuant to sections one thousand seven, one thousand eight and one thousand
nine of this article.
Therefore, the OTBs are statutorily required to obtain Board approval for virtually
anything that they do and must not only adhere to the law but also strict rules and guide
lines issued by the Board.
13

Profits and Losses
Currently in New York there are seven harness tracks in operation, four thoroughbred
tracks and six regional off-track betting corporations with approximately 264 wagering
locations throughout the State. New York City Off-Track Betting Corporation handles
approximately half of the State’s total pari-mutuel wagering activity. Approximately 38%
of the total amount bet on thoroughbred racing in New York is bet on New York Racing
Association races. (See TABLE II)
TABLE II NEW YORK STATE REGIONAL OFF-TRACK BETTING CORPORATIONS
TOTAL FACILITY HANDLE BY TRACK AND REGION
2008 Capital Catskill Nassau New York City Suffolk Western All Regions
New York State Thoroughbred:
NYRA: Aqueduct 22,828,242 12,342,837 42,479,181 113,982,551 26,174,585 12,347,858 230,155,254
Belmont 24,762,108 12,611,127 38,523,787 111,446,795 25,347,627 11,627,044 224,318,488
Saratoga 18,990,386 5,353,400 16,314,275 46,436,907 10,562,116 5,080,297 102,737,381
Total NYRA 66,580,736 30,307,364 97,317,243 271,866,253 62,084,328 29,055,199 557,211,123
Finger Lakes 7,581,438 3,679,630 5,794,697 18,370,779 3,938,472 10,854,296 50,219,312
Handle on NYS
Thoroughbred Tracks
74,162,174 33,986,994 103,111,940 290,237,032 66,022,800 39,909,495 607,430,435
New York State Harness:
Batavia 137,507 82,790 79,542 453,843 83,724 2,392,947 3,230,353
Buffalo 218,678 165,054 175,318 904,048 140,296 2,844,482 4,447,876
Monticello 2,879,026 4,358,194 3,622,145 12,578,936 2,507,687 3,261,878 29,207,866
Saratoga 3,416,361 859,427 786,001 428,811 750,689 1,308,696 7,549,985
Syracuse Mile - - - - - - -
Vernon 763,844 141,682 - 549,527 - 745,518 2,200,571
Tioga 88,349 308,313 219,296 382,733 161,923 187,214 1,347,828 Yonkers 3,323,016 5,114,777 6,663,724 30,589,391 5,311,549 3,346,480 54,348,937
Handle on NYS Harness
Tracks
10,826,781 11,030,237 11,546,026 45,887,289 8,955,868 14,087,215 102,333,416
Handle on All New York
State Tracks
84,988,955 45,017,231 114,657,966 336,124,321 74,978,668 53,996,710 709,763,851
Out-of-State Thoroughbred 86,345,668 55,911,771 137,588,226 507,389,268 81,158,906 53,475,235 921,869,074
Out-of-State Harness 15,420,783 17,897,485 25,307,285 84,615,068 19,309,801 23,535,938 186,086,360
Handle on Out-of-State
Tracks
101,766,451 73,809,256 162,895,511 592,004,336 100,468,707 77,011,173 1,107,955,434
Special Event Races:
Breeders Cup 1,561,194 647,206 1,096,574 4,271,405 653,560 735,698 8,965,637
Kentucky Derby 1,428,982 1,645,079 2,131,803 5,343,351 1,642,147 1,472,731 13,664,093
Preakness Stakes 798,892 750,764 1,175,833 2,474,947 847,862 769,371 6,817,669
Handle on Special Event
Races
3,789,068 3,043,049 4,404,210 12,089,703 3,143,569 2,977,800 29,447,399
Total NYS OTB Handle on
All Tracks
190,544,474 121,869,536 281,957,687 940,218,360 178,590,944 133,985,683 1,847,166,684
Analysis Amount bet on NY Tracks 45% 37% 41% 36% 42% 40% 38% Amount bet on Out - of -
State Tracks
55% 63% 59% 64% 58% 60% 62%
Total 100% 100% 100% 100% 100% 100% 100%
Source: Quarterly Reports Filed with the New York State Racing and Wagering Board Pursuant to Section 524 of the Racing Law.
New York City Off-Track Betting Corporation and the New York Racing Association are
clearly the two leading racing entities in the State, unfortunately they are also the two
entities in the State in the worse financial condition, both are seeking legislative action to
survive. In fact NYCOTB just filed for bankruptcy protection while NYRA recently
emerged from bankruptcy.
14
New York City Off-Track Betting Corporation
New York City Off-Track Betting Corporation’s financial decline has gotten so bad that
it filed for bankruptcy protection on December 3, 2009. A summary of key financial
statistics is listed in TABLE III below. The decline in net revenue from racing, after
paying statutory amounts, is slightly less than the decline in handle. Payments that
NYCOTB makes to in-state tracks for taking bets on their races (known as direct
payments) are on average about 6.39%7, while the amounts NYCOTB pay to out of state
tracks are about 1.88% to 3.75% (see Attachment III). NYCOTB also has to pay the NYS
tracks various statutory payments for taking bets on out of state races8 and bets on New
York tracks that are outside of an OTB’s region9. NYCOTB pays about 6.10%
10 of
regional payments to the NYS tracks on out-of-state signals and about .21%11
to their in-
state regional tracks for taking bets on NYS tracks out of their region. These payments
are generally referred to as regional payments.
When you combine the direct payments, regional payments and contractual payments
(see TABLE IV) it is easy to see that it is more economical for the NYCOTB to accept
wagers on out of state tracks than on in state tracks. 64% of New York City Off-Track
Betting’s handle is on out of state wagers (See Table II). As NYCOTB take bets more
and more on out of state tracks their net racing revenue, revenue from simulcasting after
statutory and contractual payments, will increase. This explains why the net racing
revenue has decreased less than handle, as reported in TABLE III.
The major problem for New York City Off-Track Betting Corporation, other than
decreasing handle, is the huge increase in operating expenses. The largest increase in
reported expenses is from the new accounting standard issued by the Governmental
Accounting Standards Board known as GASB 45. (GASB 45 is explained in a following
section of this report.)
The New York State Comptroller’s Office assessed NYCOTBs financial condition after
the State took it over and issued a report in August 2009. The report concluded that
NYCOTB needs to reduce costs by studying and adjusting staffing levels and reviewing
and adjusting other items such as consultant contracts, simulcast contracts and the
corporate fleet of 87 vehicles12
.
7 Direct payments NYCOTB made to NY tracks in 2008 were $21,464,031. The amount of handle the
NYCOTB had on NY racing for 2008 was $336,124,321 which is 6.39%. 8 Racing Law Sections 1015, 1016, 1017 and 1018.
9 Racing Law Sections 1008/527 and 1009.
10 Regional payments NYCOTB made to its regional NY tracks in 2008 under Sections 1015, 1016, 1017
and 1018 were approximately $36,828,923. Total out of state handle for 2008 was $604,094,039 which is
6.10%. 11
Regional payments NYCOTB made to NY tracks in 2008 under Sections 1008/527 and 1009 were
$689,921 and handle on NYS Tracks was $336,124,321 which is .21%. 12
Office of the New York State Comptroller Report 2008-S-147, New York City Off-Track Betting
Corporation, An Assessment of NYC Off-Track Betting Corporation’s Financial Condition and
Governance.
15

While the decrease in handle is a serious problem that must be addressed, New York City
Off-Track Betting Corporation must look to decrease expenses to survive. However,
decreasing expenses, while necessary, is not sufficient to save NYCOTB. Other changes
are required.
TABLE III
2004 2008 Difference % of Change
Total Net Handle 1,036,088,072 940,218,360 95,869,712 -9.25%
Net Racing Revenue 99,862,747 91,357,950 8,504,797 -8.52%
Operating expense 124,949,843 190,992,999 (66,043,156) 52.86%
516 Net Revenue / (Loss) (10,625,123) (79,802,715) 69,177,592 -651.08%
Total Surcharge to Localities 19,900,264 10,779,613 9,120,651 -45.83%
Total Section 516 Net Income /(Net
Loss), Surcharge & Capital
Acquisition Fund 13,142,398 (58,788,506) 71,930,904 -547.32%
Source: Quarterly Reports Filed with the New York State Racing and Wagering Board Pursuant to Section 524 of the Racing Law.
New York City Off-Track Betting Corporation
TABLE IV
New York City OTB
In State Tracks
Out-of-State
Tracks
Direct Payments 6.39% 0.00%
Regional Payments 0.21% 6.10%
Contractual Payments* 2.55% 2.44%
Total 9.15% 8.54% * The methodology for arriving at the rates is explained in footnotes #7 through #11 on the previous page.
Other New York OTBs
While the financial results for each of the OTBs over the past five years vary, the one
similar trait they all share is a decrease in racing revenue caused by a decrease in handle.
ATTACHMENT V provides a financial summary of each off-track betting corporation
from 2004 to 2008. Some individual key statistics are:
Capital OTB’s distributions to its participating municipalities has declined about
25%, with approximately half of the decline attributed to reduced surcharge and
16

half to Section 516 net income13
caused by reducing revenue after statutory
payments. Statutory payments for the regulatory fee and in-state harness tracks
increased while handle declined.
Catskill OTB’s distributions to its participating municipalities also decreased
about 39% with most of the decline attributed to reduced net racing revenue after
statutory payments. Statutory payments for the regulatory fee increased while
handle declined. Payments to in-state harness tracks increased as did in-state
harness handle.
Nassau OTB’s distributions to its participating municipalities have declined about
60% mainly due to decreased Section 516 net revenues. This decrease is
attributed to two main factors. One being reduced net racing revenue after
statutory payments caused by increased regulatory fees. The second reason is that
corporate expenses increased approximately 35% while branch expenses
increased about 4%.
Suffolk OTB’s distributions to its participating municipalities have declined about
65% mainly due to decreased Section 516 net revenues. Most of the decline is
attributed to reduced net racing revenue after statutory payments. Statutory
payments for the regulatory fee increased as did rental expenses.
Western OTB’s distributions to its participating municipalities increased during
this period almost 200%. Western is the only OTB in the State that owns a race
track, Batavia Downs which operates video gaming. While Western’s net racing
revenue decreased about 10% with a corresponding drop in surcharge, profits
from the video gaming operation increased over 300% thereby more than
offsetting the racing losses.
GASB 45
At the same time the off-track betting corporations have been experiencing significant
decreases in revenue from decreased wagering activity, they have been required to adopt
Governmental Accounting Standards Board Statement 45 (“GASB 45”). This accounting
pronouncement requires governmental entities, including public benefit corporations such
as the State’s regional off-track betting corporations to record the estimated cost of
offering their employees post-employment benefits such as health insurance. In the past
these costs were recorded when paid but GASB 45 now requires these entities to record
the estimated cost when the benefits are earned.
This has had the most significant impact on New York City Off-Track Betting
Corporation as they offer the most post-employment retirement benefits of all the OTBs.
For example, New York City OTB’s reported net loss for 2008 was $58.7million which is
nearly the same amount of the GASB 45 post employment benefit expense reported for
the same year. New York City Off-Track Betting Corporation’s GASB 45 expense was
13
Section 516 net revenue is the net revenue remaining after the OTB pays all costs of its operations. A
complete description of Section 516 net revenue can be found in Section 516 of the Racing Law.
17

$115 million in 2006, $21.4 million in 2007 and $58.7 million in 2008. NYCOTBs
reported accumulated deficit at the end of 2008 was $248.7 million, almost $200 million
of that is caused from unfunded post-employment retirement benefits for its employees14
.
GASB 45 expenses reported in 2008 for Suffolk OTB were $3 million; Nassau OTB $1.1
million; Western OTB $1 million; Capital OTB $48,000 and none for Catskill OTB. The
OTBs have not uniformly applied GASB 45. NYCOTB and Capital OTB report the
amounts under operating expenses and are taken into account for arriving at Section 516
net revenue. Nassau, Suffolk and Western report the GASB 45 amount, but do not
include it to arrive at the Section 516 net revenue that is distributed to its municipalities.
Catskill OTB reportedly has no GASB 45 expense to report.
The reporting of the GASB 45 expenses by NYCOTB is technically the reason that it has
been required to file for bankruptcy protection. If NYCOTB had continued to record the
costs only when paid, it could have continued to appear financially distressed, not
insolvent. The regional OTBs must be required to uniformly report the GASB 45
expenses so that a complete picture of their situation is known.
The New York Racing Association Inc.
The New York Racing Association Inc.’s (“NYRA”) financial difficulties have been well
documented over the years. NYRA went through a series of what appeared to be fatal
steps beginning in 2003 when it was indicted in a conspiracy to defraud the United States
Government in a massive tax evasion scheme it participated in to help its mutual
department tellers evade paying income taxes. NYRA entered into a deferred prosecution
agreement which it successfully emerged from in late 2005. In November 2006 NYRA
then filed for bankruptcy protection. During this same time NYRA’s exclusive franchise
to run racing at the State’s three premier thoroughbred tracks was set to expire and the
State was seeking proposals from several entities. In the fall of 2008 NYRA successfully
emerged from bankruptcy and was awarded a 25 year franchise to continue its racing
operations.
NYRA continues to struggle financially from its ever dwindling handle and track
attendance figures. As a result it has become increasingly more dependent on the
statutory monies it receives from the NYS OTB’s, particularly NYCOTB. NYRA has
made efforts to increase revenues and was the State’s first authorized pari-mutuel
wagering entity to offer internet wagering. NYRA has grown its account wagering
operations significantly but the amounts are still too small to fund the operating deficits
from live racing. State negotiations continue in an effort to select an operator for video
gaming operations at Aqueduct but appear to be stalled yet again. Without a new source
of revenue, such as video gaming, NYRA will surely be back in financial trouble very
shortly. Should NYCOTB fail to make statutory payments to NYRA, NYRA’s financial
viability would be further exacerbated.
14
See Attachment V, NYCOTBs Balance Sheet at 12/31/2008.
18

TABLE V
2004 2007* Differnce % of Change
Total Net Handle 460,276,349 429,421,474 30,854,875 -6.70%
Net Racing Revenue 287,530,000 277,991,000 9,539,000 -3.32%
Operating expense 300,908,000 298,465,000 2,443,000 -0.81%
Net Income / (Loss) (15,988,000) (34,278,000) 18,290,000 -114.40%
Source: Audited Financial Statements Filed with the New York State Racing and Wagering Board.
Audited statements for 2008 are not available.
The New York Racing Association Inc.
Other New York Tracks
Finger Lakes Racetrack and the State’s seven harness tracks have generally experienced
significant financial stability from video gaming operations at their facilities, although
some continue to struggle. The tracks have been able to increase purses and renovate
their facilities with the new stream of video gaming revenues now available to them.
Monticello Raceway, however, has been experiencing significant financial stress as both
racing and video gaming revenues decline. Both Vernon Downs and Buffalo Raceway
struggle because of competition from Native American casino gaming sites near their
facilities.
ATTACHMENT VI provides a financial summary of each New York track from 2004 to
2008. The first ten pages of this schedule report each track by year providing a
comparison of their performances. The remaining pages of this schedule report the five
year trends of each track providing a historical summary of operations. Parts of the
reports for Finger Lakes Gaming and Racing, Saratoga Gaming and Raceway and Empire
City Casino / Yonkers Raceway have been redacted as a proceeding has been initiated to
block the public release of this information. The New York Racing Association’s 2008
information is subject to issues regarding freedom of information disclosure as well.
19

III. FACTS AND FIGURES
Legislative History
In 1939 the New York Constitution, Article I, § 9 was amended to provide “no …
gambling, except [state] lotteries … and … pari-mutuel betting on horse races as may be
prescribed by the legislature and from which the state shall derive a reasonable revenue
for the support of government, shall hereafter be authorized or allowed within this state
… .” This legalized pari-mutuel wagering on horse races in New York. The Racing, Pari-
Mutuel Wagering and Breeding Law was then enacted in 1940 to establish racing
commissions and govern pari-mutuel betting on horse racing.
In 1970 the Racing, Pari-Mutuel Wagering and Breeding Law was amended to authorize
off-track betting to be owned and operated by participating municipalities and create the
New York City Off-Track Betting Corporation Law. The stated purpose of these laws
was to help reduce deficits for municipalities, particularly New York City. It was also
thought that legalized off-track betting would diminish illegal bookmaking on races and
open new markets for the State’s harness and thoroughbred tracks. New York City Off-
Track Betting quickly grew to more than 100 branches with a daily handle of almost $2
million per day15
. Illegal bookmaking on horse racing declined significantly.
The New York Court of Appeals upheld the creation of OTBs in 1972 and held that
payments from OTB handle to local governments qualify as revenue for the state16
. The
regional system that is now in place was established in the following year. The
legislature says the intention of the OTB regional system was to raise reasonable revenue
for government, curb illegal bookmaking, and conduct off-track betting compatible with
the horse racing and breeding industries of the state. At the time OTBs were forbidden to
provide food or drink and even chairs, or bathrooms in order to reduce their direct
competition with the tracks. These restrictions gradually eroded over time17
.
In 1974 the Legislature passed a law allowing the regional OTBs to collect surcharge on
winning wagers with the participating municipality’s authorization. This turned out to be
a significant source of revenue for the participating municipalities and in fact is currently
most of, if not all of, the benefits paid to them. Many in the industry, including bettors /
fans believe that this surcharge makes the OTB less competitive as it serves as an
additional tax paid by winning bettors.
Congress passed the federal Interstate Horse Racing Act of 1978 and defined conditions
for establishing standards for interstate simulcasting18
. This proves to be significant
legislation for the racing industry as tracks and OTBs are now permitted to offer pari-
mutuel wagering to various locations around the country where pari-mutuel wagering is
15
Delafield Commission report, March 1973. 16
30 N.Y.2d 207. 17
L. 1973, ch. 346. 18
15 U.S.C. §§ 3001-07. The Act requires the written consent of the host tracks representative horsemen’s
group, consent of the host track and of both the host and guest sites racing commissions.
20

permitted. Various states began passing laws similar to New York’s and competition for
wagering took off.
In 1984 New York allowed limited simulcast wagering and the establishment of a limited
number of tele-theaters. Thoroughbred simulcasts were prohibited after 7:30 p.m. to
protect the harness tracks. OTBs were restricted to two contemporaneous live out of state
thoroughbred signals and a bridge after NYRA’s races (from the time races ended at
NYRA to 7:30 p.m.)19
. With the Interstate Horse Racing Act in place and various states
passing similar laws competition for wagering took off. Total New York Handle grew for
a few more years then reached its peak in 1987 at $3.49 billion. Total New York handle
began its decline in 1988 and had never recovered.
In-home simulcasting was authorized as “an experiment” in 1990. Broader track-to-track
simulcasting was also passed for all in state tracks OTBs were required to simulcast in
state tracks. In addition the Racing and Wagering Board was also authorized to resolve
disputes including binding arbitration of the rates OTBs paid to tracks20
.
Dark day payments were imposed on the OTBs in 1997 giving harness tracks an off-set
for OTBs taking simulcast wagering on out-of-state thoroughbred races. OTBs were
required to pay 1.5% of regional handle to regional harness tracks that remain closed on
NYRA dark days21
. These payments OTBs make to the regional tracks have been
substantial and many now question the need to continue these payments as the tracks
enjoy substantial revenues from video gaming operations.
In 2001 video lottery terminals were authorized at the State’s harness tracks, Finger
Lakes, and Aqueduct. The tracks were initially allowed to keep 12 to 25 percent of total
revenue as a vendor fee of which a portion must be reinvested back into the racing
industry through purses and breeding funds22
. By 2006 all of the harness tracks and
Finger Lakes had video gaming operations and made in total over $316 million in vendor
fees from them in 2008. The only track that is authorized for video gaming operations but
yet to get them remains Aqueduct.
At the request of the off-track betting corporations in 2003 the Legislature permitted
OTBs to simulcast unlimited races including nighttime thoroughbred signals. In turn the
OTBs were required to make payments to the harness tracks to guarantee they would get
paid what they were paid in 2002. These payments have come to be known as hold
harmless or maintenance of effort payments. Included with this legislation was a
regulatory fee to be charged on all wagers equal to 39/100 of one percent of daily pools.
This fee was created to fund the Racing and Wagering Board23
. Also included was an
additional statutory payment to regional tracks to be made on annual thoroughbred handle
over $100,000,000. The OTBs claim that the hold harmless payments and regulatory fees
19
L. 1984, ch. 363, § 14. 20
L. 1990, ch. 346, §§ 27-32, 38. 21
qL. 1997, ch. 445, § 23. 22
L. 2001, ch. 383, pt. C. Legislation upheld by Court of Appeals in 2005. 5 N.Y.2d 243, Dalton v. Pataki,
5 N.Y.3d 243 23
L. 2003, ch. 62, pt. F3, §§ 24, various.
21

have increased their expenses and are causing them to be less profitable while at the same
time their revenue projections from nighttime thoroughbred proved to be overly
optimistic. The result has been that OTB’s revenue from the new unrestricted
simulcasting formula never materialized and the hold harmless provision has caused what
many agree to be a windfall of money to the harness tracks. The OTBs challenged the
hold harmless payments as well as dark day payments but the New York Court of
Appeals upheld the payments as interpreted by Racing and Wagering Board24
. The OTBs
can end these payments by ending the simulcasting of nighttime thoroughbred races but
state that if they do they will lose customers.
Account wagering was expanded to include internet wagering in 200625. The OTBs were
slow to begin to offering internet wagering with only Capital, Nassau and New York City
OTB currently doing so.
Halfway through 2008 New York State restructured NYCOTB and eliminated restrictions
on capital acquisition surcharge and other surcharge in order to fund operations. With the
authority to appoint NYCOTB board members now in control of the governor, NYCOTB
is considered by some to be a State agency regulated by the Racing and Wagering Board
- another State agency. The Task Force on the Future of Off-Track Betting was also
established26.
24
11 N.Y.3d 559. 25
L. 2006, ch. 314. 26
L. 2008, ch. 115.
22
Regulatory Environment in Other Jurisdictions
As gambling began to grow throughout the country various other states also began to
authorize off-track betting. In 1976 the Commission on the Review of the National Policy
Toward Gambling reported that only two states (New York & Connecticut) had approved
off-track betting. Simulcasting of horse races grew rapidly as each state passed its own
laws to govern its operation. Now most of the forty three States that allow pari-mutuel
wagering authorize off-track betting. Different states took different approaches to
regulating off-track betting as their constitution and legislature allowed causing a wide
variation in “legalized” operations.
The Task Force issued a survey regarding the structure and regulatory frame work of off-
track betting and advance deposit wagering entities to over fifty racing jurisdictions,
including international locations. Nineteen responses were received, eight stated that they
either did not have off-track betting or advance deposit wagering in their jurisdiction or
the response provided was incomplete.
A summary of the responses from those jurisdictions that reported relevant information
for the study is attached as Attachment I. All of the jurisdictions that responded indicated
that the off-track betting operations were either operated and / or owned by the race
tracks or private business; none indicated that the operations were owned and / or
operated by their Country/State or local municipality. New York State is unique in this
regard.
By law the OTBs in New York are required to raise a reasonable amount of revenue for
the support of government and ensure that off-track betting is conducted in a manner
compatible with the well-being of the State’s horse racing and breeding industry27
. These
two statutory requirements create conflict as the OTBs struggle to maintain benefits paid
to municipalities. The decisions the OTBs make are not always to the benefit of the NY
tracks. The clearest example of this is the amount of out state racing the OTBs now
accept bets on; versus bets accepted on the New York tracks (see TABLE VII). As a
result adversarial situations between the tracks and the OTBs are sometimes created
while they each struggle to compete against each other.
Clearly the New York OTB structure is not the optimal situation. If off-track betting was
being created now, the present structure of six regional corporations, independently
operated tracks, with racing regulated by one State agency and VLT’s by another, would
not be the ideal plan. However, the political reality is that this will likely not change.
Several commissions and task forces28
have recommended structural changes to the
system without ever being acted on. Regional off-track betting is here to stay, so the
question becomes how to optimize its operations.
27
Racing, Pari-Mutuel Wagering and Breeding Law Section 518. 28
Governor’s Commission on the Future of Horse Racing in New York State, March 1973; Examination of
the regional OTB system in New York, Joint Legislative Task Force, September, 1979; Governor’s
Advisory Commission on Racing in the 21st Century, June 1993
23

Report on Racing Data
The total amount of wagers placed on horse racing in New York at the OTBs and tracks
reached its peak in 1987 at $3.49 billion, shortly after simulcast wagering was authorized.
Total New York OTB handle reached its peak at a little over $2.06 billion in 2005 while
the tracks handle continued a steady decline. (See ATTACHMENT II)
Suffolk OTB reached its peak in handle in 1989. Two OTBs operating in upstate New
York, Capital and Western, reached their peak in handle in 1990, the same year in-home
simulcasting was authorized. Catskill and Nassau OTB reached their peak in 2005, two
years after unlimited simulcasting was authorized. New York City OTBs biggest year in
handle followed in 2006. (See TABLE VI)
TABLE VI
Year Amount
Capital 1990 234,806,538
Catskill 2005 146,522,643
Nassau 2005 311,114,349
New York City 2006 1,060,984,126
Suffolk 1989 206,786,117
Western 1990 199,835,843
Source: New York State Racing & Wagering Board Annual Reports
OTBs Highest Reported Handle
The total amount wagered at New York State tracks began declining soon after off track
betting was authorized. In 1974 the tracks reported the most amount of wagers accepted
at their facilities at $1.68 billion. In 2008 the total amount wagered at the tracks was just
a little over $600 million.
As the laws restricting simulcasting became continually less restrictive, the wagers
accepted at the State’s OTBs have changed. Table VII shows how the OTBs almost
exclusively offered wagers on New York racing at their inception to how now out-of-
state tracks have become the preferred wagering option for bettors at the OTBs. New
York tracks appear to have difficulty competing with tracks nationally when options are
made available to the bettors. Attachment II provides a 20 year annual summary of
handle by OTB with total track handle.
TABLE VII
Year
Amount
Wagered on
New York
Tracks
Amount
Wagered on
Out-of-State
Tracks Total
Percent
Wagered on
New York
Tracks
1988 1,864,582,108 86,255,340 1,950,837,448 95.58%
1993 1,529,650,139 110,192,392 1,639,842,531 93.28%
1998 1,086,274,382 786,030,549 1,872,304,931 58.02%
2003 832,611,505 1,189,840,653 2,022,452,158 41.17%
2008 709,763,851 1,137,402,833 1,847,166,684 38.42%
Source: New York State Racing & Wagering Board Annual Reports
NYS OTB Wagering Trends
24

Advance Deposit Wagering (ADW)
The passage of the Interstate Horse Racing Act in 1978 set the framework for
simulcasting horse racing for pari-mutuel wagering. Total wagering in the United States
increased for a period of time as on track attendance and wagering began to dwindle. In
2008, 89.1% of all US handle was bet off-track29
.
A Short History of the Growth of ADWs
Off-track betting locations began to open around the country as various jurisdictions
passed laws authorizing them. The advantage of operating wagering locations without the
added cost of live racing and the maintenance of large facilities was quickly realized and
seized upon. Account wagering then began to gain in popularity due to the convenience it
offered the bettors / fans. With the growth of the internet, account wagering began to
grow as well. The low overhead and operating cost for offering account wagering
services is far less than that of the brick and mortar off-track betting locations.
Competition for the betting dollar became fierce because the delivery of the service is
made instantly through the internet. Account wagering services responded by beginning
to offer rebates30
to their best customers. The practice of rebating became a controversial
issue as many tracks lost big customers to the account wagering providers. Advance
deposit wagering (ADW) became the sole area of growth for the industry as tracks
struggled to pay operating cost. Rebates eventually became accepted by the industry as
tracks began to offer them through their own account wagering systems.
In reaction to the rapid growth of ADWs and rebate shops, various jurisdictions as well as
some tracks began to prohibit wagering locations that bet on their races from offering
rebates on their races. Various jurisdictions such as Arizona, Texas and Connecticut also
prohibited out of state wagering sites from taking bets from individuals located in their
state.
Other jurisdictions such as California, Washington, Virginia and New Jersey began to
regulate out of state ADWs31
who take bets from residents within their state.
29
Jockey Club Fact Book. 30
A rebate is the term the industry used to identify cash incentives paid to bettors based on the amount of
money they wagered with an entity. 31
See Attachment I.
25

ADWs and New York State
The New York State Racing and Wagering Board initially included as a condition of
approval for an out of state site to receive the simulcast signal from a New York Track
that the site not accept any wagers from New York residents on New York races. This
practice was followed for years until 2004 when the New York Racing Association, in an
attempt to increase revenues, requested the approval of a favorable contract with
Television Gaming Network (TVG), an out of state provider, without the restriction. This
contract was subsequently approved.
In January 2008 the Racing Board no longer included the restriction on any simulcast
approvals. The regional off-track betting corporations have complained and stated they
believe its not legal for out of state entities to accept wagers from New York residence.
They were advised to seek an opinion from the New York State Attorney General’s
Office did not. The Task Force on the Future of Off-Track Betting did so in a letter dated
June 28, 2009. The Task Force was advised in September 2009 that the Attorney
General’s Office referred the matter to the Governor’s office, which has given no opinion
as of the date of this report.
The growth of ADWs has been significant. For example, the State of Oregon authorized
account wagering in 2000 and by 2008 account wagering handle for Oregon was $1.3
billion32
.
32
Oregon Racing Commission.
26

OTB Distributions
Distributions to Municipalities
Sections 516 and 532 of the Racing Law govern distributions the OTBs are required to
make to participating municipalities.
Section 516 requires net revenues, the amount remaining after payment of all costs of the
corporation, to be distributed quarterly among each OTB’s participating municipalities.
Fifty percent of the net revenues are required to be distributed among the participating
municipalities based on the proportion of handle the corporation had in the previous
quarter and the remaining fifty percent is required to be distributed on the basis of
population in each municipality.
Section 532 requires fifty percent of the surcharge collected to be distributed monthly in
accordance with the formula for distribution described in Section 51633
. A portion of the
remaining fifty percent is to be distributed monthly to the municipality where the track
was located that was wagered upon.
ATTACHMENT V includes a financial analysis of each regional off-track betting
corporation from 2004 to 2008 as well as a detailed financial summary. The first five
pages of this schedule provide a five year financial trend analysis of key statistics for
each OTB, the next 35 pages compare each of the OTBs currently available past five
years of operations year by year. The remaining pages of this schedule report the five
year trends of each track providing a historical summary of operations. Not only is there a
decrease in handle and related revenues reported during this period there is also an
increase in expenses. The result has been ever decreasing distributions to municipalities.
Since their inception the OTBs have provided substantial revenues to local governments.
The following summary reports these amounts by region.
Capital OTB
The total amount of cash distributions to participating localities from 1972 to 2008 by
Capital OTB was $181,680,38434
which averages out to $4.9 million a year. Cash
distributions reached a high of $9.2 million in 2001 and have steadily declined since then.
Since 2005 cash distributions have declined 32 % to $4.3 million in 2008.
Catskill OTB
The total amount of cash distributions to participating localities from 1976 to 2008 by
Catskill OTB was $216,699,46835
which averages out to $6.5 million a year. Cash
distributions reached a high of $20,178,203 in 2001. ( It should be noted that in 2001 the
Board found that Catskill OTB had not been making distributions according to Statute
which allowed them to accumulate a very large cash balance. As a result the Board
33
Section 532 was amended in 2008 to, in part, allow New York City OTB retain surcharge collected as
revenue for operations. See Section 532.7. 34
Source: Capital District Regional Off-Track Betting Corporation. 35
Source: Catskill Regional Off-Track Betting Corporation.
27

directed Catskill OTB to make the distributions to the participating localities which
resulted in a much higher than average distribution in 2001). The distributions have been
steadily declining in recent years. Since 2005 cash distributions have declined 33% to
$6.2 million in 2008.
Nassau OTB
The total amount of cash distributions to Nassau County from 1975 to 2008 by Nassau
OTB was $389,428,70636
which averages out to $11.4 million a year. Cash distributions
reached a high of $18 million in 2001 and have steadily declined since then. Since 2005
cash distributions have declined 61% to $3.9 million in 2008.
New York City OTB
The total amount of cash distributions to New York City from 1972 to 2008 by New
York City OTB was $1,271,227,74237
which averages out to $34.3 million a year. Cash
distributions reached a high of $65.2 million in 1977 and have steadily declined since
then. Since 2005 cash distributions have declined 11% to $15.4 million in 2008.
It should be noted that New York City OTB was on a fiscal year of July 1-June 30 from
1972 thru 2008. In June of 2008 New York City OTB was acquired by the State of New
York and changed their fiscal year to a state fiscal year of April 1 – March 31. As a result
of being acquired by the State of New York the formula for distribution of surcharge has
changed and New York City will receive a much smaller portion and New York City
OTB will be retaining a much larger portion for operations. For the first three quarters of
2008 NYCOTB reported that $15.4 million of Section 532 surcharge plus $2.5 million of
Capital Acquisition Fund Surcharge that would have historically been paid to New York
City as now being used to cover operating costs.
Suffolk OTB
The total amount of cash distributions to Suffolk County from 1975 to 2008 by Suffolk
OTB was $197,866,03338
which averages out to $5.8 million a year. Cash distributions
reached a high of $9.2 million in 1989 and have steadily declined since then. Since 2005
cash distributions have declined 26% to $2.2 million in 2008.
Western OTB
The total amount of cash distributions to participating localities from 1975 to 2008 by
Western OTB was $168,421,72739
which averages out to $4.9 million a year. Cash
distributions reached a high of $8 million in 1987. Although distributions have steadily
declined since that high in 1987, Western OTB, the State’s only OTB that owns and
operates a racetrack, has actually had an increase in cash distributions since 2005 of 24%
to $3.6 million in 2008 due to the video gaming operations they run at Batavia Downs.
36
Source: Nassau Regional Off-Track Betting Corporation. 37
Source: New York City Off-Track Betting Corporation. 38
Source: Suffolk Regional Off-Track Betting Corporation. 39
Source: Western Regional Off-Track Betting Corporation.
28

IV. The Off-Track Betting Corporation’s Position
Organizational Structure
The off-track betting corporations accept pari-mutuel wagers on horse racing under strict
administration of the State Racing and Wagering Board and subject to the conditions of
racing and wagering laws and rules40
. Each of the State’s six OTBs provides wagering
opportunities in essentially the same way. See ATTACHMENT VII for a comparison of
the OTB operations.
There are approximately one hundred and eighty seven full service branches, sixty eight
EZ- bets / remote sites41
, six tele-theaters42
throughout the state. Each OTB also offers
telephone account wagering to their customers. Capital, Nassau and New York City
OTBs currently offer internet wagering. Each OTB has its own totalisator system43
,
telephone wagering operations (except for Nassau and Suffolk OTBs which share this
operation) and marketing department.
The OTBs employ approximately two thousand nine hundred individuals, half of which
are part time. Each OTB has its own board of directors, officers, lobbyists, executive staff
and management that over see operations in the various departments such as personnel,
accounting, branch operations, computer support (ITS) etc.
Assets, Liabilities and Undistributed benefits (aka Balance Sheet)
The OTBs are required to distribute their net revenue, after payment of all expenses to
their participating municipalities44
. Therefore they are not permitted to accumulate net
income to provide for reserves and invest in fixed assets like a private business typically
does. In an effort to address this, the legislature allowed the OTBs to establish bond
reserves and capital acquisition funds45
where monies can be collected and held for
payment of bonds and purchases of fixed assets. As a result the OTBs balance sheet is
unlike that of a for-profit entity as the various portions of collected revenues are
separately reported to reflect how each fund is allocated and distributed in what is
typically the equity section.
What is clear when reviewing the last five years of the balance sheets of the OTBs
reported in ATTACHMENT V is that New York City OTB has more liabilities than
assets at the end of 2008 and that each OTBs’ debt ratio (total assets divided by total
40
Racing, Pari-Mutuel Wagering and Breeding Law Section 518. 41
EZ-Bets / remote sites are locations the OTBs contract with, such are bars, restaurants and bowling alleys
where self service terminals are located with simulcasting made available. There are no tellers or OTB
employees at these locations as there are at branches which are owned and / or operated by the OTB. See
Section 1001.j of the Racing Law. 42
Tele-theaters are essentially branches that also serve as public entertainment faculties and have more
amenities then branches. See Section 1001.j of the Racing Law. 43
Part 5100.1(20) defines totalisator system as a computer system that registers and computes the wagering
and payoffs in pari-mutuel wagering. 44
Racing, Pari-Mutuel Wagering and Breeding Law Section 516. 45
Racing, Pari-Mutuel Wagering and Breeding Law Sections 509 and 509-A.
29

liabilities) and debt to equity ratio (total liabilities divided by total equity/undistributed
benefits) has continually worsened.
The reported increase in liabilities for most of the OTBs is mainly due to the increase in
accounts payable (mainly due to the maintenance of effort payments owed to the harness
tracks) and for Suffolk and Western loans that were issued during this time period.
However, the largest reported increase in liabilities is by far New York City OTB with an
increase of almost one hundred ninety million dollars for post employment retirement
benefits that were required to be reported in 2007 in accordance with GASB 45.
Section 516 Net Revenues (aka Profit and (Loss))
While there are many opposing views concerning the issues surrounding the OTBs one
thing is clear, Section 516 net revenues have been constantly declining, causing less
benefits to be distributed to participating municipalities.
The ratio analysis presented on the first five pages of ATTACHMENT V present some
insight into this trend. For example, operating revenues as a percentage of handle shows
an increase over the last five years. Five of the OTBs report an increase in total branch
and corporate expenses, as a percentage of handle, with increases in professional fees,
salaries and wages, totalisator expense and fringe benefits (due to GASB 45). Advertising
and promotion expenses actually decreased during this same time period.
Capital OTB is the only OTB that has been able to actually reduce branch expenses as a
percentage of handle. However they have been unable to do so with corporate expenses.
Legislative Proposals
The OTBs’ position is “the system is broken” as they are forced to pay out more than
they make. The response to their declining financial position has been to propose
legislation that would eliminate certain payments to the State’s harness tracks such as
maintenance of effort and dark day; eliminate the regulatory fee that funds the Racing
and Wagering Board; allow them to offer video gaming; and change the payment
structure for the remaining statutory fees from paying as a percentage of gross handle to
paying the required fees with funds remaining, if any, after all operating expenses.
30

Summary of Comments Received
The Task Force requested comments from all the New York Tracks, Off-Track Betting
Corporations, breeders, horsemen, each OTB participating municipality, each totalisator
company providing services in New York, legislators, the New York State American
Federation of Labor-Congress of Industrial Organizations and various out of state
advance deposit wagering companies. Well over two hundred recommendations have
been received from eighty two entities / individuals.
TABLE VIII Summary of Comments Received
NYS Tracks 6
Totalisator Companies 3
Local Municipalities 29
Horsemen & Breeders 8
NYS Off-Track Betting Corporations 5
Bettors / Fans 31
82
Many of the responses were well thought out and constructive while some provided the
same rhetoric and self-serving interest that have plagued the industry for years. Re-
emerging themes were noted as many of the recommendations were made over and over.
(See ATTACHMENTS XIII through XIX)
At least one of the OTBs advised their participating municipalities that the Task Force’s
mission was to take the revenue stream they currently received from OTB and divert it to
the State46
. The local municipalities were told that the Task Force’s recommendations
have been “pre-ordained” and they were asked to pass resolutions to support their OTBs
legislative proposals and not support the Task Force’s recommendations that would
change the current structure.
Unfortunately no comments were received from Vernon or Tioga Downs and New York
City OTB despite being repeatedly asked and invited to participate. It is especially
regrettable that New York City OTB, whose problems were the reason for the creation of
the Task Force refused to participate when all other Regional OTB corporations did.
While understanding the crisis that is affecting NYC OTB, the Task Force believes their
interaction with the others in the racing community could have assisted them in finding
more practical solutions to their problems.
46
Minutes of the August 27, 2009 Western OTB Board meeting.
31

V. Conclusion
In 1973, 1979 and 1993 task forces or commissions issued reports on racing and OTBs.
Each of these reports concluded, in part, that the structure of the regional off-track betting
system in New York State must be changed to meet the stated goal of providing a
reasonable amount of revenue for the support of government as well as the racing and
breeding industry.
Now, the continued viability of racing and the breeding programs are in question. Since
the State created OTB to provide revenue to support government, racing and breeding
programs the State must now make major changes to ensure this goal can be met. Should
no action be taken to properly align all of these interests, then horse racing in the state of
New York will end.
Much has changed over the years since the advent of off-track betting, video gaming,
pick six’s, ADW’s and a host of new competitors. With video gaming providing a new
source of revenue to track operators and the horsemen to, in part, support racing and
breeding programs the time is now at hand to review the various protectionist payments
to the tracks provided for in the racing law while at the same time correction is made to
the OTB structure.
What has not changed fundamentally is the OTB structure itself, despite repeated calls for
such reform. It is clear that the OTBs cannot sustain current operating costs as market
conditions continue to become more and more competitive. The OTB structure must be
changed to eliminate duplicative services, streamline operations and achieve cost
efficiencies.
32

VI. Recommendations
To ensure the future success and viability of off track betting in New York State the Task
Force makes the following legislative and non-legislative recommendations.
Legislative
1. The Task Force recommends amending the Racing Law to centralize and
consolidate the repetitive business functions that add cost with no discernable
advantage to the industry or to the regional OTBs:
a. Marketing – Create a central unified market program that promotes New
York Racing and wagering interest to maximize profits. Utilize existing
resources from the New York State Lottery and I Love New York
program. The OTBs should reduce their present marketing budgets as a
result of this.
b. Simulcasts of Races on Television – Create a central unified television
channel that promotes New York racing and wagering. The current system
where each OTB has its own system of in-home simulcasting or none at
all is inefficient and costly. New York should use its regulatory influence
with cable franchisees to require the placement of two full time Statewide
racing channels on each cable system.
c. Account wagering including internet and telephone wagering – Centralize
account wagering services to provide a consistent stable platform that
would be available throughout the state. Savings would be achieved
through consolidation and handle should increase by making the service
easily and readily available.
d. Totalisator Operations – Establish a centralized tote system for all of the
OTBs and New York tracks to use. This will create cost savings by
consolidating operations and eliminate interface fees currently charged
between the New York entities. Bettors and fans will be able to use one
wagering account at any New York track or OTB and tickets will be able
to be cashed at any site as well thus enhancing the customer wagering
experience and increase handle.
e. Require the New York tracks to use the centralized tote system and
participate in the centralized marketing and television programs. Require
the New York tracks to utilize the centralized account wagering platform
should they wish to offer account wagering.
2. The Task Force recommends amending the Racing Law to require out-of-state
advance deposit wagering operators who accept wagers from New York residents
to be licensed by the New York Racing and Wagering Board. Impose the same
regulatory fee, breeder’s contribution fees and host fee on each wager accepted
from New York State. Such a change would bring New York State in line with
other racing jurisdictions regarding this matter and level the playing field for the
New York entities.
33

3. The Task Force recommends amending the Racing Law to set rates on what the
tracks charge for exporting their simulcast signal and what the OTBs pay for
simulcast imports. The out of state ADWs are able to offer rebates because the rate
which tracks sell their signal out of state is well below what the signal is sold to the
local tracks. This pricing needs to be set legislatively for both the OTBs and out of
state rate. The argument that the tracks are private business and therefore such action
would be intrusive is meritless. The tracks receive sufficient benefits as a result of
New York State’s allowing them to operate as gambling entities, that they should be
considered as regulated public utilities. The OTBs are forced (rightfully so) to carry
the local product and many, but not all, of their payments for this signal are statutory.
Part of the failing of the industry nationally has been their collective willingness to
sell the simulcast signal well below value. (The current pricing model was developed
before the widespread acceptance of cable, not to mention the internet.) This model is
broken and rebates are the proof. If the OTBs were to act as one, they could
collectively support the local tracks higher export rate by refusing to accept wagers
on non-participating entity/state. The ADWs will be regulated to prevent slippage.
4. The Task Force recommends amending the Racing Law to set county payments at
hold harmless levels or keep benefit distribution as it is. The Task Force heard
tremendous feedback from localities about the importance of regional OTBs as
sources of income to localities. Based on the fundamental restructuring the Task
Force is recommending the localities be offered an option as well. Currently, each
locality receives a portion of each of the respective Regional OTB net revenue and
surcharge. As handle decreases, so do the payments to the localities. The localities
should be offered a choice to relinquish their rights/board control in exchange for the
state capturing those payments directly from statute for them. In exchange the locality
will get the direct aid from the State at the level no lower than the previous year’s
amount.
5. The Task Force recommends amending the Racing Law to allow the OTBs to
carry forward and carry back reported quarterly losses incurred in the same fiscal
year. Wagering on horse racing is largely seasonal with heavy interest in the
summer months and on special events such as the Triple Crown and Breeders
Cup. As a result it is not uncommon for an OTB to report income in some
quarters and losses in others all in the same year. By amending the law to reflect
this business cycle this will provide cash flow relief to the OTBs and allow them
to “annualize” their Section 516 net income.
6. The Task Force recommends amending the Racing Law to eliminate the
restrictions on in-home simulcasting as currently provided for under Section
1003. Also allow un-restricted in-home simulcasting for both the tracks and OTBs
and clearly include the authority for internet video streaming as well. The current
statute did not contemplate internet use for simulcasting and creates an undue
burden on the tracks and OTBs while frustrating bettors / fans. Freeing the tracks
to display their races in format and forum they choose would provide them the
opportunity to open markets that were not easily available to them. Relieving this
34

restriction would also enable the OTBs to compete with out of state ADWs and
expand their market as well.
7. The Task Force recommends amending the Racing Law to eliminate the
maintenance of effort and hold harmless payments to those tracks with video
gaming operations that have been in operation for twenty four months or more.
The financial consequences that were anticipated to injure the New York harness
tracks as a result of night time thoroughbred wagering never materialized and
with the authorization of video gaming at the tracks now providing significant
revenues to racing operations these protectionist payments are no longer needed.
8. The Task Force recommends amending the Racing Law to eliminate dark day
payments to those tracks with video gaming operations that have been in
operation for twenty four months or more. With the authorization of video gaming
at the tracks now providing significant revenues to racing operations these
protectionist payments are no longer needed.
9. The Task Force recommends amending the Racing Law to require the OTBs to
prominently display and give preference to, in all branches and simulcasting
(including in-home), all live NYS races. One of the main objectives of the State’s
off-track betting systems is to operate in a manner compatible with the well being
of the State’s horse racing and breeding industries. It is imperative that the New
York racing product be prominently promoted.
10. The Task Force recommends amending the Racing Law Section 527.5-a to
eliminate the payment of one half of one percent of regular and multiple bets to
tracks that have had video gaming operations for 24 months or more for capital
improvements. In 2007 the OTBs distributed approximately $353,000 to the
harness tracks and $193,000 to Finger Lakes that is restricted to be used for
capital improvements at the respective tracks. With the authorization of video
gaming at the tracks now providing significant revenues to racing operations and
for capital improvements these payments are no longer needed.
11. The Task Force recommends amending the Racing Law to clarify the Racing and
Wagering Board’s regulatory authority over NYCOTB. It is important that
regulatory actions are consistently applied and that there is no bias, real or
perceived, shown in deference to any entity.
12. Should the above recommendations not be implemented, then privatizing the off-
track betting corporation’s branch operations should be seriously considered.
Revenues from the sale / franchise agreements should be allocated to the
participating municipalities and the private operator will be required to continue
payments to the participating municipalities. A central state wide entity owned by
the participating municipalities would continue to operate and manage marketing,
televised racing channel, account wagering/ internet and totalisator operations.
35

Non-Legislative
13. The Task Force believes that OTB management structure must be streamlined. In
2008 the OTBs paid a little over $10.5 million in salaries and wages to their
presidents, vice-presidents, officers and managers47
not including benefits.
Significant savings could be achieved now by consolidating and streamlining
management operations.
14. The Task Force recommends the OTBs reduce cost. It is imperative that the
OTBs, particularly New York City OTB, reduce expenses. Strict constraints must
be put in place regarding their largest expense, post employment retirement
benefits. With the implementation of GASB 45 it is clear that New York City
OTB can not afford to continue to offer the current post employment retirement
benefits that they offer their employees. Immediate steps must be taken to begin
to control this cost.
15. The Task Force recommends that the OTBs adopt uniform reporting standards for
GASB 45 expenses and determine how this liability will be funded. This is a
substantial liability that is effecting distributions to municipalities but has no
mechanism in place to fund the cost.
16. The Task Force recommends Co-opetition. While the OTBs and the tracks are
competing for the same racing dollar, both have a common goal of promoting
racing for the common good of all. Combining and unifying marketing efforts
would provide a benefit to both organizations. The larger the number of people who
follow racing, the greater the benefit to each group. This common goal can be
supported even in a competitive framework.
17. The Task Force recommends reorganizing and refocusing marketing / promotions
& customer service. It’s clear from the comments received and the declines in
handle that these areas need great improvement. A cohesive marketing and
customer service plan must be initiated immediately.
It is easy to understand that many of these recommendations are supported by various
individuals within the industry, some more than others. However, even those
recommendations that almost all agree on will not be implemented without strong
leadership and cooperation between the OTBs and the other racing interests. For
example, OTBs have been discussing consolidating tote operations for well over a year
but have yet to issue a request for proposal to initiate such change. In fact many times
tote contracts are simply extended rather than competitively bid.
It should also be noted that while many of the recommendations the Task Force offers are
similar to some that of the OTBs have offered there are some notable differences.
The Task Force does not support the OTBs recommendation that statutory amounts be
paid only after payment of all OTB operating expenses. If this was adopted, there would
47
See Attachment V, Uniform Quarterly Report Summary for 2008.
36

be little incentive for the OTBs to reduce overhead. This would also result in the perverse
outcome of out of State tracks receiving guaranteed payments while in State tracks would
have to depend on the profitable operations of the OTBs. A distribution formula such as
this seems to contradict Section 518 of the Racing Law that requires that off-track betting
be conducted in a manner compatible with the well-being of the State’s horse racing and
breeding industry.
37

VII. TASK FORCE MEMBERS
The five members of the Task Force were appointed by the governor, one was appointed
on the recommendation of the temporary president of the senate and one was appointed
on the recommendation of the speaker of the assembly.
John Van Lindt was appointed by the governor and elected Chairman of the Task Force
at the first meeting by the other members. Mr. Van Lindt is an attorney and was
Chairman of the New York State Racing and Wagering Board from 1979 -1986. He is a
former Assistant District Attorney in Manhattan and a former Assistant Attorney General
from the State Organized Crime Task Force. He served as Vice president of Hialeah
Racecourse from 1989 to 2001 and was vice president of operations for New York City
Off-Track Betting Corporation.
John Crotty was appointed by the governor and served as vice-chairman to the Task
Force. Mr. Crotty was an Executive Director of JP Morgan Chase's municipal housing
finance group, a group he was hired to start in 2007. Prior to joining JP Morgan Chase,
John was the Executive Vice President of HDC from 2004 to 2007. HDC was the
nation’s leading issuer of affordable housing bonds during two of his three full years at
HDC. Prior to joining HDC, John was Mayor Bloomberg’s Director of City Legislative
Affairs. Prior to joining the Bloomberg administration in 2002, John held a variety of
finance management positions at MCI, PaineWebber, Winstar and Verizon from 1996 to
2002. In 2003 was appointed by Mayor Bloomberg to be a Member of the Board of
Directors of the New York City Off-Track Betting Corporation.
Thomas Casaregola was appointed by the governor and served as secretary to the Task
Force. He has been director of audits and investigations for the New York State Racing
and Wagering Board since 1997. Prior to working at the Board Mr. Casaregola was a
partner in a public accounting firm where he managed audits of local municipalities as
well as various non-profit and for profit entities. Mr. Casaregola is certified public
accountant and certified fraud examiner.
Bradley M. Fischer was appointed by the governor on the recommendation of the
temporary president of the senate. Mr. Fischer is an attorney for Senate Racing and
Wagering Committee and the Veterans, Homeland Security and Military Affairs
Committee. Prior to his current position Mr. Fischer worked in a various capacities in the
Senate Democratic Conference. Mr. Fischer replaced Jon McCloskey on the Task Force
in August.
Jerry Skurnik was appointed by the governor on the recommendation of the speaker of
the assembly. Mr. Skurnik has been a partner in Prime New York since 1988, a political
consulting firm and the State's leading supplier of voter file products. Prior to starting
Prime New York, he served as an Assistant to the Mayor of New York City.
The Task Force thanks Chairman Sabini and the New York State Racing and Wagering
Board for providing support staff, and resources. Special thanks goes to Rick Goodell
who was acting counsel to the Task Force, Joe Mahoney – acting public information
officer, Kristen Buckley- special assistant and John McCloskey. The Task Force would
not have been able to achieve its mission and issue this report without their support.
38

ATTACHMENT I
States Offering OTB's
OTB's owned by the
track
OTBs
privately
owned
Racing Commisson
approval required
Surcharge on
Winning
Wagers
Municipality
share in OTB
Revenues
State share in
OTB
Revenues Host Fees
Statutes/Rules
Governing
OTB's
OTBs offer
Account
Wagering
# of
physical
locations
OTBs use
same tote
vendor
Restrictions on
Simulcasting
ADW's
Licensed
ADW's
Regulated
California No* Yes Yes No Yes Yes Yes Yes No 35 Yes Yes Yes Yes
Washington Yes No ** Yes No No Yes No Yes No 15 Yes No Yes Yes
Oregon No Yes Yes Yes No Yes Yes Yes No 13 Yes No Yes Yes
Illinois Yes No Yes Yes Yes Yes No Yes No 26 No No No No
Arizona Yes No ** Yes No No Yes No Yes No 80 No Yes No No
Ohio Yes No ** Yes Yes No Yes No Yes No 1 Yes No No No
Virginia Yes No Local Referendum No Yes Yes No Yes Yes 8 Yes No Yes Yes
South Dakota No Yes Yes No No No Yes Yes No 3 Yes No No No
Connecticut No Yes Yes No Yes Yes No Yes Yes 11 Yes No No No
New Jersey Yes No Yes Yes No No No Yes No 3 Yes No No Yes
Sweden No Yes No No Yes No Yes No Yes 2,000 Yes No No No
*OTBs are run by Racetracks, Racing Fairs, and Indian Casinos
* *OTBs are run by Racetracks, they lease space in a bar/restaurant
Source: Compiled from data received in response to a survey performed by the Task Force on the Future of Off-Track Betting in New York State.
Summary of Survey of other States/Jurisdictions handling of OTBs
39

ATTACHMENT II
Capital Catskill Nassau New York City Suffolk Western All Regions On-Track Total NYS
1971 -$ -$ -$ 118,588,586$ -$ -$ 118,588,586$ 1,626,519,870 1,745,108,456$
1972 2,316,716 - - 450,316,518 - - 452,633,234 1,521,925,927 1,974,559,161
1973 11,414,046 - - 691,280,360 - - 702,694,406 1,654,110,434 2,356,804,840
1974 15,098,937 - - 786,711,622 - 13,440,146 815,250,705 1,678,465,574 2,493,716,279
1975 * 19,796,767 - 27,903,980 773,550,528 30,367,693 55,239,443 906,858,411 1,640,911,224 2,547,769,635
1976 40,303,650 15,561,237 69,662,629 785,910,123 67,723,374 73,741,970 1,052,902,983 1,645,713,481 2,698,616,464
1977 55,041,267 41,729,116 90,692,862 777,437,682 77,426,355 85,725,016 1,128,052,298 1,448,492,902 2,576,545,200
1978 67,987,889 52,433,415 102,674,979 791,853,715 87,840,290 103,739,971 1,206,530,259 1,560,497,784 2,767,028,043
1979 91,720,613 66,849,752 134,958,752 835,815,437 109,146,866 133,535,290 1,372,026,710 1,590,246,285 2,962,272,995
1980 102,669,278 73,982,592 142,586,319 879,639,694 117,253,548 146,491,353 1,462,622,784 1,643,836,275 3,106,459,059
1981 108,653,823 80,120,747 149,594,168 891,276,192 122,394,341 153,324,442 1,505,363,713 1,584,271,013 3,089,634,726
1982 124,920,812 82,561,063 155,304,423 883,510,575 130,558,401 144,429,719 1,521,284,993 1,617,470,441 3,138,755,434
1983 134,616,018 88,668,362 159,422,909 866,764,759 136,539,171 145,961,464 1,531,972,683 1,584,173,721 3,116,146,404
1984 147,563,225 96,713,909 158,728,337 886,006,827 142,821,166 151,659,615 1,583,493,079 1,571,698,568 3,155,191,647
1985 157,719,562 106,083,129 155,085,757 871,867,750 140,669,804 143,303,334 1,574,729,336 1,596,187,321 3,170,916,657
1986 193,409,257 117,491,015 165,303,500 945,803,419 167,050,479 167,696,983 1,756,754,653 1,600,209,731 3,356,964,384
1987 209,892,621 132,723,923 180,195,868 1,003,377,015 195,383,498 187,591,674 1,909,164,599 1,580,991,775 3,490,156,374
1988 223,291,861 135,770,751 196,117,404 1,000,766,523 201,599,802 193,291,107 1,950,837,448 1,517,726,971 3,468,564,419
1989 228,130,290 135,137,777 212,472,817 940,787,164 206,786,117 196,986,948 1,920,301,113 1,438,758,913 3,359,060,026
1990 234,806,538 115,881,524 214,668,830 961,469,708 197,045,073 199,835,843 1,923,707,516 1,402,293,289 3,326,000,805
1991 226,402,623 121,541,890 196,960,292 904,201,790 185,302,638 185,500,554 1,819,909,787 1,348,935,030 3,168,844,817
1992 220,805,067 125,246,625 193,595,504 858,961,315 178,747,643 184,970,088 1,762,326,242 1,323,959,684 3,086,285,926
1993 209,279,030 117,974,312 186,542,545 775,251,135 174,420,032 176,375,477 1,639,842,531 1,213,923,598 2,853,766,129
1994 205,015,141 121,740,566 191,296,563 757,612,209 163,888,236 177,886,848 1,617,439,563 1,095,193,574 2,712,633,137
1995 214,677,508 130,493,497 220,127,790 854,457,195 177,060,836 184,052,016 1,780,868,842 1,031,376,424 2,812,245,266
1996 210,386,807 121,133,534 219,738,585 880,656,595 158,748,374 176,543,338 1,767,207,233 876,511,810 2,643,719,043
1997 216,408,562 124,587,519 235,579,004 927,920,479 159,290,619 171,259,698 1,835,045,881 833,086,330 2,668,132,211
1998 215,813,900 133,784,257 241,066,768 920,663,687 167,081,319 175,895,000 1,854,304,931 809,920,465 2,664,225,396
1999 218,214,375 137,406,986 251,104,041 975,936,705 176,267,452 183,594,503 1,942,524,062 803,489,340 2,746,013,402
2000 222,472,891 139,033,233 252,035,368 1,013,177,935 174,302,864 174,039,463 1,975,061,754 763,922,451 2,738,984,205
2001 229,435,034 144,736,947 258,206,071 1,014,631,269 186,820,326 176,319,570 2,010,149,217 780,191,946 2,790,341,163
2002 225,381,005 144,619,357 265,302,213 1,030,285,839 205,247,267 171,887,898 2,042,723,579 784,703,683 2,827,427,262
2003 220,865,269 143,265,650 261,867,738 1,025,066,708 211,476,632 159,910,161 2,022,452,158 725,668,204 2,748,120,362
2004 212,235,503 143,119,690 299,355,534 1,036,088,072 205,292,864 149,541,572 2,045,633,235 672,532,334 2,718,165,569
2005 213,061,004 146,522,643 311,114,349 1,046,424,502 199,046,909 145,402,654 2,061,572,061 582,951,231 2,644,523,292
2006 209,922,787 143,032,748 307,674,951 1,060,984,126 195,177,802 140,228,641 2,057,021,055 539,629,619 2,596,650,674
2007 201,839,522 131,807,834 293,523,497 1,030,197,904 188,158,721 139,435,042 1,984,962,520 622,293,849 2,607,256,369
2008 190,544,474 121,869,536 281,957,687 940,218,360 178,590,944 133,985,683 1,847,166,684 603,905,010 2,451,071,694
TOTAL 6,032,113,672$ 3,733,625,136$ 6,782,422,034$ 33,195,470,022$ 5,415,527,456$ 5,302,822,524$ 60,461,980,844$ 114,891,848,015$ 226,050,070,895$
* Schenectady was superseded by Capital District on August 11, 1975
Source: New York State Racing and Wagering Board annual reports
NEW YORK STATE REGIONAL OFF-TRACK BETTING CORPORATIONS
TOTAL HANDLE BY REGIONAL CORPORATION (SINCE INCEPTION)
40

ATTACHMENT III
Summary of Rates Paid by the Off-Track Betting Corporations for Taking Bets on Various Tracks Races
2008 Rates Capital OTB Catskill OTB Nassau OTB NYC OTB Suffolk OTB Western OTB
Calder 3 75% 3 75% 3 75% 3 75% 3 75% 3 75%
Churchill 2 25% 2 25% 2 25% 2 25% 2 25% 2 25%
Fairgrounds 2 75% 2 75% 2 75% 2 75% 2 75% 2 75%
Gulfstream 3 05% 3 05% 3 05% 3 05% 3 05% 3 05%
Hollywood Park 2 75% 2 75% 2 75% 2 75% 2 75% 2 75%
Laurel 2 50% 2 50% 2 50% 2 50% 2 50% 2 50%
Meadowlands (Harness) 2 50% 2 35% 2 35% 2 25% 2 00% 2 00%
Monmouth 2 25% 2 32% 2 25% 2 25% 2 25% 2 25%
Northfield Park 2 00% 2 00% 2 00% 2 00% 2 00% 2 00%
NY - Aqueduct Statutory + $700k yr Contractual Statutory + 1 25% Contractual Statutory + 1 25% Contractual Statutory +2 75% Contractual Statutory + 1 35% Contractual Statutory + 1-1 75% Contractual
NY - Belmont Statutory + $700k yr Contractual Statutory + 1 25% Contractual Statutory + 1 25% Contractual Statutory +2 75% Contractual Statutory + 1 35% Contractual Statutory + 1-1 75% Contractual
NY - Saratoga Flats Statutory + $700k yr Contractual Statutory + 1 25% Contractual Statutory + 1 25% Contractual Statutory +2 75% Contractual Statutory + 1 35% Contractual Statutory + 1-1 75% Contractual
NY - Buffalo Statutory Statutory Statutory Statutory Statutory Statutory
NY - Finger Lakes Statutory + 1% Contractual Statutory Statutory + 1% Contractual Statutory + 1 25% Contractual Statutory + 1% Contractual Statutory + 1 3% Contractual
NY - Monticello Statutory Statutory Statutory Statutory Statutory Statutory
NY - Saratoga Harness Statutory + $170k yr Contract Statutory Statutory Statutory Statutory Statutory
NY - Yonkers Statutory Statutory Statutory + 1 8% Contractual Statutory + 3 25% Contractual Statutory Statutory + 5% Contractual
Philadelphia Park 2 00% 2 00% 2 00% 2 00% 2 00% 2 00%
Santa Anita 2 75% 2 75% 2 75% 2 75% 2 75% 2 75%
Tampa Bay 1 85% 1 88% 1 88% 1 88% 1 88% 2 00%
[Percentages broken down as WPS / Multiple / Triple / Exotic]
** Note - Churchill Downs and Northfield Park's rate are from prior years rates.
Source: Simulcast contracts submitted to the New York State Racing and Wagering Board.
41

ATTACHMENT IV
Batavia
Downs Casino
Fairgrounds
Gaming &
Raceway
Finger Lakes
Gaming &
Raceway
Monticello
Casino &
Raceway
Saratoga
Gaming &
Raceway
Tioga Downs
Casino
Vernon
Downs
Casino &
Hotel
Empire City
Casino
Yonkers
Raceway Total
Video Gaming
Credits Played 0 331,815,115 690,126,161 423,006,817 981,433,754 0 2,426,381,847
Credits won 0 304,319,450 634,728,556 390,722,051 904,164,292 0 2,233,934,349
Net Win 0 27,495,665 55,397,605 32,284,766 77,269,462 0 0 0 192,447,498
Education Contribution 0 16,772,356 33,792,538 19,693,707 47,134,371 0 0 0 117,392,972
Marketing Allowance 0 0 0 0 0 0 0 0 0
Lottery Administration 0 2,749,567 5,539,760 3,228,477 7,726,946 0 0 0 19,244,750
Capital Award 0 0 0 0 0 0 0 0 0
Racetrack Commission 0 7,973,743 16,065,306 9,362,582 22,408,144 0 0 0 55,809,775
Less: Purse Contributions* 1,858,982 2,424,909 4,283,891
Net Racetrack Commission 0 6,114,761 16,065,306 6,937,673 22,408,144 0 0 0 51,525,884
Total VGM Machines 0 990 1,010 1,744 1,324 0 0 0 5,068
Avg Machine win/year 0 27,773 54,849 18,512 58,361 0 0 0 37,973
Purse Contribution/Net Win 6.8% 0.0% 7.5% 2.2%
Estimated Estimated
Batavia started
gaming
operations
May 2005
Buffalo started
gaming
operations Mar
2004
Monticello
started
gaming
operations Jun
2004
Tioga started
gaming
operations Jul
2006
Vernon
started
gaming
operations
Oct 2006
Yonkers
started
gaming
operations
Oct 2006
* Purse information was obtained from NYSRWB Form T05 filed by the tracks annually with the New York State Racing & Wagering Board.
Items blocked out are subject to Freedom of Information issues raised by the track that are currently being addressed.
New York State Race Tracks
Video Gaming Statistics
2004
Source: New York State Lottery Video Gaming Reports42

ATTACHMENT IV
Batavia Downs
Casino
Fairground
Gaming &
Raceway
Finger Lakes
Gaming &
Raceway
Monticello
Casino &
Raceway
Saratoga
Gaming &
Raceway
Tioga
Downs
Casino
Vernon
Downs
Casino &
Hotel
Empire City
Casino
Yonkers
Raceway Total
Video Gaming
Credits Played 180,895,554 440,374,772 897,590,572 891,692,956 1,310,928,551 0 3,721,482,405
Credits won 166,215,767 402,719,822 826,559,820 823,633,967 1,207,358,974 0 3,426,488,350
Net Win 14,679,787 37,654,950 71,030,752 68,058,989 103,569,577 0 0 0 294,994,055
Education Contribution 7,339,894 19,968,119 37,631,484 35,808,960 55,507,275 0 0 0 156,255,732
Marketing Allowance 1,174,384 2,182,836 4,197,275 4,207,023 6,170,168 0 0 0 17,931,686
Lottery Administration 1,467,979 3,765,495 7,103,076 6,805,899 10,356,958 0 0 0 29,499,407
Capital Award 0 0 0 0 0 0 0 0 0
Racetrack Commission 4,697,531 11,738,498 22,098,918 21,237,106 31,535,177 0 0 0 91,307,230
Less: Purse Contributions* 1,100,981 3,019,958 5,114,870 9,235,809
Net Racetrack Commission 3,596,550 8,718,540 22,098,918 16,122,236 31,535,177 0 0 0 82,071,421
Total VGM Machines 586 990 1,010 1,576 1,324 0 0 0 5,486
Avg Machine win/year 25,051 38,035 70,327 43,185 78,225 0 0 0 53,772
Purse Contribution/Net Win 7.5% 8.0% 0.0% 7.5% 3.1%
Estimated
Batavia started
gaming
operations May
2005
Tioga started
gaming
operations
Jul 2006
Vernon started
gaming
operations Oct
2006
Yonkers started
gaming
operations Oct
2006
* Purse information was obtained from NYSRWB Form T05 filed by the tracks annually with the New York State Racing & Wagering Board.
Items blocked out are subject to Freedom of Information issues raised by the track that are currently being addressed.
New York State Race Tracks
Video Gaming Statistics
2005
Source: New York State Lottery Video Gaming Reports43

ATTACHEMENT IV
Batavia Downs
Casino
Fairground
Gaming &
Raceway
Finger Lakes
Gaming &
Raceway
Monticello
Casino &
Raceway
Saratoga
Gaming &
Raceway
Tioga Downs
Casino
Vernon
Downs
Casino &
Hotel
Empire City
Casino
Yonkers
Raceway Total
Video Gaming
Credits Played 291,809,920 476,273,207 1,068,628,840 999,466,021 1,482,170,883 254,543,648 82,621,586 633,529,259 5,289,043,364
Credits won 267,800,799 434,414,453 982,016,239 922,955,676 1,362,852,109 233,674,388 75,428,129 583,596,128 4,862,737,921
Net Win 24,009,121 41,858,754 86,612,601 76,510,345 119,318,774 20,869,260 7,193,457 49,933,131 426,305,443
Education Contribution 12,004,559 20,929,378 44,404,678 39,050,483 61,902,299 10,434,629 3,596,729 26,963,890 219,286,645
Marketing Allowance 1,920,729 3,348,701 6,929,008 6,120,827 9,382,152 1,669,541 575,476 1,997,325 31,943,759
Lottery Administration 2,400,911 4,185,876 8,661,260 7,651,034 11,931,878 2,086,926 719,345 4,993,312 42,630,542
Capital Award 0 0 0 0 0 0 0 0 0
Racetrack Commission 7,682,918 13,394,804 26,617,654 23,688,000 36,102,445 6,678,164 2,301,906 15,978,602 132,444,493
Less: Purse Contributions* 1,800,683 3,557,908 5,959,902 1,762,069 593,460 4,138,458 17,812,480
Net Racetrack Commission 5,882,235 9,836,896 26,617,654 17,728,098 36,102,445 4,916,095 1,708,446 11,840,144 114,632,013
Total VGM Machines 591 959 1,200 1,587 1,331 750 777 2,590 9,785
Avg Machine win/year 40,625 43,648 72,177 48,211 89,646 27,826 9,258 19,279 43,567
Purse Contribution/Net Win 7.5% 8.5% 0.0% 7.8% 0.0% 8.4% 8.2% 8.3% 4.2%
Estimated
Tioga started
gaming
operations Jul
2006
Vernon
started
gaming
operations
Oct 2006
Yonkers
started
gaming
operations
Oct 2006
* Purse information was obtained from NYSRWB Form T05 filed by the tracks annually with the New York State Racing & Wagering Board.
Items blocked out are subject to Freedom of Information issues raised by the track that are currently being addressed.
New York State Race Tracks
Video Gaming Statistics
2006
Source: New York State Lottery Video Gaming Reports44

ATTACHMENT IV
Batavia Downs
Casino
Fairground
Gaming &
Raceway
Finger Lakes
Gaming &
Raceway
Monticello
Casino &
Raceway
Saratoga
Gaming &
Raceway
Tioga Downs
Casino
Vernon
Downs
Casino &
Hotel
Empire City
Casino
Yonkers
Raceway Total
Video Gaming
Credits Played 335,154,254 510,562,913 1,140,383,912 832,989,622 1,603,371,989 515,478,743 356,555,957 4,852,984,612 10,147,482,002
Credits won 306,905,493 465,710,179 1,047,170,379 768,699,381 1,473,587,316 474,044,769 324,501,172 4,458,658,308 9,319,276,997
Net Win 28,248,761 44,852,734 93,213,533 64,290,241 129,784,673 41,433,974 32,054,785 394,326,304 828,205,005
Education Contribution 14,124,381 22,426,368 47,903,173 32,598,640 67,909,444 20,716,988 16,027,392 228,188,675 449,895,061
Marketing Allowance 2,259,900 3,588,219 7,457,082 5,143,219 9,759,206 3,314,717 2,564,383 15,773,052 49,859,778
Lottery Administration 2,824,876 4,485,274 9,321,354 6,429,024 12,978,465 4,143,397 3,205,478 39,432,631 82,820,499
Capital Award 0 0 0 0 0 0 0 0 0
Racetrack Commission 9,039,605 14,352,873 28,531,925 20,119,358 39,137,555 13,258,872 10,257,532 110,931,947 245,629,667
Less: Purse Contributions* 2,118,718 3,812,482 5,306,355 3,509,532 2,633,415 25,079,733 42,460,235
Net Racetrack Commission 6,920,887 10,540,391 28,531,925 14,813,003 39,137,555 9,749,340 7,624,117 85,852,214 203,169,432
Total VGM Machines 592 959 1,199 1,587 1,770 750 761 5,446 13,064
Avg Machine win/year 47,718 46,770 77,743 40,511 73,325 55,245 42,122 72,407 63,396
Purse Contribution/Net Win 7.5% 8.5% 0.0% 8.3% 0.0% 8.5% 8.2% 6.4% 5.1%
Estimated
* Purse information was obtained from NYSRWB Form T05 filed by the tracks annually with the New York State Racing & Wagering Board.
Items blocked out are subject to Freedom of Information issues raised by the track that are currently being addressed.
New York State Race Tracks
Video Gaming Statistics
2007
Source: New York State Lottery Video Gaming Reports45

ATTACHMENT IV
Batavia Downs
Casino
Fairground
Gaming &
Raceway
Finger Lakes
Gaming &
Raceway
Monticello
Casino &
Raceway
Saratoga
Gaming &
Raceway
Tioga Downs
Casino
Vernon
Downs
Casino &
Hotel
Empire City
Casino
Yonkers
Raceway Total
Video Gaming
Credits Played 376,279,321 568,284,905 1,218,190,642 749,345,701 1,616,944,135 572,692,456 413,791,486 5,960,306,342 11,475,834,988
Credits won 343,818,941 518,282,777 1,116,819,923 691,236,518 1,482,570,574 525,452,245 376,531,968 5,473,846,663 10,528,559,609
Net Win 32,460,380 50,002,128 101,370,719 58,109,183 134,373,561 47,240,211 37,259,518 486,459,679 947,275,379
Education Contribution 13,702,495 18,920,293 47,373,477 24,038,943 64,575,711 18,545,391 14,021,326 245,107,194 446,284,830
Marketing Allowance 3,102,371 4,760,267 9,650,860 5,546,617 11,805,419 4,504,177 3,556,816 34,214,593 77,141,120
Lottery Administration 3,246,039 5,000,213 10,137,071 5,810,919 13,437,358 4,724,021 3,725,953 48,645,968 94,727,542
Capital Award 1,011,078 1,520,193 2,500,000 0 2,500,000 1,449,964 1,152,109 2,500,000 12,633,344
Racetrack Commission 11,398,398 19,801,162 31,709,312 22,712,705 42,055,075 18,016,705 14,803,317 155,991,927 316,488,601
Less: Purse Contributions* 2,434,528 4,250,181 4,946,342 3,994,526 3,064,421 35,392,612 54,082,610
Net Racetrack Commission 8,963,870 15,550,981 31,709,312 17,766,363 42,055,075 14,022,179 11,738,896 120,599,315 262,405,991
Total VGM Machines 603 959 1,198 1,587 1,770 758 761 5,334 12,970
Avg Machine win/year 53,831 52,140 84,617 36,616 75,917 62,322 48,961 91,200 73,036
Purse Contribution/Net Win 7.5% 8.5% 0.0% 8.5% 0.0% 8.5% 8.2% 7.3% 5.7%
* Purse information was obtained from NYSRWB Form T05 filed by the tracks annually with the New York State Racing & Wagering Board.
Items blocked out are subject to Freedom of Information issues raised by the track that are currently being addressed.
New York State Race Tracks
Video Gaming Statistics
2008
Source: New York State Lottery Video Gaming Reports46

ATTACHEMENT IV
Batavia Downs Casino [Linked to 2004 - 2008]
2004 2005 2006 2007 2008 Total
Video Gaming
Credits Played 0 180,895,554 291,809,920 335,154,254 376,279,321 1,184,139,049
Credits won 0 166,215,767 267,800,799 306,905,493 343,818,941 1,084,741,000
Net Win 0 14,679,787 24,009,121 28,248,761 32,460,380 99,398,049
Education Contribution 0 7,339,894 12,004,559 14,124,381 13,702,495 47,171,329
Marketing Allowance 0 1,174,384 1,920,729 2,259,900 3,102,371 8,457,384
Lottery Administration 0 1,467,979 2,400,911 2,824,876 3,246,039 9,939,805
Capital Award 0 0 0 0 1,011,078 1,011,078
Racetrack Commission 0 4,697,531 7,682,918 9,039,605 11,398,398 32,818,452
Less: Purse Contributions* 0 1,100,981 1,800,683 2,118,718 2,434,528 7,454,910
Net Racetrack Commission 0 3,596,550 5,882,235 6,920,887 8,963,870 25,363,542
Total VGM Machines 0 586 591 592 603 2,372
Avg Machine win/year 0 25,051 40,625 47,718 53,831 41,905
Purse Contribution/Net Win 7.5% 7.5% 7.5% 7.5% 7.5%
Batavia started
gaming
operations May
2005
* Purse information was obtained from NYSRWB Form T05 filed annually by the tracks with the New York State Racing and Wagering Board.
Souorce: New York State Lottery Video Gaming Reports47

ATTACHMENT IV
Fairgrounds Gaming & Raceway [Linked to 2004 - 2008]
2004 2005 2006 2007 2008 Total
Video Gaming
Credits Played 331,815,115 440,374,772 476,273,207 510,562,913 568,284,905 2,327,310,912
Credits won 304,319,450 402,719,822 434,414,453 465,710,179 518,282,777 2,125,446,681
Net Win 27,495,665 37,654,950 41,858,754 44,852,734 50,002,128 201,864,231
Education Contribution 16,772,356 19,968,119 20,929,378 22,426,368 18,920,293 99,016,514
Marketing Allowance 0 2,182,836 3,348,701 3,588,219 4,760,267 13,880,023
Lottery Administration 2,749,567 3,765,495 4,185,876 4,485,274 5,000,213 20,186,425
Capital Award 0 0 0 0 1,520,193 1,520,193
Racetrack Commission 7,973,743 11,738,498 13,394,804 14,352,873 19,801,162 67,261,080
Less: Purse Contributions* 1,858,982 3,019,958 3,557,908 3,812,482 4,250,181 16,499,511
Net Racetrack Commission 6,114,761 8,718,540 9,836,896 10,540,391 15,550,981 50,761,569
Total VGM Machines 990 990 959 959 959 4,857
Avg Machine win/year 27,773 38,035 43,648 46,770 52,140 41,562
Purse Contribution/Net Win 6.8% 8.0% 8.5% 8.5% 8.5% 8.2%
Buffalo
started
gaming
operations
Mar 2004
* Purse information was obtained from NYSRWB Form T05 filed annually by the tracks with the New York State Racing and Wagering Board.
Souorce: New York State Lottery Video Gaming Reports48

ATTACHMENT IV
Finger Lakes Gaming & Raceway [Linked to 2004 - 2008]
2004 2005 2006 2007 2008 Total
Video Gaming
Credits Played 690,126,161 897,590,572 1,068,628,840 1,140,383,912 1,218,190,642 5,014,920,127
Credits won 634,728,556 826,559,820 982,016,239 1,047,170,379 1,116,819,923 4,607,294,917
Net Win 55,397,605 71,030,752 86,612,601 93,213,533 101,370,719 407,625,210
Education Contribution 33,792,538 37,631,484 44,404,678 47,903,173 47,373,477 211,105,350
Marketing Allowance 0 4,197,275 6,929,008 7,457,082 9,650,860 28,234,225
Lottery Administration 5,539,760 7,103,076 8,661,260 9,321,354 10,137,071 40,762,521
Capital Award 0 0 0 0 2,500,000 2,500,000
Racetrack Commission 16,065,306 22,098,918 26,617,654 28,531,925 31,709,312 125,023,115
Less: Purse Contributions* 0
Net Racetrack Commission 16,065,306 22,098,918 26,617,654 28,531,925 31,709,312 125,023,115
Total VGM Machines 1,010 1,010 1,200 1,199 1,198 5,617
Avg Machine win/year 54,849 70,327 72,177 77,743 84,617 72,570
Purse Contribution/Net Win 0.0% 0.0% 0.0% 0.0% 0.0% 0.0%
* Purse information was obtained from NYSRWB Form T05 filed annually by the tracks with the New York State Racing and Wagering Board.
Items blocked out are subject to Freedom of Information issues raised by the track that are currently being addressed.
Source: New York State Lottery Video Gaming Reports49

ATTACHMENT IV
Monticello Casino & Raceway [Linked to 2004 - 2008]
2004 2005 2006 2007 2008 Total
Video Gaming
Credits Played 423,006,817 891,692,956 999,466,021 832,989,622 749,345,701 3,896,501,117
Credits won 390,722,051 823,633,967 922,955,676 768,699,381 691,236,518 3,597,247,593
Net Win 32,284,766 68,058,989 76,510,345 64,290,241 58,109,183 299,253,524
Education Contribution 19,693,707 35,808,960 39,050,483 32,598,640 24,038,943 151,190,733
Marketing Allowance 0 4,207,023 6,120,827 5,143,219 5,546,617 21,017,686
Lottery Administration 3,228,477 6,805,899 7,651,034 6,429,024 5,810,919 29,925,353
Capital Award 0 0 0 0 0 0
Racetrack Commission 9,362,582 21,237,106 23,688,000 20,119,358 22,712,705 97,119,751
Less: Purse Contributions* 2,424,909 5,114,870 5,959,902 5,306,355 4,946,342 23,752,378
Net Racetrack Commission 6,937,673 16,122,236 17,728,098 14,813,003 17,766,363 73,367,373
Total VGM Machines 1,744 1,576 1,587 1,587 1,587 8,081
Avg Machine win/year 18,512 43,185 48,211 40,511 36,616 37,032
Purse Contribution/Net Win 7.5% 7.5% 7.8% 8.3% 8.5% 7.9%
Monticello
started
gaming
operations
Jun 2004
* Purse information was obtained from NYSRWB Form T05 filed annually by the tracks with the New York State Racing and Wagering Board.
Souorce: New York State Lottery Video Gaming Reports50

ATTACHMENT IV
Saratoga Gaming & Raceway [Linked to 2004 - 2008]
2004 2005 2006 2007 2008 Total
Video Gaming
Credits Played 981,433,754 1,310,928,551 1,482,170,883 1,603,371,989 1,616,944,135 6,994,849,312
Credits won 904,164,292 1,207,358,974 1,362,852,109 1,473,587,316 1,482,570,574 6,430,533,265
Net Win 77,269,462 103,569,577 119,318,774 129,784,673 134,373,561 564,316,047
Education Contribution 47,134,371 55,507,275 61,902,299 67,909,444 64,575,711 297,029,100
Marketing Allowance 0 6,170,168 9,382,152 9,759,206 11,805,419 37,116,945
Lottery Administration 7,726,946 10,356,958 11,931,878 12,978,465 13,437,358 56,431,605
Capital Award 0 0 0 0 2,500,000 2,500,000
Racetrack Commission 22,408,144 31,535,177 36,102,445 39,137,555 42,055,075 171,238,396
Less: Purse Contributions* 0
Net Racetrack Commission 22,408,144 31,535,177 36,102,445 39,137,555 42,055,075 171,238,396
Total VGM Machines 1,324 1,324 1,331 1,770 1,770 7,519
Avg Machine win/year 58,361 78,225 89,646 73,325 75,917 75,052
Purse Contribution/Net Win 0.0% 0.0% 0.0% 0.0% 0.0% 0.0%
* Purse information was obtained from NYSRWB Form T05 filed annually by the tracks with the New York State Racing and Wagering Board.
Souorce: New York State Lottery Video Gaming Reports51

ATTACHMENT IV
Tioga Downs Casino [Linked to 2004 - 2008]
2004 2005 2006 2007 2008 Total
Video Gaming
Credits Played 0 0 254,543,648 515,478,743 572,692,456 1,342,714,847
Credits won 0 0 233,674,388 474,044,769 525,452,245 1,233,171,402
Net Win 0 0 20,869,260 41,433,974 47,240,211 109,543,445
Education Contribution 0 0 10,434,629 20,716,988 18,545,391 49,697,008
Marketing Allowance 0 0 1,669,541 3,314,717 4,504,177 9,488,435
Lottery Administration 0 0 2,086,926 4,143,397 4,724,021 10,954,344
Capital Award 0 0 0 0 1,449,964 1,449,964
Racetrack Commission 0 0 6,678,164 13,258,872 18,016,705 37,953,741
Less: Purse Contributions* 0 0 1,762,069 3,509,532 3,994,526 9,266,127
Net Racetrack Commission 0 0 4,916,095 9,749,340 14,022,179 28,687,614
Total VGM Machines 0 0 750 750 758 2,258
Avg Machine win/year 0 0 27,826 55,245 62,322 48,513
Purse Contribution/Net Win 8.4% 8.5% 8.5% 8.5%
Tioga started
gaming
operations Jul
2006
08/09 Lottery
report for
Tioga has a
$46 variance
from Net Win
to Total
Distribution
* Purse information was obtained from NYSRWB Form T05 filed annually by the tracks with the New York State Racing and Wagering Board.
Souorce: New York State Lottery Video Gaming Reports52

ATTACHMENT IV
Vernon Downs Casino & Hotel [Linked to 2004 - 2008]
2004 2005 2006 2007 2008 Total
Video Gaming
Credits Played 0 0 82,621,586 356,555,957 413,791,486 852,969,029
Credits won 0 0 75,428,129 324,501,172 376,531,968 776,461,269
Net Win 0 0 7,193,457 32,054,785 37,259,518 76,507,760
Education Contribution 0 0 3,596,729 16,027,392 14,021,326 33,645,447
Marketing Allowance 0 0 575,476 2,564,383 3,556,816 6,696,675
Lottery Administration 0 0 719,345 3,205,478 3,725,953 7,650,776
Capital Award 0 0 0 0 1,152,109 1,152,109
Racetrack Commission 0 0 2,301,906 10,257,532 14,803,317 27,362,755
Less: Purse Contributions* 0 0 593,460 2,633,415 3,064,421 6,291,296
Net Racetrack Commission 0 0 1,708,446 7,624,117 11,738,896 21,071,459
Total VGM Machines 0 0 777 761 761 2,299
Avg Machine win/year 0 0 9,258 42,122 48,961 33,279
Purse Contribution/Net Win 8.2% 8.2% 8.2% 8.2%
Vernon started
gaming
operations Oct
2006
* Purse information was obtained from NYSRWB Form T05 filed annually by the tracks with the New York State Racing and Wagering Board.
Souorce: New York State Lottery Video Gaming Reports53

ATTACHMENT IV
Empire City Casino Yonkers Raceway [Linked to 2004 - 2008]
2004 2005 2006 2007 2008 Total
Video Gaming
Credits Played 0 0 633,529,259 4,852,984,612 5,960,306,342 11,446,820,213
Credits won 0 0 583,596,128 4,458,658,308 5,473,846,663 10,516,101,099
Net Win 0 0 49,933,131 394,326,304 486,459,679 930,719,114
Education Contribution 0 0 26,963,890 228,188,675 245,107,194 500,259,759
Marketing Allowance 0 0 1,997,325 15,773,052 34,214,593 51,984,970
Lottery Administration 0 0 4,993,312 39,432,631 48,645,968 93,071,911
Capital Award 0 0 0 0 2,500,000 2,500,000
Racetrack Commission 0 0 15,978,602 110,931,947 155,991,927 282,902,476
Less: Purse Contributions* 0 0 4,138,458 25,079,733 35,392,612 64,610,803
Net Racetrack Commission 0 0 11,840,144 85,852,214 120,599,315 218,291,673
Total VGM Machines 0 0 2,590 5,446 5,334 13,370
Avg Machine win/year 0 0 19,279 72,407 91,200 69,612
Purse Contribution/Net Win 8.3% 6.4% 7.3% 6.9%
Yonkers
started gaming
operations Oct
2006
* Purse information was obtained from NYSRWB Form T05 filed annually by the tracks with the New York State Racing and Wagering Board.
Souorce: New York State Lottery Video Gaming Reports54

ATTACHMENT V
Financial Analysis
Capital Catskill Nassau New York City Suffolk Western Average
Exhibit 3 Analysis
Out-of-State Thoroughbred Payments as a Percentage of Out-of-State Handle
2008 2.7% 2.6% 2.6% 2.5% 2.6% 2.7% 2.6%
2007 2.4% 2.3% 2.3% 2.2% 2.3% 2.4% 2.3%
2006 2.4% 2.3% 2.3% 2.2% 2.3% 2.4% 2.3%
2005 2.4% 2.4% 2.2% 2.3% 2.3% 2.4% 2.3%
2004 2.4% 2.3% 2.2% 2.2% 2.3% 2.3% 2.3%
Total Simulcast Import Payments as a Percentage of Total Handle
2008 10.4% 10.6% 10.7% 11.0% 10.2% 10.4% 10.7%
2007 10.4% 10.1% 9.9% 10.8% 10.0% 10.4% 10.5%
2006 10.3% 10.9% 9.9% 10.9% 10.1% 10.3% 10.6%
2005 9.9% 10.1% 10.0% 10.7% 10.1% 10.3% 10.4%
2004 10.2% 10.1% 10.0% 10.7% 10.1% 10.4% 10.4%
Operating Revenue as a Percentage to Handle
2008 11.9% 12.8% 11.2% 11.8% 12.2% 15.7% 12.1%
2007 11.8% 13.1% 12.0% 11.4% 12.3% 14.2% 11.9%
2006 11.9% 12.7% 12.0% 11.1% 13.3% 13.7% 11.8%
2005 11.9% 13.4% 11.9% 11.3% 13.1% 12.6% 11.9%
2004 12.1% 12.9% 11.6% 11.0% 12.7% 11.8% 11.6%
Branch Expense as a Percentage of Handle
2008 7.6% 7.9% 7.1% 9.9% 8.2% 10.9% 9.0%
2007 7.3% 7.6% 6.6% 9.0% 7.7% 10.7% 8.3%
2006 7.1% 7.2% 6.5% 8.4% 8.5% 10.6% 8.1%
2005 7.1% 7.2% 6.3% 8.4% 8.1% 10.5% 8.0%
2004 7.7% 7.5% 6.5% 8.4% 8.0% 10.3% 8.1%
Corporate Expense as a Percentage of Handle
2008 3.7% 2.3% 4.1% 10.4% 5.1% 3.6% 7.2%
2007 3.7% 2.0% 3.9% 5.7% 4.8% 3.4% 4.7%
2006 3.6% 1.8% 3.8% 14.3% 4.9% 3.1% 9.1%
2005 3.4% 1.7% 3.6% 3.5% 4.8% 3.0% 3.4%
2004 3.5% 1.9% 2.8% 3.7% 4.6% 2.9% 3.4%
NEW YORK STATE REGIONAL OFF-TRACK BETTING CORPORATIONS
Uniform Quarterly Report's Exhibits 2, 3 & 9
Source: Analysis of Quarterly Reports Filed by the OTBs with the NYS Racing Board Pursuant to Section 524 of the Racing Law.55

ATTACHMENT V
Financial Analysis
Capital Catskill Nassau New York City Suffolk Western Average
NEW YORK STATE REGIONAL OFF-TRACK BETTING CORPORATIONS
Uniform Quarterly Report's Exhibits 2, 3 & 9
Total Expense as a Percentage of Handle
2008 11.4% 10.1% 11.2% 20.3% 13.3% 14.5% 16.2%
2007 11.0% 9.6% 10.4% 14.7% 12.6% 14.0% 13.1%
2006 10.6% 9.0% 10.2% 22.8% 13.4% 13.6% 17.2%
2005 10.6% 9.0% 9.9% 11.8% 12.8% 13.5% 11.4%
2004 11.2% 9.4% 9.3% 12.1% 12.7% 13.2% 11.5%
Section 516 Net Revenue as a Percentage of Handle
2008 0.5% 2.6% 0.1% -8.5% -1.1% 1.1% -4.1%
2007 0.8% 3.5% 1.6% -3.3% -0.2% 0.1% -1.2%
2006 1.3% 3.7% 1.8% -11.6% 0.0% 0.1% -5.4%
2005 1.3% 4.5% 2.0% -0.5% 0.2% -0.9% 0.4%
2004 0.9% 3.6% 2.3% -1.0% 0.1% -1.4% 0.1%
Exhibit 9 Analysis
Advertising as a Percentage of Handle
2008 0.03% 0.14% 0.17% 0.09% 0.03% 0.15% 0.10%
2007 0.02% 0.14% 0.15% 0.14% 0.05% 0.10% 0.12%
2006 0.02% 0.15% 0.11% 0.10% 0.04% 0.10% 0.09%
2005 0.01% 0.32% 0.14% 0.16% 0.03% 0.10% 0.14%
2004 -0.01% 0.32% 0.17% 0.20% 0.01% 0.09% 0.15%
Fringe Benefits as a Percentage of Handle
2008 1.15% 0.00% 1.84% 9.08% 2.66% 2.88% 5.49%
2007 1.26% 0.00% 1.85% 4.56% 2.59% 2.91% 3.22%
2006 1.24% 0.00% 1.82% 2.19% 2.73% 2.85% 1.98%
2005 1.21% 0.00% 1.90% 2.11% 2.60% 2.69% 1.92%
2004 1.50% 0.00% 1.52% 2.10% 2.75% 2.69% 1.92%
Source: Analysis of Quarterly Reports Filed by the OTBs with the NYS Racing Board Pursuant to Section 524 of the Racing Law.56
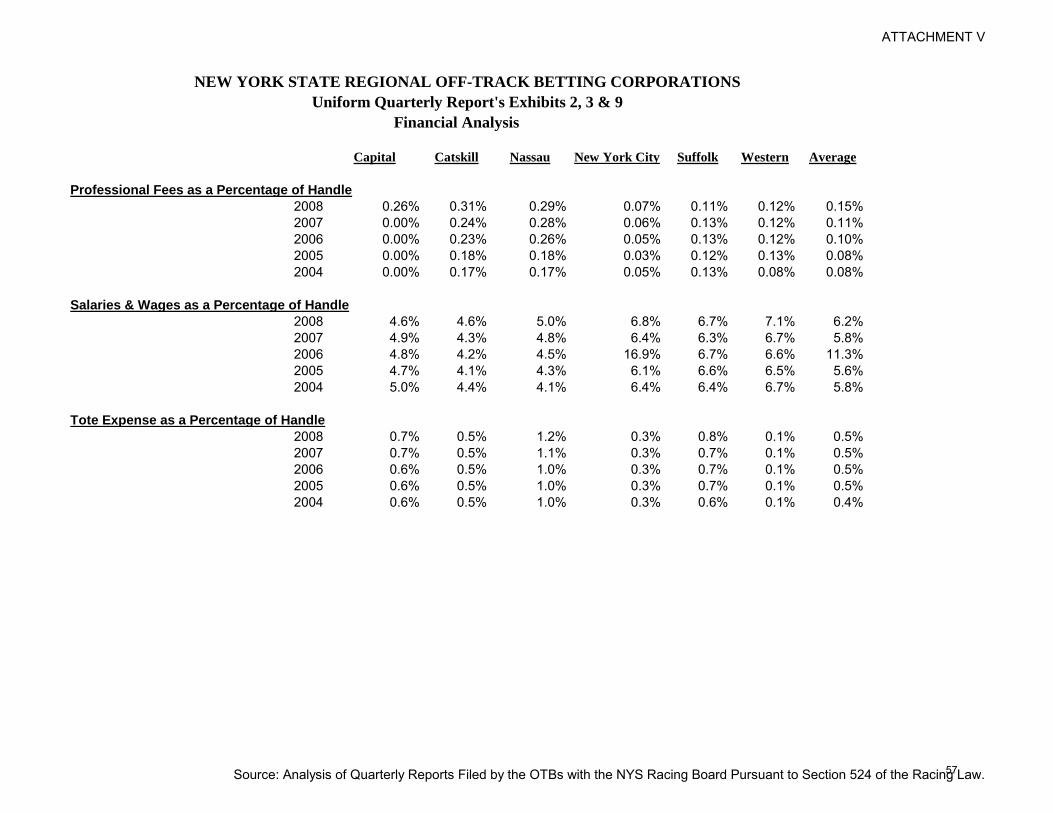
ATTACHMENT V
Financial Analysis
Capital Catskill Nassau New York City Suffolk Western Average
NEW YORK STATE REGIONAL OFF-TRACK BETTING CORPORATIONS
Uniform Quarterly Report's Exhibits 2, 3 & 9
Professional Fees as a Percentage of Handle
2008 0.26% 0.31% 0.29% 0.07% 0.11% 0.12% 0.15%
2007 0.00% 0.24% 0.28% 0.06% 0.13% 0.12% 0.11%
2006 0.00% 0.23% 0.26% 0.05% 0.13% 0.12% 0.10%
2005 0.00% 0.18% 0.18% 0.03% 0.12% 0.13% 0.08%
2004 0.00% 0.17% 0.17% 0.05% 0.13% 0.08% 0.08%
Salaries & Wages as a Percentage of Handle
2008 4.6% 4.6% 5.0% 6.8% 6.7% 7.1% 6.2%
2007 4.9% 4.3% 4.8% 6.4% 6.3% 6.7% 5.8%
2006 4.8% 4.2% 4.5% 16.9% 6.7% 6.6% 11.3%
2005 4.7% 4.1% 4.3% 6.1% 6.6% 6.5% 5.6%
2004 5.0% 4.4% 4.1% 6.4% 6.4% 6.7% 5.8%
Tote Expense as a Percentage of Handle
2008 0.7% 0.5% 1.2% 0.3% 0.8% 0.1% 0.5%
2007 0.7% 0.5% 1.1% 0.3% 0.7% 0.1% 0.5%
2006 0.6% 0.5% 1.0% 0.3% 0.7% 0.1% 0.5%
2005 0.6% 0.5% 1.0% 0.3% 0.7% 0.1% 0.5%
2004 0.6% 0.5% 1.0% 0.3% 0.6% 0.1% 0.4%
Source: Analysis of Quarterly Reports Filed by the OTBs with the NYS Racing Board Pursuant to Section 524 of the Racing Law.57

ATTACHMENT V
Financial Analysis
Capital Catskill Nassau New York City Suffolk Western Average
NEW YORK STATE REGIONAL OFF-TRACK BETTING CORPORATIONS
Uniform Quarterly Report's Exhibits 2, 3 & 9
Exhibit 2 Analysis
Current Ratio (Current Assets divided by Current Liabilities)
2008 1.07 3.55 1.13 0.25 0.54 0.68 0.61
2007 1.07 3.87 1.47 0.42 0.70 0.70 0.75
2006 1.03 3.97 1.53 0.55 0.94 0.72 0.88
2005 1.03 5.55 1.41 0.67 1.02 0.65 1.03
2004 1.11 5.02 0.56 0.87 1.00 0.18 0.94
Cash Ratio (Cash & Investments divided by Current Liabilities)
2008 0.95 3.49 1.07 0.23 0.38 0.56 0.56
2007 0.93 3.81 1.38 0.40 0.51 0.44 0.68
2006 0.88 3.90 1.36 0.51 0.74 0.45 0.78
2005 0.83 5.47 1.29 0.63 0.88 0.27 0.91
2004 0.88 4.96 0.34 0.80 0.68 0.09 0.81
Debt Ratio (Total Assets divided by Total Liabilities)
2008 1.58 4.27 1.23 0.07 1.50 2.14 0.45
2007 1.63 4.65 1.33 0.14 1.69 2.25 0.59
2006 1.66 4.41 1.31 0.21 1.78 2.18 0.69
2005 1.69 6.21 1.26 0.65 1.70 2.10 1.37
2004 1.74 5.78 1.45 0.80 1.77 2.75 2.67
Debt to Equity Ratio (Total Liabilities divided by Total Equity/ Undistributed Benefits)
2008 1.71 0.31 4.41 (1.07) 2.00 0.87 (1.81)
2007 1.59 0.27 3.03 (1.16) 1.46 0.79 (2.43)
2006 1.52 0.29 3.19 (1.26) 1.28 0.85 (3.21)
2005 1.44 0.19 3.84 (2.87) 1.42 0.91 2.67
2004 0.63 - 1.16 (1.07) 0.57 0.01 0.51
Source: Analysis of Quarterly Reports Filed by the OTBs with the NYS Racing Board Pursuant to Section 524 of the Racing Law.58

ATTACHMENT V
Financial Analysis
Capital Catskill Nassau New York City Suffolk Western Average
NEW YORK STATE REGIONAL OFF-TRACK BETTING CORPORATIONS
Uniform Quarterly Report's Exhibits 2, 3 & 9
Total number of wagering locations (branches/teletheaters)* Total
2008 80 25 21 68 25 45 264
Total Number of employees* Total
Full Time 2008 159 48 142 745 124 232 1,450
Part Time 2008 154 193 158 380 217 351 1,453
Total 2008 313 241 300 1,125 341 583 2,903
* - Information taken from the 2009 simulcast applications.
Source: Analysis of Quarterly Reports Filed by the OTBs with the NYS Racing Board Pursuant to Section 524 of the Racing Law.59
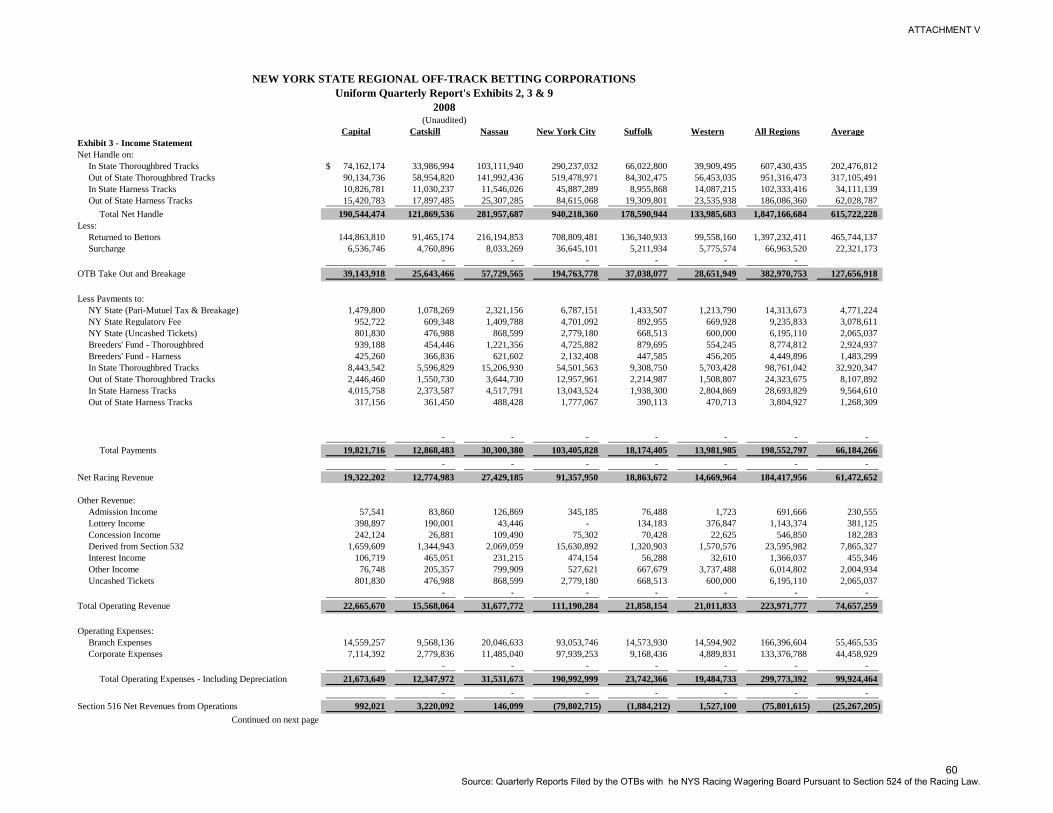
ATTACHMENT V
Capital Catskill Nassau New York City Suffolk Western All Regions Average
Exhibit 3 - Income Statement
Net Handle on:
In State Thoroughbred Tracks 74,162,174$ 33,986,994 103,111,940 290,237,032 66,022,800 39,909,495 607,430,435 202,476,812
Out of State Thoroughbred Tracks 90,134,736 58,954,820 141,992,436 519,478,971 84,302,475 56,453,035 951,316,473 317,105,491
In State Harness Tracks 10,826,781 11,030,237 11,546,026 45,887,289 8,955,868 14,087,215 102,333,416 34,111,139
Out of State Harness Tracks 15,420,783 17,897,485 25,307,285 84,615,068 19,309,801 23,535,938 186,086,360 62,028,787
Total Net Handle 190,544,474 121,869,536 281,957,687 940,218,360 178,590,944 133,985,683 1,847,166,684 615,722,228
Less:
Returned to Bettors 144,863,810 91,465,174 216,194,853 708,809,481 136,340,933 99,558,160 1,397,232,411 465,744,137
Surcharge 6,536,746 4,760,896 8,033,269 36,645,101 5,211,934 5,775,574 66,963,520 22,321,173
- - - - - -
OTB Take Out and Breakage 39,143,918 25,643,466 57,729,565 194,763,778 37,038,077 28,651,949 382,970,753 127,656,918
Less Payments to:
NY State (Pari-Mutuel Tax & Breakage) 1,479,800 1,078,269 2,321,156 6,787,151 1,433,507 1,213,790 14,313,673 4,771,224
NY State Regulatory Fee 952,722 609,348 1,409,788 4,701,092 892,955 669,928 9,235,833 3,078,611
NY State (Uncashed Tickets) 801,830 476,988 868,599 2,779,180 668,513 600,000 6,195,110 2,065,037
Breeders' Fund - Thoroughbred 939,188 454,446 1,221,356 4,725,882 879,695 554,245 8,774,812 2,924,937
Breeders' Fund - Harness 425,260 366,836 621,602 2,132,408 447,585 456,205 4,449,896 1,483,299
In State Thoroughbred Tracks 8,443,542 5,596,829 15,206,930 54,501,563 9,308,750 5,703,428 98,761,042 32,920,347
Out of State Thoroughbred Tracks 2,446,460 1,550,730 3,644,730 12,957,961 2,214,987 1,508,807 24,323,675 8,107,892
In State Harness Tracks 4,015,758 2,373,587 4,517,791 13,043,524 1,938,300 2,804,869 28,693,829 9,564,610
Out of State Harness Tracks 317,156 361,450 488,428 1,777,067 390,113 470,713 3,804,927 1,268,309
- - - - - - -
Total Payments 19,821,716 12,868,483 30,300,380 103,405,828 18,174,405 13,981,985 198,552,797 66,184,266
- - - - - - -
Net Racing Revenue 19,322,202 12,774,983 27,429,185 91,357,950 18,863,672 14,669,964 184,417,956 61,472,652
Other Revenue:
Admission Income 57,541 83,860 126,869 345,185 76,488 1,723 691,666 230,555
Lottery Income 398,897 190,001 43,446 - 134,183 376,847 1,143,374 381,125
Concession Income 242,124 26,881 109,490 75,302 70,428 22,625 546,850 182,283
Derived from Section 532 1,659,609 1,344,943 2,069,059 15,630,892 1,320,903 1,570,576 23,595,982 7,865,327
Interest Income 106,719 465,051 231,215 474,154 56,288 32,610 1,366,037 455,346
Other Income 76,748 205,357 799,909 527,621 667,679 3,737,488 6,014,802 2,004,934
Uncashed Tickets 801,830 476,988 868,599 2,779,180 668,513 600,000 6,195,110 2,065,037
- - - - - - -
Total Operating Revenue 22,665,670 15,568,064 31,677,772 111,190,284 21,858,154 21,011,833 223,971,777 74,657,259
Operating Expenses:
Branch Expenses 14,559,257 9,568,136 20,046,633 93,053,746 14,573,930 14,594,902 166,396,604 55,465,535
Corporate Expenses 7,114,392 2,779,836 11,485,040 97,939,253 9,168,436 4,889,831 133,376,788 44,458,929
- - - - - - -
Total Operating Expenses - Including Depreciation 21,673,649 12,347,972 31,531,673 190,992,999 23,742,366 19,484,733 299,773,392 99,924,464
- - - - - - -
Section 516 Net Revenues from Operations 992,021 3,220,092 146,099 (79,802,715) (1,884,212) 1,527,100 (75,801,615) (25,267,205)
Continued on next page
NEW YORK STATE REGIONAL OFF-TRACK BETTING CORPORATIONS
Uniform Quarterly Report's Exhibits 2, 3 & 9
2008(Unaudited)
Source: Quarterly Reports Filed by the OTBs with he NYS Racing Wagering Board Pursuant to Section 524 of the Racing Law.
60

ATTACHMENT V
Capital Catskill Nassau New York City Suffolk Western All Regions Average
NEW YORK STATE REGIONAL OFF-TRACK BETTING CORPORATIONS
Uniform Quarterly Report's Exhibits 2, 3 & 9
2008(Unaudited)
Continued from previous page
Section 516 Net Revenues from Operations 992,021 3,220,092 146,099 (79,802,715) (1,884,212) 1,527,100 (75,801,615) (25,267,205)
Less:
Section 509-a Contributions to Capital Acquisition Fund (294,050) 304,725 - - - - 10,675 3,558
- - - - - - -
Section 516 Net Revenue for Distribution (Loss) 697,971 3,524,817 146,099 (79,802,715) (1,884,212) 1,527,100 (75,790,940) (25,263,647)
Surcharge:
Section 532 Revenues to Participating Localities 2,881,011 2,169,941 3,963,739 8,422,826 2,272,275 2,503,838 22,213,630 7,404,543
Section 532 Revenues to Other Localities 1,195,082 649,468 1,024,544 2,356,787 951,372 933,202 7,110,455 2,370,152
- - - - - - -
Total Surcharge to all Localities 4,076,093 2,819,409 4,988,283 10,779,613 3,223,647 3,437,040 29,324,085 9,774,695
Capital Acquisition Funds:
Section 509-a Contribution from Net Revenues 294,050 (304,725) - - - - (10,675) (3,558)
Supplemental 1% Section 532 801,044 596,544 975,927 10,234,596 667,384 767,958 14,043,453 4,681,151
Other Fund Revenues net of Expenses (1,180,727) (702,208) (620,665) (1,006,279) (3,509,879) (1,169,960)
- - - - - - -
Total Capital Acquisition Funds (85,633) 291,819 273,719 10,234,596 46,719 (238,321) 10,522,899 3,507,633
TOTAL 516 NET REVENUE (LOSS), SURCHARGE - - - - - - -
AND CAPITAL ACQUISITIONS FUNDS 4,688,431$ 6,636,045 5,408,101 (58,788,506) 1,386,154 4,725,819 (35,943,956) (11,981,319)
Source: Quarterly Reports Filed by the OTBs with he NYS Racing Wagering Board Pursuant to Section 524 of the Racing Law.
61

ATTACHMENT V
Capital Catskill Nassau New York City Suffolk Western All Regions Average
NEW YORK STATE REGIONAL OFF-TRACK BETTING CORPORATIONS
Uniform Quarterly Report's Exhibits 2, 3 & 9
2008(Unaudited)
Exhibit 9 - Expenses -
Branch Operating Expenses -
Admissions Tax 272,502$ 3,225 4,888 16,978 3,494 110,017 411,104 137,035
Advertising 87,546 173,962 53,133 - 49,921 5,498 370,060 123,353
Amortization & Depreciation 140,032 98,778 20,432 - 144,526 358,118 761,886 253,962
Cable TV 32,554 16,453 47,211 - 15,714 - 111,932 37,311
Courier Service 126,559 - 109,333 - - - 235,892 78,631
Directors Fees and Reimbursements - - - - - - - -
Fringe Benefits 1,493,906 - 1,976,291 19,035,267 1,768,469 2,233,299 26,507,232 8,835,744
Insurance 294,379 992,573 113,387 1,463,666 116,724 188,707 3,169,436 1,056,479
Interest Expense - - 194,526 - 237,829 - 432,355 144,118
Maintenance & Repairs 887,246 340,264 180,650 375,835 221,018 984,977 2,989,990 996,663
Marketing & Promotions 164,520 - - - 404,016 - 568,536 189,512
Office Expense 80,576 37,331 110,241 174,617 98,147 - 500,912 166,971
Other Expenses & Services 467,444 57,066 943,885 224,201 45,394 1,129,483 2,867,473 955,824
Professional Fees - 207,818 - - 1,900 - 209,718 69,906
Racing Information 217,647 195,248 - - 635,879 404,065 1,452,839 484,280
Rent 1,477,756 1,738,974 1,765,680 17,400,046 1,612,051 318,982 24,313,489 8,104,496
Rental of Equipment 3,170 13,618 496,979 10,055 360,453 - 884,275 294,758
Salaries and Wages 5,956,681 4,010,019 9,226,634 45,062,742 6,709,174 7,450,640 78,415,890 26,138,630
Security/Armored Carrier Expense 69,808 41,863 533,429 1,095,686 38,840 38,699 1,818,325 606,108
Simulcast Fees 480,147 410,392 203,968 1,940,308 138,754 - 3,173,569 1,057,856
Telephone & Data Lines 210,085 110,029 61,170 1,851,068 97,042 428,719 2,758,113 919,371
Totalizator Expense 1,288,606 620,151 3,433,567 2,596,764 1,386,528 114,168 9,439,784 3,146,595
Travel & Reimbursement 21,826 100,801 - 8,631 6 7,182 138,446 46,149
U ilities 786,267 399,572 571,231 1,797,879 488,050 822,348 4,865,347 1,621,782
Total Branch Expenses 14,559,257 9,568,136 20,046,635 93,053,743 14,573,929 14,594,902 166,396,602 55,465,534
Source: Quarterly Reports Filed by the OTBs with he NYS Racing Wagering Board Pursuant to Section 524 of the Racing Law.
62

ATTACHMENT V
Capital Catskill Nassau New York City Suffolk Western All Regions Average
NEW YORK STATE REGIONAL OFF-TRACK BETTING CORPORATIONS
Uniform Quarterly Report's Exhibits 2, 3 & 9
2008(Unaudited)
Corporate Operating Expenses
Admissions Tax -$ - - - - - - -
Advertising (29,493) - 419,707 830,264 - 190,861 1,411,339 470,446
Amortization & Depreciation 46,531 159,625 480,968 191,634 75,276 93,338 1,047,372 349,124
Cable TV 2,018,124 1,462 2,546 - 1,122 - 2,023,254 674,418
Courier Service 5 - - - - - 5 2
Directors Fees and Reimbursements 57,800 - 4,000 - 9,067 102,385 173,252 57,751
Fringe Benefits 699,482 - 3,204,274 66,361,767 2,974,643 1,619,064 74,859,230 24,953,077
Insurance 179,475 402,126 169,880 594,417 120,449 62,045 1,528,392 509,464
Interest Expense - - - - - 52,015 52,015 17,338
Maintenance & Repairs 206,161 3,195 42,856 1,100,687 81,410 128,551 1,562,860 520,953
Marketing & Promotions 36,376 - 60,719 1,868,539 1,205 - 1,966,839 655,613
Office Expense 80,160 8,944 247,564 573,986 44,701 - 955,355 318,452
Other Expenses & Services 30,138 20,575 184,897 369,949 155,450 195,262 956,271 318,757
Professional Fees 504,054 170,033 810,404 655,303 193,476 157,803 2,491,073 830,358
Racing Information 21,816 - - - 1,685 - 23,501 7,834
Rent 21,454 319,261 249,303 4,952,081 47,429 1,440 5,590,968 1,863,656
Rental of Equipment 46,469 11,707 949 (40,861) 20,290 213,430 251,984 83,995
Salaries and Wages - President & Vice Presidents* 453,967 221,595 475,232 1,115,433 314,500 227,000 2,807,727 935,909
Salaries and Wages - Other Officers & Managers* 639,960 106,000 1,652,867 4,248,951 803,866 305,705 7,757,349 2,585,783
Salaries and Wages - Other 1,709,904 1,243,751 2,858,482 13,749,567 4,121,327 1,488,946 25,171,977 8,390,659
Security/Armored Carrier Expense 4,030 3,522 25,385 27,346 3,770 - 64,053 21,351
Simulcast Fees 3,700 - 731 231,604 - - 236,035 78,678
Telephone & Data Lines 93,818 31,191 339,262 448,634 26,622 28,326 967,853 322,618
Totalizator Expense 330 - - - - - 330 110
Travel & Reimbursement 139,910 17,788 133,619 72,429 76,144 11,729 451,619 150,540
U ilities 150,221 59,062 121,395 587,524 96,004 11,932 1,026,138 342,046
Total Corporate Expenses 7,114,392 2,779,836 11,485,040 97,939,254 9,168,436 4,889,832 133,376,790 44,458,930
* Source: The OTBs 2009 Simulcast Application Filed with the NYS Racing & Wagering Board
Source: Quarterly Reports Filed by the OTBs with he NYS Racing Wagering Board Pursuant to Section 524 of the Racing Law.
63

ATTACHMENT V
Capital Catskill Nassau New York City Suffolk Western All Regions Average
NEW YORK STATE REGIONAL OFF-TRACK BETTING CORPORATIONS
Uniform Quarterly Report's Exhibits 2, 3 & 9
2008(Unaudited)
Combined Expenses
Admissions Tax 272,502 3,225 4,888 16,978 3,494 110,017 411,104 137,035
Advertising 58,053 173,962 472,840 830,264 49,921 196,359 1,781,399 593,800
Amortization & Depreciation 186,563 258,403 501,400 191,634 219,802 451,456 1,809,258 603,086
Cable TV 2,050,678 17,915 49,757 - 16,836 - 2,135,186 711,729
Courier Service 126,564 - 109,333 - - - 235,897 78,632
Directors Fees and Reimbursements 57,800 - 4,000 - 9,067 102,385 173,252 57,751
Fringe Benefits 2,193,388 - 5,180,565 85,397,034 4,743,112 3,852,363 101,366,462 33,788,821
Insurance 473,854 1,394,699 283,267 2,058,083 237,173 250,752 4,697,828 1,565,943
Interest Expense - - 194,526 - 237,829 52,015 484,370 161,457
Maintenance & Repairs 1,093,407 343,459 223,506 1,476,522 302,428 1,113,528 4,552,850 1,517,617
Marketing & Promotions 200,896 - 60,719 1,868,539 405,221 - 2,535,375 845,125
Office Expense 160,736 46,275 357,805 748,603 142,848 - 1,456,267 485,422
Other Expenses & Services 497,582 77,641 1,128,782 594,150 200,844 1,324,745 3,823,744 1,274,581
Professional Fees 504,054 377,851 810,404 655,303 195,376 157,803 2,700,791 900,264
Racing Information 239,463 195,248 - - 637,564 404,065 1,476,340 492,113
Rent 1,499,210 2,058,236 2,014,983 22,352,127 1,659,480 320,422 29,904,458 9,968,153
Rental of Equipment 49,639 25,325 497,928 (30,806) 380,743 213,430 1,136,259 378,753
Salaries and Wages 8,760,512 5,581,365 14,213,215 64,176,693 11,948,867 9,472,291 114,152,943 38,050,981
Security/Armored Carrier Expense 73,838 45,384 558,814 1,123,032 42,610 38,699 1,882,377 627,459
Simulcast Fees 483,847 410,392 204,699 2,171,912 138,754 - 3,409,604 1,136,535
Telephone & Data Lines 303,903 141,219 400,432 2,299,702 123,664 457,045 3,725,965 1,241,988
Totalizator Expense 1,288,936 620,151 3,433,567 2,596,764 1,386,528 114,168 9,440,114 3,146,705
Travel & Reimbursement 161,736 118,589 133,619 81,060 76,150 18,911 590,065 196,688
U ilities 936,488 458,634 692,626 2,385,403 584,054 834,280 5,891,485 1,963,828
TOTAL EXPENSES 21,673,649 12,347,972 31,531,675 190,992,997 23,742,365 19,484,734 299,773,392 99,924,464
Source: Quarterly Reports Filed by the OTBs with he NYS Racing Wagering Board Pursuant to Section 524 of the Racing Law.
64

ATTACHMENT V
Capital Catskill Nassau New York City Suffolk Western All Regions Average
NEW YORK STATE REGIONAL OFF-TRACK BETTING CORPORATIONS
Uniform Quarterly Report's Exhibits 2, 3 & 9
2008(Unaudited)
BALANCE SHEET (EXHIBIT 2)
Current Assets
Cash and Cash Equivalents 8,019,000$ 17,704,248 3,160,339 8,618,063 3,527,336 5,748,814 46,777,800 15,592,600
Investments - 17,326 9,532,804 7,764,438 - - 17,314,568 5,771,523
Accounts Receivable 253,236 199,148 243,309 1,334,903 596,992 1,177,420 3,805,008 1,268,336
Prepaid Expenses and Other Assets 768,919 130,675 558,722 (190,973) 960,792 - 2,228,135 742,712
Total Current Assets 9,041,155 18,051,397 13,495,174 17,526,431 5,085,120 6,926,234 70,125,511 23,375,170
Fixed Assets
Land 3,069,827 240,000 432,050 - 2,058,342 7,406,815 13,207,034 4,402,345
Buildings 10,388,481 3,404,000 406,950 - 10,876,368 42,133,642 67,209,441 22,403,147
Furniture & Fixtures 7,598,436 435,712 718,093 535,993 8,030,283 17,318,517 5,772,839
Automobile Equipment 269,409 247,194 343,124 1,234,222 441,271 585,433 3,120,653 1,040,218
Machinery & Equipment 1,763,802 273,239 28,523,316 2,283,188 - 32,843,545 10,947,848
Leasehold Improvements (Nassau - Other) 2,725,657 1,201,387 22,530,487 41,438,481 3,266,131 418,974 71,581,117 23,860,372
Total Fixed Assets 24,051,810 7,292,095 23,985,850 71,914,112 19,461,293 58,575,147 205,280,307 68,426,769
Less: Accumulated Depreciation 13,207,832 3,658,053 1,255,287 71,219,073 5,618,184 26,915,990 121,874,419 40,624,806
Net Fixed Assets 10,843,978 3,634,042 22,730,563 695,039 13,843,109 31,659,157 83,405,888 27,801,963
Total Assets 19,885,133 21,685,439 36,225,737 18,221,470 18,928,229 38,585,391 153,531,399 51,177,133
Current Liabilities
Accounts Payable 5,961,283 3,695,161 7,554,475 48,392,397 5,545,515 6,789,768 77,938,599 25,979,533
Due to New York State 61,334 529,157 56,237 3,036,931 59,514 731,663 4,474,836 1,491,612
Due Breeders Fund 82,018 47,096 128,584 2,003,788 82,445 145,921 2,489,852 829,951
Due to Local Governments 50,341 - 73,469 608,207 - 39,627 771,644 257,215
Accrued Payroll, Fringe Benefits and Payroll Taxes 494,817 464,701 2,386,634 13,335,574 2,027,958 971,878 19,681,562 6,560,521
Due to NYS Retirement System - Current Portion - - - - - 719,328 719,328 239,776
Telephone Betting Accounts 591,923 183,596 588,167 1,714,707 298,282 126,237 3,502,912 1,167,637
Notes and Mortgage Payable - Current Portion 100,000 - 52,381 - 396,326 504,276 1,052,983 350,994
Capital Lease Obligations - Current Portion 96,894 - - 49,649 - - 146,543 48,848
Uncashed Vouchers 99,864 - 100,505 303,158 187,870 103,148 794,545 264,848
Uncashed Winning Tickets 887,807 162,101 959,466 440,804 741,266 66,090 3,257,534 1,085,845
Total Current Liabilities 8,426,281 5,081,812 11,899,918 69,885,215 9,339,176 10,197,936 114,830,338 38,276,779
Long Term Liabilities
Due to NYS Retirement System - - - - 437,125 437,125 145,708
Capital Lease Obligation 88,520 - - - - 88,520 29,507
Other - OPEB, etc 45,913 - 196,435,628 146,663 196,628,204 65,542,735
Notes and Mortgages Payable 4,000,000 - 17,633,953 3,276,717 7,214,657 32,125,327 10,708,442
Total Long Term Liabilities 4,134,433 - 17,633,953 196,435,628 3,276,717 7,798,445 229,279,176 76,426,392
Total Liabilities 12,560,714 5,081,812 29,533,871 266,320,843 12,615,893 17,996,381 344,109,514 114,703,171
Source: Quarterly Reports Filed by the OTBs with he NYS Racing Wagering Board Pursuant to Section 524 of the Racing Law.
65

ATTACHMENT V
Capital Catskill Nassau New York City Suffolk Western All Regions Average
NEW YORK STATE REGIONAL OFF-TRACK BETTING CORPORATIONS
Uniform Quarterly Report's Exhibits 2, 3 & 9
2008(Unaudited)
Undistributed Benefits To Localities
As of January 1:
Net Earnings and Regular Surcharge 2,399,447 5,598,327 702,626 (177,392,495) (417,901) (9,196,478) (178,306,474) (59,435,491)
Surcharge to Counties Conducting Racing - 38,828 - 52,006 56,512 1,968 149,314 49,771
Capital Acquisition Fund 5,525,484 11,191,741 8,351,584 - 8,541,025 29,750,724 63,360,558 21,120,186
Total 7,924,931 16,828,896 9,054,210 (177,340,489) 8,179,636 20,556,214 (114,796,602) (38,265,534)
Year To Date
Net Earnings and Regular Surcharge 3,565,826 5,694,756 4,109,838 (71,379,889) 388,064 3,882,058 (53,739,347) (17,913,116)
Surcharge Counties Conducting Racing 13,159 1,054,313 - 2,356,788 951,372 226,387 4,602,019 1,534,006
Capital Acquisition Fund Contributions (85,633) 291,820 273,719 10,234,597 46,718 (238,322) 10,522,899 3,507,633
Total Year To Date 3,493,352 7,040,889 4,383,557 (58,788,504) 1,386,154 3,870,123 (38,614,429) (12,871,476)
Available For Distribution
Net Earnings and Regular Surcharge 5,965,273 11,293,083 4,812,464 (248,772,384) (29,837) (5,314,420) (232,045,821) (77,348,607)
Surcharge to Counties Conducting Racing 13,159 1,093,141 - 2,408,794 1,007,884 228,355 4,751,333 1,583,778
Capital Acquisition Fund 5,439,851 11,483,561 8,625,303 10,234,597 8,587,744 29,512,402 73,883,458 24,627,819
Total Available 11,418,283 23,869,785 13,437,767 (236,128,993) 9,565,791 24,426,337 (153,411,030) (51,137,010)
Distributed To Localities
Net Earnings and Regular Surcharge 4,080,705 6,205,006 6,745,901 9,612,497 2,299,051 3,613,644 32,556,804 10,852,268
Surcharge to Counties Conducting Racing 13,159 1,061,151 - 2,357,883 954,404 223,682 4,610,279 1,536,760
Total Distributed 4,093,864 7,266,157 6,745,901 11,970,380 3,253,455 3,837,326 37,167,083 12,389,028
Undistributed Benefits
Net Earnings and Regular Surcharge 1,884,568 5,088,077 (1,933,437) (258,384,882) (2,328,888) (8,928,064) (264,602,626) (88,200,875)
Surcharge to Counties Conducting Racing - 31,990 - 50,911 53,480 4,673 141,054 47,018
Capital Acquisition Fund 5,439,851 11,483,561 8,625,303 10,234,597 8,587,744 29,512,402 73,883,458 24,627,819
Total Undistributed Benefits 7,324,419 16,603,628 6,691,866 (248,099,374) 6,312,336 20,589,011 (190,578,114) (63,526,038)
Total Liabilities and Undistributed
Benefits to Own Localities 19,885,133 21,685,440 36,225,737 18,221,469 18,928,229 38,585,392 153,531,400 51,177,133
NOTE: Governmental Accounting Standards Board # 45 (GASB) requires governmental entities to record the cost of providing other post employment benefits (OPEB) to employees in the year they are earned This
pronouncement became effective for all entities for the 2008 reporting year The OTBs have not uniformly applied GASB 45 therefore the following summary is provided to identify how these costs are reflected in the above reported figures
OTBs that included GASB 45 amounts in corporate expenses
under fringe benefits 48,022 58,705,000
OTBs that report the GASB 45 amounts but DO NOT REPORT
THEM AS EXPENSES AFFECTING SECTION 516 DISTRIBUTIONS 1,130,000 2,973,308 954,317
(These amounts are not reflected in the figures reported above )
OTB that has no OPEB amounts to report XX
Source: Quarterly Reports Filed by the OTBs with he NYS Racing Wagering Board Pursuant to Section 524 of the Racing Law.
66

ATTACHMENT V
Capital Catskill Nassau New York City Suffolk Western All Regions Average
Exhibit 3 - Income Statement
Net Handle on:
In State Thoroughbred Tracks 77,831,065 35,532,013 108,215,233 314,745,579 68,111,177 41,240,391 645,675,458 107,612,576
Out of State Thoroughbred Tracks 95,231,423 65,397,572 146,467,678 572,609,452 91,561,746 60,038,837 1,031,306,708 171,884,451
In State Harness Tracks 12,643,552 12,896,997 13,189,651 54,549,460 9,845,196 15,253,144 118,378,000 19,729,667
Out of State Harness Tracks 16,133,482 17,981,252 25,650,935 88,293,413 18,640,602 22,902,670 189,602,354 31,600,392
Total Net Handle 201,839,522 131,807,834 293,523,497 1,030,197,904 188,158,721 139,435,042 1,984,962,520 330,827,087
Less:
Returned to Bettors 153,383,708 98,823,334 224,857,899 785,313,845 143,850,589 103,631,039 1,509,860,414 251,643,402
Surcharge 7,248,883 5,131,305 8,609,467 32,460,058 5,441,814 6,050,691 64,942,218 10,823,703
- - - - - - - -
OTB Take Out and Breakage 41,206,931 27,853,195 60,056,131 212,424,001 38,866,318 29,753,312 410,159,888 68,359,981
Less Payments to:
NY State (Pari-Mutuel Tax & Breakage) 1,495,973 951,283 1,902,405 7,063,493 1,457,619 1,251,172 14,121,945 2,353,658
NY State Regulatory Fee 1,009,198 659,039 1,467,617 5,150,990 940,794 697,175 9,924,813 1,654,136
NY State (Uncashed Tickets) 814,640 468,531 850,287 3,485,619 585,550 650,000 6,854,627 1,142,438
Breeders' Fund - Thoroughbred 1,052,926 682,029 1,734,146 5,506,834 975,617 615,789 10,567,341 1,761,224
Breeders' Fund - Harness 454,493 392,658 654,474 2,353,976 456,005 459,875 4,771,481 795,247
In State Thoroughbred Tracks 8,924,938 6,089,691 15,797,024 58,718,029 9,868,847 6,092,655 105,491,184 17,581,864
Out of State Thoroughbred Tracks 2,313,214 1,534,321 3,330,991 12,713,987 2,065,026 1,436,086 23,393,625 3,898,938
In State Harness Tracks 4,278,661 2,195,884 2,835,476 14,070,108 2,032,024 2,815,804 28,227,957 4,704,660
Out of State Harness Tracks 335,929 368,167 498,784 1,816,128 377,741 457,337 3,854,086 642,348
City of Albany 304,435 - - - - - 304,435 50,739
City of Niagara - - - - - 42,566 42,566 7,094
- - - - - - - -
Total Payments 20,984,407 13,341,603 29,071,204 110,879,164 18,759,223 14,518,459 207,554,060 34,592,343
- - - - - - - -
Net Racing Revenue 20,222,524 14,511,592 30,984,927 101,544,837 20,107,095 15,234,853 202,605,828 33,767,638
Other Revenue:
Admission Income 62,017 93,320 142,455 374,420 96,940 2,185 771,337 128,556
Lottery Income 416,869 210,619 53,995 - 125,792 391,092 1,198,367 199,728
Concession Income 237,323 28,825 112,423 44,167 53,629 23,130 499,497 83,250
Derived from Section 532 1,783,913 1,448,250 2,232,040 9,578,056 1,404,818 1,643,369 18,090,446 3,015,074
Interest Income 125,919 222,437 472,819 1,502,591 153,796 60,164 2,537,726 422,954
Other Income 115,904 281,541 399,518 762,901 709,740 1,733,181 4,002,785 667,131
Uncashed Tickets 814,640 468,531 850,287 3,485,619 585,550 650,000 6,854,627 1,142,438
- - - - - - - -
Total Operating Revenue 23,779,109 17,265,115 35,248,464 117,292,591 23,237,360 19,737,974 236,560,613 39,426,769
Operating Expenses:
Branch Expenses 14,709,522 9,970,853 19,245,668 92,375,701 14,564,647 14,869,309 165,735,700 27,622,617
Corporate Expenses 7,481,298 2,692,283 11,426,668 58,784,370 9,110,263 4,711,511 94,206,393 15,701,066
- - - - - - - -
Total Operating Expenses - Including Depreciation 22,190,820 12,663,136 30,672,336 151,160,071 23,674,910 19,580,820 259,942,093 43,323,682
- - - - - - - -
Section 516 Net Revenues from Operations 1,588,289 4,601,979 4,576,128 (33,867,480) (437,550) 157,154 (23,381,480) (3,896,913)
Continued on next page
NEW YORK STATE REGIONAL OFF-TRACK BETTING CORPORATIONS
Uniform Quarterly Report's Exhibits 2, 3 & 9
2007(Unaudited)
Source: Quarterly Reports Filed with he NYS Racing Wagering Board Pursuant to Section 524 of the Racing Law.
67

ATTACHMENT V
Capital Catskill Nassau New York City Suffolk Western All Regions Average
NEW YORK STATE REGIONAL OFF-TRACK BETTING CORPORATIONS
Uniform Quarterly Report's Exhibits 2, 3 & 9
2007(Unaudited)
Continued from previous page
Section 516 Net Revenues from Operations 1,588,289 4,601,979 4,576,128 (33,867,480) (437,550) 157,154 (23,381,480) (3,896,913)
Less:
Section 509-a Contributions to Capital Acquisition Fund (309,600) 1,873,021 - - (39,851) - 1,523,570 253,928
- - - - - - - -
Section 516 Net Revenue for Distribution (Loss) 1,278,689 6,475,000 4,576,128 (33,867,480) (477,401) 157,154 (21,857,910) (3,642,985)
Surcharge:
Section 532 Revenues to Participating Localities 3,237,997 2,354,926 4,202,579 16,448,602 2,373,980 2,627,105 31,245,189 5,207,532
Section 532 Revenues to Other Localities 1,333,080 683,745 1,126,278 2,614,391 969,163 971,766 7,698,423 1,283,071
- - - - - - - -
Total Surcharge to all Localities 4,571,077 3,038,671 5,328,857 19,062,993 3,343,143 3,598,871 38,943,612 6,490,602
Capital Acquisition Funds:
Section 509-a Contribution from Net Revenues 309,600 (1,873,021) - - 39,851 - (1,523,570) (253,928)
Supplemental 1% Section 532 893,893 644,384 1,048,570 3,819,009 693,853 808,451 7,908,160 1,318,027
Other Fund Revenues net of Expenses (1,328,145) 655,998 (956,685) - (480,986) (1,035,280) (3,145,098) (524,183)
- - - - - - - -
Total Capital Acquisition Funds (124,652) (572,639) 91,885 3,819,009 252,718 (226,829) 3,239,492 539,915
TOTAL 516 NET REVENUE (LOSS), SURCHARGE - - - - - - - -
AND CAPITAL ACQUISITIONS FUNDS 5,725,114 8,941,032 9,996,870 (10,985,478) 3,118,460 3,529,196 20,325,194 3,387,532
Source: Quarterly Reports Filed with he NYS Racing Wagering Board Pursuant to Section 524 of the Racing Law.
68

ATTACHMENT V
Capital Catskill Nassau New York City Suffolk Western All Regions Average
NEW YORK STATE REGIONAL OFF-TRACK BETTING CORPORATIONS
Uniform Quarterly Report's Exhibits 2, 3 & 9
2007(Unaudited)
EXPENSE DETAIL (From Exh bit 9)
Branch Operating Expenses
Admissions Tax 2,481 3,520 5,544 18,620 3,643 68,530 102,338 17,056
Advertising 74,761 188,338 148,390 - 91,021 3,250 505,760 84,293
Amortization & Deprecia ion 141,027 216,239 28,396 - 148,045 391,368 925,075 154,179
Cable TV 32,639 15,644 44,896 - 14,534 - 107,713 17,952
Courier Service 117,673 - 112,517 - - - 230,190 38,365
Directors Fees and Reimbursements - - - - - - - -
Fringe Benefits 1,627,802 - 1,944,925 18,181,171 1,856,691 2,481,497 26,092,086 4,348,681
Insurance 317,789 1,033,800 127,794 1,935,506 173,593 234,842 3,823,324 637,221
Interest Expense 194 - - - 261,188 - 261,382 43,564
Maintenance & Repairs 898,547 400,222 169,181 607,623 258,021 1,095,716 3,429,310 571,552
Marketing & Promotions 161,419 - 5 - 384,601 - 546,025 91,004
Office Expense 80,884 19,021 113,791 221,129 64,020 - 498,845 83,141
Other Expenses & Services 454,431 68,736 852,788 413,705 72,824 1,042,307 2,904,791 484,132
Professional Fees - 176,785 - - 18,535 - 195,320 32,553
Racing Information 219,064 206,338 - - 742,192 376,334 1,543,928 257,321
Rent 1,455,125 1,787,293 1,570,965 15,091,182 1,256,241 304,233 21,465,039 3,577,507
Rental of Equipment 3,968 13,884 657,947 10,214 334,347 - 1,020,360 170,060
Salaries and Wages 6,202,055 4,161,699 9,009,209 46,691,400 6,724,186 7,538,009 80,326,558 13,387,760
Security/Armored Carrier Expense 65,387 41,883 490,846 1,058,558 40,469 37,439 1,734,582 289,097
Simulcast Fees 474,484 408,741 182,561 2,023,432 141,257 - 3,230,475 538,413
Telephone & Data Lines 293,803 106,588 85,980 1,772,246 210,337 355,277 2,824,231 470,705
Totalizator Expense 1,298,891 648,571 3,144,863 2,611,958 1,312,891 122,606 9,139,780 1,523,297
Travel & Reimbursement 11,063 83,242 - 9,060 6 5,637 109,008 18,168
Utilities 776,035 390,308 555,070 1,729,895 474,845 810,019 4,736,172 789,362
Total Branch Expenses 14,709,522 9,970,852 19,245,668 92,375,699 14,583,487 14,867,064 165,752,292 27,625,382
Source: Quarterly Reports Filed with he NYS Racing Wagering Board Pursuant to Section 524 of the Racing Law.
69

ATTACHMENT V
Capital Catskill Nassau New York City Suffolk Western All Regions Average
NEW YORK STATE REGIONAL OFF-TRACK BETTING CORPORATIONS
Uniform Quarterly Report's Exhibits 2, 3 & 9
2007(Unaudited)
Corporate Operating Expenses
Admissions Tax - - - - - - - -
Advertising (30,887) - 302,258 1,446,619 - 141,417 1,859,407 309,901
Amortization & Deprecia ion 61,431 141,290 466,339 136,257 89,353 72,479 967,149 161,192
Cable TV 7,354 800 2,278 - 992 - 11,424 1,904
Courier Service 12 - - - - - 12 2
Directors Fees and Reimbursements 58,600 - 4,000 2,250 10,279 48,906 124,035 20,673
Fringe Benefits 922,714 - 3,484,589 28,783,172 3,011,304 1,580,015 37,781,794 6,296,966
Insurance 207,051 423,590 171,797 767,954 130,632 97,410 1,798,434 299,739
Interest Expense - - - - - 59,006 59,006 9,834
Maintenance & Repairs 254,337 3,142 24,192 1,061,358 64,683 123,430 1,531,142 255,190
Marketing & Promotions 44,949 - 55,878 143,695 639 - 245,161 40,860
Office Expense 237,779 7,378 193,382 709,476 35,607 - 1,183,622 197,270
Other Expenses & Services 594,201 21,427 109,937 240,302 118,256 508,352 1,592,475 265,413
Professional Fees - 144,642 831,515 621,868 222,396 163,873 1,984,294 330,716
Racing Information 28,430 - - - 1,685 - 30,115 5,019
Rent 29,728 276,664 254,057 4,114,827 51,917 36,368 4,763,561 793,927
Rental of Equipment 994,213 14,326 971 204,899 34,169 - 1,248,578 208,096
Salaries and Wages 3,592,571 1,524,765 4,955,860 18,783,314 5,139,122 1,790,059 35,785,691 5,964,282
Security/Armored Carrier Expense 6,335 3,196 25,682 31,291 2,128 - 68,632 11,439
Simulcast Fees 58,323 - 4,250 165,989 - - 228,562 38,094
Telephone & Data Lines 140,885 66,813 311,142 675,931 30,871 29,764 1,255,406 209,234
Totalizator Expense 13,800 - - - - - 13,800 2,300
Travel & Reimbursement 128,686 14,690 104,919 105,092 69,969 28,738 452,094 75,349
Utilities 130,786 49,560 123,621 790,075 95,379 31,694 1,221,115 203,519
Total Corporate Expenses 7,481,298 2,692,283 11,426,667 58,784,369 9,109,381 4,711,511 94,205,509 15,700,918
Source: Quarterly Reports Filed with he NYS Racing Wagering Board Pursuant to Section 524 of the Racing Law.
70

ATTACHMENT V
Capital Catskill Nassau New York City Suffolk Western All Regions Average
NEW YORK STATE REGIONAL OFF-TRACK BETTING CORPORATIONS
Uniform Quarterly Report's Exhibits 2, 3 & 9
2007(Unaudited)
Combined Expenses
Admissions Tax 2,481 3,520 5,544 18,620 3,643 68,530 102,338 17,056
Advertising 43,874 188,338 450,648 1,446,619 91,021 144,667 2,365,167 394,195
Amortization & Deprecia ion 202,458 357,529 494,735 136,257 237,398 463,847 1,892,224 315,371
Cable TV 39,993 16,444 47,174 - 15,526 - 119,137 19,856
Courier Service 117,685 - 112,517 - - - 230,202 38,367
Directors Fees and Reimbursements 58,600 - 4,000 2,250 10,279 48,906 124,035 20,673
Fringe Benefits 2,550,516 - 5,429,514 46,964,343 4,867,995 4,061,512 63,873,880 10,645,647
Insurance 524,840 1,457,390 299,591 2,703,460 304,225 332,252 5,621,758 936,960
Interest Expense 194 - - - 261,188 59,006 320,388 53,398
Maintenance & Repairs 1,152,884 403,364 193,373 1,668,981 322,704 1,219,146 4,960,452 826,742
Marketing & Promotions 206,368 - 55,883 143,695 385,240 - 791,186 131,864
Office Expense 318,663 26,399 307,173 930,605 99,627 - 1,682,467 280,411
Other Expenses & Services 1,048,632 90,163 962,725 654,007 191,080 1,550,659 4,497,266 749,544
Professional Fees - 321,427 831,515 621,868 240,931 163,873 2,179,614 363,269
Racing Information 247,494 206,338 - - 743,877 376,334 1,574,043 262,341
Rent 1,484,853 2,063,957 1,825,022 19,206,009 1,308,158 340,601 26,228,600 4,371,433
Rental of Equipment 998,181 28,210 658,918 215,113 368,516 - 2,268,938 378,156
Salaries and Wages 9,794,626 5,686,464 13,965,069 65,474,714 11,863,308 9,328,068 116,112,249 19,352,042
Security/Armored Carrier Expense 71,722 45,079 516,528 1,089,849 42,597 37,439 1,803,214 300,536
Simulcast Fees 532,807 408,741 186,811 2,189,421 141,257 - 3,459,037 576,506
Telephone & Data Lines 434,688 173,401 397,122 2,448,177 241,208 385,041 4,079,637 679,940
Totalizator Expense 1,312,691 648,571 3,144,863 2,611,958 1,312,891 122,606 9,153,580 1,525,597
Travel & Reimbursement 139,749 97,932 104,919 114,152 69,975 34,375 561,102 93,517
Utilities 906,821 439,868 678,691 2,519,970 570,224 841,713 5,957,287 992,881
TOTAL EXPENSES 22,190,820 12,663,135 30,672,335 151,160,068 23,692,868 19,578,575 259,957,801 43,326,300
Source: Quarterly Reports Filed with he NYS Racing Wagering Board Pursuant to Section 524 of the Racing Law.
71
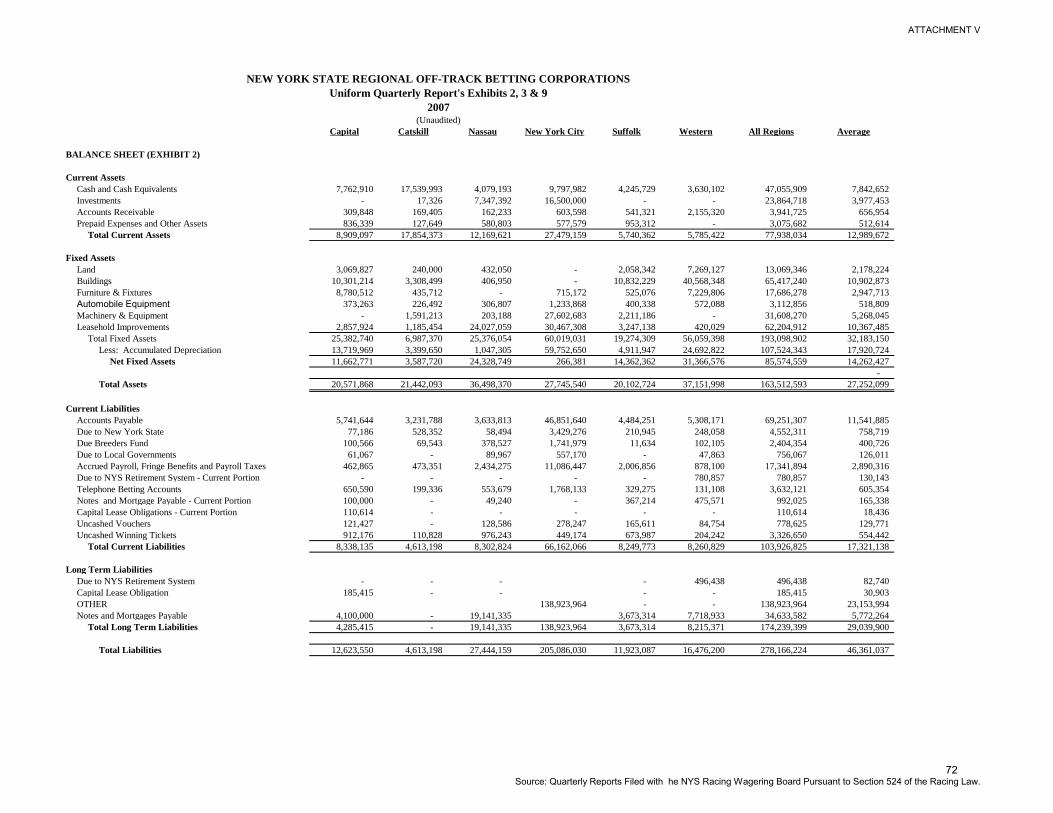
ATTACHMENT V
Capital Catskill Nassau New York City Suffolk Western All Regions Average
NEW YORK STATE REGIONAL OFF-TRACK BETTING CORPORATIONS
Uniform Quarterly Report's Exhibits 2, 3 & 9
2007(Unaudited)
BALANCE SHEET (EXHIBIT 2)
Current Assets
Cash and Cash Equivalents 7,762,910 17,539,993 4,079,193 9,797,982 4,245,729 3,630,102 47,055,909 7,842,652
Investments - 17,326 7,347,392 16,500,000 - - 23,864,718 3,977,453
Accounts Receivable 309,848 169,405 162,233 603,598 541,321 2,155,320 3,941,725 656,954
Prepaid Expenses and Other Assets 836,339 127,649 580,803 577,579 953,312 - 3,075,682 512,614
Total Current Assets 8,909,097 17,854,373 12,169,621 27,479,159 5,740,362 5,785,422 77,938,034 12,989,672
Fixed Assets
Land 3,069,827 240,000 432,050 - 2,058,342 7,269,127 13,069,346 2,178,224
Buildings 10,301,214 3,308,499 406,950 - 10,832,229 40,568,348 65,417,240 10,902,873
Furniture & Fixtures 8,780,512 435,712 - 715,172 525,076 7,229,806 17,686,278 2,947,713
Automobile Equipment 373,263 226,492 306,807 1,233,868 400,338 572,088 3,112,856 518,809
Machinery & Equipment - 1,591,213 203,188 27,602,683 2,211,186 - 31,608,270 5,268,045
Leasehold Improvements 2,857,924 1,185,454 24,027,059 30,467,308 3,247,138 420,029 62,204,912 10,367,485
Total Fixed Assets 25,382,740 6,987,370 25,376,054 60,019,031 19,274,309 56,059,398 193,098,902 32,183,150
Less: Accumulated Depreciation 13,719,969 3,399,650 1,047,305 59,752,650 4,911,947 24,692,822 107,524,343 17,920,724
Net Fixed Assets 11,662,771 3,587,720 24,328,749 266,381 14,362,362 31,366,576 85,574,559 14,262,427
-
Total Assets 20,571,868 21,442,093 36,498,370 27,745,540 20,102,724 37,151,998 163,512,593 27,252,099
Current Liabilities
Accounts Payable 5,741,644 3,231,788 3,633,813 46,851,640 4,484,251 5,308,171 69,251,307 11,541,885
Due to New York State 77,186 528,352 58,494 3,429,276 210,945 248,058 4,552,311 758,719
Due Breeders Fund 100,566 69,543 378,527 1,741,979 11,634 102,105 2,404,354 400,726
Due to Local Governments 61,067 - 89,967 557,170 - 47,863 756,067 126,011
Accrued Payroll, Fringe Benefits and Payroll Taxes 462,865 473,351 2,434,275 11,086,447 2,006,856 878,100 17,341,894 2,890,316
Due to NYS Retirement System - Current Portion - - - - - 780,857 780,857 130,143
Telephone Betting Accounts 650,590 199,336 553,679 1,768,133 329,275 131,108 3,632,121 605,354
Notes and Mortgage Payable - Current Portion 100,000 - 49,240 - 367,214 475,571 992,025 165,338
Capital Lease Obligations - Current Portion 110,614 - - - - - 110,614 18,436
Uncashed Vouchers 121,427 - 128,586 278,247 165,611 84,754 778,625 129,771
Uncashed Winning Tickets 912,176 110,828 976,243 449,174 673,987 204,242 3,326,650 554,442
Total Current Liabilities 8,338,135 4,613,198 8,302,824 66,162,066 8,249,773 8,260,829 103,926,825 17,321,138
Long Term Liabilities
Due to NYS Retirement System - - - - 496,438 496,438 82,740
Capital Lease Obligation 185,415 - - - - 185,415 30,903
OTHER 138,923,964 - - 138,923,964 23,153,994
Notes and Mortgages Payable 4,100,000 - 19,141,335 3,673,314 7,718,933 34,633,582 5,772,264
Total Long Term Liabilities 4,285,415 - 19,141,335 138,923,964 3,673,314 8,215,371 174,239,399 29,039,900
Total Liabilities 12,623,550 4,613,198 27,444,159 205,086,030 11,923,087 16,476,200 278,166,224 46,361,037
Source: Quarterly Reports Filed with he NYS Racing Wagering Board Pursuant to Section 524 of the Racing Law.
72

ATTACHMENT V
Capital Catskill Nassau New York City Suffolk Western All Regions Average
NEW YORK STATE REGIONAL OFF-TRACK BETTING CORPORATIONS
Uniform Quarterly Report's Exhibits 2, 3 & 9
2007(Unaudited)
Undistributed Benefits To Localities
As of January 1:
Net Earnings and Regular Surcharge 2,558,480 4,259,001 925,170 (143,341,078) 401,000 (9,030,086) (144,227,513) (24,037,919)
Surcharge to Counties Conducting Racing - 45,112 - 52,964 72,747 - 170,823 28,471
Capital Acquisition Fund 5,742,036 11,764,380 8,259,698 - 8,288,310 29,977,554 64,031,978 10,671,996
Total 8,300,516 16,068,493 9,184,868 (143,288,114) 8,762,057 20,947,468 (80,024,712) (13,337,452)
Year To Date
Net Earnings and Regular Surcharge 4,805,494 8,829,926 8,696,298 (17,419,248) 1,878,621 2,784,259 9,575,350 1,595,892
Surcharge Counties Conducting Racing 15,641 1,288,910 - 2,614,391 969,163 208,176 5,096,281 849,380
Capital Acquisition Fund Contributions (124,651) (572,639) 91,886 - 252,715 (226,830) (579,519) (96,587)
Total Year To Date 4,696,484 9,546,197 8,788,184 (14,804,857) 3,100,499 2,765,605 14,092,112 2,348,685
Available For Distribution
Net Earnings and Regular Surcharge 7,363,974 13,088,927 9,621,468 (160,760,326) 2,279,620 (6,245,827) (134,652,164) (22,442,027)
Surcharge to Counties Conducting Racing 15,641 1,334,022 - 2,667,355 1,041,910 208,176 5,267,104 877,851
Capital Acquisition Fund 5,617,386 11,191,741 8,351,584 - 8,541,025 29,750,724 63,452,460 10,575,410
Total Available 12,997,001 25,614,690 17,973,052 (158,092,971) 11,862,555 23,713,073 (65,932,600) (10,988,767)
Distributed To Localities
Net Earnings and Regular Surcharge 5,033,030 7,490,600 8,918,841 16,632,171 2,697,521 2,949,074 43,721,237 7,286,873
Surcharge to Counties Conducting Racing 15,641 1,295,194 - 2,615,348 985,398 207,787 5,119,368 853,228
Total Distributed 5,048,671 8,785,794 8,918,841 19,247,519 3,682,919 3,156,861 48,840,605 8,140,101
Undistributed Benefits
Net Earnings and Regular Surcharge 2,128,350 5,598,327 702,627 (177,392,497) (417,901) (9,194,901) (178,575,995) (29,762,666)
Surcharge to Counties Conducting Racing 202,582 38,828 - 52,007 56,512 415,963 765,892 127,649
Capital Acquisition Fund 5,617,386 11,191,741 8,351,584 8,541,025 29,750,724 63,452,460 10,575,410
Total Undistributed Benefits 7,948,318 16,828,896 9,054,211 (177,340,490) 8,179,636 20,971,786 (114,357,643) (19,059,607)
Total Liabilities and Undistributed
Benefits to Own Localities 20,571,868 21,442,094 36,498,370 27,745,540 20,102,723 37,447,986 163,808,581 27,301,430
NOTE: Governmental Accounting Standards Board # 45 (GASB) requires governmental entities to record the cost of providing other post employment benefits (OPEB) to employees in the year they are earned This
pronouncement became effective for some entities for the 2007 reporting year The OTBs have not uniformly applied GASB 45 therefore the following summary is provided to identify how these costs are reflected in the above reported figures
OTBs that included GASB 45 amounts in corporate expenses
under fringe benefits 21,428,000
OTBs that report the GASB 45 amounts but DO NOT REPORT
THEM AS EXPENSES AFFECTING SECTION 516 DISTRIBUTIONS 43,828,000 3,074,649
(These amounts are not reflected in the figures reported above )
OTB that has no OPEB amounts to report for this year XX XX XX
Source: Quarterly Reports Filed with he NYS Racing Wagering Board Pursuant to Section 524 of the Racing Law.
73

ATTACHMENT V
Capital Catskill Nassau New York City Suffolk Western All Regions Average
Net Handle on:
In State Thoroughbred Tracks 80,245,436$ 38,877,337$ 114,318,097$ 332,669,816$ 72,374,593$ 41,357,878$ 679,843,157$ 113,307,193$
Out of State Thoroughbred Tracks 98,321,347 71,641,040 152,076,148 578,839,019 95,411,835 59,233,409 1,055,522,798 175,920,466
In State Harness Tracks 10,597,162 9,226,449 8,057,603 30,260,589 5,206,507 12,944,369 76,292,679 12,715,447
Out of State Harness Tracks 20,758,842 23,287,922 33,223,103 119,214,702 22,184,867 26,692,985 245,362,421 40,893,737
Total Net Handle 209,922,787 143,032,748 307,674,951 1,060,984,126 195,177,802 140,228,641 2,057,021,055 342,836,843
Less: -
Returned to Bettors 159,495,714 107,230,208 235,751,928 808,862,187 149,072,417 104,009,482 1,564,421,936 260,736,989
Surcharge 7,582,116 5,576,646 8,887,927 33,926,458 5,813,549 6,137,177 67,923,873 11,320,646
OTB Take Out and Breakage 42,844,957 30,225,894 63,035,096 218,195,481 40,291,836 30,081,982 424,675,246 70,779,208
Less Payments to:
NY State (Pari-Mutuel Tax & Breakage) 1,423,365 1,052,724 2,087,029 6,932,912 1,433,530 1,239,935 14,169,495 2,361,583
NY State Regulatory Fee 1,049,635 715,164 1,538,375 5,304,921 968,135 701,143 10,277,373 1,712,896
NY State (Uncashed Tickets) 767,200 523,263 822,906 2,897,298 645,487 650,000 6,306,154 1,051,026
Breeders' Fund - Thoroughbred 1,190,210 726,331 1,736,677 6,121,070 1,100,118 640,743 11,515,149 1,919,192
Breeders' Fund - Harness 491,587 413,527 690,441 2,465,198 454,754 468,931 4,984,438 830,740
In State Thoroughbred Tracks 9,223,023 6,681,178 16,545,560 60,838,834 10,421,031 6,084,114 109,793,740 18,298,957
Out of State Thoroughbred Tracks 2,350,790 1,676,998 3,478,613 12,871,292 2,205,550 1,423,497 24,006,740 4,001,123
In State Harness Tracks 4,398,482 3,358,765 2,926,089 15,641,986 1,978,119 2,730,643 31,034,084 5,172,347
Out of State Harness Tracks 435,016 481,406 711,018 2,468,374 447,516 521,867 5,065,197 844,200
City of Albany 325,134 - - - 325,134 54,189
City of Niagara - - 48,439 48,439 8,073
Total Payments 21,654,442 15,629,356 30,536,708 115,541,885 19,654,240 14,509,312 217,525,943 36,254,324
Net Racing Revenue 21,190,515 14,596,538 32,498,388 102,653,596 20,637,596 15,572,670 207,149,303 34,524,884
Other Revenue:
Admission Income 73,360 93,055 154,171 387,160 96,316 1,847 805,909 134,318
Lottery Income 441,473 248,902 48,947 - 99,304 403,219 1,241,845 206,974
Concession Income 232,931 29,527 113,945 41,528 54,064 22,821 494,816 82,469
Derived from Section 532 1,916,043 1,652,645 2,240,880 10,159,804 1,557,487 1,723,730 19,250,589 3,208,432
Interest Income 124,193 818,870 509,783 1,360,606 161,139 67,351 3,041,942 506,990
Other Income 237,638 162,040 501,416 435,888 2,801,400 808,153 4,946,535 824,423
Uncashed Tickets 767,200 523,263 822,906 2,897,298 645,487 650,000 6,306,154 1,051,026
Total Operating Revenue 24,983,353 18,124,840 36,890,436 117,935,880 26,052,793 19,249,791 243,237,093 40,539,516
-
Operating Expenses: -
Branch Expenses 14,805,227 10,238,241 19,860,149 89,541,288 16,501,299 14,796,707 165,742,911 27,623,819
Corporate Expenses 7,476,672 2,641,018 11,626,414 151,960,013 9,611,101 4,333,263 187,648,481 31,274,747
Total Operating Expenses - Including Depreciation 22,281,899 12,879,259 31,486,563 241,501,301 26,112,400 19,129,970 353,391,392 58,898,565
Section 516 Net Revenues from Operations 2,701,454 5,245,581 5,403,873 (123,565,421) (59,607) 119,821 (110,154,299) (18,359,050)
Continued on next page
NEW YORK STATE REGIONAL OFF-TRACK BETTING CORPORATIONS
STATEMENT OF REVENUES NET OF EXPENSES
2006(Unaudited)
Source: Quarterly Reports Filed with he NYS Racing Wagering Board Pursuant to Section 524 of the Racing Law.
74

ATTACHMENT V
Capital Catskill Nassau New York City Suffolk Western All Regions Average
NEW YORK STATE REGIONAL OFF-TRACK BETTING CORPORATIONS
STATEMENT OF REVENUES NET OF EXPENSES
2006(Unaudited)
Continued from previous page
Section 516 Net Revenues from Operations 2,701,454 5,245,581 5,403,873 (123,565,421) (59,607) 119,821 (110,154,299) (18,359,050)
Less:
Section 509-a Contributions to Capital Acquisition Fund (412,800) 309,610 - - (413,035) - (516,225) (86,038)
Section 516 Net Revenue for Distribution (Loss) 2,288,654 5,555,191 5,403,873 (123,565,421) (472,642) 119,821 (110,670,524) (18,445,087)
Surcharge:
Section 532 Revenues to Participating Localities 3,401,894 2,569,464 4,465,830 17,425,134 2,538,126 2,679,516 33,079,964 5,513,327
-
Section 532 Revenues to Other Localities 1,336,623 651,225 1,104,455 2,385,119 980,639 910,004 7,368,065 1,228,011
Total Surcharge to all Localities 4,738,517 3,220,689 5,570,285 19,810,253 3,518,765 3,589,520 40,448,029 6,741,338
Capital Acquisition Funds:
Section 509-a Contribution from Net Revenues 412,800 (309,610) 413,035 - 516,225 86,038
Supplemental 1% Section 532 927,556 703,312 1,076,762 3,956,401 737,297 823,927 8,225,255 1,370,876
Other Fund Revenues net of Expenses (1,407,176) - (470,769) 130,935 (1,031,977) (2,778,987) (463,165)
Total Capital Acquisition Funds (66,820) 393,702 605,993 3,956,401 1,281,267 (208,050) 5,962,493 993,749
TOTAL 516 NET REVENUE (LOSS), SURCHARGE
AND CAPITAL ACQUISITIONS FUNDS 6,960,351$ 9,169,582$ 11,580,151$ (99,798,767)$ 4,327,390$ 3,501,291$ (64,260,002)$ (10,710,000)$
Source: Quarterly Reports Filed with he NYS Racing Wagering Board Pursuant to Section 524 of the Racing Law.
75

ATTACHMENT V
Capital Catskill Nassau New York City Suffolk Western All Regions Average
NEW YORK STATE REGIONAL OFF-TRACK BETTING CORPORATIONS
STATEMENT OF REVENUES NET OF EXPENSES
2006(Unaudited)
EXPENSE DETAIL (From Exhibit 9)
Branch Operating Expenses
Admissions Tax - - 5,975 - 3,605 68,532 78,112 13,019
Advertising 69,983 220,841 150,797 - 75,260 2,031 518,912 86,485
Amortization & Depreciation 138,525 244,745 33,742 - 450,303 1,072,306 1,939,621 323,270
Cable TV 30,777 14,068 41,138 - 15,606 - 101,589 16,932
Courier Service 118,365 - 116,896 - - - 235,261 39,210
Directors Fees and Reimbursements - - - - - - - -
Fringe Benefits 1,590,125 - 1,890,906 16,345,727 2,259,713 2,452,076 24,538,547 4,089,758
Insurance 385,731 1,007,961 133,557 3,135,189 286,340 303,874 5,252,652 875,442
Interest Expense 2,597 - 796,376 - 281,099 - 1,080,072 180,012
Maintenance & Repairs 796,439 376,501 217,195 644,675 238,731 891,666 3,165,207 527,535
Marketing & Promotions 258,907 - 160 - 318,768 - 577,835 96,306
Office Expense 106,758 19,431 109,835 230,758 110,120 - 576,902 96,150
Other Expenses & Services 538,010 68,115 874,397 401,668 30,594 1,078,452 2,991,236 498,539
Professional Fees - 180,901 23,123 - 1,072 - 205,096 34,183
Racing Information 201,835 185,545 - - 691,797 347,138 1,426,315 237,719
Rent 1,436,510 1,753,731 1,639,958 14,255,429 1,272,424 308,194 20,666,246 3,444,374
Rental of Equipment 9,123 17,762 653,101 1,642 402,876 - 1,084,504 180,751
Salaries and Wages 6,280,146 4,459,124 8,645,200 45,999,875 7,837,419 7,544,611 80,766,375 13,461,063
Security/Armored Carrier Expense 66,206 44,999 476,979 1,013,579 30,101 55,436 1,687,300 281,217
Simulcast Fees 442,431 393,832 171,017 1,942,502 137,750 - 3,087,532 514,589
Telephone & Data Lines 307,168 119,479 132,324 1,275,073 195,674 329,103 2,358,821 393,137
Totalizator Expense 1,309,047 692,659 3,180,489 2,684,174 1,357,084 103,907 9,327,360 1,554,560
Travel & Reimbursement 12,661 83,835 - 6,266 - 3,912 106,674 17,779
Utilities 703,883 354,711 566,982 1,604,733 504,963 763,186 4,498,458 749,743
Total Branch Expenses 14,805,227 10,238,240 19,860,147 89,541,290 16,501,299 15,324,424 166,270,627 27,711,771
Source: Quarterly Reports Filed with he NYS Racing Wagering Board Pursuant to Section 524 of the Racing Law.
76

ATTACHMENT V
Capital Catskill Nassau New York City Suffolk Western All Regions Average
NEW YORK STATE REGIONAL OFF-TRACK BETTING CORPORATIONS
STATEMENT OF REVENUES NET OF EXPENSES
2006(Unaudited)
Corporate Operating Expenses *
Admissions Tax - - - - - - - -
Advertising (38,149) - 181,510 1,019,818 - 134,144 1,297,323 216,221
Amortization & Depreciation 47,620 116,398 440,851 457,675 169,484 214,687 1,446,715 241,119
Cable TV 19,730 - 1,596 - 874 - 22,200 3,700
Courier Service 199 - - - - - 199 33
Directors Fees and Reimbursements 57,900 - 4,000 2,250 30,217 93,597 187,964 31,327
Fringe Benefits 1,006,404 - 3,696,223 6,865,806 3,077,197 1,549,850 16,195,480 2,699,247
Insurance 243,953 406,321 188,527 1,387,781 192,942 89,370 2,508,894 418,149
Interest Expense 544 - - - 1,517 124,048 126,109 21,018
Maintenance & Repairs 222,448 3,120 41,963 1,081,320 79,486 141,595 1,569,932 261,655
Marketing & Promotions 52,581 - 70,504 188,339 2,537 - 313,961 52,327
Office Expense 205,075 8,784 209,908 516,848 41,889 - 982,504 163,751
Other Expenses & Services 484,989 33,514 158,624 205,628 181,815 453,825 1,518,395 253,066
Professional Fees - 148,010 791,863 534,381 247,397 166,740 1,888,391 314,732
Racing Information 33,492 - - - 1,685 - 35,177 5,863
Rent 31,421 228,531 264,302 4,747,127 52,851 107,940 5,432,172 905,362
Rental of Equipment 894,019 12,866 5,373 52,092 33,768 - 998,118 166,353
Salaries and Wages 3,756,548 1,583,497 5,057,661 133,289,074 5,324,866 1,675,642 150,687,288 25,114,548
Security/Armored Carrier Expense 7,937 3,003 24,483 24,514 5,145 - 65,082 10,847
Simulcast Fees 52,692 - - 104,079 - - 156,771 26,129
Telephone & Data Lines 140,608 48,019 285,971 450,199 30,896 33,177 988,870 164,812
Totalizator Expense 13,715 - (8,105) - - - 5,610 935
Travel & Reimbursement 119,869 14,794 99,936 109,219 15,107 13,447 372,372 62,062
Utilities 123,077 34,161 111,224 923,860 121,427 62,913 1,376,662 229,444
Total Corporate Expenses 7,476,672 2,641,018 11,626,414 151,960,010 9,611,100 4,860,975 188,176,189 31,362,698
* Capital OTB includes Cable TV expenses
Source: Quarterly Reports Filed with he NYS Racing Wagering Board Pursuant to Section 524 of the Racing Law.
77

ATTACHMENT V
Capital Catskill Nassau New York City Suffolk Western All Regions Average
NEW YORK STATE REGIONAL OFF-TRACK BETTING CORPORATIONS
STATEMENT OF REVENUES NET OF EXPENSES
2006(Unaudited)
Combined Expenses
Admissions Tax - - 5,975 - 3,605 68,532 78,112 13,019
Advertising 31,834 220,841 332,307 1,019,818 75,260 136,175 1,816,235 302,706
Amortization & Depreciation 186,145 361,143 474,593 457,675 619,787 1,286,993 3,386,336 564,389
Cable TV 50,507 14,068 42,734 - 16,480 - 123,789 20,632
Courier Service 118,564 - 116,896 - - - 235,460 39,243
Directors Fees and Reimbursements 57,900 - 4,000 2,250 30,217 93,597 187,964 31,327
Fringe Benefits 2,596,529 - 5,587,129 23,211,533 5,336,910 4,001,926 40,734,027 6,789,005
Insurance 629,684 1,414,282 322,084 4,522,970 479,282 393,244 7,761,546 1,293,591
Interest Expense 3,141 - 796,376 - 282,616 124,048 1,206,181 201,030
Maintenance & Repairs 1,018,887 379,621 259,158 1,725,995 318,217 1,033,261 4,735,139 789,190
Marketing & Promotions 311,488 - 70,664 188,339 321,305 - 891,796 148,633
Office Expense 311,833 28,215 319,743 747,606 152,009 - 1,559,406 259,901
Other Expenses & Services 1,022,999 101,629 1,033,021 607,296 212,409 1,532,277 4,509,631 751,605
Professional Fees - 328,911 814,986 534,381 248,469 166,740 2,093,487 348,915
Racing Information 235,327 185,545 - - 693,482 347,138 1,461,492 243,582
Rent 1,467,931 1,982,262 1,904,260 19,002,556 1,325,275 416,134 26,098,418 4,349,736
Rental of Equipment 903,142 30,628 658,474 53,734 436,644 - 2,082,622 347,104
Salaries and Wages 10,036,694 6,042,621 13,702,861 179,288,949 13,162,285 9,220,253 231,453,663 38,575,611
Security/Armored Carrier Expense 74,143 48,002 501,462 1,038,093 35,246 55,436 1,752,382 292,064
Simulcast Fees 495,123 393,832 171,017 2,046,581 137,750 - 3,244,303 540,717
Telephone & Data Lines 447,776 167,498 418,295 1,725,272 226,570 362,280 3,347,691 557,949
Totalizator Expense 1,322,762 692,659 3,172,384 2,684,174 1,357,084 103,907 9,332,970 1,555,495
Travel & Reimbursement 132,530 98,629 99,936 115,485 15,107 17,359 479,046 79,841
Utilities 826,960 388,872 678,206 2,528,593 626,390 826,099 5,875,120 979,187
TOTAL EXPENSES 22,281,899 12,879,258 31,486,561 241,501,300 26,112,399 20,185,399 354,446,816 59,074,469
Source: Quarterly Reports Filed with he NYS Racing Wagering Board Pursuant to Section 524 of the Racing Law.
78

ATTACHMENT V
Capital Catskill Nassau New York City Suffolk Western All Regions Average
NEW YORK STATE REGIONAL OFF-TRACK BETTING CORPORATIONS
STATEMENT OF REVENUES NET OF EXPENSES
2006(Unaudited)
BALANCE SHEET (EXHIBIT 2)
Current Assets
Cash and Cash Equivalents 7,131,842 18,318,099 1,976,008 4,938,194 5,569,779 4,044,233 41,978,155 6,996,359
Investments - 17,326 9,717,603 27,000,000 - - 36,734,929 6,122,488
Accounts Receivable 338,759 108,820 549,158 736,128 691,724 1,816,490 4,241,079 706,847
Prepaid Expenses and Other Assets 917,670 203,327 941,083 1,349,506 826,103 679,810 4,917,499 819,583
Total Current Assets 8,388,271 18,647,572 13,183,852 34,023,828 7,087,606 6,540,533 87,871,662 14,645,277
Fixed Assets
Land 3,069,827 240,000 432,050 - 2,058,342 7,240,310 13,040,529 2,173,422
Buildings 10,329,289 1,520,644 406,950 - 11,203,251 39,472,612 62,932,746 10,488,791
Furniture & Fixtures 10,588,169 425,213 - 431,436 424,639 4,267,526 16,136,983 2,689,497
Automobile Equipment 357,939 243,552 311,856 1,059,260 300,411 533,520 2,806,538 467,756
Machinery & Equipment - 1,533,721 198,803 26,282,423 3,307,646 2,862,823 34,185,416 5,697,569
Leasehold Improvements 2,787,905 1,169,030 24,760,229 38,723,702 4,109,935 777,768 72,328,569 12,054,762
Total Fixed Assets 27,133,129 5,132,160 26,109,888 66,496,821 21,404,224 55,154,559 201,430,781 33,571,797
Less: Accumulated Depreciation 14,613,073 3,059,932 848,040 63,022,908 8,662,032 23,030,425 113,236,410 18,872,735
Net Fixed Assets 12,520,056 2,072,228 25,261,848 3,473,913 12,742,192 32,124,134 88,194,371 14,699,062
Total Assets 20,908,327 20,719,800 38,445,700 37,497,741 19,829,798 38,664,667 176,066,033 29,344,339
Current Liabilities
Accounts Payable 5,177,916 3,154,400 2,547,901 44,350,969 3,569,096 6,068,001 64,868,283 10,811,381
Due to New York State 80,253 613,534 72,256 3,199,797 86,310 58,570 4,110,720 685,120
Due Breeders Fund 127,185 77,888 203,648 2,078,563 127,881 183,963 2,799,128 466,521
Due to Local Governments 83,266 45,112 115,791 - 72,747 52,761 369,677 61,613
Accrued Payroll, Fringe Benefits and Payroll Taxes 467,907 459,332 2,799,614 5,092,686 1,918,665 816,101 11,554,305 1,925,718
Due to NYS Retirement System - Current Portion - - - 4,752,000 154,119 1,037,844 5,943,963 990,661
Telephone Betting Accounts 655,874 205,287 1,609,384 1,799,198 373,069 121,073 4,763,885 793,981
Notes and Mortgage Payable - Current Portion 262,661 - 46,287 - 313,600 448,500 1,071,048 178,508
Capital Lease Obligations - Current Portion 163,308 - - - - - 163,308 27,218
Uncashed Vouchers 118,508 - 227,255 263,331 174,127 115,003 898,224 149,704
Uncashed Winning Tickets 992,760 140,866 993,121 780,283 775,198 124,440 3,806,668 634,445
Total Current Liabilities 8,129,638 4,696,419 8,615,257 62,316,827 7,564,812 9,026,256 100,349,209 16,724,868
Long Term Liabilities
Due to NYS Retirement System - - - 110,773,000 - 496,438 111,269,438 18,544,906
Capital Lease Obligation 278,173 - - - - - 278,173 46,362
Other 7,071,325 - - 7,071,325 1,178,554
Notes and Mortgages Payable 4,200,000 - 20,645,575 - 3,575,678 8,194,504 36,615,757 6,102,626
Total Long Term Liabilities 4,478,173 - 20,645,575 117,844,325 3,575,678 8,690,942 155,234,693 25,872,449
-
Total Liabilities 12,607,811 4,696,419 29,260,832 180,161,152 11,140,490 17,717,198 255,583,902 42,597,317
Source: Quarterly Reports Filed with he NYS Racing Wagering Board Pursuant to Section 524 of the Racing Law.
79

ATTACHMENT V
Capital Catskill Nassau New York City Suffolk Western All Regions Average
NEW YORK STATE REGIONAL OFF-TRACK BETTING CORPORATIONS
STATEMENT OF REVENUES NET OF EXPENSES
2006(Unaudited)
Undistributed Benefits To Localities
As of January 1:
Net Earnings and Regular Surcharge 2,643,886 5,390,998 475,111 (141,592,330) 412,987 (9,150,576) (141,819,924) (23,636,654)
Surcharge to Counties Conducting Racing - - - 462,712 - - 462,712 77,119
Capital Acquisition Fund 5,808,855 11,370,678 7,653,706 - 8,059,424 30,185,604 63,078,267 10,513,045
Total 8,452,741 16,761,676 8,128,817 (141,129,618) 8,472,411 21,035,028 (78,278,945) (13,046,491)
Year To Date
Net Earnings and Regular Surcharge 6,008,861 8,124,655 9,869,703 (265,704) 2,478,519 2,799,337 29,015,371 4,835,895
Surcharge Counties Conducting Racing 6,822 - - 363,903 - 197,912 568,637 94,773
Capital Acquisition Fund Contributions (66,820) 393,702 605,992 - 868,232 (208,050) 1,593,056 265,509
Total Year To Date 5,948,863 8,518,357 10,475,695 98,199 3,346,751 2,789,199 31,177,064 5,196,177
Available For Distribution
Net Earnings and Regular Surcharge 8,652,747 13,515,653 10,344,814 (141,858,034) 2,478,471 (6,351,239) (113,217,588) (18,869,598)
Surcharge to Counties Conducting Racing 6,822 - - 826,616 - 197,912 1,031,350 171,892
Capital Acquisition Fund 5,742,036 11,764,380 8,259,698 - 9,340,692 29,977,554 65,084,360 10,847,393
Total Available 14,401,605 25,280,033 18,604,512 (141,031,418) 11,819,163 23,824,227 (47,101,878) (7,850,313)
Distributed To Localities
Net Earnings and Regular Surcharge 6,094,265 9,256,653 9,419,644 1,483,044 3,129,853 2,678,225 32,061,684 5,343,614
Surcharge to Counties Conducting Racing 6,822 - - 148,949 - 198,534 354,305 59,051
Total Distributed 6,101,087 9,256,653 9,419,644 1,631,993 3,129,853 2,876,759 32,415,989 5,402,665
Undistributed Benefits
Net Earnings and Regular Surcharge 2,558,480 4,258,999 925,170 (143,341,078) 401,000 (9,031,665) (144,229,094) (24,038,182)
Surcharge to Counties Conducting Racing - - - 677,667 - 1,579 679,246 113,208
Capital Acquisition Fund 5,742,036 11,764,380 8,259,698 - 8,288,310 29,977,554 64,031,978 10,671,996
Total Undistributed Benefits 8,300,516 16,023,381 9,184,868 (142,663,411) 8,689,310 20,947,468 (79,517,870) (13,252,978)
Total Liabilities and Undistributed
Benefits to Own Localities 20,908,327 20,719,800 38,445,700 37,497,741 19,829,800 38,664,666 176,066,032 29,344,339
NOTE: Governmental Accounting Standards Board # 45 (GASB) requires governmental entities to record the cost of providing other post employment benefits (OPEB) to employees in the year they are earned This
pronouncement became effective for some entities for the 2006 reporting year The OTBs have not uniformly applied GASB 45 therefore the following summary is provided to identify how these costs are reflected in the above reported figures
OTBs that included GASB 45 amounts in corporate expenses
under fringe benefits 115,525,000
OTB that has no OPEB amounts to report for this year XX XX XX XX XX
Source: Quarterly Reports Filed with he NYS Racing Wagering Board Pursuant to Section 524 of the Racing Law.
80

ATTACHMENT V
Capital Catskill Nassau New York City Suffolk Western All Regions Average
Net Handle on:
In State Thoroughbred Tracks 81,498,026$ 41,364,026$ 118,777,561$ 340,003,080$ 74,739,277$ 44,243,373$ 700,625,343$ 116,770,891$
Out of State Thoroughbred Tracks 97,262,347 71,326,890 150,275,752 550,506,561 94,300,450 60,803,204 1,024,475,204 170,745,867
In State Harness Tracks 10,163,223 9,193,081 8,259,865 30,973,836 5,878,091 12,385,270 76,853,366 12,808,894
Out of State Harness Tracks 24,137,408 24,638,646 33,801,171 124,941,025 24,129,091 27,970,807 259,618,148 43,269,691
Total Net Handle 213,061,004 146,522,643 311,114,349 1,046,424,502 199,046,909 145,402,654 2,061,572,061 343,595,344
Less:
Returned to Bettors 161,780,612 109,778,640 238,494,587 798,253,666 152,243,277 107,871,069 1,568,421,851 261,403,642
Surcharge 7,775,738 5,780,496 8,978,025 33,680,453 5,828,961 6,372,986 68,416,659 11,402,777
OTB Take Out and Breakage 43,504,654 30,963,507 63,641,737 214,490,383 40,974,671 31,158,599 424,733,551 70,788,925
Less Payments to:
NY State (Pari-Mutuel Tax & Breakage) 1,746,990 1,254,359 2,526,046 8,082,287 1,721,517 1,377,463 16,708,662 2,784,777
NY State Regulatory Fee 943,309 639,435 1,372,224 4,620,753 876,308 639,149 9,091,178 1,515,196
NY State (Uncashed Tickets) 751,200 540,000 796,625 2,871,658 596,399 610,000 6,165,882 1,027,647
Breeders' Fund - Thoroughbred 1,224,943 650,624 1,582,005 5,316,700 996,466 606,306 10,377,044 1,729,507
Breeders' Fund - Harness 359,656 431,258 706,827 2,527,320 494,677 483,633 5,003,371 833,895
In State Thoroughbred Tracks 9,241,379 6,905,404 16,778,050 59,517,281 10,560,315 6,480,397 109,482,826 18,247,138
Out of State Thoroughbred Tracks 2,321,382 1,678,749 3,356,568 12,414,619 2,203,157 1,488,926 23,463,401 3,910,567
In State Harness Tracks 3,636,777 2,255,113 3,154,083 14,392,291 2,125,203 2,652,059 28,215,526 4,702,588
Out of State Harness Tracks 530,929 509,170 769,550 2,617,722 492,145 563,820 5,483,336 913,889
City of Albany 349,972 - - - - - 349,972 58,329
City of Niagara - - - - - 55,576 55,576 9,263
Total Payments 21,106,537 14,864,112 31,041,978 112,360,631 20,066,187 14,957,329 214,396,774 35,732,796
Net Racing Revenue 22,398,117 16,099,395 32,599,759 102,129,752 20,908,484 16,201,270 210,336,777 35,056,130
Other Revenue:
Admission Income 85,606 91,760 149,293 411,855 98,008 3,409 839,931 139,989
Lottery Income 466,989 275,008 53,223 22,884 87,355 396,306 1,301,765 216,961
Concession Income 184,730 30,727 105,104 70,401 53,200 20,897 465,059 77,510
Derived from Section 532 1,993,259 1,715,725 2,111,830 10,019,482 1,563,189 1,787,603 19,191,088 3,198,515
Interest Income 95,479 486,711 281,699 734,080 47,510 15,748 1,661,227 276,871
Other Income (604,353) 464,161 941,846 1,738,392 2,622,704 (770,787) 4,391,963 731,994
Uncashed Tickets 751,200 540,000 796,625 2,871,658 596,398 610,000 6,165,881 1,027,647
Total Operating Revenue 25,371,027 19,703,487 37,039,379 117,998,504 25,976,848 18,264,446 244,353,691 40,725,615
Operating Expenses:
Branch Expenses 15,227,102 10,603,717 19,736,852 87,392,602 16,049,092 15,229,552 164,238,917 27,373,153
Corporate Expenses 7,323,526 2,547,900 11,119,823 36,120,921 9,484,769 4,411,936 71,008,875 11,834,813
Total Operating Expenses - Including Depreciation 22,550,628 13,151,617 30,856,675 123,513,523 25,533,861 19,641,488 235,247,792 39,207,965
Section 516 Net Revenues from Operations 2,820,399 6,551,870 6,182,704 (5,515,019) 442,987 (1,377,042) 9,105,899 1,517,650
Continued on next page
NEW YORK STATE REGIONAL OFF-TRACK BETTING CORPORATIONS
STATEMENT OF REVENUES NET OF EXPENSES
2005(Unaudited)
Source: Quarterly Reports Filed with he NYS Racing Wagering Board Pursuant to Section 524 of the Racing Law.
81

ATTACHMENT V
Capital Catskill Nassau New York City Suffolk Western All Regions Average
NEW YORK STATE REGIONAL OFF-TRACK BETTING CORPORATIONS
STATEMENT OF REVENUES NET OF EXPENSES
2005(Unaudited)
Continued from previous page
Section 516 Net Revenues from Operations 2,820,399 6,551,870 6,182,704 (5,515,019) 442,987 (1,377,042) 9,105,899 1,517,650
Less:
Section 509-a Contributions to Capital Acquisition Fund (412,800) 198,518 - - (116,488) - (330,770) (55,128)
Section 516 Net Revenue for Distribution (Loss) 2,407,599 6,750,388 6,182,704 (5,515,019) 326,499 (1,377,042) 8,775,129 1,462,522
Surcharge:
Section 532 Revenues to Participating Localities 3,475,972 2,649,028 4,692,191 17,284,741 2,545,873 2,787,377 33,435,182 5,572,530
Section 532 Revenues to Other Localities 1,358,562 692,069 1,083,166 2,468,742 982,683 945,741 7,530,963 1,255,161
Total Surcharge to all Localities 4,834,534 3,341,097 5,775,357 19,753,483 3,528,556 3,733,118 40,966,145 6,827,691
Capital Acquisition Funds:
Section 509-a Contribution from Net Revenues 412,800 (198,518) - - 116,488 - 330,770 55,128
Supplemental 1% Section 532 947,945 723,674 1,090,838 3,907,488 737,216 852,265 8,259,426 1,376,571
Other Fund Revenues net of Expenses (1,257,598) - (1,905,233) - (326,410) (862,329) (4,351,570) (725,262)
Total Capital Acquisition Funds 103,147 525,156 (814,395) 3,907,488 527,294 (10,064) 4,238,626 706,438
TOTAL 516 NET REVENUE (LOSS), SURCHARGE
AND CAPITAL ACQUISITIONS FUNDS 7,345,280$ 10,616,641$ 11,143,666$ 18,145,952$ 4,382,349$ 2,346,012$ 53,979,900$ 8,996,650$
Source: Quarterly Reports Filed with he NYS Racing Wagering Board Pursuant to Section 524 of the Racing Law.
82

ATTACHMENT V
Capital Catskill Nassau New York City Suffolk Western All Regions Average
NEW YORK STATE REGIONAL OFF-TRACK BETTING CORPORATIONS
STATEMENT OF REVENUES NET OF EXPENSES
2005(Unaudited)
EXPENSE DETAIL (From Exhibit 9)
Branch Operating Expenses
Admissions Tax - - 5,822 - 3,876 216,416 226,114 37,686
Advertising 67,444 475,938 263,716 - 55,236 641 862,975 143,829
Amor ization & Depreciation 146,347 336,543 54,289 - 453,459 1,081,826 2,072,464 345,411
Cable TV 29,083 14,015 34,275 - 16,182 - 93,555 15,593
Courier Service 111,194 - 116,273 - - - 227,467 37,911
Directors Fees and Reimbursements - - - - - - - -
Fringe Benefits 1,632,960 - 1,824,584 15,231,527 2,210,318 2,441,877 23,341,266 3,890,211
Insurance 434,162 1,007,916 145,811 1,756,723 337,753 345,895 4,028,260 671,377
Interest Expense 7,693 - 585,617 - 301,260 - 894,570 149,095
Maintenance & Repairs 902,303 309,856 267,860 472,723 190,030 846,600 2,989,372 498,229
Marketing & Promotions 236,145 - - - 234,871 - 471,016 78,503
Office Expense 98,623 15,884 191,248 225,847 89,874 - 621,476 103,579
Other Expenses & Services 579,209 78,777 904,738 279,316 62,229 1,074,900 2,979,169 496,528
Professional Fees - 141,685 140,359 - 45 - 282,089 47,015
Racing Information 206,712 195,886 - - 667,593 318,119 1,388,310 231,385
Rent 1,466,631 1,638,010 1,556,120 14,066,340 1,140,570 412,659 20,280,330 3,380,055
Rental of Equipment 10,971 20,483 644,797 5,121 380,334 - 1,061,706 176,951
Salaries and Wages 6,446,249 4,554,502 8,636,748 46,202,078 7,657,055 7,512,978 81,009,610 13,501,602
Security/Armored Carrier Expense 82,604 45,021 291,755 1,071,588 23,936 135,481 1,650,385 275,064
Simulcast Fees 457,215 396,792 182,070 0 2,034,334 142,375 - 3,212,786 535,464
Telephone & Data Lines 260,833 108,367 153,775 1,777,675 237,001 342,080 2,879,731 479,955
Totalizator Expense 1,313,999 791,289 3,158,210 2,727,514 1,349,370 141,184 9,481,566 1,580,261
Travel & Reimbursement 11,850 75,881 - 5,733 1,199 5,298 99,961 16,660
Utilities 724,875 396,872 578,786 1,536,087 456,718 789,168 4,482,506 747,084
Total Branch Expenses 15,227,102 10,603,717 19,736,853 87,392,606 16,011,284 15,665,122 164,636,684 27,439,447
Source: Quarterly Reports Filed with he NYS Racing Wagering Board Pursuant to Section 524 of the Racing Law.
83

ATTACHMENT V
Capital Catskill Nassau New York City Suffolk Western All Regions Average
NEW YORK STATE REGIONAL OFF-TRACK BETTING CORPORATIONS
STATEMENT OF REVENUES NET OF EXPENSES
2005(Unaudited)
Corporate Operating Expenses *
Admissions Tax - - - - - - - -
Advertising (41,888) - 157,145 1,704,239 289 142,397 1,962,182 327,030
Amor ization & Depreciation 60,660 83,348 345,870 462,624 145,044 249,463 1,347,009 224,502
Cable TV 6,487 - 996 - 3,195 - 10,678 1,780
Courier Service 4,115 - - - - - 4,115 686
Directors Fees and Reimbursements 54,605 - 4,500 3,250 9,100 90,677 162,132 27,022
Fringe Benefits 943,359 - 4,092,960 6,862,862 2,969,881 1,463,555 16,332,617 2,722,103
Insurance 256,002 372,671 197,527 651,871 190,705 96,674 1,765,450 294,242
Interest Expense 2,822 - - 1,919 - 97,919 102,660 17,110
Maintenance & Repairs 197,102 78,091 30,408 996,365 88,991 114,547 1,505,504 250,917
Marketing & Promotions 46,034 - 66,139 317,614 81 12,546 442,414 73,736
Office Expense 197,337 9,865 152,030 726,982 29,407 - 1,115,621 185,937
Other Expenses & Services 609,543 31,490 211,301 405,673 177,607 327,788 1,763,402 293,900
Professional Fees - 115,924 434,668 365,097 244,838 184,675 1,345,202 224,200
Racing Information 32,508 - - - 441 - 32,949 5,492
Rent 111,376 206,471 259,335 4,597,524 3,698 97,700 5,276,104 879,351
Rental of Equipment 836,932 17,615 5,958 43,824 30,405 - 934,734 155,789
Salaries and Wages 3,525,027 1,521,142 4,740,604 17,586,689 5,410,976 1,868,972 34,653,410 5,775,568
Security/Armored Carrier Expense 8,468 2,699 22,048 66,497 2,715 - 102,427 17,071
Simulcast Fees 54,700 - - 95,020 - - 149,720 24,953
Telephone & Data Lines 151,621 58,551 235,845 399,853 36,839 31,852 914,561 152,427
Totalizator Expense 3,609 - - - - - 3,609 602
Travel & Reimbursement 132,553 13,391 115,052 89,963 20,175 11,086 382,220 63,703
Utilities 130,554 36,644 47,439 743,052 120,385 57,654 1,135,728 189,288
Total Corporate Expenses 7,323,526 2,547,902 11,119,825 36,120,918 9,484,772 4,847,505 71,444,448 11,907,408
* Capital OTB includes Cable TV expenses
Source: Quarterly Reports Filed with he NYS Racing Wagering Board Pursuant to Section 524 of the Racing Law.
84

ATTACHMENT V
Capital Catskill Nassau New York City Suffolk Western All Regions Average
NEW YORK STATE REGIONAL OFF-TRACK BETTING CORPORATIONS
STATEMENT OF REVENUES NET OF EXPENSES
2005(Unaudited)
Combined Expenses
Admissions Tax - - 5,822 - 3,876 216,416 226,114 37,686
Advertising 25,556 475,938 420,861 1,704,239 55,525 143,038 2,825,157 470,860
Amor ization & Depreciation 207,007 419,890 400,159 462,624 598,503 1,331,289 3,419,472 569,912
Cable TV 35,570 14,015 35,271 - 19,377 - 104,233 17,372
Courier Service 115,309 - 116,273 - - - 231,582 38,597
Directors Fees and Reimbursements 54,605 - 4,500 3,250 9,100 90,677 162,132 27,022
Fringe Benefits 2,576,319 - 5,917,544 22,094,389 5,180,199 3,905,432 39,673,883 6,612,314
Insurance 690,164 1,380,587 343,338 2,408,594 528,458 442,569 5,793,710 965,618
Interest Expense 10,515 - 585,617 1,919 301,260 97,919 997,230 166,205
Maintenance & Repairs 1,099,405 387,947 298,268 1,469,088 279,021 961,147 4,494,876 749,146
Marketing & Promotions 282,179 - 66,139 317,614 234,952 12,546 913,430 152,238
Office Expense 295,960 25,749 343,278 952,829 119,281 - 1,737,097 289,516
Other Expenses & Services 1,188,752 110,266 1,116,039 684,989 239,836 1,402,688 4,742,570 790,428
Professional Fees - 257,609 575,027 365,097 244,883 184,675 1,627,291 271,215
Racing Information 239,220 195,886 - - 668,034 318,119 1,421,259 236,877
Rent 1,578,007 1,844,481 1,815,455 18,663,864 1,144,268 510,359 25,556,434 4,259,406
Rental of Equipment 847,903 38,098 650,755 48,945 410,739 - 1,996,440 332,740
Salaries and Wages 9,971,276 6,075,644 13,377,352 63,788,767 13,068,031 9,381,950 115,663,020 19,277,170
Security/Armored Carrier Expense 91,072 47,720 313,803 1,138,085 26,651 135,481 1,752,812 292,135
Simulcast Fees 511,915 396,792 182,070 2,129,354 142,375 - 3,362,506 560,418
Telephone & Data Lines 412,454 166,917 389,620 2,177,528 273,840 373,932 3,794,291 632,382
Totalizator Expense 1,317,608 791,289 3,158,210 2,727,514 1,349,370 141,184 9,485,175 1,580,863
Travel & Reimbursement 144,403 89,272 115,052 95,696 21,374 16,384 482,181 80,364
Utilities 855,429 433,516 626,225 2,279,139 577,103 846,822 5,618,234 936,372
TOTAL EXPENSES 22,550,628 13,151,616 30,856,678 123,513,524 25,496,056 20,512,627 236,081,129 39,346,855
Source: Quarterly Reports Filed with he NYS Racing Wagering Board Pursuant to Section 524 of the Racing Law.
85

ATTACHMENT V
Capital Catskill Nassau New York City Suffolk Western All Regions Average
NEW YORK STATE REGIONAL OFF-TRACK BETTING CORPORATIONS
STATEMENT OF REVENUES NET OF EXPENSES
2005(Unaudited)
BALANCE SHEET (EXHIBIT 2)
Current Assets
Cash and Cash Equivalents 6,060,782$ 17,604,467$ 8,923,967$ 5,789,597$ 5,988,270$ 2,725,694$ 47,092,777 7,848,796
Investments - 17,326 2,813,463 19,000,000 1,000,000 - 22,830,789 3,805,132
Accounts Receivable 443,709 34,984 626,221 760,288 763,915 2,774,524 5,403,641 900,607
Prepaid Expenses and Other Assets 1,015,811 213,591 418,561 1,035,813 364,488 928,233 3,976,497 662,750
Total Current Assets 7,520,302 17,870,368 12,782,212 26,585,698 8,116,673 6,428,451 79,303,704 13,217,284
Fixed Assets
Land 3,069,827 240,000 432,050 - 2,146,875 7,214,847 13,103,599 2,183,933
Buildings 10,132,704 1,352,434 479,550 - 10,802,573 39,389,234 62,156,495 10,359,416
Furniture & Fixtures 10,356,553 425,213 - 417,946 425,679 3,137,444 14,762,835 2,460,473
Automobile Equipment 339,233 311,416 279,829 976,240 513,375 529,970 2,950,063 491,677
Machinery & Equipment - 1,450,613 179,881 25,288,086 3,301,463 3,719,649 33,939,692 5,656,615
Leasehold Improvements 2,710,901 1,139,577 25,948,458 38,029,507 3,905,194 1,430,212 73,163,849 12,193,975
Total Fixed Assets 26,609,218 4,919,253 27,319,768 64,711,779 21,095,159 55,421,356 200,076,533 33,346,089
Less: Accumulated Depreciation 13,491,122 2,805,102 745,725 60,954,103 8,710,427 21,690,801 108,397,280 18,066,213
Net Fixed Assets 13,118,096 2,114,151 26,574,043 3,757,676 12,384,732 33,730,555 91,679,253 15,279,876
Total Assets 20,638,398$ 19,984,519$ 39,356,255$ 30,343,374$ 20,501,405$ 40,159,006 170,982,957 28,497,160
Current Liabilities
Accounts Payable 4,285,587$ 1,548,727$ 2,660,381$ 28,094,218$ 2,661,178$ 5,125,215$ 44,375,306 7,395,884
Due to New York State 98,486 107,363 89,153 3,841,122 103,372 671,569 4,911,065 818,511
Due Breeders Fund 111,919 71,729 177,696 609,960 117,552 1,089,942 2,178,798 363,133
Due to Local Governments 75,756 43,199 219,356 - 67,883 47,760 453,954 75,659
Accrued Payroll, Fringe Benefits and Payroll Taxes 409,377 497,545 3,678,496 4,653,586 1,883,540 827,128 11,949,672 1,991,612
Due to NYS Retirement System - Current Portion - - - - 1,560,091 840,503 2,400,594 400,099
Telephone Betting Accounts 588,063 236,727 1,110,083 1,723,426 396,643 130,153 4,185,095 697,516
Notes and Mortgage Payable - Current Portion 435,319 - 43,512 - 292,315 1,068,432 1,839,578 306,596
Capital Lease Obligations - Current Portion 157,443 - - - - - 157,443 26,241
Uncashed Vouchers 144,018 - 122,387 258,220 163,674 71,856 760,155 126,693
Uncashed Winning Tickets 975,548 713,895 979,512 417,359 738,923 90,011 3,915,248 652,541
Total Current Liabilities 7,281,516 3,219,185 9,080,576 39,597,891 7,985,171 9,962,569 77,126,908 12,854,485
Long Term Liabilities
Due to NYS Retirement System - - - - 154,119 497,193 651,312 108,552
Capital Lease Obligation 441,480 - - - - - 441,480 73,580
Other - - - 6,981,412 - - 6,981,412 1,163,569
Notes and Mortgages Payable 4,462,661 - 22,146,862 - 3,889,703 8,664,215 39,163,441 6,527,240
Total Long Term Liabilities 4,904,141 - 22,146,862 6,981,412 4,043,822 9,161,408 47,237,645 7,872,941
Total Liabilities 12,185,657$ 3,219,185$ 31,227,438$ 46,579,303$ 12,028,993$ 19,123,977$ 124,364,553 20,727,426
Source: Quarterly Reports Filed with he NYS Racing Wagering Board Pursuant to Section 524 of the Racing Law.
86

ATTACHMENT V
Capital Catskill Nassau New York City Suffolk Western All Regions Average
NEW YORK STATE REGIONAL OFF-TRACK BETTING CORPORATIONS
STATEMENT OF REVENUES NET OF EXPENSES
2005(Unaudited)
Undistributed Benefits To Localities
As of January 1:
Net Earnings and Regular Surcharge 2,882,836$ 5,259,185$ 2,231,534$ (16,325,474)$ 187,276$ (7,619,358)$ (13,384,001) (2,230,667)
Surcharge to Counties Conducting Racing - - - 466,652 - - 466,652 77,775
Capital Acquisition Fund 5,705,707 10,855,042 8,468,099 - 7,715,352 30,195,669 62,939,869 10,489,978
Total 8,588,543 16,114,227 10,699,633 (15,858,822) 7,902,628 22,576,311 50,022,520 8,337,087
Year To Date
Net Earnings and Regular Surcharge 6,233,546 9,278,798 10,874,893 639,887 2,662,452 1,410,335 31,099,911 5,183,319
Surcharge Counties Conducting Racing - 120,616 - 336,949 - 211,986 669,551 111,592
Capital Acquisition Fund Contributions 103,147 525,156 (814,393) - 737,216 (10,065) 541,061 90,177
Total Year To Date 6,336,693 9,924,570 10,060,500 976,836 3,399,668 1,612,256 32,310,523 5,385,087
Available For Distribution
Net Earnings and Regular Surcharge 9,116,382 14,537,983 13,106,427 (15,685,587) 2,733,240 (6,209,023) 17,599,422 2,933,237
Surcharge to Counties Conducting Racing - 120,616 - 803,601 - 211,986 1,136,203 189,367
Capital Acquisition Fund 5,808,855 11,380,198 7,653,706 - 8,569,056 30,185,604 63,597,419 10,599,570
Total Available 14,925,237 26,038,797 20,760,133 (14,881,986) 11,302,296 24,188,567 82,333,044 13,722,174
Distributed To Localities
Net Earnings and Regular Surcharge 6,472,493 9,166,213 12,631,316 1,231,554 2,829,885 2,943,754 35,275,215 5,879,203
Surcharge to Counties Conducting Racing - 107,252 - 122,389 - 209,785 439,426 73,238
Total Distributed 6,472,493 9,273,465 12,631,316 1,353,943 2,829,885 3,153,539 35,714,641 5,952,440
Undistributed Benefits
Net Earnings and Regular Surcharge 2,643,886 5,371,770 475,111 (16,917,141) 412,987 (9,152,777) (17,166,164) (2,861,027)
Surcharge to Counties Conducting Racing - 13,364 - 681,212 - 2,201 696,777 116,130
Capital Acquisition Fund 5,808,855 11,380,198 7,653,706 - 8,059,424 30,185,604 63,087,787 10,514,631
Total Undistributed Benefits 8,452,741 16,765,332 8,128,817 (16,235,929) 8,472,411 21,035,028 46,618,400 7,769,733
Total Liabilities and Undistributed
Benefits to Own Localities 20,638,398$ 19,984,517$ 39,356,255$ 30,343,374$ 20,501,404$ 40,159,005$ 170,982,953 28,497,159
Source: Quarterly Reports Filed with he NYS Racing Wagering Board Pursuant to Section 524 of the Racing Law.
87

ATTACHMENT V
Capital Catskill Nassau New York City Suffolk Western All Regions Average
Net Handle on:
In State Thoroughbred Tracks 84,110,402 41,119,505 116,511,010 343,030,302 78,762,001 47,336,000 710,869,220 118,478,203
Out of State Thoroughbred Tracks 96,279,402 70,025,217 140,026,121 548,224,513 96,792,065 64,482,280 1,015,829,598 169,304,933
In State Harness Tracks 10,873,443 9,468,494 10,119,354 41,319,969 7,572,034 11,764,927 91,118,221 15,186,370
Out of State Harness Tracks 20,972,256 22,506,474 32,699,049 103,513,288 22,166,764 25,958,365 227,816,196 37,969,366
Total Net Handle 212,235,503 143,119,690 299,355,534 1,036,088,072 205,292,864 149,541,572 2,045,633,235 340,938,873
Less:
Returned to Bettors 161,258,837 107,270,433 229,406,706 791,273,743 157,243,766 111,157,018 1,557,610,503 259,601,751
Surcharge 7,767,564 5,721,739 9,127,188 33,598,344 5,917,320 6,518,408 68,650,563 11,441,761
- - - - - - - -
OTB Take Out and Breakage 43,209,102 30,127,518 60,821,640 211,215,985 42,131,778 31,866,146 419,372,169 69,895,362
Less Payments to:
NY State (Pari-Mutuel Tax & Breakage) 1,650,587 1,219,508 2,444,880 8,057,295 1,783,159 1,410,394 16,565,823 2,760,971
NY State Regulatory Fee 827,718 558,167 1,167,528 4,040,743 800,642 583,212 7,978,010 1,329,668
NY State (Uncashed Tickets) 840,000 485,663 823,318 3,199,463 596,078 615,000 6,559,522 1,093,254
Breeders' Fund - Thoroughbred 1,073,882 647,151 1,533,984 5,338,445 1,039,727 651,615 10,284,804 1,714,134
Breeders' Fund - Harness 494,767 417,190 722,486 2,490,583 498,694 467,184 5,090,904 848,484
In State Thoroughbred Tracks 9,393,289 6,849,070 16,162,052 61,262,235 11,123,167 6,930,660 111,720,473 18,620,079
Out of State Thoroughbred Tracks 2,270,882 1,631,833 3,024,129 12,295,593 2,219,125 1,474,048 22,915,610 3,819,268
In State Harness Tracks 4,302,042 2,136,581 3,041,951 12,437,929 2,207,817 2,714,487 26,840,807 4,473,468
Out of State Harness Tracks 419,675 486,267 892,878 2,230,952 474,489 591,202 5,095,463 849,244
City of Albany 338,391 - - - - - 338,391 56,399
City of Niagara - - - - - 63,567 63,567 10,595
- - - - - - - -
Total Payments 21,611,233 14,431,430 29,813,206 111,353,238 20,742,898 15,501,369 213,453,374 35,575,562
- - - - - - - -
Net Racing Revenue 21,597,869 15,696,088 31,008,434 99,862,747 21,388,880 16,364,777 205,918,795 34,319,799
Other Revenue:
Admission Income 83,182 101,905 152,738 416,075 133,752 2,780 890,432 148,405
Lottery Income 485,239 288,675 51,518 15,691 78,739 417,291 1,337,153 222,859
Concession Income 216,021 32,203 109,513 111,198 69,169 21,294 559,398 93,233
Derived from Section 532 1,941,736 1,663,288 2,057,471 9,830,823 1,488,345 1,804,455 18,786,118 3,131,020
Interest Income 35,536 45,224 34,848 263,309 28,446 10,620 417,983 69,664
Other Income 441,375 217,561 615,167 625,414 2,355,261 (1,644,491) 2,610,287 435,048
Uncashed Tickets 840,000 485,663 823,318 3,199,463 596,078 615,000 6,559,522 1,093,254
- - - - - - - -
Total Operating Revenue 25,640,958 18,530,607 34,853,007 114,324,720 26,138,670 17,591,726 237,079,688 39,513,281
Operating Expenses:
Branch Expenses 16,321,873 10,757,484 19,327,094 86,966,833 16,502,834 15,405,770 165,281,888 27,546,981
Corporate Expenses 7,456,524 2,649,040 8,524,420 37,983,010 9,498,812 4,349,576 70,461,382 11,743,564
- - - - - - - -
Total Operating Expenses - Including Depreciation 23,778,397 13,406,524 27,851,514 124,949,843 26,001,646 19,755,346 235,743,270 39,290,545
- - - - - - - -
Section 516 Net Revenues from Operations 1,862,561 5,124,083 7,001,493 (10,625,123) 137,024 (2,163,620) 1,336,418 222,736
Continued on next page
NEW YORK STATE REGIONAL OFF-TRACK BETTING CORPORATIONS
STATEMENT OF REVENUES NET OF EXPENSES
2004(Unaudited)
Source: Quarterly Reports Filed with the NYS Racing and Wagering Board Pursuant to Section 524 of the Racing Law.
88
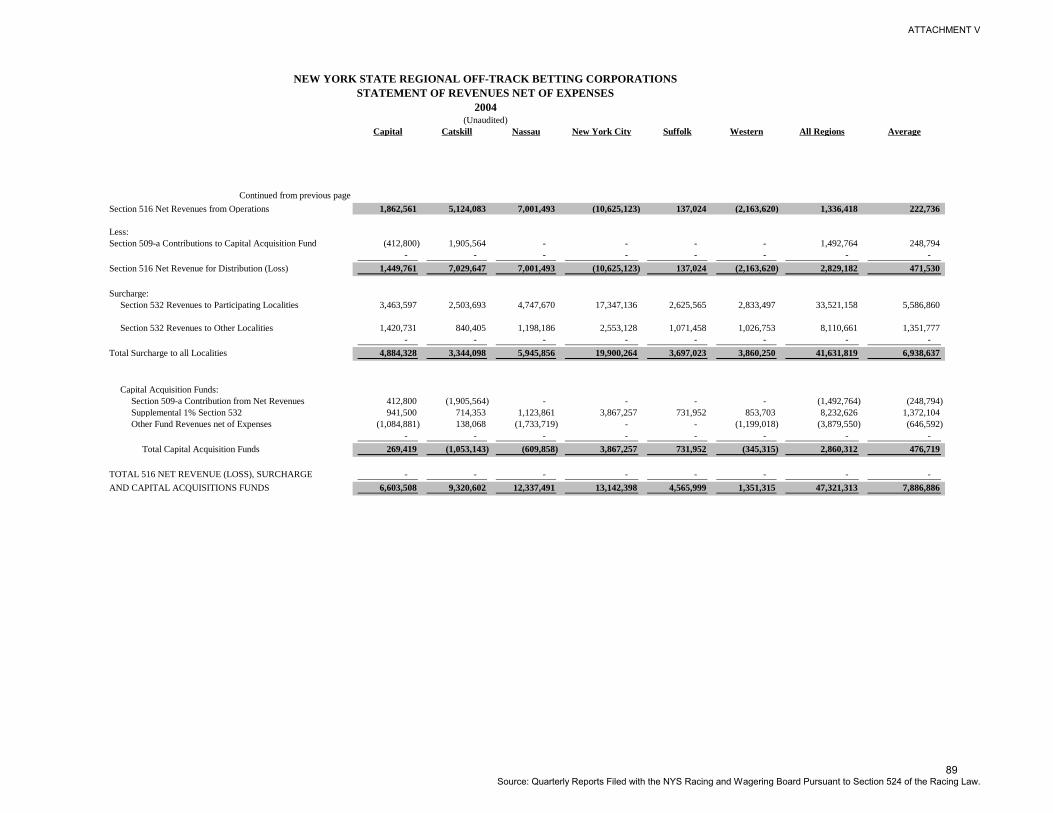
ATTACHMENT V
Capital Catskill Nassau New York City Suffolk Western All Regions Average
NEW YORK STATE REGIONAL OFF-TRACK BETTING CORPORATIONS
STATEMENT OF REVENUES NET OF EXPENSES
2004(Unaudited)
Continued from previous page
Section 516 Net Revenues from Operations 1,862,561 5,124,083 7,001,493 (10,625,123) 137,024 (2,163,620) 1,336,418 222,736
Less:
Section 509-a Contributions to Capital Acquisition Fund (412,800) 1,905,564 - - - - 1,492,764 248,794
- - - - - - - -
Section 516 Net Revenue for Distribution (Loss) 1,449,761 7,029,647 7,001,493 (10,625,123) 137,024 (2,163,620) 2,829,182 471,530
Surcharge:
Section 532 Revenues to Participating Localities 3,463,597 2,503,693 4,747,670 17,347,136 2,625,565 2,833,497 33,521,158 5,586,860
Section 532 Revenues to Other Localities 1,420,731 840,405 1,198,186 2,553,128 1,071,458 1,026,753 8,110,661 1,351,777
- - - - - - - -
Total Surcharge to all Localities 4,884,328 3,344,098 5,945,856 19,900,264 3,697,023 3,860,250 41,631,819 6,938,637
Capital Acquisition Funds:
Section 509-a Contribution from Net Revenues 412,800 (1,905,564) - - - - (1,492,764) (248,794)
Supplemental 1% Section 532 941,500 714,353 1,123,861 3,867,257 731,952 853,703 8,232,626 1,372,104
Other Fund Revenues net of Expenses (1,084,881) 138,068 (1,733,719) - - (1,199,018) (3,879,550) (646,592)
- - - - - - - -
Total Capital Acquisition Funds 269,419 (1,053,143) (609,858) 3,867,257 731,952 (345,315) 2,860,312 476,719
TOTAL 516 NET REVENUE (LOSS), SURCHARGE - - - - - - - -
AND CAPITAL ACQUISITIONS FUNDS 6,603,508 9,320,602 12,337,491 13,142,398 4,565,999 1,351,315 47,321,313 7,886,886
Source: Quarterly Reports Filed with the NYS Racing and Wagering Board Pursuant to Section 524 of the Racing Law.
89

ATTACHMENT V
Capital Catskill Nassau New York City Suffolk Western All Regions Average
NEW YORK STATE REGIONAL OFF-TRACK BETTING CORPORATIONS
STATEMENT OF REVENUES NET OF EXPENSES
2004(Unaudited)
EXPENSE DETAIL (From Exhibit 9)
Branch Operating Expenses
Admissions Tax - - 9,296 - 5,073 - 14,369 2,395
Adver ising 43,498 454,518 233,176 - 12,888 1,254 745,334 124,222
Amortization & Depreciation 163,476 363,015 20,340 - 476,111 1,114,231 2,137,173 356,196
Cable TV 27,490 15,738 28,935 - 17,428 - 89,591 14,932
Courier Service 87,905 - 120,186 - - - 208,091 34,682
Directors Fees and Reimbursements - - - - - - - -
Fringe Benefits 2,079,163 - 1,597,724 14,838,201 2,823,548 2,591,225 23,929,861 3,988,310
Insurance 473,923 1,016,028 137,310 1,897,273 338,927 323,469 4,186,930 697,822
Interest Expense 13,676 - 239,021 - 319,843 - 572,540 95,423
Maintenance & Repairs 866,315 364,663 252,391 452,119 231,640 947,197 3,114,325 519,054
Marketing & Promotions 240,481 - - - 283,694 - 524,175 87,363
Office Expense 121,836 45,955 146,872 180,516 27,522 - 522,701 87,117
Other Expenses & Services 623,129 64,536 885,148 414,308 31,992 961,842 2,980,955 496,826
Professional Fees - 130,564 65,250 - 2,400 - 198,214 33,036
Racing Information 218,422 242,725 - - 739,602 348,399 1,549,148 258,191
Rent 1,482,219 1,655,750 1,811,996 13,578,596 1,115,330 457,958 20,101,849 3,350,308
Rental of Equipment 189,212 13,008 650,233 3,080 355,839 - 1,211,372 201,895
Salaries and Wages 6,964,563 4,686,354 8,879,889 47,375,307 7,587,056 7,830,132 83,323,301 13,887,217
Security/Armoured Carrier Expense 79,480 43,661 429,211 1,074,662 31,024 149,879 1,807,917 301,320
Simulcast Fees 408,653 382,738 188,002 1,925,835 141,450 3,046,678 507,780
Telephone & Data Lines 236,942 119,579 123,148 1,176,793 223,255 339,114 2,218,831 369,805
Totalizator Expense 1,361,897 713,913 3,006,817 2,643,112 1,327,565 143,444 9,196,748 1,532,791
Travel & Reimbursement 6,533 70,096 - 150 500 5,050 82,329 13,722
Utilities 633,060 374,612 502,150 1,406,881 410,147 793,929 4,120,779 686,797
Total Branch Expenses 16,321,873 10,757,453 19,327,095 86,966,833 16,502,834 16,007,123 165,883,211 27,647,202
Source: Quarterly Reports Filed with the NYS Racing and Wagering Board Pursuant to Section 524 of the Racing Law.
90

ATTACHMENT V
Capital Catskill Nassau New York City Suffolk Western All Regions Average
NEW YORK STATE REGIONAL OFF-TRACK BETTING CORPORATIONS
STATEMENT OF REVENUES NET OF EXPENSES
2004(Unaudited)
Corporate Operating Expenses
Admissions Tax - - - - - - - -
Adver ising (55,553) - 265,369 2,036,934 - 131,128 2,377,878 396,313
Amortization & Depreciation 89,129 98,313 65,448 470,909 176,413 232,734 1,132,946 188,824
Cable TV 2,771 - 1,102 - 4,851 - 8,724 1,454
Courier Service 194 - (19) - - - 175 29
Directors Fees and Reimbursements 50,350 - 4,500 4,250 10,450 91,249 160,799 26,800
Fringe Benefits 1,101,236 - 2,939,658 6,950,332 2,822,218 1,438,123 15,251,567 2,541,928
Insurance 287,897 361,322 185,443 798,170 182,516 97,693 1,913,041 318,840
Interest Expense 6,029 - 20,181 11,213 - 6,757 44,180 7,363
Maintenance & Repairs 217,208 62,546 22,529 1,356,375 114,297 100,531 1,873,486 312,248
Marketing & Promotions 17,362 - 36,903 236,155 - 28,461 318,881 53,147
Office Expense 191,603 10,270 147,736 893,538 39,597 (17,196) 1,265,548 210,925
Other Expenses & Services 567,918 26,494 259,191 312,879 220,845 331,981 1,719,308 286,551
Professional Fees - 106,825 450,416 549,452 260,381 126,104 1,493,178 248,863
Racing Information 34,134 - - - - - 34,134 5,689
Rent 35,837 208,184 232,635 4,474,903 4,206 96,553 5,052,318 842,053
Rental of Equipment 791,443 22,287 14,283 144,209 4,085 - 976,307 162,718
Salaries and Wages 3,615,972 1,634,250 3,447,663 18,634,817 5,497,599 2,195,889 35,026,190 5,837,698
Security/Armoured Carrier Expense 8,352 2,592 26,110 58,877 2,460 - 98,391 16,399
Simulcast Fees 52,477 - - 109,248 - - 161,725 26,954
Telephone & Data Lines 175,350 66,634 247,854 250,912 35,393 31,513 807,656 134,609
Totalizator Expense - - 1,207 - - - 1,207 201
Travel & Reimbursement 139,163 12,370 91,915 94,726 26,938 11,277 376,389 62,732
Utilities 127,652 36,953 64,300 595,110 96,563 48,132 968,710 161,452
Total Corporate Expenses 7,456,524 2,649,040 8,524,424 37,983,009 9,498,812 4,950,929 71,062,738 11,843,790
Source: Quarterly Reports Filed with the NYS Racing and Wagering Board Pursuant to Section 524 of the Racing Law.
91

ATTACHMENT V
Capital Catskill Nassau New York City Suffolk Western All Regions Average
NEW YORK STATE REGIONAL OFF-TRACK BETTING CORPORATIONS
STATEMENT OF REVENUES NET OF EXPENSES
2004(Unaudited)
Combined Expenses
Admissions Tax - - 9,296 - 5,073 - 14,369 2,395
Adver ising (12,055) 454,518 498,545 2,036,934 12,888 132,382 3,123,212 520,535
Amortization & Depreciation 252,605 461,328 85,788 470,909 652,524 1,346,965 3,270,119 545,020
Cable TV 30,261 15,738 30,037 - 22,279 - 98,315 16,386
Courier Service 88,099 - 120,167 - - - 208,266 34,711
Directors Fees and Reimbursements 50,350 - 4,500 4,250 10,450 91,249 160,799 26,800
Fringe Benefits 3,180,399 - 4,537,382 21,788,533 5,645,766 4,029,348 39,181,428 6,530,238
Insurance 761,820 1,377,350 322,753 2,695,443 521,443 421,162 6,099,971 1,016,662
Interest Expense 19,705 - 259,202 11,213 319,843 6,757 616,720 102,787
Maintenance & Repairs 1,083,523 427,209 274,920 1,808,494 345,937 1,047,728 4,987,811 831,302
Marketing & Promotions 257,843 - 36,903 236,155 283,694 28,461 843,056 140,509
Office Expense 313,439 56,225 294,608 1,074,054 67,119 (17,196) 1,788,249 298,042
Other Expenses & Services 1,191,047 91,030 1,144,339 727,187 252,837 1,293,823 4,700,263 783,377
Professional Fees - 237,389 515,666 549,452 262,781 126,104 1,691,392 281,899
Racing Information 252,556 242,725 - - 739,602 348,399 1,583,282 263,880
Rent 1,518,056 1,863,934 2,044,631 18,053,499 1,119,536 554,511 25,154,167 4,192,361
Rental of Equipment 980,655 35,295 664,516 147,289 359,924 - 2,187,679 364,613
Salaries and Wages 10,580,535 6,320,604 12,327,552 66,010,124 13,084,655 10,026,021 118,349,491 19,724,915
Security/Armoured Carrier Expense 87,832 46,253 455,321 1,133,539 33,484 149,879 1,906,308 317,718
Simulcast Fees 461,130 382,738 188,002 2,035,083 141,450 - 3,208,403 534,734
Telephone & Data Lines 412,292 186,213 371,002 1,427,705 258,648 370,627 3,026,487 504,415
Totalizator Expense 1,361,897 713,913 3,008,024 2,643,112 1,327,565 143,444 9,197,955 1,532,993
Travel & Reimbursement 145,696 82,466 91,915 94,876 27,438 16,327 458,718 76,453
Utilities 760,712 411,565 566,450 2,001,991 506,710 842,061 5,089,489 848,248
TOTAL EXPENSES 23,778,397 13,406,493 27,851,519 124,949,842 26,001,646 20,958,052 236,945,949 39,490,992
Source: Quarterly Reports Filed with the NYS Racing and Wagering Board Pursuant to Section 524 of the Racing Law.
92

ATTACHMENT V
Capital Catskill Nassau New York City Suffolk Western All Regions Average
NEW YORK STATE REGIONAL OFF-TRACK BETTING CORPORATIONS
STATEMENT OF REVENUES NET OF EXPENSES
2004(Unaudited)
BALANCE SHEET (EXHIBIT 2)
Current Assets
Cash and Cash Equivalents 5,391,833 16,717,518 (123,819) 4,991,620 3,981,596 1,200,537 32,159,285 5,359,881
Investments - 17,326 3,193,031 17,796,607 - - 21,006,964 3,501,161
Accounts Receivable 313,773 52,663 951,934 849,767 1,132,078 586,404 3,886,619 647,770
Prepaid Expenses and Other Assets 1,105,909 162,330 2,154,626 1,177,779 697,893 454,456 5,752,993 958,832
Total Current Assets 6,811,515 16,949,837 6,175,772 24,815,773 5,811,567 2,241,397 62,805,861 10,467,644
Fixed Assets
Land 3,069,827 240,000 432,050 - 2,146,875 7,098,749 12,987,501 2,164,584
Buildings 9,970,335 1,485,583 479,550 - 10,584,271 37,462,532 59,982,271 9,997,045
Furniture & Fixtures 9,785,046 425,213 385,470 430,980 2,932,434 13,959,143 2,326,524
Automobile Equipment 295,483 297,197 292,113 864,284 537,216 582,595 2,868,888 478,148
Machinery & Equipment - 1,441,465 3,690 24,313,440 3,075,442 3,313,913 32,147,950 5,357,992
Leasehold Improvements 2,770,953 1,081,276 25,754,553 37,050,948 3,775,213 1,430,212 71,863,155 11,977,193
Total Fixed Assets 25,891,644 4,970,734 26,961,956 62,614,142 20,549,997 52,820,435 193,808,908 32,301,485
Less: Accumulated Depreciation 12,534,684 2,432,781 622,881 58,520,517 8,165,566 19,607,129 101,883,558 16,980,593
Net Fixed Assets 13,356,960 2,537,953 26,339,075 4,093,625 12,384,431 33,213,306 91,925,350 15,320,892
-
Total Assets 20,168,475 19,487,790 32,514,847 28,909,398 18,195,998 35,454,703 154,731,211 25,788,535
Current Liabilities
Accounts Payable 3,199,522 1,698,200 3,128,488 17,217,758 1,955,521 2,148,661 29,348,150 4,891,358
Due to New York State 81,668 583,383 75,421 3,406,198 59,020 64,982 4,270,672 711,779
Due Breeders Fund 108,557 66,855 172,970 574,959 - 1,118,798 2,042,139 340,357
Due to Local Governments 77,261 59,591 109,593 - 92,081 57,957 396,483 66,081
Accrued Payroll, Fringe Benefits and Payroll Taxes 347,973 514,561 2,200,109 4,736,062 1,871,789 844,408 10,514,902 1,752,484
Due to NYS Retirement System - Current Portion 100,383 - - - 390,206 1,057,386 1,547,975 257,996
Telephone Betting Accounts 601,134 264,385 2,242,176 1,825,320 324,066 115,468 5,372,549 895,425
Notes and Mortgage Payable - Current Portion 447,417 - 40,902 272,545 7,200,000 7,960,864 1,326,811
Capital Lease Obligations - Current Portion 72,383 - - - - 72,383 12,064
Uncashed Vouchers 203,847 - 105,629 268,356 175,451 56,568 809,851 134,975
Uncashed Winning Tickets 911,008 186,586 998,851 350,292 673,819 86,729 3,207,285 534,548
Total Current Liabilities 6,151,153 3,373,561 9,074,139 28,378,945 5,814,498 12,750,957 65,543,253 10,923,876
Long Term Liabilities
Due to NYS Retirement System - - - 296,821 127,434 424,255 70,709
Capital Lease Obligation 530,790 - - 515,979 - 1,046,769 174,462
Other 7,148,114 7,148,114 1,191,352
Notes and Mortgages Payable 4,897,980 - 12,567,524 4,182,051 21,647,555 3,607,926
Total Long Term Liabilites 5,428,770 - 12,567,524 7,664,093 4,478,872 127,434 30,266,693 5,044,449
-
Total Liabilities 11,579,923 3,373,561 21,641,663 36,043,038 10,293,370 12,878,391 95,809,946 15,968,324
Source: Quarterly Reports Filed with the NYS Racing and Wagering Board Pursuant to Section 524 of the Racing Law.
93

ATTACHMENT V
Capital Catskill Nassau New York City Suffolk Western All Regions Average
NEW YORK STATE REGIONAL OFF-TRACK BETTING CORPORATIONS
STATEMENT OF REVENUES NET OF EXPENSES
2004(Unaudited)
Undistributed Benefits To Localities
As of January 1:
Net Earnings and Regular Surcharge 2,784,988 3,609,418 2,709,624 (12,807,977) 482,251 7,386,658 4,164,962 694,160
Surcharge to Counties Conducting Racing - - - 543,297 - - 543,297 90,550
Capital Acquisition Fund 5,436,288 11,895,983 9,251,505 4,847,940 7,697,283 17,713,174 56,842,173 9,473,696
Total 8,221,276 15,505,401 11,961,129 (7,416,740) 8,179,534 25,099,832 61,550,432 10,258,405
Year To Date
Net Earnings and Regular Surcharge 5,241,083 9,554,849 11,749,162 (143,498) 2,762,589 652,681 29,816,866 4,969,478
Surcharge Counties Conducting Racing 10,671 - - 352,231 - 219,553 582,455 97,076
Capital Acquisition Fund Contributions 269,417 (1,040,941) (609,855) 285,878 731,952 (345,315) (708,864) (118,144)
Total Year To Date 5,521,171 8,513,908 11,139,307 494,611 3,494,541 526,919 29,690,457 4,948,410
Available For Distribution
Net Earnings and Regular Surcharge 8,026,071 13,164,267 14,458,786 (12,951,475) 3,244,840 8,039,339 33,981,828 5,663,638
Surcharge to Counties Conducting Racing 10,671 - - 895,528 - 219,553 1,125,752 187,625
Capital Acquisition Fund 5,705,707 10,855,042 8,641,650 5,133,818 8,429,235 17,367,859 56,133,311 9,355,552
Total Available 13,742,449 24,019,309 23,100,436 (6,922,129) 11,674,075 25,626,751 91,240,891 15,206,815
Distributed To Localities
Net Earnings and Regular Surcharge 5,143,227 7,905,083 12,227,252 5,439 3,771,447 2,830,887 31,883,335 5,313,889
Surcharge to Counties Conducting Racing 10,671 - - 206,072 - 219,553 436,296 72,716
Total Distributed 5,153,898 7,905,083 12,227,252 211,511 3,771,447 3,050,440 32,319,631 5,386,605
Undistributed Benefits
Net Earnings and Regular Surcharge 2,660,637 5,259,185 2,231,534 (12,951,475) 187,276 (7,619,358) (10,232,201) (1,705,367)
Surcharge to Counties Conducting Racing 222,208 - - 689,456 - - 911,664 151,944
Capital Acquisition Fund 5,705,707 10,855,042 8,641,650 5,128,379 7,715,352 30,195,669 68,241,799 11,373,633
Total Undistributed Benefits 8,588,552 16,114,227 10,873,184 (7,133,640) 7,902,628 22,576,311 58,921,262 9,820,210
Total Liabilities and Undistributed
Benefits to Own Localities 20,168,475 19,487,788 32,514,847 28,909,398 18,195,998 35,454,702 154,731,208 25,788,535
Note: NYC Undistributed benefit beginning balance is from previous month Amounts added and distributed are monthly
Source: Quarterly Reports Filed with the NYS Racing and Wagering Board Pursuant to Section 524 of the Racing Law.
94

ATTACHMENT V
2004 2005 2006 2007 2008
Exhibit 3 - Income Statement
Net Handle on:
In State Thoroughbred Tracks 84,110,402$ 81,498,026$ 80,245,436$ 77,831,065$ 74,162,174$
Out of State Thoroughbred Tracks 96,279,402 97,262,347 98,321,347 95,231,423 90,134,736
In State Harness Tracks 10,873,443 10,163,223 10,597,162 12,643,552 10,826,781
Out of State Harness Tracks 20,972,256 24,137,408 20,758,842 16,133,482 15,420,783
Total Net Handle 212,235,503 213,061,004 209,922,787 201,839,522 190,544,474
Less: - - - - -
Returned to Bettors 161,258,837 161,780,612 159,495,714 153,383,708 144,863,810
Surcharge 7,767,564 7,775,738 7,582,116 7,248,883 6,536,746
OTB Take Out and Breakage 43,209,102 43,504,654 42,844,957 41,206,931 39,143,918
0 00% 0 00% 0 00% 0 00% 0 00%
Less Payments to: - - - - -
NY State (Pari-Mutuel Tax & Breakage) 1,650,587 1,746,990 1,423,365 1,495,973 1,479,800
NY State Regulatory Fee 827,718 943,309 1,049,635 1,009,198 952,722
NY State (Uncashed Tickets) 840,000 751,200 767,200 814,640 801,830
Breeders' Fund - Thoroughbred 1,073,882 1,224,943 1,190,210 1,052,926 939,188
Breeders' Fund - Harness 494,767 359,656 491,587 454,493 425,260
In State Thoroughbred Tracks 9,393,289 9,241,379 9,223,023 8,924,938 8,443,542
Out of State Thoroughbred Tracks 2,270,882 2,321,382 2,350,790 2,313,214 2,446,460
In State Harness Tracks 4,302,042 3,636,777 4,398,482 4,278,661 4,015,758
Out of State Harness Tracks 419,675 530,929 435,016 335,929 317,156
City of Albany 338,391 349,972 325,134 304,435 -
City of Niagara - - - - -
Total Payments 21,611,233 21,106,537 21,654,442 20,984,407 19,821,716
Net Racing Revenue 21,597,869 22,398,117 21,190,515 20,222,524 19,322,202
- - - - -
Other Revenue: - - - - -
Admission Income 83,182 85,606 73,360 62,017 57,541
Lottery Income 485,239 466,989 441,473 416,869 398,897
Concession Income 216,021 184,730 232,931 237,323 242,124
Derived from Section 532 1,941,736 1,993,259 1,916,043 1,783,913 1,659,609
Interest Income 35,536 95,479 124,193 125,919 106,719
Other Income 441,375 (604,353) 237,638 115,904 76,748
Uncashed Tickets 840,000 751,200 767,200 814,640 801,830
Total Operating Revenue 25,640,958 25,371,027 24,983,353 23,779,109 22,665,670
- - - - -
Operating Expenses: - - - - -
Branch Expenses 16,321,873 15,227,102 14,805,227 14,709,522 14,559,257
Corporate Expenses 7,456,524 7,323,526 7,476,672 7,481,298 7,114,392
Total Operating Expenses - Including Depreciation 23,778,397 22,550,628 22,281,899 22,190,820 21,673,649
Section 516 Net Revenues from Operations 1,862,561 2,820,399 2,701,454 1,588,289 992,021
- - - - -
Section 516 Net Revenues from Operations 1,862,561 2,820,399 2,701,454 1,588,289 992,021
- - - - -
Less: - - - - -
Section 509-a Contributions to Capital Acquisition Fund (412,800) (412,800) (412,800) (309,600) (294,050)
Section 516 Net Revenue for Distribution (Loss) 1,449,761 2,407,599 2,288,654 1,278,689 697,971
Surcharge:
Section 532 Revenues to Participating Localities 3,463,597 3,475,972 3,401,894 3,237,997 2,881,011
- - - - -
Section 532 Revenues to Other Localities 1,420,731 1,358,562 1,336,623 1,333,080 1,195,082
Total Surcharge to all Localities 4,884,328 4,834,534 4,738,517 4,571,077 4,076,093
Capital Acquisition Funds:
Section 509-a Contribution from Net Revenues 412,800 412,800 412,800 309,600 294,050
Supplemental 1% Section 532 941,500 947,945 927,556 893,893 801,044
Other Fund Revenues net of Expenses (1,084,881) (1,257,598) (1,407,176) (1,328,145) (1,180,727)
Total Capital Acquisition Funds 269,419 103,147 (66,820) (124,652) (85,633)
TOTAL 516 NET REVENUE (LOSS), SURCHARGE
AND CAPITAL ACQUISITIONS FUNDS 6,603,508$ 7,345,280$ 6,960,351$ 5,725,114$ 4,688,431$
Capital District Regional Off-Track Betting Corporation(Unaudited)
Source: Quarterly Reports Filed with he NYS Racing Wagering Board Puruant to Section 524 of the Racing Law.95

ATTACHMENT V
2004 2005 2006 2007 2008
Capital District Regional Off-Track Betting Corporation(Unaudited)
EXPENSE DETAIL (From Exhibit 9)
Branch Operating Expenses
Admissions Tax - - - 2,481 0 272,502 0
Advertising 43,498 67,444 69,983 74,761 87,546
Amortization & Depreciation 163,476 146,347 138,525 141,027 140,032
Cable TV 27,490 29,083 30,777 32,639 32,554
Courier Service 87,905 111,194 118,365 117,673 126,559
Directors Fees and Reimbursements - - - - -
Fringe Benefits 2,079,163 1,632,960 1,590,125 1,627,802 1,493,906
Insurance 473,923 434,162 385,731 317,789 294,379
Interest Expense 13,676 7,693 2,597 194 0
Maintenance & Repairs 866,315 902,303 796,439 898,547 887,246
Marketing & Promotions 240,481 236,145 258,907 161,419 164,520
Office Expense 121,836 98,623 106,758 80,884 80,576
Other Expenses & Services 623,129 579,209 538,010 454,431 467,444
Professional Fees - - - - -
Racing Informa ion 218,422 206,712 201,835 219,064 217,647
Rent 1,482,219 1,466,631 1,436,510 1,455,125 1,477,756
Rental of Equipment 189,212 10,971 9,123 3,968 3,170
Salaries and Wages 6,964,563 6,446,249 6,280,146 6,202,055 5,956,681
Security/Armored Carrier Expense 79,480 82,604 66,206 65,387 69,808
Simulcast Fees 408,653 457,215 442,431 474,484 480,147
Telephone & Data Lines 236,942 260,833 307,168 293,803 210,085
Totalizator Expense 1,361,897 1,313,999 1,309,047 1,298,891 1,288,606
Travel & Reimbursement 6,533 11,850 12,661 11,063 21,826
Utilities 633,060 724,875 703,883 776,035 786,267
Total Branch Expenses 16,321,873 15,227,102 14,805,227 14,709,522 14,559,257
Corporate Operating Expenses
Admissions Tax - - - - -
Advertising (55,553) (41,888) (38,149) (30,887) (29,493)
Amortization & Depreciation 89,129 60,660 47,620 61,431 46,531
Cable TV 2,771 6,487 19,730 7,354 2,018,124
Courier Service 194 4,115 199 12 5
Directors Fees and Reimbursements 50,350 54,605 57,900 58,600 57,800
Fringe Benefits 1,101,236 943,359 1,006,404 922,714 699,482
Insurance 287,897 256,002 243,953 207,051 179,475
Interest Expense 6,029 2,822 544 0 0
Maintenance & Repairs 217,208 197,102 222,448 254,337 206,161
Marketing & Promotions 17,362 46,034 52,581 44,949 36,376
Office Expense 191,603 197,337 205,075 237,779 80,160
Other Expenses & Services 567,918 609,543 484,989 594,201 30,138
Professional Fees - - - - 504,054
Racing Informa ion 34,134 32,508 33,492 28,430 21,816
Rent 35,837 111,376 31,421 29,728 21,454
Rental of Equipment 791,443 836,932 894,019 994,213 46,469
Salaries and Wages 3,615,972 3,525,027 3,756,548 3,592,571 1,709,904
Security/Armored Carrier Expense 8,352 8,468 7,937 6,335 4,030
Simulcast Fees 52,477 54,700 52,692 58,323 3,700
Telephone & Data Lines 175,350 151,621 140,608 140,885 93,818
Totalizator Expense 0 3,609 13,715 13,800 330
Travel & Reimbursement 139,163 132,553 119,869 128,686 139,910
Utilities 127,652 130,554 123,077 130,786 150,221
Total Corporate Expenses 7,456,524 7,323,526 7,476,672 7,481,298 7,114,392
Combined Expenses
Admissions Tax - - - 2,481 272,502
Advertising (12,055) 25,556 31,834 43,874 58,053
Amortization & Depreciation 252,605 207,007 186,145 202,458 186,563
Cable TV 30,261 35,570 50,507 39,993 2,050,678
Courier Service 88,099 115,309 118,564 117,685 126,564
Directors Fees and Reimbursements 50,350 54,605 57,900 58,600 57,800
Fringe Benefits 3,180,399 2,576,319 2,596,529 2,550,516 2,193,388
Insurance 761,820 690,164 629,684 524,840 473,854
Interest Expense 19,705 10,515 3,141 194 -
Maintenance & Repairs 1,083,523 1,099,405 1,018,887 1,152,884 1,093,407
Marketing & Promotions 257,843 282,179 311,488 206,368 200,896
Office Expense 313,439 295,960 311,833 318,663 160,736
Other Expenses & Services 1,191,047 1,188,752 1,022,999 1,048,632 497,582
Professional Fees - - - - 504,054
Racing Informa ion 252,556 239,220 235,327 247,494 239,463
Rent 1,518,056 1,578,007 1,467,931 1,484,853 1,499,210
Rental of Equipment 980,655 847,903 903,142 998,181 49,639
Salaries and Wages 10,580,535 9,971,276 10,036,694 9,794,626 8,760,512
Security/Armored Carrier Expense 87,832 91,072 74,143 71,722 73,838
Simulcast Fees 461,130 511,915 495,123 532,807 483,847
Telephone & Data Lines 412,292 412,454 447,776 434,688 303,903
Totalizator Expense 1,361,897 1,317,608 1,322,762 1,312,691 1,288,936
Travel & Reimbursement 145,696 144,403 132,530 139,749 161,736
Utilities 760,712 855,429 826,960 906,821 936,488
TOTAL EXPENSES 23,778,397 22,550,628 22,281,899 22,190,820 21,673,649
Source: Quarterly Reports Filed with he NYS Racing Wagering Board Puruant to Section 524 of the Racing Law.96

ATTACHMENT V
2004 2005 2006 2007 2008
Capital District Regional Off-Track Betting Corporation(Unaudited)
BALANCE SHEET (EXHIBIT 2)
Current Assets
Cash and Cash Equivalents 5,391,833$ 6,060,782$ 7,131,842$ 7,762,910$ 8,019,000$
Investments - - - - -
Accounts Receivable 313,773 443,709 338,759 309,848 253,236
Prepaid Expenses and Other Assets 1,105,909 1,015,811 917,670 836,339 768,919
Total Current Assets 6,811,515 7,520,302 8,388,271 8,909,097 9,041,155
Fixed Assets
Land 3,069,827 3,069,827 3,069,827 3,069,827 3,069,827
Buildings 9,970,335 10,132,704 10,329,289 10,301,214 10,388,481
Furniture & Fixtures 9,785,046 10,356,553 10,588,169 8,780,512 7,598,436
Automobile Equipment 295,483 339,233 357,939 373,263 269,409
Machinery & Equipment - - - - -
Leasehold Improvements 2,770,953 2,710,901 2,787,905 2,857,924 2,725,657
Total Fixed Assets 25,891,644 26,609,218 27,133,129 25,382,740 24,051,810
Less: Accumulated Depreciation 12,534,684 13,491,122 14,613,073 13,719,969 13,207,832
Net Fixed Assets 13,356,960 13,118,096 12,520,056 11,662,771 10,843,978
0 0 0 0 0
Total Assets 20,168,475$ 20,638,398$ 20,908,327$ 20,571,868$ 19,885,133$
Current Liabilities
Accounts Payable 3,199,522$ 4,285,587$ 5,177,916$ 5,741,644$ 5,961,283$
Due to New York State 81,668 98,486 80,253 77,186 61,334
Due Breeders Fund 108,557 111,919 127,185 100,566 82,018
Due to Local Governments* 77,261 75,756 83,266 61,067 50,341
Accrued Payroll, Fringe Benefits and Payroll Taxes 347,973 409,377 467,907 462,865 494,817
Due to NYS Retirement System - Current Portion 100,383 0 - - - -
Telephone Betting Accounts 601,134 588,063 655,874 650,590 591,923
Notes and Mortgage Payable - Current Portion 447,417 435,319 262,661 100,000 100,000
Capital Lease Obligations - Current Portion 72,383 157,443 163,308 110,614 96,894
Uncashed Vouchers 203,847 144,018 118,508 121,427 99,864
Uncashed Winning Tickets 911,008 975,548 992,760 912,176 887,807
Total Current Liabilities 6,151,153 7,281,516 8,129,638 8,338,135 8,426,281
Long Term Liabilities
Due to NYS Retirement System - - - - -
Capital Lease Obligation 530,790 441,480 278,173 185,415 88,520
Other - - - - 45,913 0
Notes and Mortgages Payable 4,897,980 4,462,661 4,200,000 4,100,000 4,000,000
Total Long Term Liabilities 5,428,770 4,904,141 4,478,173 4,285,415 4,134,433
0 0 0 0 0
Total Liabilities 11,579,923$ 12,185,657$ 12,607,811$ 12,623,550$ 12,560,714$
Undistributed Benefits To Localities
As of January 1:
Net Earnings and Regular Surcharge 2,784,988$ 2,882,836$ 2,643,886$ 2,558,480$ 2,399,447$
Surcharge to Counties Conducting Racing - - - - -
Capital Acquisition Fund 5,436,288 5,705,707 5,808,855 5,742,036 5,525,484
Total 8,221,276 8,588,543 8,452,741 8,300,516 7,924,931
Year To Date
Net Earnings and Regular Surcharge 5,241,083 6,233,546 6,008,861 4,805,494 3,565,826
Surcharge Counties Conducting Racing 10,671 0 - 6,822 0 15,641 0 13,159 0
Capital Acquisition Fund Contributions 269,417 103,147 (66,820) (124,651) (85,633)
Total Year To Date 5,521,171 6,336,693 5,948,863 4,696,484 3,493,352
Available For Distribution
Net Earnings and Regular Surcharge 8,026,071 9,116,382 8,652,747 7,363,974 5,965,273
Surcharge to Counties Conducting Racing 10,671 0 - 6,822 0 15,641 0 13,159 0
Capital Acquisition Fund 5,705,707 5,808,855 5,742,036 5,617,386 5,439,851
Total Available 13,742,449 14,925,237 14,401,605 12,997,001 11,418,283
Distributed To Localities
Net Earnings and Regular Surcharge 5,143,227 6,472,493 6,094,265 5,033,030 4,080,705
Surcharge to Counties Conducting Racing 10,671 0 - 6,822 0 15,641 0 13,159 0
Total Distributed 5,153,898 6,472,493 6,101,087 5,048,671 4,093,864
Undistributed Benefits
Net Earnings and Regular Surcharge 2,660,637 2,643,886 2,558,480 2,128,350 1,884,568
Surcharge to Counties Conducting Racing 222,208 0 - - 202,582 0 -
Capital Acquisition Fund 5,705,707 5,808,855 5,742,036 5,617,386 5,439,851
Total Undistributed Benefits 8,588,552 8,452,741 8,300,516 7,948,318 7,324,419
Total Liabilities and Undistributed
Benefits to Own Localities 20,168,475$ 20,638,398$ 20,908,327$ 20,571,868$ 19,885,133$
Source: Quarterly Reports Filed with he NYS Racing Wagering Board Puruant to Section 524 of the Racing Law.97

ATTACHMENT V
2004 2005 2006 2007 2008
Exhibit 3 - Income Statement
Net Handle on:
In State Thoroughbred Tracks 41,119,505$ 41,364,026$ 38,877,337$ 35,532,013$ 33,986,994$
Out of State Thoroughbred Tracks 70,025,217 71,326,890 71,641,040 65,397,572 58,954,820
In State Harness Tracks 9,468,494 9,193,081 9,226,449 12,896,997 11,030,237
Out of State Harness Tracks 22,506,474 24,638,646 23,287,922 17,981,252 17,897,485
Total Net Handle 143,119,690 146,522,643 143,032,748 131,807,834 121,869,536
Less:
Returned to Bettors 107,270,433 109,778,640 107,230,208 98,823,334 91,465,174
Surcharge 5,721,739 5,780,496 5,576,646 5,131,305 4,760,896
OTB Take Out and Breakage 30,127,518 30,963,507 30,225,894 27,853,195 25,643,466
Less Payments to:
NY State (Pari-Mutuel Tax & Breakage) 1,219,508 1,254,359 1,052,724 951,283 1,078,269
NY State Regulatory Fee 558,167 639,435 715,164 659,039 609,348
NY State (Uncashed Tickets) 485,663 540,000 523,263 468,531 476,988
Breeders' Fund - Thoroughbred 647,151 650,624 726,331 682,029 454,446
Breeders' Fund - Harness 417,190 431,258 413,527 392,658 366,836
In State Thoroughbred Tracks 6,849,070 6,905,404 6,681,178 6,089,691 5,596,829
Out of State Thoroughbred Tracks 1,631,833 1,678,749 1,676,998 1,534,321 1,550,730
In State Harness Tracks 2,136,581 2,255,113 3,358,765 2,195,884 2,373,587
Out of State Harness Tracks 486,267 509,170 481,406 368,167 361,450
City of Albany - - - - -
City of Niagara - - - - -
Total Payments 14,431,430 14,864,112 15,629,356 13,341,603 12,868,483
Net Racing Revenue 15,696,088 16,099,395 14,596,538 14,511,592 12,774,983
Other Revenue:
Admission Income 101,905 91,760 93,055 93,320 83,860
Lottery Income 288,675 275,008 248,902 210,619 190,001
Concession Income 32,203 30,727 29,527 28,825 26,881
Derived from Section 532 1,663,288 1,715,725 1,652,645 1,448,250 1,344,943
Interest Income 45,224 486,711 818,870 222,437 465,051
Other Income 217,561 464,161 162,040 281,541 205,357
Uncashed Tickets 485,663 540,000 523,263 468,531 476,988
Total Operating Revenue 18,530,607 19,703,487 18,124,840 17,265,115 15,568,064
Operating Expenses:
Branch Expenses 10,757,484 10,603,717 10,238,241 9,970,853 9,568,136
Corporate Expenses 2,649,040 2,547,900 2,641,018 2,692,283 2,779,836
Total Operating Expenses - Including Depreciation 13,406,524 13,151,617 12,879,259 12,663,136 12,347,972
Section 516 Net Revenues from Operations 5,124,083 6,551,870 5,245,581 4,601,979 3,220,092
- - - - -
Section 516 Net Revenues from Operations 5,124,083 6,551,870 5,245,581 4,601,979 3,220,092
Less:
Section 509-a Contributions to Capital Acquisition Fund 1,905,564 198,518 309,610 1,873,021 304,725
Section 516 Net Revenue for Distribution (Loss) 7,029,647 6,750,388 5,555,191 6,475,000 3,524,817
Surcharge:
Section 532 Revenues to Participating Localities 2,503,693 2,649,028 2,569,464 2,354,926 2,169,941
Section 532 Revenues to Other Localities 840,405 692,069 651,225 683,745 649,468
Total Surcharge to all Localities 3,344,098 3,341,097 3,220,689 3,038,671 2,819,409
Capital Acquisition Funds:
Section 509-a Contribution from Net Revenues (1,905,564) (198,518) (309,610) (1,873,021) (304,725)
Supplemental 1% Section 532 714,353 723,674 703,312 644,384 596,544
Other Fund Revenues net of Expenses 138,068 - - 655,998 -
Total Capital Acquisition Funds (1,053,143) 525,156 393,702 (572,639) 291,819
TOTAL 516 NET REVENUE (LOSS), SURCHARGE
AND CAPITAL ACQUISITIONS FUNDS 9,320,602$ 10,616,641$ 9,169,582$ 8,941,032$ 6,636,045$
Catskill Regional Off-Track Betting Corporation(Unaudited)
Source: Quarterly Reports Filed wi h the New York State Racing Wagering Board Pursuant to Section 524 of the Racing Law.98

ATTACHMENT V
2004 2005 2006 2007 2008
Catskill Regional Off-Track Betting Corporation(Unaudited)
EXPENSE DETAIL (From Exhibit 9)
Branch Operating Expenses
Admissions Tax - - - 3,520 0 3,225 4
Advertising 454,518 475,938 220,841 188,338 173,962
Amortization & Depreciation 363,015 336,543 244,745 216,239 98,778
Cable TV 15,738 14,015 14,068 15,644 16,453
Courier Service 0 0 0 0 0
Directors Fees and Reimbursements - - - - -
Fringe Benefits 0 0 0 0 0
Insurance 1,016,028 1,007,916 1,007,961 1,033,800 992,573
Interest Expense 0 0 0 0 0
Maintenance & Repairs 364,663 309,856 376,501 400,222 340,264
Marketing & Promotions 0 0 0 0 0
Office Expense 45,955 15,884 19,431 19,021 37,331
Other Expenses & Services 64,536 78,777 68,115 68,736 57,066
Professional Fees 130,564 0 141,685 0 180,901 0 176,785 0 207,818 2
Racing Informa ion 242,725 195,886 185,545 206,338 195,248
Rent 1,655,750 1,638,010 1,753,731 1,787,293 1,738,974
Rental of Equipment 13,008 20,483 17,762 13,884 13,618
Salaries and Wages 4,686,354 4,554,502 4,459,124 4,161,699 4,010,019
Security/Armored Carrier Expense 43,661 45,021 44,999 41,883 41,863
Simulcast Fees 382,738 396,792 393,832 408,741 410,392
Telephone & Data Lines 119,579 108,367 119,479 106,588 110,029
Totalizator Expense 713,913 791,289 692,659 648,571 620,151
Travel & Reimbursement 70,096 75,881 83,835 83,242 100,801
Utilities 374,612 396,872 354,711 390,308 399,572
Total Branch Expenses 10,757,453 10,603,717 10,238,240 9,970,852 9,568,136
Corporate Operating Expenses
Admissions Tax - - - - -
Advertising 0 0 0 0 0
Amortization & Depreciation 98,313 83,348 116,398 141,290 159,625
Cable TV 0 0 0 800 1,462
Courier Service 0 0 0 0 0
Directors Fees and Reimbursements 0 0 0 0 0
Fringe Benefits 0 0 0 0 0
Insurance 361,322 372,671 406,321 423,590 402,126
Interest Expense 0 0 0 0 0
Maintenance & Repairs 62,546 78,091 3,120 3,142 3,195
Marketing & Promotions 0 0 0 0 0
Office Expense 10,270 9,865 8,784 7,378 8,944
Other Expenses & Services 26,494 31,490 33,514 21,427 20,575
Professional Fees 106,825 00 115,924 00 148,010 00 144,642 00 170,033 06
Racing Informa ion 0 0 0 0 0
Rent 208,184 206,471 228,531 276,664 319,261
Rental of Equipment 22,287 17,615 12,866 14,326 11,707
Salaries and Wages 1,634,250 1,521,142 1,583,497 1,524,765 1,243,751
Security/Armored Carrier Expense 2,592 2,699 3,003 3,196 3,522
Simulcast Fees 0 0 0 0 0
Telephone & Data Lines 66,634 58,551 48,019 66,813 31,191
Totalizator Expense 0 0 0 0 0
Travel & Reimbursement 12,370 13,391 14,794 14,690 17,788
Utilities 36,953 36,644 34,161 49,560 59,062
Total Corporate Expenses 2,649,040 2,547,902 2,641,018 2,692,283 2,779,836
Combined Expenses
Admissions Tax - - - 3,520 3,225
Advertising 454,518 475,938 220,841 188,338 173,962
Amortization & Depreciation 461,328 419,890 361,143 357,529 258,403
Cable TV 15,738 14,015 14,068 16,444 17,915
Courier Service - - - - -
Directors Fees and Reimbursements - - - - -
Fringe Benefits - - - - -
Insurance 1,377,350 1,380,587 1,414,282 1,457,390 1,394,699
Interest Expense - - - - -
Maintenance & Repairs 427,209 387,947 379,621 403,364 343,459
Marketing & Promotions - - - - -
Office Expense 56,225 25,749 28,215 26,399 46,275
Other Expenses & Services 91,030 110,266 101,629 90,163 77,641
Professional Fees 237,389 257,609 328,911 321,427 377,851
Racing Informa ion 242,725 195,886 185,545 206,338 195,248
Rent 1,863,934 1,844,481 1,982,262 2,063,957 2,058,236
Rental of Equipment 35,295 38,098 30,628 28,210 25,325
Salaries and Wages 6,320,604 6,075,644 6,042,621 5,686,464 5,581,365
Security/Armored Carrier Expense 46,253 47,720 48,002 45,079 45,384
Simulcast Fees 382,738 396,792 393,832 408,741 410,392
Telephone & Data Lines 186,213 166,917 167,498 173,401 141,219
Totalizator Expense 713,913 791,289 692,659 648,571 620,151
Travel & Reimbursement 82,466 89,272 98,629 97,932 118,589
Utilities 411,565 433,516 388,872 439,868 458,634
TOTAL EXPENSES 13,406,493 13,151,616 12,879,258 12,663,135 12,347,972
Source: Quarterly Reports Filed wi h the New York State Racing Wagering Board Pursuant to Section 524 of the Racing Law.99

ATTACHMENT V
2004 2005 2006 2007 2008
Catskill Regional Off-Track Betting Corporation(Unaudited)
BALANCE SHEET (EXHIBIT 2)
Current Assets
Cash and Cash Equivalents 16,717,518$ 17,604,467$ 18,318,099$ 17,539,993$ 17,704,248$
Investments 17,326 0 17,326 0 17,326 0 17,326 0 17,326 0
Accounts Receivable 52,663 34,984 108,820 169,405 199,148
Prepaid Expenses and Other Assets 162,330 213,591 203,327 127,649 130,675
Total Current Assets 16,949,837 17,870,368 18,647,572 17,854,373 18,051,397
Fixed Assets
Land 240,000 240,000 240,000 240,000 240,000
Buildings 1,485,583 1,352,434 1,520,644 3,308,499 3,404,000
Furniture & Fixtures 425,213 425,213 425,213 435,712 435,712
Automobile Equipment 297,197 311,416 243,552 226,492 247,194
Machinery & Equipment 1,441,465 0 1,450,613 0 1,533,721 0 1,591,213 0 1,763,802 0
Leasehold Improvements 1,081,276 1,139,577 1,169,030 1,185,454 1,201,387
Total Fixed Assets 4,970,734 4,919,253 5,132,160 6,987,370 7,292,095
Less: Accumulated Depreciation 2,432,781 2,805,102 3,059,932 3,399,650 3,658,053
Net Fixed Assets 2,537,953 2,114,151 2,072,228 3,587,720 3,634,042
Total Assets 19,487,790$ 19,984,519$ 20,719,800$ 21,442,093$ 21,685,439$
Current Liabilities
Accounts Payable 1,698,200$ 1,548,727$ 3,154,400$ 3,231,788$ 3,695,161$
Due to New York State 583,383 107,363 613,534 528,352 529,157
Due Breeders Fund 66,855 71,729 77,888 69,543 47,096
Due to Local Governments* 59,591 43,199 45,112 - -
Accrued Payroll, Fringe Benefits and Payroll Taxes 514,561 497,545 459,332 473,351 464,701
Due to NYS Retirement System - Current Portion - - - - -
Telephone Betting Accounts 264,385 236,727 205,287 199,336 183,596
Notes and Mortgage Payable - Current Portion - - - - -
Capital Lease Obligations - Current Portion - - - - -
Uncashed Vouchers - - - - -
Uncashed Winning Tickets 186,586 713,895 140,866 110,828 162,101
Total Current Liabilities 3,373,561 3,219,185 4,696,419 4,613,198 5,081,812
Long Term Liabilities
Due to NYS Retirement System - - - - -
Capital Lease Obligation - - - - -
Other - - - - -
Notes and Mortgages Payable - - - - -
Total Long Term Liabilities - - - - -
Total Liabilities 3,373,561$ 3,219,185$ 4,696,419$ 4,613,198$ 5,081,812$
Undistributed Benefits To Localities
As of January 1:
Net Earnings and Regular Surcharge 3,609,418$ 5,259,185$ 5,390,998$ 4,259,001$ 5,598,327$
Surcharge to Counties Conducting Racing - - - 45,112 00 38,828 00
Capital Acquisition Fund 11,895,983 10,855,042 11,370,678 11,764,380 11,191,741
Total 15,505,401 16,114,227 16,761,676 16,068,493 16,828,896
Year To Date
Net Earnings and Regular Surcharge 9,554,849 9,278,798 8,124,655 8,829,926 5,694,756
Surcharge Counties Conducting Racing - 120,616 0 - 1,288,910 0 1,054,313 0
Capital Acquisition Fund Contributions (1,040,941) 525,156 393,702 (572,639) 291,820
Total Year To Date 8,513,908 9,924,570 8,518,357 9,546,197 7,040,889
Available For Distribution
Net Earnings and Regular Surcharge 13,164,267 14,537,983 13,515,653 13,088,927 11,293,083
Surcharge to Counties Conducting Racing - 120,616 0 - 1,334,022 0 1,093,141 0
Capital Acquisition Fund 10,855,042 11,380,198 11,764,380 11,191,741 11,483,561
Total Available 24,019,309 26,038,797 25,280,033 25,614,690 23,869,785
Distributed To Localities
Net Earnings and Regular Surcharge 7,905,083 9,166,213 9,256,653 7,490,600 6,205,006
Surcharge to Counties Conducting Racing - 107,252 0 - 1,295,194 0 1,061,151 0
Total Distributed 7,905,083 9,273,465 9,256,653 8,785,794 7,266,157
Undistributed Benefits
Net Earnings and Regular Surcharge 5,259,185 5,371,770 4,258,999 5,598,327 5,088,077
Surcharge to Counties Conducting Racing - 13,364 0 - 38,828 0 31,990 0
Capital Acquisition Fund 10,855,042 11,380,198 11,764,380 11,191,741 11,483,561
Total Undistributed Benefits 16,114,227 16,765,332 16,023,381 16,828,896 16,603,628
Total Liabilities and Undistributed
Benefits to Own Localities 19,487,788$ 19,984,517$ 20,719,800$ 21,442,094$ 21,685,440$
Source: Quarterly Reports Filed wi h the New York State Racing Wagering Board Pursuant to Section 524 of the Racing Law.100

ATTACHMENT V
2004 2005 2006 2007 2008
Exhibit 3 - Income Statement
Net Handle on:
In State Thoroughbred Tracks 116,511,010$ 118,777,561$ 114,318,097$ 108,215,233$ 103,111,940$
Out of State Thoroughbred Tracks 140,026,121 150,275,752 152,076,148 146,467,678 141,992,436
In State Harness Tracks 10,119,354 8,259,865 8,057,603 13,189,651 11,546,026
Out of State Harness Tracks 32,699,049 33,801,171 33,223,103 25,650,935 25,307,285
Total Net Handle 299,355,534 311,114,349 307,674,951 293,523,497 281,957,687
Less:
Returned to Bettors 229,406,706 238,494,587 235,751,928 224,857,899 216,194,853
Surcharge 9,127,188 8,978,025 8,887,927 8,609,467 8,033,269
OTB Take Out and Breakage 60,821,640 63,641,737 63,035,096 60,056,131 57,729,565
Less Payments to:
NY State (Pari-Mutuel Tax & Breakage) 2,444,880 2,526,046 2,087,029 1,902,405 2,321,156
NY State Regulatory Fee 1,167,528 1,372,224 1,538,375 1,467,617 1,409,788
NY State (Uncashed Tickets) 823,318 796,625 822,906 850,287 868,599
Breeders' Fund - Thoroughbred 1,533,984 1,582,005 1,736,677 1,734,146 1,221,356
Breeders' Fund - Harness 722,486 706,827 690,441 654,474 621,602
In State Thoroughbred Tracks 16,162,052 16,778,050 16,545,560 15,797,024 15,206,930
Out of State Thoroughbred Tracks 3,024,129 3,356,568 3,478,613 3,330,991 3,644,730
In State Harness Tracks 3,041,951 3,154,083 2,926,089 2,835,476 4,517,791
Out of State Harness Tracks 892,878 769,550 711,018 498,784 488,428
City of Albany - - - - -
City of Niagara - - - - -
Total Payments 29,813,206 31,041,978 30,536,708 29,071,204 30,300,380
Net Racing Revenue 31,008,434 32,599,759 32,498,388 30,984,927 27,429,185
Other Revenue:
Admission Income 152,738 149,293 154,171 142,455 126,869
Lottery Income 51,518 53,223 48,947 53,995 43,446
Concession Income 109,513 105,104 113,945 112,423 109,490
Derived from Section 532 2,057,471 2,111,830 2,240,880 2,232,040 2,069,059
Interest Income 34,848 281,699 509,783 472,819 231,215
Other Income 615,167 941,846 501,416 399,518 799,909
Uncashed Tickets 823,318 796,625 822,906 850,287 868,599
Total Operating Revenue 34,853,007 37,039,379 36,890,436 35,248,464 31,677,772
Operating Expenses:
Branch Expenses 19,327,094 19,736,852 19,860,149 19,245,668 20,046,633
Corporate Expenses 8,524,420 11,119,823 11,626,414 11,426,668 11,485,040
Total Operating Expenses - Including Depreciation 27,851,514 30,856,675 31,486,563 30,672,336 31,531,673
Section 516 Net Revenues from Operations 7,001,493 6,182,704 5,403,873 4,576,128 146,099
- - - - -
Section 516 Net Revenues from Operations 7,001,493 6,182,704 5,403,873 4,576,128 146,099
Less:
Section 509-a Contributions to Capital Acquisition Fund
Section 516 Net Revenue for Distribution (Loss) 7,001,493 6,182,704 5,403,873 4,576,128 146,099
Surcharge:
Section 532 Revenues to Participating Localities 4,747,670 4,692,191 4,465,830 4,202,579 3,963,739
Section 532 Revenues to Other Localities 1,198,186 1,083,166 1,104,455 1,126,278 1,024,544
Total Surcharge to all Localities 5,945,856 5,775,357 5,570,285 5,328,857 4,988,283
Capital Acquisition Funds:
Section 509-a Contribution from Net Revenues - - - - -
Supplemental 1% Section 532 1,123,861 1,090,838 1,076,762 1,048,570 975,927
Other Fund Revenues net of Expenses (1,733,719) (1,905,233) (470,769) (956,685) (702,208)
Total Capital Acquisition Funds (609,858) (814,395) 605,993 91,885 273,719
TOTAL 516 NET REVENUE (LOSS), SURCHARGE
AND CAPITAL ACQUISITIONS FUNDS 12,337,491$ 11,143,666$ 11,580,151$ 9,996,870$ 5,408,101$
Nassau Regional Off-Track Betting Corporation(Unaudited)
Source: Quarterly Reports Filed wi h the New York State Racing Wagering Board Pursuant to Section 524 of the Racing Law.101

ATTACHMENT V
2004 2005 2006 2007 2008
Nassau Regional Off-Track Betting Corporation(Unaudited)
EXPENSE DETAIL (From Exhibit 9)
Branch Operating Expenses
Admissions Tax 9,296 5,822 5,975 5,544 4,888
Advertising 233,176 263,716 150,797 148,390 53,133
Amortization & Depreciation 20,340 54,289 33,742 28,396 20,432
Cable TV 28,935 34,275 41,138 44,896 47,211
Courier Service 120,186 116,273 116,896 112,517 109,333
Directors Fees and Reimbursements - - - - -
Fringe Benefits 1,597,724 1,824,584 1,890,906 1,944,925 1,976,291
Insurance 137,310 145,811 133,557 127,794 113,387
Interest Expense 239,021 585,617 796,376 0 194,526
Maintenance & Repairs 252,391 267,860 217,195 169,181 180,650
Marketing & Promotions 0 0 160 5 0
Office Expense 146,872 191,248 109,835 113,791 110,241
Other Expenses & Services 885,148 904,738 874,397 852,788 943,885
Professional Fees 65,250 0 140,359 0 23,123 0 - -
Racing Informa ion 0 0 0 0 0
Rent 1,811,996 1,556,120 1,639,958 1,570,965 1,765,680
Rental of Equipment 650,233 644,797 653,101 657,947 496,979
Salaries and Wages 8,879,889 8,636,748 8,645,200 9,009,209 9,226,634
Security/Armored Carrier Expense 429,211 291,755 476,979 490,846 533,429
Simulcast Fees 188,002 182,070 171,017 182,561 203,968
Telephone & Data Lines 123,148 153,775 132,324 85,980 61,170
Totalizator Expense 3,006,817 3,158,210 3,180,489 3,144,863 3,433,567
Travel & Reimbursement 0 0 0 0 0
Utilities 502,150 578,786 566,982 555,070 571,231
Total Branch Expenses 19,327,095 19,736,853 19,860,147 19,245,668 20,046,635
Corporate Operating Expenses
Admissions Tax - - - - -
Advertising 265,369 157,145 181,510 302,258 419,707
Amortization & Depreciation 65,448 345,870 440,851 466,339 480,968
Cable TV 1,102 996 1,596 2,278 2,546
Courier Service (19) 0 0 0 0
Directors Fees and Reimbursements 4,500 4,500 4,000 4,000 4,000
Fringe Benefits 2,939,658 4,092,960 3,696,223 3,484,589 3,204,274
Insurance 185,443 197,527 188,527 171,797 169,880
Interest Expense 20,181 0 0 0 0
Maintenance & Repairs 22,529 30,408 41,963 24,192 42,856
Marketing & Promotions 36,903 66,139 70,504 55,878 60,719
Office Expense 147,736 152,030 209,908 193,382 247,564
Other Expenses & Services 259,191 211,301 158,624 109,937 184,897
Professional Fees 450,416 00 434,668 00 791,863 00 831,515 00 810,404 00
Racing Informa ion 0 0 0 0 0
Rent 232,635 259,335 264,302 254,057 249,303
Rental of Equipment 14,283 5,958 5,373 971 949
Salaries and Wages 3,447,663 4,740,604 5,057,661 4,955,860 2,858,482
Security/Armored Carrier Expense 26,110 22,048 24,483 25,682 25,385
Simulcast Fees 0 0 0 4,250 731
Telephone & Data Lines 247,854 235,845 285,971 311,142 339,262
Totalizator Expense 1,207 0 (8,105) 0 0
Travel & Reimbursement 91,915 115,052 99,936 104,919 133,619
Utilities 64,300 47,439 111,224 123,621 121,395
Total Corporate Expenses 8,524,424 11,119,825 11,626,414 11,426,667 11,485,040
Combined Expenses
Admissions Tax 9,296 5,822 5,975 5,544 4,888
Advertising 498,545 420,861 332,307 450,648 472,840
Amortization & Depreciation 85,788 400,159 474,593 494,735 501,400
Cable TV 30,037 35,271 42,734 47,174 49,757
Courier Service 120,167 116,273 116,896 112,517 109,333
Directors Fees and Reimbursements 4,500 4,500 4,000 4,000 4,000
Fringe Benefits 4,537,382 5,917,544 5,587,129 5,429,514 5,180,565
Insurance 322,753 343,338 322,084 299,591 283,267
Interest Expense 259,202 585,617 796,376 - 194,526
Maintenance & Repairs 274,920 298,268 259,158 193,373 223,506
Marketing & Promotions 36,903 66,139 70,664 55,883 60,719
Office Expense 294,608 343,278 319,743 307,173 357,805
Other Expenses & Services 1,144,339 1,116,039 1,033,021 962,725 1,128,782
Professional Fees 515,666 575,027 814,986 831,515 810,404
Racing Informa ion - - - - -
Rent 2,044,631 1,815,455 1,904,260 1,825,022 2,014,983
Rental of Equipment 664,516 650,755 658,474 658,918 497,928
Salaries and Wages 12,327,552 13,377,352 13,702,861 13,965,069 14,213,215
Security/Armored Carrier Expense 455,321 313,803 501,462 516,528 558,814
Simulcast Fees 188,002 182,070 171,017 186,811 204,699
Telephone & Data Lines 371,002 389,620 418,295 397,122 400,432
Totalizator Expense 3,008,024 3,158,210 3,172,384 3,144,863 3,433,567
Travel & Reimbursement 91,915 115,052 99,936 104,919 133,619
Utilities 566,450 626,225 678,206 678,691 692,626
TOTAL EXPENSES 27,851,519 30,856,678 31,486,561 30,672,335 31,531,675
Source: Quarterly Reports Filed wi h the New York State Racing Wagering Board Pursuant to Section 524 of the Racing Law.102
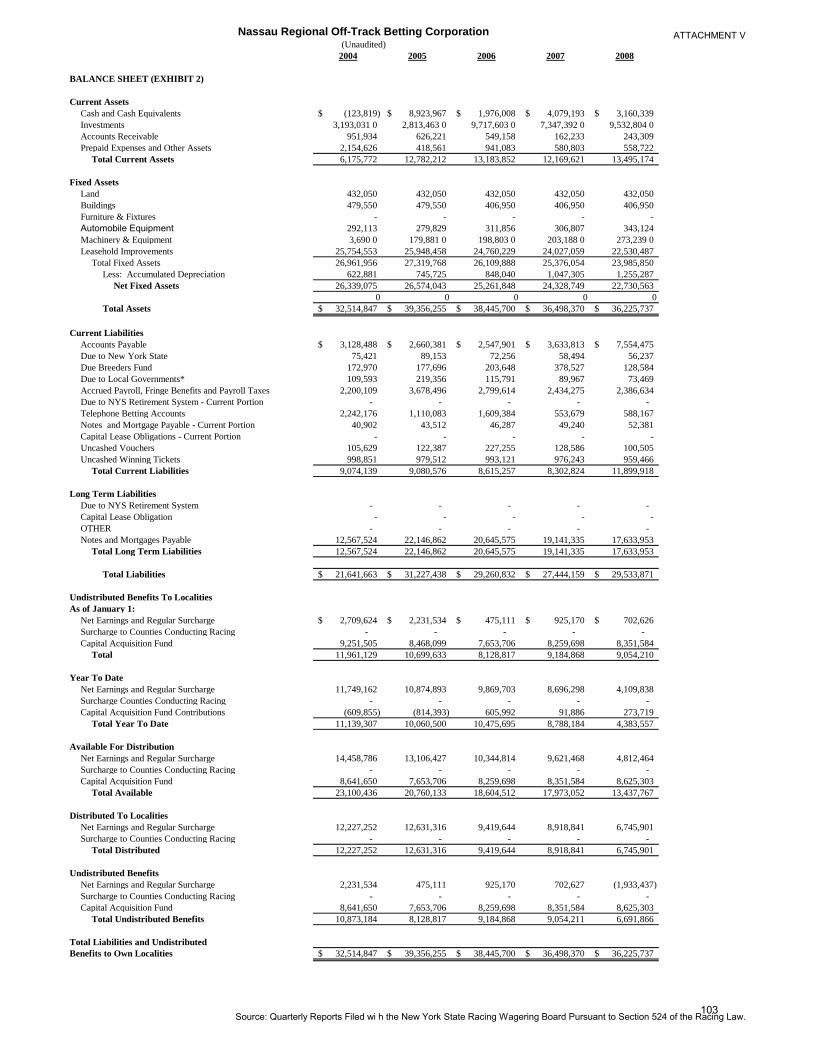
ATTACHMENT V
2004 2005 2006 2007 2008
Nassau Regional Off-Track Betting Corporation(Unaudited)
BALANCE SHEET (EXHIBIT 2)
Current Assets
Cash and Cash Equivalents (123,819)$ 8,923,967$ 1,976,008$ 4,079,193$ 3,160,339$
Investments 3,193,031 0 2,813,463 0 9,717,603 0 7,347,392 0 9,532,804 0
Accounts Receivable 951,934 626,221 549,158 162,233 243,309
Prepaid Expenses and Other Assets 2,154,626 418,561 941,083 580,803 558,722
Total Current Assets 6,175,772 12,782,212 13,183,852 12,169,621 13,495,174
Fixed Assets
Land 432,050 432,050 432,050 432,050 432,050
Buildings 479,550 479,550 406,950 406,950 406,950
Furniture & Fixtures - - - - -
Automobile Equipment 292,113 279,829 311,856 306,807 343,124
Machinery & Equipment 3,690 0 179,881 0 198,803 0 203,188 0 273,239 0
Leasehold Improvements 25,754,553 25,948,458 24,760,229 24,027,059 22,530,487
Total Fixed Assets 26,961,956 27,319,768 26,109,888 25,376,054 23,985,850
Less: Accumulated Depreciation 622,881 745,725 848,040 1,047,305 1,255,287
Net Fixed Assets 26,339,075 26,574,043 25,261,848 24,328,749 22,730,563
0 0 0 0 0
Total Assets 32,514,847$ 39,356,255$ 38,445,700$ 36,498,370$ 36,225,737$
Current Liabilities
Accounts Payable 3,128,488$ 2,660,381$ 2,547,901$ 3,633,813$ 7,554,475$
Due to New York State 75,421 89,153 72,256 58,494 56,237
Due Breeders Fund 172,970 177,696 203,648 378,527 128,584
Due to Local Governments* 109,593 219,356 115,791 89,967 73,469
Accrued Payroll, Fringe Benefits and Payroll Taxes 2,200,109 3,678,496 2,799,614 2,434,275 2,386,634
Due to NYS Retirement System - Current Portion - - - - -
Telephone Betting Accounts 2,242,176 1,110,083 1,609,384 553,679 588,167
Notes and Mortgage Payable - Current Portion 40,902 43,512 46,287 49,240 52,381
Capital Lease Obligations - Current Portion - - - - -
Uncashed Vouchers 105,629 122,387 227,255 128,586 100,505
Uncashed Winning Tickets 998,851 979,512 993,121 976,243 959,466
Total Current Liabilities 9,074,139 9,080,576 8,615,257 8,302,824 11,899,918
Long Term Liabilities
Due to NYS Retirement System - - - - -
Capital Lease Obligation - - - - -
OTHER - - - - -
Notes and Mortgages Payable 12,567,524 22,146,862 20,645,575 19,141,335 17,633,953
Total Long Term Liabilities 12,567,524 22,146,862 20,645,575 19,141,335 17,633,953
Total Liabilities 21,641,663$ 31,227,438$ 29,260,832$ 27,444,159$ 29,533,871$
Undistributed Benefits To Localities
As of January 1:
Net Earnings and Regular Surcharge 2,709,624$ 2,231,534$ 475,111$ 925,170$ 702,626$
Surcharge to Counties Conducting Racing - - - - -
Capital Acquisition Fund 9,251,505 8,468,099 7,653,706 8,259,698 8,351,584
Total 11,961,129 10,699,633 8,128,817 9,184,868 9,054,210
Year To Date
Net Earnings and Regular Surcharge 11,749,162 10,874,893 9,869,703 8,696,298 4,109,838
Surcharge Counties Conducting Racing - - - - -
Capital Acquisition Fund Contributions (609,855) (814,393) 605,992 91,886 273,719
Total Year To Date 11,139,307 10,060,500 10,475,695 8,788,184 4,383,557
Available For Distribution
Net Earnings and Regular Surcharge 14,458,786 13,106,427 10,344,814 9,621,468 4,812,464
Surcharge to Counties Conducting Racing - - - - -
Capital Acquisition Fund 8,641,650 7,653,706 8,259,698 8,351,584 8,625,303
Total Available 23,100,436 20,760,133 18,604,512 17,973,052 13,437,767
Distributed To Localities
Net Earnings and Regular Surcharge 12,227,252 12,631,316 9,419,644 8,918,841 6,745,901
Surcharge to Counties Conducting Racing - - - - -
Total Distributed 12,227,252 12,631,316 9,419,644 8,918,841 6,745,901
Undistributed Benefits
Net Earnings and Regular Surcharge 2,231,534 475,111 925,170 702,627 (1,933,437)
Surcharge to Counties Conducting Racing - - - - -
Capital Acquisition Fund 8,641,650 7,653,706 8,259,698 8,351,584 8,625,303
Total Undistributed Benefits 10,873,184 8,128,817 9,184,868 9,054,211 6,691,866
Total Liabilities and Undistributed
Benefits to Own Localities 32,514,847$ 39,356,255$ 38,445,700$ 36,498,370$ 36,225,737$
Source: Quarterly Reports Filed wi h the New York State Racing Wagering Board Pursuant to Section 524 of the Racing Law.103

ATTACHMENT V
2004 2005 2006 2007 2008
Exhibit 3 - Income Statement
Net Handle on:
In State Thoroughbred Tracks 343,030,302 340,003,080 332,669,816 314,745,579 290,237,032
Out of State Thoroughbred Tracks 548,224,513 550,506,561 578,839,019 572,609,452 519,478,971
In State Harness Tracks 41,319,969 30,973,836 30,260,589 54,549,460 45,887,289
Out of State Harness Tracks 103,513,288 124,941,025 119,214,702 88,293,413 84,615,068
Total Net Handle 1,036,088,072 1,046,424,502 1,060,984,126 1,030,197,904 940,218,360
Less:
Returned to Bettors 791,273,743 798,253,666 808,862,187 785,313,845 708,809,481
Surcharge 33,598,344 33,680,453 33,926,458 32,460,058 36,645,101
- - - - -
OTB Take Out and Breakage 211,215,985 214,490,383 218,195,481 212,424,001 194,763,778
Less Payments to:
NY State (Pari-Mutuel Tax & Breakage) 8,057,295 8,082,287 6,932,912 7,063,493 6,787,151
NY State Regulatory Fee 4,040,743 4,620,753 5,304,921 5,150,990 4,701,092
NY State (Uncashed Tickets) 3,199,463 2,871,658 2,897,298 3,485,619 2,779,180
Breeders' Fund - Thoroughbred 5,338,445 5,316,700 6,121,070 5,506,834 4,725,882
Breeders' Fund - Harness 2,490,583 2,527,320 2,465,198 2,353,976 2,132,408
In State Thoroughbred Tracks 61,262,235 59,517,281 60,838,834 58,718,029 54,501,563
Out of State Thoroughbred Tracks 12,295,593 12,414,619 12,871,292 12,713,987 12,957,961
In State Harness Tracks 12,437,929 14,392,291 15,641,986 14,070,108 13,043,524
Out of State Harness Tracks 2,230,952 2,617,722 2,468,374 1,816,128 1,777,067
City of Albany - - - - -
City of Niagara - - - - -
- - - - -
Total Payments 111,353,238 112,360,631 115,541,885 110,879,164 103,405,828
- - - - -
Net Racing Revenue 99,862,747 102,129,752 102,653,596 101,544,837 91,357,950
Other Revenue:
Admission Income 416,075 411,855 387,160 374,420 345,185
Lottery Income 15,691 22,884 - - -
Concession Income 111,198 70,401 41,528 44,167 75,302
Derived from Section 532 9,830,823 10,019,482 10,159,804 9,578,056 15,630,892
Interest Income 263,309 734,080 1,360,606 1,502,591 474,154
Other Income 625,414 1,738,392 435,888 762,901 527,621
Uncashed Tickets 3,199,463 2,871,658 2,897,298 3,485,619 2,779,180
- - - - -
Total Operating Revenue 114,324,720 117,998,504 117,935,880 117,292,591 111,190,284
Operating Expenses:
Branch Expenses 86,966,833 87,392,602 89,541,288 92,375,701 93,053,746
Corporate Expenses 37,983,010 36,120,921 151,960,013 58,784,370 97,939,253
- - - - -
Total Operating Expenses - Including Depreciation 124,949,843 123,513,523 241,501,301 151,160,071 190,992,999
- - - - -
Section 516 Net Revenues from Operations (10,625,123) (5,515,019) (123,565,421) (33,867,480) (79,802,715)
- - - - -
Section 516 Net Revenues from Operations (10,625,123) (5,515,019) (123,565,421) (33,867,480) (79,802,715)
Less:
Section 509-a Contributions to Capital Acquisition Fund
- - - - -
Section 516 Net Revenue for Distribution (Loss) (10,625,123) (5,515,019) (123,565,421) (33,867,480) (79,802,715)
Surcharge:
Section 532 Revenues to Participating Localities 17,347,136 17,284,741 17,425,134 16,448,602 8,422,826
Section 532 Revenues to Other Localities 2,553,128 2,468,742 2,385,119 2,614,391 2,356,787
- - - - -
Total Surcharge to all Localities 19,900,264 19,753,483 19,810,253 19,062,993 10,779,613
Capital Acquisition Funds:
Section 509-a Contribution from Net Revenues - - - - -
Supplemental 1% Section 532 3,867,257 3,907,488 3,956,401 3,819,009 10,234,596
Other Fund Revenues net of Expenses - - - - -
- - - - -
Total Capital Acquisition Funds 3,867,257 3,907,488 3,956,401 3,819,009 10,234,596
TOTAL 516 NET REVENUE (LOSS), SURCHARGE - - - - -
AND CAPITAL ACQUISITIONS FUNDS 13,142,398 18,145,952 (99,798,767) (10,985,478) (58,788,506)
New York City Off-Track Betting Corporation(Unaudited)
Source: Quarterly Reports Filed with the New York State Racing and Wagering Board Pursuant to Section 524 of the Racing Law.104

ATTACHMENT V
2004 2005 2006 2007 2008
New York City Off-Track Betting Corporation(Unaudited)
EXPENSE DETAIL (From Exhibit 9)
Branch Operating Expenses
Admissions Tax - - - 18,620 16,978
Advertising - - - - -
Amortization & Depreciation - - - - -
Cable TV - - - - -
Courier Service - - - - -
Directors Fees and Reimbursements - - - - -
Fringe Benefits 14,838,201 15,231,527 16,345,727 18,181,171 19,035,267
Insurance 1,897,273 1,756,723 3,135,189 1,935,506 1,463,666
Interest Expense - - - - -
Maintenance & Repairs 452,119 472,723 644,675 607,623 375,835
Marketing & Promotions - - - - -
Office Expense 180,516 225,847 230,758 221,129 174,617
Other Expenses & Services 414,308 279,316 401,668 413,705 224,201
Professional Fees - - - - -
Racing Informa ion - - - - -
Rent 13,578,596 14,066,340 14,255,429 15,091,182 17,400,046
Rental of Equipment 3,080 5,121 1,642 10,214 10,055
Salaries and Wages 47,375,307 46,202,078 45,999,875 46,691,400 45,062,742
Security/Armored Carrier Expense 1,074,662 1,071,588 1,013,579 1,058,558 1,095,686
Simulcast Fees 1,925,835 2,034,334 1,942,502 2,023,432 1,940,308
Telephone & Data Lines 1,176,793 1,777,675 1,275,073 1,772,246 1,851,068
Totalizator Expense 2,643,112 2,727,514 2,684,174 2,611,958 2,596,764
Travel & Reimbursement 150 5,733 6,266 9,060 8,631
Utilities 1,406,881 1,536,087 1,604,733 1,729,895 1,797,879
Total Branch Expenses 86,966,833 87,392,606 89,541,290 92,375,699 93,053,743
Corporate Operating Expenses
Admissions Tax - - - - -
Advertising 2,036,934 1,704,239 1,019,818 1,446,619 830,264
Amortization & Depreciation 470,909 462,624 457,675 136,257 191,634
Cable TV - - - - -
Courier Service - - - - -
Directors Fees and Reimbursements 4,250 3,250 2,250 2,250 -
Fringe Benefits 6,950,332 6,862,862 6,865,806 28,783,172 66,361,767
Insurance 798,170 651,871 1,387,781 767,954 594,417
Interest Expense 11,213 1,919 - - -
Maintenance & Repairs 1,356,375 996,365 1,081,320 1,061,358 1,100,687
Marketing & Promotions 236,155 317,614 188,339 143,695 1,868,539
Office Expense 893,538 726,982 516,848 709,476 573,986
Other Expenses & Services 312,879 405,673 205,628 240,302 369,949
Professional Fees 549,452 365,097 534,381 621,868 655,303
Racing Informa ion - - - - -
Rent 4,474,903 4,597,524 4,747,127 4,114,827 4,952,081
Rental of Equipment 144,209 43,824 52,092 204,899 (40,861)
Salaries and Wages 18,634,817 17,586,689 133,289,074 18,783,314 13,749,567
Security/Armored Carrier Expense 58,877 66,497 24,514 31,291 27,346
Simulcast Fees 109,248 95,020 104,079 165,989 231,604
Telephone & Data Lines 250,912 399,853 450,199 675,931 448,634
Totalizator Expense - - - - -
Travel & Reimbursement 94,726 89,963 109,219 105,092 72,429
Utilities 595,110 743,052 923,860 790,075 587,524
Total Corporate Expenses 37,983,009 36,120,918 151,960,010 58,784,369 97,939,254
Combined Expenses
Admissions Tax - - - 18,620 16,978
Advertising 2,036,934 1,704,239 1,019,818 1,446,619 830,264
Amortization & Depreciation 470,909 462,624 457,675 136,257 191,634
Cable TV - - - - -
Courier Service - - - - -
Directors Fees and Reimbursements 4,250 3,250 2,250 2,250 -
Fringe Benefits 21,788,533 22,094,389 23,211,533 46,964,343 85,397,034
Insurance 2,695,443 2,408,594 4,522,970 2,703,460 2,058,083
Interest Expense 11,213 1,919 - - -
Maintenance & Repairs 1,808,494 1,469,088 1,725,995 1,668,981 1,476,522
Marketing & Promotions 236,155 317,614 188,339 143,695 1,868,539
Office Expense 1,074,054 952,829 747,606 930,605 748,603
Other Expenses & Services 727,187 684,989 607,296 654,007 594,150
Professional Fees 549,452 365,097 534,381 621,868 655,303
Racing Informa ion - - - - -
Rent 18,053,499 18,663,864 19,002,556 19,206,009 22,352,127
Rental of Equipment 147,289 48,945 53,734 215,113 (30,806)
Salaries and Wages 66,010,124 63,788,767 179,288,949 65,474,714 64,176,693
Security/Armored Carrier Expense 1,133,539 1,138,085 1,038,093 1,089,849 1,123,032
Simulcast Fees 2,035,083 2,129,354 2,046,581 2,189,421 2,171,912
Telephone & Data Lines 1,427,705 2,177,528 1,725,272 2,448,177 2,299,702
Totalizator Expense 2,643,112 2,727,514 2,684,174 2,611,958 2,596,764
Travel & Reimbursement 94,876 95,696 115,485 114,152 81,060
Utilities 2,001,991 2,279,139 2,528,593 2,519,970 2,385,403
TOTAL EXPENSES 124,949,842 123,513,524 241,501,300 151,160,068 190,992,997
Source: Quarterly Reports Filed with the New York State Racing and Wagering Board Pursuant to Section 524 of the Racing Law.105

ATTACHMENT V
2004 2005 2006 2007 2008
New York City Off-Track Betting Corporation(Unaudited)
BALANCE SHEET (EXHIBIT 2)
Current Assets
Cash and Cash Equivalents 4,991,620 5,789,597 4,938,194 9,797,982 8,618,063
Investments 17,796,607 19,000,000 27,000,000 16,500,000 7,764,438
Accounts Receivable 849,767 760,288 736,128 603,598 1,334,903
Prepaid Expenses and Other Assets 1,177,779 1,035,813 1,349,506 577,579 (190,973)
Total Current Assets 24,815,773 26,585,698 34,023,828 27,479,159 17,526,431
Fixed Assets
Land - - - - -
Buildings - - - - -
Furniture & Fixtures 385,470 417,946 431,436 715,172 718,093
Automobile Equipment 864,284 976,240 1,059,260 1,233,868 1,234,222
Machinery & Equipment 24,313,440 25,288,086 26,282,423 27,602,683 28,523,316
Leasehold Improvements 37,050,948 38,029,507 38,723,702 30,467,308 41,438,481
Total Fixed Assets 62,614,142 64,711,779 66,496,821 60,019,031 71,914,112
Less: Accumulated Depreciation 58,520,517 60,954,103 63,022,908 59,752,650 71,219,073
Net Fixed Assets 4,093,625 3,757,676 3,473,913 266,381 695,039
Total Assets 28,909,398 30,343,374 37,497,741 27,745,540 18,221,470
Current Liabilities
Accounts Payable 17,217,758 28,094,218 44,350,969 46,851,640 48,392,397
Due to New York State 3,406,198 3,841,122 3,199,797 3,429,276 3,036,931
Due Breeders Fund 574,959 609,960 2,078,563 1,741,979 2,003,788
Due to Local Governments* - - - 557,170 608,207
Accrued Payroll, Fringe Benefits and Payroll Taxes 4,736,062 4,653,586 5,092,686 11,086,447 13,335,574
Due to NYS Retirement System - Current Portion - - 4,752,000 - -
Telephone Betting Accounts 1,825,320 1,723,426 1,799,198 1,768,133 1,714,707
Notes and Mortgage Payable - Current Portion - - - - -
Capital Lease Obligations - Current Portion - - - - 49,649
Uncashed Vouchers 268,356 258,220 263,331 278,247 303,158
Uncashed Winning Tickets 350,292 417,359 780,283 449,174 440,804
Total Current Liabilities 28,378,945 39,597,891 62,316,827 66,162,066 69,885,215
Long Term Liabilities
Due to NYS Retirement System - - 110,773,000 - -
Capital Lease Obligation 515,979 - - - -
Other 7,148,114 6,981,412 7,071,325 138,923,964 196,435,628
Notes and Mortgages Payable - - - - -
Total Long Term Liabilities 7,664,093 6,981,412 117,844,325 138,923,964 196,435,628
- - - - -
Total Liabilities 36,043,038 46,579,303 180,161,152 205,086,030 266,320,843
Undistributed Benefits To Localities
As of January 1:
Net Earnings and Regular Surcharge (12,807,977) (16,325,474) (141,592,330) (143,341,078) (177,392,495)
Surcharge to Counties Conducting Racing 543,297 466,652 462,712 52,964 52,006
Capital Acquisition Fund 4,847,940 - - - -
Total (7,416,740) (15,858,822) (141,129,618) (143,288,114) (177,340,489)
Year To Date
Net Earnings and Regular Surcharge (143,498) 639,887 (265,704) (17,419,248) (71,379,889)
Surcharge Counties Conducting Racing 352,231 336,949 363,903 2,614,391 2,356,788
Capital Acquisition Fund Contributions 285,878 - - - 10,234,597
Total Year To Date 494,611 976,836 98,199 (14,804,857) (58,788,504)
Available For Distribution
Net Earnings and Regular Surcharge (12,951,475) (15,685,587) (141,858,034) (160,760,326) (248,772,384)
Surcharge to Counties Conducting Racing 895,528 803,601 826,616 2,667,355 2,408,794
Capital Acquisition Fund 5,133,818 - - - 10,234,597
Total Available (6,922,129) (14,881,986) (141,031,418) (158,092,971) (236,128,993)
Distributed To Localities
Net Earnings and Regular Surcharge 5,439 1,231,554 1,483,044 16,632,171 9,612,497
Surcharge to Counties Conducting Racing 206,072 122,389 148,949 2,615,348 2,357,883
Total Distributed 211,511 1,353,943 1,631,993 19,247,519 11,970,380
Undistributed Benefits
Net Earnings and Regular Surcharge (12,951,475) (16,917,141) (143,341,078) (177,392,497) (258,384,882)
Surcharge to Counties Conducting Racing 689,456 681,212 677,667 52,007 50,911
Capital Acquisition Fund 5,128,379 - - - 10,234,597
Total Undistributed Benefits (7,133,640) (16,235,929) (142,663,411) (177,340,490) (248,099,374)
Total Liabilities and Undistributed
Benefits to Own Localities 28,909,398 30,343,374 37,497,741 27,745,540 18,221,469
Source: Quarterly Reports Filed with the New York State Racing and Wagering Board Pursuant to Section 524 of the Racing Law.106

ATTACHMENT V
2004 2005 2006 2007 2008
Exhibit 3 - Income Statement
Net Handle on:
In State Thoroughbred Tracks 78,762,001 74,739,277 72,374,593 68,111,177 66,022,800
Out of State Thoroughbred Tracks 96,792,065 94,300,450 95,411,835 91,561,746 84,302,475
In State Harness Tracks 7,572,034 5,878,091 5,206,507 9,845,196 8,955,868
Out of State Harness Tracks 22,166,764 24,129,091 22,184,867 18,640,602 19,309,801
Total Net Handle 205,292,864 199,046,909 195,177,802 188,158,721 178,590,944
Less: - - - - -
Returned to Bettors 157,243,766 152,243,277 149,072,417 143,850,589 136,340,933
Surcharge 5,917,320 5,828,961 5,813,549 5,441,814 5,211,934
- - - - -
OTB Take Out and Breakage 42,131,778 40,974,671 40,291,836 38,866,318 37,038,077
Less Payments to:
NY State (Pari-Mutuel Tax & Breakage) 1,783,159 1,721,517 1,433,530 1,457,619 1,433,507
NY State Regulatory Fee 800,642 876,308 968,135 940,794 892,955
NY State (Uncashed Tickets) 596,078 596,399 645,487 585,550 668,513
Breeders' Fund - Thoroughbred 1,039,727 996,466 1,100,118 975,617 879,695
Breeders' Fund - Harness 498,694 494,677 454,754 456,005 447,585
In State Thoroughbred Tracks 11,123,167 10,560,315 10,421,031 9,868,847 9,308,750
Out of State Thoroughbred Tracks 2,219,125 2,203,157 2,205,550 2,065,026 2,214,987
In State Harness Tracks 2,207,817 2,125,203 1,978,119 2,032,024 1,938,300
Out of State Harness Tracks 474,489 492,145 447,516 377,741 390,113
City of Albany - - - - -
City of Niagara - - - - -
- - - - -
Total Payments 20,742,898 20,066,187 19,654,240 18,759,223 18,174,405
- - - - -
Net Racing Revenue 21,388,880 20,908,484 20,637,596 20,107,095 18,863,672
- - - - -
Other Revenue: - - - - -
Admission Income 133,752 98,008 96,316 96,940 76,488
Lottery Income 78,739 87,355 99,304 125,792 134,183
Concession Income 69,169 53,200 54,064 53,629 70,428
Derived from Section 532 1,488,345 1,563,189 1,557,487 1,404,818 1,320,903
Interest Income 28,446 47,510 161,139 153,796 56,288
Other Income 2,355,261 2,622,704 2,801,400 709,740 667,679
Uncashed Tickets 596,078 596,398 645,487 585,550 668,513
- - - - -
Total Operating Revenue 26,138,670 25,976,848 26,052,793 23,237,360 21,858,154
- - - - -
Operating Expenses: - - - - -
Branch Expenses 16,502,834 16,049,092 16,501,299 14,564,647 14,573,930
Corporate Expenses 9,498,812 9,484,769 9,611,101 9,110,263 9,168,436
- - - - -
Total Operating Expenses - Including Depreciation 26,001,646 25,533,861 26,112,400 23,674,910 23,742,366
- - - - -
Section 516 Net Revenues from Operations 137,024 442,987 (59,607) (437,550) (1,884,212)
- - - - -
Section 516 Net Revenues from Operations 137,024 442,987 (59,607) (437,550) (1,884,212)
Less:
Section 509-a Contributions to Capital Acquisition Fund - (116,488) (413,035) (39,851) -
- - - - -
Section 516 Net Revenue for Distribution (Loss) 137,024 326,499 (472,642) (477,401) (1,884,212)
Surcharge:
Section 532 Revenues to Participating Localities 2,625,565 2,545,873 2,538,126 2,373,980 2,272,275
Section 532 Revenues to Other Localities 1,071,458 982,683 980,639 969,163 951,372
- - - - -
Total Surcharge to all Localities 3,697,023 3,528,556 3,518,765 3,343,143 3,223,647
Capital Acquisition Funds:
Section 509-a Contribution from Net Revenues - 116,488 413,035 39,851 -
Supplemental 1% Section 532 731,952 737,216 737,297 693,853 667,384
Other Fund Revenues net of Expenses - (326,410) 130,935 (480,986) (620,665)
- - - - -
Total Capital Acquisition Funds 731,952 527,294 1,281,267 252,718 46,719
TOTAL 516 NET REVENUE (LOSS), SURCHARGE - - - - -
AND CAPITAL ACQUISITIONS FUNDS 4,565,999 4,382,349 4,327,390 3,118,460 1,386,154
Suffolk Regional Off-Track Betting Corporation(Unaudited)
Source: Quarterly Reports Filed with the New York State Racing Board Pursuant to Section 524 of the Racing Law.107

ATTACHMENT V
2004 2005 2006 2007 2008
Suffolk Regional Off-Track Betting Corporation(Unaudited)
EXPENSE DETAIL (From Exhibit 9)
Branch Operating Expenses
Admissions Tax 5,073 3,876 3,605 3,643 3,494
Advertising 12,888 55,236 75,260 91,021 49,921
Amortization & Depreciation 476,111 453,459 450,303 148,045 144,526
Cable TV 17,428 16,182 15,606 14,534 15,714
Courier Service - - - - -
Directors Fees and Reimbursements - - - - -
Fringe Benefits 2,823,548 2,210,318 2,259,713 1,856,691 1,768,469
Insurance 338,927 337,753 286,340 173,593 116,724
Interest Expense 319,843 301,260 281,099 261,188 237,829
Maintenance & Repairs 231,640 190,030 238,731 258,021 221,018
Marketing & Promotions 283,694 234,871 318,768 384,601 404,016
Office Expense 27,522 89,874 110,120 64,020 98,147
Other Expenses & Services 31,992 62,229 30,594 72,824 45,394
Professional Fees 2,400 45 1,072 18,535 1,900
Racing Informa ion 739,602 667,593 691,797 742,192 635,879
Rent 1,115,330 1,140,570 1,272,424 1,256,241 1,612,051
Rental of Equipment 355,839 380,334 402,876 334,347 360,453
Salaries and Wages 7,587,056 7,657,055 7,837,419 6,724,186 6,709,174
Security/Armored Carrier Expense 31,024 23,936 30,101 40,469 38,840
Simulcast Fees 141,450 142,375 137,750 141,257 138,754
Telephone & Data Lines 223,255 237,001 195,674 210,337 97,042
Totalizator Expense 1,327,565 1,349,370 1,357,084 1,312,891 1,386,528
Travel & Reimbursement 500 1,199 - 6 6
Utilities 410,147 456,718 504,963 474,845 488,050
Total Branch Expenses 16,502,834 16,011,284 16,501,299 14,583,487 14,573,929
Corporate Operating Expenses
Admissions Tax - - - - -
Advertising - 289 - - -
Amortization & Depreciation 176,413 145,044 169,484 89,353 75,276
Cable TV 4,851 3,195 874 992 1,122
Courier Service - - - - -
Directors Fees and Reimbursements 10,450 9,100 30,217 10,279 9,067
Fringe Benefits 2,822,218 2,969,881 3,077,197 3,011,304 2,974,643
Insurance 182,516 190,705 192,942 130,632 120,449
Interest Expense - - 1,517 - -
Maintenance & Repairs 114,297 88,991 79,486 64,683 81,410
Marketing & Promotions - 81 2,537 639 1,205
Office Expense 39,597 29,407 41,889 35,607 44,701
Other Expenses & Services 220,845 177,607 181,815 118,256 155,450
Professional Fees 260,381 244,838 247,397 222,396 193,476
Racing Informa ion - 441 1,685 1,685 1,685
Rent 4,206 3,698 52,851 51,917 47,429
Rental of Equipment 4,085 30,405 33,768 34,169 20,290
Salaries and Wages 5,497,599 5,410,976 5,324,866 5,139,122 4,121,327
Security/Armored Carrier Expense 2,460 2,715 5,145 2,128 3,770
Simulcast Fees - - - - -
Telephone & Data Lines 35,393 36,839 30,896 30,871 26,622
Totalizator Expense - - - - -
Travel & Reimbursement 26,938 20,175 15,107 69,969 76,144
Utilities 96,563 120,385 121,427 95,379 96,004
Total Corporate Expenses 9,498,812 9,484,772 9,611,100 9,109,381 9,168,436
Combined Expenses
Admissions Tax 5,073 3,876 3,605 3,643 3,494
Advertising 12,888 55,525 75,260 91,021 49,921
Amortization & Depreciation 652,524 598,503 619,787 237,398 219,802
Cable TV 22,279 19,377 16,480 15,526 16,836
Courier Service - - - - -
Directors Fees and Reimbursements 10,450 9,100 30,217 10,279 9,067
Fringe Benefits 5,645,766 5,180,199 5,336,910 4,867,995 4,743,112
Insurance 521,443 528,458 479,282 304,225 237,173
Interest Expense 319,843 301,260 282,616 261,188 237,829
Maintenance & Repairs 345,937 279,021 318,217 322,704 302,428
Marketing & Promotions 283,694 234,952 321,305 385,240 405,221
Office Expense 67,119 119,281 152,009 99,627 142,848
Other Expenses & Services 252,837 239,836 212,409 191,080 200,844
Professional Fees 262,781 244,883 248,469 240,931 195,376
Racing Informa ion 739,602 668,034 693,482 743,877 637,564
Rent 1,119,536 1,144,268 1,325,275 1,308,158 1,659,480
Rental of Equipment 359,924 410,739 436,644 368,516 380,743
Salaries and Wages 13,084,655 13,068,031 13,162,285 11,863,308 11,948,867
Security/Armored Carrier Expense 33,484 26,651 35,246 42,597 42,610
Simulcast Fees 141,450 142,375 137,750 141,257 138,754
Telephone & Data Lines 258,648 273,840 226,570 241,208 123,664
Totalizator Expense 1,327,565 1,349,370 1,357,084 1,312,891 1,386,528
Travel & Reimbursement 27,438 21,374 15,107 69,975 76,150
Utilities 506,710 577,103 626,390 570,224 584,054
TOTAL EXPENSES 26,001,646 25,496,056 26,112,399 23,692,868 23,742,365
Source: Quarterly Reports Filed with the New York State Racing Board Pursuant to Section 524 of the Racing Law.108

ATTACHMENT V
2004 2005 2006 2007 2008
Suffolk Regional Off-Track Betting Corporation(Unaudited)
BALANCE SHEET (EXHIBIT 2)
Current Assets
Cash and Cash Equivalents 3,981,596 5,988,270 5,569,779 4,245,729 3,527,336
Investments - 1,000,000 - - -
Accounts Receivable 1,132,078 763,915 691,724 541,321 596,992
Prepaid Expenses and Other Assets 697,893 364,488 826,103 953,312 960,792
Total Current Assets 5,811,567 8,116,673 7,087,606 5,740,362 5,085,120
Fixed Assets
Land 2,146,875 2,146,875 2,058,342 2,058,342 2,058,342
Buildings 10,584,271 10,802,573 11,203,251 10,832,229 10,876,368
Furniture & Fixtures 430,980 425,679 424,639 525,076 535,993
Automobile Equipment 537,216 513,375 300,411 400,338 441,271
Machinery & Equipment 3,075,442 3,301,463 3,307,646 2,211,186 2,283,188
Leasehold Improvements 3,775,213 3,905,194 4,109,935 3,247,138 3,266,131
Total Fixed Assets 20,549,997 21,095,159 21,404,224 19,274,309 19,461,293
Less: Accumulated Depreciation 8,165,566 8,710,427 8,662,032 4,911,947 5,618,184
Net Fixed Assets 12,384,431 12,384,732 12,742,192 14,362,362 13,843,109
- - - - -
Total Assets 18,195,998 20,501,405 19,829,798 20,102,724 18,928,229
Current Liabilities
Accounts Payable 1,955,521 2,661,178 3,569,096 4,484,251 5,545,515
Due to New York State 59,020 103,372 86,310 210,945 59,514
Due Breeders Fund - 117,552 127,881 11,634 82,445
Due to Local Governments* 92,081 67,883 72,747 - -
Accrued Payroll, Fringe Benefits and Payroll Taxes 1,871,789 1,883,540 1,918,665 2,006,856 2,027,958
Due to NYS Retirement System - Current Portion 390,206 1,560,091 154,119 - -
Telephone Betting Accounts 324,066 396,643 373,069 329,275 298,282
Notes and Mortgage Payable - Current Portion 272,545 292,315 313,600 367,214 396,326
Capital Lease Obligations - Current Portion - - - - -
Uncashed Vouchers 175,451 163,674 174,127 165,611 187,870
Uncashed Winning Tickets 673,819 738,923 775,198 673,987 741,266
Total Current Liabilities 5,814,498 7,985,171 7,564,812 8,249,773 9,339,176
Long Term Liabilities
Due to NYS Retirement System 296,821 154,119 - - -
Capital Lease Obligation - - - - -
Other - - - - -
Notes and Mortgages Payable 4,182,051 3,889,703 3,575,678 3,673,314 3,276,717
Total Long Term Liabilities 4,478,872 4,043,822 3,575,678 3,673,314 3,276,717
- - - - -
Total Liabilities 10,293,370 12,028,993 11,140,490 11,923,087 12,615,893
Undistributed Benefits To Localities
As of January 1:
Net Earnings and Regular Surcharge 482,251 187,276 412,987 401,000 (417,901)
Surcharge to Counties Conducting Racing - - - 72,747 56,512
Capital Acquisition Fund 7,697,283 7,715,352 8,059,424 8,288,310 8,541,025
Total 8,179,534 7,902,628 8,472,411 8,762,057 8,179,636
Year To Date
Net Earnings and Regular Surcharge 2,762,589 2,662,452 2,478,519 1,878,621 388,064
Surcharge Counties Conducting Racing - - - 969,163 951,372
Capital Acquisition Fund Contributions 731,952 737,216 868,232 252,715 46,718
Total Year To Date 3,494,541 3,399,668 3,346,751 3,100,499 1,386,154
Available For Distribution
Net Earnings and Regular Surcharge 3,244,840 2,733,240 2,478,471 2,279,620 (29,837)
Surcharge to Counties Conducting Racing - - - 1,041,910 1,007,884
Capital Acquisition Fund 8,429,235 8,569,056 9,340,692 8,541,025 8,587,744
Total Available 11,674,075 11,302,296 11,819,163 11,862,555 9,565,791
Distributed To Localities
Net Earnings and Regular Surcharge 3,771,447 2,829,885 3,129,853 2,697,521 2,299,051
Surcharge to Counties Conducting Racing - - - 985,398 954,404
Total Distributed 3,771,447 2,829,885 3,129,853 3,682,919 3,253,455
Undistributed Benefits - - - - -
Net Earnings and Regular Surcharge 187,276 412,987 401,000 (417,901) (2,328,888)
Surcharge to Counties Conducting Racing - - - 56,512 53,480
Capital Acquisition Fund 7,715,352 8,059,424 8,288,310 8,541,025 8,587,744
Total Undistributed Benefits 7,902,628 8,472,411 8,689,310 8,179,636 6,312,336
Total Liabilities and Undistributed
Benefits to Own Localities 18,195,998 20,501,404 19,829,800 20,102,723 18,928,229
Source: Quarterly Reports Filed with the New York State Racing Board Pursuant to Section 524 of the Racing Law.109

ATTACHMENT V
2004 2005 2006 2007 2008
Exhibit 3 - Income Statement
Net Handle on:
In State Thoroughbred Tracks 47,336,000 44,243,373 41,357,878 41,240,391 39,909,495
Out of State Thoroughbred Tracks 64,482,280 60,803,204 59,233,409 60,038,837 56,453,035
In State Harness Tracks 11,764,927 12,385,270 12,944,369 15,253,144 14,087,215
Out of State Harness Tracks 25,958,365 27,970,807 26,692,985 22,902,670 23,535,938
Total Net Handle 149,541,572 145,402,654 140,228,641 139,435,042 133,985,683
Less:
Returned to Bettors 111,157,018 107,871,069 104,009,482 103,631,039 99,558,160
Surcharge 6,518,408 6,372,986 6,137,177 6,050,691 5,775,574
- - - - -
OTB Take Out and Breakage 31,866,146 31,158,599 30,081,982 29,753,312 28,651,949
Less Payments to:
NY State (Pari-Mutuel Tax & Breakage) 1,410,394 1,377,463 1,239,935 1,251,172 1,213,790
NY State Regulatory Fee 583,212 639,149 701,143 697,175 669,928
NY State (Uncashed Tickets) 615,000 610,000 650,000 650,000 600,000
Breeders' Fund - Thoroughbred 651,615 606,306 640,743 615,789 554,245
Breeders' Fund - Harness 467,184 483,633 468,931 459,875 456,205
In State Thoroughbred Tracks 6,930,660 6,480,397 6,084,114 6,092,655 5,703,428
Out of State Thoroughbred Tracks 1,474,048 1,488,926 1,423,497 1,436,086 1,508,807
In State Harness Tracks 2,714,487 2,652,059 2,730,643 2,815,804 2,804,869
Out of State Harness Tracks 591,202 563,820 521,867 457,337 470,713
City of Albany - - - - -
City of Niagara 63,567 55,576 48,439 42,566 -
- - - - -
Total Payments 15,501,369 14,957,329 14,509,312 14,518,459 13,981,985
- - - - -
Net Racing Revenue 16,364,777 16,201,270 15,572,670 15,234,853 14,669,964
Other Revenue:
Admission Income 2,780 3,409 1,847 2,185 1,723
Lottery Income 417,291 396,306 403,219 391,092 376,847
Concession Income 21,294 20,897 22,821 23,130 22,625
Derived from Section 532 1,804,455 1,787,603 1,723,730 1,643,369 1,570,576
Interest Income 10,620 15,748 67,351 60,164 32,610
Other Income (1,644,491) (770,787) 808,153 1,733,181 3,737,488
Uncashed Tickets 615,000 610,000 650,000 650,000 600,000
- - - - -
Total Operating Revenue 17,591,726 18,264,446 19,249,791 19,737,974 21,011,833
Operating Expenses:
Branch Expenses 15,405,770 15,229,552 14,796,707 14,869,309 14,594,902
Corporate Expenses 4,349,576 4,411,936 4,333,263 4,711,511 4,889,831
- - - - -
Total Operating Expenses - Including Depreciation 19,755,346 19,641,488 19,129,970 19,580,820 19,484,733
- - - - -
Section 516 Net Revenues from Operations (2,163,620) (1,377,042) 119,821 157,154 1,527,100
- - - - -
Section 516 Net Revenues from Operations (2,163,620) (1,377,042) 119,821 157,154 1,527,100
Less:
Section 509-a Contributions to Capital Acquisition Fund
- - - - -
Section 516 Net Revenue for Distribution (Loss) (2,163,620) (1,377,042) 119,821 157,154 1,527,100
Surcharge:
Section 532 Revenues to Participating Localities 2,833,497 2,787,377 2,679,516 2,627,105 2,503,838
Section 532 Revenues to Other Localities 1,026,753 945,741 910,004 971,766 933,202
- - - - -
Total Surcharge to all Localities 3,860,250 3,733,118 3,589,520 3,598,871 3,437,040
Capital Acquisition Funds:
Section 509-a Contribution from Net Revenues - - - - -
Supplemental 1% Section 532 853,703 852,265 823,927 808,451 767,958
Other Fund Revenues net of Expenses (1,199,018) (862,329) (1,031,977) (1,035,280) (1,006,279)
- - - - -
Total Capital Acquisition Funds (345,315) (10,064) (208,050) (226,829) (238,321)
TOTAL 516 NET REVENUE (LOSS), SURCHARGE - - - - -
AND CAPITAL ACQUISITIONS FUNDS 1,351,315 2,346,012 3,501,291 3,529,196 4,725,819
Western Regional Off-Track Betting Corporation(Unaudited)
Source: Quarterly Reports Filed With the New York State Racing Wagering Board Pursuant to Section 524 of the Racing Law.110

ATTACHMENT V
2004 2005 2006 2007 2008
Western Regional Off-Track Betting Corporation(Unaudited)
EXPENSE DETAIL (From Exhibit 9)
Branch Operating Expenses
Admissions Tax - 216,416 68,532 68,530 110,017
Advertising 1,254 641 2,031 3,250 5,498
Amortization & Depreciation 1,114,231 1,081,826 1,072,306 391,368 358,118
Cable TV - - - - -
Courier Service - - - - -
Directors Fees and Reimbursements - - - - -
Fringe Benefits 2,591,225 2,441,877 2,452,076 2,481,497 2,233,299
Insurance 323,469 345,895 303,874 234,842 188,707
Interest Expense - - - - -
Maintenance & Repairs 947,197 846,600 891,666 1,095,716 984,977
Marketing & Promotions - - - - -
Office Expense - - - - -
Other Expenses & Services 961,842 1,074,900 1,078,452 1,042,307 1,129,483
Professional Fees - - - - -
Racing Informa ion 348,399 318,119 347,138 376,334 404,065
Rent 457,958 412,659 308,194 304,233 318,982
Rental of Equipment - - - - -
Salaries and Wages 7,830,132 7,512,978 7,544,611 7,538,009 7,450,640
Security/Armored Carrier Expense 149,879 135,481 55,436 37,439 38,699
Simulcast Fees - - - - -
Telephone & Data Lines 339,114 342,080 329,103 355,277 428,719
Totalizator Expense 143,444 141,184 103,907 122,606 114,168
Travel & Reimbursement 5,050 5,298 3,912 5,637 7,182
Utilities 793,929 789,168 763,186 810,019 822,348
Total Branch Expenses 16,007,123 15,665,122 15,324,424 14,867,064 14,594,902
Corporate Operating Expenses
Admissions Tax - - - - -
Advertising 131,128 142,397 134,144 141,417 190,861
Amortization & Depreciation 232,734 249,463 214,687 72,479 93,338
Cable TV - - - - -
Courier Service - - - - -
Directors Fees and Reimbursements 91,249 90,677 93,597 48,906 102,385
Fringe Benefits 1,438,123 1,463,555 1,549,850 1,580,015 1,619,064
Insurance 97,693 96,674 89,370 97,410 62,045
Interest Expense 6,757 97,919 124,048 59,006 52,015
Maintenance & Repairs 100,531 114,547 141,595 123,430 128,551
Marketing & Promotions 28,461 12,546 - - -
Office Expense (17,196) - - - -
Other Expenses & Services 331,981 327,788 453,825 508,352 195,262
Professional Fees 126,104 184,675 166,740 163,873 157,803
Racing Informa ion - - - - -
Rent 96,553 97,700 107,940 36,368 1,440
Rental of Equipment - - - - 213,430
Salaries and Wages 2,195,889 1,868,972 1,675,642 1,790,059 1,488,946
Security/Armored Carrier Expense - - - - -
Simulcast Fees - - - - -
Telephone & Data Lines 31,513 31,852 33,177 29,764 28,326
Totalizator Expense - - - - -
Travel & Reimbursement 11,277 11,086 13,447 28,738 11,729
Utilities 48,132 57,654 62,913 31,694 11,932
Total Corporate Expenses 4,950,929 4,847,505 4,860,975 4,711,511 4,889,832
Combined Expenses
Admissions Tax - 216,416 68,532 68,530 110,017
Advertising 132,382 143,038 136,175 144,667 196,359
Amortization & Depreciation 1,346,965 1,331,289 1,286,993 463,847 451,456
Cable TV - - - - -
Courier Service - - - - -
Directors Fees and Reimbursements 91,249 90,677 93,597 48,906 102,385
Fringe Benefits 4,029,348 3,905,432 4,001,926 4,061,512 3,852,363
Insurance 421,162 442,569 393,244 332,252 250,752
Interest Expense 6,757 97,919 124,048 59,006 52,015
Maintenance & Repairs 1,047,728 961,147 1,033,261 1,219,146 1,113,528
Marketing & Promotions 28,461 12,546 - - -
Office Expense (17,196) - - - -
Other Expenses & Services 1,293,823 1,402,688 1,532,277 1,550,659 1,324,745
Professional Fees 126,104 184,675 166,740 163,873 157,803
Racing Informa ion 348,399 318,119 347,138 376,334 404,065
Rent 554,511 510,359 416,134 340,601 320,422
Rental of Equipment - - - - 213,430
Salaries and Wages 10,026,021 9,381,950 9,220,253 9,328,068 9,472,291
Security/Armored Carrier Expense 149,879 135,481 55,436 37,439 38,699
Simulcast Fees - - - - -
Telephone & Data Lines 370,627 373,932 362,280 385,041 457,045
Totalizator Expense 143,444 141,184 103,907 122,606 114,168
Travel & Reimbursement 16,327 16,384 17,359 34,375 18,911
Utilities 842,061 846,822 826,099 841,713 834,280
TOTAL EXPENSES 20,958,052 20,512,627 20,185,399 19,578,575 19,484,734
Source: Quarterly Reports Filed With the New York State Racing Wagering Board Pursuant to Section 524 of the Racing Law.111

ATTACHMENT V
2004 2005 2006 2007 2008
Western Regional Off-Track Betting Corporation(Unaudited)
BALANCE SHEET (EXHIBIT 2)
Current Assets
Cash and Cash Equivalents 1,200,537 2,725,694 4,044,233 3,630,102 5,748,814
Investments - - - - -
Accounts Receivable 586,404 2,774,524 1,816,490 2,155,320 1,177,420
Prepaid Expenses and Other Assets 454,456 928,233 679,810 - -
Total Current Assets 2,241,397 6,428,451 6,540,533 5,785,422 6,926,234
Fixed Assets
Land 7,098,749 7,214,847 7,240,310 7,269,127 7,406,815
Buildings 37,462,532 39,389,234 39,472,612 40,568,348 42,133,642
Furniture & Fixtures 2,932,434 3,137,444 4,267,526 7,229,806 8,030,283
Automobile Equipment 582,595 529,970 533,520 572,088 585,433
Machinery & Equipment 3,313,913 3,719,649 2,862,823 - -
Leasehold Improvements 1,430,212 1,430,212 777,768 420,029 418,974
Total Fixed Assets 52,820,435 55,421,356 55,154,559 56,059,398 58,575,147
Less: Accumulated Depreciation 19,607,129 21,690,801 23,030,425 24,692,822 26,915,990
Net Fixed Assets 33,213,306 33,730,555 32,124,134 31,366,576 31,659,157
- - - - -
Total Assets 35,454,703 40,159,006 38,664,667 37,151,998 38,585,391
Current Liabilities
Accounts Payable 2,148,661 5,125,215 6,068,001 5,308,171 6,789,768
Due to New York State 64,982 671,569 58,570 248,058 731,663
Due Breeders Fund 1,118,798 1,089,942 183,963 102,105 145,921
Due to Local Governments* 57,957 47,760 52,761 47,863 39,627
Accrued Payroll, Fringe Benefits and Payroll Taxes 844,408 827,128 816,101 878,100 971,878
Due to NYS Retirement System - Current Portion 1,057,386 840,503 1,037,844 780,857 719,328
Telephone Betting Accounts 115,468 130,153 121,073 131,108 126,237
Notes and Mortgage Payable - Current Portion 7,200,000 1,068,432 448,500 475,571 504,276
Capital Lease Obligations - Current Portion - - - - -
Uncashed Vouchers 56,568 71,856 115,003 84,754 103,148
Uncashed Winning Tickets 86,729 90,011 124,440 204,242 66,090
Total Current Liabilities 12,750,957 9,962,569 9,026,256 8,260,829 10,197,936
Long Term Liabilities
Due to NYS Retirement System 127,434 497,193 496,438 496,438 437,125
Capital Lease Obligation - - - - -
OTHER - - - - 146,663
Notes and Mortgages Payable - 8,664,215 8,194,504 7,718,933 7,214,657
Total Long Term Liabilities 127,434 9,161,408 8,690,942 8,215,371 7,798,445
Total Liabilities 12,878,391 19,123,977 17,717,198 16,476,200 17,996,381
Undistributed Benefits To Localities
As of January 1:
Net Earnings and Regular Surcharge 7,386,658 (7,619,358) (9,150,576) (9,030,086) (9,196,478)
Surcharge to Counties Conducting Racing - - - - 1,968
Capital Acquisition Fund 17,713,174 30,195,669 30,185,604 29,977,554 29,750,724
Total 25,099,832 22,576,311 21,035,028 20,947,468 20,556,214
Year To Date
Net Earnings and Regular Surcharge 652,681 1,410,335 2,799,337 2,784,259 3,882,058
Surcharge Counties Conducting Racing 219,553 211,986 197,912 208,176 226,387
Capital Acquisition Fund Contributions (345,315) (10,065) (208,050) (226,830) (238,322)
Total Year To Date 526,919 1,612,256 2,789,199 2,765,605 3,870,123
Available For Distribution
Net Earnings and Regular Surcharge 8,039,339 (6,209,023) (6,351,239) (6,245,827) (5,314,420)
Surcharge to Counties Conducting Racing 219,553 211,986 197,912 208,176 228,355
Capital Acquisition Fund 17,367,859 30,185,604 29,977,554 29,750,724 29,512,402
Total Available 25,626,751 24,188,567 23,824,227 23,713,073 24,426,337
Distributed To Localities
Net Earnings and Regular Surcharge 2,830,887 2,943,754 2,678,225 2,949,074 3,613,644
Surcharge to Counties Conducting Racing 219,553 209,785 198,534 207,787 223,682
Total Distributed 3,050,440 3,153,539 2,876,759 3,156,861 3,837,326
Undistributed Benefits
Net Earnings and Regular Surcharge (7,619,358) (9,152,777) (9,031,665) (9,194,901) (8,928,064)
Surcharge to Counties Conducting Racing - 2,201 1,579 415,963 4,673
Capital Acquisition Fund 30,195,669 30,185,604 29,977,554 29,750,724 29,512,402
Total Undistributed Benefits 22,576,311 21,035,028 20,947,468 20,971,786 20,589,011
Total Liabilities and Undistributed
Benefits to Own Localities 35,454,702 40,159,005 38,664,666 37,447,986 38,585,392
Source: Quarterly Reports Filed With the New York State Racing Wagering Board Pursuant to Section 524 of the Racing Law.112

ATTACHMENT VI
Batavia
Downs
Casino
Fairgrounds
Gaming &
Raceway*
Finger Lakes
Gaming &
Raceway
Monticello
Casino &
Raceway
New York
Racing
Association
Saratoga
Gaming &
Raceway
Tioga Downs
Casino
Vernon
Downs
Casino &
Hotel
Empire City
Casino
Yonkers
Raceway Total
Revenues 0
Pari-Mutuel Commissions - Live & Simulcasts 971,849 2,800,241 2,797,583 161,334,000 3,600,359 21,608,548 193,112,580
NYS OTB Commissions 183,961 1,966,490 7,859,127 95,217,000 1,136,163 12,166,078 118,528,819
Other revenues 73,262 2,411,819 1,946,006 30,979,000 3,521,863 471,368 39,403,318
Net VGM Track Commission 0 7,973,743 9,362,655 0 0 17,336,398
Less VGM Expenses 0 2,857,725 0 0 2,857,725
Net Gaming Revenues 0 7,973,743 0 6,504,930 0 0 0 0 0 14,478,673
Total Revenues 1,229,072 15,152,293 0 19,107,646 287,530,000 0 0 8,258,385 34,245,994 365,523,390
Expenses
Amounts paid to NYS - Taxes from Racing 91,448 196,801 218,595 10,549,000 179,427 2,096,624 13,331,895
Amounts paid to Breeders from Racing 35,365 444,812 122,743 3,175,000 69,703 680,653 4,528,276
Amounts paid for Purses-net 285,798 3,551,968 4,979,682 120,863,000 1,750,206 15,381,819 146,812,473
Pari-Mutuel & Operating Expenses 0 4,408,426 12,766,985 0 10,180,217 7,278,614 34,634,242
General and Admin Expenses 1,952,817 6,492,131 3,489,009 157,689,000 0 10,174,687 179,797,644
Depreciation 368,751 23,963 507,353 8,632,000 385,331 972,681 10,890,079
Other Expenses 136,080 365,926 55,500 2,575,985 4,829,451 7,962,942
Total Expenses 2,870,259 15,484,027 0 22,139,867 300,908,000 0 0 15,140,869 41,414,529 397,957,551
Income (Loss) before Taxes (1,641,187) (331,734) 0 (3,032,221) (13,378,000) 0 0 (6,882,484) (7,168,535) (32,434,161)
Other expense/(Income) (90,084) 0 0 243,964 0 (352,191) (604,446) (802,757)
Interest Expense 126,260 57,055 2,374,531 2,610,000 2,186,598 1,477,815 8,832,259
Total Net Income (Loss) Before Taxes (1,677,363) (388,789) 0 (5,650,716) (15,988,000) 0 0 (8,716,891) (8,041,904) (40,463,663)
Provision for Income Taxes, Expense (Benefit) 0 0 0 0 0 0 0 (70,349) (70,349)
Net Income (Loss) (1,677,363) (388,789) 0 (5,650,716) (15,988,000) 0 0 (8,716,891) (7,971,555) (40,393,314)
Number of Live Race Days 2 87 157 230 252 165 0 44 207 1,144
Items blocked out are subject to Freedom of Information issues raised by the track that are currently being addressed.
* VGM operating expenses are not separately reported. Therefore are included in either Pari-mutuel, general operating or other expense.
New York State Race Tracks
Financial Statements
2004
Source: Prepared from information obtained from Audited Financial Statements, NYS Racing Board Annual report and NYS Lottery Video Gaming Reports. 113

ATTACHMENT VI
Batavia
Downs
Casino
Fairgrounds
Gaming &
Raceway*
Finger Lakes
Gaming &
Raceway
Monticello
Casino &
Raceway
New York
Racing
Association
Saratoga
Gaming &
Raceway
Tioga Downs
Casino
Vernon
Downs
Casino &
Hotel
Empire City
Casino
Yonkers
Raceway Total
New York State Race Tracks
Financial Statements
2004
Current Assets ^
Cash and Cash Equivalents 2,175,953 5,247,529 10,330,000 71,578 2,429,882 20,254,942
Investments 0 0 0 0 0
Receivables 486,167 2,679,637 16,244,000 154,175 4,070,518 23,634,497
Restricted Cash 490,028 159,282 12,650,000 259,620 0 13,558,930
Prepaid Expenses 129,512 790,551 1,647,000 419,498 2,986,561
Other Assets 62,829 0 0 366,339 0 429,168
Total Current Assets 0 3,344,489 0 8,876,999 40,871,000 0 0 851,712 6,919,898 60,864,098
Property Plant and Equipment
Land and Land Improvements 294,128 2,251,196 32,905,000 12,825,814 48,276,138
Buildings and Building Improvements 0 28,530,758 196,565,000 0 225,095,758
Furniture Fixture and Equipment 653,832 2,742,908 45,465,000 21,957,102 5,208,492 76,027,334
Construction in progress 0 0 8,518,000 0 8,518,000
Other Assets 616,131 129,732 419,000 121,671 40,326,642 41,613,176
Less: Accumulated Depreciation 1,176,580 507,353 208,811,000 13,130,780 22,266,506 245,892,219
Total Property Plant and Equipment 0 387,511 0 33,147,241 75,061,000 0 0 8,947,993 36,094,442 153,638,187
Other Assets
Intangible Assets 0 0 0 10,927,000 0 0 10,927,000
Due from affiliated Companies 0 0 0 0 0 3,708,888 3,708,888
Loans receivable from shareholders 0 0 0 0 0 6,181,343 6,181,343
Other Assets 13,393 0 5,153,000 598,156 83,160 5,847,709
Total Assets 0 3,745,393 0 42,024,240 132,012,000 0 0 10,397,861 52,987,731 241,167,225
Current liabilities
Current Portion of Long Term Debt & N/P 0 0 0 0 26,847,074 39,500,000 66,347,074
Accounts Payable 776,572 1,492,618 17,953,000 4,505,413 8,902,905 33,630,508
Accrued Expenses 249,710 1,216,754 8,604,000 0 7,304,547 17,375,011
Purses Payable 888,660 0 2,615,866 15,848,000 461,455 2,619,787 22,433,768
Statutory Payables 0 0 0 1,476,000 0 0 6,850,309 8,326,309
State Facility 0 0 0 0 0 0 0 0
Other Liabilities 74,005 0 1,447,499 32,527,000 384,131 5,006 34,437,641
Total Current Liabilities 0 1,988,947 0 6,772,737 76,408,000 0 0 32,198,073 65,182,554 182,550,311
Non Current Liabilities
Long Term accrued expenses 0 0 0 72,515,000 0 0 0 72,515,000
Due to Shareholder/Parent 1,451,172 40,902,219 0 0 0 0 42,353,391
Long Term Debt 1,351,000 0 0 0 26,394 0 1,377,394
Other LT Liabilities 3,724,044 0 0 117,814,000 0 0 0 121,538,044
Total Long Term Liabilities 0 6,526,216 0 40,902,219 190,329,000 0 0 26,394 3,611,904 241,395,733
Minority Interest in consolidated Partnerships 0 0 0 0 0 0 0
Shareholders Equity
Stock 0 10,500 0 1,000 4,629,236 6,691,508 11,332,244
Less: Treasury Stock 0 0 0 0 0 0 0
Retained Earnings/(Accumulated Deficit) (4,780,270) (5,650,716) (102,155,000) (26,455,842) (22,498,235) (161,540,063)
Accumulated other comprehensive Income/(Loss) 0 (32,571,000) (32,571,000)
Total Stockholder's Equity 0 (4,769,770) 0 (5,650,716) (134,725,000) 0 0 (21,826,606) (15,806,727) (182,778,819)
Total Liabilities and Stockholder's Equity 0 3,745,393 0 42,024,240 132,012,000 0 0 10,397,861 52,987,731 241,167,225
^ - Batavia Downs assets, liabilities and equity are combined with Western OTB's balance sheet.
Note: Tioga Downs Opened in June 2006. Vernon Downs closed from July 2004 to August 2006.
Liabilities and Shareholders Equity
Assets
Source: Prepared from information obtained from Audited Financial Statements, NYS Racing Board Annual report and NYS Lottery Video Gaming Reports. 114

ATTACHMENT VI
Batavia
Downs
Casino
Fairgrounds
Gaming &
Raceway*
Finger Lakes
Gaming &
Raceway
Monticello
Casino &
Raceway
New York
Racing
Association
Saratoga
Gaming &
Raceway
Tioga Downs
Casino
Vernon
Downs
Casino &
Hotel
Empire City
Casino
Yonkers
Raceway** Total
Revenues 0
Pari-Mutuel Commissions - Live & Simulcasts 1,879,674 2,846,915 3,946,588 144,450,000 6,896,170 160,019,347
NYS OTB Commissions 1,033,155 1,407,605 11,705,030 96,719,000 8,241,139 119,105,929
Other revenues 385,940 5,294,243 3,036,823 39,726,000 188,909 48,631,915
Net VGM Track Commission 4,697,530 11,732,774 21,237,110 0 0 37,667,414
Less VGM Expenses 3,003,956 2,510,027 0 0 5,513,983
Net Gaming Revenues 1,693,574 11,732,774 0 18,727,083 0 0 0 0 0 32,153,431
Total Revenues 4,992,343 21,281,537 0 37,415,524 280,895,000 0 0 0 15,326,218 359,910,622
Expenses
Amounts paid to NYS - Taxes from Racing 180,460 203,062 233,885 9,974,000 952,185 11,543,592
Amounts paid to Breeders from Racing 73,164 574,064 139,277 2,970,000 296,082 4,052,587
Amounts paid for Purses-net 2,080,200 4,432,429 5,923,429 115,595,000 4,975,800 133,006,858
Pari-Mutuel & Operating Expenses 3,221,724 4,949,426 15,545,405 8,961,973 32,678,528
General and Admin Expenses 9,267,432 4,149,170 156,757,000 10,118,050 180,291,652
Depreciation 937,157 61,650 1,118,675 7,953,000 998,753 11,069,235
Other Expenses 164,848 1,069,400 812,497 134,000 594,000 2,774,745
Total Expenses 6,657,553 20,557,463 0 27,922,338 293,383,000 0 0 0 26,896,843 375,417,197
Income (Loss) before Taxes (1,665,210) 724,074 0 9,493,186 (12,488,000) 0 0 0 (11,570,625) (15,506,575)
Other expense/(Income) (95,829) 0 0 0 0 (2,060,735) (2,156,564)
Interest Expense 0 52,644 5,200,000 2,546,000 2,891,589 10,690,233
Total Net Income (Loss) Before Taxes (1,569,381) 671,430 0 4,293,186 (15,034,000) 0 0 0 (12,401,479) (24,040,244)
Provision for Income Taxes, Expense (Benefit) 0 8,340 0 0 0 0 0 6,180 14,520
Net Income (Loss) (1,569,381) 663,090 0 4,293,186 (15,034,000) 0 0 0 (12,407,659) (24,054,764)
Number of Live Race Days 58 84 160 235 254 173 0 0 105 1,069
Items blocked out are subject to Freedom of Information issues raised by the track that are currently being addressed.
* VGM operating expenses are not separately reported. Therefore are included in either Pari-mutuel, general operating or other expense.
** Yonkers closed in July 2005 for construction and renovations relating to beginning VGM operations.
New York State Race Tracks
Financial Statements
2005
Source: Prepared from information obtained from Audited Financial Statements, NYS Racing Board Annual report and NYS Lottery Video Gaming Reports. 115

ATTACHMENT VI
Batavia
Downs
Casino
Fairgrounds
Gaming &
Raceway*
Finger Lakes
Gaming &
Raceway
Monticello
Casino &
Raceway
New York
Racing
Association
Saratoga
Gaming &
Raceway
Tioga Downs
Casino
Vernon
Downs
Casino &
Hotel
Empire City
Casino
Yonkers
Raceway** Total
New York State Race Tracks
Financial Statements
2005
Current Assets ^
Cash and Cash Equivalents 2,717,947 6,341,550 9,672,000 3,114,377 21,845,874
Investments 0 0 0 0 0
Receivables 263,501 3,358,497 12,035,000 1,800,098 17,457,096
Restricted Cash 2,242,910 4,304,847 14,539,000 0 21,086,757
Prepaid Expenses 108,050 1,026,389 2,217,000 535,960 3,887,399
Other Assets 58,195 0 0 0 58,195
Total Current Assets 0 5,390,603 0 15,031,283 38,463,000 0 0 0 5,450,435 64,335,321
Property Plant and Equipment
Land and Land Improvements 294,128 2,265,216 33,237,000 12,825,814 48,622,158
Buildings and Building Improvements 605,830 29,037,146 197,829,000 29,271,248 256,743,224
Furniture Fixture and Equipment 830,864 2,724,335 46,307,000 5,242,821 55,105,020
Construction in progress 0 0 9,155,000 0 9,155,000
Other Assets 0 120,384 357,000 0 27,353,278 27,830,662
Less: Accumulated Depreciation 1,111,698 1,621,828 216,294,000 5,155,410 224,182,936
Total Property Plant and Equipment 0 619,124 0 32,525,253 70,591,000 0 0 0 69,537,751 173,273,128
Other Assets
Intangible Assets 0 0 0 4,901,000 0 0 4,901,000
Due from affiliated Companies 0 0 0 0 0 3,064,483 3,064,483
Loans receivable from shareholders 0 0 0 0 0 6,818,189 6,818,189
Other Assets 13,030 0 4,056,000 10,287,402 14,356,432
Total Assets 0 6,022,757 0 47,556,536 118,011,000 0 0 0 95,158,260 266,748,553
Current liabilities
Current Portion of Long Term Debt & N/P 0 0 0 0 0 0
Accounts Payable 591,468 738,179 31,442,000 8,194,379 40,966,026
Accrued Expenses 696,431 2,666,951 11,770,000 7,574,909 22,708,291
Purses Payable 1,593,084 0 3,327,650 14,369,000 3,087,903 22,377,637
Statutory Payables 0 0 0 1,284,000 0 0 1,284,000
State Facility 0 0 0 0 0 0 0
Other Liabilities 769,206 0 26,942,000 2,500,608 30,211,814
Total Current Liabilities 0 3,650,189 0 6,732,780 85,807,000 0 0 0 21,357,799 117,547,768
Non Current Liabilities
Long Term accrued expenses 0 0 0 90,558,000 0 0 90,558,000
Due to Shareholder/Parent 1,846,115 42,181,286 0 0 0 44,027,401
Long Term Debt 1,051,000 0 0 0 98,365,549 99,416,549
Other LT Liabilities 3,582,133 0 0 94,937,000 0 5,006 98,524,139
Total Long Term Liabilities 0 6,479,248 0 42,181,286 185,495,000 0 0 0 98,370,555 332,526,089
Minority Interest in consolidated Partnerships 0 0 0 0 0 3,611,904 3,611,904
Shareholders Equity
Stock 0 10,500 0 1,000 7,101,908 7,113,408
Less: Treasury Stock 0 0 0 0 0 0 0
Retained Earnings/(Accumulated Deficit) (4,117,180) (1,357,530) (117,189,000) (30,684,647) (153,348,357)
Accumulated other comprehensive Income/(Loss) 0 0 0 (36,103,000) (4,599,259) (40,702,259)
Total Stockholder's Equity 0 (4,106,680) 0 (1,357,530) (153,291,000) 0 0 0 (28,181,998) (186,937,208)
Total Liabilities and Stockholder's Equity 0 6,022,757 0 47,556,536 118,011,000 0 0 0 95,158,260 266,748,553
^ - Batavia Downs assets, liabilities and equity are combined with Western OTB's balance sheet.
Note: Tioga Downs Opened in June 2006. Vernon Downs closed from July 2004 to August 2006.
Liabilities and Shareholders Equity
Assets
Source: Prepared from information obtained from Audited Financial Statements, NYS Racing Board Annual report and NYS Lottery Video Gaming Reports. 116

ATTACHMENT VI
Batavia
Downs
Casino*
Fairgrounds
Gaming &
Raceway
Finger Lakes
Gaming &
Raceway
Monticello
Casino &
Raceway
New York
Racing
Association
Saratoga
Gaming &
Raceway
Tioga Downs
Casino*
Vernon
Downs
Casino &
Hotel*
Empire City
Casino
Yonkers
Raceway** Total
Revenues 0
Pari-Mutuel Commissions - Live & Simulcasts 1,617,607 2,602,345 3,248,794 146,173,000 1,078,691 498,411 2,337,006 157,555,854
NYS OTB Commissions 1,059,192 1,315,794 14,748,380 95,860,000 578,597 880,959 1,673,000 116,115,922
Other revenues 982,786 6,387,070 3,581,448 33,462,000 1,776,461 1,584,863 917,339 48,691,967
Net VGM Track Commission 7,682,921 13,394,801 23,688,000 0 6,678,163 2,301,906 15,978,604 69,724,395
Less VGM Expenses 0 13,166,843 49,846 0 0 0 8,093,865 21,310,554
Net Gaming Revenues 7,682,921 227,958 0 23,638,154 0 0 6,678,163 2,301,906 7,884,739 48,413,841
Total Revenues 11,342,506 10,533,167 0 45,216,776 275,495,000 0 10,111,912 5,266,139 12,812,084 370,777,584
Expenses
Amounts paid to NYS - Taxes from Racing 189,467 174,014 236,613 9,850,000 45,088 80,751 148,272 10,724,205
Amounts paid to Breeders from Racing 65,405 618,572 145,011 2,883,000 305,311 132,281 53,521 4,203,101
Amounts paid for Purses-net 3,397,899 4,874,232 8,468,165 119,296,000 1,773,887 593,460 5,578,178 143,981,821
Pari-Mutuel & Operating Expenses 5,911,054 3,439,794 17,385,246 2,385,837 1,484,414 7,154,212 37,760,557
General and Admin Expenses 0 5,815,922 149,530,000 8,201,402 4,120,454 19,633,490 187,301,268
Depreciation 1,007,316 130,425 1,139,152 7,071,000 735,823 805,045 3,306,225 14,194,986
Other Expenses 161,117 0 1,950,000 0 1,993,462 6,494,946 8,899,906 19,499,431
Total Expenses 10,732,258 9,237,037 0 35,140,109 288,630,000 0 15,440,810 13,711,351 44,773,804 417,665,369
Income (Loss) before Taxes 610,248 1,296,130 0 10,076,667 (13,135,000) 0 (5,328,898) (8,445,212) (31,961,720) (46,887,785)
Other expense/(Income) (17,463) 0 0 1,813,000 (750,500) 70,505 (477,081) 638,461
Interest Expense 499,200 41,302 2,939,282 2,882,000 4,708,484 829,478 7,159,084 19,058,830
Total Net Income (Loss) Before Taxes 128,511 1,254,828 0 7,137,385 (17,830,000) 0 (9,286,882) (9,345,195) (38,643,723) (66,585,076)
Provision for Income Taxes, Expense (Benefit) 0 9,703 1,965,151 0 0 0 (2,140,785) 24,639 (141,292)
Net Income (Loss) 128,511 1,245,125 0 5,172,234 (17,830,000) 0 (9,286,882) (7,204,410) (38,668,362) (66,443,784)
Number of Live Race Days 57 84 156 246 248 171 51 30 32 1,075
Items blocked out are subject to Freedom of Information issues raised by the track that are currently being addressed.
* VGM operating expenses are not seperately reported. Therefore are included in either Pari-mutuel, general operating or other expense.
** Yonkers reopened in the fall of 2006 and raced only 32 days during the year. The OTB commissions are estimated for this year based on past years amounts.
New York State Race Tracks
Financial Statements
2006
Source: Prepared from information obtained from Audited Financial Statements, NYS Racing Board Annual report and NYS Lottery Video Gaming Reports. 117
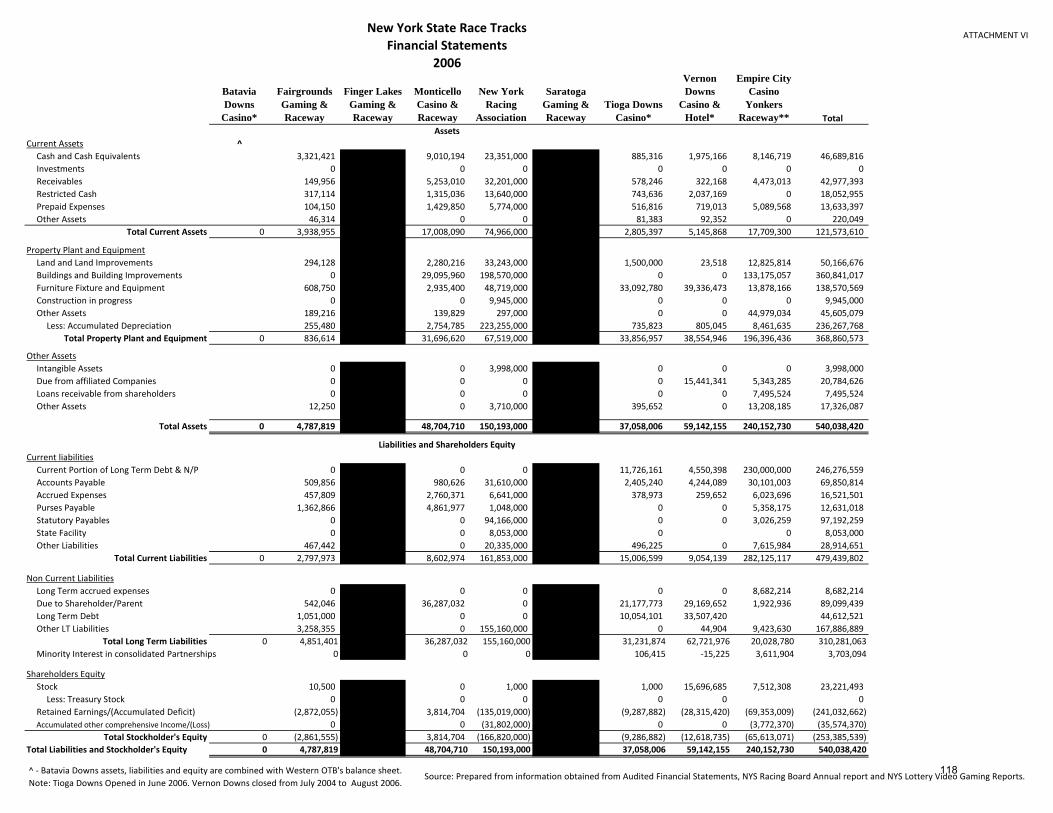
ATTACHMENT VI
Batavia
Downs
Casino*
Fairgrounds
Gaming &
Raceway
Finger Lakes
Gaming &
Raceway
Monticello
Casino &
Raceway
New York
Racing
Association
Saratoga
Gaming &
Raceway
Tioga Downs
Casino*
Vernon
Downs
Casino &
Hotel*
Empire City
Casino
Yonkers
Raceway** Total
New York State Race Tracks
Financial Statements
2006
Current Assets ^
Cash and Cash Equivalents 3,321,421 9,010,194 23,351,000 885,316 1,975,166 8,146,719 46,689,816
Investments 0 0 0 0 0 0 0
Receivables 149,956 5,253,010 32,201,000 578,246 322,168 4,473,013 42,977,393
Restricted Cash 317,114 1,315,036 13,640,000 743,636 2,037,169 0 18,052,955
Prepaid Expenses 104,150 1,429,850 5,774,000 516,816 719,013 5,089,568 13,633,397
Other Assets 46,314 0 0 81,383 92,352 0 220,049
Total Current Assets 0 3,938,955 0 17,008,090 74,966,000 0 2,805,397 5,145,868 17,709,300 121,573,610
Property Plant and Equipment
Land and Land Improvements 294,128 2,280,216 33,243,000 1,500,000 23,518 12,825,814 50,166,676
Buildings and Building Improvements 0 29,095,960 198,570,000 0 0 133,175,057 360,841,017
Furniture Fixture and Equipment 608,750 2,935,400 48,719,000 33,092,780 39,336,473 13,878,166 138,570,569
Construction in progress 0 0 9,945,000 0 0 0 9,945,000
Other Assets 189,216 139,829 297,000 0 0 44,979,034 45,605,079
Less: Accumulated Depreciation 255,480 2,754,785 223,255,000 735,823 805,045 8,461,635 236,267,768
Total Property Plant and Equipment 0 836,614 0 31,696,620 67,519,000 0 33,856,957 38,554,946 196,396,436 368,860,573
Other Assets
Intangible Assets 0 0 0 3,998,000 0 0 0 0 3,998,000
Due from affiliated Companies 0 0 0 0 0 15,441,341 5,343,285 20,784,626
Loans receivable from shareholders 0 0 0 0 0 0 0 7,495,524 7,495,524
Other Assets 12,250 0 3,710,000 395,652 0 13,208,185 17,326,087
Total Assets 0 4,787,819 0 48,704,710 150,193,000 0 37,058,006 59,142,155 240,152,730 540,038,420
Current liabilities
Current Portion of Long Term Debt & N/P 0 0 0 0 11,726,161 4,550,398 230,000,000 246,276,559
Accounts Payable 509,856 980,626 31,610,000 2,405,240 4,244,089 30,101,003 69,850,814
Accrued Expenses 457,809 2,760,371 6,641,000 378,973 259,652 6,023,696 16,521,501
Purses Payable 1,362,866 0 4,861,977 1,048,000 0 0 5,358,175 12,631,018
Statutory Payables 0 0 0 94,166,000 0 0 0 3,026,259 97,192,259
State Facility 0 0 0 8,053,000 0 0 0 8,053,000
Other Liabilities 467,442 0 0 20,335,000 496,225 0 7,615,984 28,914,651
Total Current Liabilities 0 2,797,973 0 8,602,974 161,853,000 0 15,006,599 9,054,139 282,125,117 479,439,802
Non Current Liabilities
Long Term accrued expenses 0 0 0 0 0 0 0 8,682,214 8,682,214
Due to Shareholder/Parent 542,046 0 36,287,032 0 0 21,177,773 29,169,652 1,922,936 89,099,439
Long Term Debt 1,051,000 0 0 0 10,054,101 33,507,420 44,612,521
Other LT Liabilities 3,258,355 0 0 155,160,000 0 0 44,904 9,423,630 167,886,889
Total Long Term Liabilities 0 4,851,401 0 36,287,032 155,160,000 0 31,231,874 62,721,976 20,028,780 310,281,063
Minority Interest in consolidated Partnerships 0 0 0 0 0 106,415 -15,225 3,611,904 3,703,094
Shareholders Equity
Stock 10,500 0 1,000 1,000 15,696,685 7,512,308 23,221,493
Less: Treasury Stock 0 0 0 0 0 0
Retained Earnings/(Accumulated Deficit) (2,872,055) 3,814,704 (135,019,000) (9,287,882) (28,315,420) (69,353,009) (241,032,662)
Accumulated other comprehensive Income/(Loss) 0 0 0 (31,802,000) 0 0 (3,772,370) (35,574,370)
Total Stockholder's Equity 0 (2,861,555) 0 3,814,704 (166,820,000) 0 (9,286,882) (12,618,735) (65,613,071) (253,385,539)
Total Liabilities and Stockholder's Equity 0 4,787,819 0 48,704,710 150,193,000 0 37,058,006 59,142,155 240,152,730 540,038,420
^ - Batavia Downs assets, liabilities and equity are combined with Western OTB's balance sheet.
Note: Tioga Downs Opened in June 2006. Vernon Downs closed from July 2004 to August 2006.
Liabilities and Shareholders Equity
Assets
Source: Prepared from information obtained from Audited Financial Statements, NYS Racing Board Annual report and NYS Lottery Video Gaming Reports. 118

ATTACHMENT VI
Batavia
Downs
Casino*
Fairgrounds
Gaming &
Raceway
Finger Lakes
Gaming &
Raceway
Monticello
Casino &
Raceway
New York
Racing
Association
Saratoga
Gaming &
Raceway
Tioga
Downs
Casino
Vernon
Downs
Casino &
Hotel
Empire City
Casino
Yonkers
Raceway Total
Revenues
Pari-Mutuel Commissions - Live & Simulcasts 1,595,243 2,627,243 2,630,817 151,367,000 1,608,686 2,980,626 15,863,055 178,672,670
NYS OTB Commissions 973,259 1,217,421 5,649,604 92,746,000 305,128 1,098,328 13,598,746 115,588,486
Other revenues 1,227,054 6,989,219 3,165,911 33,878,000 2,568,051 3,213,830 9,152,555 60,194,620
Net VGM Track Commission 9,039,604 14,352,861 20,119,357 0 13,259,277 10,257,549 110,931,948 177,960,596
Less VGM Expenses 0 14,098,369 852,361 0 5,074,277 3,990,176 40,462,452 64,477,635
Net Gaming Revenues 9,039,604 254,492 0 19,266,996 0 0 8,185,000 6,267,373 70,469,496 113,482,961
Total Revenues 12,835,160 11,088,375 0 30,713,328 277,991,000 0 12,666,865 13,560,157 109,083,852 467,938,737
Expenses
Amounts paid to NYS - Taxes from Racing 193,848 195,786 209,254 9,990,000 125,017 265,336 1,473,289 12,452,530
Amounts paid to Breeders from Racing 59,484 639,358 109,432 3,015,000 62,788 131,555 525,827 4,543,444
Amounts paid for Purses-net 3,735,631 5,095,614 3,544,369 116,234,000 2,562,049 3,901,111 32,674,150 167,746,924
Pari-Mutuel & Operating Expenses 6,179,279 3,553,310 16,875,360 0 2,941,858 2,785,460 16,514,465 48,849,732
General and Admin Expenses 0 5,288,463 155,061,000 6,451,069 8,929,253 29,733,579 205,463,364
Depreciation 1,050,752 159,267 1,175,718 7,074,000 1,527,685 2,441,479 9,486,390 22,915,291
Other Expenses 150,148 1,950,000 7,091,000 310,995 808,836 594,000 10,904,979
Total Expenses 11,369,142 9,643,335 0 29,152,596 298,465,000 0 13,981,461 19,263,030 91,001,700 472,876,264
Income (Loss) before Taxes 1,466,018 1,445,040 0 1,560,732 (20,474,000) 0 (1,314,596) (5,702,873) 18,082,152 (4,937,527)
Other expense/(Income) (3,992) 0 0 0 (10,984) 7,710,418 7,632,726 15,328,168
Interest Expense 474,755 37,620 0 2,491,288 4,475,000 1,973,278 3,367,337 29,049,185 41,868,463
Total Net Income (Loss) Before Taxes 995,255 1,407,420 0 (930,556) (24,949,000) 0 (3,276,890) (16,780,628) (18,599,759) (62,134,158)
Provision for Income Taxes, Expense (Benefit) 0 31,613 0 9,329,000 0 0 (566,018) 15,336 8,809,931
Net Income (Loss) 995,255 1,375,807 0 (930,556) (34,278,000) 0 (3,276,890) (16,214,610) (18,615,095) (70,944,089)
Number of Live Race Days 57 82 158 219 244 169 58 80 307 1,374
Items blocked out are subject to Freedom of Information issues raised by the track that are currently being addressed.
* VGM operating expenses are not seperately reported. Therefore are included in either Pari-mutuel, general operating or other expense.
New York State Race Tracks
Financial Statements
2007
Source: Prepared from information obtained from Audited Financial Statements, NYS Racing Board Annual report and NYS Lottery Video Gaming Reports. 119

ATTACHMENT VI
Batavia
Downs
Casino*
Fairgrounds
Gaming &
Raceway
Finger Lakes
Gaming &
Raceway
Monticello
Casino &
Raceway
New York
Racing
Association
Saratoga
Gaming &
Raceway
Tioga
Downs
Casino
Vernon
Downs
Casino &
Hotel
Empire City
Casino
Yonkers
Raceway Total
New York State Race Tracks
Financial Statements
2007
Current Assets ^
Cash and Cash Equivalents 3,868,946 3,807,279 24,318,000 1,582,729 1,842,196 8,371,364 43,790,514
Investments 0 0 0 0 0
Receivables 392,037 1,401,255 26,884,000 217,384 423,814 5,959,597 35,278,087
Restricted Cash 762,289 811,709 14,350,000 375,093 551,675 0 16,850,766
Prepaid Expenses 95,020 2,819,049 5,176,000 414,498 211,615 824,269 9,540,451
Other Current Assets 52,777 0 0 127,071 124,087 0 303,935
Total Current Assets 0 5,171,069 0 8,839,292 70,728,000 0 2,716,775 3,153,387 15,155,230 105,763,753
Property Plant and Equipment
Land and Land Improvements 294,128 2,309,055 33,243,000 256,000 5,831,879 12,825,814 54,759,876
Buildings and Building Improvements 0 29,204,183 200,658,000 153,204,005 383,066,188
Furniture Fixture and Equipment 634,543 3,137,142 50,819,000 34,550,509 34,648,393 15,507,612 139,297,199
Construction in progress 0 0 9,902,000 0 0 9,902,000
Other Assets 346,754 136,749 241,000 0 52,309,790 53,034,293
Less: Accumulated Depreciation 414,747 3,928,707 230,051,000 1,988,950 2,496,539 17,791,887 256,671,830
Total Property Plant and Equipment 0 860,678 0 30,858,422 64,812,000 0 32,817,559 37,983,733 216,055,334 383,387,726
Other Assets
Intangible Assets 0 0 0 0 0 13,400,000 0 13,400,000
Due from affiliated Companies 0 0 0 0 7,531,855 7,531,855
Loans receivable from shareholders 0 0 0 0 0 8,437,620 8,437,620
Other Assets 0 0 3,647,000 247,500 13,762,320 17,656,820
Total Assets 0 6,031,747 0 39,697,714 139,187,000 0 35,534,334 54,784,620 260,942,359 536,177,774
Current liabilities
Current Portion of Long Term Debt & N/P 0 0 0 0 1,689,133 21,266,316 282,150,000 305,105,449
Accounts Payable 823,239 686,395 41,480,000 2,236,741 2,617,662 14,745,944 62,589,981
Accrued Expenses 511,617 2,625,393 3,606,000 98,850 91,528 7,299,378 14,232,766
Purses Payable 1,340,197 0 1,112,961 20,499,000 1,128,146 24,080,304
Statutory Payables 0 0 0 78,800,800 0 5,538,922 84,339,722
State Facility 0 0 0 31,274,000 0 0 31,274,000
Other Liabilities 585,811 0 0 30,624,200 3,817,278 35,027,289
Total Current Liabilities 0 3,260,864 0 4,424,749 206,284,000 0 4,024,724 23,975,506 314,679,668 556,649,511
Non Current Liabilities
Long Term accrued expenses 0 0 15,879,000 0 10,081,289 246,878 10,843,630 37,050,797
Due to Shareholder/Parent 395,556 0 32,388,817 0 0 33,884,837 44,148,285 989,807 111,807,302
Long Term Debt 1,051,000 0 0 0 0 1,051,000
Other LT Liabilities 2,810,075 0 0 124,792,000 0 9,849,000 8,471,285 145,922,360
Total Long Term Liabilities 0 4,256,631 0 32,388,817 140,671,000 0 43,966,126 54,244,163 20,304,722 295,831,459$
Minority Interest in consolidated Partnerships 0 0 0 0 0 0 0 4,205,904 4,205,904
Shareholders Equity
Stock 10,500 0 1,000 15,613,841 7,512,308 23,137,649
Less: Treasury Stock 0 0 0 0 0 0
Retained Earnings/(Accumulated Deficit) (1,496,248) 2,884,148 (169,297,000) (12,456,516) (39,048,890) (83,500,246) (302,914,752)
Accumulated other comprehensive Income/(Loss) 0 0 0 (38,472,000) (2,259,997) (40,731,997)
Total Stockholder's Equity 0 (1,485,748) 0 2,884,148 (207,768,000) 0 (12,456,516) (23,435,049) (78,247,935) (320,509,100)
Total Liabilities and Stockholder's Equity 0 6,031,747 0 39,697,714 139,187,000 0 35,534,334 54,784,620 260,942,359 536,177,774
^ - Batavia Downs assets, liabilities and equity are combined with Western OTB's balance sheet.
Items blocked out are subject to Freedom of Information issues raised by the track that are currently being addressed.
Liabilities and Shareholders Equity
Assets
Source: Prepared from information obtained from Audited Financial Statements, NYS Racing Board Annual report and NYS Lottery Video Gaming Reports. 120

ATTACHMENT VI
Batavia
Downs
Casino*
Fairgrounds
Gaming &
Raceway
Finger Lakes
Gaming &
Raceway*
Monticello
Casino &
Raceway
New York Racing
Association~
Saratoga
Gaming &
Raceway
Tioga Downs
Casino
Vernon
Downs
Casino &
Hotel
Empire City
Casino
Yonkers
Raceway~* Total
Revenues
Pari-Mutuel Commissions - Live & Simulcasts 1,402,787 2,411,995 1,743,595 1,512,275 3,197,044 10,648,674 20,916,370
NYS OTB Commissions 1,101,627 1,156,361 4,714,000 290,845 1,022,845 12,277,808 20,563,486
Other revenues 1,525,552 8,563,161 2,653,284 3,131,620 3,808,876 8,029,847 27,712,340
Net VGM Track Commission 11,398,396 19,801,161 22,712,703 0 18,009,754 14,801,859 155,991,926 242,715,799
Less VGM Expenses 0 19,060,363 125,356 0 6,754,912 5,304,235 574,882 31,819,748
Net Gaming Revenues 11,398,396 740,798 0 22,587,347 0 0 11,254,842 9,497,624 155,417,044 210,896,051
Total Revenues 15,428,362 12,872,315 0 31,698,226 0 0 16,189,582 17,526,389 186,373,373 280,088,247
Expenses
Amounts paid to NYS - Taxes from Racing 177,937 178,242 183,793 128,558 267,809 1,241,664 2,178,003
Amounts paid to Breeders from Racing 54,488 709,509 90,257 61,282 131,000 493,952 1,540,488
Amounts paid for Purses-net 4,195,485 5,452,532 2,665,095 3,246,641 5,041,654 43,040,042 63,641,449
Pari-Mutuel & Operating Expenses 7,484,366 3,490,724 16,923,157 2,916,345 2,786,875 45,349,653 78,951,120
General and Admin Expenses 0 0 5,355,352 6,128,909 8,261,953 38,411,793 58,158,007
Depreciation 1,064,442 125,315 1,227,425 1,694,200 2,631,683 18,397,072 25,140,137
Other Expenses 145,942 0 3,200,000 79,309 901,471 1,838,439 6,165,161
Total Expenses 13,122,660 9,956,322 0 29,645,079 0 0 14,255,244 20,022,445 148,772,615 235,774,365
Income (Loss) before Taxes 2,305,702 2,915,993 0 2,053,147 0 0 1,934,338 (2,496,056) 37,600,758 44,313,882
Other expense/(Income) 64,494 0 0 (1,008,856) (540,079) 597,250 (887,191)
Interest Expense 448,315 168,972 2,606,004 1,284,912 2,463,518 36,641,919 43,613,640
Total Net Income (Loss) Before Taxes 1,792,893 2,747,021 0 (552,857) 0 0 1,658,282 (4,419,495) 361,589 1,587,433
Provision for Income Taxes, Expense (Benefit) 0 436,135 0 0 0 0 (47,075) 65,075 0 454,135
Net Income (Loss) 1,792,893 2,310,886 0 (552,857) 0 0 1,705,357 (4,484,570) 361,589 1,133,298
Number of Live Race Days 60 83 157 223 249 169 59 90 253 1,343
Items blocked out are subject to Freedom of Information issues raised by the track that are currently being addressed except for NYRA's, because audited statements are not available.
* VGM operating expenses are not seperately reported. Therefore are included in either Pari-mutuel, general operating or other expense.
New York State Race Tracks
Financial Statements
2008
Source: Prepared from information obtained from Audited Financial Statements, NYS Racing Board Annual report and NYS Lottery Video Gaming Reports. 121

ATTACHMENT VI
Batavia
Downs
Casino*
Fairgrounds
Gaming &
Raceway
Finger Lakes
Gaming &
Raceway*
Monticello
Casino &
Raceway
New York Racing
Association~
Saratoga
Gaming &
Raceway
Tioga Downs
Casino
Vernon
Downs
Casino &
Hotel
Empire City
Casino
Yonkers
Raceway~* Total
New York State Race Tracks
Financial Statements
2008
Current Assets ^
Cash and Cash Equivalents 5,826,437 5,760,111 1,738,208 1,522,872 15,331,547 30,179,175
Investments 0 0 0 0 0 0
Receivables 433,552 1,284,278 287,173 403,061 4,532,719 6,940,783
Restricted Cash 2,394,383 502,076 2,036,148 1,780,649 0 6,713,256
Prepaid Expenses 114,465 2,946,229 416,455 243,771 3,495,558 7,216,478
Other Current Assets 71,905 0 0 122,469 146,240 0 340,614
Total Current Assets 0 8,840,742 0 10,492,694 0 0 4,600,453 4,096,593 23,359,824 51,390,306
Property Plant and Equipment
Land and Land Improvements 294,128 2,309,055 0 285,336 6,116,664 12,825,730 21,830,913
Buildings and Building Improvements 232,323 29,249,420 0 0 0 186,126,485 215,608,228
Furniture Fixture and Equipment 556,665 3,349,836 35,047,391 34,933,248 32,585,350 106,472,490
Construction in progress 0 0 0 497,382 1,310,692 231,481 2,039,555
Other Assets 695,213 155,625 0 0 0 0 850,838
Less: Accumulated Depreciation 441,052 5,156,132 3,864,529 5,763,382 26,125,848 41,350,943
Total Property Plant and Equipment 0 1,337,277 0 29,907,804 0 0 31,965,580 36,597,222 205,643,198 305,451,081
Other Assets
Intangible Assets 0 0 0 0 0 0 13,400,000 0 13,400,000
Due from affiliated Companies 0 0 0 0 0 0 7,147,193 7,147,193
Loans receivable from shareholders 0 0 0 0 0 0 0 9,184,919 9,184,919
Other Assets 9,000 1,068,203 0 0 0 18,123,339 19,200,542
Total Assets 0 10,187,019 0 41,468,701 0 0 36,566,033 54,093,815 263,458,473 405,774,041
Current liabilities
Current Portion of Long Term Debt & N/P 1,063 0 0 0 11,274,613 1,460,576 288,108,900 300,845,152
Accounts Payable 971,454 602,684 4,107,914 3,652,651 7,035,973 16,370,676
Accrued Expenses 666,213 2,331,730 0 0 8,689,317 11,687,260
Purses Payable 1,833,355 0 1,138,519 0 0 3,536,666 6,508,540
Statutory Payables 0 0 0 0 0 0 1,418,203 1,418,203
State Facility 0 0 0 0 0 0 0 0 0
Other Liabilities 1,264,417 0 0 0 0 10,014,689 11,279,106
Total Current Liabilities 0 4,736,502 0 4,072,933 0 0 15,382,527 5,113,227 318,803,748 348,108,937
Non Current Liabilities
Long Term accrued expenses 1,520,193 0 0 0 73,046 165,992 0 1,759,231
Due to Shareholder/Parent 739,421 0 35,064,477 0 0 31,908,694 47,020,140 1,023,562 115,756,294
Long Term Debt 529,469 0 0 0 0 19,800,000 0 20,329,469
Other LT Liabilities 1,836,296 0 (47,075) 9,914,075 16,717,603 28,420,899
Total Long Term Liabilities 0 4,625,379 0 35,064,477 0 0 31,934,665 76,900,207 17,741,165 166,265,893
Minority Interest in consolidated Partnerships 0 0 0 0 0 0 0 0 4,799,904 4,799,904
Shareholders Equity
Stock 10,500 0 0 0 15,613,841 7,512,308 23,136,649
Less: Treasury Stock 0 0 0 0 0 0 0 0
Retained Earnings/(Accumulated Deficit) 814,638 2,331,291 (10,751,159) (43,533,460) (83,138,655) (134,277,345)
Accumulated other comprehensive Income/(Loss) 0 0 0 0 0 (2,259,997) (2,259,997)
Total Stockholder's Equity 0 825,138 0 2,331,291 0 0 (10,751,159) (27,919,619) (77,886,344) (113,400,693)
Total Liabilities and Stockholder's Equity 0 10,187,019 0 41,468,701 0 0 36,566,033 54,093,815 263,458,473 405,774,041
^ - Batavia Downs assets, liabilities and equity are combined with Western OTB's balance sheet.
~ - Financial statetments for this year are unaudited.
Liabilities and Shareholders Equity
Assets
Source: Prepared from information obtained from Audited Financial Statements, NYS Racing Board Annual report and NYS Lottery Video Gaming Reports. 122

ATTACHMENT VI
Batavia Downs Casino Income Statement
[Linked to 2004 - 2008]
2004 2005 2006 2007 2008
Revenues
Pari-Mutuel Commissions - Live & Simulcast 971,849 1,879,674 1,617,607 1,595,243 1,402,787
NYS OTB Commissions 183,961 1,033,155 1,059,192 973,259 1,101,627
Other revenues 73,262 385,940 982,786 1,227,054 1,525,552
Net VGM Track Commission 0 4,697,530 7,682,921 9,039,604 11,398,396
Less VGM Expenses 0 3,003,956 0 0 0
Net Gaming Revenues 0 1,693,574 7,682,921 9,039,604 11,398,396
Total Revenues 1,229,072 4,992,343 11,342,506 12,835,160 15,428,362
Expenses
Amounts paid to NYS - Taxes from Racing 91,448 180,460 189,467 193,848 177,937
Amounts paid to Breeders from Racing 35,365 73,164 65,405 59,484 54,488
Amounts paid for Purses - net 285,798 2,080,200 3,397,899 3,735,631 4,195,485
Pari-Mutuel & Operating Expenses 0 3,221,724 5,911,054 6,179,279 7,484,366
General and Admin Expenses 1,952,817 0 0 0 0
Depreciation 368,751 937,157 1,007,316 1,050,752 1,064,442
Other Expenses 136,080 164,848 161,117 150,148 145,942
Total Expenses 2,870,259 6,657,553 10,732,258 11,369,142 13,122,660
Income / (Loss) before Taxes (1,641,187) (1,665,210) 610,248 1,466,018 2,305,702
Other expense/(Income) (90,084) (95,829) (17,463) (3,992) 64,494
Interest (Earned)/Expense 126,260 0 499,200 474,755 448,315
Total Net Income / (Loss) Before Taxes (1,677,363) (1,569,381) 128,511 995,255 1,792,893
Provision for Income Taxes, Expense (Benefit) 0 0 0 0 0
Net Income / (Loss) (1,677,363) (1,569,381) 128,511 995,255 1,792,893
Number of Live Race Days 2 58 57 57 60
* VGM operating expenses are not separately reported. Therefore are included in either Pari-mutuel, general operating or other expense.
^ - Batavia Downs assets, liabilities and equity are combined with Western OTB's balance sheet.
Source: Prepared from information obtained from Audited Financial Statements, NYS Racing Board Annual report and NYS Lottery Video Gaming Reports.123

ATTACHMENT VI
2004 2005 2006 2007 2008
Batavia Downs Casino
Assets
Current Assets
Cash and Cash Equivalents 0 0 0 0 0
Investments 0 0 0 0 0
Receivables 0 0 0 0 0
Restricted Cash 0 0 0 0 0
Prepaid Expenses 0 0 0 0 0
Other Assets 0 0 0 0 0
Total Current Assets 0 0 0 0 0
Property Plant and Equipment
Land and Land Improvements 0 0 0 0 0
Buildings and Building Improvements 0 0 0 0 0
Furniture Fixture and Equipment 0 0 0 0 0
Construction in progress 0 0 0 0 0
Other Assets 0 0 0 0 0
Less Accumulated Depreciation 0 0 0 0 0
Total Property Plant and Equipment 0 0 0 0 0
Intangible Assets 0 0 0 0 0
Due from affiliated Companies 0 0 0 0 0
Loans receivable from shareholders 0 0 0 0 0
Other Assets 0 0 0 0 0
Total Assets 0 0 0 0 0
Liabilities and Shareholders Equity 0 0 0 0 0
Current liabilities
Current Portion of Long Term Debt/Notes Payable 0 0 0 0 0
Accounts Payable 0 0 0 0 0
Accrued Expenses 0 0 0 0 0
Purses Payable 0 0 0 0 0
Statutory Payables 0 0 0 0 0
State Facility 0 0 0 0 0
Other Liabilities 0 0 0 0 0
Total Current Liabilities 0 0 0 0 0
Non Current Liabilities
Long Term accrued expenses 0 0 0 0 0
Due to Shareholder/Parent 0 0 0 0 0
Long Term Debt 0 0 0 0 0
Other LT Liabilities 0 0 0 0 0
Total Long Term Liabilities 0 0 0 0 0
Minority Interest in consolidated Partnerships 0 0 0 0 0
Shareholders Equity
Stock 0 0 0 0 0
Less: Treasury Stock 0 0 0 0 0
Retained Earnings/(Accumulated Deficit) 0 0 0 0 0
Accumulated other comprehensive Income/(Loss) 0 0 0 0 0
Total Stockholder's Equity 0 0 0 0 0
Total Liabilities and Stockholder's Equity 0 0 0 0 0
Balance Sheet
Source: Prepared from information obtained from Audited Financial Statements, NYS Racing Board Annual report and NYS Lottery Video Gaming Reports.124

ATTACHMENT VI
Fairgrounds Gaming & Raceway* Income Statement
[Linked to 2004 - 2008]
2004 2005 2006 2007 2008
Revenues
Pari-Mutuel Commissions - Live & Simulcast 2,800,241 2,846,915 2,602,345 2,627,243 2,411,995
NYS OTB Commissions 1,966,490 1,407,605 1,315,794 1,217,421 1,156,361
Other revenues 2,411,819 5,294,243 6,387,070 6,989,219 8,563,161
Net VGM Track Commission 7,973,743 11,732,774 13,394,801 14,352,861 19,801,161
Less VGM Expenses 0 0 13,166,843 14,098,369 19,060,363
Net Gaming Revenues 7,973,743 11,732,774 227,958 254,492 740,798
Total Revenues 15,152,293 21,281,537 10,533,167 11,088,375 12,872,315
Expenses
Amounts paid to NYS - Taxes from Racing 196,801 203,062 174,014 195,786 178,242
Amounts paid to Breeders from Racing 444,812 574,064 618,572 639,358 709,509
Amounts paid for Purses - net 3,551,968 4,432,429 4,874,232 5,095,614 5,452,532
Pari-Mutuel & Operating Expenses 4,408,426 4,949,426 3,439,794 3,553,310 3,490,724
General and Admin Expenses 6,492,131 9,267,432 0 0 0
Depreciation 23,963 61,650 130,425 159,267 125,315
Other Expenses 365,926 1,069,400 0 0 0
Total Expenses 15,484,027 20,557,463 9,237,037 9,643,335 9,956,322
Income / (Loss) before Taxes (331,734) 724,074 1,296,130 1,445,040 2,915,993
Other expense/(Income) 0 0 0 0 0
Interest (Earned)/Expense 57,055 52,644 41,302 37,620 168,972
Total Net Income / (Loss) Before Taxes (388,789) 671,430 1,254,828 1,407,420 2,747,021
Provision for Income Taxes, Expense (Benefit) 0 8,340 9,703 31,613 436,135
Net Income / (Loss) (388,789) 663,090 1,245,125 1,375,807 2,310,886
Number of Live Race Days 87 84 84 82 83
Source: Prepared from information obtained from Audited Financial Statements, NYS Racing Board Annual report and NYS Lottery Video Gaming Reports.125

ATTACHMENT VI
2004 2005 2006 2007 2008
Fairgrounds Gaming & Raceway*
Assets
Current Assets
Cash and Cash Equivalents 2,175,953 2,717,947 3,321,421 3,868,946 5,826,437
Investments 0 0 0 0 0
Receivables 486,167 263,501 149,956 392,037 433,552
Restricted Cash 490,028 2,242,910 317,114 762,289 2,394,383
Prepaid Expenses 129,512 108,050 104,150 95,020 114,465
Other Assets 62,829 58,195 46,314 52,777 71,905
Total Current Assets 3,344,489 5,390,603 3,938,955 5,171,069 8,840,742
Property Plant and Equipment
Land and Land Improvements 294,128 294,128 294,128 294,128 294,128
Buildings and Building Improvements 0 605,830 0 0 232,323
Furniture Fixture and Equipment 653,832 830,864 608,750 634,543 556,665
Construction in progress 0 0 0 0 0
Other Assets 616,131 0 189,216 346,754 695,213
Less Accumulated Depreciation 1,176,580 1,111,698 255,480 414,747 441,052
Total Property Plant and Equipment 387,511 619,124 836,614 860,678 1,337,277
Intangible Assets 0 0 0 0 0
Due from affiliated Companies 0 0 0 0 0
Loans receivable from shareholders 0 0 0 0 0
Other Assets 13,393 13,030 12,250 0 9,000
Total Assets 3,745,393 6,022,757 4,787,819 6,031,747 10,187,019
Liabilities and Shareholders Equity
Current liabilities
Current Portion of Long Term Debt/Notes Payable 0 0 0 0 1,063
Accounts Payable 776,572 591,468 509,856 823,239 971,454
Accrued Expenses 249,710 696,431 457,809 511,617 666,213
Purses Payable 888,660 1,593,084 1,362,866 1,340,197 1,833,355
Statutory Payables 0 0 0 0 0
State Facility 0 0 0 0 0
Other Liabilities 74,005 769,206 467,442 585,811 1,264,417
Total Current Liabilities 1,988,947 3,650,189 2,797,973 3,260,864 4,736,502
Non Current Liabilities
Long Term accrued expenses 0 0 0 0 1,520,193
Due to Shareholder/Parent 1,451,172 1,846,115 542,046 395,556 739,421
Long Term Debt 1,351,000 1,051,000 1,051,000 1,051,000 529,469
Other LT Liabilities 3,724,044 3,582,133 3,258,355 2,810,075 1,836,296
Total Long Term Liabilities 6,526,216 6,479,248 4,851,401 4,256,631 4,625,379
Minority Interest in consolidated Partnerships 0 0 0 0 0
Shareholders Equity
Stock 10,500 10,500 10,500 10,500 10,500
Less: Treasury Stock 0 0 0 0 0
Retained Earnings/(Accumulated Deficit) (4,780,270) (4,117,180) (2,872,055) (1,496,248) 814,638
Accumulated other comprehensive Income/(Loss) 0 0 0 0 0
Total Stockholder's Equity (4,769,770) (4,106,680) (2,861,555) (1,485,748) 825,138
Total Liabilities and Stockholder's Equity 3,745,393 6,022,757 4,787,819 6,031,747 10,187,019
Balance Sheet
Source: Prepared from information obtained from Audited Financial Statements, NYS Racing Board Annual report and NYS Lottery Video Gaming Reports.126

ATTACHMENT VI
Finger Lakes Gaming & Raceway Income Statement
[Linked to 2004 - 2008]
2004 2005 2006 2007 2008
Revenues
Pari-Mutuel Commissions - Live & Simulcast 0 0 0 0 0
NYS OTB Commissions 0 0 0 0 0
Other revenues 0 0 0 0 0
Net VGM Track Commission 0 0 0 0 0
Less VGM Expenses 0 0 0 0 0
Net Gaming Revenues 0 0 0 0 0
Total Revenues 0 0 0 0 0
Expenses
Amounts paid to NYS - Taxes from Racing 0 0 0 0 0
Amounts paid to Breeders from Racing 0 0 0 0 0
Amounts paid for Purses - net 0 0 0 0 0
Pari-Mutuel & Operating Expenses 0 0 0 0 0
General and Admin Expenses 0 0 0 0 0
Depreciation 0 0 0 0 0
Other Expenses 0 0 0 0 0
Total Expenses 0 0 0 0 0
Income / (Loss) before Taxes 0 0 0 0 0
Other expense/(Income) 0 0 0 0 0
Interest (Earned)/Expense 0 0 0 0 0
Total Net Income / (Loss) Before Taxes 0 0 0 0 0
Provision for Income Taxes, Expense (Benefit) 0 0 0 0 0
Net Income / (Loss) 0 0 0 0 0
Number of Live Race Days 157 160 156 158 157
* VGM operating expenses are not separately reported. Therefore are included in either Pari-mutuel, general operating or other expense.
Items blocked out are subject to Freedom of Information issues raised by the track that are currently being addressed.
Source: Prepared from information obtained from Audited Financial Statements, NYS Racing Board Annual report and NYS Lottery Video Gaming Reports.127
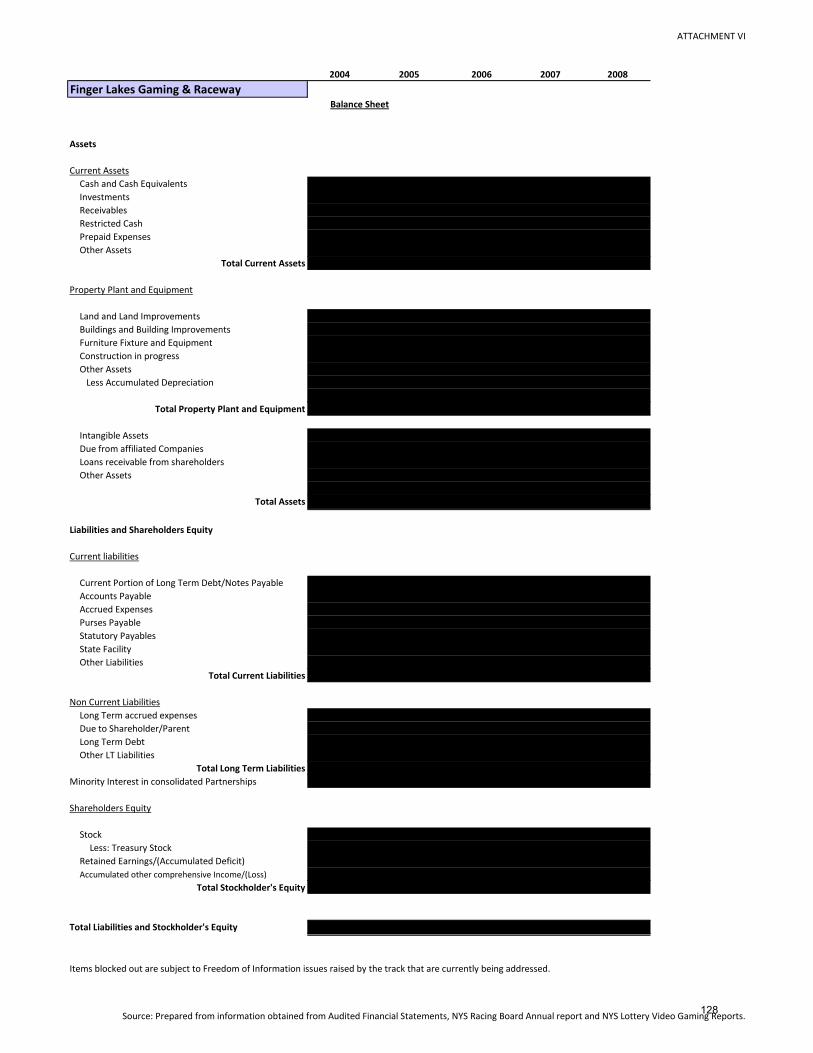
ATTACHMENT VI
2004 2005 2006 2007 2008
Finger Lakes Gaming & Raceway
Assets
Current Assets
Cash and Cash Equivalents 0 0 0 0 0
Investments 0 0 0 0 0
Receivables 0 0 0 0 0
Restricted Cash 0 0 0 0 0
Prepaid Expenses 0 0 0 0 0
Other Assets 0 0 0 0 0
Total Current Assets 0 0 0 0 0
Property Plant and Equipment
Land and Land Improvements 0 0 0 0 0
Buildings and Building Improvements 0 0 0 0 0
Furniture Fixture and Equipment 0 0 0 0 0
Construction in progress 0 0 0 0 0
Other Assets 0 0 0 0 0
Less Accumulated Depreciation 0 0 0 0 0
Total Property Plant and Equipment 0 0 0 0 0
Intangible Assets 0 0 0 0 0
Due from affiliated Companies 0 0 0 0 0
Loans receivable from shareholders 0 0 0 0 0
Other Assets 0 0 0 0 0
Total Assets 0 0 0 0 0
Liabilities and Shareholders Equity
Current liabilities
Current Portion of Long Term Debt/Notes Payable 0 0 0 0 0
Accounts Payable 0 0 0 0 0
Accrued Expenses 0 0 0 0 0
Purses Payable 0 0 0 0 0
Statutory Payables 0 0 0 0 0
State Facility 0 0 0 0 0
Other Liabilities 0 0 0 0 0
Total Current Liabilities 0 0 0 0 0
Non Current Liabilities
Long Term accrued expenses 0 0 0 0 0
Due to Shareholder/Parent 0 0 0 0 0
Long Term Debt 0 0 0 0 0
Other LT Liabilities 0 0 0 0 0
Total Long Term Liabilities 0 0 0 0 0
Minority Interest in consolidated Partnerships 0 0 0 0 0
Shareholders Equity
Stock 0 0 0 0 0
Less: Treasury Stock 0 0 0 0 0
Retained Earnings/(Accumulated Deficit) 0 0 0 0 0
Accumulated other comprehensive Income/(Loss) 0 0 0 0 0
Total Stockholder's Equity 0 0 0 0 0
Total Liabilities and Stockholder's Equity 0 0 0 0 0
Items blocked out are subject to Freedom of Information issues raised by the track that are currently being addressed.
Balance Sheet
Source: Prepared from information obtained from Audited Financial Statements, NYS Racing Board Annual report and NYS Lottery Video Gaming Reports.128

ATTACHEMENT VI
Monticello Casino & Raceway Income Statement
[Linked to 2004 - 2008]
2004 2005 2006 2007 2008
Revenues
Pari-Mutuel Commissions - Live & Simulcast 2,797,583 3,946,588 3,248,794 2,630,817 1,743,595
NYS OTB Commissions 7,859,127 11,705,030 14,748,380 5,649,604 4,714,000
Other revenues 1,946,006 3,036,823 3,581,448 3,165,911 2,653,284
Net VGM Track Commission 9,362,655 21,237,110 23,688,000 20,119,357 22,712,703
Less VGM Expenses 2,857,725 2,510,027 49,846 852,361 125,356
Net Gaming Revenues 6,504,930 18,727,083 23,638,154 19,266,996 22,587,347
Total Revenues 19,107,646 37,415,524 45,216,776 30,713,328 31,698,226
Expenses
Amounts paid to NYS - Taxes from Racing 218,595 233,885 236,613 209,254 183,793
Amounts paid to Breeders from Racing 122,743 139,277 145,011 109,432 90,257
Amounts paid for Purses - net 4,979,682 5,923,429 8,468,165 3,544,369 2,665,095
Pari-Mutuel & Operating Expenses 12,766,985 15,545,405 17,385,246 16,875,360 16,923,157
General and Admin Expenses 3,489,009 4,149,170 5,815,922 5,288,463 5,355,352
Depreciation 507,353 1,118,675 1,139,152 1,175,718 1,227,425
Other Expenses 55,500 812,497 1,950,000 1,950,000 3,200,000
Total Expenses 22,139,867 27,922,338 35,140,109 29,152,596 29,645,079
Income / (Loss) before Taxes (3,032,221) 9,493,186 10,076,667 1,560,732 2,053,147
Other expense/(Income) 243,964 0 0 0 0
Interest (Earned)/Expense 2,374,531 5,200,000 2,939,282 2,491,288 2,606,004
Total Net Income / (Loss) Before Taxes (5,650,716) 4,293,186 7,137,385 (930,556) (552,857)
Provision for Income Taxes, Expense (Benefit) 0 0 1,965,151 0 0
Net Income / (Loss) (5,650,716) 4,293,186 5,172,234 (930,556) (552,857)
Number of Live Race Days 230 235 246 219 223
Source: Prepared from information obtained from Audited Financial Statements, NYS Racing Board Annual report and NYS Lottery Video Gaming Reports.129

ATTACHEMENT VI
2004 2005 2006 2007 2008
Monticello Casino & Raceway
Assets
Current Assets
Cash and Cash Equivalents 5,247,529 6,341,550 9,010,194 3,807,279 5,760,111
Investments 0 0 0 0 0
Receivables 2,679,637 3,358,497 5,253,010 1,401,255 1,284,278
Restricted Cash 159,282 4,304,847 1,315,036 811,709 502,076
Prepaid Expenses 790,551 1,026,389 1,429,850 2,819,049 2,946,229
Other Assets 0 0 0 0 0
Total Current Assets 8,876,999 15,031,283 17,008,090 8,839,292 10,492,694
Property Plant and Equipment
Land and Land Improvements 2,251,196 2,265,216 2,280,216 2,309,055 2,309,055
Buildings and Building Improvements 28,530,758 29,037,146 29,095,960 29,204,183 29,249,420
Furniture Fixture and Equipment 2,742,908 2,724,335 2,935,400 3,137,142 3,349,836
Construction in progress 0 0 0 0 0
Other Assets 129,732 120,384 139,829 136,749 155,625
Less Accumulated Depreciation 507,353 1,621,828 2,754,785 3,928,707 5,156,132
Total Property Plant and Equipment 33,147,241 32,525,253 31,696,620 30,858,422 29,907,804
Intangible Assets 0 0 0 0 0
Due from affiliated Companies 0 0 0 0 0
Loans receivable from shareholders 0 0 0 0 0
Other Assets 0 0 0 0 1,068,203
Total Assets 42,024,240 47,556,536 48,704,710 39,697,714 41,468,701
Liabilities and Shareholders Equity
Current liabilities
Current Portion of Long Term Debt/Notes Payable 0 0 0 0 0
Accounts Payable 1,492,618 738,179 980,626 686,395 602,684
Accrued Expenses 1,216,754 2,666,951 2,760,371 2,625,393 2,331,730
Purses Payable 2,615,866 3,327,650 4,861,977 1,112,961 1,138,519
Statutory Payables 0 0 0 0 0
State Facility 0 0 0 0 0
Other Liabilities 1,447,499 0 0 0 0
Total Current Liabilities 6,772,737 6,732,780 8,602,974 4,424,749 4,072,933
Non Current Liabilities
Long Term accrued expenses 0 0 0 0 0
Due to Shareholder/Parent 40,902,219 42,181,286 36,287,032 32,388,817 35,064,477
Long Term Debt 0 0 0 0 0
Other LT Liabilities 0 0 0 0 0
Total Long Term Liabilities 40,902,219 42,181,286 36,287,032 32,388,817 35,064,477
Minority Interest in consolidated Partnerships 0 0 0 0 0
Shareholders Equity
Stock 0 0 0 0 0
Less: Treasury Stock 0 0 0 0 0
Retained Earnings/(Accumulated Deficit) (5,650,716) (1,357,530) 3,814,704 2,884,148 2,331,291
Accumulated other comprehensive Income/(Loss) 0 0 0 0 0
Total Stockholder's Equity (5,650,716) (1,357,530) 3,814,704 2,884,148 2,331,291
Total Liabilities and Stockholder's Equity 42,024,240 47,556,536 48,704,710 39,697,714 41,468,701
Balance Sheet
Source: Prepared from information obtained from Audited Financial Statements, NYS Racing Board Annual report and NYS Lottery Video Gaming Reports.130

ATTACHMENT VI
New York Racing Association Income Statement
[Linked to 2004 - 2008] UNAUDITED
2004 2005 2006 2007 2008
Revenues
Pari-Mutuel Commissions - Live & Simulcast 161,334,000 144,450,000 146,173,000 151,367,000 0
NYS OTB Commissions 95,217,000 96,719,000 95,860,000 92,746,000 0
Other revenues 30,979,000 39,726,000 33,462,000 33,878,000 0
Net VGM Track Commission 0 0 0 0 0
Less VGM Expenses 0 0 0 0 0
Net Gaming Revenues 0 0 0 0 0
Total Revenues 287,530,000 280,895,000 275,495,000 277,991,000 0
Expenses
Amounts paid to NYS - Taxes from Racing 10,549,000 9,974,000 9,850,000 9,990,000 0
Amounts paid to Breeders from Racing 3,175,000 2,970,000 2,883,000 3,015,000 0
Amounts paid for Purses - net 120,863,000 115,595,000 119,296,000 116,234,000 0
Pari-Mutuel & Operating Expenses 0 0 0 0 0
General and Admin Expenses 157,689,000 156,757,000 149,530,000 155,061,000 0
Depreciation 8,632,000 7,953,000 7,071,000 7,074,000 0
Other Expenses 0 134,000 0 7,091,000 0
Total Expenses 300,908,000 293,383,000 288,630,000 298,465,000 0
Income / (Loss) before Taxes (13,378,000) (12,488,000) (13,135,000) (20,474,000) 0
Other expense/(Income) 0 0 1,813,000 0 0
Interest (Earned)/Expense 2,610,000 2,546,000 2,882,000 4,475,000 0
Total Net Income / (Loss) Before Taxes (15,988,000) (15,034,000) (17,830,000) (24,949,000) 0
Provision for Income Taxes, Expense (Benefit) 0 0 0 9,329,000 0
Net Income / (Loss) (15,988,000) (15,034,000) (17,830,000) (34,278,000) 0
Number of Live Race Days 252 254 248 244 249
Audited financial statements for 2008 are not available.
Source: Prepared from information obtained from Audited Financial Statements, NYS Racing Board Annual report and NYS Lottery Video Gaming Reports131

ATTACHMENT VI
2004 2005 2006 2007 2008
New York Racing Association
Assets
Current Assets
Cash and Cash Equivalents 10,330,000 9,672,000 23,351,000 24,318,000 0
Investments 0 0 0 0 0
Receivables 16,244,000 12,035,000 32,201,000 26,884,000 0
Restricted Cash 12,650,000 14,539,000 13,640,000 14,350,000 0
Prepaid Expenses 1,647,000 2,217,000 5,774,000 5,176,000 0
Other Assets 0 0 0 0 0
Total Current Assets 40,871,000 38,463,000 74,966,000 70,728,000 0
Property Plant and Equipment
Land and Land Improvements 32,905,000 33,237,000 33,243,000 33,243,000 0
Buildings and Building Improvements 196,565,000 197,829,000 198,570,000 200,658,000 0
Furniture Fixture and Equipment 45,465,000 46,307,000 48,719,000 50,819,000 0
Construction in progress 8,518,000 9,155,000 9,945,000 9,902,000 0
Other Assets 419,000 357,000 297,000 241,000 0
Less Accumulated Depreciation 208,811,000 216,294,000 223,255,000 230,051,000 0
Total Property Plant and Equipment 75,061,000 70,591,000 67,519,000 64,812,000 0
Intangible Assets 10,927,000 4,901,000 3,998,000 0 0
Due from affiliated Companies 0 0 0 0 0
Loans receivable from shareholders 0 0 0 0 0
Other Assets 5,153,000 4,056,000 3,710,000 3,647,000 0
Total Assets 132,012,000 118,011,000 150,193,000 139,187,000 0
Liabilities and Shareholders Equity
Current liabilities
Current Portion of Long Term Debt/Notes Payable 0 0 0 0 0
Accounts Payable 17,953,000 31,442,000 31,610,000 41,480,000 0
Accrued Expenses 8,604,000 11,770,000 6,641,000 3,606,000 0
Purses Payable 15,848,000 14,369,000 1,048,000 20,499,000 0
Statutory Payables 1,476,000 1,284,000 94,166,000 78,800,800 0
State Facility 0 0 8,053,000 31,274,000 0
Other Liabilities 32,527,000 26,942,000 20,335,000 30,624,200 0
Total Current Liabilities 76,408,000 85,807,000 161,853,000 206,284,000 0
Non Current Liabilities
Long Term accrued expenses 72,515,000 90,558,000 0 15,879,000 0
Due to Shareholder/Parent 0 0 0 0 0
Long Term Debt 0 0 0 0 0
Other LT Liabilities 117,814,000 94,937,000 155,160,000 124,792,000 0
Total Long Term Liabilities 190,329,000 185,495,000 155,160,000 140,671,000 0
Minority Interest in consolidated Partnerships 0 0 0 0 0
Shareholders Equity
Stock 1,000 1,000 1,000 1,000 0
Less: Treasury Stock 0 0 0 0 0
Retained Earnings/(Accumulated Deficit) (102,155,000) (117,189,000) (135,019,000) (169,297,000) 0
Accumulated other comprehensive Income/(Loss) (32,571,000) (36,103,000) (31,802,000) (38,472,000) 0
Total Stockholder's Equity (134,725,000) (153,291,000) (166,820,000) (207,768,000) 0
Total Liabilities and Stockholder's Equity 132,012,000 118,011,000 150,193,000 139,187,000 0
Balance Sheet
Source: Prepared from information obtained from Audited Financial Statements, NYS Racing Board Annual report and NYS Lottery Video Gaming Reports132

ATTACHMENT VI
Saratoga Gaming & Raceway Income Statement
[Linked to 2004 - 2008]
2004 2005 2006 2007 2008
Revenues
Pari-Mutuel Commissions - Live & Simulcast 0 0 0 0 0
NYS OTB Commissions 0 0 0 0 0
Other revenues 0 0 0 0 0
Net VGM Track Commission 0 0 0 0 0
Less VGM Expenses 0 0 0 0 0
Net Gaming Revenues 0 0 0 0 0
Total Revenues 0 0 0 0 0
Expenses
Amounts paid to NYS - Taxes from Racing 0 0 0 0 0
Amounts paid to Breeders from Racing 0 0 0 0 0
Amounts paid for Purses - net 0 0 0 0 0
Pari-Mutuel & Operating Expenses 0 0 0 0 0
General and Admin Expenses 0 0 0 0 0
Depreciation 0 0 0 0 0
Other Expenses 0 0 0 0 0
Total Expenses 0 0 0 0 0
Income / (Loss) before Taxes 0 0 0 0 0
Other expense/(Income) 0 0 0 0 0
Interest (Earned)/Expense 0 0 0 0 0
Total Net Income / (Loss) Before Taxes 0 0 0 0 0
Provision for Income Taxes, Expense (Benefit) 0 0 0 0 0
Net Income / (Loss) 0 0 0 0 0
Number of Live Race Days 165 173 171 169 169
Source: Prepared from information obtained from Audited Financial Statements, NYS Racing Board Annual report and NYS Lottery Video Gaming Reports.133

ATTACHMENT VI
2004 2005 2006 2007 2008
Saratoga Gaming & Raceway
Assets
Current Assets
Cash and Cash Equivalents 0 0 0 0 0
Investments 0 0 0 0 0
Receivables 0 0 0 0 0
Restricted Cash 0 0 0 0 0
Prepaid Expenses 0 0 0 0 0
Other Assets 0 0 0 0 0
Total Current Assets 0 0 0 0 0
Property Plant and Equipment
Land and Land Improvements 0 0 0 0 0
Buildings and Building Improvements 0 0 0 0 0
Furniture Fixture and Equipment 0 0 0 0 0
Construction in progress 0 0 0 0 0
Other Assets 0 0 0 0 0
Less Accumulated Depreciation 0 0 0 0 0
Total Property Plant and Equipment 0 0 0 0 0
Intangible Assets 0 0 0 0 0
Due from affiliated Companies 0 0 0 0 0
Loans receivable from shareholders 0 0 0 0 0
Other Assets 0 0 0 0 0
Total Assets 0 0 0 0 0
Liabilities and Shareholders Equity
Current liabilities
Current Portion of Long Term Debt/Notes Payable 0 0 0 0 0
Accounts Payable 0 0 0 0 0
Accrued Expenses 0 0 0 0 0
Purses Payable 0 0 0 0 0
Statutory Payables 0 0 0 0 0
State Facility 0 0 0 0 0
Other Liabilities 0 0 0 0 0
Total Current Liabilities 0 0 0 0 0
Non Current Liabilities
Long Term accrued expenses 0 0 0 0 0
Due to Shareholder/Parent 0 0 0 0 0
Long Term Debt 0 0 0 0 0
Other LT Liabilities 0 0 0 0 0
Total Long Term Liabilities 0 0 0 0 0
Minority Interest in consolidated Partnerships 0 0 0 0 0
Shareholders Equity
Stock 0 0 0 0 0
Less: Treasury Stock 0 0 0 0 0
Retained Earnings/(Accumulated Deficit) 0 0 0 0 0
Accumulated other comprehensive Income/(Loss) 0 0 0 0 0
Total Stockholder's Equity 0 0 0 0 0
Total Liabilities and Stockholder's Equity 0 0 0 0 0
Balance Sheet
Source: Prepared from information obtained from Audited Financial Statements, NYS Racing Board Annual report and NYS Lottery Video Gaming Reports.134

ATTACHMENT VI
Tioga Downs Casino Income Statement
[Linked to 2004 - 2008]
2004 2005 2006 2007 2008
Revenues
Pari-Mutuel Commissions - Live & Simulcast 0 0 1,078,691 1,608,686 1,512,275
NYS OTB Commissions 0 0 578,597 305,128 290,845
Other revenues 0 0 1,776,461 2,568,051 3,131,620
Net VGM Track Commission 0 0 6,678,163 13,259,277 18,009,754
Less VGM Expenses 0 0 0 5,074,277 6,754,912
Net Gaming Revenues 0 0 6,678,163 8,185,000 11,254,842
Total Revenues 0 0 10,111,912 12,666,865 16,189,582
Expenses
Amounts paid to NYS - Taxes from Racing 0 0 45,088 125,017 128,558
Amounts paid to Breeders from Racing 0 0 305,311 62,788 61,282
Amounts paid for Purses - net 0 0 1,773,887 2,562,049 3,246,641
Pari-Mutuel & Operating Expenses 0 0 2,385,837 2,941,858 2,916,345
General and Admin Expenses 0 0 8,201,402 6,451,069 6,128,909
Depreciation 0 0 735,823 1,527,685 1,694,200
Other Expenses 0 0 1,993,462 310,995 79,309
Total Expenses 0 0 15,440,810 13,981,461 14,255,244
Income / (Loss) before Taxes 0 0 (5,328,898) (1,314,596) 1,934,338
Other expense/(Income) 0 0 (750,500) (10,984) (1,008,856)
Interest (Earned)/Expense 0 0 4,708,484 1,973,278 1,284,912
Total Net Income / (Loss) Before Taxes 0 0 (9,286,882) (3,276,890) 1,658,282
Provision for Income Taxes, Expense (Benefit) 0 0 0 0 (47,075)
Net Income / (Loss) 0 0 (9,286,882) (3,276,890) 1,705,357
Number of Live Race Days 0 0 51 58 59
Note: Tioga Downs Opened in June 2006.
Source: Prepared from information obtained from Audited Financial Statements, NYS Racing Board Annual reports and NYS Lottery Video Gaming Reports135
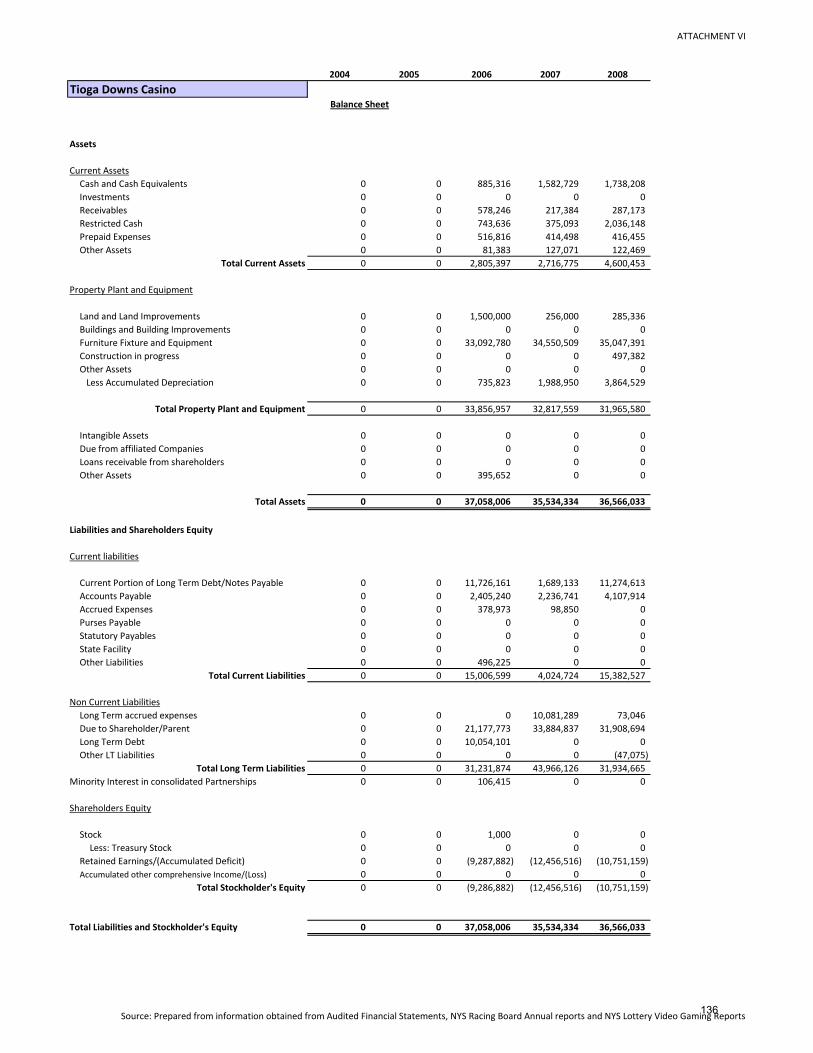
ATTACHMENT VI
2004 2005 2006 2007 2008
Tioga Downs Casino
Assets
Current Assets
Cash and Cash Equivalents 0 0 885,316 1,582,729 1,738,208
Investments 0 0 0 0 0
Receivables 0 0 578,246 217,384 287,173
Restricted Cash 0 0 743,636 375,093 2,036,148
Prepaid Expenses 0 0 516,816 414,498 416,455
Other Assets 0 0 81,383 127,071 122,469
Total Current Assets 0 0 2,805,397 2,716,775 4,600,453
Property Plant and Equipment
Land and Land Improvements 0 0 1,500,000 256,000 285,336
Buildings and Building Improvements 0 0 0 0 0
Furniture Fixture and Equipment 0 0 33,092,780 34,550,509 35,047,391
Construction in progress 0 0 0 0 497,382
Other Assets 0 0 0 0 0
Less Accumulated Depreciation 0 0 735,823 1,988,950 3,864,529
Total Property Plant and Equipment 0 0 33,856,957 32,817,559 31,965,580
Intangible Assets 0 0 0 0 0
Due from affiliated Companies 0 0 0 0 0
Loans receivable from shareholders 0 0 0 0 0
Other Assets 0 0 395,652 0 0
Total Assets 0 0 37,058,006 35,534,334 36,566,033
Liabilities and Shareholders Equity
Current liabilities
Current Portion of Long Term Debt/Notes Payable 0 0 11,726,161 1,689,133 11,274,613
Accounts Payable 0 0 2,405,240 2,236,741 4,107,914
Accrued Expenses 0 0 378,973 98,850 0
Purses Payable 0 0 0 0 0
Statutory Payables 0 0 0 0 0
State Facility 0 0 0 0 0
Other Liabilities 0 0 496,225 0 0
Total Current Liabilities 0 0 15,006,599 4,024,724 15,382,527
Non Current Liabilities
Long Term accrued expenses 0 0 0 10,081,289 73,046
Due to Shareholder/Parent 0 0 21,177,773 33,884,837 31,908,694
Long Term Debt 0 0 10,054,101 0 0
Other LT Liabilities 0 0 0 0 (47,075)
Total Long Term Liabilities 0 0 31,231,874 43,966,126 31,934,665
Minority Interest in consolidated Partnerships 0 0 106,415 0 0
Shareholders Equity
Stock 0 0 1,000 0 0
Less: Treasury Stock 0 0 0 0 0
Retained Earnings/(Accumulated Deficit) 0 0 (9,287,882) (12,456,516) (10,751,159)
Accumulated other comprehensive Income/(Loss) 0 0 0 0 0
Total Stockholder's Equity 0 0 (9,286,882) (12,456,516) (10,751,159)
Total Liabilities and Stockholder's Equity 0 0 37,058,006 35,534,334 36,566,033
Balance Sheet
Source: Prepared from information obtained from Audited Financial Statements, NYS Racing Board Annual reports and NYS Lottery Video Gaming Reports136

ATTACHEMENT VI
Vernon Downs Casino & Hotel Income Statement
[Linked to 2004 - 2008]
2004 2005 2006 2007 2008
Revenues
Pari-Mutuel Commissions - Live & Simulcast 3,600,359 0 498,411 2,980,626 3,197,044
NYS OTB Commissions 1,136,163 0 880,959 1,098,328 1,022,845
Other revenues 3,521,863 0 1,584,863 3,213,830 3,808,876
Net VGM Track Commission 0 0 2,301,906 10,257,549 14,801,859
Less VGM Expenses 0 0 0 3,990,176 5,304,235
Net Gaming Revenues 0 0 2,301,906 6,267,373 9,497,624
Total Revenues 8,258,385 0 5,266,139 13,560,157 17,526,389
Expenses
Amounts paid to NYS - Taxes from Racing 179,427 0 80,751 265,336 267,809
Amounts paid to Breeders from Racing 69,703 0 132,281 131,555 131,000
Amounts paid for Purses - net 1,750,206 0 593,460 3,901,111 5,041,654
Pari-Mutuel & Operating Expenses 10,180,217 0 1,484,414 2,785,460 2,786,875
General and Admin Expenses 0 0 4,120,454 8,929,253 8,261,953
Depreciation 385,331 0 805,045 2,441,479 2,631,683
Other Expenses 2,575,985 0 6,494,946 808,836 901,471
Total Expenses 15,140,869 0 13,711,351 19,263,030 20,022,445
Income / (Loss) before Taxes (6,882,484) 0 (8,445,212) (5,702,873) (2,496,056)
Other expense/(Income) (352,191) 0 70,505 7,710,418 (540,079)
Interest (Earned)/Expense 2,186,598 0 829,478 3,367,337 2,463,518
Total Net Income / (Loss) Before Taxes (8,716,891) 0 (9,345,195) (16,780,628) (4,419,495)
Provision for Income Taxes, Expense (Benefit) 0 0 (2,140,785) (566,018) 65,075
Net Income / (Loss) (8,716,891) 0 (7,204,410) (16,214,610) (4,484,570)
Number of Live Race Days 44 0 30 80 90
Note: Vernon Downs closed from July 2004 to August 2006.
Source: Prepared from information obtained from Audited Financial Statements, NYS Racing Board Annual Reports and NYS Lottery Video Gaming Reports.137
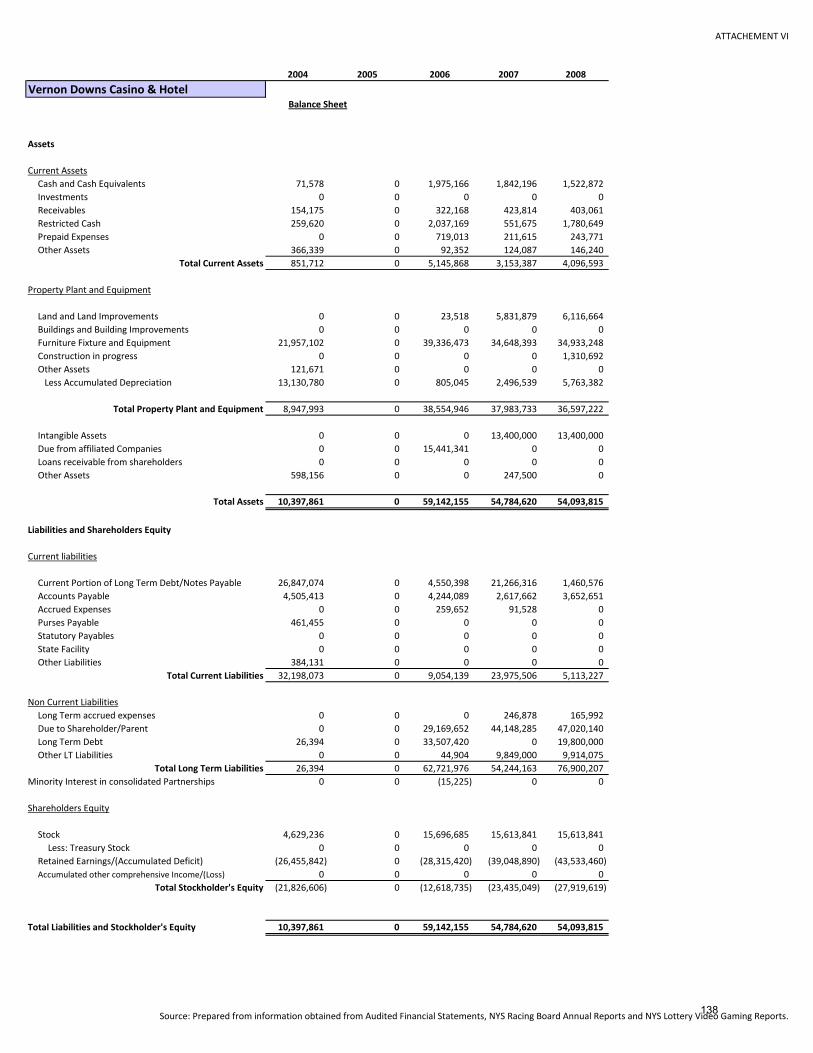
ATTACHEMENT VI
2004 2005 2006 2007 2008
Vernon Downs Casino & Hotel
Assets
Current Assets
Cash and Cash Equivalents 71,578 0 1,975,166 1,842,196 1,522,872
Investments 0 0 0 0 0
Receivables 154,175 0 322,168 423,814 403,061
Restricted Cash 259,620 0 2,037,169 551,675 1,780,649
Prepaid Expenses 0 0 719,013 211,615 243,771
Other Assets 366,339 0 92,352 124,087 146,240
Total Current Assets 851,712 0 5,145,868 3,153,387 4,096,593
Property Plant and Equipment
Land and Land Improvements 0 0 23,518 5,831,879 6,116,664
Buildings and Building Improvements 0 0 0 0 0
Furniture Fixture and Equipment 21,957,102 0 39,336,473 34,648,393 34,933,248
Construction in progress 0 0 0 0 1,310,692
Other Assets 121,671 0 0 0 0
Less Accumulated Depreciation 13,130,780 0 805,045 2,496,539 5,763,382
Total Property Plant and Equipment 8,947,993 0 38,554,946 37,983,733 36,597,222
Intangible Assets 0 0 0 13,400,000 13,400,000
Due from affiliated Companies 0 0 15,441,341 0 0
Loans receivable from shareholders 0 0 0 0 0
Other Assets 598,156 0 0 247,500 0
Total Assets 10,397,861 0 59,142,155 54,784,620 54,093,815
Liabilities and Shareholders Equity
Current liabilities
Current Portion of Long Term Debt/Notes Payable 26,847,074 0 4,550,398 21,266,316 1,460,576
Accounts Payable 4,505,413 0 4,244,089 2,617,662 3,652,651
Accrued Expenses 0 0 259,652 91,528 0
Purses Payable 461,455 0 0 0 0
Statutory Payables 0 0 0 0 0
State Facility 0 0 0 0 0
Other Liabilities 384,131 0 0 0 0
Total Current Liabilities 32,198,073 0 9,054,139 23,975,506 5,113,227
Non Current Liabilities
Long Term accrued expenses 0 0 0 246,878 165,992
Due to Shareholder/Parent 0 0 29,169,652 44,148,285 47,020,140
Long Term Debt 26,394 0 33,507,420 0 19,800,000
Other LT Liabilities 0 0 44,904 9,849,000 9,914,075
Total Long Term Liabilities 26,394 0 62,721,976 54,244,163 76,900,207
Minority Interest in consolidated Partnerships 0 0 (15,225) 0 0
Shareholders Equity
Stock 4,629,236 0 15,696,685 15,613,841 15,613,841
Less: Treasury Stock 0 0 0 0 0
Retained Earnings/(Accumulated Deficit) (26,455,842) 0 (28,315,420) (39,048,890) (43,533,460)
Accumulated other comprehensive Income/(Loss) 0 0 0 0 0
Total Stockholder's Equity (21,826,606) 0 (12,618,735) (23,435,049) (27,919,619)
Total Liabilities and Stockholder's Equity 10,397,861 0 59,142,155 54,784,620 54,093,815
Balance Sheet
Source: Prepared from information obtained from Audited Financial Statements, NYS Racing Board Annual Reports and NYS Lottery Video Gaming Reports.138

ATTACHMENT VI
Empire City Casino Yonkers Raceway Income Statement
[Linked to 2004 - 2008] UNAUDITED
2004 2005 2006 2007 2008
Revenues
Pari-Mutuel Commissions - Live & Simulcast 21,608,548 6,896,170 2,337,006 15,863,055 10,648,674
NYS OTB Commissions 12,166,078 8,241,139 1,673,000 13,598,746 12,277,808
Other revenues 471,368 188,909 917,339 9,152,555 8,029,847
Net VGM Track Commission 0 0 15,978,604 110,931,948 155,991,926
Less VGM Expenses 0 0 8,093,865 40,462,452 574,882
Net Gaming Revenues 0 0 7,884,739 70,469,496 155,417,044
Total Revenues 34,245,994 15,326,218 12,812,084 109,083,852 186,373,373
Expenses
Amounts paid to NYS - Taxes from Racing 2,096,624 952,185 148,272 1,473,289 1,241,664
Amounts paid to Breeders from Racing 680,653 296,082 53,521 525,827 493,952
Amounts paid for Purses - net 15,381,819 4,975,800 5,578,178 32,674,150 43,040,042
Pari-Mutuel & Operating Expenses 7,278,614 8,961,973 7,154,212 16,514,465 45,349,653
General and Admin Expenses 10,174,687 10,118,050 19,633,490 29,733,579 38,411,793
Depreciation 972,681 998,753 3,306,225 9,486,390 18,397,072
Other Expenses 4,829,451 594,000 8,899,906 594,000 1,838,439
Total Expenses 41,414,529 26,896,843 44,773,804 91,001,700 148,772,615
Income / (Loss) before Taxes (7,168,535) (11,570,625) (31,961,720) 18,082,152 37,600,758
Other expense/(Income) (604,446) (2,060,735) (477,081) 7,632,726 597,250
Interest (Earned)/Expense 1,477,815 2,891,589 7,159,084 29,049,185 36,641,919
Total Net Income / (Loss) Before Taxes (8,041,904) (12,401,479) (38,643,723) (18,599,759) 361,589
Provision for Income Taxes, Expense (Benefit) (70,349) 6,180 24,639 15,336 0
Net Income / (Loss) (7,971,555) (12,407,659) (38,668,362) (18,615,095) 361,589
Number of Live Race Days 207 105 32 307 253
* VGM operating expenses are not separately reported. Therefore are included in either Pari-mutuel, general operating or other expense.
** Yonkers closed in July 2005 for construction and renovations relating to beginning VGM operations. They reopened in the fall of 2006 and raced only 32 days during
the year. The OTB commissions are estimated for this year based on past years amounts.
Source: Prepared from information obtained from Audited Financial Statements, NYS Racing Board Annual reports and NYS Lottery Video Gaming Reports.139

ATTACHMENT VI
2004 2005 2006 2007 2008
Empire City Casino Yonkers Raceway
Assets
Current Assets
Cash and Cash Equivalents 2,429,882 3,114,377 8,146,719 8,371,364 15,331,547
Investments 0 0 0 0 0
Receivables 4,070,518 1,800,098 4,473,013 5,959,597 4,532,719
Restricted Cash 0 0 0 0 0
Prepaid Expenses 419,498 535,960 5,089,568 824,269 3,495,558
Other Assets 0 0 0 0 0
Total Current Assets 6,919,898 5,450,435 17,709,300 15,155,230 23,359,824
Property Plant and Equipment
Land and Land Improvements 12,825,814 12,825,814 12,825,814 12,825,814 12,825,730
Buildings and Building Improvements 0 29,271,248 133,175,057 153,204,005 186,126,485
Furniture Fixture and Equipment 5,208,492 5,242,821 13,878,166 15,507,612 32,585,350
Construction in progress 0 0 0 0 231,481
Other Assets 40,326,642 27,353,278 44,979,034 52,309,790 0
Less Accumulated Depreciation 22,266,506 5,155,410 8,461,635 17,791,887 26,125,848
Total Property Plant and Equipment 36,094,442 69,537,751 196,396,436 216,055,334 205,643,198
Intangible Assets 0 0 0 0 0
Due from affiliated Companies 3,708,888 3,064,483 5,343,285 7,531,855 7,147,193
Loans receivable from shareholders 6,181,343 6,818,189 7,495,524 8,437,620 9,184,919
Other Assets 83,160 10,287,402 13,208,185 13,762,320 18,123,339
Total Assets 52,987,731 95,158,260 240,152,730 260,942,359 263,458,473
Liabilities and Shareholders Equity
Current liabilities
Current Portion of Long Term Debt/Notes Payable 39,500,000 0 230,000,000 282,150,000 288,108,900
Accounts Payable 8,902,905 8,194,379 30,101,003 14,745,944 7,035,973
Accrued Expenses 7,304,547 7,574,909 6,023,696 7,299,378 8,689,317
Purses Payable 2,619,787 3,087,903 5,358,175 1,128,146 3,536,666
Statutory Payables 6,850,309 0 3,026,259 5,538,922 1,418,203
State Facility 0 0 0 0 0
Other Liabilities 5,006 2,500,608 7,615,984 3,817,278 10,014,689
Total Current Liabilities 65,182,554 21,357,799 282,125,117 314,679,668 318,803,748
Non Current Liabilities
Long Term accrued expenses 0 0 8,682,214 10,843,630 0
Due to Shareholder/Parent 0 0 1,922,936 989,807 1,023,562
Long Term Debt 0 98,365,549 0 0 0
Other LT Liabilities 0 5,006 9,423,630 8,471,285 16,717,603
Total Long Term Liabilities 3,611,904 98,370,555 20,028,780 20,304,722 17,741,165
Minority Interest in consolidated Partnerships 0 3,611,904 3,611,904 4,205,904 4,799,904
Shareholders Equity
Stock 6,691,508 7,101,908 7,512,308 7,512,308 7,512,308
Less: Treasury Stock 0 0 0 0 0
Retained Earnings/(Accumulated Deficit) (22,498,235) (30,684,647) (69,353,009) (83,500,246) (83,138,655)
Accumulated other comprehensive Income/(Loss) 0 (4,599,259) (3,772,370) (2,259,997) (2,259,997)
Total Stockholder's Equity (15,806,727) (28,181,998) (65,613,071) (78,247,935) (77,886,344)
Total Liabilities and Stockholder's Equity 52,987,731 95,158,260 240,152,730 260,942,359 263,458,473
Balance Sheet
Source: Prepared from information obtained from Audited Financial Statements, NYS Racing Board Annual reports and NYS Lottery Video Gaming Reports.140

ATTACHMENT VII
Capital Catskill Nassau New York City Suffolk Western* Total
Handle for 2008 190,544,474 121,869,536 281,957,687 940,218,360 178,590,944 133,985,683 1,847,166,684
Full Time Employees 159 48 142 745 124 232 1450
Part Time Employees 154 193 158 380 217 351 1453
Total Employees 313 241 300 1,125 341 583 2903
Ave. Handle per employee 608,768 505,683 939,859 835,750 523,727 229,821 636,296
# of Presidents & VPs 5 1 3 7 2 2 20
Telephone Wagering 1 1 1 1 1 1 6
Internet Wagering 1 1 1 3
Teletheaters 2 1 1 3 1 1 9
Branches 41 20 11 65 13 37 187
Ez-Bets / Remote sites 37 4 9 11 7 68
Total Locations 82 26 23 70 26 46 273
Ave. Handle per Location 2,323,713 4,687,290 12,259,030 13,431,691 6,868,882 2,912,732 6,766,178
Account Wagering Services
Telephone with live operators Yes Yes Yes Yes Yes Yes 100%
Tel w/natural voice recognition Yes No No Yes No No 50%
Tel w/touch tone Yes Yes Yes Yes Yes Yes 100%
Personal betting terminals Yes Yes Yes Yes Yes No 83%
Stored value instruments
(cash cards) Yes No No No No No 17%
Internet Yes No Yes Yes No No 50%
Day or Temp. accounts No Yes Yes No Yes No 50%
In-home simulcasting (TV) Yes No Yes Yes Yes Yes 83%
* Employment figures may include employees working at the VGM facility at Batavia Downs.
Off-Track Betting Corporations
Summary of Operations
Source: 2009 Simulcast Application each OTB made to the New York State Racing and Wagering Board.
141
ATTACHMENT VIII
Task Force on the Future of Off-Track Betting in
New York State
MINUTES
MEETING OF MAY 14, 2009
A meeting of the Task Force on the Future of Off-Track Betting in New York State was
held on Thursday, May 14, 2009 at 11:00am at the Racing and Wagering Board’s
Manhattan Office located at 86 Chambers Street, Suite 201, New York, New York.
The meeting was called to order at 11:00 a.m.
In Attendance Were:
John Van Lindt
John Crotty
Jon J. McCloskey
Thomas Casaregola
Rick Goodell, NYSRWB
Also In Attendance Were:
Nick Antenucci, Wilson Elser
Marietta Seaman, (Suffolk) OTB
Maureen Flynn, Monticello Raceway
Leonard Allen, OTB District Council 37, AFSCME
Richard Steier, The Chief
Barry Yomtov, OTB Local 858
Jamie Lenbrauer, YNY
Lauren Iovino, PLA
Robert Palumbo, NYRA
Pat Viscusi, NYRA
Joe Faraldo, SOA of NY
Dan Wray, NYCOTB
Shuang Liu, United Journal
Ronald Ochrym, NYSRWB
Kristen Buckley, NYSRWB
142

ATTACHMENT VIII
2
Call to Order to Organize & Form Task Force
John Van Lindt acted as the organizing person and called the meeting to order. A motion was
made by Jon McCloskey to elect John Van Lindt as Temporary Chairman. The motion was
seconded by Thomas Casaregola and passed unanimously.
A motion was made by John Van Lindt to elect Thomas Casaregola as Temporary Secretary. The
motion was seconded by John Crotty and passed unanimously.
Task Force – Summary of Enabling Legislation
Temporary Chairman Van Lindt asked Rick Goodell, assistant council for the New York State
Racing and Wagering Board to read the mandate of the Task Force as stated in State law and
describe the requirements of the Task Force. Mr. Goodell read the appropriate sections of
Chapter 115 of the Laws of 2008 (§ 26) that created the task Force and described general
administrative requirements.
Resolutions
Temporary Chairman Van Lindt requested a motion to adopt the informal resolution dated May
13, 2009 to form the Task Force on the Future of Off-Track Betting in New York State. A
motion was made by Thomas Casaregola to adopt the informal resolution dated May 13, 2009 to
form the Task Force on the Future of Off-Track Betting in New York State. The motion was
seconded by Jon McCloskey and passed unanimously.
Temporary Chairman Van Lindt requested a motion to adopt Resolution No. 2009-01 the by-
laws of the Task Force. A motion was made by Thomas Casaregola to adopt Resolution No.
2009-01, by-laws. The motion was seconded by Jon McCloskey and passed unanimously.
A motion was made by Jon McCloskey to elect John Van Lindt as Chairman. The motion was
seconded by John Crotty and passed unanimously.
A motion was made by Chairman Van Lindt to elect Thomas Casaregola as Secretary and
Administrator. The motion was seconded by Jon McCloskey and passed unanimously.
A motion was made by Chairman Van Lindt to elect John Crotty as Vice-Chair. The motion was
seconded by Thomas Casaregola and passed unanimously.
A motion was made by Chairman Van Lindt to appoint Rick Goodell as counsel. The motion
was seconded by John Crotty and passed unanimously.
A motion was made by Chairman Van Lindt to appoint Joseph Mahoney as public information
officer. The motion was seconded by John Crotty and passed unanimously
A motion was made by Chairman Van Lindt to adopt Resolution No. 2009-02, resolution to meet
in public. The motion was seconded by John Crotty and passed unanimously.
143

ATTACHMENT VIII
3
General Discussion – Task Force Mission
Chairman Van Lindt commented on the Task Force’s purpose and stated that a review of the
OTB operations and finances will be conducted including a review of the NY tracks as well.
Chairman Van Lindt also stated that of the millions of dollars wagered in NY that 75% of it is
wagered off-track and that NY wagering has a major impact nationally and to the States
economy. The way he saw it there are four options to consider when looking at a possible
overhaul to the OTB system in NYS;
The first is consolidation to achieve cost savings by efficiency of operations,
The second is merging one or two OTBs with a track- noting NYRA as a national leader
in thoroughbred racing,
The third option is to do nothing and let an OTB, like NYCOTB simply fail (he noted
this is not a viable option),
The fourth option is to privatize the OTBs.
Vice-chair Crotty stated that he appreciated the opportunity the Governor gave him by placing
him on the committee. Mr. Crotty discussed the large volume of wagering noting the economic
impact of wagering in NY with OTB being the major component. He stated that the Task Force
needs to examine all stakeholders in trying to understand issues to make recommendations to
protect jobs and growth of all sectors. Mr. Crotty noted that approximately $10 billion is spent
on buying movie tickets in the US while the total amount wagered on horse racing is
approximately $15 billion. He went on to say that the cost of movie tickets is much higher ($10)
than the cost of placing a typical bet ($2). Clearly this is an important industry and we need to
focus on this.
Member McCloskey discussed the need of getting all sectors of the New York racing industry to
work together. He stated that OTB is a major component of the racing community and he agreed
that allowing it to fail is not a viable option. He stated that the Task Force needs to get everyone
to work together - to achieve growth. Mr. McCloskey noted that it is a difficult task but that it
needs to be addressed; the State can no longer look at bandaid approaches/solutions. Mr. Crotty
and Mr. McCloskey discussed briefly role of OTB within the larger racing and wagering
community.
Member Casaregola talked about the large task ahead for the Board and the need to look at all
players in the New York racing industry.
Chairman Van Lindt again discussed the goals of the Task Force and the report that is to be
issued and again noted the four options he previously discussed. Having noted the options, he
listed the affected stakeholders - horsemen, breeders, presidents of OTB regions, state leaders
(and committee chairs), tote companies, tracks, local governments and labor unions. Chairman
Van Lindt stated that letters will go out to each of the mentioned stakeholders soliciting their
opinion and input. Chairman Van Lindt also noted that the Task Force is also asking the OTBs
not to enter into long term contracts while the Task Force is conducting is study and issuing its
report.
144

ATTACHMENT VIII
4
New Business
Member Casaregola noted that the Task Force has received letters from Marvin Newberg
representing Monticello Raceway and a letter from Joseph Faraldo representing the Standardbred
Owners Association of New York. These letters were submitted for the Task Force’s review and
incorporated into the record. Mr. Casaregola also corrected a procedural issue regarding the
adoption of the first resolution (this matter is correctly recorded in the minutes above).
The Task Force’s next meeting will be the week of June 22, 2009 in Albany. The exact date,
place and time has not yet been determined.
Public Comment
Chairman Van Lindt offered opportunity for public comment. Dan Wray- NYCOTB asked for a
timetable for the report. Chairman Van Lindt noted that the Task Force will work as quickly as
possible in completing its mission. Robert Palumbo-NYRA asked how appointments to the Task
Force were made, why the Assembly did not have anyone at the meeting and if the Assembly
knew about the meeting. Chairman Van Lindt and Mr. Crotty noted that the Speakers office was
notified. Leonard Allen-OTB District Council 37, AFSCME asked why they were not included
in list of entities to receive a letter. Chairman Van Lindt noted he would be sure to be added to
the list and that his input is welcomed. Marietta Seaman-(Suffolk) OTB asked who the
appointment representing OTB was on the Board. Chairman Van Lindt noted OTB did not have
an appointment to the Board. There were no other comments
Adjournment
Chairman Van Lindt made a motion to adjourn the meeting, seconded by Member Casaregola.
The meeting was adjourned at approximately 11:40am.
Respectfully Submitted,
_______________________
Thomas Casaregola
Secretary to the Task Force
145

ATTACHMENT IX
Task Force on the Future of Off-Track Betting in
New York State
MINUTES
MEETING OF JUNE 24, 2009
A meeting of the Task Force on the Future of Off-Track Betting in New York State was
held on Wednesday, June 24, 2009 at 11:00am at the Empire State Plaza, Meeting Room #1
Albany, New York.
In Attendance Were:
Chairman John Van Lindt
Vice-Chair John Crotty
Jon J. McCloskey
Thomas Casaregola, Secretary
Rick Goodell, Counsel
Also In Attendance Were:
Charles Vickery
Brian Flynn, NYCOTB
Dan Wray, NYCOTB
A representative for Leonard Allen, OTB District Council 37, AFSCME
Mike Hoblock
Joni Yoswein, YNY/SOA
Kristin Buckley, NYSRWB
Jim Kellogg, NYSRWB
Anne Leahy, Whiteman Osterman Hanna
Steve Bochnak, NYS Assembly
Honorable J. Gary Pretlow, NYS Assembly, Chair of the Assembly Racing & Wagering
Committee
Brendan Fitzgerald, Executive Chamber
Michael Wilton, PLA
Ronald Ochrym, NYSRWB
Honorable John Sabini, Chairman of the New York State Racing and Wagering Board
Joseph Mahoney, NYSRWB
Anthony Piscitelli, Wilson Elser Moskowits Edelman & Dicker
Jessica Morelli, NYSAC
Amy Solomon, Mckenna Long
Jerry Skurnik, Assembly nominee to the Task Force
146

ATTACHMENT IX
2
Call to Order
The meeting was called to order at 11:01 a.m.
Minutes of Previous Meeting
Chairman Van Lindt requested a motion to approve the minutes of the meeting held on May 14,
2009. A motion was made by John Crotty and seconded by Chairman Van Lindt. The minutes
were approved unanimously.
Introductory Remarks
Chairman John Van Lindt mentioned the importance of Off-Track Betting in New York State and
noted how the system is constantly under criticism for its structure and operation. He read an article
by Jerry Bossert that appeared in the Daily News on June 19, 2009 that quoted Dennis Dowd, the
senior vice president of legal and government affairs for the New Jersey Sports and Expositions
Authority, criticizing the NYS OTB system and operations.
He then gave a legislative summary of laws in the 1970s regarding the establishment of OTB in
New York.
Chairman Van Lindt then read sections of the report “Analysis Prepared by the Staff of the Joint
Legislative Task Force to Study and Evaluate the Pari-Mutuel Racing and Breeding Industry in
New York State”.
A summary of current OTB operations was also provided regarding various items such as the
number of employees, branches, amount of handle and wagering platforms.
Statutory History of New York OTB
Rick Goodell, counsel to the Task Force provided a summary of the statutory history of Off-
Track Betting ending with the authorization of OTB to the State take over of New York City
OTB in June of 2008 and the creation of the Task Force on the Future of Off-Track Betting.
Summary of Various Commission Reports related to Off-Track Betting in New York State
Jon McCloskey provided a summary of the following reports that have been issued over the
years, since the creation of Off-Track Betting in New York, and issues at the time such
commissions were created. Noted that each of the reports recommended some kind of
consolidation of OTB operations and mentioned that since then there were several privately
commissioned reports. A written report was submitted and included for the record. The reports
that were summarized are:
Governor’s Commission on the Future of Horse Racing in New York State, March, 1973
Examination of The Regional OTB System in New York, Joint Legislative Task Force,
September, 1979
Governor’s Advisory Commission on Racing in the 21st Century, June 1993.
Summary of Comments Received
John Crotty reported that the Task Force had requested information from the OTBs, racetracks,
horsemen, tote companies, labor unions, local municipalities, breeders and fans/bettors. Between
50 to 60 responses were received. It was noted that no response was received from New York
City OTB and Nassau OTB’s response was submitted with a request for an exemption from
Freedom of Information Requests. He further stated the Task Force was disappointed that New
York City OTB did not respond and that Nassau OTB’s response was being returned with a
147
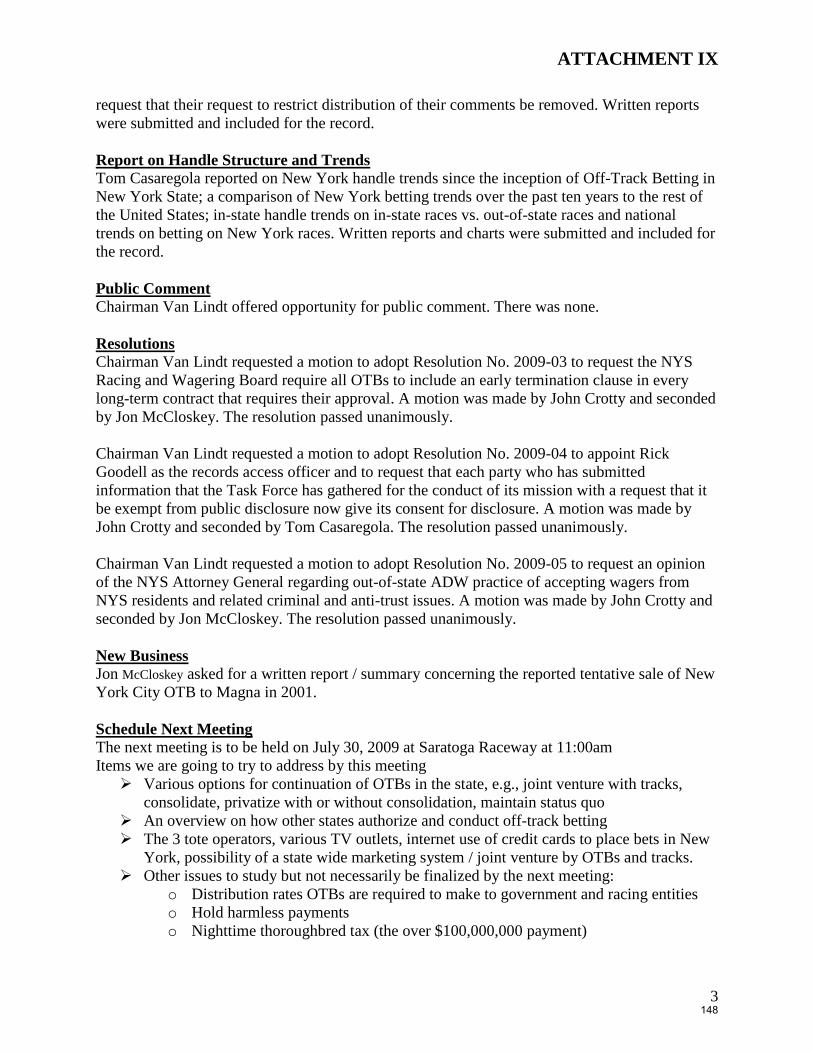
ATTACHMENT IX
3
request that their request to restrict distribution of their comments be removed. Written reports
were submitted and included for the record.
Report on Handle Structure and Trends
Tom Casaregola reported on New York handle trends since the inception of Off-Track Betting in
New York State; a comparison of New York betting trends over the past ten years to the rest of
the United States; in-state handle trends on in-state races vs. out-of-state races and national
trends on betting on New York races. Written reports and charts were submitted and included for
the record.
Public Comment
Chairman Van Lindt offered opportunity for public comment. There was none.
Resolutions
Chairman Van Lindt requested a motion to adopt Resolution No. 2009-03 to request the NYS
Racing and Wagering Board require all OTBs to include an early termination clause in every
long-term contract that requires their approval. A motion was made by John Crotty and seconded
by Jon McCloskey. The resolution passed unanimously.
Chairman Van Lindt requested a motion to adopt Resolution No. 2009-04 to appoint Rick
Goodell as the records access officer and to request that each party who has submitted
information that the Task Force has gathered for the conduct of its mission with a request that it
be exempt from public disclosure now give its consent for disclosure. A motion was made by
John Crotty and seconded by Tom Casaregola. The resolution passed unanimously.
Chairman Van Lindt requested a motion to adopt Resolution No. 2009-05 to request an opinion
of the NYS Attorney General regarding out-of-state ADW practice of accepting wagers from
NYS residents and related criminal and anti-trust issues. A motion was made by John Crotty and
seconded by Jon McCloskey. The resolution passed unanimously.
New Business
Jon McCloskey asked for a written report / summary concerning the reported tentative sale of New
York City OTB to Magna in 2001.
Schedule Next Meeting
The next meeting is to be held on July 30, 2009 at Saratoga Raceway at 11:00am
Items we are going to try to address by this meeting
Various options for continuation of OTBs in the state, e.g., joint venture with tracks,
consolidate, privatize with or without consolidation, maintain status quo
An overview on how other states authorize and conduct off-track betting
The 3 tote operators, various TV outlets, internet use of credit cards to place bets in New
York, possibility of a state wide marketing system / joint venture by OTBs and tracks.
Other issues to study but not necessarily be finalized by the next meeting:
o Distribution rates OTBs are required to make to government and racing entities
o Hold harmless payments
o Nighttime thoroughbred tax (the over $100,000,000 payment)
148

ATTACHMENT IX
4
o Continuation of surcharge
o Out of state ADW operations operating in NY
o Introduction and use of VLTs in NY and other forms of gambling introduced
since the inception of OTBs.
Adjournment
Chairman Van Lindt requested a motion to adjourn the meeting. A motion was made by John
Crotty and seconded by Jon McCloskey. The resolution passed unanimously.
The meeting was adjourned at approximately 12:05pm.
Respectfully Submitted,
_______________________
Thomas Casaregola
Secretary to the Task Force
149

ATTACHMENT X
Task Force on the Future of Off-Track Betting in
New York State
MINUTES
MEETING OF JULY 30, 2009
A meeting of the Task Force on the Future of Off-Track Betting in New York State was
held on Thursday, July 30, 2009 at 11:00am at the Nevele Pride room in the clubhouse at
Saratoga Gaming and Raceway, Saratoga New York.
In Attendance Were:
Chairman John Van Lindt
Vice-Chair John Crotty
Jon J. McCloskey
Jerry Skurnik
Thomas Casaregola, Secretary
Also In Attendance Were:
Martin Basinait, Western OTB
John Signor, Capital OTB
Marc Corazzini, FAN
Ed Fountaine, NY Post
Nancy Priputen Madrian, Capital OTB
Rob Palumbo, NYRA
Hal Handel, NYRA
Charlie Hayward, NYRA
Richard Dirkes, Getnick & Getnick
Bruce Cogan, Saratoga Gaming
Bill Crowel, Witeman, Osterman etal.
Patrick Kehoe, NYRA
Pete Pagliaro, NYS OSC
Harry Snyder, NYS Racing Commission
Sylvia Hamer, Governor’s Office
Lisa Marrello, Wilson Elser
Skip Piscatelli, Wilson Elser
Nick Antenucci, Wilson Elser
Jessica Morelli, NYSAC
Michael Wilton, P. Lynch Assoc.
Jeffery Casale, Suffolk OTB
David Needham, Suffolk OTB
Charles Vickery
150

ATTACHMENT X
2
Robert Hemsworth, Capital OTB
Brad Fischer, NYS Senate & Senate nominee to the Task Force
Joni Yoswein, YNY/SOA
Abby Jenkins, NYSAC
Dick Powell, RGS
Valerie Lucanera, Catskill OTB
Linda Casse, Ocala owner
Donald Groth, Catskill OTB
Michael Amo, Orange County Legislator / ThoroFan
Bruce Benedict, GVE
Don Braim, Saratoga Gaming
George Wiley, Saratoga Gaming
John Mattarazo, Saratoga Gaming
Mike Hoblock, Catskill
Honorable J. Gary Pretlow, NYS Assembly, Chair of the Assembly Racing & Wagering
Committee
Steve Bochnak, NYS Assembly
Paul Post, Saratogian
Kristin Buckley, NYSRWB
John Googas, NYSRWB
Ronald Ochrym, NYSRWB
Joseph Mahoney, NYSRWB
Call to Order
The meeting was called to order at 11:02 a.m.
Minutes of Previous Meeting
Chairman Van Lindt requested a motion to approve the minutes of the meeting held on June 24,
2009. A motion was made by Chairman Van Lindt and seconded by Jerry Skurnik. The minutes
were approved unanimously.
151

ATTACHMENT X
3
Introductory Remarks
Chairman Van Lindt reported the total New York State handle (bets placed in NYS) at $2.45
million with $1.8 million being wagered at the six regional Off-Track Betting Corporations. A
summary of what the task force has done so far was also provided as well as mention of the
pending requests for legal opinions from the New York State Attorney General’s office regarding
out-of-state Advance Deposit Wagering providers. A summary of the 216 total recommendations
received to date was made. These recommendations were received from 61 individuals and or entities
as follows:
NYS Tracks 6
Tote Companies 3
Local Municipalities 12
Horsemen and Breeders 7
NYS Off-Track Betting Corporations 5
Bettors / Public / Fans 28
61
The only authorized pari-mutuel wagering entities that have yet to submit comments to the Task
Force are New York City OTB, Finger Lakes Raceway, Vernon Downs and Tioga Downs.
Financial Reports and Analysis
Tom Casaregola reported that financial summaries and analysis were performed on all of the
New York State Off-Track Betting Corporations and racetracks. The analysis was compiled from
information filed with the New York State Racing and Wagering Board and information from the
New York State Lottery for the past five years. The information is to be posted on the Task
Force’s web site by tomorrow (July 31st) so that it may be reviewed by all interested parties
along with the members of the Task Force. Mr. Casaregola noted that the task Force has not
come to any conclusions regarding this information but rather is considering it as comments and
suggestions are made. It was noted that some information is not yet available for disclosure as
some issues regarding Freedom of Information disclosure are being addressed.
Public Comment
Chairman Van Lindt noted that the OTB presidents and president of NYRA were invited to
address the Task Force at this meeting.
Mr. Charles Hayward, president of NYRA read from a document he prepared for a meeting he
had with the OTB presidents in the summer of 2006 concerning consolidating tote, internet
wagering platforms, statewide television and video streaming over the internet for simulcasting
NY races as well as a statewide marketing. Also suggested consolidating operations and
overhead (accounting, marketing, insurance etc.) Mr. Hayward also discussed the monies owed
to NYRA by NYCOTB and NYCOTB's poor financial position and encouraged the Task Force
to concentrate on the problems of NYCOTB.
Mr. Donald Groth, president of Catskill OTB stated he has been promoting the idea of a
statewide television network for racing for decades and hopes the task force recommends it in
their report. Supports a statewide tote system for all NY tracks and OTBs and to update the
system with current technology. Stated a statewide marketing program is a brilliant idea and
152

ATTACHMENT X
4
suggest the I Love New York campaign be used for this. Mr.Groth also stated that the OTBs
meet all the time to try to find ways to save money and consolidate however when asked he
offered no examples of implemented programs. Lastly out of state Advance Deposit Wagering
(ADW) companies are poaching thousands of dollars of bets from the OTBs and there are too
many people living off of OTB.
Mr. Martin Basinait, president of Western OTB stated that Western OTB’s position is unique
because in addition to operating an OTB they also operate a racetrack and video gaming
operations. The gaming business follows the economy of the country, which is now very bad. It’s
difficult to operate a 20th
century business on 19th
century laws. The distribution (of revenue)
model needs to be changed. Supports a statewide tote operation and statewide player card.
Western OTB does not offer nighttime thoroughbred wagering because the statutory payments to
do so are too high and stated that they should all support New York racing.
Mr. Jeffery Casale, president of Suffolk OTB stated that Suffolk OTB submitted their proposed
business model on how OTB should be run to the Task Force. Their model is more customer
friendly and supports a statewide tote to provide patrons the ability to use one player card or
voucher at any New York location (OTB or track). Suffolk OTB currently shares a phone center
and print shop with Nassau OTB that works well. Supports the idea of centralized telephone
wagering centers, one upstate and one downstate. Suffolk OTB is promoting a statewide
handicapping tournament that helps promote New York racing. They are sensitive to their local
communities on placing of branches and believe that should continue. Racing is in decline and
there needs to be a change to the distribution formulas. The racing product needs to improve,
better marketing and larger fields are needed as there is more competition for the betting dollar.
Mr. John Signor, president of Capital OTB stated the decline in racing is a national problem not
just New York. Stated that the tracks and OTBs work together all the time and cited how Capital
OTB promotes NYRA racing at Saratoga in addition to Finger Lakes and Vernon Downs racing.
Nighttime thoroughbred racing was projected to add $400 million in handle, which did not
happen. As a result of the legislation they have to pay too much to the harness tracks based on
handle from 2002 as current handle continues to decline. Also stated he believes that the out of
state ADWs are having a massive impact on their operations and stated that Youbet told them
two years ago that they had $50 million of New York customer handle and that he believes the
amount to be much higher now. They have cut their expenses consistently over the years and run
efficient operations and believe it’s a good idea to have a statewide tote and television station for
racing.
Mr. Michael Amo, Orange County Legislator, Chairman of the OTB committee for the County
and Chairman of the Board of ThoroFan, a non-profit organization formed for the benefit of
racing fans stated that the Task Force should be sure to remember the fans and be sure not to do
or recommend anything that would hurt them. He also stressed its important to educate people to
learn about the sport and betting.
New Business
None.
153

ATTACHMENT X
5
Schedule Next Meeting
The next meeting is tentatively planned to be held towards the end of August. Time and place to
be announced.
Adjournment
Chairman Van Lindt requested a motion to adjourn the meeting. A motion was made by John
Crotty and seconded by Jon McCloskey. The resolution passed unanimously.
The meeting was adjourned at approximately 12:05pm.
Respectfully Submitted,
_______________________
Thomas Casaregola
Secretary to the Task Force
154

ATTACHEMENT XI
Task Force on the Future of Off-Track Betting in
New York State
MINUTES
MEETING OF AUGUST 20, 2009
A meeting of the Task Force on the Future of Off-Track Betting in New York State was
held on Thursday, August 20, 2009 at 11:00am at the Victoria Pool Building, 19 Roosevelt
Drive at the Saratoga Spa State Park, Saratoga Spring, New York.
In Attendance Were:
Chairman John Van Lindt
Brad Fischer
Thomas Casaregola, Secretary
Vice-Chair John Crotty (via telephone)
Jerry Skurnik (via telephone)
Also In Attendance Were:
Jon J. McCloskey
Martin Basinait, Western OTB
Maureen Flynn, Monticello Raceway
Kevin Kearny, Finger Lakes
Jamie Hartman, Saratoga Gaming
Donald Groth, Catskill OTB
Valerie Lucanera, Catskill OTB
Pam Donehower, International Racing Management (IRM) Ltd
James Mango, Buffalo Raceway
Nancy Priputen Madrian, Capital OTB
Jim Crane, Crane, Parente and Cherubin
John Hindman, TVG
Dino Amoroso, Nassau Downs OTB
Skip Piscatelli, Wilson Elser
Nick Antenucci, Wilson Elser
Martin Kinsella, NYS Thoroughbred Breeding Fund
Sylvia Hamer, Executive Chamber
Patrick Kehoe, NYRA
Dick Powell, RGS
Dianne Frazier, NY Breeders
Robert Hemsworth, Capital OTB
Shawn Wiles, Monticello Raceway
Peter Goold, Ag & NYS Horse Breeding Fund
155

ATTACHEMENT XI
2
James Orgen, sz H
George Karam, Saratoga HHA / Empire State HHA
Richard Burstein, Saratoga Gaming & Raceway
Mike Corbin, Delaware North Companies Inc.
Jim Gallagher, NYTHA
Matt Hegarty, Daily Racing Form (DRF)
Abby Jenkins, NYSAC
Marietta Seaman, Suffolk OTB
Jeff True, United Tote
Brendan Fitzgerald, Executive Chamber
John Mattarazo, Saratoga Gaming
Edward Bogdan, NYTB
Jeffrey Cannizzo, NYTB
Joe McMahon, Joe McMahon Thoroughbred Farm
Ellen McClain, NYRA
Phil Palermo, Finger Lakes
Pat Placito, Finger Lakes
Rob Palumbo, NYRA
John Signor, Capital OTB
Gene Chabrier, XpressBet
Honorable John Sabini, Chairman of the New York State Racing and Wagering Board
Kristin Buckley, NYSRWB
James Kellogg, NYSRWB
Ronald Ochrym, NYSRWB
Joseph Mahoney, NYSRWB
Dan Wray, NYCOTB
Call to Order
The meeting was called to order at 11:00 a.m.
Minutes of Previous Meeting
Chairman Van Lindt requested a motion to approve the minutes of the meeting held on July 30,
2009. A motion was made by Chairman Van Lindt and seconded by Thomas Casaregola. The
minutes were approved unanimously.
Appointment of Records Access Appeals Officer
Thomas Casaregola made a motion to appoint John Van Lindt the records access appeals officer.
The motion was seconded by Brad Fischer. The motion was approved unanimously.
Executive Session
The Task Force went into executive session at 11:07am to address freedom of information issues
raised by two of the racetracks. The executive session ended and the meeting resumed at
11:34am.
156

ATTACHEMENT XI
3
Introductory Remarks
Chairman Van Lindt provided a summary of the history of Off-track betting, racing and Video
Gaming in New York State including handle (bets placed in NYS) trends. A summary of the
meetings and resolutions the Task Force made to date was also provided.
Public Comment
Chairman Van Lindt noted that various individuals were invited to address the Task Force at this
meeting.
Mr. Dino Amoroso, president of Nassau OTB summarized Nassau OTB’s operations and stated
that they have cut costs since he began in 2006, closed inefficient branches and changed
operations. They began offering Internet wagering, implementing 8 FastBet facilities and
offering more automated (self service) wagering platforms as well as began a players rewards
program. These wagering platforms are significantly less costly to operate then traditional brick
and mortar branches however the out of state ADWs still continue to take business (bettors) that
would otherwise wager with them. (The profit margin for Internet wagering program is about
17% to 18% while the profit margin for their branches is about 10%.) Mr. Amoroso suggested
that OTBs be authorized to operate VLTs, have a statewide marketing program, a joint internet
platform with NYRA and all NYS tracks and OTBs, and that OTBs no longer be required to pay
dark day and hold harmless payments to the NY tracks. He stated that Nassau and Suffolk OTB
share telephone wagering operations which has proved to be very beneficial for both entities. Mr.
Amoroso also stated that Nassau OTB performed a study of the OTB structure in the other
jurisdictions that concluded that none of these structures have been successful. Mr. Amoroso was
asked to provide a copy of the OTB study Nassau OTB performed as well as submitting a copy
of the uniform tote RFP the OTBs issued.
Jim Mango, chief operating officer of Buffalo Raceway supports the idea of statewide tote,
Internet, TV (for NYS racing) and buying co-op for out-of-state simulcast signals. Also supports
prohibiting out-of-state ADWs from taking bets from NY residents. Stated there was too much
competition in NYS among the tracks and OTBs and that the Task Force needs to think of the
patrons.
John Hindman, senior vice president and counsel for TVG stated they are licensed in 15 states.
TVG decided the best way to enter the NY market was to partner with a licensed NY operator,
Yonkers Raceway to operate Yonkers’ Internet and account wagering platform. Therefore they
collect, and pay, all NYS taxes, breeder’s payments etc like every other NYS licensed provider.
Stated that on-line (electronic) account opening and sign up is necessary to provide an easy way
for customers to open accounts. The current restriction from this practice is hurting their ability
to grow in the NY market. California is a good example to follow for regulation of ADW
operations.
Dick Powell, Racing and Gaming Services (RGS) of St. Kitts, a rebate shop stated they are just
like any other ADW, they participate in the pools and contribute to purses, taxes etc. The only
difference from them and other ADWs is they are off shore. The off shore bookmakers, the
operators who are not in the (host track) common pools are pirates, stealing the track’s signal and
paying nothing to the industry. Closing the borders of New York from out of state ADWs will
157

ATTACHEMENT XI
4
only drive bettors to the bookmakers (pirates) and further hurt the industry. If the OTBs are
going to survive they must get rid of the surcharge to be competitive. A plan must be developed
to keep the participating counties whole. The monopoly the OTBs had in NYS is gone, the open
market is what he believes makes operators better and competitive. Rebates make it possible for
good bettors to make money and become professional bettors, which in turn increases the
amount they bet as well as revenue to the industry. RGS has good relationships with horsemen
around the country as a result of the high volume of wagering they do. Mr. Powell disagreed
with Dino Amoroso and stated that tracks who own OTB’s are profitable. Mr. Powell stated he
worked at the Fairgrounds in Louisiana, who owned OTBs that were very profitable.
A break was taken at 12.56pm. The meeting resumed at 1:05pm
Philip Palermo, Finger Lakes cited the recent New York State Comptrollers audit of New York
City OTB and stated they should devote their time to address their administrative and operating
costs structure rather than attacking the current statutory structure. In addition he recommended
that they (NYCOTB) stop taking the out of state signals they say is costing them too much in
statutory fees. New leadership is needed at NYCOTB. They (Finger Lakes) could take over the
management of NYCOTB and make it profitable.
Shawn Wiles, Monticello stated that NYCOTB (finances) make it clear that the OTB model (in
NYS) needs to be changed. Stated that despite the findings of the recent New York State
Comptrollers audit of New York City OTB, (NYCOTB) has done nothing to address the
problems. The Task Force needs to address major issues such as requiring the OTBs to pay the
tracks what they owe them and not wait extended periods of time for the required payments. The
maintenance of effort payments, hold harmless and dark day payments need to be paid. The
practice of the OTBs taking out of state harness signals at night over the New York Harness
signals must stop. Suggest that the option of the tracks running the OTBs should be explored. It
is in the best interest of everyone that the OTBs remain strong.
Martin Kinsella, Executive Director of the New York State Thoroughbred Breeding and
Development Fund. The Fund takes no position of what form or structure the OTBs take as long
as the revenue from OTBs continue to the Fund, as this is the majority of the Funds revenue
(over 72%). Without the breeders there wouldn’t be any horses to bet on. Suggest the task force
recommend that the fund receive the same percentage of revenue from all sources of wages
rather than the current various calculations now in place. NYCOTB provides about 40% of the
Funds total revenue. Current delay in payments from NYCOTB is causing the Fund, for the first
time ever, to delay payments for owners and breeders awards. Current statute provides no time
frame for when OTBs are to submit statutory payments to the Fund. Therefore it is suggested
that the Task Force recommend a date certain be established in statute that requires when
payments are to be submitted to the Fund.
Peter Goold, Executive Director of the New York State Agriculture Horse Breeding and
Development Fund stated there are about 400 horse farms in NYS in about 49 counties that
occupy about 4,000 acres. About 25% of these farms are standardbred farms. NYCOTB provides
about 6% of the Fund’s total revenue, the majority of the Funds revenue now comes from VLTs.
The OTBs use to account for about 75% of the Funds total revenue, before VLTs and now
158

ATTACHEMENT XI
5
account for about 25% of the Funds revenue (after VLTs.) It is important that the revenue from
OTBs continue to the Fund to maintain the strong breeding program that the Fund supports.
John Matarazzo, Director of Racing Operations Saratoga Gaming and Raceway noted that Dino
Amoroso mentioned that the OTBs mandate ways to curb bookmaking and provide revenue for
local governments but did not mention that the other mandate the OTBs have is to support racing
and breeding. He has worked for both OTB and racetrack. When he was at OTB the focus was to
maximize revenue for the support of government and they spent little time considering the long-
term impact (of what they were doing) on racing. Everyone was making more money at the
beginning of OTB. OTB has drastically reduced revenue that Saratoga Gaming and Raceway
makes annually. Capital OTB owes them over $2 million in hold harmless payments of which
50% of that money goes to purses. Recommend the hold harmless payments provided a higher
commission rate be paid to the host NY track, enact legislation to offer additional gaming (non-
taxable free play and table games), improve operating efficiencies and hold the out of state
ADWs to the same standard as the NYS OTBs by requiring them to pay the same amounts the
OTBs pay. Mr. Matarazzo stated that he believes there is too many wagering outlets in NYS,
compared to other states. There is no new revenue to make therefore consolidation is logical but
is not a long-term solution. The only practical and permanent solution is to privatize OTB. This
will align OTB with the racetracks rather than trying to compete for the same money. In every
state with the exception of NY the OTBs are run by the tracks, while not an easy concept in NY
it is the best method.
New Business
None.
Schedule Next Meeting
The next meeting is tentatively planned to be held towards the end of September somewhere
downstate. Time and place to be announced.
Adjournment
The meeting was adjourned at approximately 1:41pm.
Respectfully Submitted,
_______________________
Thomas Casaregola
Secretary to the Task Force
159

ATTACHEMENT XII
Task Force on the Future of Off-Track Betting in
New York State
MINUTES
MEETING OF OCTOBER 5, 2009
A meeting of the Task Force on the Future of Off-Track Betting in New York State was
held on Monday, October 5, 2009 at 11:00am in the “Good Time Room” at Yonkers
Raceway, 810 Central Avenue, Yonkers, New York.
In Attendance Were:
Chairman John Van Lindt
Vice-Chair John Crotty
Jerry Skurnik
Brad Fischer
Thomas Casaregola, Secretary
Rick Goodell, Counsel
Also In Attendance Were:
Bob Galterio, Yonkers Raceway
Kevin Kearny, Finger Lakes
Richard Burstein, Saratoga Gaming & Raceway
John Mattarazo, Saratoga Gaming
Donald Braim, Saratoga Gaming
Barry Yomtov, Local 858
Jonathan Strause, Virtual Media Group
William Phillips, Virtual Media Group
Ray Kerrison, NY Post
Marietta Seaman, Suffolk OTB
Neil Tiger, Suffolk OTB
Edward Ryan, Yonkers Raceway
Dennis Moran, Yonkers Raceway
Andrew LeRay, NYU- Press
Ben Rohn, Yonkers Raceway
Charles Cole, Yonkers Raceway
Nick Brily, Yonkers Raceway
Donald Groth, Catskill OTB
Valerie Lucanera, Catskill OTB
Ursula McIntyre, Yonkers Raceway
Wayne Smith, Yonkers Raceway
160

ATTACHEMENT XII
2
Jamie Hartman, Saratoga Gaming
Matt Bunyan, Yonkers Raceway
Stephanie Bunyan, Yonkers Raceway
Joel Davey, Yonkers Raceway
George Casale, SOA of NY
Joe Faraldo, SOA of NY
Joe Mayo, SOA of NY
Michael Porto
Honorable John Sabini, Chairman of the New York State Racing and Wagering Board
Kristin Buckley, NYSRWB
James Kellogg, NYSRWB
Ronald Ochrym, NYSRWB
Joseph Mahoney, NYSRWB
Call to Order
The meeting was called to order at 11:01 a.m.
Minutes of Previous Meeting
Chairman Van Lindt requested a motion to approve the minutes of the meeting held on August
20, 2009. A motion was made by Chairman Van Lindt and seconded by Brad Fischer. The
minutes were approved unanimously.
Introductory Remarks
Chairman Van Lindt provided a summary of the history of Off-track betting, racing and Video
Gaming in New York State including handle (bets placed in NYS) trends.
Status of Request for an Opinion from the New York State Attorney General
In a letter dated June 28, 2009 the Task Force requested an opinion of the NYS Attorney
General regarding the legality of out-of-state ADW’s practice of accepting wagers from NYS
residents and related anti-trust issues. Task Force Counsel Rick Goodell reported that he had just
been informed by the Attorney General’s Office that the letter was referred to the Governor’s
Office to respond to.
Summary of Benefits to Participating Municipalities paid by Regional OTBs
Secretary Casaregola stated that information from each of the OTBs was obtained regarding the
amount of benefits each of them has paid to their participating municipalities since their
inception. This is an important statistic as the Task Force is charge to make recommendations to,
in part maximize contributions the OTBs make to local governments. A copy of the report is
attached and identified as Attachment I. (Not included with this report.)
OTB Structure in Other Jurisdictions
Secretary Casaregola reported that a survey regarding the structure and regulator frame work of
OTBs was sent to several racing jurisdictions, including international locations. A summary of
the responses from those jurisdictions that reported relevant information for the study was
provided. (Note that the survey was sent to over 50 jurisdictions and that we received 19
161

ATTACHEMENT XII
3
responses. There are eight jurisdictions not listed in the summary as they reported as not having
OTBs or reported incomplete information.) A copy of the report is attached and is identified as
Attachment II. (Not included with this report.)
Public Comment
Mr. Robert Galterio, Vice President and General Manager of Yonkers Raceway provided a
written submission (copy is attached and is identified as Attachment III). Mr. Galterio stated that
strong racing industry in New York will help build a strong NY OTB system and that ADW’s
taking bets from New York residents should be regulated by New York. He also stated that
NYCOTB currently owes Yonkers Raceway about $12 million, not including the Maintenance of
effort amounts, and that they have tentatively reached an agreement for them to pay Yonkers half
the amount now and the remainder over a period of time. Mr. Galterio also expressed concern
over the OTB proposal to pay the statutory amounts due the in state tracks (such as Yonkers) on
a new formula based on net income after operating expenses (rather than on the current system
based on percentage of handle.) He stated that under the proposed system out of state tracks
would be guaranteed to continue to get the percentage of handle they charge but the NY tracks
(such as Yonkers) could conceivably get nothing if the OTBs pay based on net income and the
OTB has a loss. He believes this is highly unfair and not good for NY racing or NY.
Vice-Chair John Crotty noted that the Task Force was created in the same section of law that
enabled the State to save NYCOTB and assume its operations and that it is unacceptable that
NYCOTB has not submitted any comments nor participate in any discussions with the Task
Force. In the past each section of the racing industry has always looked out for each of their own
interest at the detriment to others and that NYCOTB is doing it again.
Task Force Member Jerry Skurnik stated that he attended the NYS Senate Racing Committee
meeting recently to hear what NYCOTB will tell the Senate Committee but not the Task Force.
Mr. Skurnik stated that, to his credit, NYCOTB Chairman Frucher stated he would not publicly
discuss private conversations he has had with the Governor on this matter but Ray Casey,
President of NYCOTB did say that NYCOTB would meet with any State Senator to discuss their
(NYCOTBs) current situation. Yet NYCOTB will not meet with the Task Force. Mr. Skurnik
also stated that it is not fair to the taxpayers, the State or to horseplayers for NYCOTB to
develop a plan in secret. NYCOTB previously stated they had a plan that they would submit to
the Task Force yet one was never submitted. All of the other OTBs and virtually all of the NYS
tracks have participated except NYCOTB.
Michael Porto stated that he is a racing analyst, wrote a book called “Winning System” that sold
over 50,000 copies and was an analyst for OTB, therefore he feels he is qualified to make
recommendations to fix OTB. He presented a summary of several operational ideas that
included; allowing OTB to show other races while NYRA is running, questioned the number of
automobiles OTB owns, close branches that loose money, close certain nighttime operating
branches, limit the number of racing signals that are displayed, stop paying clerks who work on
Sunday double time (close on Sunday and Monday), consider charging admission to branches
like tracks charge admission to go to the races, limit or eliminate the daily sheets posted on the
walls of the branches (results and performances), reduce the number of “upper echelon”
162

ATTACHEMENT XII
4
management positions and offer a new wager he developed that offers a lottery like payoff for
selecting the trifecta for three consecutive races (he said it could make $50 million).
Jonathan Strause, Chairman and CEO of Virtual Media Group did a presentation on a virtual
racing product his company offers called IRace. Mr. Strause stated that virtual racing has helped
grow handle on live racing in the UK and has become a vital part of the racing industry in
various countries. A copy of the presentation is attached and is identified as Attachment IV. (Not
included with this report.)
New Business
None.
Schedule Next Meeting
There may be another meeting to issue and discuss a draft or final report. Time and place to be
announced.
Adjournment
The meeting was adjourned at approximately 12:25pm.
Executive Session
The Task Force immediately went into executive session to address freedom of information
issues raised by two of the racetracks (Finger Lakes and Saratoga Gaming and Racing).
Respectfully Submitted,
_______________________
Thomas Casaregola
Secretary to the Task Force
163

ATTACHMENT XIII
1
The Task Force on the Future of Off-Track Betting in New York State
Summary of Comments Received From
Bettors & Fans
Responses
Jackson Leeds –Bettor/Fan- He made several submissions on various dates
summarized below:
NYS should join Senator Lesniak's (D) (NJ) lawsuit to make sports
betting legal.
That OTB's should be allowed to take bets on Palm Sunday, Easter
and Christmas and Racing Law Section 105 is unconstitutional.
That Nassau OTB has settled a lawsuit alleging that they forced an
employee to work on political campaigns during OTB business hours
and that the person was fired when she reported the matter.
That he believes Nassau OTB does not select branch locations
correctly and not for good business reasons.
That Dino Amoroso said at the Nassau OTB board meeting this
week that the OTBs are considering closing on Tuesdays so they
won't have to pay the tracks dark day money.
He is frustrated that the NYRA signal is not available in-home in
Nassau County.
Jerry Bossert -Daily News Racing Reporter– Consolidate OTBs and let NYRA
run it. The OTB system in NY should be like the ones in Pennsylvania, New
Jersey or Kentucky.
Lester Wolff –Bettor/Fan– Consolidate OTBs, eliminate surcharge, offer
rebates, get a centralized state-wide cable distribution, allow “sub-dollar”
wagering on exotic bets and standardize posting of entries and results.
Michael McKay –Bettor/Fan– Add an additional surcharge to fund a drug
testing / deterrent program. Performing enhancing drugs have ruined the integrity
of the sport.
Larry –Bettor/Fan– OTB clerks should know what race a pick six wager starts
with, they do not always seem to know this and as a result can not help so the
wager can be placed. Clerks do not tell you the total amount of winnings for all
wagers unless specifically asked. Also stated that clerks bet while working and
164

ATTACHMENT XIII
2
sometimes include the cost of some of their wagers to be covered by the next
bettor.
Alanpoobah –Bettor/Fan– OTBs surcharge and take-out is too high, “OTB is a
thieving organization.”
Alan Franks -Bettor/Fan– Aqueduct and Belmont facilities in need of some
repairs and maintenance. Also suggest better access for the fans to view the races.
Skip –Bettor/Fan– The branch on 87th
& 5th
does not open timely and windows
are understaffed, the clerks at the restaurant branch on 4th
ave eat while on duty.
Vince Conti –Bettor/Fan/ and runs NYbred.com– Additional revenue could be made by the State and the industry by selling racing related products (i.e. books on racing / handicapping, t-shirts, Derby paraphenalia etc.) Neil Satterly, Executive Director of SUNY New York Network – Currently the NY Network provides satellite transmission for several of NY’s OTBs but has over the years lost some OTB’s to other providers. The cost for transmission is fixed for this system therefore the cost to the remaining OTBs is increased when one OTB leaves the NY Network system. He suggest that if all the OTBs are required to use this system for satellite transmissions then the cost would be more equitable. Otherwise this service may be lost.
Liz -Bettor/Fan– Requested that NYRA lift its restriction it placed on Nassau
OTB over a dispute regarding Nassau’s in-home simulcasting thereby preventing
Nassau OTB (and Suffolk OTB as well) from showing any racing, including the
Belmont, in-home.
Linda Edwards –Bettor/Fan– A self reported new fan to racing suggests more
marketing, better facilities, particularly Belmont, and less time between races and
or a half time like show to keep people entertained.
Angelo –Bettor/Fan– Suggest either closing all OTBs or lowering the takeout.
Michael Troy –Bettor/Fan– A self described long time bettor suggest allowing
video streaming of races on the internet, reducing services fees for depositing
money in betting accounts, lift restrictions on simulcasting New York tracks over
out-of-state races, allow the cancellation of bets over the internet to give bettors
the chance to change their mind or correct an error.
Gregg Sitrin – Bettor/Fan – Legalize sports betting at OTBs to increase profits.
“More Faves” – Bettor/Fan – OTBs must get sports betting to remain
competitive with Delaware and other states.
Aaron Shapiro – Bettor/Fan – Consolidate the six OTBs into one and work with
NYRA. Also reduce takeout and take care of the bettors. Says the recent dispute
165

ATTACHMENT XIII
3
between NYRA and Nassau OTB that resulted in NYRA pulling the Television
rights to Nassau only frustrates the bettors and hurts NY racing.
Ed – Bettor/Fan – Consolidate all the OTBs and NYRA, allow video streaming
of NYRA races and have one TV channel with live races.
Steve Ende – Bettor/Fan – NYCOTB employees and tellers don’t do their job
and the NYCOTB branches are dirty. Branches should be run like the Nassau
OTB branch in Carle Place.
Jonathan Krangle – Bettor/Fan – Recommends more special events, contests
and give-a-ways, including providing trips to local racetracks.
John Adare – Bettor/Fan – Wants to be able to place parlay wager over the
phone. Nassau OTB currently does not allow parlay wagers to be placed over the
phone.
Aaron Shapiro– Bettor/Fan – Frustrated that he cannot watch NYRA races at
home in Nassau County due to the current dispute between NYRA and Nassau
OTB. Says the only ones being hurt are the fans, that these recent actions are good
for no one and that politicians are costing NYS millions of dollars by not allowing
slots (at Aqueduct).
Robert Gilbert – Bettor/Fan – Recommends reducing the minimum required bet
to 10 or 50 cents so more people will bet. He believes people will be more willing
to make exotic wagers because it will be more affordable. He believes this will
increase handle and revenues.
Robert Massello – Bettor/Fan – Says there is no need for OTBs anymore.
Internet gambling and advance deposit wagering has replaced them.
Ed O’Brien – Bettor/Fan – Doesn’t like Capital OTB’s Television production of
racing and the procedures in place to deposit and withdraw money from his
wagering account. He says NYRA’s account wagering is much better but they do
not offer harness racing (current law does not allow NY thoroughbred tracks to
import harness track signals.) He recommends that NYRA run all wagering in the
State and that all duplicative management, tote systems, TV presentations etc
should be eliminated. There should be one wagering platform. (Mr. O’Brien
works at CBS 6 in Albany but stated that these are his comments, not the
stations.)
Richard Burger – Bettor/Fan – Suggest combining the OTBs with NYRA to
end needless disputes, Nassau OTB branches are much cleaner than NYCOTBs
and lowering the OTB take out.
166

ATTACHMENT XIII
4
Jared Garrick – Bettor/Fan – Says that NYRA, the Racing Commission and
OTB’s need to radically change and make racing and wagering exciting. He sites
several problems:
1. NYRA continuously add more and more NY Bred races with horses with
no racing ability.
2. There is no respect for the fans:
a. Late scratches are made with no explanation
b. $1 trifecta, exactas, Pick 3s and Pick 4s but require $2 bets for Pick
6s. This limits people who will place such bets.
c. No TV or radio coverage of races anymore
3. NY Racing does not promote the intellectual aspect of handicapping while
poker continues to gain popularity in analyzing player’s strategies.
John Moore – Bettor/Fan – There should be only one system and it must be
under common ownership with NYRA. New legislation must provide for
mandatory distribution of the signals to all ADW providers who want to take bets
via computer as well as to all simulcast operators, subject to binding arbitration
within New York State.
Michael Porto – Bettor/Fan – Submitted a 2-part plan to save NYCOTB:
Part I
1. Close all OTB shops (branches) except restaurants and ones like the
one located on 241 Street Bronx. This will save millions in rent,
security, cleaner’s salaries etc.
2. All other bets to be placed via telephone or computer. Winning wagers
to be charged a 5% fee. Restaurant wagers continue to be charged
takeout and surcharge as under current system.
3. Small stores, similar to check cashing operations will have 2 clerks per
6 hour shifts to accept money for wagering, deposits and withdrawals.
Also will sell racing programs at these locations.
4. Instead of showing 20 different races per day show 3 tracks in the
afternoon so there are 3 races every half hour. Do the same in the
evening and offer two races late afternoon early evening (in between
the day time and night races). This will allow customers to more
opportunity to watch the races and wager.
5. Management must be trimmed; there are usually 2 managers per day
(at one branch).
6. Clerks from branches that are closed can work as telephone clerk
operators.
7. Management in the home (central) offices must be trimmed as much as
possible. There is no need for the 100 plus people that work there at
present.
8. There is no need to spend money on (racing) analyst. Players will
wager and don’t need outside advice, the newspaper analysts are more
than enough.
167

ATTACHMENT XIII
5
Part II
1. NYRA must understand they cannot control the racing signals bet in
home and need to stop acting like a dictator.
2. OTBs should close on Monday each week, no OTB employee should
work. This will save millions.
3. OTB restaurants do not have enough business to remain open all week,
they should be open for wagering on Friday and Saturday only.
Charles Vickery – Submitted a spreadsheet comparing US , ADW & NY
handle that he described as showing how NY handle did not decline as drastically
as reported by the Task Force at the June 24, 2009 meeting.
Brian Culnan - A thoroughbred owner, breeder and fan recommends the OTB
operations be turned over to the tracks to eliminate duplication of services and
achieve operating efficiencies. Payments to local governments should remain the
same under this new proposed structure.
Anonymous submission - Recommended that “incompetent” people at OTB
headquarters be fired. New management is needed.
Adam Webster - A self described “large volume gambler” commented on the
poor customer service and management of OTB, specifically at “The Inside
Track” on 2nd
Ave. and 53rd
St. in New York City. He stated he is sometimes
forced to leave, and not bet because he not provided a table.
Tom Cicatello - Believes that there is a conflict of interest with Western OTB
owning and operating Batavia Downs and wants to be able to bet on night time
thoroughbred with them but is unable to as they do not offer it. He also stated that
Western has done little for the City of Buffalo, Westerns facilities outside of the
city are “plush” while the ones in the City need help.
168

ATTACHMENT XIV
1
The Task Force on the Future of Off-Track Betting in New York State
Summary of Comments Received From
Breeders
Jeffrey A. Cannizzo – Executive Director, New York Thoroughbred Breeder’s Inc. - The
breeding program in New York relies on revenues generated from the State’s tracks and OTBs.
As handle continues to decline so do monies for breeder awards. As a result they recommend a
change in statute to allow them to get a share of the simulcast export revenues the tracks make on
selling their signal to out-of-state locations. They also stress the need for the tracks and OTBs to
work together with the breeders and to protect the monies that are set aside for the breeding
program. Lastly the support regulating out-of-state ADW providers who accept wagers from New
York State residents and getting a portion of such handle for the State’s breeding program.
Martin Kinsella – Executive Director, New York State Thoroughbred Breeding &
Development Fund Corp. – There are over 400 breeding farms in NYS and nearly 40,000 acres
of green-space retained by thousands of employees in the thoroughbred breeding industry. The 6
regional OTBs provide the largest revenue source to the fund (approximately 69% of the Funds
revenue). Suggest the following:
Increase the OTB contributions to the Fund to be equal to the contributions made by the
tracks. Currently the OTBs pay .005% of handle to the Fund while the tracks pay .007%.
This would provide and additional $2 million to the Fund.
Currently there is no requirement in law stating when the OTBs and tracks are to pay the
fund yet the fund disburses awards monthly. Some entities have delayed making
payments to the fund and in turn causing cash flow issues for the fund. Therefore suggest
that specific due dates for payments to the fund be added to statute requiring timely
payments.
Suggest that the impact of ADWs accepting wagers from NY residents be carefully
reviewed with the best interest of the State and its Breeding programs in mind.
Peter Goold – Executive Director, Agriculture and New York State Horse Breeding
Development Fund – The NYS OTBs are crucial to the ability of the Fund to perform its mission
as they provide approximately 25% of the Funds total revenues. NYS standardbred population
has increased almost 50% and the average value of a standardbred has increase by 25% thus
creating a positive economic impact in the rural areas of the State. New York’s OTBs must
maintain competitive with various providers to achieve its mission.
Currently there is no requirement in law stating when the OTBs and tracks are to pay the fund yet
the fund disburses awards monthly. Some entities have delayed making payments to the fund and
in turn causing cash flow issues for the fund. Therefore suggest that specific due dates for
payments to the fund be added to statute requiring timely payments
169

ATTACHMENT XV
1
The Task Force on the Future of Off-Track Betting in New York State
Summary of Comments Received From
Horsemen
Standardbred Owners Associations of New York (SOA) - Recommend that
OTBs be required to prominently display races from New York tracks over all
out-of-state races. Alternatively recommend that a consortium of New York
tracks run the OTBs, thereby eliminating conflicting interest the current set up
has. An outline of the plan is provided that recommends each track be authorized
to run a certain number of branches near their facility / in region. The tracks could
take over existing branches in their regions with existing staffing guaranteed for
set time period. The tracks would operate and fund the operations, coordinate
simulcasting (with NY signals getting priority). The State in turn would agree not
to expand VLT gaming any further as well as the pensions of the current OTB
employees. Illinois’s OTB system is referenced as a model to follow to increase
revenues and make the system once more profitable.
The SOA submitted an additional comment on August 17, 2009 objecting to the
public comment from New York City OTB that the distribution formula for
paying statutory fees is broken and they should no longer pay based on a
percentage of handle but rather pay such fees after deduction of all expenses. The
SOA provides examples on the inequity in this proposal such as car dealers only
paying GM for the cost of the new GM car they sell only if the dealer makes a
profit.
Garry Contessa – Thoroughbred Trainer – Says the OTBs are very poorly
managed and are cash cows for their executives. If the tracks don’t want to run the
OTBs the horsemen will. He states that it needs to be run by someone who knows
the business from the bottom up and offers to be that person.
Richard Papa - President, Harness Horse Assoc. of Central New York – Supports the SOA’s “New York First Initiative”, which would place NYS racing
first and help all affected parties in NYS including the tracks, breeders, horsemen,
state/local government and the OTBs.
George Karam – President, Saratoga Harness Horsepersons Association – States they have more than 600 members. The current OTB model has failed.
OTBs refuse to pay money owed to them even after directed so by the courts after
they lost a suit regarding “hold-harmless” provision in the Racing Law. Further
states that OTB operations are “nothing more than patronage hand outs and store
front operations.” Suggest the following:
Create anew entity that eliminates all the state OTBs and replaces it
with new entity
Have the tracks & horsemen associations run the operations like as
done in other states to ensure profitability and protect the NY product.
170

ATTACHMENT XV
2
Allow NY residents to wager from their homes, work etc. via
dedicated OTB channels, land based phones, mobile phones or
computers.
Have one call center or central hub to handle all wagers thereby
eliminating multiple regions and reducing costs.
Mandate the “New York First” Initiative, which simply promotes NY
racing and State residents.
171

ATTACHMENT XVI
1
The Task Force on the Future of Off-Track Betting in New York State
Summary of Comments Received From
Municipalities
Participating
Rockland County – Have seven branch locations, Nanuet, Pearl River, Nyack,
Haverstraw and three locations in Suffern. Have received the following revenues
from OTB:
2004: $2,758,388
2005 $2,800,651
2006 $2,587,447
2007 $1,941,924
2008 $1,587,195
Offered no recommendations.
Niagara County – First response - Receives approximately $230,000 annual
revenue from OTB that is used to reduce the County property tax levy. After
speaking to their county representative on Western OTB’s board a second
response was provided stating that Western OTB is forced to make “welfare”
payments to instate tracks who are profitable VLT operators. Over the past 35
years Niagara County received over $17,892,653 from OTB. They have five
branches with thirty-four jobs that have paid nearly $33,061,446 in wages and
benefits since its inception. They also state that Western OTB pays real estate
taxes and ad valorem taxes on their branches and locations and virtually negated
illegal wagering on horse races.
Offered no recommendations with their first response but did provide the
following recommendations with their second response:
Change statute to allow OTBs to make statutory distributions after
payment of operating expenses,
Repeal maintenance of effort payments,
Eliminate dark day payments,
Reduce the regulatory fee used to fund the Racing and Wagering
Board by 50%,
Either prohibit out-of-state ADWs from accepting wagers from New
York residents or require them to be licensed and regulated like the
OTBs including the requirements of statutory distributions that are
equal or greater than the ones the NY OTBs are required to make.
Wayne County – There is one location within the County in the Village of Newark
that employs seven individuals. They provide payroll and revenue figures from the
inception of OTB through 2008 and also stated they received the following:
2006 - $56,236
2007 - $73,099
2009 - $96,411
172

ATTACHMENT XVI
2
They recommend that the current structure for the distribution of statutory monies
be reversed from the current form where statutory payments are made prior to
paying operational expense to allowing the OTBs to pay its operating expenses
first then paying any statutory amounts from any remaining funds. They also state
they oppose any changes that would diminish the amount of revenue that is
distributed to Wayne County.
Sullivan County – States that since joining OTB in 2005 they have seen annual
benefits of approximately $330,000 be reduced to $216,000 as a result of changes
in law by the State to confiscate regulatory costs, authorized and tolerated slot
machines and out of state ADW to poach business and bets from OTB.
These problems can be mitigated by supporting Catskill OTBs 2009 Legislative
Plan including “Keep New York money in New York, Out of state Internet and
Account wagering operators should be blocked and or licensed and required to
pay fees to the counties and industry.
Further stated that the State has done nothing since it took over NYCOTB and
now threaten to consolidate OTB operations which would be a detriment to
Sullivan County.
Genesee County – They have 2 Western OTB branches in their county that
provides 47 jobs. They provide payroll and revenue figures from the inception of
OTB through 2008. Also as a hosting community for an OTB/Race Track the
county, City of Batavia and Town of Batavia receives approximately $500,000 in
their general fund and has about 300 employees contribute to their local economy.
They state that Western OTB has made the following recommendations that if
enacted would assure their profitability:
The current structure for the distribution of statutory monies be reversed
from the current form where statutory payments are made prior to paying
operational expense to allowing the OTBs to pay its operating expenses
first then paying any statutory amounts from any remaining funds.
Repeal the “Maintenance of Effort” provisions that have resulted in
“welfare” payments to the “unneedy”.
Eliminate “Dark Day” “welfare” subsidies they pay the tracks.
Require an industry wide application of the Regulatory fee and reduce it
from .5% to .25%. (This appears to mean to apply the fee to ADWs.)
License out of state ADWs and require them to pay same statutory
payments as the OTBs. The current model provides for unfair competition.
OTBs should be allowed one site each for operation of video lottery
gaming.
Genesse County also submitted Resolution 276 dated 09/11/09 that lists all of the
benefits they have enjoyed (distributions, jobs etc.) as being a member county for
Western OTB and that they have been told that the Task Force’s
recommendations have been “pre-ordained” to dissolve the regional OTBs and
consolidate them so that the participating counties no longer receive distributions
from them. The resolution resolves:
173

ATTACHMENT XVI
3
They will not support any recommendations the Task Force make that
would change the current OTB structure,
They support Western OTBs legislative efforts to increase distributions,
Their stake in OTB be protected.
Fulton County – Recommends improving the revenue stream for local
governments by correcting the current model that requires their OTB, Capital
OTB to subsidize a privately owned harness track that has generated billions of
dollars in VLT handle since its inception. Also recommends:
Licensing out of state ADWs and requiring them to pay same statutory
payments as the OTBs
Repeal Maintenance of Effort payments to harness tracks
Repeal Dark Day payments that benefit tracks for not racing.
Allow OTBs to retain unclaimed winning tickets
Increase the NYRA takeout. The reduction in 2001 was a mistake that hurt
the OTBs and NYRA.
Steuben County – Stated they obtained detailed information from Western OTB
regarding this matter and provided a copy of the financial and statistical
information with their response. Provide the following:
Current law requires Western OTB to pay “welfare” payments to the NY
tracks that can exceed the revenue OTB makes on the NY tracks races.
Now that the tracks have video gaming such subsidies are no longer
needed.
Western OTB has 2 branches that provide 14 jobs that contribute the local
economy. They provide payroll and revenue figures from the inception of
OTB through 2008.
They state that Western OTB has made the following recommendations that if
enacted would assure their profitability:
The current structure for the distribution of statutory monies be reversed
from the current form where statutory payments are made prior to paying
operational expense to allowing the OTBs to pay its operating expenses
first then paying any statutory amounts from any remaining funds.
Repeal the “Maintenance of Effort” provisions that have resulted in
“welfare” payments to the “unneedy”.
Eliminate “Dark Day” “welfare” subsidies they pay the tracks.
Require an industry wide application of the Regulatory fee and reduce it
from .5% to .25%. (This appears to mean to apply the fee to ADWs.)
License out of state ADWs and require them to pay same statutory
payments as the OTBs or not allow them to accept wagers from NYS
residents. The current model provides for unfair competition.
OTBs should be allowed one site each for operation of video lottery
gaming.
Steuben County also submitted Resolution 162-09 dated 10/26/09 that lists all of
the benefits they have enjoyed (distributions, jobs etc.) as being a member county
for Western OTB and that they have been told that the Task Force’s
174

ATTACHMENT XVI
4
recommendations have been “pre-ordained” to dissolve the regional OTBs and
consolidate them so that the participating counties no longer receive distributions
from them. The resolution resolves:
They will not support any recommendations the Task Force make that
would change the current OTB structure,
They support Western OTBs legislative efforts to increase distributions,
Their stake in OTB be protected.
Schuyler County - Submitted Resolution 319 that was adopted on 10/13/09 that
lists all of the benefits they have enjoyed (distributions, jobs etc.) as being a
member county for Western OTB and that they have been told that the Task
Force’s recommendations have been “pre-ordained” to dissolve the regional
OTBs and consolidate them so that the participating counties no longer receive
distributions from them. The resolution resolves:
They will not support any recommendations the Task Force make that
would change the current OTB structure,
They support Western OTBs legislative efforts to increase distributions,
Their stake in OTB be protected.
Chautauqua County - Submitted Motion No. 10-09 that was adopted on
September 23, 2009 that lists all of the benefits they have enjoyed (distributions,
jobs etc.) as being a member county for Western OTB and that they have been
told that the Task Force’s recommendations have been “pre-ordained” to dissolve
the regional OTBs and consolidate them so that the participating counties no
longer receive distributions from them. The resolution resolves:
They will not support any recommendations the Task Force make that
would change the current OTB structure,
They support Western OTBs legislative efforts to increase distributions,
Their stake in OTB be protected.
Rensselaer County – Currently have nine (9) Capital OTB branches within the
county and OTB generates an important source of revenue for the county. County
revenue from OTB has gone from $878,000 in 2001 to about $406,000 in 2008.
Stated that they understand this decrease is due to various legislation that has
adversely affected OTB operations. Recommend consolidation of OTBs, which
they understand the task force is considering should be done to the extent it
enhances the racing industry and protects revenue stream from OTBs that the
counties rely on.
Livingston County - They have 1 Western OTB branches in their county that
provides 15 jobs. They provide payroll and revenue figures from the inception of
OTB through 2008. Believe the OTB system should stay “as is” with some
changes to regulations that would reduce payments to harness tracks.
175

ATTACHMENT XVI
5
Suffolk County – Suffolk OTB employees 320 individuals that contribute the
local economy and taxes. They operate14 branches and 13 Quick bet locations.
Revenue to Suffolk County from OTB in 2008 was $2,299,051, which is a
57.75% decrease from 1998 revenues. Since 1999 arrest for gambling in Suffolk
County has been reduced by over 30%.
The County supports legislation that would decrease OTB payments to the
industry and increase payments to local governments.
Suffolk County also submitted a letter signed by all eighteen legislatures that
describes the benefits they have enjoyed (distributions, jobs etc.) from Suffolk
OTB. They state that:
They will not support any recommendations the Task Force make that
would change the current OTB structure,
They support Suffolk OTBs legislative efforts to increase distributions,
City of Albany – The City has a positive working relationship with Capital OTB
who employs many City residents. OTB has produced from $349,973 in 2005 to
$270,198 in 2008 of revenue for the City. Supports the following proposals to
restore OTB’s strength and increase revenue:
End Statutory Payments to the Harness Tracks
Allow VLTs at OTBs
Level the Playing Field for OTBs by licensing and taxing ADWs
Provide VLT revenue sharing agreement with host municipalities
Non-Participating
Schoharie County – There is no OTB in the county and therefore does not
know the current impact OTB has on them.
Recommends:
Sharing revenue from OTB statewide to all counties (participating and
non-participating) will increase statewide cooperation and gain
support.
Distribute annual report to all counties to convey a real picture of what
OTB does to benefit each municipality. Include in such report how the
OTBs help strengthen the racing and breeding industries in the state.
Make OTB facilities conveniently located to provide access to more
people to increase revenues. Suggest increasing the number of betting
locations but not one on every corner.
City of Yonkers – There are no OTBs in the city itself but there are several
branches that are very close. They report that as currently structured and
authorized OTB has no impact on the City of Yonkers.
Recommend:
As the host City to the Empire Casino at Yonkers Raceway the City of
Yonkers is not in favor of bills S.4588 / A.8211 that would permit OTBs
176

ATTACHMENT XVI
6
to host video lottery terminals. The City states that video lottery
terminals should only be placed at designated racetracks and that while
“store-front” casinos’ may produce some additional revenue, it would
not be in the best interest of New York’s residents.
177

ATTACHMENT XVII
1
The Task Force on the Future of Off-Track Betting in New York State
Summary of Comments Received From
OTBs
Capital District Regional Off-Track Betting:
CURRENT IMPACT:
Employs 300 people of which 200 are AFSCME Union members.
Has reduced expenses over $2 million in last four years and continues to
cut costs.
Operates and owns its own TV station that makes horse racing available to
over 300,000 people.
Pioneered the EZ Bet concept to cut cost and reach new fans.
Has partnered with NYCOTB and NYRA during the Saratoga season to
promote racing.
Has aggressively engaged in new innovations such as Internet wagering
and live video streaming on the Internet.
RECOMMENDATIONS:
Provided a copy of the 2009 OTB Omnibus Bill that that Suffolk OTB also
submitted as well as copies of approximately 300 letters from Capital OTB
employees to their State legislative representatives requesting they support the
bill. Stated they supported the bill (which is described in detail in the
summary of Suffolk OTB’s submission below) however listed the following
in their response:
The OTBs need to maintain local control so they can obtain input on many
issues.
Single tote system for all 6 regional OTBs
Statewide TV Station that cable companies would be legislatively required
to provide at no cost.
Legislative action described in the 2009 OTB Omnibus Bill.
Eliminate the hold harmless payments to the tracks.
Authorize VLTs at OTBs.
Enhance and coordinate marketing efforts with all OTBs and NYS tracks.
MORITORIUM ON LONG TERM CONTRACTS:
Cited several reasons why abiding by the Task Force’s request to
not enter into long term contracts until the Task Forces mission is
complete and respectfully declined to do so. The main reason
provided is that they believe it would detrimental to the
corporation’s bottom line.
Additional Comment – June 30, 2009 – Stated that Capital OTB should not be
portrayed as “top heavy” with management as they felt was done at the Task
Force’s June 25, 2009 meeting. Information was provided that reports that by
promoting individuals in the company and not filling the Executive Vice
178

ATTACHMENT XVII
2
Presidents position that they achieved a $108,500 savings. In addition they have
cut cost over the past several years and now have the lowest corporate wages in
22 years.
Second Additional Comment – June 30, 2009 – Provided copies of a form letter
signed by 15 Capital OTB patrons. The comments are supportive of the
promotions, Internet wagering, cash rewards and general customer services. The
individuals who signed the letter are:
1. Rick Caputo
2. Vincent Arduini
3. Bob Schere
4. Rick Alfred
5. Andrew Weir
6. Miles Bailey
7. Don Matusik
8. Roddy Valente, Horse owner
9. Stew Boschwitz
10. Todd Dugan, Horse owner
11. Ron Mutch
12. Cos Cavallo
13. Carl Stowell
14. Alan Boulant, Horse owner
15. Gordon Mayo
Third Additional Comment – July 2, 2009 – Copies of resolutions that were
passed in 2004 and 2005 from the following Capital OTB participating
municipalities were provided requesting state legislation to assist Capital OTB,
allow VLT’s at OTBs and repeal certain legislation such as the hold harmless
provision:
City of Schenectady – Supportive of VLTs (2004)
Cortland County - Supportive of VLTs (2004)
Madison County - Supportive of VLTs (2004)
Clinton County - Supportive of VLTs (2004)
Oneida County - Supportive of VLTs (2004)
Fulton County - Supportive of VLTs (2004)
Intercounty Legislative Committee of the Adirondacks
(Representing the Counties of Clinton, Essex, Franklin, Fulton,
Hamilton, Herkimer, Lewis, St. Lawrence, Saratoga, Warren and
Washington) - Supportive of VLTs (2004)
Montgomery County - Supportive of VLTs (2004)
St. Lawrence County - Supportive of VLTs (2004)
Warren County - Supportive of VLTs (2004)
Warren County – Authorize $1,000 paid from Capital OTB to be
distributed to the Warren County Soil and Water Conservation
District for the Envirothon Program.
Herkimer County - Supportive of VLTs (2004)
Greene County - Supportive of VLTs (2004)
Rensselaer County - Supportive of VLTs (2004)
179

ATTACHMENT XVII
3
Washington County - Supportive of VLTs (2004)
Franklin County - Supportive of VLTs (2004)
Essex County - Supportive of VLTs (2004)
Columbia County - Supportive of VLTs (2004)
Warren County – Opposes State Tax on OTB handle (2005)
Fulton County – Eliminate Hold Harmless provisions, increase
takeout on NYRA races, increase breakage, authorize Internet
betting, and reduce State Taxes on OTB handle. (2005)
Warren County - Eliminate Hold Harmless provisions, increase
takeout on NYRA races, increase breakage, and authorize Internet
betting. (2005)
Warren County – Repeal regulatory fee, require an OTB
representative be on the NYRA Board, reduce or eliminate hold
harmless provisions, include hold harmless payments to be made to
Capital OTB from Turning Stone Casino and Saratoga Harness,
mandate special smoking rooms for OTB parlors. (2004)
St. Lawrence County - Repeal regulatory fee, require an OTB
representative be on the NYRA Board, reduce or eliminate hold
harmless provisions, include hold harmless payments to be made to
Capital OTB from Turning Stone Casino and Saratoga Harness,
mandate special smoking rooms for OTB parlors. (2004)
Montgomery County - Repeal regulatory fee, require an OTB
representative be on the NYRA Board, reduce or eliminate hold
harmless provisions, include hold harmless payments to be made to
Capital OTB from Turning Stone Casino and Saratoga Harness,
mandate special smoking rooms for OTB parlors. (2004)
Clinton County - Repeal regulatory fee, reduce or eliminate hold
harmless provisions, include hold harmless payments to be made to
Capital OTB from Turning Stone Casino and Saratoga Harness,
mandate special smoking rooms for OTB parlors. (2004)
Rensselaer County - Repeal regulatory fee, require an OTB
representative be on the NYRA Board, reduce or eliminate hold
harmless provisions, include hold harmless payments to be made to
Capital OTB from Turning Stone Casino and Saratoga Harness,
mandate special smoking rooms for OTB parlors. (2004)
Fulton County – Repeal regulatory fee, require an OTB
representative be on the NYRA Board, reduce or eliminate hold
harmless provisions, include hold harmless payments to be made to
Capital OTB from Turning Stone Casino and Saratoga Harness,
mandate special smoking rooms for OTB parlors. (2004)
Columbia County - Repeal regulatory fee, require an OTB
representative be on the NYRA Board, reduce or eliminate hold
harmless provisions, include hold harmless payments to be made to
180
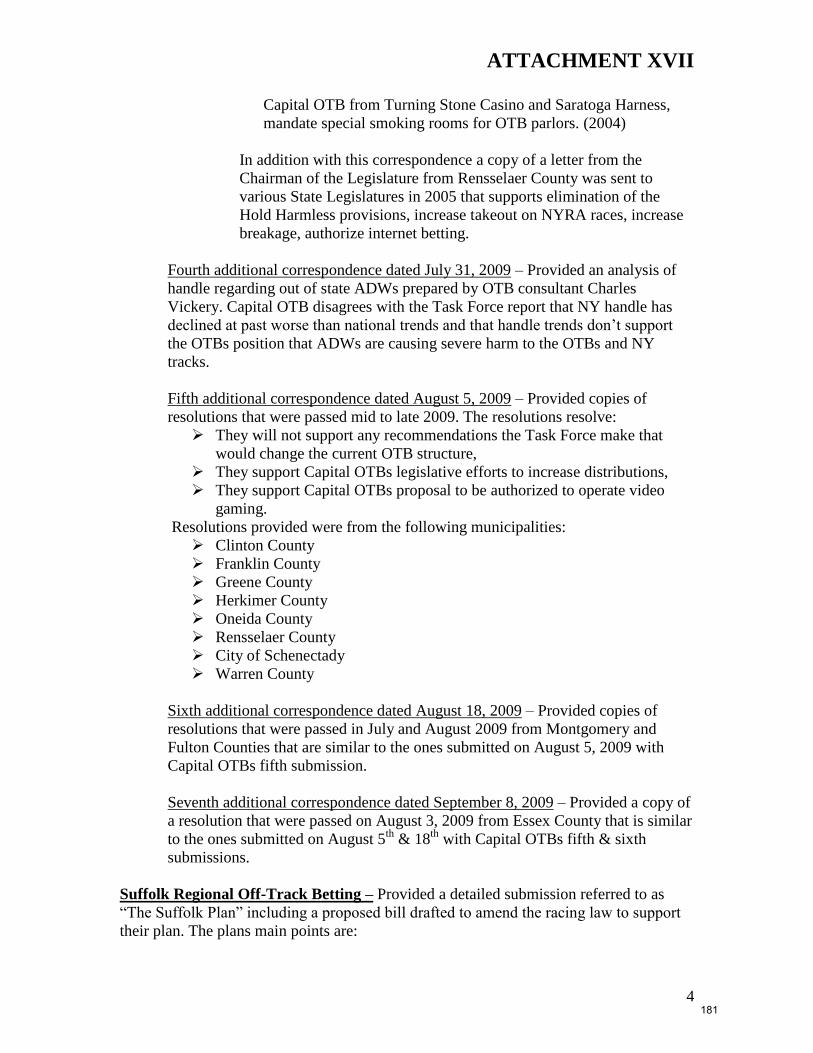
ATTACHMENT XVII
4
Capital OTB from Turning Stone Casino and Saratoga Harness,
mandate special smoking rooms for OTB parlors. (2004)
In addition with this correspondence a copy of a letter from the
Chairman of the Legislature from Rensselaer County was sent to
various State Legislatures in 2005 that supports elimination of the
Hold Harmless provisions, increase takeout on NYRA races, increase
breakage, authorize internet betting.
Fourth additional correspondence dated July 31, 2009 – Provided an analysis of
handle regarding out of state ADWs prepared by OTB consultant Charles
Vickery. Capital OTB disagrees with the Task Force report that NY handle has
declined at past worse than national trends and that handle trends don’t support
the OTBs position that ADWs are causing severe harm to the OTBs and NY
tracks.
Fifth additional correspondence dated August 5, 2009 – Provided copies of
resolutions that were passed mid to late 2009. The resolutions resolve:
They will not support any recommendations the Task Force make that
would change the current OTB structure,
They support Capital OTBs legislative efforts to increase distributions,
They support Capital OTBs proposal to be authorized to operate video
gaming.
Resolutions provided were from the following municipalities:
Clinton County
Franklin County
Greene County
Herkimer County
Oneida County
Rensselaer County
City of Schenectady
Warren County
Sixth additional correspondence dated August 18, 2009 – Provided copies of
resolutions that were passed in July and August 2009 from Montgomery and
Fulton Counties that are similar to the ones submitted on August 5, 2009 with
Capital OTBs fifth submission.
Seventh additional correspondence dated September 8, 2009 – Provided a copy of
a resolution that were passed on August 3, 2009 from Essex County that is similar
to the ones submitted on August 5th
& 18th
with Capital OTBs fifth & sixth
submissions.
Suffolk Regional Off-Track Betting – Provided a detailed submission referred to as
“The Suffolk Plan” including a proposed bill drafted to amend the racing law to support
their plan. The plans main points are:
181

ATTACHMENT XVII
5
Creation of an umbrella, Service corporation consisting of the 6
independent OTBs (maintain local autonomy to the independent corps to
deal with branch locations, union issues other matters having to do with
specific branch location issues.)
Development and implementation of a state-wide tote-system
Development and implementation of one upstate and one downstate
telephone wager center
Establishment of a statewide “OTB/Racing” cable television station
Development and implementation of a statewide internet wagering site for
use by all NYS OTBs
Development and implementation of a statewide branding and marketing
effort
Development and implementation of a shared purchasing policy for all
OTBs.
Eliminate maintenance of effort payments to privately owned harness
tracks
Eliminate dark day payments to privately owned harness tracks
Require out-of-state ADW companies to pay the same statutory and
regulatory fees as OTBs.
Require licensing of ADWs and modify required account wagering
procedures (currently addressed by rule) into statute.
Remove restriction on wagering on Palm Sunday
Make statutory payments after operational expense based on percentage of
take instead of handle.
Either completely eliminate all regional statutory payments to tracks or
reduce such payments by 50% and require all remaining payments to be
made to purses.
Amend Section 516 of the Racing Law to allow carry over of losses from
one quarter to the next to apply to subsequent quarter’s profit.
Amend current in-home simulcasting restrictions to free up the ability for
in home distribution including video streaming provided the approval of
the Regional OTB.
Authorize VLTs at OTBs and include authorization for video lottery table
games.
The OTBs should have free and unimpeded access to the simulcasting of
each NYS track.
The Racing & Wagering Board should audit each track to determine
whether each track has passed through to the horsemen those OTB funds
they have been statutorily required to.
Each OTB should be authorized to open additional teletheaters.
MORITORIUM ON LONG TERM CONTRACTS:
Cited several reasons why abiding by the Task Force’s request to
not enter into long term contracts until the Task Forces mission is
complete and respectfully declined to do so. The main reason
provided is that they believe it would detrimental to the
corporation’s bottom line.
182
ATTACHMENT XVII
6
Nassau Regional Off-Track Betting – Provided a thirteen-page submission
however requested it be exempt from public disclosure. The submission was
returned and a request for a submission for public disclosure was made.
A second submission was made on June 30, 2009 without a request for exemption
from public disclosure. Nassau reported the contributions it made to Nassau
County, the State and racing since its inception and noted they employ 315
individuals and continue to streamline operations through the use of technological
innovations. As the industry has been changing Nassau has reduced the number of
branches but has increased branch size and concentrated on amenities. Nassau has
also turned its focus to account wagering, the fastest growing segment of
wagering in horse racing. They are the first OTB to provide video streaming to
their Internet wagering customers (located in Nassau County) and launched a
reward program all for customer convenience. They also developed a restaurant /
branch program to reach more customers and host / promote many events
regarding NY racing and wagering activities.
Nassau and Suffolk OTB jointly operate a telephone wagering facility that
provides a cost savings to both and suggest the Task Force consider such a model.
They claim that the Racing Law they are forced to follow is outdated and the
revenue and distributions requirements are not in conformity with generally
accepted accounting principles (GAAP). As a result they recommend:
1. Eliminate Racing Law Sections 1016 and 1017 payments
2. Eliminate 2% tax on out-of-state thoroughbred handle after 7:30 pm over
$100 million.
3. Allow the OTBs to receive a credit for uncashed winning tickets turned
over to the State against the regulatory fee they pay
4. Eliminate pari-mutuel taxes on tele-theatre handle
5. Eliminate requirement for simulcast agreement with regional tracks
6. Eliminate regional track designation for tracks more than 50 miles from
Nassau County (except NYRA tracks)
7. Change maintenance of effort calculations to be based on composite
amounts not individuals track levels
8. Give the OTBs the right to approve any in-state track’s agreement to
export to an out-of-state entity
9. Reduce minimum pay on wagers from .05 to .025 per $1 ($2.05 minimum
on $2 Wager).
Nassau drafted the New York Racing Initiatives program in 2005 with the intent
of improving cooperation between the State’s OTBs and NYRA and believes
much of that program would be useful today. They suggest that the NY tracks
need to re-invest in their infrastructure and explore running nighttime
thoroughbred races. In addition field sizes should have a required minimum and
VLT monies should “seed” Pick Four and Pick Six pools to entice more wagering.
Backstretch conditions must be improved and better enforcement is needed to
rebuild the integrity of racing.
Suggest that NYRAs’ takeout could be increased and money could be diverted to
the New York Racing Initiatives Fund. The Initiatives program also includes a
183

ATTACHMENT XVII
7
call for statewide platform for Internet, Player Reward, Television & Account
Wagering.
Statutory and regulatory payments should be reduced and some monies should be
redirected to the Initiatives program.
Out-of-State ADW’s should be prohibited from accepting wagers from NY
residents unless they are licensed and regulated by NYS and pay the same
statutory payments as the NY OTBs.
Suggest that the State join the federal lawsuit to legalize sports betting and
authorize the OTBs to offer sports betting as they have the systems in place to
handle such activity. Nassau also suggests that VLTs be approved for the tele-
theatres.
MORITORIUM ON LONG TERM CONTRACTS:
Cited several reasons, very similar to Capital’s why abiding by the
Task Force’s request to not enter into long term contracts until the
Task Forces mission is complete and respectfully declined to do
so. The main reason provided is that they believe it would
detrimental to the corporation’s bottom line.
Catskill Regional Off-Track Betting – Provided some financial / statistical
information that reports Catskill OTB as the most efficient OTB in the
state with highest revenues to participating municipalities and lowest
expenses. Also provided a summary of several events that have caused
diminishing returns to municipalities such as the Racing Board
authorizing rebates, the opening of Tioga Downs and the new Yonkers
Raceway, New Jersey OTB beginning operations, out of state ADWs,
poor economy and no Triple Crown winner.
RECOMMENDATIONS:
Repeal Section 1017-a(2)(a) and (b) – the hold harmless and
maintenance of effort payments to harness tracks.
Return unclaimed winning tickets to the OTBs to distribute to
member counties.
Require cable TV to provide public access racing channels.
Eliminate regulatory fee or spread it across “all handle” or at least
cap it.
Eliminate regional payments to tracks with VLTs.
Eliminate consent by tracks over OTBs.
Authorize OTBs to retain surcharge payable to local governments
where a track is located if such track has VLTs.
Prohibit or license out of state ADWs
If out of state ADWs are permitted to accept wagers from NYS
resident then assess them a 2.5% “source market fee” and require
them to pay same statutory payments as NYS OTBs.
Authorize 500 permanent or experimental VLTs for each OTB to
be installed at one or more facilities each.
184

ATTACHMENT XVII
8
Require any racino payments enacted to be paid as “host
community” fees to be paid to the regional OTB for distribution to
the host communities.
Based on the above Catskill OTB projects it will gain $51,870,000 in
additional distributions to participating municipalities plus another
$87,500,000 in host community fees for VLTs at OTBs with $58,300,000
to be raised for Education.
MORITORIUM ON LONG TERM CONTRACTS:
Cited several reasons, very similar to Capital’s why abiding by the Task
Force’s request to not enter into long term contracts until the Task Forces
mission is complete and respectfully declined to do so. The main reason
provided is that they believe it would violate their fiduciary responsibility.
Second Response – Some comments received by the Task Force are “wild-eyed
ideas”. It is “ILL ADVISED” to allow the take over of OTBs by the bankrupt
NYRA or failed harness tracks. . “How dare any respectable respondent or task
force member even imagine such an idea.” There is nothing wrong with the
management of OTBs or their regional concept, it’s the laws that have failed
them. He recommends:
A. Repeal Section 1017-a(2)(a) of the Racing Law, the hold harmless
provision that requires OTBs subsidize harness tracks/VLT vendors that
compete against OTBs.
B. Repeal Section 1017-a(2)(b) of the Racing Law, the maintenance of effort
provision that requires OTBs to subsidize the same tracks as above.
C. Eliminate regional designation and payments to tracks with VLTs
D. Eliminate consent by tracks over OTB, says this could save millions.
E. Prohibit or license out of state ADWs. If licensed they must pay same fees
as OTB does and an out of state source market fee of 2.5%
F. Amend cable TV stations to require 2 channels with each franchise
agreement for the use of OTB in promoting NY racing.
Further states the Task Force could help facilitate a joint marketing program and
joint services (tote, internet & telephone wagering platforms) with required
participation of all NY OTBs and tracks.
Third Additional Comment – July 27, 2009 – Calls upon the Task Force to
recommend regulating out of state ADWs if the Attorney General finds that it is
legal for them to take bets from NY residents and to recommend that the out of
state ADWs be criminally prosecuted if it is found that such practice is illegal.
Catskill OTB also strongly criticized the handle analysis presented at the Task
Force’s June 24th
meeting and concludes that the OTBs are doing a good job.
Recommends that the OTBs be allowed to operate VLTs and that the Task Force
facilitate a statewide marketing program and joint services platforms such as
totalisator, internet& telephone account wagering for all OTBs and tracks in the
State.
Fourth Additional Comment – September 1, 2009 – Criticizes some Task Force
comments at previous meetings that some OTBs don’t promote the sport enough.
185

ATTACHMENT XVII
9
Recommends that the regulatory fee the OTBs pay be reduced by amounts spent
to promote racing.
Fifth Additional Comment – October 27, 2009 – The New York OTB model is
the best model anywhere, not the worst, as it is often described. What separates it
from others is that is required to provide revenue for the support of government
while other OTBs systems in other jurisdictions only purpose is to support racing.
The NY OTBs have provided $2.8 billion to local governments, nearly $1 billion
to the State and more than $3.8 billion to support the racing industry. Monies
must not be diverted from local governments to failed track owners.
Western Regional Off-Track Betting – State they have a unique perspective as an OTB
and harness track/VLT operator. While financially strong as a result of the VLT
operations they offer the following recommendations:
Hold harmless payments are no longer necessary as well as several other similar
payments.
Fundamental problem such as paying beneficiaries under Racing Law Section 527
before OTB operational expenses must be addressed.
They stated that they will rely upon the tracks and OTBs to more specific as to
their respective recommendations, which they state would “unquestionably
agree”.
MORITORIUM ON LONG TERM CONTRACTS:
No response was offered on this.
New York City Off-Track Betting – Contacted the Task Force after the June 24th
Task
Force meeting stating they were working on the submission but it would be a couple days
late. The Task Force was than later advised that NYC OTB would make no submission to
the Task Force as they work on their (at the time) pending bankruptcy reorganization
plan. After several correspondences NYCOTB chairman Meyer Frucher provided a
submission to the Task Force dated October 19, 2009. Mr. Frucher stated that the work
they are doing is “discrete in nature” and is “entirely separate and distinct form the Task
Force’s mission”. Mr. Frucher also stated that while Chapter 115 of the laws of 2008
provided them some limited legislative relieve, it was not enough. The governor issued
Executive Order No. 27 authorizing NYCOTB to file a petition for reorganization under
Chapter 9 of Title 11 of the US Bankruptcy code. As a result NYCOTB has been focused
on their pending bankruptcy and has not been able to focus on providing information to
the Task Force. A copy of Mr. Frucher’s testimony to the Senate Racing Committee on
August 25, 2009 was provided and he again declined to appear before the Task Force as
he continues sensitive discussions relative to NYCOTBs bankruptcy.
186

ATTACHMENT XVIII
1
The Task Force on the Future of Off-Track Betting in New York State
Summary of Comments Received From
Totalisator Providers
AmTote – (Tote provider for NYCOTB and Buffalo Raceway)- They earn revenues
from NYS racing operations in two ways, as a provider of tote services and ITW interface
fees with locations that don’t use AmTote.
Expressed concern of the “increased political momentum” of placing the cost of
monitoring tote activities on the tote company. Believes cost is a major issue.
Support regulating ADW providers that have customers in NYS just as current
state operators are.
Believes concentration should be on increasing revenues and not on cost cutting.
Ideas to increase revenue are:
o Ease account sign-up for ADWs
o Enable casual cell phone based wagering
o Ease expansion of restaurant/pub/convenience store OTB outlets
o Ease introduction of new super exotic wagers targeted at the non-
traditional horse wagering customer.
Believes that consolidation of tote services under one provider will not produce
significant savings. States that 86% of tote cost is from staffing and paper which
will not change with consolidations and that 91% of capital cost are terminals and
outlet-based equipment that will also not change as a result of consolidation.
United Tote – (Tote provider for NYRA, Capital OTB, Western OTB, Batavia
Downs, Finger Lakes, Tioga Downs and Vernon Downs) – States that the NY OTBs
were originally intended to enlarge the market areas of the tracks and enhance customer
service. However they have become competitors with the tracks and their operations are
imbalanced by regulatory impositions.
Suggest the tracks and OTBs consolidate resources and their governance to
increase profitability.
Consolidation of some or all of the 6 OTBs would reduce the cost of operations,
increase technical efficiency, improve regulatory capabilities and efficiencies and
vastly enhance customer experience. Provides several examples of duplicate cost
including the fact that ITW interface fees would no longer be required. ITW
interface fees are typically .15% of handle (about $4 million per year) and that
personnel cost are about half of one percent of handle. One central system would
also present huge cost savings for Internet account wager platform and allow
customers to use their accounts at any NYS location, which currently cannot be
done.
States that fewer systems handling larger volumes of data provides for bettor
regulatory control and will lower costs for 3rd
party monitoring of the systems.
Suggests that consolidating NYCOTB tote system with Capital and Western
OTBs massive efficiencies can be achieved. Even more could be done if Catskill
OTB were to join. They do not recommend mandating such consolidation but
rather establishing a consolation plan that addresses long-term costs and benefits.
187

ATTACHMENT XVIII
2
Other regulatory suggestions include:
o Eliminate surcharge on winnings
o Eliminate other breed and time of day restrictions including restrictions
on thoroughbred and harness.
o Eliminate subsidies payments that some entities are currently forced to
pay others, frequently their competitors.
o Aligning ADW operations with the tracks into a source-based model.
Believes that NYS should regulate out-of-state ADWs, including United Tote’s
parent company Youbet.com however there should be no newly created fees and
taxes imposed on such entities. United Tote believes that such additional fees
would artificially suppress the largest growth for NYS track handle (ADWs) and
therefore cause an adverse effect on them. Furthermore other jurisdictions may
follow suit, which will in turn further suppress handle particularly on NYRA
races.
Recommendation to optimally utilize the OTB system are:
1. Provides specific ideas on the form of a single Statewide OTB, its
directors and regulatory structure.
2. Promote NY racing as a whole and have the OTBs operate as an
extension of the tracks, they way it was intended. Says the image of OTB
is tarnished and needs to be “re-branded”.
3. Combine live teller operations into a single service based system so there
is one provider that can be accessed throughout the State.
4. License ADW’s to ensure security and protection to the bettors and not
create market manipulation protectionism.
Scientific Games Racing LLC – The key to a healthy horse racing industry is
distribution and the OTBs are the primary way to achieve this. Believe the NYS OTBs
are at an unfair competitive disadvantage to out of state ADWs and that this situation
should be addressed. They recommend the New Jersey model for regulating ADWs be
explored. They support legally compliant measures to increase handle and suggest OTB
models in other countries such as Sweden, UK, France and the Dominican Republic be
studied for ideas on ways to increase distribution and handle in New York. They believe
that tote operators, because of the nature of the business, can provide useful information
in this area and appreciate the opportunity to do so.
188

ATTACHMENT XIX
1
The Task Force on the Future of Off-Track Betting in New York State
Summary of Comments Received From
The Tracks
Buffalo – OTB’s contributed to decline in NY racing by continued bickering,
unwarranted competition between entities, inconsistently maintained
facilities, divergent presentation of product, unenthusiastic employees,
poorly maintained facilities, confusion by patrons regarding such issues as
surcharges, telephone & internet wagering, rebates, track signals offered,
out-of-state jurisdictions taking advantage of situation with discriminatory
pricing and “poachers” (national internet & telephone wagering operators)
providing player incentives for which NYS cannot compete.
Buffalo receives approximately $1.2 million annually, most of which
comes from Western OTB and is equally split with the horsemen. This
represents 40% of Buffalo’s total income of which about half
($580,000) is derived from out-of-state harness, $100,000 from “dark
Day” and the remainder from “regional” and “direct” payments.
Buffalo receives no “maintenance of effort” payments as Western
OTB does not offer nighttime thoroughbred. Income at Buffalo has
declined steadily for years.
The impact of the decline in racing revenue has had on purses has been
offset by VLT contributions which represent 76% of purses earned.
11% of the total purse money comes from OTB.
In-home simulcasting and the 25 surrounding OTB branches has had a
negative impact.
Western OTB refused to show Buffalo races in Monroe County, which
again hurt them.
Buffalo cannot compete with Western OTB or the national ADWs.
The various monies the OTBs pay to the NY tracks (dark day, out-of-
state Harness, Maintenance of effort, direct commissions and regional
commissions) are relied upon by the tracks and horsemen. A complete
analysis must be performed before proposing any changes to the
distributions methods so not to enrich the OTBs and possibly injure
the tracks or horsemen.
The OTBs have joined together as a “buying co-op” so they can obtain
favorable rates from out-of-state tracks. As a result the rates the OTBs
pay is about half then the rates the NY tracks pay. Buffalo has been
told they could not participate in the OTB buying co-op.
FUTURE ROLE / RECOMMENDATIONS:
Need legislation to create a statewide Tote hub; statewide
satellite/decoder communications network and require all tracks and
OTBs to participate.
Create a statewide television network for all OTBs and NY tracks with
a regional approach.
189

ATTACHMENT XIX
2
Create a statewide Internet and telephone wagering network for all
OTBs and tracks and establish regionalized distribution of revenues.
Need legislation requiring all out-of-state host fees paid by NY tracks
and OTBs be negotiated as one statewide fee.
Require all OTBs to give top priority to NY tracts with strict
requirements for signal presentation.
Require NY residents to bet through NY wagering venues (tracks &
OTBs) only and no longer allow out-of-state providers (ADWs) to
accept wagers from NY residents.
Yonkers Raceway – Presently Yonkers derives approximately $12 million from
all OTBs with a similar amount dedicated to purses which helps sustain racing.
They obtained about $300 million of loans to perform renovations to the track to
accommodate video gaming. The loans were based on revenues, which OTB is a
big part of losing any of this revenue could jeopardize their loan covenants. They
race more days than any other track in North America (244) yet rank 6th
in
average purse per race. OTB plays a significant role in promoting their races but
could do more. OTBs however showcase out of state races (which they make
more money on) over Yonkers races. Agree that the payment schedule devised to
limit the cannibalization of harness revenues from allowing nighttime
thoroughbred (known as Maintenance of Effort payments) need to be revised (in
an equitable way) due to the OTBs miscalculation of projected thoroughbred
handle. Believes cost savings could be achieved by consolidating OTBs and
suggest that the OTBs join the NY tracks in negotiating simulcasting rates.
Currently OTBs pay about half of what the tracks pay for the same simulcast
signal because of their “buying power”. By including the tracks everyone can pay
less and therefore make more money.
Also recommends that OTBs not be allowed get VLTS as this would jeopardize
their investment and loan commitments and result in the canalization of VLT
handle much like was done to the racing handle at the inception of OTBs.
Lastly recommends the licensing of ADWs and be able to sign up customers and
accept deposits like they do to “level the playing field”.
Saratoga Gaming & Raceway – The OTBs in their current form cannot fulfill its
mission to raise revenue for local governments and strengthen NY’s racing and
breeding industries. In every other state in the country the OTB systems are an
extension of the tracks and not a direct competitor. Anything less than
privatization of the OTBs simply will not work.
Saratoga handle has steadily declined due to Capital OTBs numerous branches in
surrounding County’s that have major populations and Capital OTB’s telephone
and Internet wagering systems that accept Saratoga county residents. The regional
OTB should act as a marketing tool to promote in-state racing, particularly the
racetracks that exist within the OTB’s region. OTBs must continue to fund the
tracks because of the detrimental effect they have on on-track betting. OTB’s
should continue to provide money to local governments but not at the expense of
the tracks and the horsemen, who they are statutorily to provide for as well. OTBs
190

ATTACHMENT XIX
3
mission to raise revenues for state and local governments directly conflicts with
its mission to strengthen the racing and breeding industries in NYS.
In an effort to raise further revenues OTBs supported approval to allow them to
offer wagering on out of state evening thoroughbred races which they said would
add new handle and not cannibalize the NY harness handle. Maintenance of
Effort payments or “hold harmless” payments were agreed to by the OTBs to
mitigate the effect on NY handle. The thoroughbred handle they anticipated did
not occur and harness handle declined thereby causing payments to be required to
the harness tracks as a result of the OTB decision to take the evening
thoroughbred signal. The OTBs ended up challenging the very legislation they
championed. They lost and have still not paid the tracks.
OTBs should be mandated to promote NY racing first and over out of state racing
to meet its mandate to act in the best interest of NY racing. This will be difficult,
as the OTBs have been marketing the out of state products because they make
more money from them then on NY tracks. As an alternative suggest repealing the
hold harmless provisions and in its place require the OTBs to pay a less rate to the
regional tracks on such wagers, thereby reducing their payments. In return they
recommend that the tax on free play vouchers be lifted. Such non-taxable free
play is a proven marketing tool in other jurisdictions and will benefit the
horsemen, breeder’s track and State as well.
Supports the idea of the tracks joining the OTBs in negotiating simulcasting rates.
Currently OTBs pay about half of what the tracks pay for the same simulcast
signal because of their “buying power”. By including the tracks everyone can pay
less and therefore make more money.
Amend Section 1003 of the Racing Law to no longer require mutual consent for
video streaming racing and only require host track consent.
Ideally would like to prohibit out of state ADWs from accepting wagers from NY
residents but believe this is impractical as NY tracks rely on ADWs revenues.
Therefore suggest that ADWs be subject to the same statutory payments as the
NY OTBs and pay a 5% commission to the NY OTBs.
Again stresses that the OTBs cannot, in their current form meet all their statutory
requirements. Believe that consolidating the OTB’s and streamlining operations
(they compare the numerous branch locations in NYS to PA, Arizona, Illinois,
Indiana combined and conclude NY is over saturated with OTB branches.) will
help but that only by privatizing (and continuing to allow payments to
municipalities for 5 years) will the system really ever be fixed.
Monticello Casino & Raceway - OTBs have weakened harness racing to its lowest
levels. They have interpreted statute to suit their own purposes such as denying
191

ATTACHMENT XIX
4
Monticello is a regional track, refusing to pay statutory payments and creating an overall
hostile atmosphere. Millions of dollars are owed to Monticello by NYC, Nassau and
Suffolk OTBs with some liabilities going as far back as September 2007. The result has
been Monticello having the lowest purse structure in the state, even with VLTs. The
recommend:
Downsizing operations
Close unprofitable branches
Streamline operations through the use of technologies
Approach unions for contract concessions
Cut pay/benefits
Ensure benefit packages are in line with comparable industry
Employee benefit contributions
License OTB employees
Eliminate political appointees
Go lean and mean. 30 years ago Monticello had 127 mutuel tellers, they now have
15, their pension plan was eliminated in 1988 and there were no raises from 1985
to 2003.
Address surcharge to see if still needed
Require yearly financial audits including a review of operational procedures that
are no longer relevant.
Require out of state ADWs to contribute to NYS racing industry and charge them
10%, half of which goes to the OTBs and State and half to the industry. This
would cut into their ability to offer rebates that the current take out structure in
NY does not provide to the tracks and OTBs now.
Privatize the OTBs
Pursue sports betting.
One telephone/internet wagering platform for the entire state.
Pursue bookies and off shore rebate shops from offering NY tracks. Keep NY
money in NY.
Market protection, the market belongs to the tracks, not the OTBs who
merchandise racing.
Have the OTBs and NY tracks combine to negotiate one rate for all imports to
benefit NY.
Consolidate payments, commissions and settlements into one A/P & A/R
department.
Monticello submitted a second letter dated October 26, 2009 that provided an analysis of
handle and racing revenue from 1981 to 2008 that demonstrates why dark day and
maintenance of effort payments were established. The analysis also provides for a
comparison of revenues retained from racing between the tracks, who retain
approximately 2.20% and the OTBs who retain approximately 9.25%. They ask that the
Task Force not recommend any decreases to distributions to tracks.
New York Racing Association, Inc. (NYRA) – Suggest that given the immediate financial
shortfalls of New York City OTB that the Task Force first concentrate on a plan to reorganize
NYC OTB’s finances before they run out of money before the end of 2009. NYRA also provided
192

ATTACHMENT XIX
5
a listing of goals of OTB/NYRA Restructuring that would streamline and improve the
distribution of racing throughout the State. The goals included are:
Eliminate duplicative costs
Rationalize statutory rates based on current industry practices
Increase payments to local government
Statewide phone and internet account wagering platform
Statewide television and video streaming broadcast
Statewide integrated marketing strategy
Contemporary retail network that presents horse racing in a positive entertaining
environment
Increase payments to purses
Increase payments to breeders awards to ensure that New York continues growth and
support for breeders
Simplified business model where the track and the retail network have consistent goals
Consolidate operating structures
193