task order 15: data for education programming in asia · pdf filetask order 15: data for...
TRANSCRIPT

EdData II
Task Order 15: Data for Education
Programming in Asia and the Middle
East (DEP/AME)
Philippines EGRA Four Language
Study –2015 Follow-On
EdData II Technical and Managerial Assistance, Task Order 15 EdData II Contract Number EHC-E-00-04-00004 Task Order Number AID-OAA-BC-11-00001 October 8, 2015
This document was prepared to be examined by the United States Agency for International Development. It was prepared by RTI International.
Task Order 15: Data for Education
Programming in Asia and the Middle
East (DEP/AME)
Philippines EGRA Four Language
Study –2015 Follow-On
Prepared for USAID/Washington Mitch Kirby Senior Education Advisor, Asia Bureau Contracting Officer’s Technical Representative Data for Education Programming/Asia and Middle East 1300 Pennsylvania Avenue NW Washington, DC 20523 Prepared by Sarah Pouezevara, Joe DeStefano, Christopher Cummiskey, and Jennifer Pressley RTI International 3040 Cornwallis Road Post Office Box 12194 Research Triangle Park, NC 27709-2194
RTI International is one of the world’s leading research institutes, dedicated to improving the human condition by turning knowledge into practice. Our staff of more than 3,700 provides research and technical services to governments and businesses in more than 75 countries in the areas of health and pharmaceuticals, education and training, surveys and statistics, advanced technology, international development, economic and social policy, energy and the environment, and laboratory and chemistry services. For more information, visit www.rti.org. RTI International is a registered trademark and a trade name of Research Triangle Institute.
The authors’ views expressed in this publication do not necessarily reflect the views of the United States Agency for International Development or the United States Government.
EdData II Task Order 15 (DEP-AME)
Philippines EGRA Four Language Study – 2015 Follow-On i
Table of Contents Page
List of Figures ...................................................................................................................ii
List of Tables ...................................................................................................................iv
Abbreviations .................................................................................................................. v
I. Executive Summary .............................................................................................. 1
II. Introduction ........................................................................................................... 5
1 Hiligaynon ........................................................................................................... 11
1.1 Background .............................................................................................. 11
1.2 EGRA results ........................................................................................... 12
1.2.1 Hiligaynon reading ........................................................................ 12
1.2.2 Filipino and English ....................................................................... 16
1.3 MTB-MLE implementation ....................................................................... 18
2 Ilokano ................................................................................................................ 24
2.1 Background .............................................................................................. 24
2.2 EGRA results ........................................................................................... 25
2.2.1 Ilokano reading.............................................................................. 25
2.2.2 Filipino and English ....................................................................... 28
2.3 MTB-MLE Implementation ....................................................................... 30
3 Sinugbuanong Binisaya (Cebuano) .................................................................... 35
3.1 Background .............................................................................................. 35
3.2 EGRA results ........................................................................................... 36
3.2.1 Cebuano reading........................................................................... 36
3.2.2 Filipino and English ....................................................................... 39
3.3 MTB-MLE Implementation ....................................................................... 41
4 Maguindanaoan .................................................................................................. 47
4.1 Background .............................................................................................. 47
4.2 Summary of results .................................................................................. 48
4.2.1 Maguindanaoan reading ............................................................... 48
4.2.2 Filipino and English ....................................................................... 51
4.3 MTB-MLE implementation ....................................................................... 52

EdData II Task Order 15 (DEP-AME)
Philippines EGRA Four Language Study – 2015 Follow-On ii
5 Cross-Language Findings................................................................................... 59
5.1 EGRA....................................................................................................... 59
5.2 MTB-MLE Implementation ....................................................................... 62
6 Conclusions and Recommendations .................................................................. 69
Annex 1: Pearson Correlations by Language and Grade ........................................ 74
Annex 2: Outcome of Regional Discussion of EGRA Results in Region VI ............ 77
Annex 3: Participants in the Early Grade Reading Summit ..................................... 79
List of Figures
Figure 1. Percent of students meeting the benchmark for oral reading fluency ... 3
Figure 2. Percent of students scoring zero on oral reading fluency ..................... 3
Figure 3. Hiligaynon – Letter sound identification (distribution) .......................... 14
Figure 4. Hiligaynon – Nonword decoding (distribution) ..................................... 15
Figure 5. Hiligaynon – Reading fluency (distribution) ......................................... 15
Figure 6. Hiligaynon – Reading comprehension (distribution) ............................ 15
Figure 7. Hiligaynon – Differences between boys’ and girls’ scores (G2 only) ... 16
Figure 8. Hiligaynon – Filipino language development ....................................... 17
Figure 9. Hiligaynon – English language development ...................................... 17
Figure 10. Hiligaynon – Classroom observation time ........................................... 18
Figure 11. Hiligaynon – Component 1 score index distribution ............................ 20
Figure 12. Hiligaynon – Component 2 score index distribution ............................ 20
Figure 13. Hiligaynon – Component 3 index score distribution ............................ 21
Figure 14. Hiligaynon – Teacher expectations for when children should know how to read ......................................................................................... 21
Figure 15. Ilokano – Letter sound identification (distribution) ............................... 27
Figure 16. Ilokano – Nonword reading (distribution) ............................................ 28
Figure 17. Ilokano – Reading fluency (distribution) .............................................. 28
Figure 18. Ilokano – Reading comprehension (distribution) ................................. 28
Figure 19. Ilokano – Filipino language development ............................................ 29
Figure 20. Ilokano – English language development ........................................... 29
Figure 21. Ilokano – Differences between boys’ and girls’ scores (G2 only) ........ 30
Figure 22. Ilokano – Classroom observation time ................................................ 31

EdData II Task Order 15 (DEP-AME)
Philippines EGRA Four Language Study – 2015 Follow-On iii
Figure 23. Ilokano – Component 1 index (distribution) ......................................... 32
Figure 24. Ilokano – Component 2 index (distribution) ......................................... 32
Figure 25. Ilokano – Component 3 index (distribution) ......................................... 33
Figure 26. Ilokano – Teacher expectations for when children should know how to read................................................................................................. 33
Figure 27. Cebuano – Letter sound identification (distribution) ............................ 38
Figure 28. Cebuano – Nonword reading (distribution) ......................................... 38
Figure 29. Cebuano – Reading fluency (distribution) ........................................... 38
Figure 30. Cebuano – Reading comprehension (distribution) .............................. 39
Figure 31. Cebuano – Differences between boys’ and girls’ scores..................... 39
Figure 32. Filipino language development ........................................................... 40
Figure 33. English language development ........................................................... 40
Figure 34. Cebuano – Use of classroom time ...................................................... 41
Figure 35. Cebuano – Component 1 index (distribution) ...................................... 43
Figure 36. Cebuano – Component 2 index (distribution) ...................................... 44
Figure 37. Cebuano – Component 3 index (distribution) ...................................... 44
Figure 38. Cebuano – Teacher expectations for when children should know how to read ......................................................................................... 45
Figure 39. Maguindanoan – Letter sound identification (distribution) ................... 50
Figure 40. Maguindanoan – Nonword reading (distribution) ................................ 50
Figure 41. Maguindanoan – Oral reading fluency (distribution) ........................... 50
Figure 42. Maguindanoan – Comprehension (distribution) .................................. 51
Figure 43. Maguindanaoan – Differences between boys’ and girls’ scores (G2 only) .................................................................................................... 51
Figure 44. Maguindanaoan – Filipino language development .............................. 52
Figure 45. Maguindanaoan – Filipino language development .............................. 52
Figure 46. Maguindanoan – Classroom observation time .................................... 53
Figure 47. Maguindanaoan – Component 1 index (distribution) .......................... 55
Figure 48. Maguindanaoan – Component 2 index (distribution) .......................... 56
Figure 49. Maguindanaoan – Component 3 index (distribution) .......................... 57
Figure 50. Maguindanaoan – Teacher expectations for when a child should know how to read ................................................................................ 57
Figure 51. Zero scores on all subtasks ................................................................ 59
Figure 52. Factors that contribute to developing strong readers .......................... 60
Figure 53. Type of training in beginning reading that teachers have received ..... 63
EdData II Task Order 15 (DEP-AME)
Philippines EGRA Four Language Study – 2015 Follow-On iv
Figure 54. Comfort with the mother tongue .......................................................... 64
Figure 55. Familiarity with the mother tongue ...................................................... 64
Figure 56. Availability of books in the classroom ................................................. 65
Figure 57. Materials used, as reported by teachers ............................................. 67
Figure 58. Materials used most, as reported by teachers .................................... 67
Figure 59. Instructional strategies in the reading classroom ................................ 68
List of Tables
Table 1. Overview of EGRA in the Philippines, 2013 – 2015 .............................. 5
Table 2. Samples per stage ................................................................................ 6
Table 3. Final sample and assessment counts of students, teachers, and classrooms observations by region, grade, and year ............................ 7
Table 4. Hiligaynon – selected characteristics by grade (2015) ........................ 11
Table 5. Hiligaynon reading benchmarks drafted in the 2014 benchmarking workshop ............................................................................................ 12
Table 6. Hiligaynon – Performance on Reading Subtasks ................................ 12
Table 7. Hiligaynon – Summary of index scores (means) ................................. 19
Table 8. Ilokano – Selected characteristics by grade (2015) ............................ 24
Table 9. Ilokano draft reading benchmarks ....................................................... 25
Table 10. Ilokano – Performance on reading subtasks ....................................... 25
Table 11. Ilokano – Summary of index scores (means) ...................................... 31
Table 12. Cebuano – Selected characteristics by grade (2015) ......................... 35
Table 13. Cebuano recommended reading benchmarks .................................... 36
Table 14. Cebuano – Performance on reading subtasks .................................... 36
Table 15. Cebuano – Summary of index scores (means) ................................... 42
Table 16. Maguindanaoan – Selected characteristics by grade (2015) .............. 47
Table 17. Maguindanaoan recommended reading benchmarks ......................... 48
Table 18. Maguindanaoan – Performance on reading subtasks ......................... 48
Table 19. Maguidanaoan – Summary of index scores (means) .......................... 54
Table 20. Intergrade gains by subtask and language (average of 2014 and 2015 scores) ....................................................................................... 61
Table 21. MTB-MLE index (logistic regression) .................................................. 62
Table 22. Overview of all MTB-MLE index mean scores (2015 only) ................. 62
EdData II Task Order 15 (DEP-AME)
Philippines EGRA Four Language Study – 2015 Follow-On v
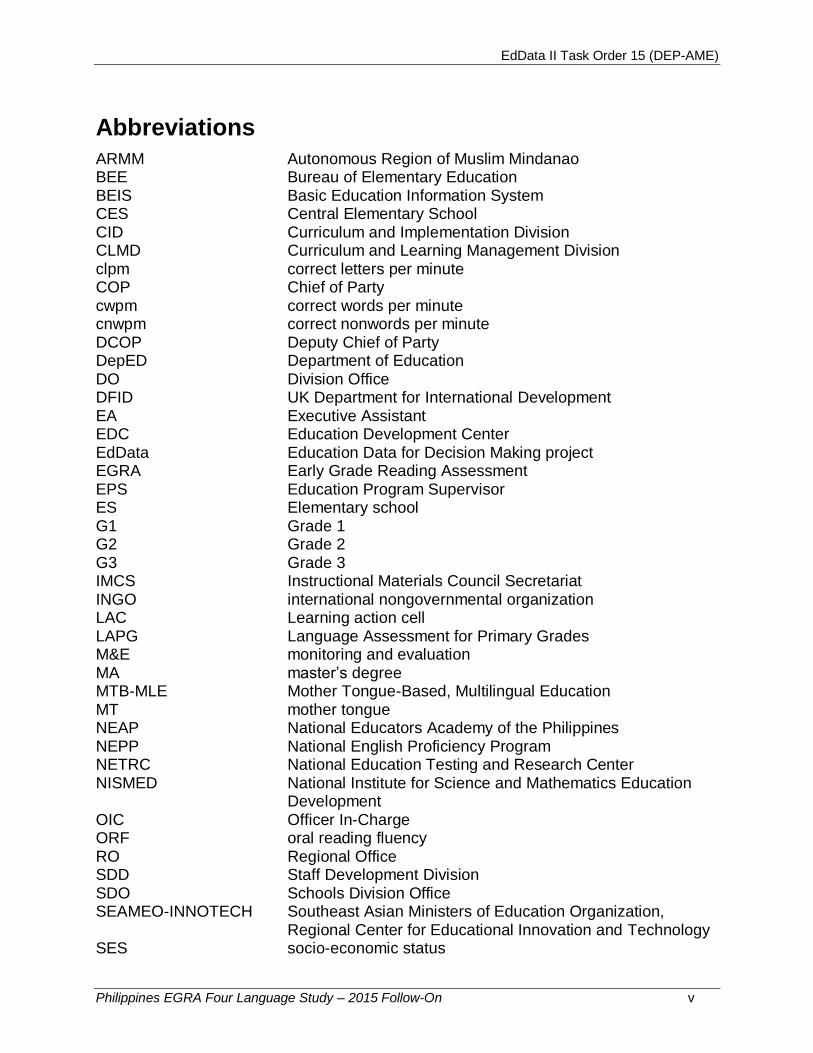
Abbreviations
ARMM Autonomous Region of Muslim Mindanao BEE Bureau of Elementary Education BEIS Basic Education Information System CES Central Elementary School CID Curriculum and Implementation Division CLMD Curriculum and Learning Management Division clpm correct letters per minute COP Chief of Party cwpm correct words per minute cnwpm correct nonwords per minute DCOP Deputy Chief of Party DepED Department of Education DO Division Office DFID UK Department for International Development EA Executive Assistant EDC Education Development Center EdData Education Data for Decision Making project EGRA Early Grade Reading Assessment EPS Education Program Supervisor ES Elementary school G1 Grade 1 G2 Grade 2 G3 Grade 3 IMCS Instructional Materials Council Secretariat INGO international nongovernmental organization LAC Learning action cell LAPG Language Assessment for Primary Grades M&E monitoring and evaluation MA master’s degree MTB-MLE Mother Tongue-Based, Multilingual Education MT mother tongue NEAP National Educators Academy of the Philippines NEPP National English Proficiency Program NETRC National Education Testing and Research Center NISMED National Institute for Science and Mathematics Education
Development OIC Officer In-Charge ORF oral reading fluency RO Regional Office SDD Staff Development Division SDO Schools Division Office SEAMEO-INNOTECH Southeast Asian Ministers of Education Organization,
Regional Center for Educational Innovation and Technology SES socio-economic status
EdData II Task Order 15 (DEP-AME)
Philippines EGRA Four Language Study – 2015 Follow-On vi
TEI Teacher Education Institute TNS Taylor Nelson Sofres; TNS Global UK United Kingdom UP University of the Philippines USAID United States Agency for International Development

EdData II Task Order 15 (DEP-AME)
Philippines EGRA Four Language Study – 2015 Follow-On 1
I. Executive Summary
The completion of an Early Grade Reading Assessment (EGRA) in four mother tongues in the
Philippines for a second consecutive year enables the Department of Education (DepED) to
examine how the implementation of the Mother Tongue-Based, Multilingual Education (MTB-
MLE) initiative is progressing. For example, is there evidence that schools and teachers are more
successfully implementing MTB-MLE? Are students in grades 1 (G1) and 2 (G2) developing
improved reading skills in their mother tongues? And, are they also developing initial skills in
both Filipino and English?
Samples of 30 to 40 teachers and 375 to 400 students per grade were drawn in each of the four
regions – Region I, Region VI, Region VII, and the Autonomous Region of Muslim Mindanao
(ARMM) – from schools that were pre-identified as teaching in the target languages, respectively
Ilokano, Hiligaynon, Cebuano, and Maguindanaoan. The sampled teachers were asked about
their preparation for, level of comfort with, and understanding of MTB-MLE, and their
instructional practice during a reading lesson was observed. Students completed an assessment of
their letter sound knowledge, decoding skills, oral reading fluency, and reading comprehension
in their mother tongue, and their listening comprehension and ability to read familiar words in
Filipino, as well as their oral understanding of common English vocabulary words and phrases.
MTB-MLE implementation: Regarding the implementation of MTB-MLE in the four regions,
the 2015 survey, like the 2014 one, used the information from teacher interviews and classroom
observations to construct an index that covers three areas of MTB-MLE: Teacher preparation
and ability to provide instruction in the mother tongue; Availability and use of a diversity of
MTB-MLE materials; and Instructional practice and the use of time during mother-tongue
reading lessons.
Comparing the 2014 and 2015 scores of schools on these three components of the MTB-MLE
index allows us to make the following general statements about how implementation of MTB-
MLE is proceeding. We found that:
In all four regions, a greater proportion of students have teachers who are better prepared
and more comfortable teaching in the mother tongue, with the exception of students
learning in Ilokano in Region I. In Region I, the decline stems mostly from fewer
teachers stating that they use assessments such as EGRA (or others) to regularly evaluate
student performance. Mother tongues are being spoken during the vast majority of
observed reading lesson time, as was the case in 2014.
The 2015 survey also revealed greater presence and use of MTB-MLE materials in three
of the four regions. In ARMM the availability of diverse materials linked to MTB-MLE
remains below what it should be as the region is still struggling to meet the challenge of
ensuring their adequate supply and use.
In Region I, VII, and ARMM, teachers displayed more of the practices associated with
building reading skill and more time during reading lessons was being used to practice
specific skills. Many more classrooms in Regions 1, VI, and VII were showing better
practice (35 to 40%) than in ARMM (11%). However, in Region VI, no difference was
EdData II Task Order 15 (DEP-AME)
Philippines EGRA Four Language Study – 2015 Follow-On 2
seen from 2014 to 2015 in the proportion of schools where teachers were demonstrating
desirable practices.
Teacher expectations regarding students’ acquisition of literacy changed dramatically
from 2014 to 2015 across all regions, with much higher percentages of teachers stating
that students can learn to read in their mother tongues during G1.
Mother-tongue reading: Data related to each region’s improvements in MTB-MLE
implementation are provided in the appropriate sections of the report. The general picture is that
implementation is improving as MTB-MLE moves into its second year of full implementation.
Whether an additional year of implementation is leading to significantly better outcomes is
revealed by looking at how students performed on the 2014 and 2015 EGRA subtests.
One way to compare performance in 2014 to 2015 is to look at the percentage of students in each
year achieving a desirable level of reading proficiency. In September 2014, teams from each of
the four regions came together to develop recommendations for benchmark levels of student
performance in oral reading fluency (ORF).
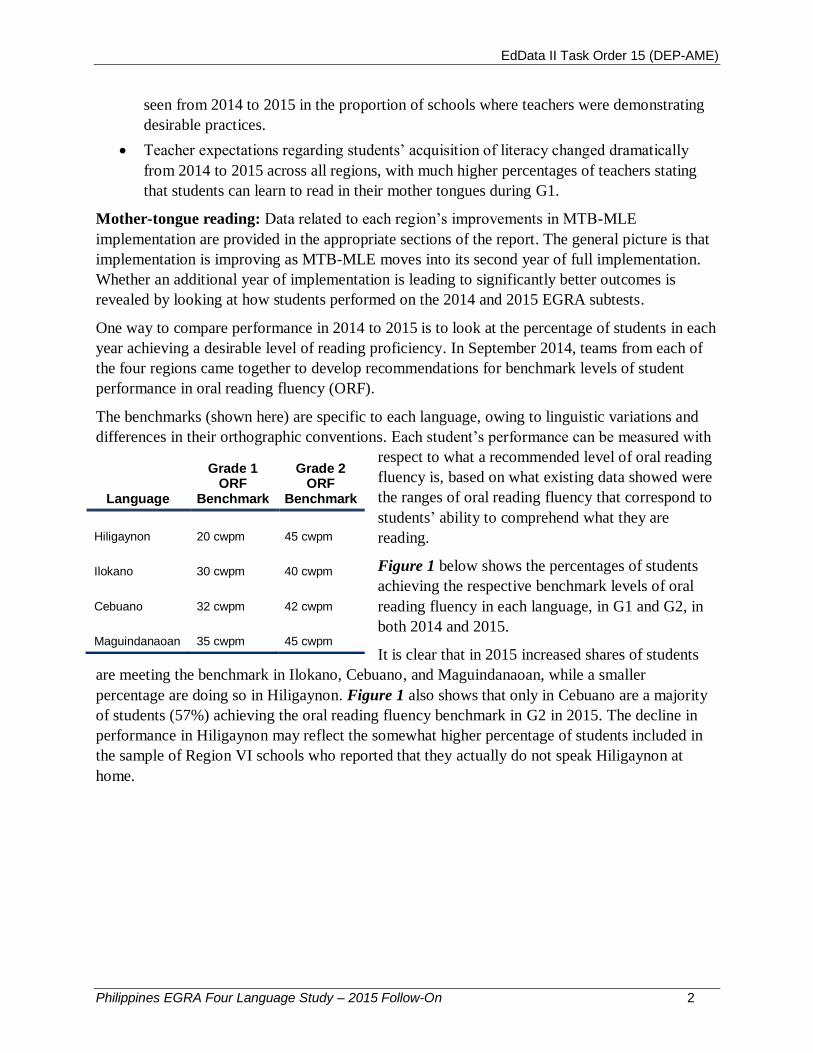
The benchmarks (shown here) are specific to each language, owing to linguistic variations and
differences in their orthographic conventions. Each student’s performance can be measured with
respect to what a recommended level of oral reading
fluency is, based on what existing data showed were
the ranges of oral reading fluency that correspond to
students’ ability to comprehend what they are
reading.
Figure 1 below shows the percentages of students
achieving the respective benchmark levels of oral
reading fluency in each language, in G1 and G2, in
both 2014 and 2015.
It is clear that in 2015 increased shares of students
are meeting the benchmark in Ilokano, Cebuano, and Maguindanaoan, while a smaller
percentage are doing so in Hiligaynon. Figure 1 also shows that only in Cebuano are a majority
of students (57%) achieving the oral reading fluency benchmark in G2 in 2015. The decline in
performance in Hiligaynon may reflect the somewhat higher percentage of students included in
the sample of Region VI schools who reported that they actually do not speak Hiligaynon at
home.
Language
Grade 1 ORF
Benchmark
Grade 2 ORF
Benchmark
Hiligaynon 20 cwpm 45 cwpm
Ilokano 30 cwpm 40 cwpm
Cebuano 32 cwpm 42 cwpm
Maguindanaoan 35 cwpm 45 cwpm
EdData II Task Order 15 (DEP-AME)
Philippines EGRA Four Language Study – 2015 Follow-On 3
Figure 1. Percent of students meeting the benchmark for oral reading fluency
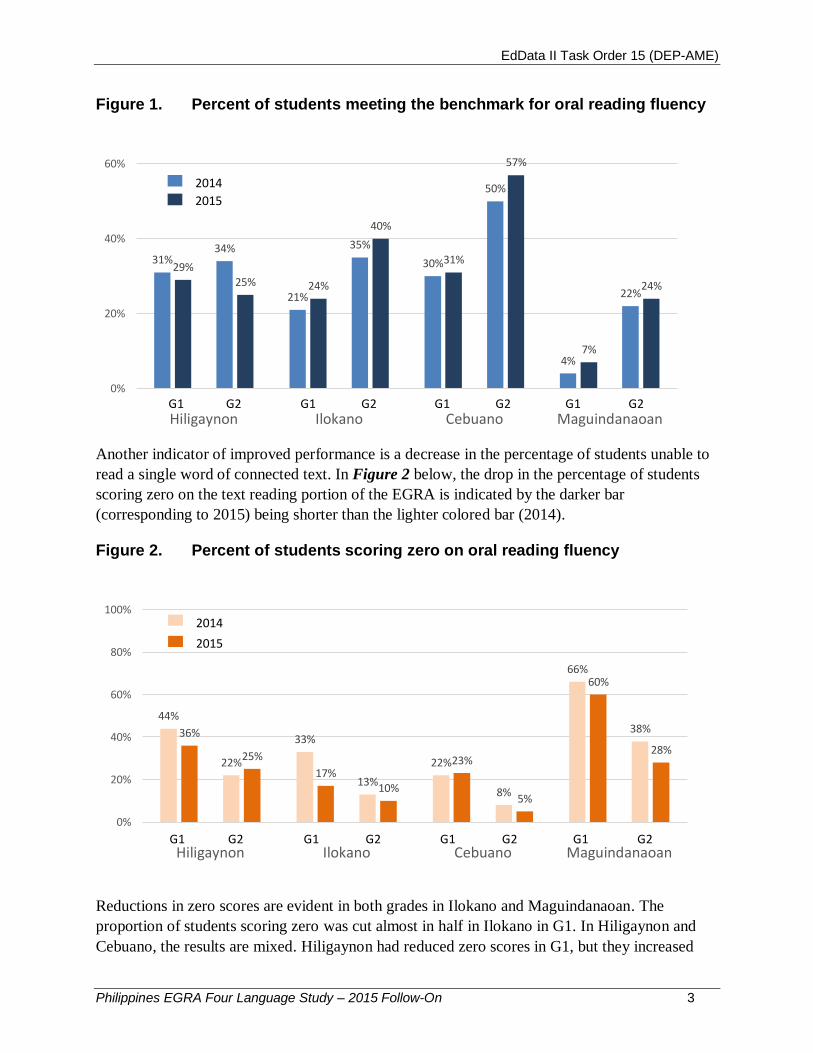
Another indicator of improved performance is a decrease in the percentage of students unable to
read a single word of connected text. In Figure 2 below, the drop in the percentage of students
scoring zero on the text reading portion of the EGRA is indicated by the darker bar
(corresponding to 2015) being shorter than the lighter colored bar (2014).
Figure 2. Percent of students scoring zero on oral reading fluency
Reductions in zero scores are evident in both grades in Ilokano and Maguindanaoan. The
proportion of students scoring zero was cut almost in half in Ilokano in G1. In Hiligaynon and
Cebuano, the results are mixed. Hiligaynon had reduced zero scores in G1, but they increased
31%
21%
30%
4%
29%
24%
31%
7%
34% 35%
50%
22%25%
40%
57%
24%
0%
20%
40%
60%
Hiligaynon Ilokano Cebuano Maguindanaoan
% of students meeting the benchmark for oral reading fluency
G1 G1 G1 G1G2 G2 G2 G2
2014
2015
44%
33%
22%
66%
36%
17%23%
60%
22%
13%8%
38%
25%
10%5%
28%
0%
20%
40%
60%
80%
100%
Hiligaynon Ilokano Cebuano Maguindanaoan
% of students scoring zero on oral reading fluency
G1 G1 G1 G1G2 G2 G2 G2
2014
2015
EdData II Task Order 15 (DEP-AME)
Philippines EGRA Four Language Study – 2015 Follow-On 4
slightly in G2; Cebuano had a very slight increase in G1 zero scores but a decline to only 5% of
G2 students unable to read a single word of the short passage.
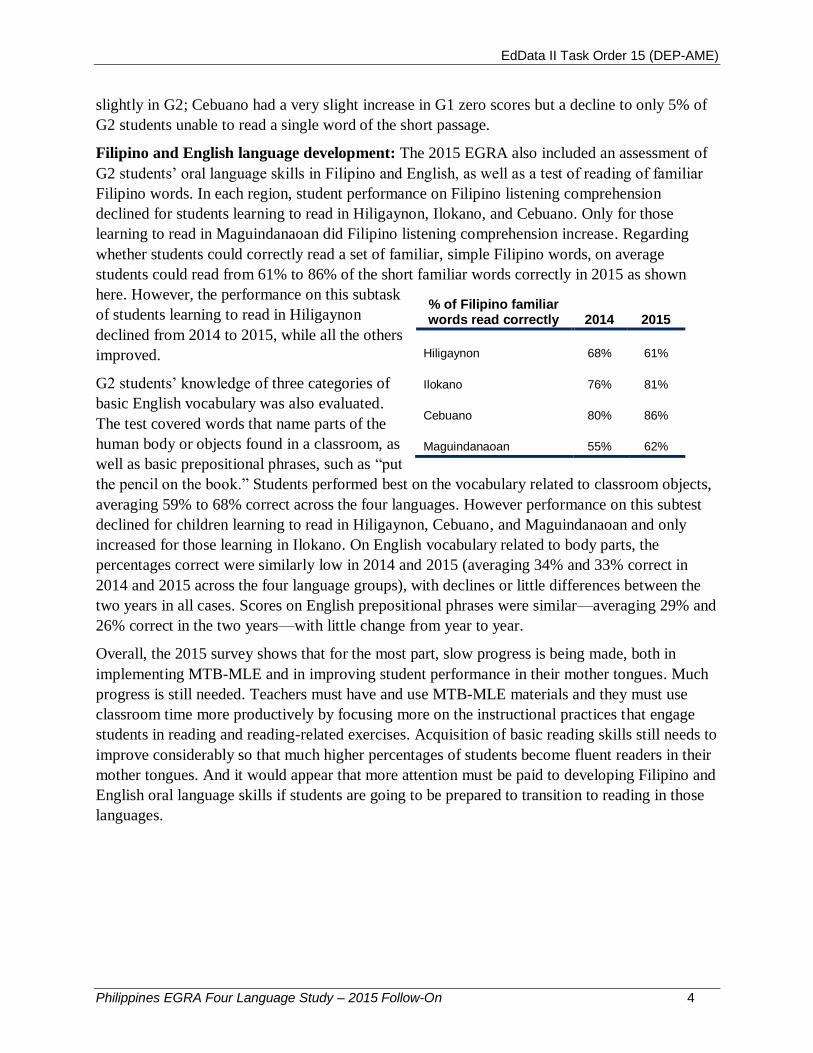
Filipino and English language development: The 2015 EGRA also included an assessment of
G2 students’ oral language skills in Filipino and English, as well as a test of reading of familiar
Filipino words. In each region, student performance on Filipino listening comprehension
declined for students learning to read in Hiligaynon, Ilokano, and Cebuano. Only for those
learning to read in Maguindanaoan did Filipino listening comprehension increase. Regarding
whether students could correctly read a set of familiar, simple Filipino words, on average
students could read from 61% to 86% of the short familiar words correctly in 2015 as shown
here. However, the performance on this subtask
of students learning to read in Hiligaynon
declined from 2014 to 2015, while all the others
improved.
G2 students’ knowledge of three categories of
basic English vocabulary was also evaluated.
The test covered words that name parts of the
human body or objects found in a classroom, as
well as basic prepositional phrases, such as “put
the pencil on the book.” Students performed best on the vocabulary related to classroom objects,
averaging 59% to 68% correct across the four languages. However performance on this subtest
declined for children learning to read in Hiligaynon, Cebuano, and Maguindanaoan and only
increased for those learning in Ilokano. On English vocabulary related to body parts, the
percentages correct were similarly low in 2014 and 2015 (averaging 34% and 33% correct in
2014 and 2015 across the four language groups), with declines or little differences between the
two years in all cases. Scores on English prepositional phrases were similar—averaging 29% and
26% correct in the two years—with little change from year to year.
Overall, the 2015 survey shows that for the most part, slow progress is being made, both in
implementing MTB-MLE and in improving student performance in their mother tongues. Much
progress is still needed. Teachers must have and use MTB-MLE materials and they must use
classroom time more productively by focusing more on the instructional practices that engage
students in reading and reading-related exercises. Acquisition of basic reading skills still needs to
improve considerably so that much higher percentages of students become fluent readers in their
mother tongues. And it would appear that more attention must be paid to developing Filipino and
English oral language skills if students are going to be prepared to transition to reading in those
languages.
% of Filipino familiar words read correctly 2014 2015
Hiligaynon 68% 61%
Ilokano 76% 81%
Cebuano 80% 86%
Maguindanaoan 55% 62%

EdData II Task Order 15 (DEP-AME)
Philippines EGRA Four Language Study – 2015 Follow-On 5
II. Introduction
Background
For the past three years United States Agency for International Development (USAID) has been
supporting the Philippines Department of Education (DepED) to monitor progress of
implementation of Mother Tongue-Based Multilingual Education (MTB-MLE) through the use
of the Early Grade Reading Assessment (EGRA).1 The first implementation of EGRA was in the
2012–2013 school year; it assessed the English and Filipino reading ability of children in grade 3
([G3] national sample) as well Ilokano in grade 1 ([G1] regional sample). The following year,
DepED, with USAID support, administered EGRA in G1 and G2 in four regions and languages,
including Ilokano, and collected data on classroom teaching using observations and teacher
interviews. This year EGRA was again administered in the same set of four regional languages
(see Table 1, below). Additional data were collected through classroom observations and teacher
interviews from the classrooms where students were selected at random. In this way, the
characteristics of teachers and classrooms could be used to explore differences in achievement.
Fieldwork was completed each time at the end of the school year, so the studies can be
interpreted each time as indicative of a full year of instruction in the grade level targeted.
Table 1. Overview of EGRA in the Philippines, 2013 – 2015
Characteristic 2013 2014 2015
Languages and grades English (G3) Filipino (G3) Ilokano (G1)
Ilokano (G1/G2) Hiligaynon (G1/G2) Cebuano (G1/G2) Maguindanaoan (G1/G2)
Ilokano (G1/G2) Hiligaynon (G1/G2) Cebuano (G1/G2) Maguindanaoan (G1/G2)
Instruments EGRA Student questionnaire Teacher questionnaire
EGRA Student questionnaire Teacher questionnaire Classroom observation
EGRA (shortened) Student questionnaire Teacher questionnaire Classroom observation
Implementing partners DepED RTI TNS SEAMEO-INNOTECH
DepED RTI TNS
DepED TNS RTI EDC (USAID/Basa)
G1=Grade 1; G2=Grade 2; G3=Grade 3
This series of end-of year, sample-based assessments is done with the objective of determining
whether children are learning how to read in the mother tongue in G1 and G2 and if
implementation experience helps improve instruction and raises overall achievement from one
year to the next. Ultimately, it is expected that gains in mother tongue reading will translate to
gains in English and Filipino reading in G3. As such, this series of measurements provides the
1 For more information, including past reports from the Philippines, see www.eddataglobal.org
EdData II Task Order 15 (DEP-AME)
Philippines EGRA Four Language Study – 2015 Follow-On 6
baseline with which to establish performance benchmarks and targets, and then evaluate progress
towards those targets periodically.
As part of these efforts, USAID’s Education Data for Decision Making project (EdData) and
Basa Filipinas Projects (Basa) jointly supported a workshop in 2014 to use the results from
EGRAs to draft benchmarks for reading performance in the first years of elementary education.
These benchmarks are used in the analysis of results that follow for each language.
Research design and methodology
Sample methodology: The study was designed to be representative of the population of students
attending public schools in the select regions that instruct in the targeted mother tongue. For
example, although Ilokano is spoken outside of Region 1, and within Region 1 other languages
are also used, the sample represents students in schools in Region 1 that use Ilokano as the
language of instruction.
The 2012–2013 Basic Education Information System (BEIS) public school census was used as
the sampling frame to sample schools. Prior to sampling, all schools that were not located in the
four regions or did not instruct in the regions’ specified mother tongues were excluded. Schools
were stratified by region, then 40 schools in each region were sampled proportional to the
combined G1 and G2 enrollment. For each originally sampled school, two replacement schools2
were automatically selected to replace the original school if the original school was deemed
inadequate to assess.3 Once schools were sampled and verified to meet the necessary
requirements for evaluation, teams went to each school and sampled one G1 teacher and one G2
teacher. For the sampled teachers, the assessors conducted the teacher questionnaire and the
reading lesson observation. Students taught by the selected teachers were then sampled, and
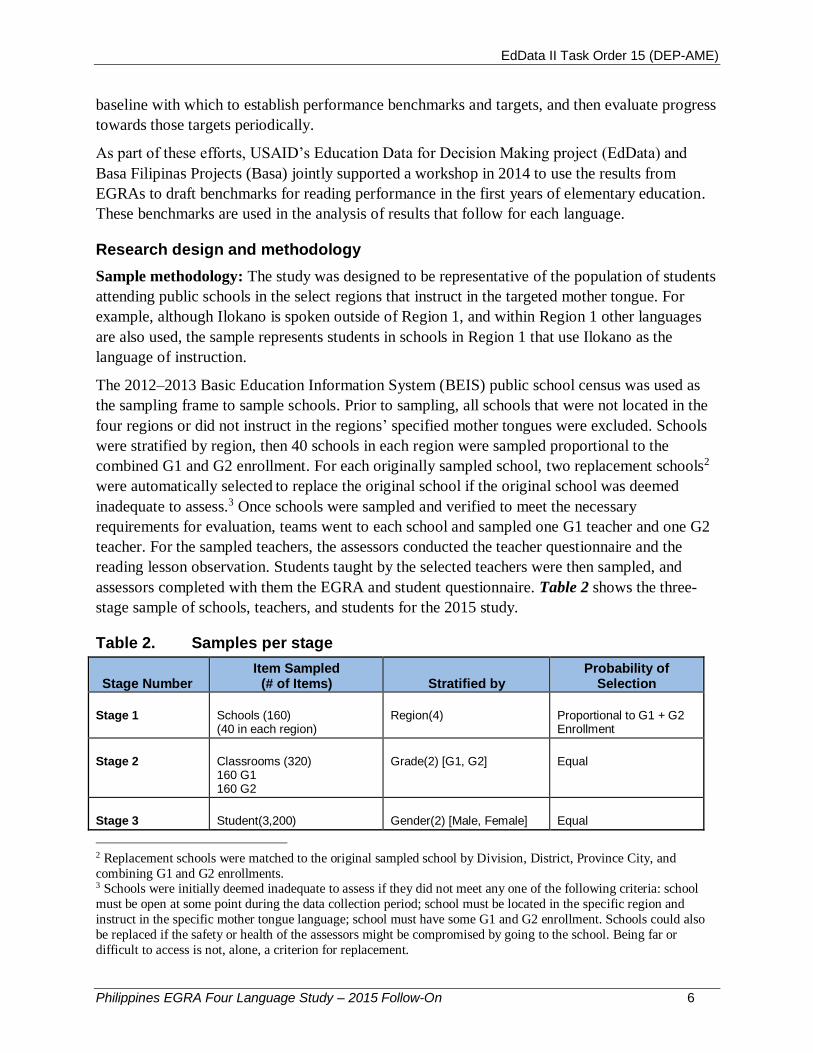
assessors completed with them the EGRA and student questionnaire. Table 2 shows the three-
stage sample of schools, teachers, and students for the 2015 study.
Table 2. Samples per stage
Stage Number Item Sampled (# of Items) Stratified by
Probability of Selection
Stage 1 Schools (160) (40 in each region)
Region(4) Proportional to G1 + G2 Enrollment
Stage 2 Classrooms (320) 160 G1 160 G2
Grade(2) [G1, G2] Equal
Stage 3 Student(3,200) Gender(2) [Male, Female] Equal
2 Replacement schools were matched to the original sampled school by Division, District, Province City, and
combining G1 and G2 enrollments. 3 Schools were initially deemed inadequate to assess if they did not meet any one of the following criteria: school
must be open at some point during the data collection period; school must be located in the specific region and
instruct in the specific mother tongue language; school must have some G1 and G2 enrollment. Schools could also
be replaced if the safety or health of the assessors might be compromised by going to the school. Being far or
difficult to access is not, alone, a criterion for replacement.
EdData II Task Order 15 (DEP-AME)
Philippines EGRA Four Language Study – 2015 Follow-On 7
200 G1 boys, 200 G1 girls; 200 G2 boys, 200 G2 girls [In each region]
It should be noted that the 2015 sample methodology was identical to the 2014 sample
methodology and used the same 2013–2014 BEIS sampling frame to maintain a consistency
from year to year to ensure comparability. However, during data collection, ongoing conflict in
the ARMM required further exclusions in areas that were deemed unsafe for the assessment team
to enter. Schools already sampled in these areas were excluded from the sample and replacement
schools not located in the conflict areas were resampled to replace these schools. Additionally,
many schools in Region VI (Hiligaynon) were replaced because they were not using Hiligaynon
as the mother tongue.
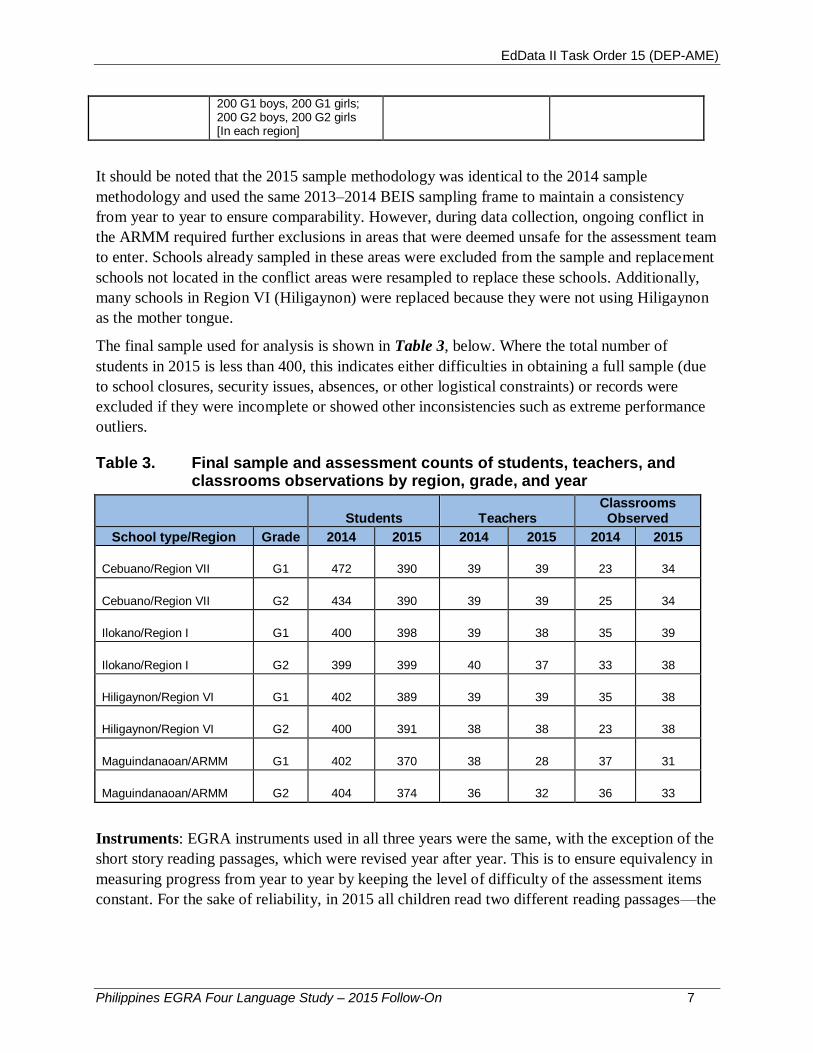
The final sample used for analysis is shown in Table 3, below. Where the total number of
students in 2015 is less than 400, this indicates either difficulties in obtaining a full sample (due
to school closures, security issues, absences, or other logistical constraints) or records were
excluded if they were incomplete or showed other inconsistencies such as extreme performance
outliers.
Table 3. Final sample and assessment counts of students, teachers, and classrooms observations by region, grade, and year
Students Teachers
Classrooms Observed
School type/Region Grade 2014 2015 2014 2015 2014 2015
Cebuano/Region VII G1 472 390 39 39 23 34
Cebuano/Region VII G2 434 390 39 39 25 34
Ilokano/Region I G1 400 398 39 38 35 39
Ilokano/Region I G2 399 399 40 37 33 38
Hiligaynon/Region VI G1 402 389 39 39 35 38
Hiligaynon/Region VI G2 400 391 38 38 23 38
Maguindanaoan/ARMM G1 402 370 38 28 37 31
Maguindanaoan/ARMM G2 404 374 36 32 36 33
Instruments: EGRA instruments used in all three years were the same, with the exception of the
short story reading passages, which were revised year after year. This is to ensure equivalency in
measuring progress from year to year by keeping the level of difficulty of the assessment items
constant. For the sake of reliability, in 2015 all children read two different reading passages—the

EdData II Task Order 15 (DEP-AME)
Philippines EGRA Four Language Study – 2015 Follow-On 8
same story used in 2014 and a new story written for 2015.4 The purpose of having children read
two passages was so that if the 2014 reading passages had been used in classrooms in the year
between the two assessments then the new passage could be used to report progress in reading
ability. Analysis of the data gave no indication that the 2014 passage had been used in schools or
that children had been prepared for the test other than through regular classroom instruction.5 In
fact, mean scores were very similar on the two reading passages. Therefore, we felt confident
using the outcomes of the 2014 reading passage in this report to be sure that comparison of
progress is based on entirely equivalent measurements.
The classroom observation instrument collects data on language use and instructional activities
by recording observation ‘snapshots’ every 3 minutes over the course of the mother tongue
lesson, which is where most reading instruction takes place. The classroom observation
instrument was identical in 2014 and 2015, except that it was administered only in reading
classes instead of across the curriculum. The analysis of observation data shows the proportion
of total observations in a certain category, and this is used as a proxy for how much class time is
actually spent on that activity. It is aggregated across the whole sample, not classroom by
classroom. Although we are making comparisons in instructional time use from 2014 to 2015,
this must be done with caution. The comparisons made in this report are only meant to be
indicative of the use of instructional time and in no way should be taken to represent a reliable
measure of classroom instruction throughout the year.
Students and teachers were also interviewed. Students were interviewed after their reading
assessment in order to gather information about classroom and home language practices from
their perspectives. Teacher interviews were conducted before or after the classroom observation,
depending on the day’s schedule. Data from teacher interviews were merged at the student level
prior to analysis, therefore the data can be interpreted as “the proportion of students whose
teacher/classroom has this characteristic.” The scores were analyzed by calculating the mean
score, and showing the distribution of scores. Most of the teacher questionnaire was the same as
in 2014, allowing us to see if there is any evolution in trends. However, a few additional
questions were asked or reformulated to yield more accurate results.
Finally, elements from all of these instruments were combined to create an index, or quantifiable
measurement, of MTB-MLE implementation. The indices summarize data related to three areas:
Teacher training, language ability, and the supports teachers receive at their schools
(Component 1)
Materials available and being used in classrooms (Component 2)
Instructional practices observed during reading lessons (Component 3)
4 All stories were developed by Filipino teachers and education specialists using standard EGRA test construction
guidelines during workshops facilitated by RTI. See previous EGRA reports for details. 5 Although as pointed out in each section, data from the student questionnaire indicate that a proportion of students
report having already done “an assessment like this,” and teachers report using EGRA in the classroom. Therefore
familiarity with the test format is on the rise. The effect of this on reading scores is uncertain.
EdData II Task Order 15 (DEP-AME)
Philippines EGRA Four Language Study – 2015 Follow-On 9
After calculating a score based on the relevant data from each instrument, we identified the score
that corresponds to the 75th percentile and calculated the proportion of the sample equal to or
above that score and the proportion below. Some teacher interview questions were added to or
rephrased in the teacher interview in 2015, and some were removed. In order to ensure that index
scores from 2014 and 2015 would be comparable, the index uses only data points that were
collected the same way each year, and therefore the 2014 index scores were recalculated to
ensure this consistency.
Fieldwork: Each year, a mix of private research contractors and employees of DepED carried
out the EGRA, classroom observations, and interviews. Over the three years of EGRA work in
the Philippines, RTI International (the main implementing partner for USAID) has been building
the capacity of the government to take on a larger role in training and fieldwork logistics. In
additional to Bureau of Elementary Education (BEE) central staff, regional directors and MTB-
MLE coordinators have been increasingly in charge of coordinating logistics, selecting staff, and
conducting training for the EGRA surveys. In 2015, the assessor training was conducted entirely
by Philippines-based staff from DepED and a local subcontractor (TNS Global) that has been
involved with EGRA in the Philippines since 2012, with the support of two local consultants
hired by RTI. Whereas in 2013 and 2014 assessors were a mix of DepED and TNS staff, in 2015
they were entirely made up of DepED staff, but some private researchers were involved in
fieldwork coordination.
Given the research framework above, it is also useful to remember, when reading this report, that
you can interpret findings for the system as a whole by comparing the difference between 2014
and 2015 performance, or you can interpret findings for one cohort by comparing G1 students in
2014 to G2 students in 2015. Although these are based on random samples and not longitudinal
measurement of the same children from year to year, the random sampling allows us to treat the
results as representative of a cohort’s performance.
Description of study participants
Before presenting characteristics of each region/language in the sections that follow, we will
present a general profile of teachers/classrooms in all four regions combined and some general
data across the four languages.
Teachers: Data from one teacher per grade, per school, were collected through a teacher
questionnaire. For analysis, the data were combined with the student data such that every student
EGRA record is associated with the data from his or her teacher. Therefore, data here are
reported in terms of “students who are taught by a teacher with the characteristic.” The data are
also weighted, and therefore provide a relatively representative picture of the teaching force
across the four regions. Some data, disaggregated by region, are presented in the sections that
present the results by language.
97% of children are taught by a female teacher.
EdData II Task Order 15 (DEP-AME)
Philippines EGRA Four Language Study – 2015 Follow-On 10
Most children sampled were in heterogeneous classrooms (93%), however some classes
were included that were either for slow learners or gifted learners, but these were in equal
proportion.
91% of students have a teacher with a bachelor’s degree, while 8% have a teacher with a
master’s degree (MA). The proportion of teachers with an MA was slightly higher in
2014 (12%).
83% of students have a teacher who received training in teaching reading from DepEdD,
but 4% have a teacher with no training in beginning reading; 33% of students have a
teacher who received training from USAID/Basa or another project. School-based
training, peer learning, and even self-research are also strategies some teachers reported
using to learn how to teach reading.
This year 62% of students have teachers who report feeling ‘very’ confident using the
mother tongue to teach reading, compared to 51% in 2014.
84% of students have a teacher who says they have the MTB-MLE materials as a
resource for teaching reading, and 78% have a teacher in possession of the teacher’s
guide.
39% of students have a teacher who has leveled readers in the classroom.
Students: After the series of reading assessment exercises, children were asked questions about
themselves, their classrooms, and the characteristics of their home environments. Across the
whole sample, the profile of G1 and G2 students is:6
17% of G1 and 25% of G2 students indicate that they have already done “a test like this.”
98% of students in both grades were at the school for the entire year, and 88% of G2
students were at the same school the year before, so we can be confident that the skills
measured reflect teaching at the school level.
84% of G1 students and 90% of G2 students are the appropriate age for the grade they are
in (6 or 7 for G1, and 7 or 8 for G2).
92% of students sampled speak the language of instruction of the school (and the
language of the EGRA) with their parents; 68% use only that language in the home, while
the remainder report that there are other languages used in the home.
This year, students were not asked questions about socio-economic status (SES) in an attempt to
keep the questionnaire brief. The relationship between SES and results has been established in
previous surveys; however, this limits the ability to control for SES in the regression analyses.
6 Data are weighted, and student-reported (not otherwise verified by the study).

EdData II Task Order 15 (DEP-AME)
Philippines EGRA Four Language Study – 2015 Follow-On 11
1 Hiligaynon
1.1 Background
Sample. The 2015 sample was drawn from the list of schools provided in 2014 (schools that
reported using Hiligaynon as the mother tongue). During fieldwork planning, after the sample
was drawn, it was determined that some of the schools in the sample were not using Hiligaynon
as the mother tongue, and the sample was redrawn excluding the divisions of Aklan and Antique
and the districts of Cauayan II, Hinobaan, Sagay City District I, San Carlos City District III, and
Escalante II. The target sample was 800 students (400 G1 and 400 G2); the actual number of
records used in the analysis was 389 G1 and 391 G2 for a total of 780 students assessed between
March 2 and 6. Additionally, 39 G1 teachers and 38 G2 teachers were interviewed and 38
reading classrooms (for the same teachers) were observed in each grade. Characteristics of the
region, based on weighted averages of student and teacher questionnaire items, are described in
Table 4.
Table 4. Hiligaynon – selected characteristics by grade (2015)
Characteristics G1 G2
Percentage of children who…
… are overage (>7 in G1; >8 in G2; student reported) 6% 15%
… have been at the same school for two years (student reported) 87% 96%
… had no recorded absences in Feb. 2015 (from official school records) 65% 69%
… have a teacher whose native language is Hiligaynon (teacher-reported) 79% 87%
… have no books at home 40% 41%
… speak Hiligaynon at home (student-reported) 91% 89%
… report that their teacher speaks mostly Hiligaynon in class this year 92% 88%
… report that the teacher never uses the MTB-MLE reading book for Hiligaynon 28% 13%
Average number of days absent in Feb. 2015 for children with any absences 1.9 days 2.1 days
Percentage of children whose teacher…
… is teaching in the mother tongue for the first time this year 9% 11%
… has already used EGRA in the classroom with their children 42% 37%
… has the MTB-MLE learner materials (textbook) 93% 89%
… has a teacher’s guide 67% 65%

EdData II Task Order 15 (DEP-AME)
Philippines EGRA Four Language Study – 2015 Follow-On 12
… has never received training in beginning reading 8% 6%
Benchmarking. At the 2014 benchmarking workshop, the Hiligaynon team established, on the
basis of previous survey work, the following recommended benchmarks and targets (see Table
5). This report describes progress towards benchmarks in these areas.
Table 5. Hiligaynon reading benchmarks drafted in the 2014 benchmarking workshop
Grade 1 Grade 2
ORF
(cwpm) Comprehension
(% correct) ORF
(cwpm) Comprehension
(% correct)
Long-range goal 25 60% 50 80%
Benchmark by end 2015–2016 20 40% 45 62%
Maximum % scoring zero by end 2015–2016
25% 40% 10% 15%
1.2 EGRA results
1.2.1 Hiligaynon reading
Table 6 below summarizes the scores across grades, years, and subtasks in terms of average
items correct per minute and percent of children scoring zero. As a reminder, a positive change is
a decrease in zero scores, and an increase in the mean.
Table 6. Hiligaynon – Performance on Reading Subtasks
Grade 1 Grade 2
Percent scoring zero 2014 2015 2014 2015
Letter sound knowledge 22% 24% 14% 26%
Decoding 45% 32% 21% 24%
Reading fluency 44% 36% 22% 25%
Reading comprehension 64% 59% 31% 39%
Grade 1 Grade 2
Average items correct per minute 2014 2015 2014 2015
Letter sound knowledge 11.6 11.2 13.0 11.6
Decoding 9.8 9.8 21.1 16.3*
Reading fluency 12.9 13.7 31.6 27.0
Reading comprehension 0.8 0.8 2.1 1.7

EdData II Task Order 15 (DEP-AME)
Philippines EGRA Four Language Study – 2015 Follow-On 13
* Statistically significant difference from 2014 to 2015
No improvement in performance (in terms of average items read per minute) is apparent on any
of the subtasks, in either grade, from 2014 to 2015; in fact, the mean items correct decreases for
G2 students in 2015. Furthermore, G2 students did no better on letter-sound identification than
G1 in either year of the assessment. Surprisingly, the proportion of children who scored zero on
the letter sounds task increased from 2014 to 2015 in both grades, nearly doubling in the case of
G2 students. Figure 3, Figure 4, Figure 5, and Figure 6 show the distribution of scores by
grade and by year for letter sounds.
The proportion of G2 children with zero scores also increased from 2014 to 2015 on the other
subtasks, though not by as much as letter sounds. This is difficult to explain since the proportion
of zero scores stays about the same or decreases in G1 from 2014 to 2015 on all of the subtasks.
One explanation is the characteristics of the sample in this region; this is a region where
community languages overlap geographically, and it may be that children are going to a school
that is not using their mother tongue.7 According to exit interview data, about 10% of children in
G2 (and 6% in G1) do not use Hiligaynon at home, compared to 2–3% in the 2014 sample.
Although the two studies do not measure the same individuals, the random sampling allows us to
assume that the cohort of 2015 represents the same cohort that moved up from G1 in 2014, and
therefore it may indicate that children who did not achieve letter sound knowledge in G1 are still
failing to master that skill in G2. Similarly, more teachers in this year’s sample are not native
Hiligaynon speakers. Teachers report at least three different sequences for teaching the
alphabet—vowels first, alphabetical order (a,b,c,d,e…), and a custom sequence
(a,u,g,i,s,b,t,l,y….). The type of error made, as observed and recorded by the assessors, was
mostly saying the letter name or saying the sound as a syllable, in equal proportions (40%). Thus
the problem isn’t as serious as it could be—i.e., a total lack of recognition of the letters or
mistaking a letter for a different letter; but the subtest isn’t allowing us to determine precisely if
children understand letter-sound correspondence. However, we can determine this indirectly
through their capacity to decode nonwords (invented words that nonetheless resemble real
Hiligaynon words orthographically).
For nonword decoding, scores improve from G1 to G2 in both years. Although there are more
zero scores for G2 in 2015, there are also more children in the lower ranges than in the higher
ranges after two years of mother-tongue instruction. On the other hand, the difference between
G1 and G2 is clear—children start to reach the higher ranges of words per minute read after two
years of instruction. The 2015 G2 cohort shows clearly that performance for that group improved
from 2014 to 2015 in terms of reducing zero scores and having more children reach higher
ranges. Figure 4 shows the distribution on the nonword decoding task.
Means on reading fluency and comprehension also improve from G1 to G2 in both years of the
study, although the magnitude of the differences is not as great in 2015. For example, in 2014,
the inter-grade difference between children in the same school was 18.7 correct words per
7 And, as mentioned in the section 1.1 Background, the sample selection changed somewhat from 2014 because of
last minute exclusions.

EdData II Task Order 15 (DEP-AME)
Philippines EGRA Four Language Study – 2015 Follow-On 14
minute on reading fluency; in 2015 that difference is only 13.3 words per minute. As shown in
Figure 5, the change in ORF from 2014 to 2015 has improved for G1 in terms of reducing the
proportion of zero scores by 18% and by increasing the proportion of children scoring in a
measurable range. In G2 there are slightly more children with zero scores and in the lower ranges
of the distribution than in the higher ranges. However, overall grade level differences are clear,
in that more children start to read above 40 correct words per minute (cwpm) in G2. Also at the
cohort level (G1 in 2014 compared to G2 in 2015) we see a drop in zero scores, a steady
proportion of children reading in the lower ranges of fluency (11 to 30 cwpm) and then a large
increase in the proportion of children reading above 40 cwpm. Again, this can probably be
explained by the approximately 10% of children who do not use Hiligaynon at home, but find
themselves in a Hiligaynon school.
The benchmarks established were that, in the long term, G1 children should be able to read 25
cwpm and G2 children should be able to read 50 cwpm. The teams agreed that in the short term
they would like to see at least 50% of children reading 20 cwpm or more in G1 and 50% reading
45 cwpm or more in G2. The data show that 29% of children in G1 are reaching the reading
benchmark, and 25% of G2 students are reaching the comprehension benchmark. Thus there is
still more to be done to increase the rate at which children achieve the higher level of fluency.
In reading comprehension, the benchmarks were that in the long term, children should reach 60%
comprehension in G1 and 80% comprehension in G2. In the short term, the teams agreed that by
the end of the 2015–2016 school year at least 25% of G1 children would achieve 40%
comprehension, and 30% of G2 students would achieve 62% comprehension. These targets have
been achieved in 2015, but actual performance is lower than in 2014. Comprehension scores
from both years and grades are presented in Figure 6. G2 children are not achieving significantly
higher scores in comprehension than G1 students, and the largest proportion of children in both
grades is in the zero score range. The reasons for such low reading comprehension should be
examined in more detail.
Figure 3. Hiligaynon – Letter sound identification (distribution)
0%10%20%30%40%50%
0 1-10 11-20 21-30 31-40 41-50 51-60 61-70
Range of letter sounds correctly identified per minute
Percent of children in each range
Grade 1--2014
Grade 1--2015
Grade 2--2014
Grade 2--2015

EdData II Task Order 15 (DEP-AME)
Philippines EGRA Four Language Study – 2015 Follow-On 15
Figure 4. Hiligaynon – Nonword decoding (distribution)
Figure 5. Hiligaynon – Reading fluency (distribution)
Figure 6. Hiligaynon – Reading comprehension (distribution)
Boys are also falling behind girls in all areas. Figure 7 below shows that girls outperform boys
by 34 to 48% on all subtasks (all differences are statistically significant). This translates to 10.7
cwpm more on oral reading fluency. Though not pictured, G1 differences between boys and girls
were even larger—almost double in the case of ORF and comprehension.
0%10%20%30%40%50%
0 1-10 11-20 21-30 31-40 41-50 51-60 61-70
Range of nonwords decoded per minute
Percent of children in each range
Grade 1--2014
Grade 1--2015
Grade 2--2014
Grade 2--2015
0%10%20%30%40%50%
0 1-10 11-20 21-30 31-40 41-50 51-60 61-70 71-80 81-90 91-100
Range of oral reading fluency scores
Percent of children in each range
Grade 1--2014
Grade 1--2015
Grade 2--2014
Grade 2--2015
0%20%40%60%80%
100%
0 20% 40% 60% 80% 100%
Percent correct on comprehension questions
Percent of children in category
Grade 1--2014
Grade 1--2015
Grade 2--2014
Grade 2--2015

EdData II Task Order 15 (DEP-AME)
Philippines EGRA Four Language Study – 2015 Follow-On 16
Figure 7. Hiligaynon – Differences between boys’ and girls’ scores (G2 only)
1.2.2 Filipino and English
The development of reading in Filipino should begin in G2, although oral language was
introduced already in G1. All but 7 children confirmed that they were learning Filipino in school.
However, in 2015 performance has declined on all measures compared to 2014. The mean cwpm
on Filipino familiar word reading is 23, down from 29, and this is statistically significant (at the
.05 level) although the decrease in percent correct and the increase in zero scores, shown in
Figure 8a and 8b, below, are not. For Filipino listening comprehension, student performance
declined significantly: the percent correct declined nearly 30 percentage points, while zero scores
more than doubled.8
As a reminder, when viewing these results, a positive result would be indicated by a downward
sloping (decrease) line connecting zero scores (at left in the graph) and an upward sloping one
(increase) connecting the means (at right in the graph).
8 Both these changes are statistically significant at the .001 level.
48%
34%
48%
50% higher average score for girls
0 5 10 15 20 25 30 35
Letter sounds
Nonwords
ORF
Comprehension
Subtask score (correct items per minute or total correct items [Comprehension])
Percent advantage of girls over boys in each subtask
Boys
Girls

EdData II Task Order 15 (DEP-AME)
Philippines EGRA Four Language Study – 2015 Follow-On 17
Figure 8. Hiligaynon – Filipino language development
8a) Percent zero scores 8b) Mean percent correct
English vocabulary development also shows a decline from 2014. There are more students who
did not get any questions correct (zero scores) and a lower overall average number of correct
responses (both differences are statistically significant at the .05 level). Figure 9a and 9b below
show the magnitude of the changes on these two tasks. A very low percentage of children scored
zero on the component that asks them to identify objects around the classroom, but the average
percent correct declines from 71% to 63%. The most difficult task is executing commands
(prepositional phrases like “put the pencil behind you”), in which a third of children scored zero
in 2015 and the mean percent correct decreased from 2014. Finally, zero scores more than
doubled—from 8% to 17%—for identifying parts of the body.
Figure 9. Hiligaynon – English language development
9a) Percent zero scores 9b) Mean percent correct
EdData II Task Order 15 (DEP-AME)
Philippines EGRA Four Language Study – 2015 Follow-On 18
1.3 MTB-MLE implementation
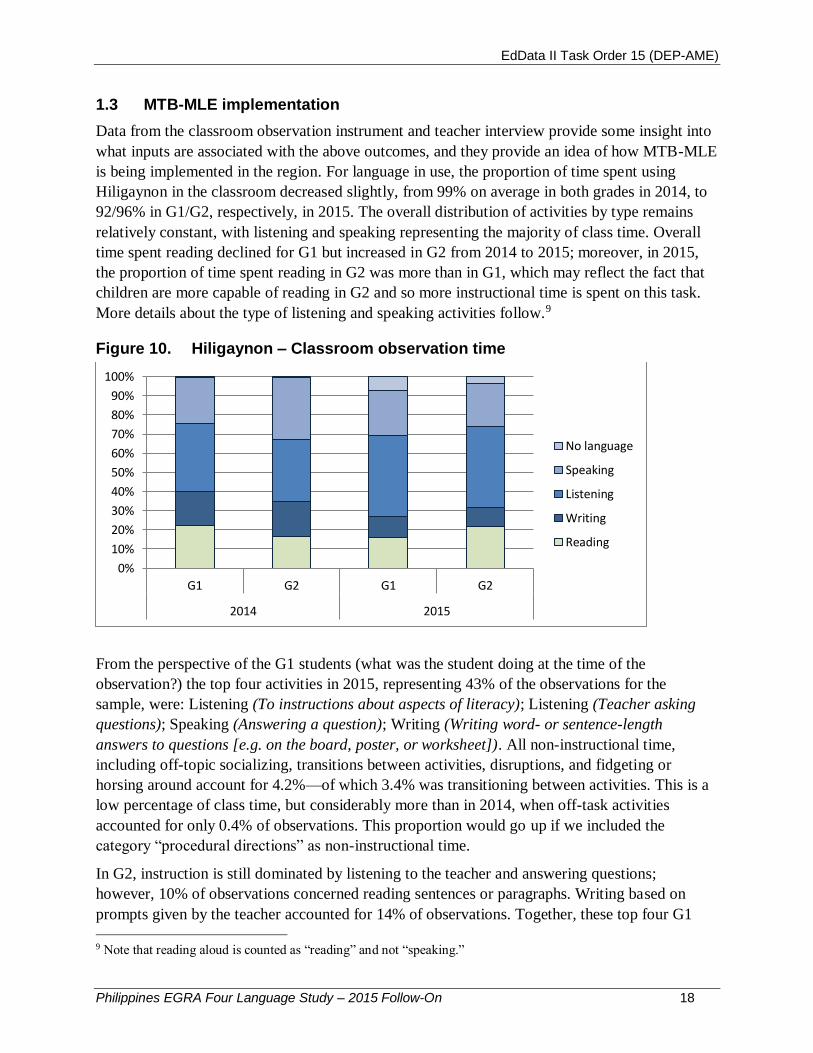
Data from the classroom observation instrument and teacher interview provide some insight into
what inputs are associated with the above outcomes, and they provide an idea of how MTB-MLE
is being implemented in the region. For language in use, the proportion of time spent using
Hiligaynon in the classroom decreased slightly, from 99% on average in both grades in 2014, to
92/96% in G1/G2, respectively, in 2015. The overall distribution of activities by type remains
relatively constant, with listening and speaking representing the majority of class time. Overall
time spent reading declined for G1 but increased in G2 from 2014 to 2015; moreover, in 2015,
the proportion of time spent reading in G2 was more than in G1, which may reflect the fact that
children are more capable of reading in G2 and so more instructional time is spent on this task.
More details about the type of listening and speaking activities follow.9
Figure 10. Hiligaynon – Classroom observation time
From the perspective of the G1 students (what was the student doing at the time of the
observation?) the top four activities in 2015, representing 43% of the observations for the
sample, were: Listening (To instructions about aspects of literacy); Listening (Teacher asking
questions); Speaking (Answering a question); Writing (Writing word- or sentence-length
answers to questions [e.g. on the board, poster, or worksheet]). All non-instructional time,
including off-topic socializing, transitions between activities, disruptions, and fidgeting or
horsing around account for 4.2%—of which 3.4% was transitioning between activities. This is a
low percentage of class time, but considerably more than in 2014, when off-task activities
accounted for only 0.4% of observations. This proportion would go up if we included the
category “procedural directions” as non-instructional time.
In G2, instruction is still dominated by listening to the teacher and answering questions;
however, 10% of observations concerned reading sentences or paragraphs. Writing based on
prompts given by the teacher accounted for 14% of observations. Together, these top four G1
9 Note that reading aloud is counted as “reading” and not “speaking.”
0%
10%
20%
30%
40%
50%
60%
70%
80%
90%
100%
G1 G2 G1 G2
2014 2015
No language
Speaking
Listening
Writing
Reading
EdData II Task Order 15 (DEP-AME)
Philippines EGRA Four Language Study – 2015 Follow-On 19
activities account for 45% of observations. G2 time spent off-task is close to 1% in both years.
Additionally, during 9% of observations in 2015 students were listening to the teacher give
procedural directions.
The teacher perspective tells a similar story, with instruction in both grades and years dominated
by asking questions, explaining subject matter, waiting for students to respond or giving
procedural directions. For G1, 41% of observations were coded as “Waiting for pupils to
respond”—considerably more than in 2014 (23%). The proportion of time recorded as “off task”
is close to 2% in 2015 in both grades, which is an increase from almost none in G1. Keeping in
mind the limitations of a one-time observation of classrooms, we do get a sense that instruction
is still largely teacher-led, with whole-class configuration accounting for at least 50% of
observations in G1 in both years. However, the proportion of whole class “attention on teacher”
instruction has gone down in 2015, from nearly 75% of observations in G1 and 66% in G2 in
2014, with modest increases evident in individual and group work.
MTB-MLE index. A high-level look at the MTB-MLE index components shows that the region
is improving in terms of MTB-MLE implementation.
Table 7. Hiligaynon – Summary of index scores (means)
2014 2015
Component 1 (out of 22 points) 11 10
Component 2 (out of 13 points) 6 8
Component 3 (out of 15 points) 6 6
Combined (out of 50 points) 24 23
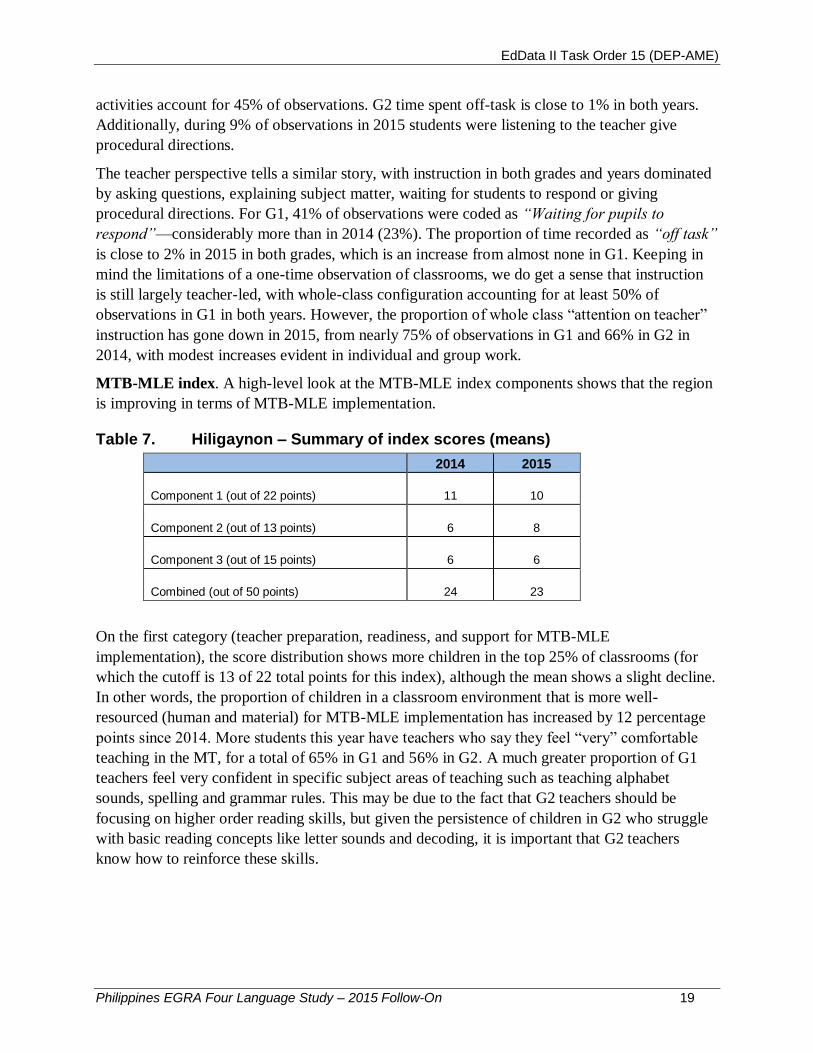
On the first category (teacher preparation, readiness, and support for MTB-MLE
implementation), the score distribution shows more children in the top 25% of classrooms (for
which the cutoff is 13 of 22 total points for this index), although the mean shows a slight decline.
In other words, the proportion of children in a classroom environment that is more well-
resourced (human and material) for MTB-MLE implementation has increased by 12 percentage
points since 2014. More students this year have teachers who say they feel “very” comfortable
teaching in the MT, for a total of 65% in G1 and 56% in G2. A much greater proportion of G1
teachers feel very confident in specific subject areas of teaching such as teaching alphabet
sounds, spelling and grammar rules. This may be due to the fact that G2 teachers should be
focusing on higher order reading skills, but given the persistence of children in G2 who struggle
with basic reading concepts like letter sounds and decoding, it is important that G2 teachers
know how to reinforce these skills.
EdData II Task Order 15 (DEP-AME)
Philippines EGRA Four Language Study – 2015 Follow-On 20
Figure 11. Hiligaynon – Component 1 score index distribution
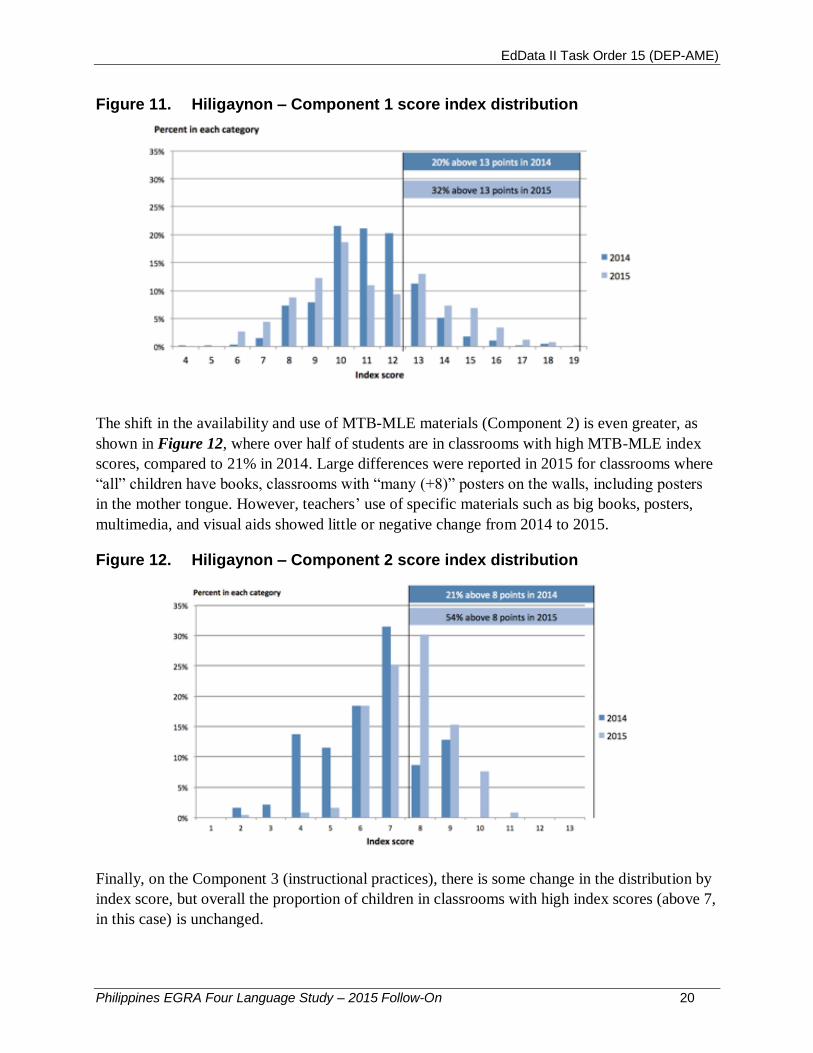
The shift in the availability and use of MTB-MLE materials (Component 2) is even greater, as
shown in Figure 12, where over half of students are in classrooms with high MTB-MLE index
scores, compared to 21% in 2014. Large differences were reported in 2015 for classrooms where
“all” children have books, classrooms with “many (+8)” posters on the walls, including posters
in the mother tongue. However, teachers’ use of specific materials such as big books, posters,
multimedia, and visual aids showed little or negative change from 2014 to 2015.
Figure 12. Hiligaynon – Component 2 score index distribution
Finally, on the Component 3 (instructional practices), there is some change in the distribution by
index score, but overall the proportion of children in classrooms with high index scores (above 7,
in this case) is unchanged.
EdData II Task Order 15 (DEP-AME)
Philippines EGRA Four Language Study – 2015 Follow-On 21
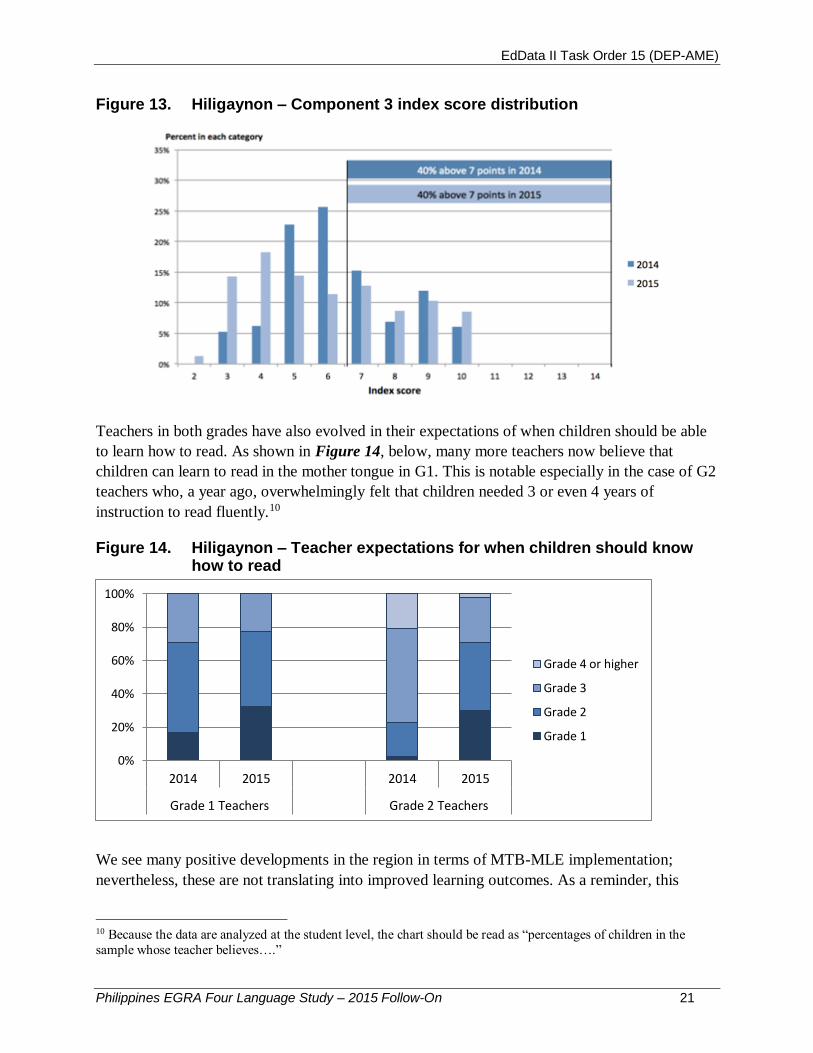
Figure 13. Hiligaynon – Component 3 index score distribution
Teachers in both grades have also evolved in their expectations of when children should be able
to learn how to read. As shown in Figure 14, below, many more teachers now believe that
children can learn to read in the mother tongue in G1. This is notable especially in the case of G2
teachers who, a year ago, overwhelmingly felt that children needed 3 or even 4 years of
instruction to read fluently.10
Figure 14. Hiligaynon – Teacher expectations for when children should know how to read
We see many positive developments in the region in terms of MTB-MLE implementation;
nevertheless, these are not translating into improved learning outcomes. As a reminder, this
10 Because the data are analyzed at the student level, the chart should be read as “percentages of children in the
sample whose teacher believes….”
0%
20%
40%
60%
80%
100%
2014 2015 2014 2015
Grade 1 Teachers Grade 2 Teachers
Grade 4 or higher
Grade 3
Grade 2
Grade 1

EdData II Task Order 15 (DEP-AME)
Philippines EGRA Four Language Study – 2015 Follow-On 22
survey measures only certain aspects of implementation and classroom instruction. Other aspects
of MTB-MLE implementation should be explored through other types of research. For example,
what is the quality of the MTB-MLE materials? How are teachers implementing the curriculum
throughout the year? Is there sufficient time dedicated to reading during the school day? What
type of support is being provided at home? What other demographic issues may be affecting
school outcomes? Some additional research, support and training in this region may be necessary
to identify specific areas of improvement in the implementation of MTB-MLE that could
accelerate progress towards the benchmarks.
The draft report was shared with Region VI staff to solicit their reactions to the levels of student
performance described above. A group of officials at the regional level who have been involved
in the preparation and the implementation of the 2014 and 2015 studies solicited reactions to
these results and shared with the authors of this report their responses to specific questions
relating to how they account for some of the changes in performance from 2014 to 2015 and to
offer their recommendations for how they intend to improve the teaching and learning of reading
in Hiligaynon. The results of their consultations and discussions are presented in Annex 2.
EdData II Task Order 15 (DEP-AME)
Philippines EGRA Four Language Study – 2015 Follow-On 23
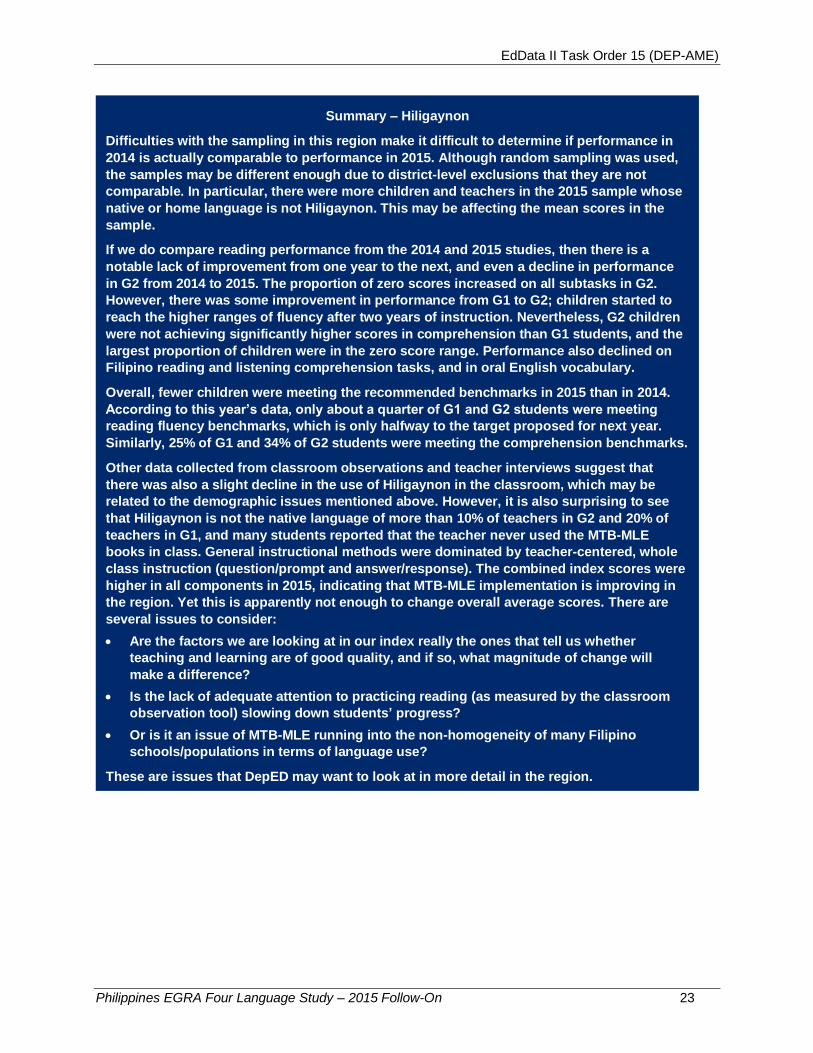
Summary – Hiligaynon
Difficulties with the sampling in this region make it difficult to determine if performance in
2014 is actually comparable to performance in 2015. Although random sampling was used,
the samples may be different enough due to district-level exclusions that they are not
comparable. In particular, there were more children and teachers in the 2015 sample whose
native or home language is not Hiligaynon. This may be affecting the mean scores in the
sample.
If we do compare reading performance from the 2014 and 2015 studies, then there is a
notable lack of improvement from one year to the next, and even a decline in performance
in G2 from 2014 to 2015. The proportion of zero scores increased on all subtasks in G2.
However, there was some improvement in performance from G1 to G2; children started to
reach the higher ranges of fluency after two years of instruction. Nevertheless, G2 children
were not achieving significantly higher scores in comprehension than G1 students, and the
largest proportion of children were in the zero score range. Performance also declined on
Filipino reading and listening comprehension tasks, and in oral English vocabulary.
Overall, fewer children were meeting the recommended benchmarks in 2015 than in 2014.
According to this year’s data, only about a quarter of G1 and G2 students were meeting
reading fluency benchmarks, which is only halfway to the target proposed for next year.
Similarly, 25% of G1 and 34% of G2 students were meeting the comprehension benchmarks.
Other data collected from classroom observations and teacher interviews suggest that
there was also a slight decline in the use of Hiligaynon in the classroom, which may be
related to the demographic issues mentioned above. However, it is also surprising to see
that Hiligaynon is not the native language of more than 10% of teachers in G2 and 20% of
teachers in G1, and many students reported that the teacher never used the MTB-MLE
books in class. General instructional methods were dominated by teacher-centered, whole
class instruction (question/prompt and answer/response). The combined index scores were
higher in all components in 2015, indicating that MTB-MLE implementation is improving in
the region. Yet this is apparently not enough to change overall average scores. There are
several issues to consider:
Are the factors we are looking at in our index really the ones that tell us whether
teaching and learning are of good quality, and if so, what magnitude of change will
make a difference?
Is the lack of adequate attention to practicing reading (as measured by the classroom
observation tool) slowing down students’ progress?
Or is it an issue of MTB-MLE running into the non-homogeneity of many Filipino
schools/populations in terms of language use?
These are issues that DepED may want to look at in more detail in the region.
EdData II Task Order 15 (DEP-AME)
Philippines EGRA Four Language Study – 2015 Follow-On 24
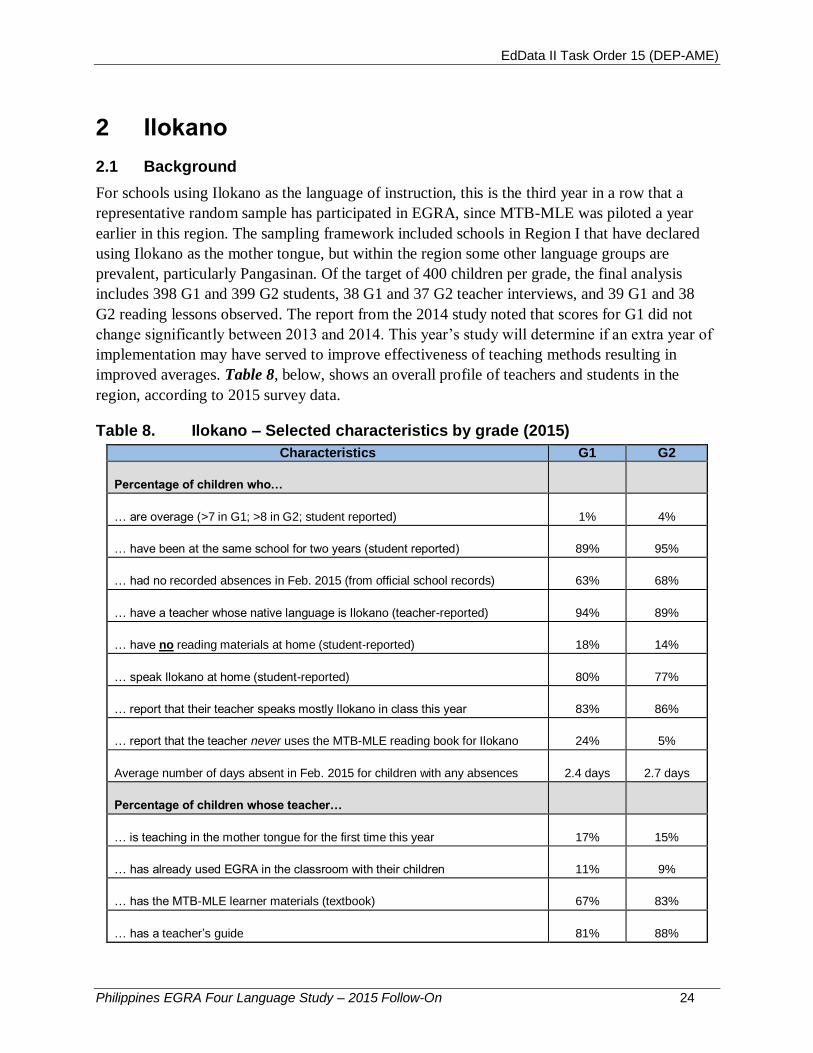
2 Ilokano
2.1 Background
For schools using Ilokano as the language of instruction, this is the third year in a row that a
representative random sample has participated in EGRA, since MTB-MLE was piloted a year
earlier in this region. The sampling framework included schools in Region I that have declared
using Ilokano as the mother tongue, but within the region some other language groups are
prevalent, particularly Pangasinan. Of the target of 400 children per grade, the final analysis
includes 398 G1 and 399 G2 students, 38 G1 and 37 G2 teacher interviews, and 39 G1 and 38
G2 reading lessons observed. The report from the 2014 study noted that scores for G1 did not
change significantly between 2013 and 2014. This year’s study will determine if an extra year of
implementation may have served to improve effectiveness of teaching methods resulting in
improved averages. Table 8, below, shows an overall profile of teachers and students in the
region, according to 2015 survey data.
Table 8. Ilokano – Selected characteristics by grade (2015)
Characteristics G1 G2
Percentage of children who…
… are overage (>7 in G1; >8 in G2; student reported) 1% 4%
… have been at the same school for two years (student reported) 89% 95%
… had no recorded absences in Feb. 2015 (from official school records) 63% 68%
… have a teacher whose native language is Ilokano (teacher-reported) 94% 89%
… have no reading materials at home (student-reported) 18% 14%
… speak Ilokano at home (student-reported) 80% 77%
… report that their teacher speaks mostly Ilokano in class this year 83% 86%
… report that the teacher never uses the MTB-MLE reading book for Ilokano 24% 5%
Average number of days absent in Feb. 2015 for children with any absences 2.4 days 2.7 days
Percentage of children whose teacher…
… is teaching in the mother tongue for the first time this year 17% 15%
… has already used EGRA in the classroom with their children 11% 9%
… has the MTB-MLE learner materials (textbook) 67% 83%
… has a teacher’s guide 81% 88%
EdData II Task Order 15 (DEP-AME)
Philippines EGRA Four Language Study – 2015 Follow-On 25
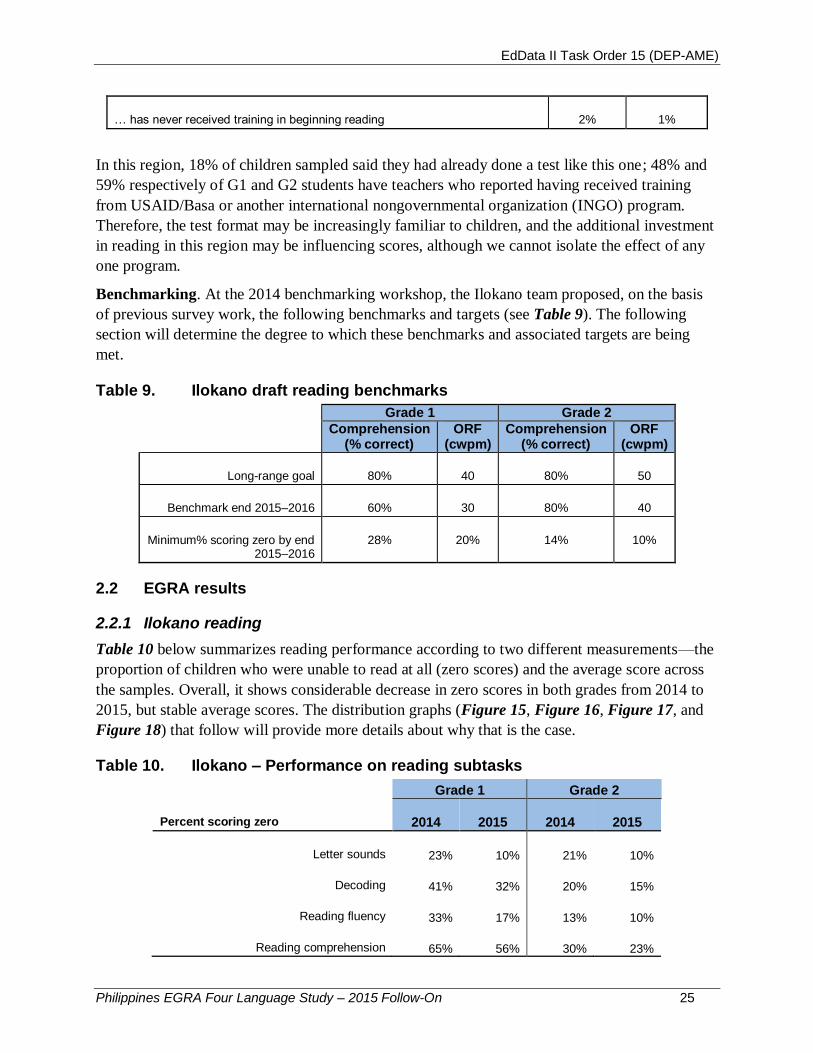
… has never received training in beginning reading 2% 1%
In this region, 18% of children sampled said they had already done a test like this one; 48% and
59% respectively of G1 and G2 students have teachers who reported having received training
from USAID/Basa or another international nongovernmental organization (INGO) program.
Therefore, the test format may be increasingly familiar to children, and the additional investment
in reading in this region may be influencing scores, although we cannot isolate the effect of any
one program.
Benchmarking. At the 2014 benchmarking workshop, the Ilokano team proposed, on the basis
of previous survey work, the following benchmarks and targets (see Table 9). The following
section will determine the degree to which these benchmarks and associated targets are being
met.
Table 9. Ilokano draft reading benchmarks
Grade 1 Grade 2
Comprehension
(% correct) ORF
(cwpm) Comprehension
(% correct) ORF
(cwpm)
Long-range goal 80% 40 80% 50
Benchmark end 2015–2016 60% 30 80% 40
Minimum% scoring zero by end 2015–2016
28% 20% 14% 10%
2.2 EGRA results
2.2.1 Ilokano reading
Table 10 below summarizes reading performance according to two different measurements—the
proportion of children who were unable to read at all (zero scores) and the average score across
the samples. Overall, it shows considerable decrease in zero scores in both grades from 2014 to
2015, but stable average scores. The distribution graphs (Figure 15, Figure 16, Figure 17, and
Figure 18) that follow will provide more details about why that is the case.
Table 10. Ilokano – Performance on reading subtasks
Grade 1 Grade 2
Percent scoring zero 2014 2015 2014 2015
Letter sounds 23% 10% 21% 10%
Decoding 41% 32% 20% 15%
Reading fluency 33% 17% 13% 10%
Reading comprehension 65% 56% 30% 23%

EdData II Task Order 15 (DEP-AME)
Philippines EGRA Four Language Study – 2015 Follow-On 26
Grade 1 Grade 2
Average items correct per minute 2014 2015 2014 2015
Letter sounds 14.7 14.5 16.8 17.8
Decoding 17.4 16.4 33.7 31.1
Reading fluency 14.7 17.7 30.1 33.4
Reading comprehension 0.9 1.1 2.2 2.4
The proportion of children with zero scores decreased on all subtasks in both grades from 2014
to 2015, with the largest decreases in letter sounds (G1 and G2) and G1 reading fluency as
measured by the short story reading passage, where the percentage of students having no reading
ability was cut almost in half. What is surprising, in the case of letter sounds, is that there is so
little difference between G1 and G2 across the distribution of scores, as evident in Figure 15.
This may indicate an overall lack of instruction on letter sounds in both grades, or interference in
letter sound articulation by a certain subpopulation of the sample.
On the other hand, the skill of applying letter-sound knowledge is translating into decoding
ability, which improves considerably from G1 to G2 for students learning to read in Ilokano in
this region, where four times as many children are decoding at a rate of more than 40 correct
nonwords per minute (cnwpm) this year (See Figure 16). As noted also in the 2014 report, in
most languages we expect story reading fluency to be a bit higher than decoding words in
isolation, since children can make use of context to anticipate words and draw on frequently used
vocabulary to increase reading speed. In Ilokano, this was not the case, probably because of its
agglutinative nature. In 2015, the averages do increase slightly, rather than decrease; however,
these are neither large nor statistically significant increases, so we can still consider that
decoding fluency and connected-text (story) reading fluency are very similar for this language.
Both the means and the distribution are very similar.
In reading comprehension, children are also performing much better this year, doubling and
tripling the number of children who answered 60% and 80% of questions correctly. Of G2
students 11% answered all questions correctly in 2015, compared to 1% in 2015. As a reminder,
the reading passage that children read this year was exactly the same as the reading passage used
in 2014. This means we can be sure that the change is not because the reading passage was
easier. We also anticipated that there could be a chance that this reading passage, developed
three years ago, and used last year, could have been circulated in classrooms and so children
were already familiar with it. To reassure us that this was not the case, all children read a second,
previously unused story. The results on the previously unseen reading passage were actually
slightly better than the results on the 2014 reused reading passage. Thus the trend is going
generally in the right direction, although the gains are relatively small and the region as a whole
is still far from meeting the benchmarks and targets it has proposed.
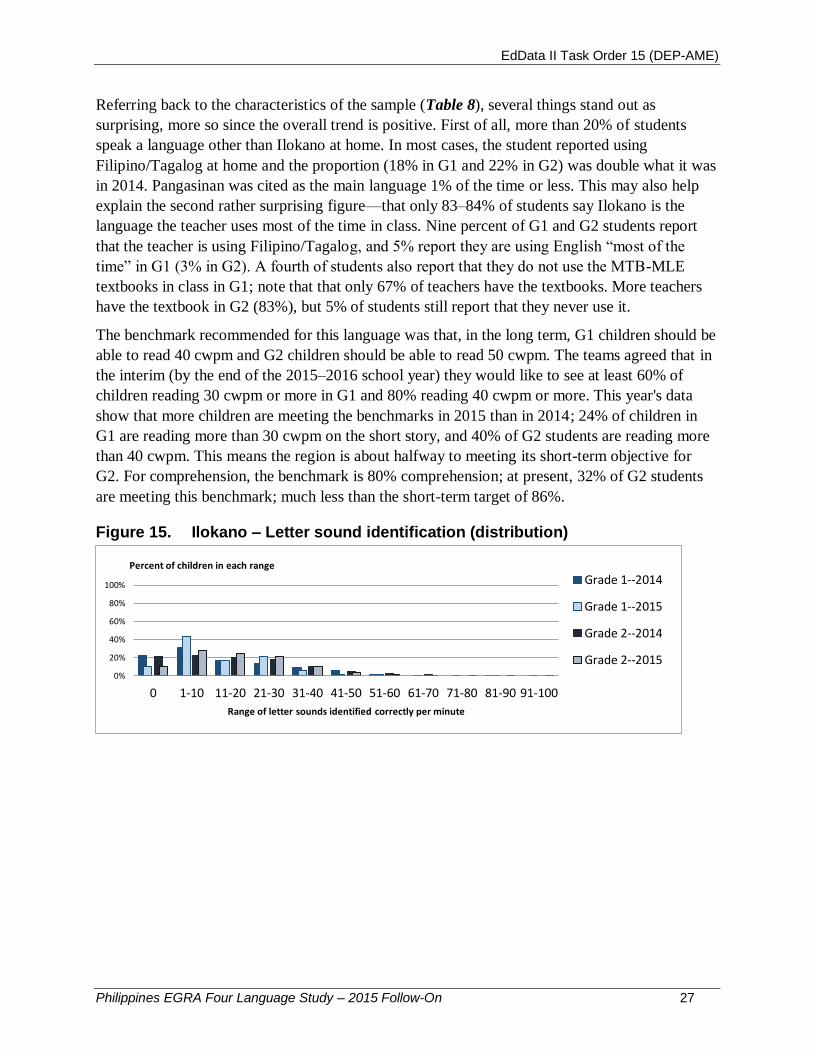
EdData II Task Order 15 (DEP-AME)
Philippines EGRA Four Language Study – 2015 Follow-On 27
Referring back to the characteristics of the sample (Table 8), several things stand out as
surprising, more so since the overall trend is positive. First of all, more than 20% of students
speak a language other than Ilokano at home. In most cases, the student reported using
Filipino/Tagalog at home and the proportion (18% in G1 and 22% in G2) was double what it was
in 2014. Pangasinan was cited as the main language 1% of the time or less. This may also help
explain the second rather surprising figure—that only 83–84% of students say Ilokano is the
language the teacher uses most of the time in class. Nine percent of G1 and G2 students report
that the teacher is using Filipino/Tagalog, and 5% report they are using English “most of the
time” in G1 (3% in G2). A fourth of students also report that they do not use the MTB-MLE
textbooks in class in G1; note that that only 67% of teachers have the textbooks. More teachers
have the textbook in G2 (83%), but 5% of students still report that they never use it.
The benchmark recommended for this language was that, in the long term, G1 children should be
able to read 40 cwpm and G2 children should be able to read 50 cwpm. The teams agreed that in
the interim (by the end of the 2015–2016 school year) they would like to see at least 60% of
children reading 30 cwpm or more in G1 and 80% reading 40 cwpm or more. This year's data
show that more children are meeting the benchmarks in 2015 than in 2014; 24% of children in
G1 are reading more than 30 cwpm on the short story, and 40% of G2 students are reading more
than 40 cwpm. This means the region is about halfway to meeting its short-term objective for
G2. For comprehension, the benchmark is 80% comprehension; at present, 32% of G2 students
are meeting this benchmark; much less than the short-term target of 86%.
Figure 15. Ilokano – Letter sound identification (distribution)
0%
20%
40%
60%
80%
100%
0 1-10 11-20 21-30 31-40 41-50 51-60 61-70 71-80 81-90 91-100
Range of letter sounds identified correctly per minute
Percent of children in each range
Grade 1--2014
Grade 1--2015
Grade 2--2014
Grade 2--2015
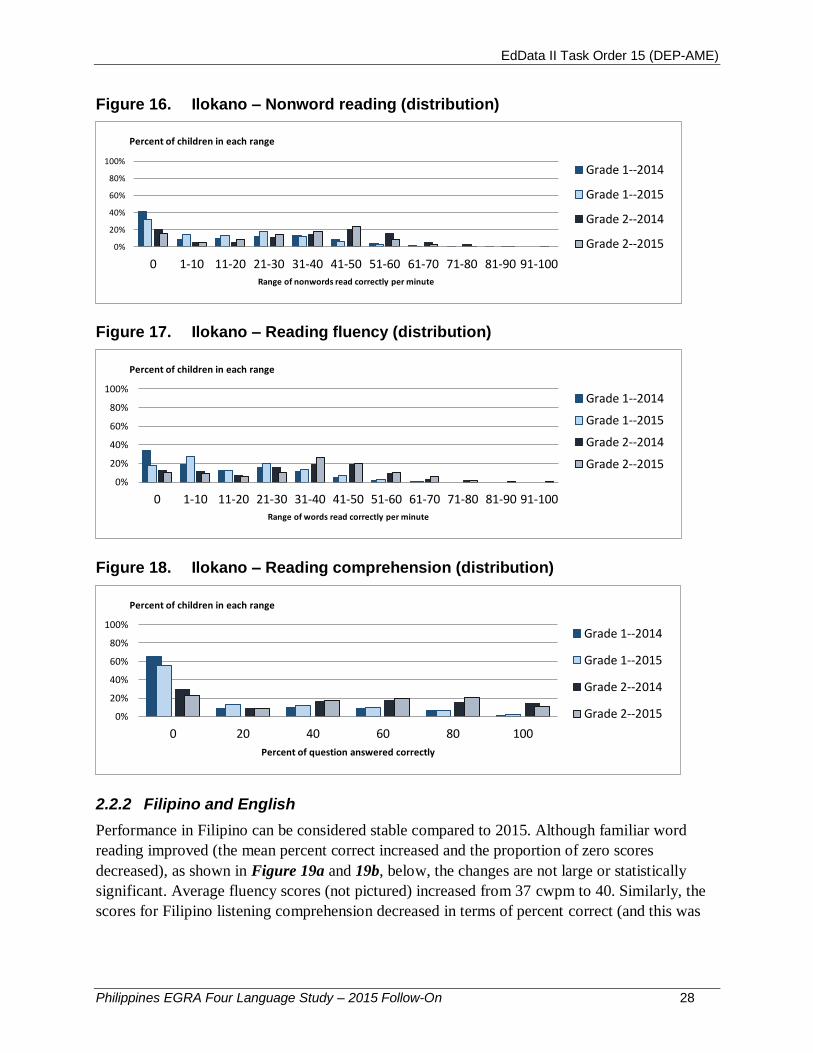
EdData II Task Order 15 (DEP-AME)
Philippines EGRA Four Language Study – 2015 Follow-On 28
Figure 16. Ilokano – Nonword reading (distribution)
Figure 17. Ilokano – Reading fluency (distribution)
Figure 18. Ilokano – Reading comprehension (distribution)
2.2.2 Filipino and English
Performance in Filipino can be considered stable compared to 2015. Although familiar word
reading improved (the mean percent correct increased and the proportion of zero scores
decreased), as shown in Figure 19a and 19b, below, the changes are not large or statistically
significant. Average fluency scores (not pictured) increased from 37 cwpm to 40. Similarly, the
scores for Filipino listening comprehension decreased in terms of percent correct (and this was
0%
20%
40%
60%
80%
100%
0 1-10 11-20 21-30 31-40 41-50 51-60 61-70 71-80 81-90 91-100Range of nonwords read correctly per minute
Percent of children in each range
Grade 1--2014
Grade 1--2015
Grade 2--2014
Grade 2--2015
0%
20%
40%
60%
80%
100%
0 1-10 11-20 21-30 31-40 41-50 51-60 61-70 71-80 81-90 91-100Range of words read correctly per minute
Percent of children in each range
Grade 1--2014
Grade 1--2015
Grade 2--2014
Grade 2--2015
0%
20%
40%
60%
80%
100%
0 20 40 60 80 100
Percent of question answered correctly
Percent of children in each range
Grade 1--2014
Grade 1--2015
Grade 2--2014
Grade 2--2015
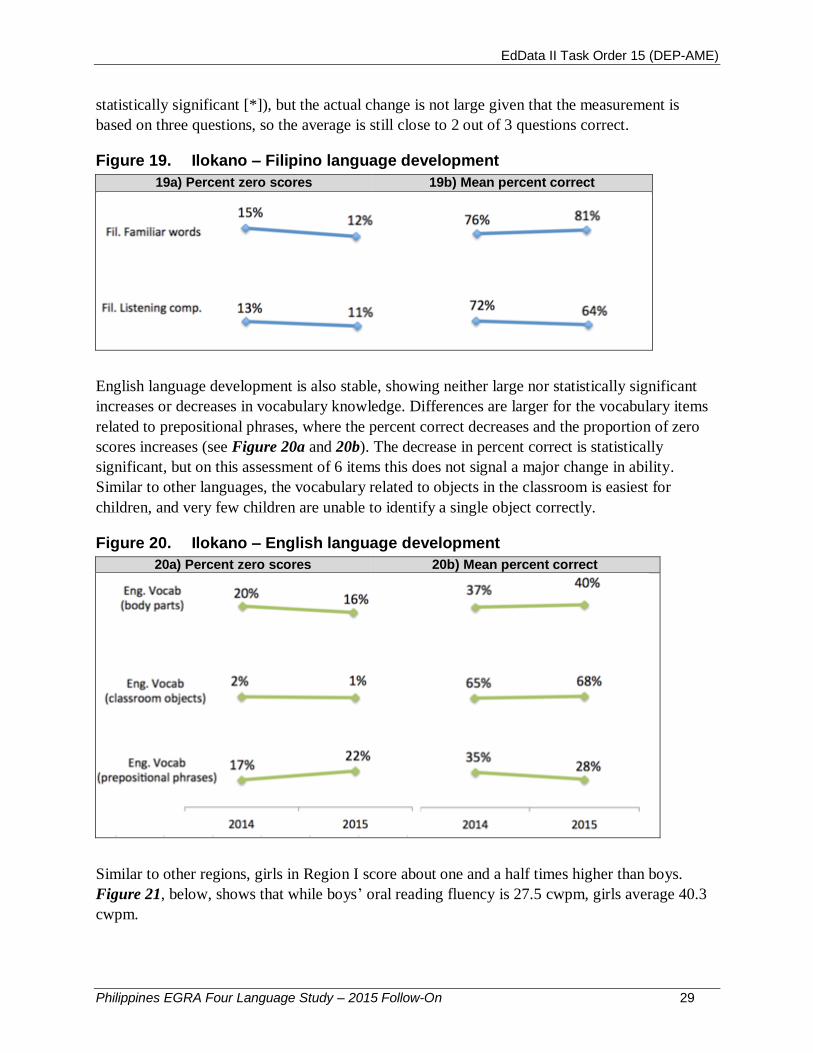
EdData II Task Order 15 (DEP-AME)
Philippines EGRA Four Language Study – 2015 Follow-On 29
statistically significant [*]), but the actual change is not large given that the measurement is
based on three questions, so the average is still close to 2 out of 3 questions correct.
Figure 19. Ilokano – Filipino language development
19a) Percent zero scores 19b) Mean percent correct
English language development is also stable, showing neither large nor statistically significant
increases or decreases in vocabulary knowledge. Differences are larger for the vocabulary items
related to prepositional phrases, where the percent correct decreases and the proportion of zero
scores increases (see Figure 20a and 20b). The decrease in percent correct is statistically
significant, but on this assessment of 6 items this does not signal a major change in ability.
Similar to other languages, the vocabulary related to objects in the classroom is easiest for
children, and very few children are unable to identify a single object correctly.
Figure 20. Ilokano – English language development
20a) Percent zero scores 20b) Mean percent correct
Similar to other regions, girls in Region I score about one and a half times higher than boys.
Figure 21, below, shows that while boys’ oral reading fluency is 27.5 cwpm, girls average 40.3
cwpm.
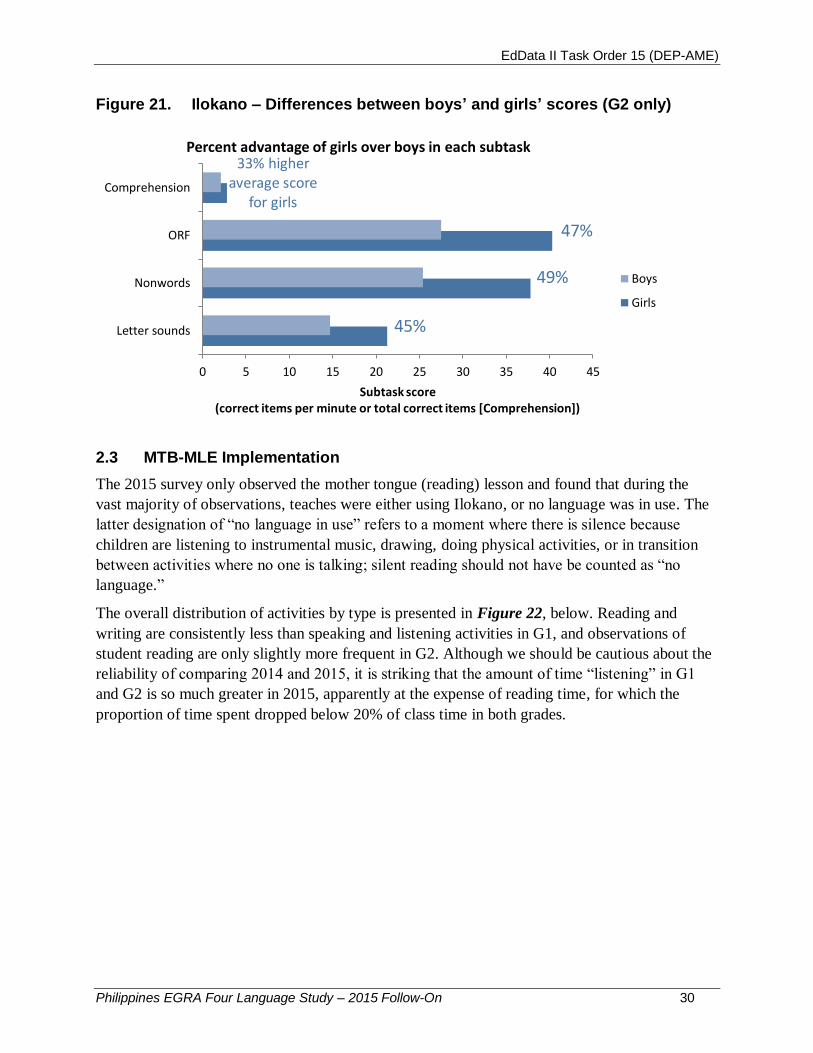
EdData II Task Order 15 (DEP-AME)
Philippines EGRA Four Language Study – 2015 Follow-On 30
Figure 21. Ilokano – Differences between boys’ and girls’ scores (G2 only)
2.3 MTB-MLE Implementation
The 2015 survey only observed the mother tongue (reading) lesson and found that during the
vast majority of observations, teaches were either using Ilokano, or no language was in use. The
latter designation of “no language in use” refers to a moment where there is silence because
children are listening to instrumental music, drawing, doing physical activities, or in transition
between activities where no one is talking; silent reading should not have be counted as “no
language.”
The overall distribution of activities by type is presented in Figure 22, below. Reading and
writing are consistently less than speaking and listening activities in G1, and observations of
student reading are only slightly more frequent in G2. Although we should be cautious about the
reliability of comparing 2014 and 2015, it is striking that the amount of time “listening” in G1
and G2 is so much greater in 2015, apparently at the expense of reading time, for which the
proportion of time spent dropped below 20% of class time in both grades.
45%
49%
47%
33% higher average score
for girls
0 5 10 15 20 25 30 35 40 45
Letter sounds
Nonwords
ORF
Comprehension
Subtask score (correct items per minute or total correct items [Comprehension])
Percent advantage of girls over boys in each subtask
Boys
Girls

EdData II Task Order 15 (DEP-AME)
Philippines EGRA Four Language Study – 2015 Follow-On 31
Figure 22. Ilokano – Classroom observation time
Looking in more detail at the type of listening, speaking, reading, and writing activities going on
at each observation moment, we deduce that in G1-2015, the instructional model consists
primarily of question and answer, in a whole class configuration. From the pupils’ point of view,
32% of observations concerned listening to questions or procedural directions, or answering
questions. The next most frequent activity, at 8% of observations, was writing word- or sentence-
length prompts. This pattern was very similar in G2 in 2015, with the same four activities
accounting for the top 37% of observations. Similarly, student time off-task accounted for 6% of
observations in both grades, with most of these coded as transitions between activities. In total,
the teacher was noted as “off task” in 3–4% of observations.
MTB-MLE index. The MTB-MLE index calculation is another way of understanding the profile
of instructional practice using the mother tongue.
Table 11. Ilokano – Summary of index scores (means)
2014 2015
Component 1 (out of 22 possible) 11 9
Component 2 (out of 13 possible) 6 8
Component 3 (out of 15 possible) 5 6
Combined 22 23
In Region 1, Component 1 of the index, dealing with teacher training, language use and support
for MTB-MLE at the school level is among the only one in the study showing a lower score in
2015 than 2014. The items that seem to be affecting this decline are fewer teachers who say they
have ever used EGRA in the classroom or who use any kind of frequent oral evaluation to
measure reading progress; less frequent lesson plans and observations by school leadership; and
fewer teachers who address poor reading outcomes through designing teaching materials,
planning new activities, or adapting teaching to better suit the needs of learners.
0%
20%
40%
60%
80%
100%
G1 G2 G1 G2
2014 2015
No language
Speaking
Listening
Writing
Reading
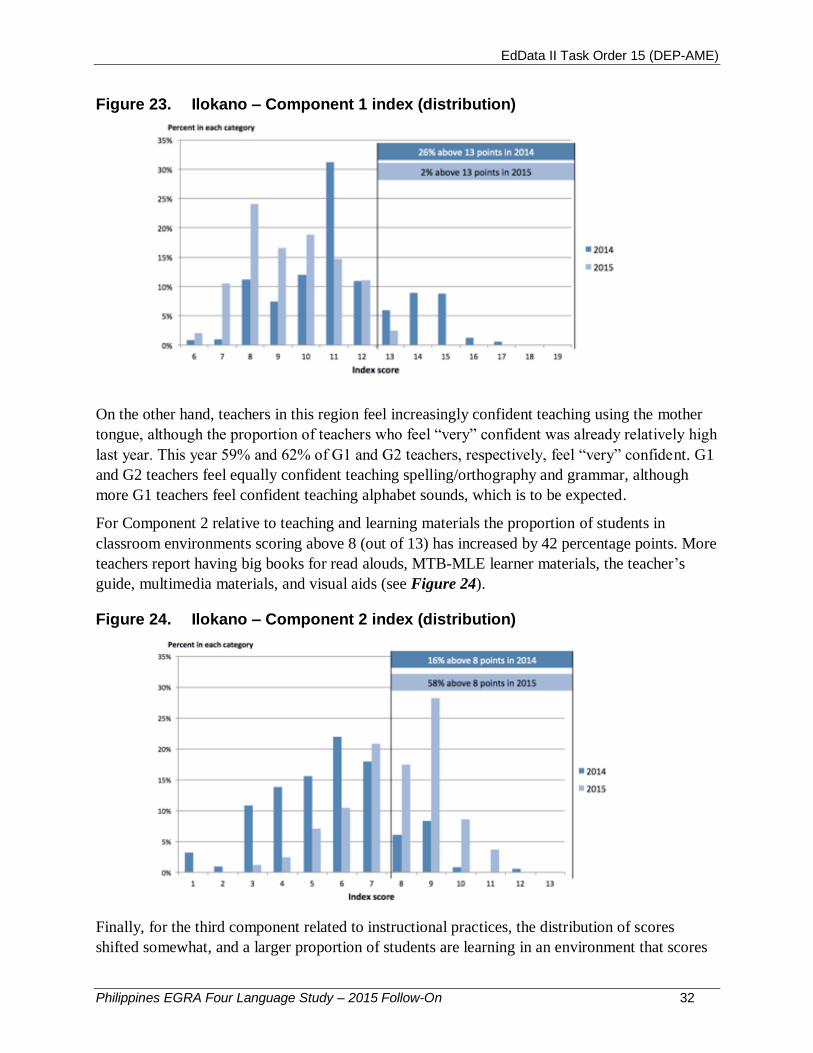
EdData II Task Order 15 (DEP-AME)
Philippines EGRA Four Language Study – 2015 Follow-On 32
Figure 23. Ilokano – Component 1 index (distribution)
On the other hand, teachers in this region feel increasingly confident teaching using the mother
tongue, although the proportion of teachers who feel “very” confident was already relatively high
last year. This year 59% and 62% of G1 and G2 teachers, respectively, feel “very” confident. G1
and G2 teachers feel equally confident teaching spelling/orthography and grammar, although
more G1 teachers feel confident teaching alphabet sounds, which is to be expected.
For Component 2 relative to teaching and learning materials the proportion of students in
classroom environments scoring above 8 (out of 13) has increased by 42 percentage points. More
teachers report having big books for read alouds, MTB-MLE learner materials, the teacher’s
guide, multimedia materials, and visual aids (see Figure 24).
Figure 24. Ilokano – Component 2 index (distribution)
Finally, for the third component related to instructional practices, the distribution of scores
shifted somewhat, and a larger proportion of students are learning in an environment that scores
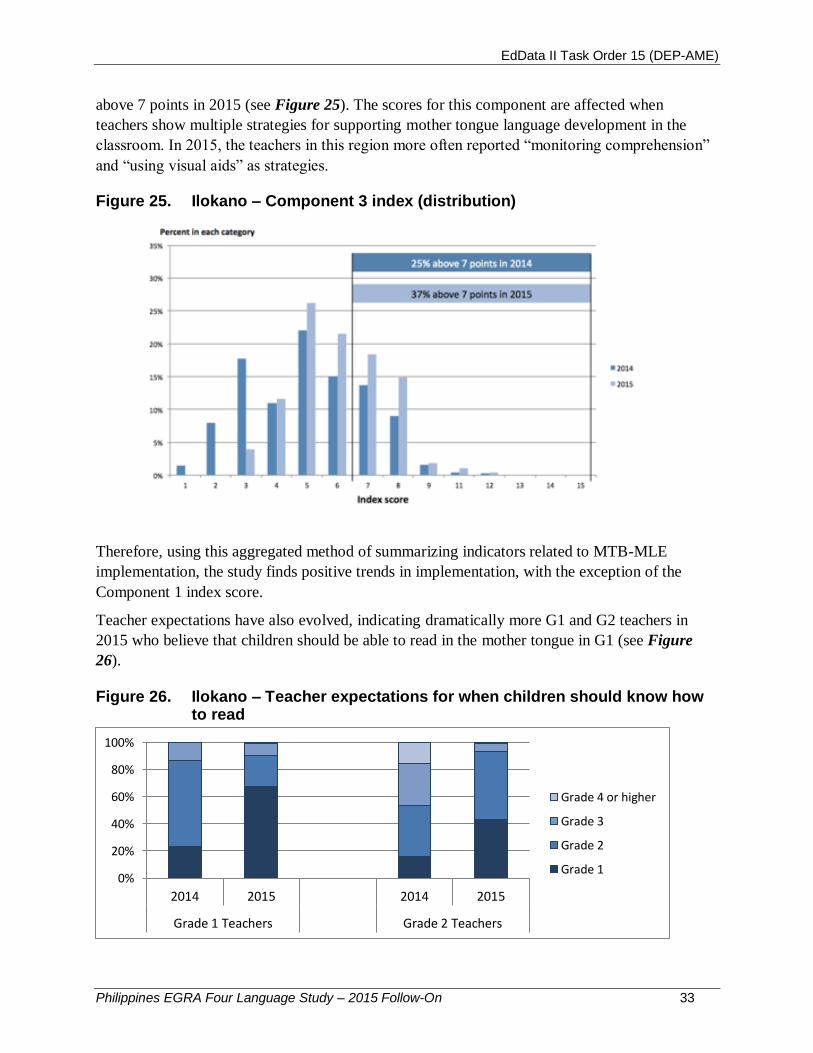
EdData II Task Order 15 (DEP-AME)
Philippines EGRA Four Language Study – 2015 Follow-On 33
above 7 points in 2015 (see Figure 25). The scores for this component are affected when
teachers show multiple strategies for supporting mother tongue language development in the
classroom. In 2015, the teachers in this region more often reported “monitoring comprehension”
and “using visual aids” as strategies.
Figure 25. Ilokano – Component 3 index (distribution)
Therefore, using this aggregated method of summarizing indicators related to MTB-MLE
implementation, the study finds positive trends in implementation, with the exception of the
Component 1 index score.
Teacher expectations have also evolved, indicating dramatically more G1 and G2 teachers in
2015 who believe that children should be able to read in the mother tongue in G1 (see Figure
26).
Figure 26. Ilokano – Teacher expectations for when children should know how to read
0%
20%
40%
60%
80%
100%
2014 2015 2014 2015
Grade 1 Teachers Grade 2 Teachers
Grade 4 or higher
Grade 3
Grade 2
Grade 1
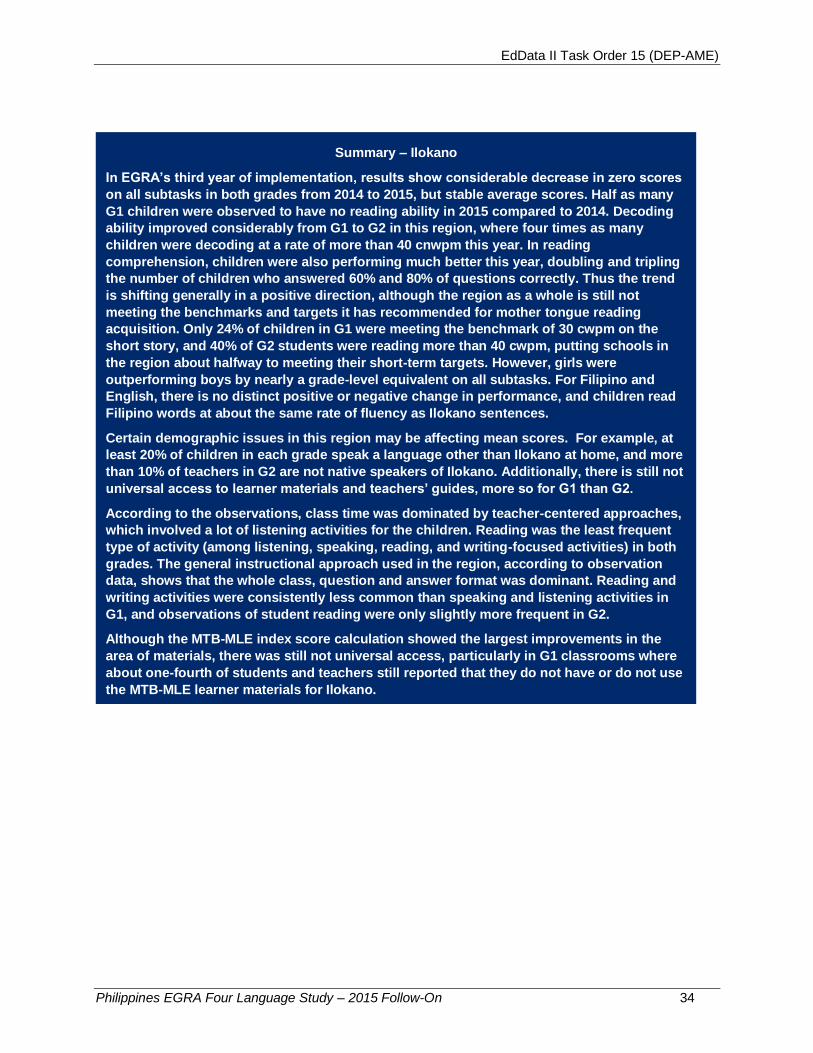
EdData II Task Order 15 (DEP-AME)
Philippines EGRA Four Language Study – 2015 Follow-On 34
Summary – Ilokano
In EGRA’s third year of implementation, results show considerable decrease in zero scores
on all subtasks in both grades from 2014 to 2015, but stable average scores. Half as many
G1 children were observed to have no reading ability in 2015 compared to 2014. Decoding
ability improved considerably from G1 to G2 in this region, where four times as many
children were decoding at a rate of more than 40 cnwpm this year. In reading
comprehension, children were also performing much better this year, doubling and tripling
the number of children who answered 60% and 80% of questions correctly. Thus the trend
is shifting generally in a positive direction, although the region as a whole is still not
meeting the benchmarks and targets it has recommended for mother tongue reading
acquisition. Only 24% of children in G1 were meeting the benchmark of 30 cwpm on the
short story, and 40% of G2 students were reading more than 40 cwpm, putting schools in
the region about halfway to meeting their short-term targets. However, girls were
outperforming boys by nearly a grade-level equivalent on all subtasks. For Filipino and
English, there is no distinct positive or negative change in performance, and children read
Filipino words at about the same rate of fluency as Ilokano sentences.
Certain demographic issues in this region may be affecting mean scores. For example, at
least 20% of children in each grade speak a language other than Ilokano at home, and more
than 10% of teachers in G2 are not native speakers of Ilokano. Additionally, there is still not
universal access to learner materials and teachers’ guides, more so for G1 than G2.
According to the observations, class time was dominated by teacher-centered approaches,
which involved a lot of listening activities for the children. Reading was the least frequent
type of activity (among listening, speaking, reading, and writing-focused activities) in both
grades. The general instructional approach used in the region, according to observation
data, shows that the whole class, question and answer format was dominant. Reading and
writing activities were consistently less common than speaking and listening activities in
G1, and observations of student reading were only slightly more frequent in G2.
Although the MTB-MLE index score calculation showed the largest improvements in the
area of materials, there was still not universal access, particularly in G1 classrooms where
about one-fourth of students and teachers still reported that they do not have or do not use
the MTB-MLE learner materials for Ilokano.

EdData II Task Order 15 (DEP-AME)
Philippines EGRA Four Language Study – 2015 Follow-On 35
3 Sinugbuanong Binisaya (Cebuano)
3.1 Background
The sample for this language group came from Region VII (Central Visayas). Some of the
schools sampled were in the divisions of Cebu and Bohol, where USAID/Basa Pilipinas is also
operating. Other divisions represented (proportionally to the population of students in schools
that were identified by the region as using Cebuano as the language of instruction) are Carcar
City, Cebu City, City of Naga, Dumaguete City, Guihulngan City, Lapu Lapu City, Mandaue
City, Negros Oriental, Talisay City and Toledo City. The final sample consisted of 390 students,
39 teacher interviews, and 34 classroom observations per grade.
General characteristics of students and teachers in schools that use Cebuano as the language of
instruction are presented in Table 12, below.
Table 12. Cebuano – Selected characteristics by grade (2015)
Characteristics G1 G2
Percentage of children who…
… are overage (>7 in G1; >8 in G2; student reported) 8% 11%
… have been at the same school for two years (student reported) 79% 92%
… had no recorded absences in Feb. 2015 (from official school records) 64% 62%
… have a teacher whose native language is Cebuano (teacher-reported) 99% 100%
… have no reading materials at home 42% 38%
… speak Cebuano at home (student-reported) 98% 99%
… report that their teacher speaks mostly Cebuano in class this year 94% 91%
… report that the teacher never uses the MTB-MLE reading book for Cebuano 14% 2%
Average number of days absent in Feb. 2015 for children with any absences 2.1 days 2.1 days
Percentage of teachers who…
… are teaching in the mother tongue for the first time this year 22% 8%
… have already used EGRA in the classroom with their children 88% 89%
… have the MTB-MLE learner materials (textbook) 72% 97%
… have a teacher’s guide 87% 96%
… have never received training in beginning reading 6% 3%

EdData II Task Order 15 (DEP-AME)
Philippines EGRA Four Language Study – 2015 Follow-On 36
At the 2014 benchmarking workshop, the Cebuano regional team recommended, on the basis of
previous survey work, the following benchmarks and targets.
Table 13. Cebuano recommended reading benchmarks
Grade 1 Grade 2
Comprehension
(% correct) ORF
(cwpm) Comprehension
(% correct) ORF
(cwpm)
Long-range goal 80% 45 80% 50
Benchmark end 2015–2016 40% 32 60% 42
Minimum% scoring zero by end 2015–2016
25% 15% 15% 5%
A total of 48% of children in G2 and 28% in G1 reported that they have already gone through an
assessment like this one. These numbers are not much different than in 2014. On the other hand,
the proportion of children who say that Cebuano is the language their teacher uses most is higher
this year than last, by more than 10 percentage points for each grade (see Table 14, below).
Combined with other questions on language use, we can be confident that this year’s EGRA
measures skills of children who have been learning in the local language for two full years of
primary school.
3.2 EGRA results
3.2.1 Cebuano reading
Table 14 shows that although performance in G1 is similar in 2015 and 2014, there is a modest
positive difference in performance for G2, especially in terms of nearly eliminating zero scores
in three subtests. This is evidence of the cumulative effect of two years of instruction in the
mother tongue, since children in G2 in 2015 represent children who were in G1 in 2014 when
MTB-MLE was introduced.
Table 14. Cebuano – Performance on reading subtasks
Grade 1 Grade 2
Percent scoring zero 2014 2015 2014 2015
Letter sounds 11% 7% 11% 3%
Decoding 28% 29% 10% 7%
Reading fluency 22% 23% 8% 5%
Reading comprehension 49% 46% 19% 13%
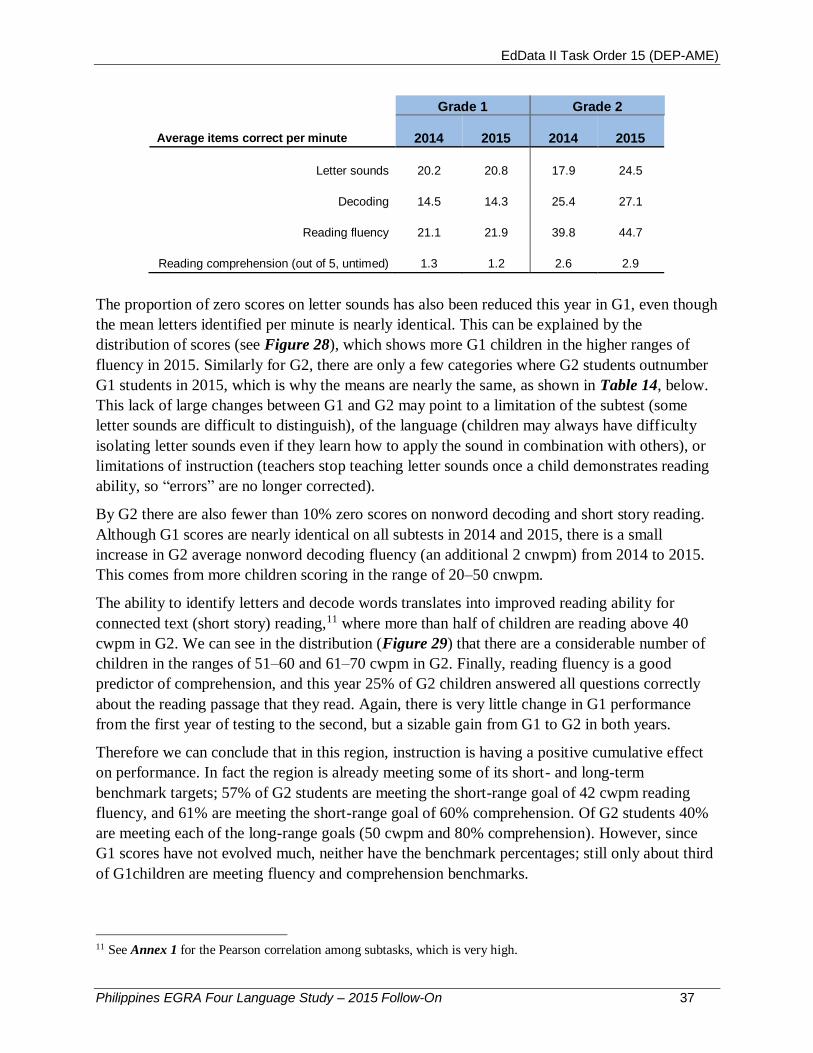
EdData II Task Order 15 (DEP-AME)
Philippines EGRA Four Language Study – 2015 Follow-On 37
Grade 1 Grade 2
Average items correct per minute 2014 2015 2014 2015
Letter sounds 20.2 20.8 17.9 24.5
Decoding 14.5 14.3 25.4 27.1
Reading fluency 21.1 21.9 39.8 44.7
Reading comprehension (out of 5, untimed) 1.3 1.2 2.6 2.9
The proportion of zero scores on letter sounds has also been reduced this year in G1, even though
the mean letters identified per minute is nearly identical. This can be explained by the
distribution of scores (see Figure 28), which shows more G1 children in the higher ranges of
fluency in 2015. Similarly for G2, there are only a few categories where G2 students outnumber
G1 students in 2015, which is why the means are nearly the same, as shown in Table 14, below.
This lack of large changes between G1 and G2 may point to a limitation of the subtest (some
letter sounds are difficult to distinguish), of the language (children may always have difficulty
isolating letter sounds even if they learn how to apply the sound in combination with others), or
limitations of instruction (teachers stop teaching letter sounds once a child demonstrates reading
ability, so “errors” are no longer corrected).
By G2 there are also fewer than 10% zero scores on nonword decoding and short story reading.
Although G1 scores are nearly identical on all subtests in 2014 and 2015, there is a small
increase in G2 average nonword decoding fluency (an additional 2 cnwpm) from 2014 to 2015.
This comes from more children scoring in the range of 20–50 cnwpm.
The ability to identify letters and decode words translates into improved reading ability for
connected text (short story) reading,11 where more than half of children are reading above 40
cwpm in G2. We can see in the distribution (Figure 29) that there are a considerable number of
children in the ranges of 51–60 and 61–70 cwpm in G2. Finally, reading fluency is a good
predictor of comprehension, and this year 25% of G2 children answered all questions correctly
about the reading passage that they read. Again, there is very little change in G1 performance
from the first year of testing to the second, but a sizable gain from G1 to G2 in both years.
Therefore we can conclude that in this region, instruction is having a positive cumulative effect
on performance. In fact the region is already meeting some of its short- and long-term
benchmark targets; 57% of G2 students are meeting the short-range goal of 42 cwpm reading
fluency, and 61% are meeting the short-range goal of 60% comprehension. Of G2 students 40%
are meeting each of the long-range goals (50 cwpm and 80% comprehension). However, since
G1 scores have not evolved much, neither have the benchmark percentages; still only about third
of G1children are meeting fluency and comprehension benchmarks.
11 See Annex 1 for the Pearson correlation among subtasks, which is very high.
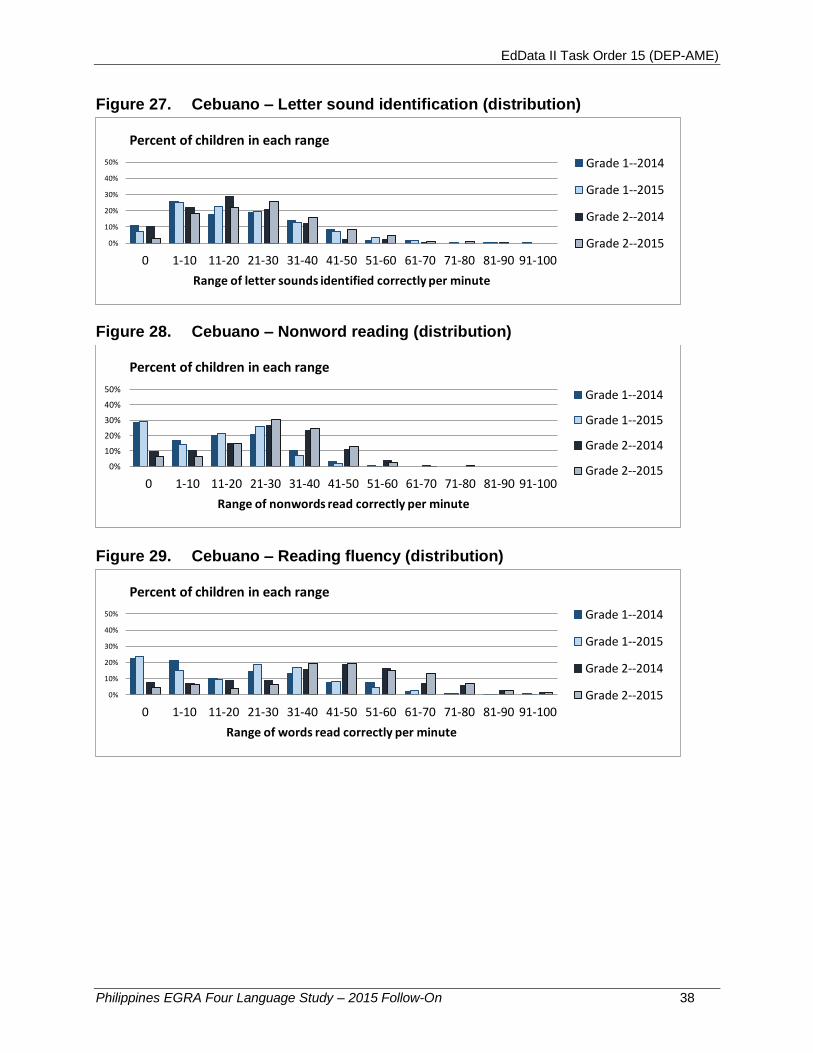
EdData II Task Order 15 (DEP-AME)
Philippines EGRA Four Language Study – 2015 Follow-On 38
Figure 27. Cebuano – Letter sound identification (distribution)
Figure 28. Cebuano – Nonword reading (distribution)
Figure 29. Cebuano – Reading fluency (distribution)
0%
10%
20%
30%
40%
50%
0 1-10 11-20 21-30 31-40 41-50 51-60 61-70 71-80 81-90 91-100
Range of letter sounds identified correctly per minute
Percent of children in each range
Grade 1--2014
Grade 1--2015
Grade 2--2014
Grade 2--2015
0%
10%
20%
30%
40%
50%
0 1-10 11-20 21-30 31-40 41-50 51-60 61-70 71-80 81-90 91-100
Range of nonwords read correctly per minute
Percent of children in each range
Grade 1--2014
Grade 1--2015
Grade 2--2014
Grade 2--2015
0%
10%
20%
30%
40%
50%
0 1-10 11-20 21-30 31-40 41-50 51-60 61-70 71-80 81-90 91-100
Range of words read correctly per minute
Percent of children in each range
Grade 1--2014
Grade 1--2015
Grade 2--2014
Grade 2--2015
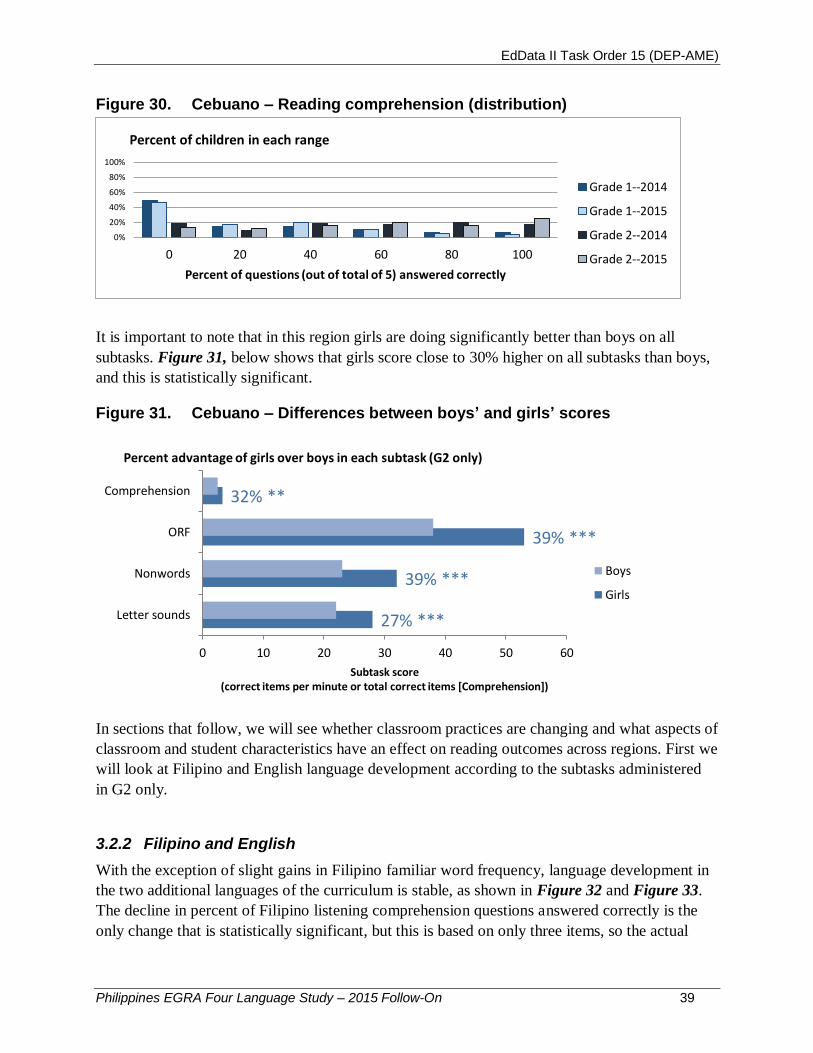
EdData II Task Order 15 (DEP-AME)
Philippines EGRA Four Language Study – 2015 Follow-On 39
Figure 30. Cebuano – Reading comprehension (distribution)
It is important to note that in this region girls are doing significantly better than boys on all
subtasks. Figure 31, below shows that girls score close to 30% higher on all subtasks than boys,
and this is statistically significant.
Figure 31. Cebuano – Differences between boys’ and girls’ scores
In sections that follow, we will see whether classroom practices are changing and what aspects of
classroom and student characteristics have an effect on reading outcomes across regions. First we
will look at Filipino and English language development according to the subtasks administered
in G2 only.
3.2.2 Filipino and English
With the exception of slight gains in Filipino familiar word frequency, language development in
the two additional languages of the curriculum is stable, as shown in Figure 32 and Figure 33.
The decline in percent of Filipino listening comprehension questions answered correctly is the
only change that is statistically significant, but this is based on only three items, so the actual
0%
20%
40%
60%
80%
100%
0 20 40 60 80 100
Percent of questions (out of total of 5) answered correctly
Percent of children in each range
Grade 1--2014
Grade 1--2015
Grade 2--2014
Grade 2--2015
27% ***
39% ***
39% ***
32% **
0 10 20 30 40 50 60
Letter sounds
Nonwords
ORF
Comprehension
Subtask score (correct items per minute or total correct items [Comprehension])
Percent advantage of girls over boys in each subtask (G2 only)
Boys
Girls
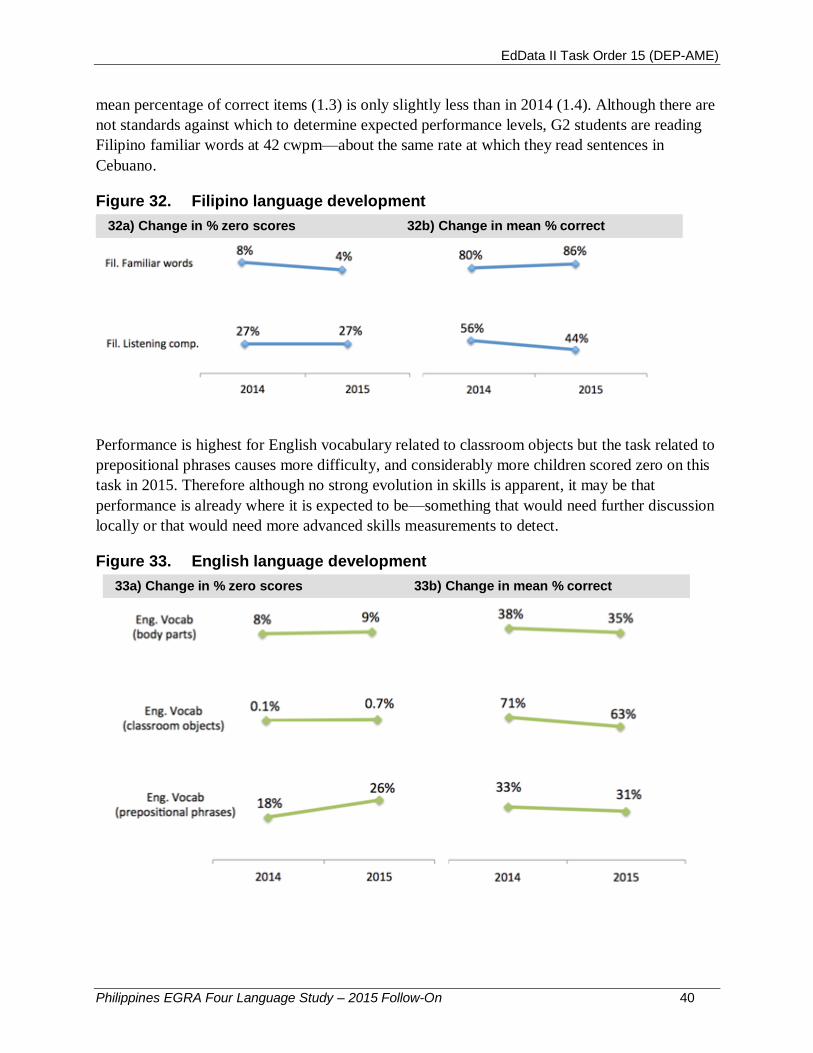
EdData II Task Order 15 (DEP-AME)
Philippines EGRA Four Language Study – 2015 Follow-On 40
mean percentage of correct items (1.3) is only slightly less than in 2014 (1.4). Although there are
not standards against which to determine expected performance levels, G2 students are reading
Filipino familiar words at 42 cwpm—about the same rate at which they read sentences in
Cebuano.
Figure 32. Filipino language development
32a) Change in % zero scores 32b) Change in mean % correct
Performance is highest for English vocabulary related to classroom objects but the task related to
prepositional phrases causes more difficulty, and considerably more children scored zero on this
task in 2015. Therefore although no strong evolution in skills is apparent, it may be that
performance is already where it is expected to be—something that would need further discussion
locally or that would need more advanced skills measurements to detect.
Figure 33. English language development
33a) Change in % zero scores 33b) Change in mean % correct

EdData II Task Order 15 (DEP-AME)
Philippines EGRA Four Language Study – 2015 Follow-On 41
3.3 MTB-MLE Implementation
According to classroom observations, Cebuano is being used as the teaching language all of the
time during mother tongue language lessons in 99% of G1 classrooms observed. However, that is
only the case for 86% of G2 classrooms observed during a mother tongue language lesson. In the
other 14% of classrooms, the classroom use of the mother tongue was coded as “most of the time
[75–95% of the time]” and the other language used was English. The reasons given for code
switching in the classroom were either to give procedural directions (13%) or to clarify a concept
provided first in the mother tongue (3%).
At a high level, most time spent in the classroom is focused on having children listen (to the
teacher or other students); this is the largest category in both grades and years of observation (see
Figure 34). Having children read is still the least frequent activity, with the exception of G2 in
2015, where 21% of observations noted that the instructional focus was on reading. The change
in time spent reading from G1 to G2 is much greater in 2015 than in 2014, where both G1 and
G2 students spent about the same amount of time reading.
Figure 34. Cebuano – Use of classroom time
Recognizing that there can be some overlap in activities (for example, children can be reading
passively while the teacher is talking), it is useful to also look at a more detailed breakdown of
the type of listening, speaking, reading, or writing activity that was occurring at the time of the
observation moment.
At this level, we see that 42% of classroom time in G1 is spent on the top four activities:
Speaking: answering a question; Writing: word or sentence length prompts; Listening:
procedural directions and classroom management; and Listening: stories, poems, riddles, etc.
This last category accounted for 8% of observations, and in fact, this is the only region where
this activity was counted a substantial number of times. There were also no instances of speaking
0%
10%
20%
30%
40%
50%
60%
70%
80%
90%
100%
2014 2015 2014 2015
G1 G2
No language
Speaking
Listening
Writing
Reading

EdData II Task Order 15 (DEP-AME)
Philippines EGRA Four Language Study – 2015 Follow-On 42
off topic or waiting during some kind of class disruption. However, 2.4% of observations were
transitions between activities. In G2, the same activities account for the top four types
(equivalent to 49% of class time), with the exception of Listening: stories, which is replaced by
Reading: sentences or short paragraphs. Again, time spent off-task is limited to transitions
between activities at 2.3% of observations.
From the teacher perspective (the assessor records what the teacher’s focus was at each
observation moment), the top activity in G1 is waiting for students to complete a task (37%)
followed by asking/answering questions, giving procedural directions, and lecturing/explaining
subject matter, which together account for another 40% of observations. The proportions are
very similar in G2.
MTB-MLE index. Schools using Cebuano as the language of instruction in Region VII are
showing improvement in all three areas of the index.12 Table 15 below shows the increase in the
mean score by component, while the graphs that follow show the distribution of scores,
highlighting the proportion of students who are in a classroom environment with the highest
scores (based on the 75th percentile and above).
Table 15. Cebuano – Summary of index scores (means)
2014 2015
Component 1 (out of 22 possible) 11 12
Component 2 (out of 13 possible) 5 7
Component 3 (out of 15 possible) 4 6
Combined 21 26
For Component 1, relative to teacher preparation, attitudes and support for MTB-MLE, the mean
increases only by 1 point, but the distribution shows a much larger proportion of the sample
above the 75th percentile cutoff. One important difference in the characteristics of the sample is
that nearly 100% of students have a teacher whose (self-reported) native language is Cebuano.
Other than that, the main differences in the index score are attributable to more teachers
reporting more types of methods for measuring student progress in reading.
12 Statistically significant to the .001 level, with the exception of Component 1, which was significant to the .05
level.
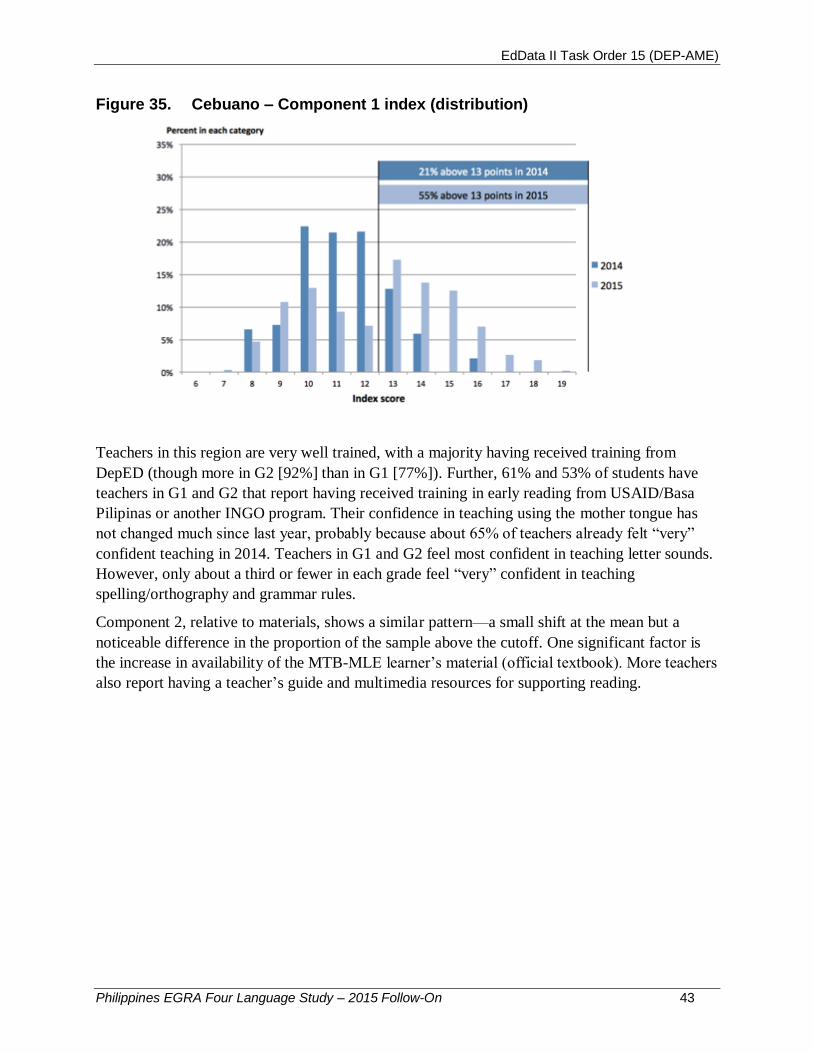
EdData II Task Order 15 (DEP-AME)
Philippines EGRA Four Language Study – 2015 Follow-On 43
Figure 35. Cebuano – Component 1 index (distribution)
Teachers in this region are very well trained, with a majority having received training from
DepED (though more in G2 [92%] than in G1 [77%]). Further, 61% and 53% of students have
teachers in G1 and G2 that report having received training in early reading from USAID/Basa
Pilipinas or another INGO program. Their confidence in teaching using the mother tongue has
not changed much since last year, probably because about 65% of teachers already felt “very”
confident teaching in 2014. Teachers in G1 and G2 feel most confident in teaching letter sounds.
However, only about a third or fewer in each grade feel “very” confident in teaching
spelling/orthography and grammar rules.
Component 2, relative to materials, shows a similar pattern—a small shift at the mean but a
noticeable difference in the proportion of the sample above the cutoff. One significant factor is
the increase in availability of the MTB-MLE learner’s material (official textbook). More teachers
also report having a teacher’s guide and multimedia resources for supporting reading.
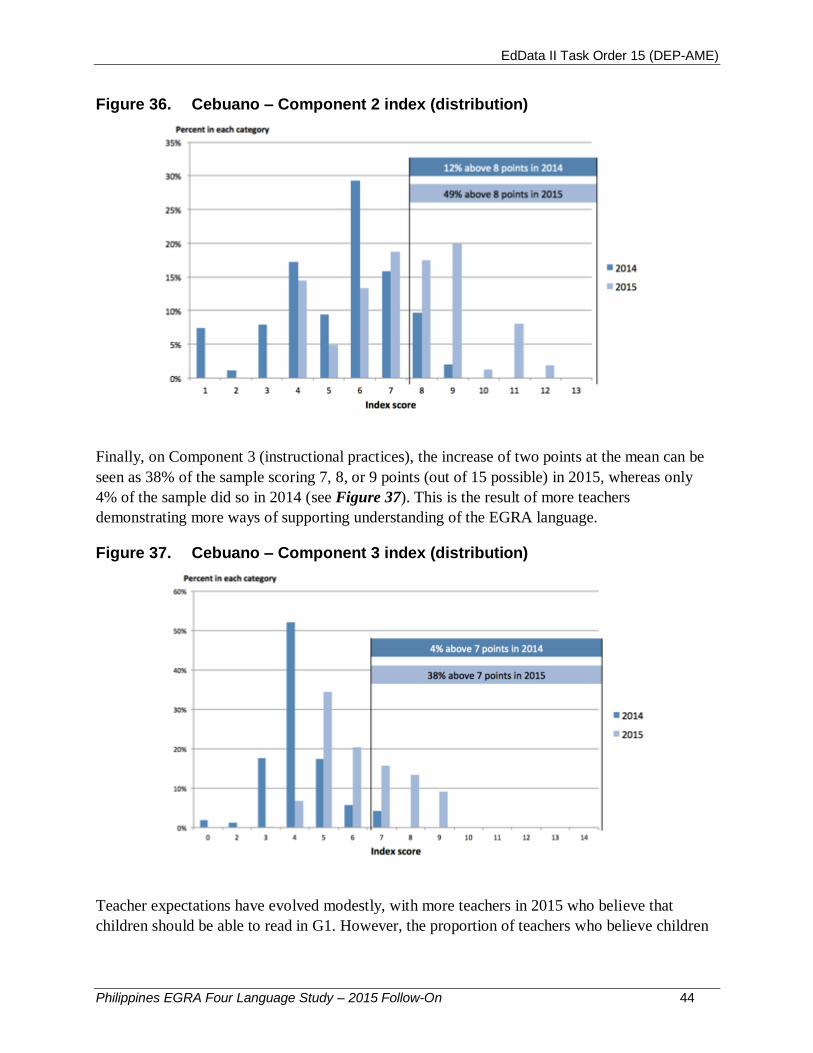
EdData II Task Order 15 (DEP-AME)
Philippines EGRA Four Language Study – 2015 Follow-On 44
Figure 36. Cebuano – Component 2 index (distribution)
Finally, on Component 3 (instructional practices), the increase of two points at the mean can be
seen as 38% of the sample scoring 7, 8, or 9 points (out of 15 possible) in 2015, whereas only
4% of the sample did so in 2014 (see Figure 37). This is the result of more teachers
demonstrating more ways of supporting understanding of the EGRA language.
Figure 37. Cebuano – Component 3 index (distribution)
Teacher expectations have evolved modestly, with more teachers in 2015 who believe that
children should be able to read in G1. However, the proportion of teachers who believe children

EdData II Task Order 15 (DEP-AME)
Philippines EGRA Four Language Study – 2015 Follow-On 45
should be able to read after two years of instruction (G2) remains relatively constant, as shown in
Figure 38, below.
Figure 38. Cebuano – Teacher expectations for when children should know how to read
0%
20%
40%
60%
80%
100%
2014 2015 2014 2015
Grade 1 Teachers Grade 2 Teachers
Grade 4 or higher
Grade 3
Grade 2
Grade 1

EdData II Task Order 15 (DEP-AME)
Philippines EGRA Four Language Study – 2015 Follow-On 46
Summary – Cebuano
In this region, instruction is having a positive cumulative effect on performance. Although
2015 performance in G1 is similar to what it was in 2014, there is a modest positive
difference in G2 scores. There were fewer than 10% zero scores on three of the four
subtests, and this region had the lowest overall proportion of children who scored zero on
all subtests (in other words, who may have a more serious issue with reading, language, or
overall confidence with the test format). More than half of children were reading above 40
cwpm in G2, and average ORF increased from 40 to 45 cwpm. In addition, 25% of G2
students were able to answer all questions about the story they read.
The region is already meeting some of its short- and long-term benchmark targets; 40% of
G2 students were meeting the long-range benchmark for fluency (50 cwpm), and 40% were
meeting the benchmark for comprehension (80% comprehension). There is a large and
significant difference between girls’ performance and boys’. Girls scored close to 30%
higher than boys on all subtasks. Filipino and English language development was also
stable, and familiar word reading fluency in Filipino was similar to story reading fluency in
Cebuano.
Classroom observation data show that G2 classrooms were doing more reading activities
in 2015 than in G1 or either grade in 2014. More time was spent in G2 classrooms reading
than speaking or writing activities, although across grades and years of assessment
“listening” is still the most common activity.
According to data from teacher interviews, teachers were well trained, a large share having
received training in reading instruction from DepED or USAID/Basa Pilipinas. Teachers’
expectations have also evolved, and more teachers believed that children should be able to
read after one year of instruction. Yet G1 teachers seemed to be at a disadvantage in terms
of materials—they had a lower percentage of MTB-MLE learner books and teachers’ guides
compared to almost universal access to these materials in G2. Given the strong
relationship between a print-rich classroom environment and student outcomes, prior to
the start of the next school year, DepED should ensure that G1 teachers are appropriately
resourced and ready to implement the reading program with sufficient intensity. If G1
scores can be increased, it follows that G2 performance will also increase and the region
may meet its targets sooner.
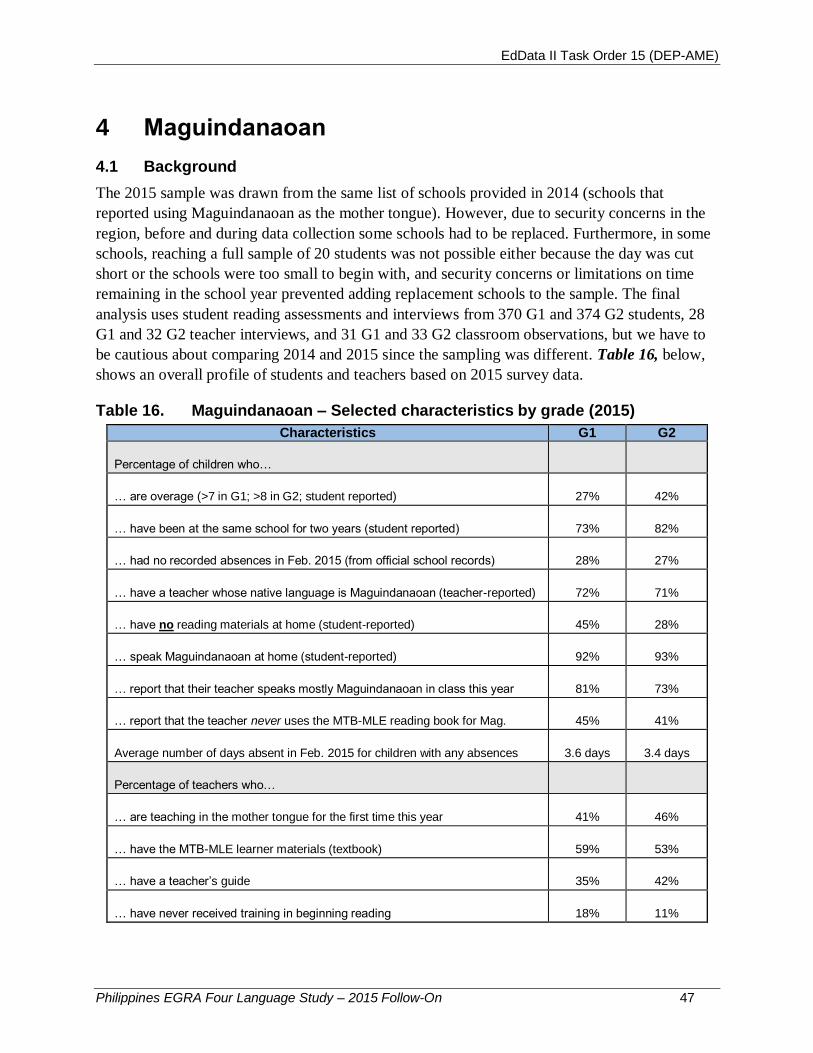
EdData II Task Order 15 (DEP-AME)
Philippines EGRA Four Language Study – 2015 Follow-On 47
4 Maguindanaoan
4.1 Background
The 2015 sample was drawn from the same list of schools provided in 2014 (schools that
reported using Maguindanaoan as the mother tongue). However, due to security concerns in the
region, before and during data collection some schools had to be replaced. Furthermore, in some
schools, reaching a full sample of 20 students was not possible either because the day was cut
short or the schools were too small to begin with, and security concerns or limitations on time
remaining in the school year prevented adding replacement schools to the sample. The final
analysis uses student reading assessments and interviews from 370 G1 and 374 G2 students, 28
G1 and 32 G2 teacher interviews, and 31 G1 and 33 G2 classroom observations, but we have to
be cautious about comparing 2014 and 2015 since the sampling was different. Table 16, below,
shows an overall profile of students and teachers based on 2015 survey data.
Table 16. Maguindanaoan – Selected characteristics by grade (2015)
Characteristics G1 G2
Percentage of children who…
… are overage (>7 in G1; >8 in G2; student reported) 27% 42%
… have been at the same school for two years (student reported) 73% 82%
… had no recorded absences in Feb. 2015 (from official school records) 28% 27%
… have a teacher whose native language is Maguindanaoan (teacher-reported) 72% 71%
… have no reading materials at home (student-reported) 45% 28%
… speak Maguindanaoan at home (student-reported) 92% 93%
… report that their teacher speaks mostly Maguindanaoan in class this year 81% 73%
… report that the teacher never uses the MTB-MLE reading book for Mag. 45% 41%
Average number of days absent in Feb. 2015 for children with any absences 3.6 days 3.4 days
Percentage of teachers who…
… are teaching in the mother tongue for the first time this year 41% 46%
… have the MTB-MLE learner materials (textbook) 59% 53%
… have a teacher’s guide 35% 42%
… have never received training in beginning reading 18% 11%
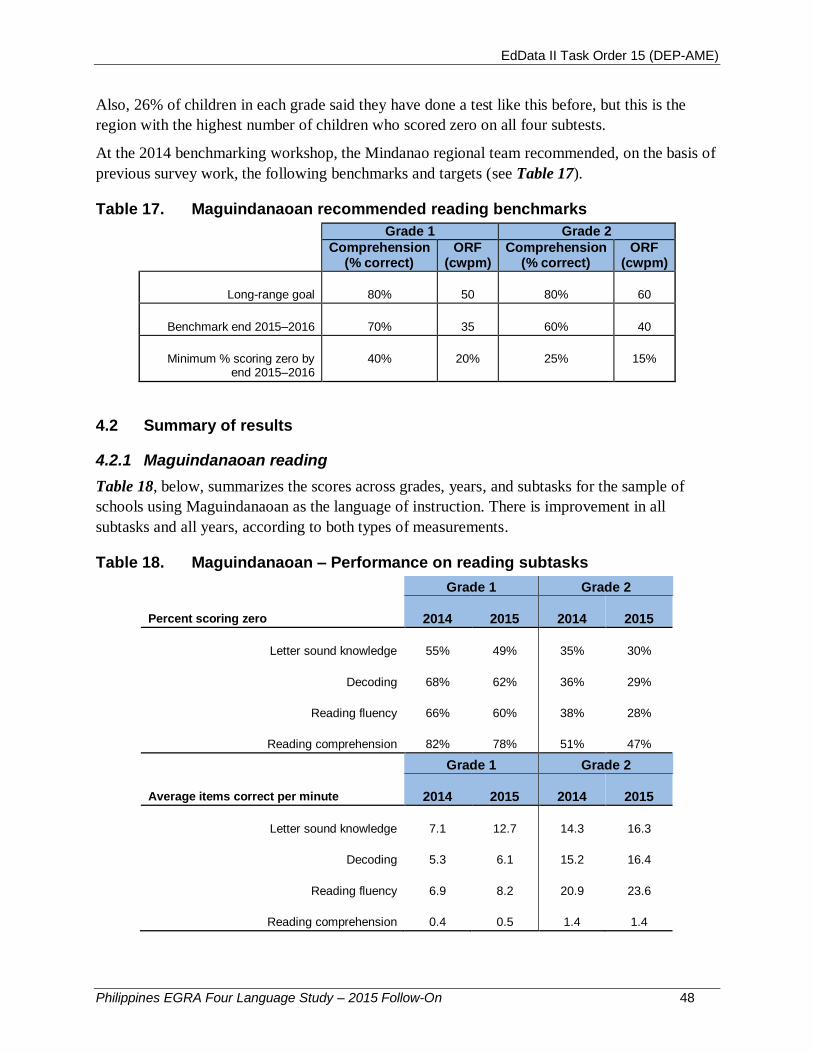
EdData II Task Order 15 (DEP-AME)
Philippines EGRA Four Language Study – 2015 Follow-On 48
Also, 26% of children in each grade said they have done a test like this before, but this is the
region with the highest number of children who scored zero on all four subtests.
At the 2014 benchmarking workshop, the Mindanao regional team recommended, on the basis of
previous survey work, the following benchmarks and targets (see Table 17).
Table 17. Maguindanaoan recommended reading benchmarks
Grade 1 Grade 2
Comprehension
(% correct) ORF
(cwpm) Comprehension
(% correct) ORF
(cwpm)
Long-range goal 80% 50 80% 60
Benchmark end 2015–2016 70% 35 60% 40
Minimum % scoring zero by end 2015–2016
40% 20% 25% 15%
4.2 Summary of results
4.2.1 Maguindanaoan reading
Table 18, below, summarizes the scores across grades, years, and subtasks for the sample of
schools using Maguindanaoan as the language of instruction. There is improvement in all
subtasks and all years, according to both types of measurements.
Table 18. Maguindanaoan – Performance on reading subtasks
Grade 1 Grade 2
Percent scoring zero 2014 2015 2014 2015
Letter sound knowledge 55% 49% 35% 30%
Decoding 68% 62% 36% 29%
Reading fluency 66% 60% 38% 28%
Reading comprehension 82% 78% 51% 47%
Grade 1 Grade 2
Average items correct per minute 2014 2015 2014 2015
Letter sound knowledge 7.1 12.7 14.3 16.3
Decoding 5.3 6.1 15.2 16.4
Reading fluency 6.9 8.2 20.9 23.6
Reading comprehension 0.4 0.5 1.4 1.4
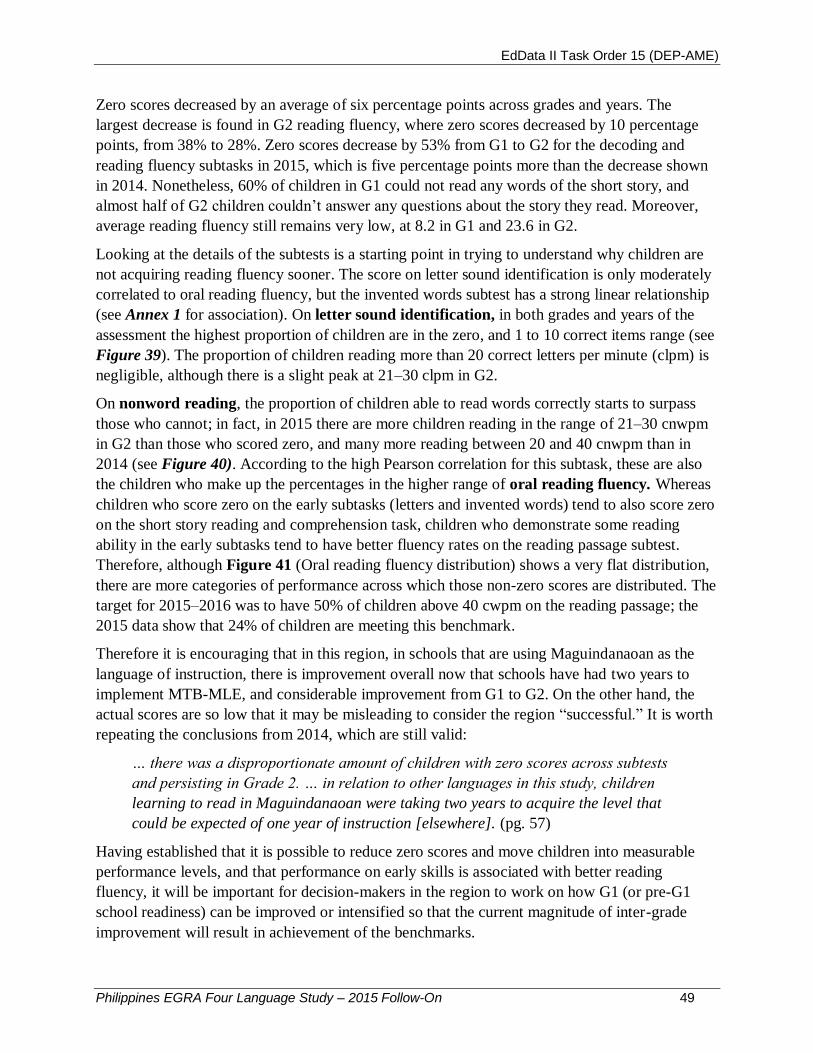
EdData II Task Order 15 (DEP-AME)
Philippines EGRA Four Language Study – 2015 Follow-On 49
Zero scores decreased by an average of six percentage points across grades and years. The
largest decrease is found in G2 reading fluency, where zero scores decreased by 10 percentage
points, from 38% to 28%. Zero scores decrease by 53% from G1 to G2 for the decoding and
reading fluency subtasks in 2015, which is five percentage points more than the decrease shown
in 2014. Nonetheless, 60% of children in G1 could not read any words of the short story, and
almost half of G2 children couldn’t answer any questions about the story they read. Moreover,
average reading fluency still remains very low, at 8.2 in G1 and 23.6 in G2.
Looking at the details of the subtests is a starting point in trying to understand why children are
not acquiring reading fluency sooner. The score on letter sound identification is only moderately
correlated to oral reading fluency, but the invented words subtest has a strong linear relationship
(see Annex 1 for association). On letter sound identification, in both grades and years of the
assessment the highest proportion of children are in the zero, and 1 to 10 correct items range (see
Figure 39). The proportion of children reading more than 20 correct letters per minute (clpm) is
negligible, although there is a slight peak at 21–30 clpm in G2.
On nonword reading, the proportion of children able to read words correctly starts to surpass
those who cannot; in fact, in 2015 there are more children reading in the range of 21–30 cnwpm
in G2 than those who scored zero, and many more reading between 20 and 40 cnwpm than in
2014 (see Figure 40). According to the high Pearson correlation for this subtask, these are also
the children who make up the percentages in the higher range of oral reading fluency. Whereas
children who score zero on the early subtasks (letters and invented words) tend to also score zero
on the short story reading and comprehension task, children who demonstrate some reading
ability in the early subtasks tend to have better fluency rates on the reading passage subtest.
Therefore, although Figure 41 (Oral reading fluency distribution) shows a very flat distribution,
there are more categories of performance across which those non-zero scores are distributed. The
target for 2015–2016 was to have 50% of children above 40 cwpm on the reading passage; the
2015 data show that 24% of children are meeting this benchmark.
Therefore it is encouraging that in this region, in schools that are using Maguindanaoan as the
language of instruction, there is improvement overall now that schools have had two years to
implement MTB-MLE, and considerable improvement from G1 to G2. On the other hand, the
actual scores are so low that it may be misleading to consider the region “successful.” It is worth
repeating the conclusions from 2014, which are still valid:
… there was a disproportionate amount of children with zero scores across subtests
and persisting in Grade 2. … in relation to other languages in this study, children
learning to read in Maguindanaoan were taking two years to acquire the level that
could be expected of one year of instruction [elsewhere]. (pg. 57)
Having established that it is possible to reduce zero scores and move children into measurable
performance levels, and that performance on early skills is associated with better reading
fluency, it will be important for decision-makers in the region to work on how G1 (or pre-G1
school readiness) can be improved or intensified so that the current magnitude of inter-grade
improvement will result in achievement of the benchmarks.

EdData II Task Order 15 (DEP-AME)
Philippines EGRA Four Language Study – 2015 Follow-On 50
Figure 39. Maguindanoan – Letter sound identification (distribution)
Figure 40. Maguindanoan – Nonword reading (distribution)
Figure 41. Maguindanoan – Oral reading fluency (distribution)
0%
20%
40%
60%
80%
100%
0 1-10 11-20 21-30 31-40 41-50 51-60 61-70 71-80
Range of letter sounds identified correctly per minute
Percent of children in each range
Grade 1--2014
Grade 1--2015
Grade 2--2014
Grade 2--2015
0%
20%
40%
60%
80%
100%
0 1-10 11-20 21-30 31-40 41-50 51-60 61-70 81-90
Range of nonwords read correctly per minute (cnwpm)
Percent of children in each range
Grade 1--2014
Grade 1--2015
Grade 2--2014
Grade 2--2015
0%
20%
40%
60%
80%
100%
0 1-10 11-20 21-30 31-40 41-50 51-60 61-70 71-80 81-90
Range of words read correctly per minute
Percent of children in each range (ST benchmark for G2 = 15% zero scores)
Grade 1--2014
Grade 1--2015
Grade 2--2014
Grade 2--2015

EdData II Task Order 15 (DEP-AME)
Philippines EGRA Four Language Study – 2015 Follow-On 51
Figure 42. Maguindanoan – Comprehension (distribution)
Girls are outperforming boys on all subtasks (see Figure 43), although the differences are not as
large or as significant (statistically) as in other regions.
Figure 43. Maguindanaoan – Differences between boys’ and girls’ scores (G2 only)
4.2.2 Filipino and English
On the two measures of additional language development, children in the schools using
Maguindanaoan show an overall stable to downward trend. Average Filipino familiar word
fluency remained at 23–24 cwpm. Figure 44 shows that the percent correct (out of items
attempted) increased slightly, while the percentage of zero scores decreased slightly, but neither
of these changes is statistically significant. Listening comprehension, on the other hand, shows a
more sizable decrease in percent correct and an increase in zero scores; both are statistically
significant (to the .001 and .05 levels, respectively).
0%
20%
40%
60%
80%
100%
0 20 40 60 80 100
Range of letter sounds identified correctly per minute
Percent of children in each range (ST benchmark for G2 = 25% zero scores)
Grade 1--2014
Grade 1--2015
Grade 2--2014
Grade 2--2015
35%
26%
35%
33%
0 5 10 15 20 25 30 35 40 45
Letter sounds
Nonwords
ORF
Comprehension
Subtask score (correct items per minute or total correct items [Comprehension])
Percent advantage of girls over boys in each subtask
Boys
Girls
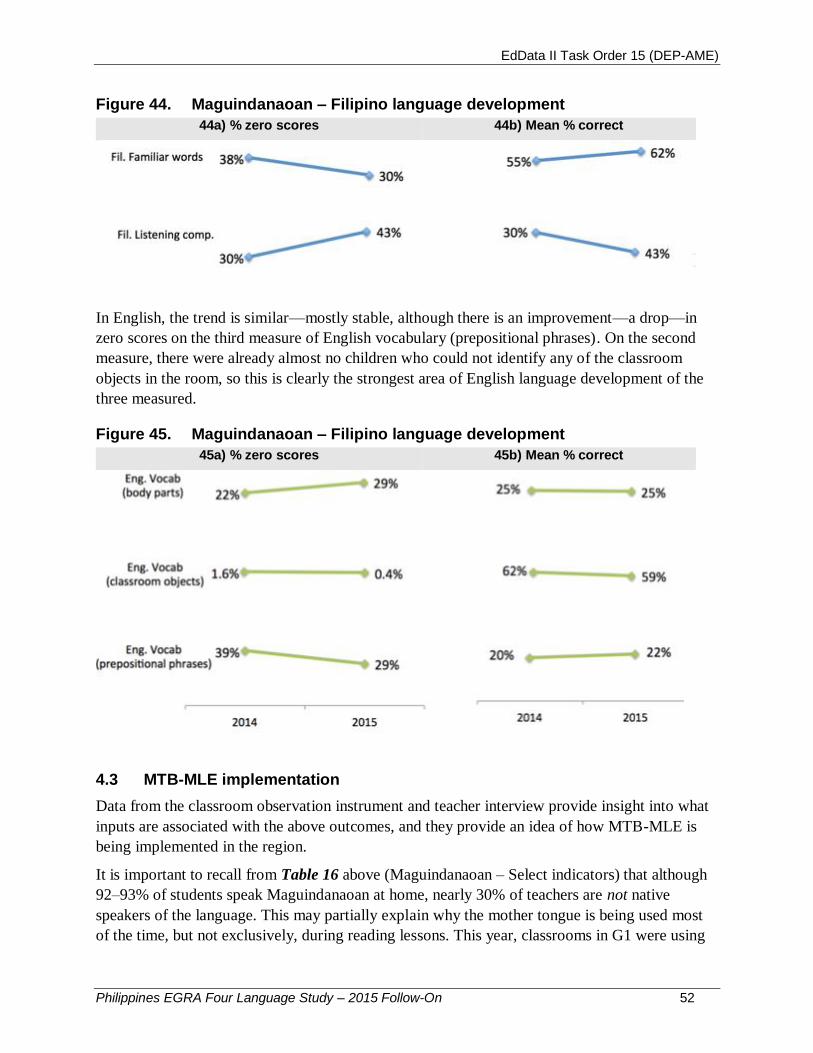
EdData II Task Order 15 (DEP-AME)
Philippines EGRA Four Language Study – 2015 Follow-On 52
Figure 44. Maguindanaoan – Filipino language development
44a) % zero scores 44b) Mean % correct
In English, the trend is similar—mostly stable, although there is an improvement—a drop—in
zero scores on the third measure of English vocabulary (prepositional phrases). On the second
measure, there were already almost no children who could not identify any of the classroom
objects in the room, so this is clearly the strongest area of English language development of the
three measured.
Figure 45. Maguindanaoan – Filipino language development
45a) % zero scores 45b) Mean % correct
4.3 MTB-MLE implementation
Data from the classroom observation instrument and teacher interview provide insight into what
inputs are associated with the above outcomes, and they provide an idea of how MTB-MLE is
being implemented in the region.
It is important to recall from Table 16 above (Maguindanaoan – Select indicators) that although
92–93% of students speak Maguindanaoan at home, nearly 30% of teachers are not native
speakers of the language. This may partially explain why the mother tongue is being used most
of the time, but not exclusively, during reading lessons. This year, classrooms in G1 were using
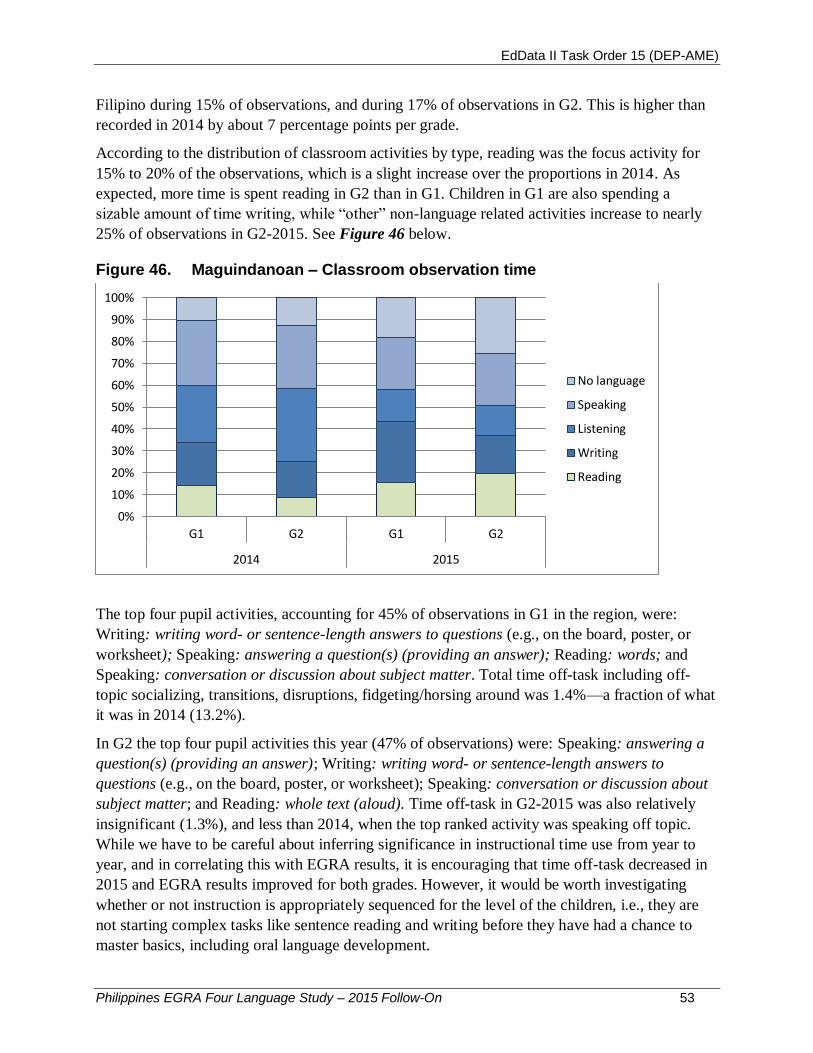
EdData II Task Order 15 (DEP-AME)
Philippines EGRA Four Language Study – 2015 Follow-On 53
Filipino during 15% of observations, and during 17% of observations in G2. This is higher than
recorded in 2014 by about 7 percentage points per grade.
According to the distribution of classroom activities by type, reading was the focus activity for
15% to 20% of the observations, which is a slight increase over the proportions in 2014. As
expected, more time is spent reading in G2 than in G1. Children in G1 are also spending a
sizable amount of time writing, while “other” non-language related activities increase to nearly
25% of observations in G2-2015. See Figure 46 below.
Figure 46. Maguindanoan – Classroom observation time
The top four pupil activities, accounting for 45% of observations in G1 in the region, were:
Writing: writing word- or sentence-length answers to questions (e.g., on the board, poster, or
worksheet); Speaking: answering a question(s) (providing an answer); Reading: words; and
Speaking: conversation or discussion about subject matter. Total time off-task including off-
topic socializing, transitions, disruptions, fidgeting/horsing around was 1.4%—a fraction of what
it was in 2014 (13.2%).
In G2 the top four pupil activities this year (47% of observations) were: Speaking: answering a
question(s) (providing an answer); Writing: writing word- or sentence-length answers to
questions (e.g., on the board, poster, or worksheet); Speaking: conversation or discussion about
subject matter; and Reading: whole text (aloud). Time off-task in G2-2015 was also relatively
insignificant (1.3%), and less than 2014, when the top ranked activity was speaking off topic.
While we have to be careful about inferring significance in instructional time use from year to
year, and in correlating this with EGRA results, it is encouraging that time off-task decreased in
2015 and EGRA results improved for both grades. However, it would be worth investigating
whether or not instruction is appropriately sequenced for the level of the children, i.e., they are
not starting complex tasks like sentence reading and writing before they have had a chance to
master basics, including oral language development.
0%
10%
20%
30%
40%
50%
60%
70%
80%
90%
100%
G1 G2 G1 G2
2014 2015
No language
Speaking
Listening
Writing
Reading
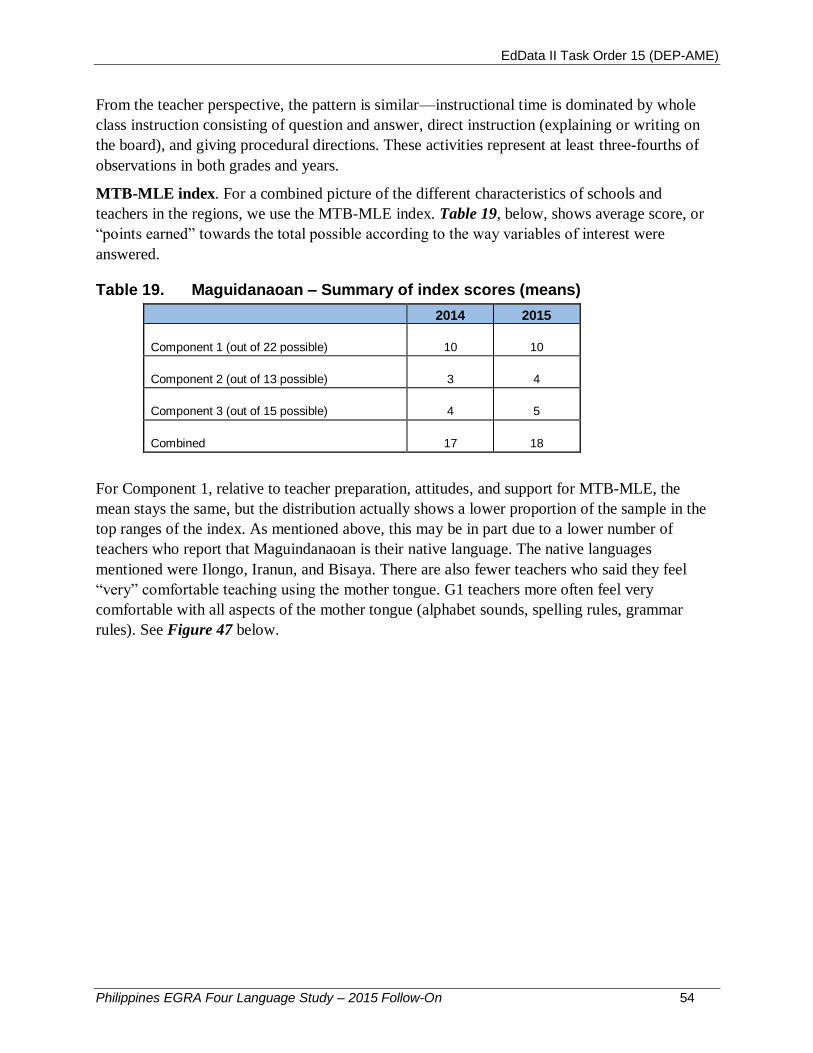
EdData II Task Order 15 (DEP-AME)
Philippines EGRA Four Language Study – 2015 Follow-On 54
From the teacher perspective, the pattern is similar—instructional time is dominated by whole
class instruction consisting of question and answer, direct instruction (explaining or writing on
the board), and giving procedural directions. These activities represent at least three-fourths of
observations in both grades and years.
MTB-MLE index. For a combined picture of the different characteristics of schools and
teachers in the regions, we use the MTB-MLE index. Table 19, below, shows average score, or
“points earned” towards the total possible according to the way variables of interest were
answered.
Table 19. Maguidanaoan – Summary of index scores (means)
2014 2015
Component 1 (out of 22 possible) 10 10
Component 2 (out of 13 possible) 3 4
Component 3 (out of 15 possible) 4 5
Combined 17 18
For Component 1, relative to teacher preparation, attitudes, and support for MTB-MLE, the
mean stays the same, but the distribution actually shows a lower proportion of the sample in the
top ranges of the index. As mentioned above, this may be in part due to a lower number of
teachers who report that Maguindanaoan is their native language. The native languages
mentioned were Ilongo, Iranun, and Bisaya. There are also fewer teachers who said they feel
“very” comfortable teaching using the mother tongue. G1 teachers more often feel very
comfortable with all aspects of the mother tongue (alphabet sounds, spelling rules, grammar
rules). See Figure 47 below.
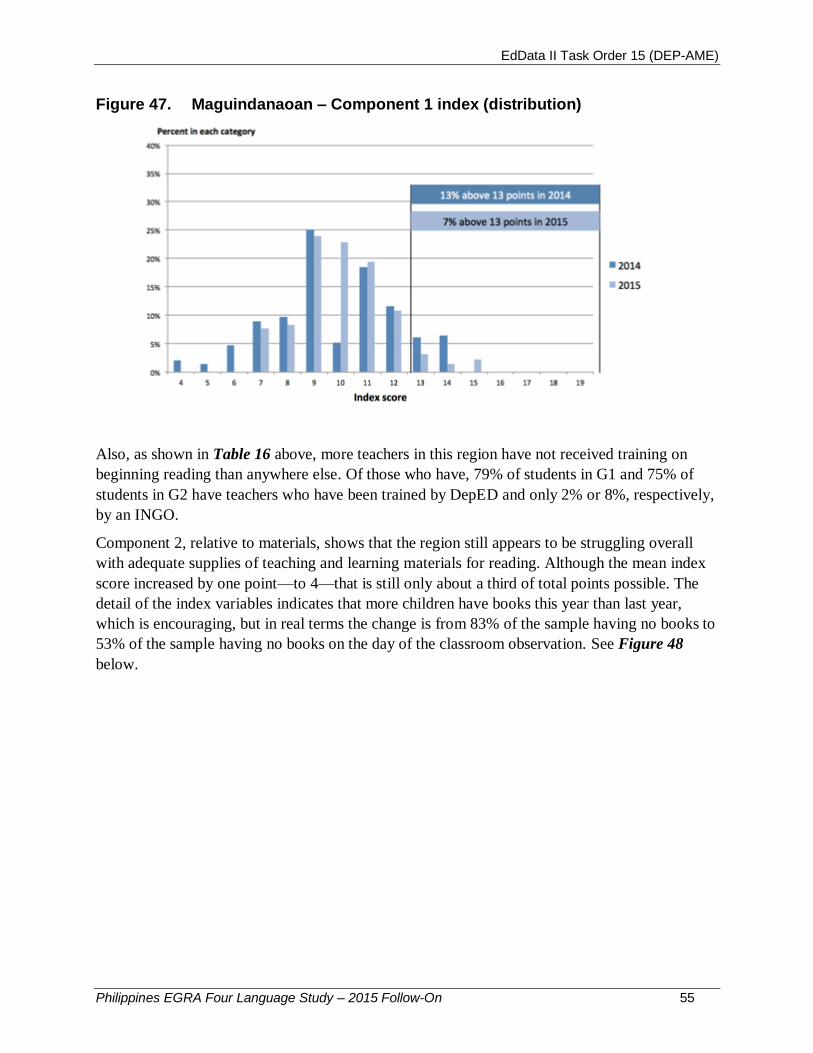
EdData II Task Order 15 (DEP-AME)
Philippines EGRA Four Language Study – 2015 Follow-On 55
Figure 47. Maguindanaoan – Component 1 index (distribution)
Also, as shown in Table 16 above, more teachers in this region have not received training on
beginning reading than anywhere else. Of those who have, 79% of students in G1 and 75% of
students in G2 have teachers who have been trained by DepED and only 2% or 8%, respectively,
by an INGO.
Component 2, relative to materials, shows that the region still appears to be struggling overall
with adequate supplies of teaching and learning materials for reading. Although the mean index
score increased by one point—to 4—that is still only about a third of total points possible. The
detail of the index variables indicates that more children have books this year than last year,
which is encouraging, but in real terms the change is from 83% of the sample having no books to
53% of the sample having no books on the day of the classroom observation. See Figure 48
below.
EdData II Task Order 15 (DEP-AME)
Philippines EGRA Four Language Study – 2015 Follow-On 56
Figure 48. Maguindanaoan – Component 2 index (distribution)
Finally, on Component 3 (instructional practices), there is also a one point increase at the mean,
but overall distribution is limited to the lower end of the scale of possible points. In this
component, the score will increase if the classroom observer recorded, among other things,
different types of strategies to support mother tongue language use and understanding, such as
“praising or rewarding pupils for using the mother tongue appropriately,” “By pointing out or
correcting EGRA language errors and misunderstandings,” “By using simpler form of EGRA
language to explain more difficult language,” or “By monitoring comprehension (e.g., ‘Do you
understand?’ 'Need more explanation?’)”. None of the strategies were observed in use for more
than 30% of the students in the sample, with the exception of “using a simpler form,” which was
recorded for 45% of the population in 2015. By way of comparison, in other regions these
strategies were often used for more than 50% of the sample.13 See Figure 49 below.
13 It is also important to remember that the accuracy of this measurement depends on the ability of the assessor to
detect those behaviors. The classroom observation assessors were teachers or other DepEd staff from the regions, so
in some regions the assessors might have been more attuned to these subtle strategies, especially if, as teachers, they
use them in their own classrooms.

EdData II Task Order 15 (DEP-AME)
Philippines EGRA Four Language Study – 2015 Follow-On 57
Figure 49. Maguindanaoan – Component 3 index (distribution)
Teacher expectations have evolved considerably in this region. Where almost no teachers
thought that children should learn to read in the mother tongue in G1 last year, this year nearly
40% in each grade believe it is possible. See Figure 50 below.
Figure 50. Maguindanaoan – Teacher expectations for when a child should know how to read
0%
20%
40%
60%
80%
100%
2014 2015 2014 2015
Grade 1 Teachers Grade 2 Teachers
Grade 4 or higher
Grade 3
Grade 2
Grade 1
EdData II Task Order 15 (DEP-AME)
Philippines EGRA Four Language Study – 2015 Follow-On 58
Summary – Maguindanaoan
The schools in this region have succeeded in decreasing the proportion of zero scores on
all EGRA subtasks for Maguindanaoan, as well as increasing the mean scores. There are
also large improvements in reading performance from G1 to G2. Nevertheless, average
reading fluency was still relatively low at 8 and 24 cwpm in G1 and G2, respectively.
Children in G2 read Filipino words at the same rate as Maguindanaoan words. As in other
regions, girls outperformed boys on all subtasks by 25% or more. Teacher expectations
have changed considerably since 2014, and nearly 40% of teachers in each grade now
believe it is possible to learn to read in G1.
The instructional model, as inferred from the classroom observation tool, is similar to other
regions: instructional time was dominated by whole class instruction consisting of
question and answer, direct instruction (explaining or writing on the board), and giving
procedural directions.
It is likely that demographic issues in this region are affecting outcomes more than
instructional ones. For example, children were frequently absent; many children were
overage for grade; Maguindanaoan was not the language of instruction for many teachers;
children did not have books at home, etc. Overcoming these challenges may require unique
and exceptional measures. However, ensuring that the basics are in place is still important.
More teachers in this region had not received training in beginning reading; more children
reported that the teacher did not use the MTB-MLE learner materials in class; teachers
themselves reported not having the books.

EdData II Task Order 15 (DEP-AME)
Philippines EGRA Four Language Study – 2015 Follow-On 59
5 Cross-Language Findings
5.1 EGRA
Although we remind the reader to be cautious of comparing scores across languages,14
particularly for timed measures such as reading fluency (cwpm), which can be affected by the
characteristics of the language, it is possible to look at some results side-by-side for all school
types. For example, a child receives a “zero” score on a subtask if he or she did not provide one
correct answer. An incorrect answer can also be no answer at all (child is silent). Therefore zero
scores indicate a lack of reading ability, but they may also be related to a child’s hesitation or
discomfort with the unfamiliar testing format (especially in G1). It is reasonable to compare the
proportion of children in different regions with no reading ability. Although we cannot know for
certain what condition is underlying the zero scores, it can be important to see how many
children get zero scores on all subtasks. Figure 51 shows this calculation for each region,
disaggregated by G1 and G2 students.
Figure 51. Zero scores on all subtasks
This is a quick and powerful illustration of disparities across regions. The cause of the disparities
may be related to demographics (overage, underage, absences, poverty), or resource constraints
(lack of materials, human resource limitations, etc.) all of which affect teaching and learning.
These issues have been explored in some detail language by language above, and using
regression techniques we can isolate some of the factors that are associated with higher
performance.
Factors that contribute to reading achievement. The sample sizes in each region are sufficient
to analyze reading scores on each subtest; however, when attempting to identify characteristics
14 Each language has its own specific linguistic features that affect the expected rate of literacy acquisition; for
example, agglutinative languages like Ilokano consist of very long words, where another language might have
broken the same concept into several words. Therefore, a reasonable expectation of word reading fluency by grade
for one language might look very different for another language.
4% 7%15%
36%
1% 5%11%
19%
0%
25%
50%
75%
100%
Cebuano Ilokano Hiligaynon Maguindanaoan
Grade 1 Grade 2

EdData II Task Order 15 (DEP-AME)
Philippines EGRA Four Language Study – 2015 Follow-On 60
of the sample that may be associated with results, the sample sizes become too small to be
statistically significant. Therefore, for the purposes of running regression analyses on student and
classroom characteristics, we combine all languages into one sample. Because oral reading
fluency scores can vary according to language characteristic, we use a more comparable variable
across languages, which is “if the child is in the top 25% of readers in the region, by grade level”
(adjusted for region, gender, and being overage). Figure 52, below, shows student self-reported
characteristics that are significantly associated with being one of the top performers according to
oral reading fluency. For the entire sample, 724 children were identified as being in the top 25%
of the students in the region according to ORF. The analysis shows that time on task (having help
at home, doing homework) and eyes on print (using the MTB-MLE materials and having books
at home) are strongly correlated with reading outcomes. For example, if a child is asked to read
aloud “often” in class, the child is nearly four times more likely (than someone who never is
asked) to be in the top 25%.
Figure 52. Factors that contribute to developing strong readers
Note: Dark blue/three asterisks corresponds to .001 level of significance, medium blue/two asterisks corresponds to .05 level of significance, and light blue/one asterisk corresponds to 01 level of significance.
Linear regression concludes the same thing, but we see the actual difference in reading
outcomes; that is, how many more words per minute a child reads, on average, if they have the
characteristic. Children who:
have a teacher who reads stories (in the mother tongue) to the class “often”: 5.9 cwpm
use the MTB-MLE reading book “often” in class: 6.5 cwpm
use the MTB-MLE math book “often” in class: 7.8 cwpm
have any reading materials at home: 8 cwpm
***
**
***
***
***
**
*
*
**
*
*
*
0 0.5 1 1.5 2 2.5 3 3.5 4 4.5
Teacher asks child to read aloud in class "often"…
Teacher gives homework "often" [30%]
Someone listens to the child read aloud at home…
Has reading materials at home (of any kind) [69%]
Has books at home [61%]
Uses the MTB-MLE math book "often" [34%]
Uses the MTB-MLE reading book "often" [32%]
A parent helps with homework "often" [22%]
A parent helps learn letters at home [52%]
A parent helps read words at home [51%]
A sibling helps read words at home [29%]
A sibling helps learn letters at home [27%]
Odds ratio
Home-level factors (student reported)
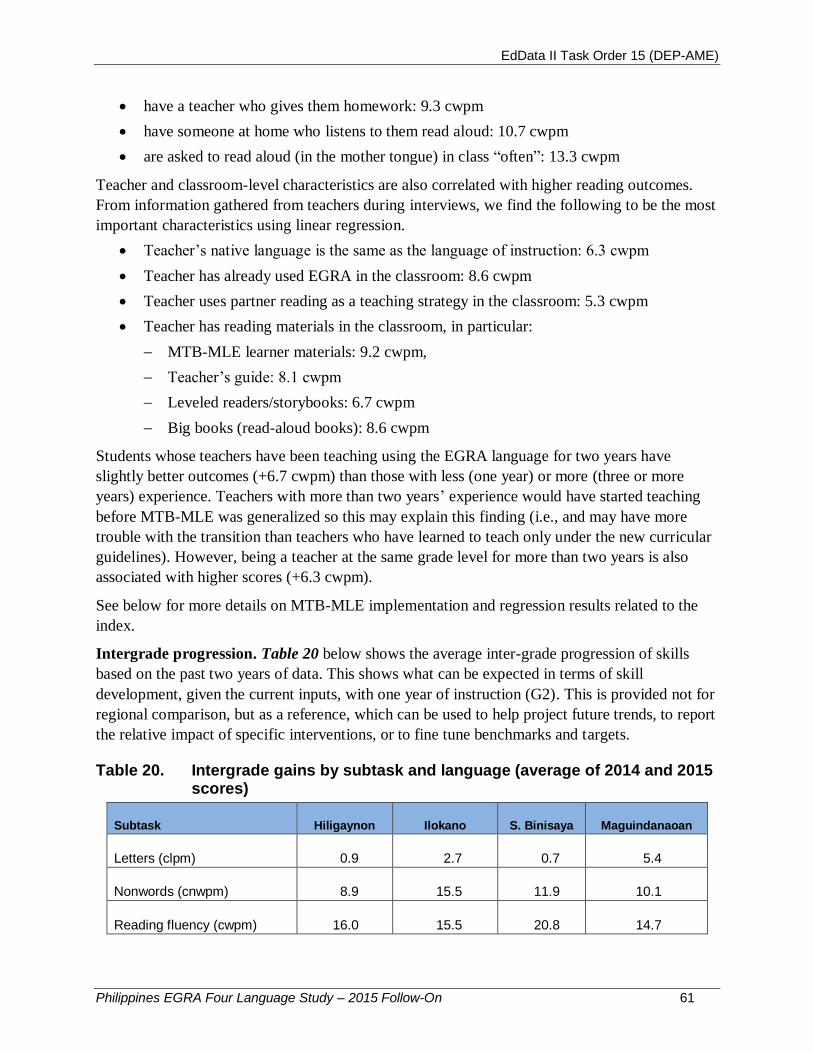
EdData II Task Order 15 (DEP-AME)
Philippines EGRA Four Language Study – 2015 Follow-On 61
have a teacher who gives them homework: 9.3 cwpm
have someone at home who listens to them read aloud: 10.7 cwpm
are asked to read aloud (in the mother tongue) in class “often”: 13.3 cwpm
Teacher and classroom-level characteristics are also correlated with higher reading outcomes.
From information gathered from teachers during interviews, we find the following to be the most
important characteristics using linear regression.
Teacher’s native language is the same as the language of instruction: 6.3 cwpm
Teacher has already used EGRA in the classroom: 8.6 cwpm
Teacher uses partner reading as a teaching strategy in the classroom: 5.3 cwpm
Teacher has reading materials in the classroom, in particular:
MTB-MLE learner materials: 9.2 cwpm,
Teacher’s guide: 8.1 cwpm
Leveled readers/storybooks: 6.7 cwpm
Big books (read-aloud books): 8.6 cwpm
Students whose teachers have been teaching using the EGRA language for two years have
slightly better outcomes (+6.7 cwpm) than those with less (one year) or more (three or more
years) experience. Teachers with more than two years’ experience would have started teaching
before MTB-MLE was generalized so this may explain this finding (i.e., and may have more
trouble with the transition than teachers who have learned to teach only under the new curricular
guidelines). However, being a teacher at the same grade level for more than two years is also
associated with higher scores (+6.3 cwpm).
See below for more details on MTB-MLE implementation and regression results related to the
index.
Intergrade progression. Table 20 below shows the average inter-grade progression of skills
based on the past two years of data. This shows what can be expected in terms of skill
development, given the current inputs, with one year of instruction (G2). This is provided not for
regional comparison, but as a reference, which can be used to help project future trends, to report
the relative impact of specific interventions, or to fine tune benchmarks and targets.
Table 20. Intergrade gains by subtask and language (average of 2014 and 2015 scores)
Subtask Hiligaynon Ilokano S. Binisaya Maguindanaoan
Letters (clpm) 0.9 2.7 0.7 5.4
Nonwords (cnwpm) 8.9 15.5 11.9 10.1
Reading fluency (cwpm) 16.0 15.5 20.8 14.7
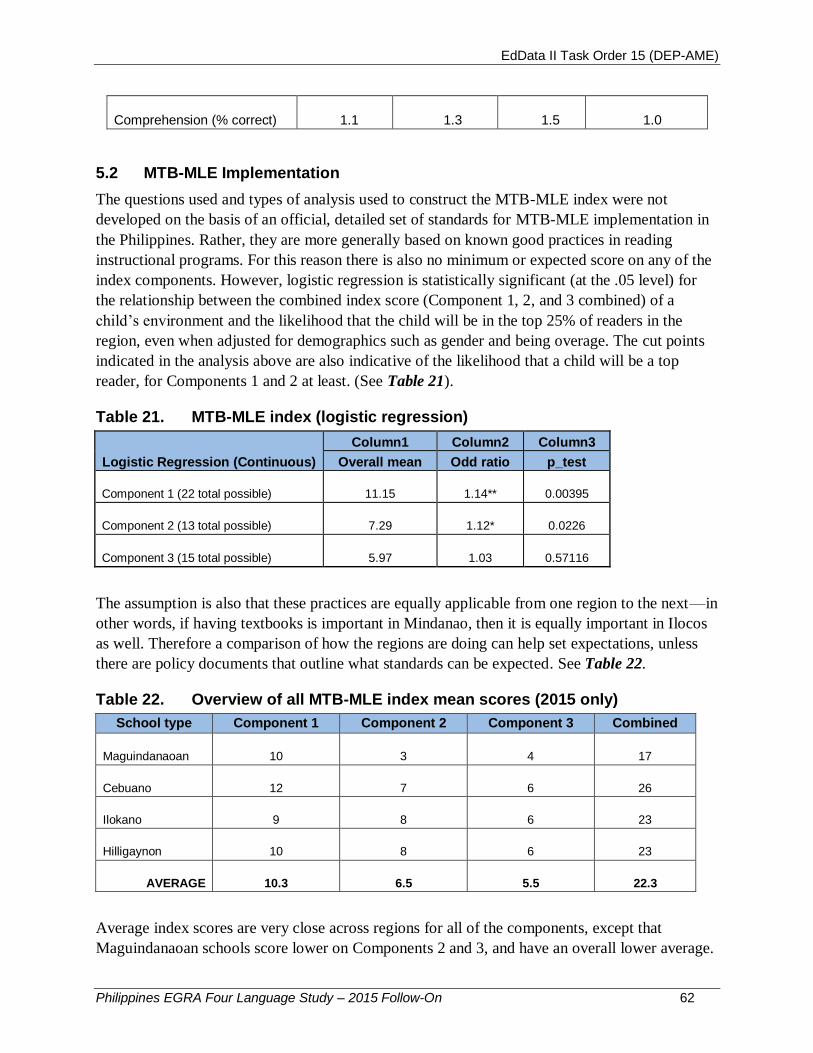
EdData II Task Order 15 (DEP-AME)
Philippines EGRA Four Language Study – 2015 Follow-On 62
Comprehension (% correct) 1.1 1.3 1.5 1.0
5.2 MTB-MLE Implementation
The questions used and types of analysis used to construct the MTB-MLE index were not
developed on the basis of an official, detailed set of standards for MTB-MLE implementation in
the Philippines. Rather, they are more generally based on known good practices in reading
instructional programs. For this reason there is also no minimum or expected score on any of the
index components. However, logistic regression is statistically significant (at the .05 level) for
the relationship between the combined index score (Component 1, 2, and 3 combined) of a
child’s environment and the likelihood that the child will be in the top 25% of readers in the
region, even when adjusted for demographics such as gender and being overage. The cut points
indicated in the analysis above are also indicative of the likelihood that a child will be a top
reader, for Components 1 and 2 at least. (See Table 21).
Table 21. MTB-MLE index (logistic regression)
Logistic Regression (Continuous)
Column1 Column2 Column3
Overall mean Odd ratio p_test
Component 1 (22 total possible) 11.15 1.14** 0.00395
Component 2 (13 total possible) 7.29 1.12* 0.0226
Component 3 (15 total possible) 5.97 1.03 0.57116
The assumption is also that these practices are equally applicable from one region to the next—in
other words, if having textbooks is important in Mindanao, then it is equally important in Ilocos
as well. Therefore a comparison of how the regions are doing can help set expectations, unless
there are policy documents that outline what standards can be expected. See Table 22.
Table 22. Overview of all MTB-MLE index mean scores (2015 only)
School type Component 1 Component 2 Component 3 Combined
Maguindanaoan 10 3 4 17
Cebuano 12 7 6 26
Ilokano 9 8 6 23
Hilligaynon 10 8 6 23
AVERAGE 10.3 6.5 5.5 22.3
Average index scores are very close across regions for all of the components, except that
Maguindanaoan schools score lower on Components 2 and 3, and have an overall lower average.
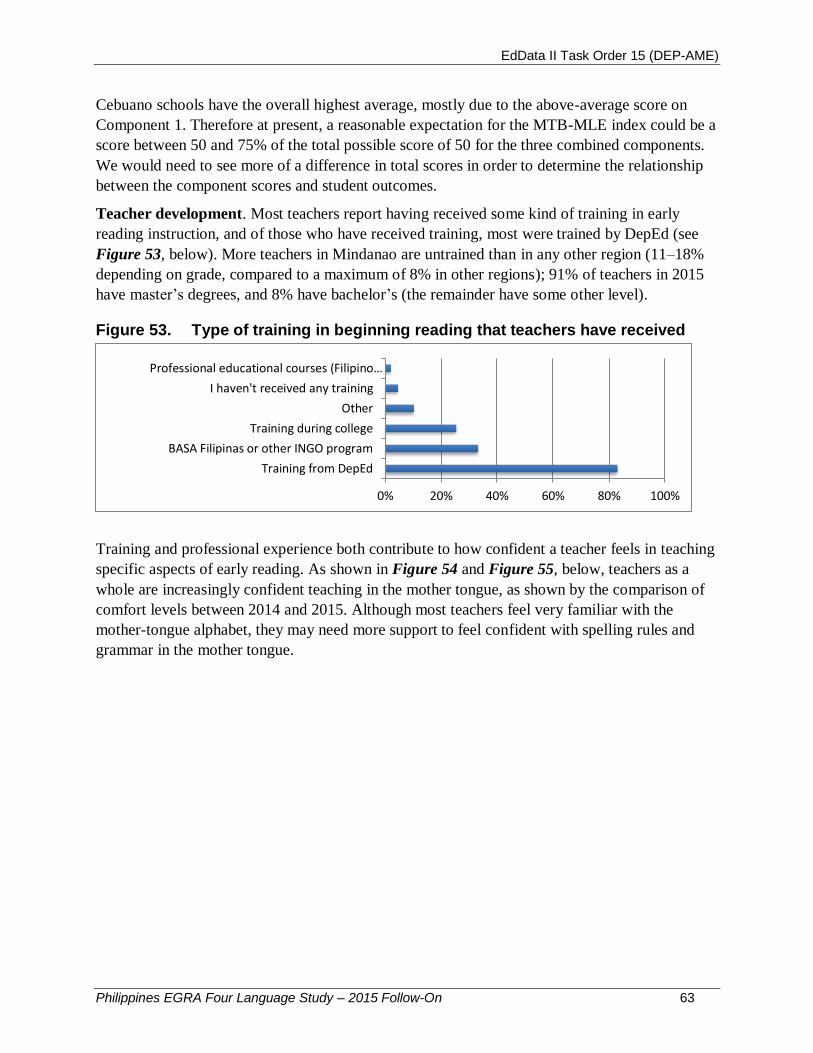
EdData II Task Order 15 (DEP-AME)
Philippines EGRA Four Language Study – 2015 Follow-On 63
Cebuano schools have the overall highest average, mostly due to the above-average score on
Component 1. Therefore at present, a reasonable expectation for the MTB-MLE index could be a
score between 50 and 75% of the total possible score of 50 for the three combined components.
We would need to see more of a difference in total scores in order to determine the relationship
between the component scores and student outcomes.
Teacher development. Most teachers report having received some kind of training in early
reading instruction, and of those who have received training, most were trained by DepEd (see
Figure 53, below). More teachers in Mindanao are untrained than in any other region (11–18%
depending on grade, compared to a maximum of 8% in other regions); 91% of teachers in 2015
have master’s degrees, and 8% have bachelor’s (the remainder have some other level).
Figure 53. Type of training in beginning reading that teachers have received
Training and professional experience both contribute to how confident a teacher feels in teaching
specific aspects of early reading. As shown in Figure 54 and Figure 55, below, teachers as a
whole are increasingly confident teaching in the mother tongue, as shown by the comparison of
comfort levels between 2014 and 2015. Although most teachers feel very familiar with the
mother-tongue alphabet, they may need more support to feel confident with spelling rules and
grammar in the mother tongue.
0% 20% 40% 60% 80% 100%
Training from DepEd
BASA Filipinas or other INGO program
Training during college
Other
I haven't received any training
Professional educational courses (Filipino…

EdData II Task Order 15 (DEP-AME)
Philippines EGRA Four Language Study – 2015 Follow-On 64
Figure 54. Comfort with the mother tongue
Figure 55. Familiarity with the mother tongue
As a reminder, between 4% and 27% of teachers are teaching in a language that is not their own
mother tongue; this proportion is highest for Maguindanaoan schools and lowest for schools
teaching in Cebuano in Region VII.
Materials availability and use. Home access to books (as self-reported by children) is
consistently correlated with higher reading outcomes in the early grades. From a sample of RTI-
administered studies, children who report having access to books at home score between 6 to 8
cwpm higher on reading than their peers who do not.15 In 2014, in the Philippines, having books
at home was associated with a difference of 8 cwpm in reading fluency, or about half a year of
15 All reports available on www.eddataglobal.org
0% 20% 40% 60% 80%
2014
2015
A. Comfort level: Teaching in the MT in general
Very
Somewhat
Not at all
0% 20% 40% 60% 80%
Alphabet sounds
Spelling/orthography
Grammar rules
B. Familiarity with ... (2015 only)
Very
Somewhat
Not at all
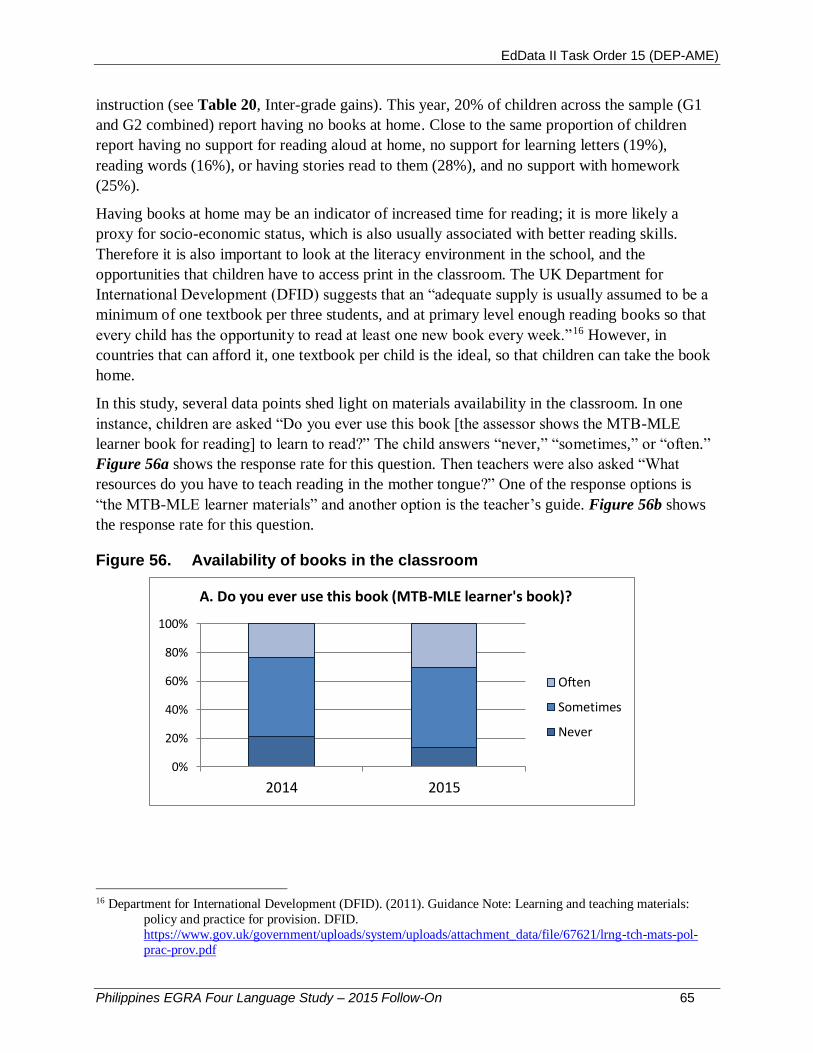
EdData II Task Order 15 (DEP-AME)
Philippines EGRA Four Language Study – 2015 Follow-On 65
instruction (see Table 20, Inter-grade gains). This year, 20% of children across the sample (G1
and G2 combined) report having no books at home. Close to the same proportion of children
report having no support for reading aloud at home, no support for learning letters (19%),
reading words (16%), or having stories read to them (28%), and no support with homework
(25%).
Having books at home may be an indicator of increased time for reading; it is more likely a
proxy for socio-economic status, which is also usually associated with better reading skills.
Therefore it is also important to look at the literacy environment in the school, and the
opportunities that children have to access print in the classroom. The UK Department for
International Development (DFID) suggests that an “adequate supply is usually assumed to be a
minimum of one textbook per three students, and at primary level enough reading books so that
every child has the opportunity to read at least one new book every week.”16 However, in
countries that can afford it, one textbook per child is the ideal, so that children can take the book
home.
In this study, several data points shed light on materials availability in the classroom. In one
instance, children are asked “Do you ever use this book [the assessor shows the MTB-MLE
learner book for reading] to learn to read?” The child answers “never,” “sometimes,” or “often.”
Figure 56a shows the response rate for this question. Then teachers were also asked “What
resources do you have to teach reading in the mother tongue?” One of the response options is
“the MTB-MLE learner materials” and another option is the teacher’s guide. Figure 56b shows
the response rate for this question.
Figure 56. Availability of books in the classroom
16 Department for International Development (DFID). (2011). Guidance Note: Learning and teaching materials:
policy and practice for provision. DFID.
https://www.gov.uk/government/uploads/system/uploads/attachment_data/file/67621/lrng-tch-mats-pol-
prac-prov.pdf
0%
20%
40%
60%
80%
100%
2014 2015
A. Do you ever use this book (MTB-MLE learner's book)?
Often
Sometimes
Never
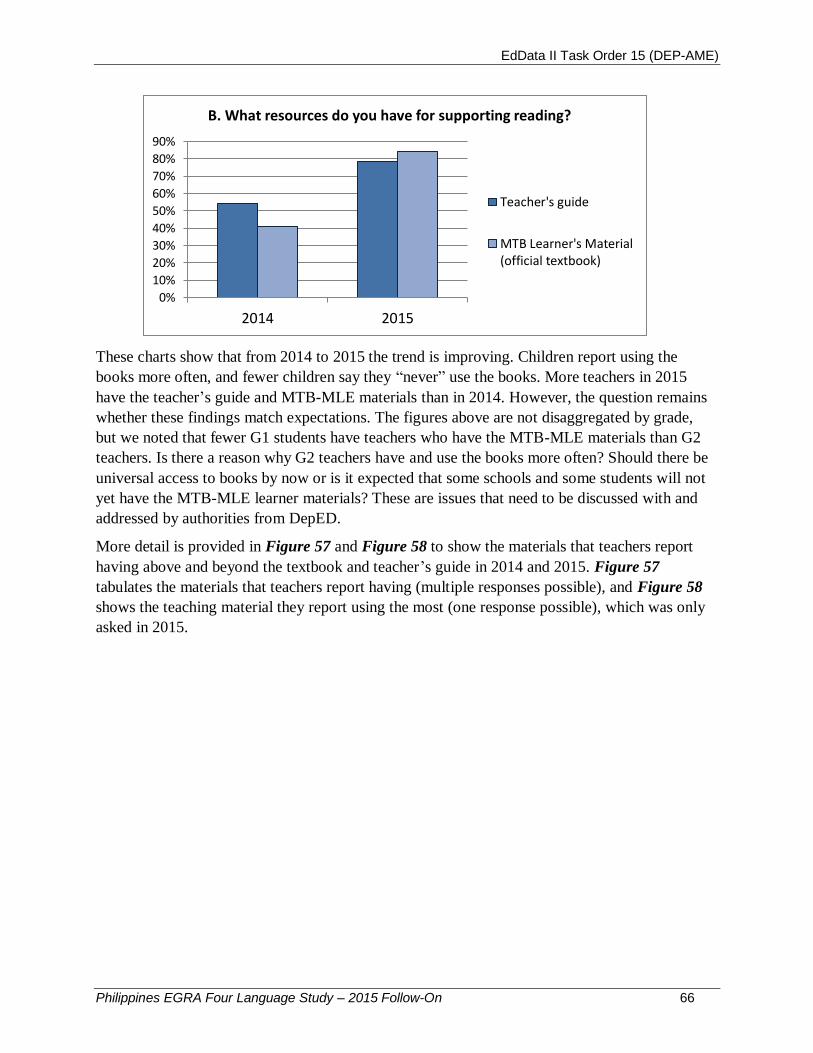
EdData II Task Order 15 (DEP-AME)
Philippines EGRA Four Language Study – 2015 Follow-On 66
These charts show that from 2014 to 2015 the trend is improving. Children report using the
books more often, and fewer children say they “never” use the books. More teachers in 2015
have the teacher’s guide and MTB-MLE materials than in 2014. However, the question remains
whether these findings match expectations. The figures above are not disaggregated by grade,
but we noted that fewer G1 students have teachers who have the MTB-MLE materials than G2
teachers. Is there a reason why G2 teachers have and use the books more often? Should there be
universal access to books by now or is it expected that some schools and some students will not
yet have the MTB-MLE learner materials? These are issues that need to be discussed with and
addressed by authorities from DepED.
More detail is provided in Figure 57 and Figure 58 to show the materials that teachers report
having above and beyond the textbook and teacher’s guide in 2014 and 2015. Figure 57
tabulates the materials that teachers report having (multiple responses possible), and Figure 58
shows the teaching material they report using the most (one response possible), which was only
asked in 2015.
0%
10%
20%
30%
40%
50%
60%
70%
80%
90%
2014 2015
B. What resources do you have for supporting reading?
Teacher's guide
MTB Learner's Material(official textbook)
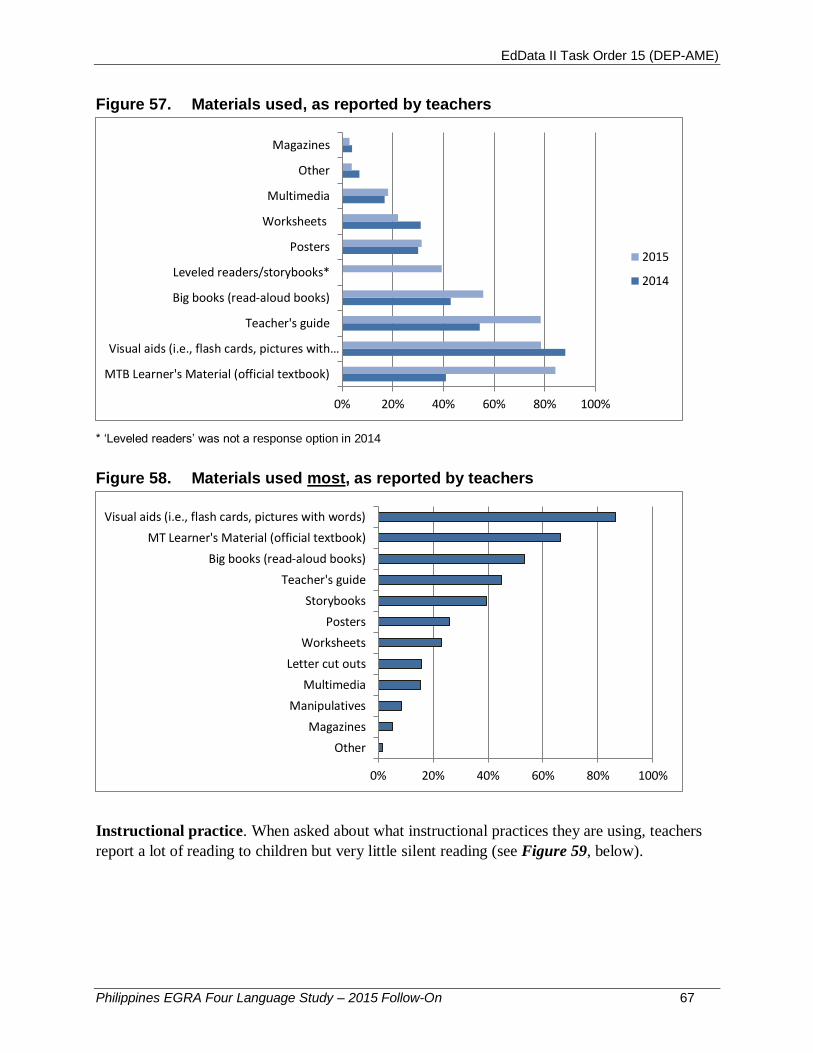
EdData II Task Order 15 (DEP-AME)
Philippines EGRA Four Language Study – 2015 Follow-On 67
Figure 57. Materials used, as reported by teachers
* ‘Leveled readers’ was not a response option in 2014
Figure 58. Materials used most, as reported by teachers
Instructional practice. When asked about what instructional practices they are using, teachers
report a lot of reading to children but very little silent reading (see Figure 59, below).
0% 20% 40% 60% 80% 100%
MTB Learner's Material (official textbook)
Visual aids (i.e., flash cards, pictures with…
Teacher's guide
Big books (read-aloud books)
Leveled readers/storybooks*
Posters
Worksheets
Multimedia
Other
Magazines
2015
2014
0% 20% 40% 60% 80% 100%
Other
Magazines
Manipulatives
Multimedia
Letter cut outs
Worksheets
Posters
Storybooks
Teacher's guide
Big books (read-aloud books)
MT Learner's Material (official textbook)
Visual aids (i.e., flash cards, pictures with words)
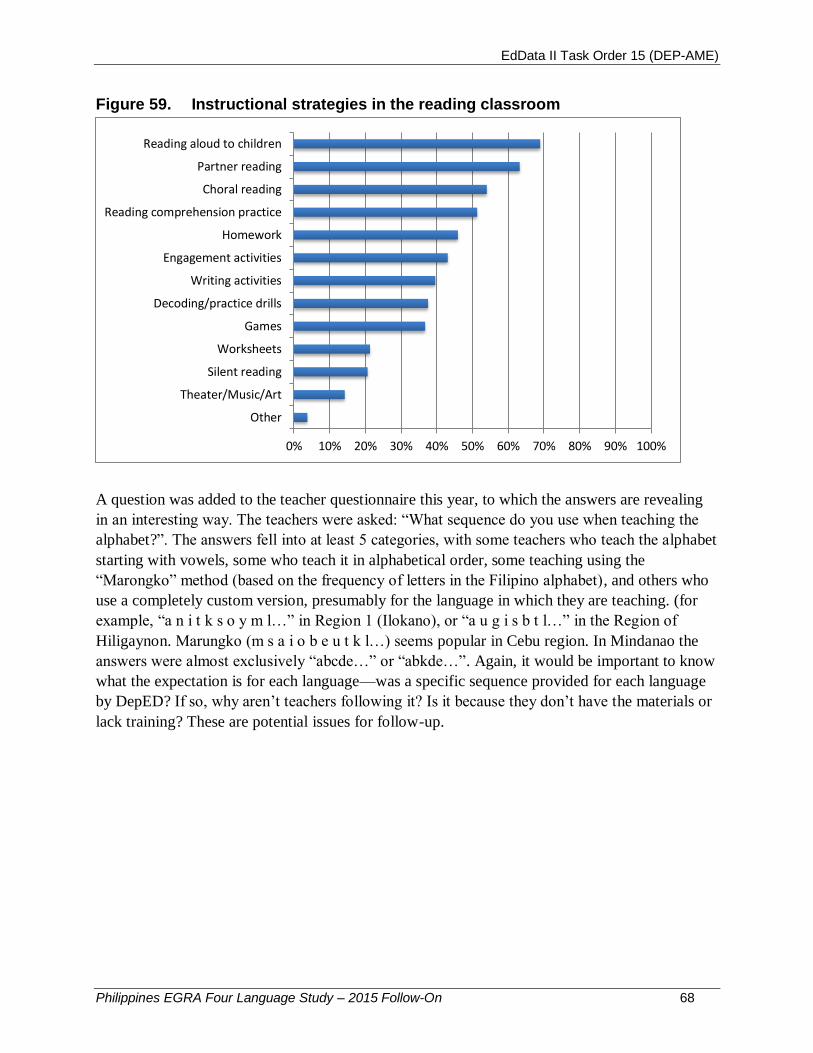
EdData II Task Order 15 (DEP-AME)
Philippines EGRA Four Language Study – 2015 Follow-On 68
Figure 59. Instructional strategies in the reading classroom
A question was added to the teacher questionnaire this year, to which the answers are revealing
in an interesting way. The teachers were asked: “What sequence do you use when teaching the
alphabet?”. The answers fell into at least 5 categories, with some teachers who teach the alphabet
starting with vowels, some who teach it in alphabetical order, some teaching using the
“Marongko” method (based on the frequency of letters in the Filipino alphabet), and others who
use a completely custom version, presumably for the language in which they are teaching. (for
example, “a n i t k s o y m l…” in Region 1 (Ilokano), or “a u g i s b t l…” in the Region of
Hiligaynon. Marungko (m s a i o b e u t k l…) seems popular in Cebu region. In Mindanao the
answers were almost exclusively “abcde…” or “abkde…”. Again, it would be important to know
what the expectation is for each language—was a specific sequence provided for each language
by DepED? If so, why aren’t teachers following it? Is it because they don’t have the materials or
lack training? These are potential issues for follow-up.
0% 10% 20% 30% 40% 50% 60% 70% 80% 90% 100%
Other
Theater/Music/Art
Silent reading
Worksheets
Games
Decoding/practice drills
Writing activities
Engagement activities
Homework
Reading comprehension practice
Choral reading
Partner reading
Reading aloud to children

EdData II Task Order 15 (DEP-AME)
Philippines EGRA Four Language Study – 2015 Follow-On 69
6 Conclusions and Recommendations
In the interest of drawing on all the available information related to children learning to read in
the early grades of elementary education, DepED collaborated with two USAID-supported
activities to host an Early Grade Reading Summit. The Summit, held on August 14, 2015,
enabled participants to consider data from the recently completed pilot implementation by
DepED of the Language Assessment for Primary Grades (LAPG), from an evaluation of learning
outcomes in two regions conducted by the USAID/Basa Pilipinas project, and from the 2015 and
2014 EGRAs in four mother tongues. Participants were asked to discuss these findings,
determine what they see as their implications, and make recommendations for how to improve
the teaching and learning of reading in mother tongues.
The DepED Undersecretary for Programs and Projects, Dina S. Ocampo, opened the Summit by
stressing that DepED sees early grade literacy as an urgent priority. She reiterated that grades
K–3 are the most important foundation for the success of DepED’s K–12 reforms. She pointed
out that when the MTB-MLE policy was begun, there were no data available on how children
learn to read in mother tongues, and that now there are three years of data to inform DepED’s
monitoring and evaluation of MTB-MLE. These data are enabling actors throughout the system
to reflect on their contributions to improving implementation of MTB-MLE.
In addition to having these data, Undersecretary Ocampo emphasized the importance of asking,
“What happens next? Is our intervention good enough? Do we need to support teachers more?
What do we do to help them?” In response to these questions, Dr. Ocampo indicated the
importance of strengthening what she referred to as the “academic spine” within DepED so that
programs are aligned from the center, to the regions, divisions, districts, and schools. The
Undersecretary also asked the participants not to look at early grade education in a vacuum, but
to consider it as integral to the entire education program of DepED. Dr. Ocampo finished by
imploring the participants not to always think of new programs to implement and to instead
reflect on how to improve and get the most value out of the programs, which the Department is
already implementing.
Following Undersecretary Ocampo, Brian Levey, the Director of the Office of Education in
USAID/Philipppines, recalled the contributions of USAID’s support to DepED, notably the two
projects that have been most active over the last three years, PhilED Data and Basa Pilipinas.
Mr. Levey referred to USAID’s agenda, which emphasizes evidence-based programming, new
partnerships, innovation, and a relentless focus on results. He pointed out the close alignment
between USAID’s education strategy and the priorities of DepED—both recognizing and
emphasizing the importance of assuring literacy acquisitions in the early grades of elementary
education.
The Director of the Bureau of Elementary Education, Dr. Marilyn Dimaano, introduced the three
presentations through which the participants would be able to examine the most recent available
data on learning outcomes in the early grades. First, Dr. Nelia Benito, the Director of the
National Education Testing and Research Center (NETRC), presented the results from the pilot
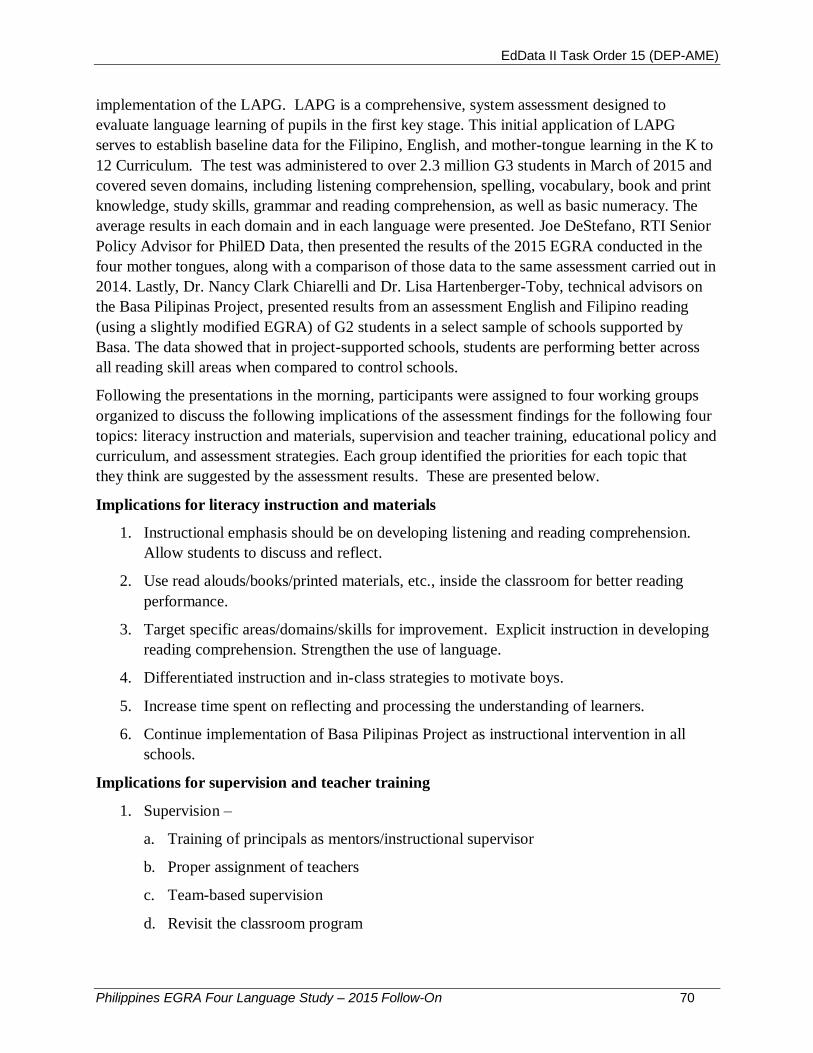
EdData II Task Order 15 (DEP-AME)
Philippines EGRA Four Language Study – 2015 Follow-On 70
implementation of the LAPG. LAPG is a comprehensive, system assessment designed to
evaluate language learning of pupils in the first key stage. This initial application of LAPG
serves to establish baseline data for the Filipino, English, and mother-tongue learning in the K to
12 Curriculum. The test was administered to over 2.3 million G3 students in March of 2015 and
covered seven domains, including listening comprehension, spelling, vocabulary, book and print
knowledge, study skills, grammar and reading comprehension, as well as basic numeracy. The
average results in each domain and in each language were presented. Joe DeStefano, RTI Senior
Policy Advisor for PhilED Data, then presented the results of the 2015 EGRA conducted in the
four mother tongues, along with a comparison of those data to the same assessment carried out in
2014. Lastly, Dr. Nancy Clark Chiarelli and Dr. Lisa Hartenberger-Toby, technical advisors on
the Basa Pilipinas Project, presented results from an assessment English and Filipino reading
(using a slightly modified EGRA) of G2 students in a select sample of schools supported by
Basa. The data showed that in project-supported schools, students are performing better across
all reading skill areas when compared to control schools.
Following the presentations in the morning, participants were assigned to four working groups
organized to discuss the following implications of the assessment findings for the following four
topics: literacy instruction and materials, supervision and teacher training, educational policy and
curriculum, and assessment strategies. Each group identified the priorities for each topic that
they think are suggested by the assessment results. These are presented below.
Implications for literacy instruction and materials
1. Instructional emphasis should be on developing listening and reading comprehension.
Allow students to discuss and reflect.
2. Use read alouds/books/printed materials, etc., inside the classroom for better reading
performance.
3. Target specific areas/domains/skills for improvement. Explicit instruction in developing
reading comprehension. Strengthen the use of language.
4. Differentiated instruction and in-class strategies to motivate boys.
5. Increase time spent on reflecting and processing the understanding of learners.
6. Continue implementation of Basa Pilipinas Project as instructional intervention in all
schools.
Implications for supervision and teacher training
1. Supervision –
a. Training of principals as mentors/instructional supervisor
b. Proper assignment of teachers
c. Team-based supervision
d. Revisit the classroom program
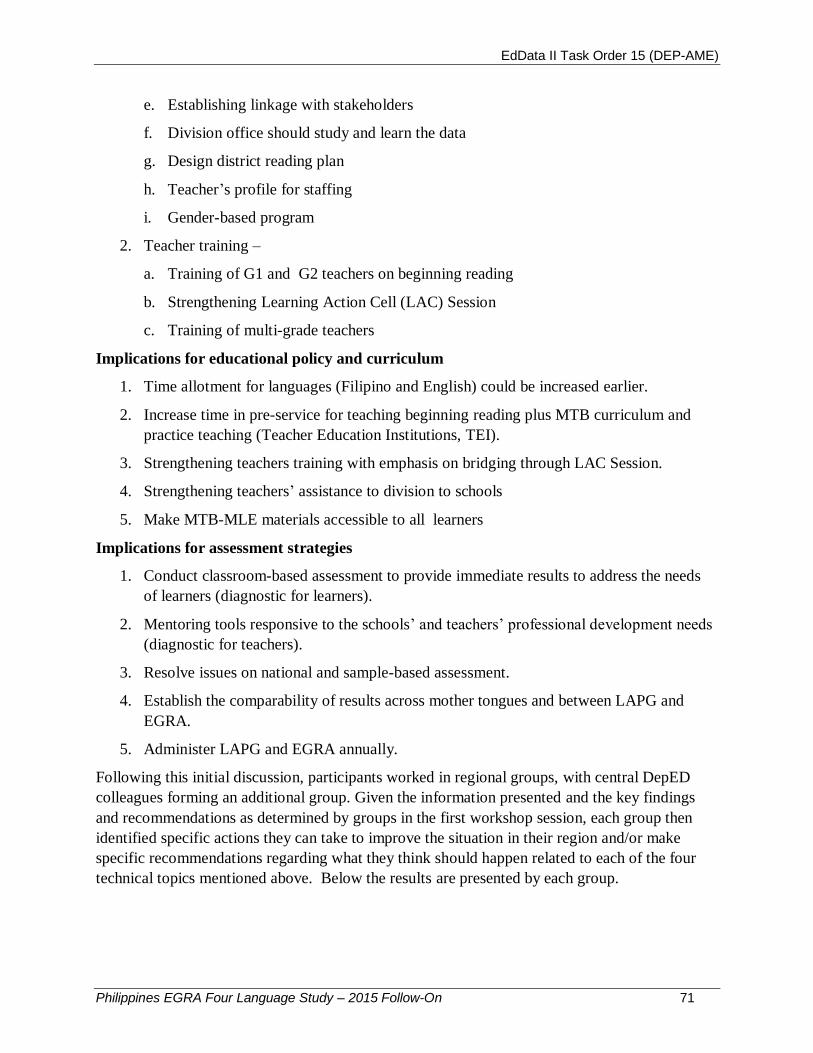
EdData II Task Order 15 (DEP-AME)
Philippines EGRA Four Language Study – 2015 Follow-On 71
e. Establishing linkage with stakeholders
f. Division office should study and learn the data
g. Design district reading plan
h. Teacher’s profile for staffing
i. Gender-based program
2. Teacher training –
a. Training of G1 and G2 teachers on beginning reading
b. Strengthening Learning Action Cell (LAC) Session
c. Training of multi-grade teachers
Implications for educational policy and curriculum
1. Time allotment for languages (Filipino and English) could be increased earlier.
2. Increase time in pre-service for teaching beginning reading plus MTB curriculum and
practice teaching (Teacher Education Institutions, TEI).
3. Strengthening teachers training with emphasis on bridging through LAC Session.
4. Strengthening teachers’ assistance to division to schools
5. Make MTB-MLE materials accessible to all learners
Implications for assessment strategies
1. Conduct classroom-based assessment to provide immediate results to address the needs
of learners (diagnostic for learners).
2. Mentoring tools responsive to the schools’ and teachers’ professional development needs
(diagnostic for teachers).
3. Resolve issues on national and sample-based assessment.
4. Establish the comparability of results across mother tongues and between LAPG and
EGRA.
5. Administer LAPG and EGRA annually.
Following this initial discussion, participants worked in regional groups, with central DepED
colleagues forming an additional group. Given the information presented and the key findings
and recommendations as determined by groups in the first workshop session, each group then
identified specific actions they can take to improve the situation in their region and/or make
specific recommendations regarding what they think should happen related to each of the four
technical topics mentioned above. Below the results are presented by each group.
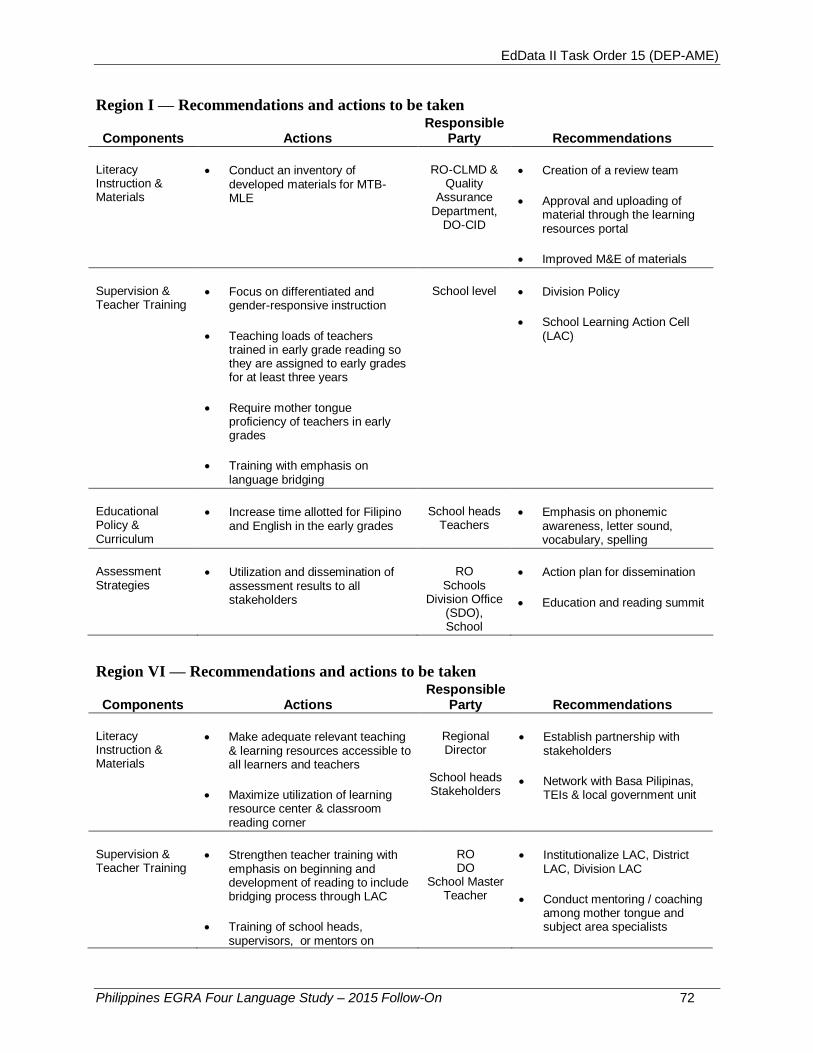
EdData II Task Order 15 (DEP-AME)
Philippines EGRA Four Language Study – 2015 Follow-On 72
Region I — Recommendations and actions to be taken
Components Actions Responsible
Party Recommendations
Literacy Instruction & Materials
Conduct an inventory of developed materials for MTB-MLE
RO-CLMD & Quality
Assurance Department,
DO-CID
Creation of a review team
Approval and uploading of material through the learning resources portal
Improved M&E of materials
Supervision & Teacher Training
Focus on differentiated and gender-responsive instruction
Teaching loads of teachers trained in early grade reading so they are assigned to early grades for at least three years
Require mother tongue proficiency of teachers in early grades
Training with emphasis on language bridging
School level Division Policy
School Learning Action Cell (LAC)
Educational Policy & Curriculum
Increase time allotted for Filipino and English in the early grades
School heads Teachers
Emphasis on phonemic awareness, letter sound, vocabulary, spelling
Assessment Strategies
Utilization and dissemination of assessment results to all stakeholders
RO Schools
Division Office (SDO), School
Action plan for dissemination
Education and reading summit
Region VI — Recommendations and actions to be taken
Components Actions Responsible
Party Recommendations
Literacy Instruction & Materials
Make adequate relevant teaching & learning resources accessible to all learners and teachers
Maximize utilization of learning resource center & classroom reading corner
Regional Director
School heads Stakeholders
Establish partnership with stakeholders
Network with Basa Pilipinas, TEIs & local government unit
Supervision & Teacher Training
Strengthen teacher training with emphasis on beginning and development of reading to include bridging process through LAC
Training of school heads, supervisors, or mentors on
RO DO
School Master Teacher
Institutionalize LAC, District LAC, Division LAC
Conduct mentoring / coaching among mother tongue and subject area specialists

EdData II Task Order 15 (DEP-AME)
Philippines EGRA Four Language Study – 2015 Follow-On 73
Components Actions Responsible
Party Recommendations reading pedagogy
Educational Policy & Curriculum
Revisit class program to allocate time for reading
Engaged-time-on-tasks
Institutionalize multi-literacy & numeracy program
School heads Teachers
Revise class program to include specific time for reading
Enhance engaged-time-on tasks
Assessment Strategies
Develop school-based assessment with the school head to support the national assessment
School heads Teachers
Encourage teachers to conduct school-based reading assessment to support national assessment results
Region VII — Recommendations and actions to be taken
Actions Responsible Party/Office Recommendations
Literacy Instructions and Materials
Develop materials to support/address the least learned competencies
RO SDO
School heads Teachers
Identify pool of writers/subject specialists
Supervision and Teacher Training
Intensify instructional supervision
Strengthen capability building of teachers
School heads & teachers
SDO, school heads
Strengthen the conduct of LAC sessions
Conduct school-based in-service training on beginning reading
Educational Policy and Curriculum
Intensify teacher induction program
SDO Include topics on current trends in language literacy and numeracy
Assessment Strategies
Conduct classroom-based assessment focusing on the early grades
SDO & schools Train teachers on the preparation of the tool and utilization of results
As stated throughout this report, the 2015 survey in the four regions revealed that progress is
being made in implementing MTB-MLE, especially regarding improvements in teacher
preparation and readiness to teach reading in mother tongues and in changing teacher
expectations of when their students should learn to read. However, instructional practice has not
dramatically improved. Student performance in three of the four regions tested is trending
upwards, albeit the rate of improvement is still slow as the education system adjusts to the
complete overhaul of the curriculum that has been undertaken over the last three years. As stated
by Undersecretary Ocampo, this is not the time to switch to something new, but rather is the time
to seek ways to improve the programs and initiatives that DepED is already trying to implement.
Renewed and intensified efforts are going to be needed if DepED is to succeed in helping
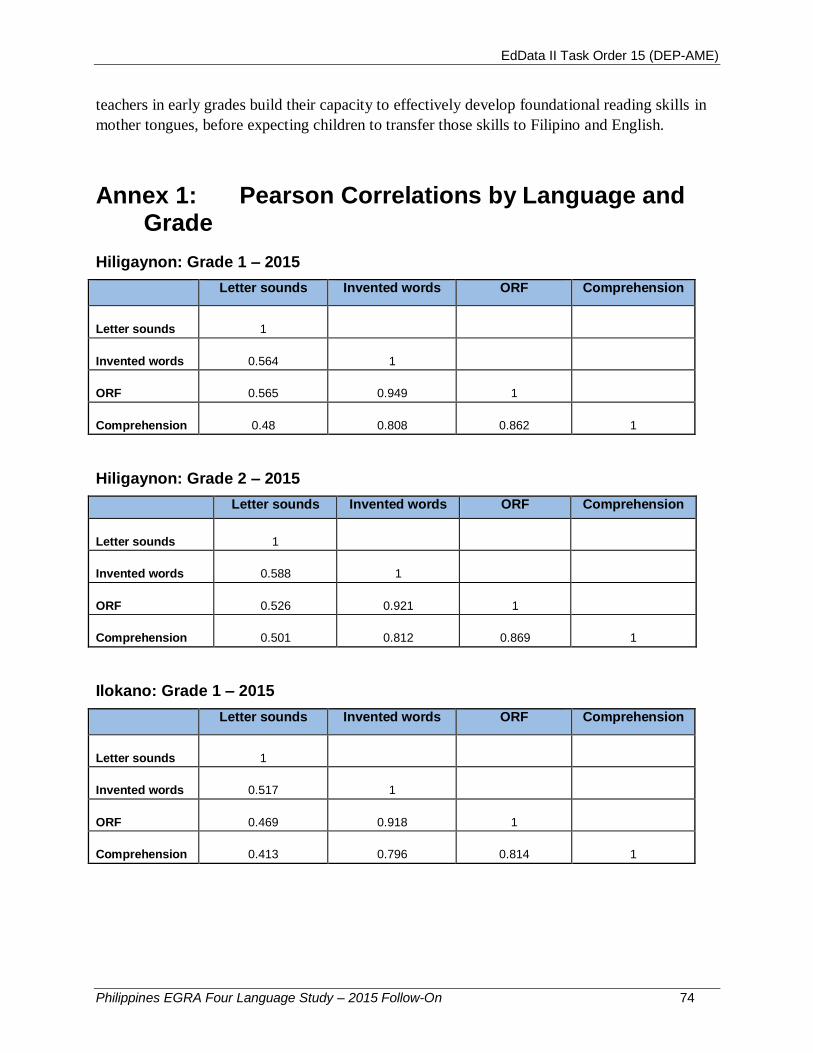
EdData II Task Order 15 (DEP-AME)
Philippines EGRA Four Language Study – 2015 Follow-On 74
teachers in early grades build their capacity to effectively develop foundational reading skills in
mother tongues, before expecting children to transfer those skills to Filipino and English.
Annex 1: Pearson Correlations by Language and
Grade
Hiligaynon: Grade 1 – 2015
Letter sounds Invented words ORF Comprehension
Letter sounds 1
Invented words 0.564 1
ORF 0.565 0.949 1
Comprehension 0.48 0.808 0.862 1
Hiligaynon: Grade 2 – 2015
Letter sounds Invented words ORF Comprehension
Letter sounds 1
Invented words 0.588 1
ORF 0.526 0.921 1
Comprehension 0.501 0.812 0.869 1
Ilokano: Grade 1 – 2015
Letter sounds Invented words ORF Comprehension
Letter sounds 1
Invented words 0.517 1
ORF 0.469 0.918 1
Comprehension 0.413 0.796 0.814 1

EdData II Task Order 15 (DEP-AME)
Philippines EGRA Four Language Study – 2015 Follow-On 75
Ilokano: Grade 2 – 2015
Letter sounds Invented words ORF Comprehension
Letter sounds 1
Invented words 0.484 1
ORF 0.422 0.906 1
Comprehension 0.429 0.78 0.808 1
Cebuano: Grade 1 – 2015
Letter sounds Invented words ORF Comprehension
Letter sounds 1
Invented words 0.643 1
ORF 0.612 0.951 1
Comprehension 0.517 0.841 0.87 1
Cebuano: Grade 2 – 2015
Letter sounds Invented words ORF Comprehension
Letter sounds 1
Invented words 0.441 1
ORF 0.406 0.887 1
Comprehension 0.388 0.746 0.813 1
Maguindanaoan: Grade 1 – 2015
Letter sounds Invented words ORF Comprehension
Letter sounds 1
Invented words 0.352 1
ORF 0.384 0.87 1
Comprehension 0.332 0.791 0.807 1
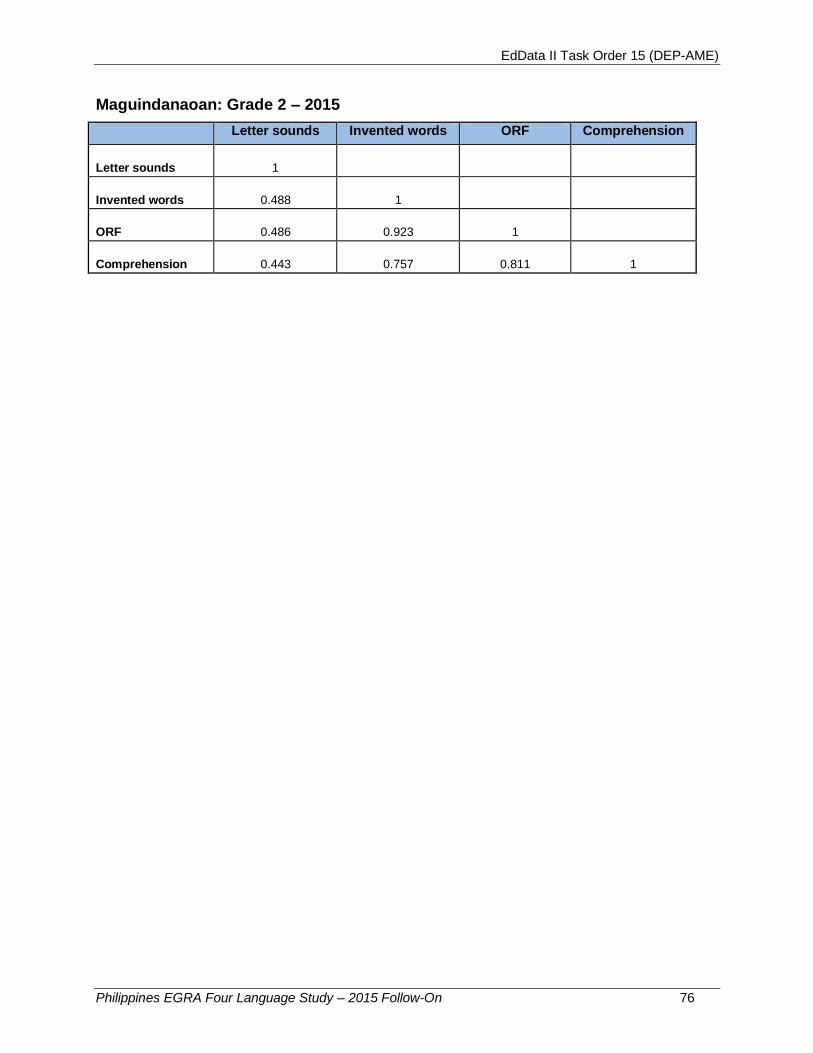
EdData II Task Order 15 (DEP-AME)
Philippines EGRA Four Language Study – 2015 Follow-On 76
Maguindanaoan: Grade 2 – 2015
Letter sounds Invented words ORF Comprehension
Letter sounds 1
Invented words 0.488 1
ORF 0.486 0.923 1
Comprehension 0.443 0.757 0.811 1

EdData II Task Order 15 (DEP-AME)
Philippines EGRA Four Language Study – 2015 Follow-On 77
Annex 2: Outcome of Regional Discussion of EGRA Results in Region VI
Reading the 2015 report and results, are there any findings that are surprising? How do you
explain these results? Please indicate how positive or negative findings align with local standards
and expectations. For example, if the report finds that 50% of teachers do not have a teaching
guide, is that the expected teacher-to-manual ratio? If not, what could explain the fact that half of
teachers don’t have the manual? If the teachers report using a certain sequence in teaching the
alphabet, is that the same one that is recommended by the official materials or not?
Conclusions Recommendations
Most pupils manifest non-mastery/confusion between letter name and letter sounds
Grade 1 and 2 teachers will have to give more focus on mastery of letter sounds and other basic skills
Grade 2 pupils were confused during decoding task because teachers are at the same time also introducing beginning reading in English and Filipino
Proper time/enough time needs to be allotted to the mastery of MTB-MLE reading skills before introducing English and Filipino
Students promoted from G1 to G2 have not mastered reading and oral fluency
Intensify remediation and interventions for those pupils who have not mastered basic reading skills
Teachers focused too much on improving reading comprehension
Teaching needs to be holistic and more balanced across all subtasks of reading
Poor Hiligaynon and English development may in part be due too much focus on teacher activities in teacher training
More focus in teacher training needs to be given to pupil activities and pupil interaction that teachers should be facilitating
MTB-MLE implementation increases, while learning outcomes decrease
Intensify instructional supervision with focus on developmental reading. Conduct curriculum review in teacher education institutions to ensure adequate focus on development reading subjects.
Insufficient number of teacher’s guides distributed to the field. An increased number of classes leaves the new teachers without teacher’s guides and without training in MTB-MLE
Additional procurement of materials through local, national agencies, and through NGOs.
Provision of teacher’s guide from Central/Regional Office to newly hired teachers in Grades 1 and 2.
In teaching the alphabet, teachers do not follow the suggested sequence as indicated in the official materials. Most of the teachers are simply teaching the letters in order.
Capacitate school heads on instructional supervision with intensified attention during supervision on developmental reading and basic skills development.
EdData II Task Order 15 (DEP-AME)
Philippines EGRA Four Language Study – 2015 Follow-On 78
The EGRA and associated instruments (student questionnaire, teacher questionnaire, classroom
observation) only measure some aspects of MTB-MLE implementation and student learning.
However, there are of course many other factors that are unmeasured that no doubt have an
influence on results. What are some other important initiatives or events in the region that could
have had an effect on the results? For example, if many schools were closed due to weather or
conflict? Were there other special reading-focused initiatives launched in the region? Are there
known problems with children being matched to a school that uses their mother tongue as
language of instruction?
Reading Programs
Include MTB in the remedial reading program
Hangkat sa Kinaalaman of Iloilo Province
Parade of characters during reading month
Various languages used at home
Conduct of Search for Outstanding Reading Teacher (SORT)
Literacy and numeracy training for teachers
Drop Everything and Read (DEAR)
Reading Recovery Program
Reading month
Factors:
Educational attainment of parents
Socio-economic status
Inequitable teacher’s training
Topographical location of schools
Peace and security situation
Natural calamities
No proper assessment of children with special needs
Time of year/day in which the pupils are being assessed
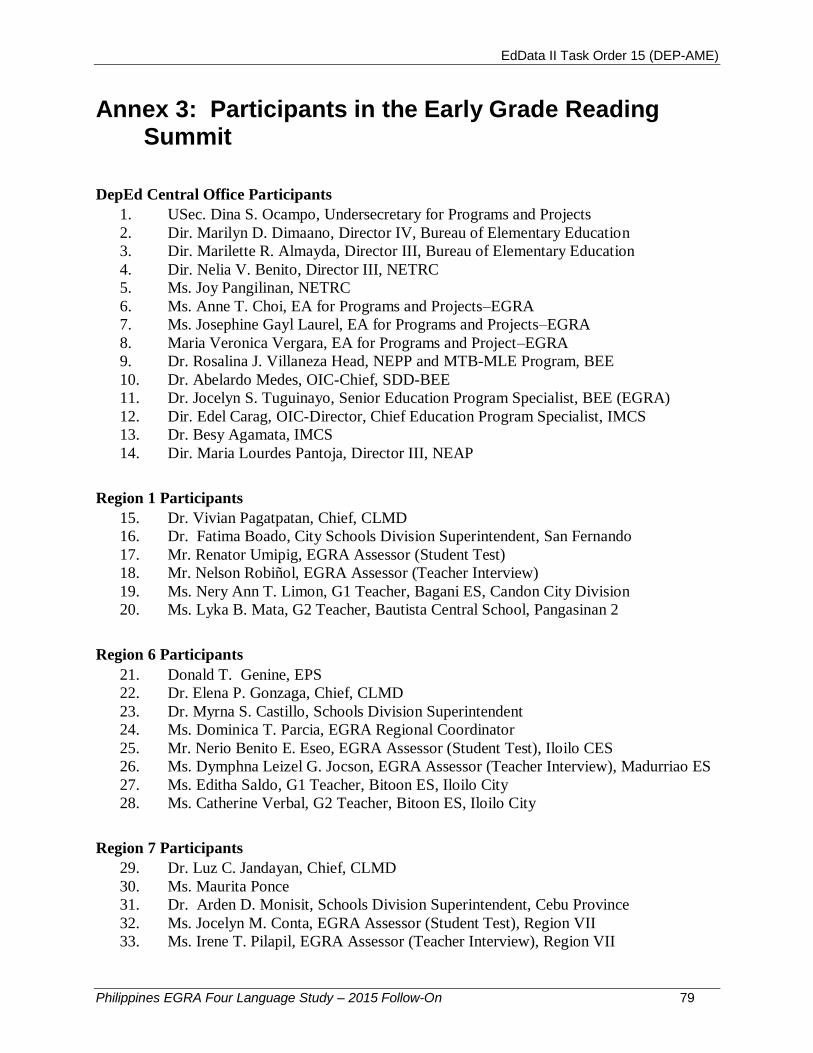
EdData II Task Order 15 (DEP-AME)
Philippines EGRA Four Language Study – 2015 Follow-On 79
Annex 3: Participants in the Early Grade Reading Summit
DepEd Central Office Participants
1. USec. Dina S. Ocampo, Undersecretary for Programs and Projects
2. Dir. Marilyn D. Dimaano, Director IV, Bureau of Elementary Education
3. Dir. Marilette R. Almayda, Director III, Bureau of Elementary Education
4. Dir. Nelia V. Benito, Director III, NETRC
5. Ms. Joy Pangilinan, NETRC
6. Ms. Anne T. Choi, EA for Programs and Projects–EGRA
7. Ms. Josephine Gayl Laurel, EA for Programs and Projects–EGRA
8. Maria Veronica Vergara, EA for Programs and Project–EGRA
9. Dr. Rosalina J. Villaneza Head, NEPP and MTB-MLE Program, BEE
10. Dr. Abelardo Medes, OIC-Chief, SDD-BEE
11. Dr. Jocelyn S. Tuguinayo, Senior Education Program Specialist, BEE (EGRA)
12. Dir. Edel Carag, OIC-Director, Chief Education Program Specialist, IMCS
13. Dr. Besy Agamata, IMCS
14. Dir. Maria Lourdes Pantoja, Director III, NEAP
Region 1 Participants
15. Dr. Vivian Pagatpatan, Chief, CLMD
16. Dr. Fatima Boado, City Schools Division Superintendent, San Fernando
17. Mr. Renator Umipig, EGRA Assessor (Student Test)
18. Mr. Nelson Robiñol, EGRA Assessor (Teacher Interview)
19. Ms. Nery Ann T. Limon, G1 Teacher, Bagani ES, Candon City Division
20. Ms. Lyka B. Mata, G2 Teacher, Bautista Central School, Pangasinan 2
Region 6 Participants
21. Donald T. Genine, EPS
22. Dr. Elena P. Gonzaga, Chief, CLMD
23. Dr. Myrna S. Castillo, Schools Division Superintendent
24. Ms. Dominica T. Parcia, EGRA Regional Coordinator
25. Mr. Nerio Benito E. Eseo, EGRA Assessor (Student Test), Iloilo CES
26. Ms. Dymphna Leizel G. Jocson, EGRA Assessor (Teacher Interview), Madurriao ES
27. Ms. Editha Saldo, G1 Teacher, Bitoon ES, Iloilo City
28. Ms. Catherine Verbal, G2 Teacher, Bitoon ES, Iloilo City
Region 7 Participants
29. Dr. Luz C. Jandayan, Chief, CLMD
30. Ms. Maurita Ponce
31. Dr. Arden D. Monisit, Schools Division Superintendent, Cebu Province
32. Ms. Jocelyn M. Conta, EGRA Assessor (Student Test), Region VII
33. Ms. Irene T. Pilapil, EGRA Assessor (Teacher Interview), Region VII

EdData II Task Order 15 (DEP-AME)
Philippines EGRA Four Language Study – 2015 Follow-On 80
34. Ms. Sheila R. Dumagil, G1 Teacher, LapuLapu City Central School
35. Ms. Brenda Lee Faelnar, G2 Teacher, Pilipog ES, Cordova
ARMM Participants
36. Ms. Saada Tubing, EGRA Regional Coordinator, ARMM
Basa Pilipinas Participants
37. Mr. Marcial Salvatierra, COP
38. Ms. Lisa Hartenberger-Toby, DCOP for Programs
39. Mr. Ilya Son, DCOP for Operations
40. Ms. Nancy Clark-Chiarelli, Senior Technical Director
41. Ms. Chin Ruba, M&E and Research Specialist
42. Ms. Ophelia Armilla, Administration and Logistic Officer
43. Harry James Creo, Communication Officer
44. Paolo Balderia, Communication Assistant Officer
45. Ms. Carolyn Fruto, Operation Manager
UP-NISMED
46. Dr. Monalisa Sasing, Researcher, UP NISMED
RTI International
47. Mr. Joseph DeStefano, Senior Technical Advisor
48. Mr. Rufino Jamilano, In-Country Task Coordinator, PhilED Data Project
SEAMEO-INNOTECH
49. Dr. Ramon Bacani, Executive Director
50. Mr. Philip Purnell, Research and Training Director
USAID Philippines
51. Mr. Brian Levey, Director, Office of Education
52. Ms. Erica Rounsefell, Deputy Director, Office of Education
53. Ms. Marie Antoinette Reyes-Hayles, Program Management Specialist, Office of
Education
54. Ms. Nancy Ebuenga, Development Program Specialist
55. Mr. Albert Aquino, Development Program Specialist
Social Impact
56. Mr. Mike Duthie, Senior Evaluation Specialist
57. Jessie Barrot, Education Specialist