tata motors ltd. - credit suisse
TRANSCRIPT
DISCLOSURE APPENDIX AT THE BACK OF THIS REPORT CONTAINS IMPORTANT DISCLOSURES, ANALYST CERTIFICATIONS, AND THE STATUS OF NON-US ANALYSTS. US Disclosure: Credit Suisse does and seeks to do business with companies covered in its research reports. As a result, investors should be aware that the Firm may have a conflict of interest that could affect the objectivity of this report. Investors should consider this report as only a single factor in making their investment decision.
CREDIT SUISSE SECURITIES RESEARCH & ANALYTICS BEYOND INFORMATION®
Client-Driven Solutions, Insights, and Access
09 January 2014
Asia Pacific/India
Equity Research
Automobile Manufacturers
Tata Motors Ltd.
(TAMO.BO / TTMT IN) INCREASE TARGET PRICE
The story has more legs: Part 2
■ JLR exhibiting great confidence in volumes, doubling capacity in four
years. In our 10 Sep 2013 report, "The story has more legs", we highlighted
how JLR's annual sales could easily exceed 600,000 units by FY17. JLR
clearly has much more aggressive plans than that and is gearing up to double
capacity from 400,000 in FY13 to 800,000 units by FY17. The higher outlay on
capex with a bias towards spends for capacity expansion (60%) rather than
product development is an indication of the company's confidence on volumes.
■ JLR catching up on platform efficiency should help protect margins. JLR
until recently almost had a platform per model, which has resulted in JLR
having more platforms than peers despite selling a fourth of their volumes.
Going forward, it is likely to focus on three main platforms against seven
platforms currently. This platform consolidation should result in JLR doubling
the models/platform and almost tripling the volumes/platform. Given the kind of
savings that other manufacturers have seen, we assume 20% savings on
models undergoing platform consolidation. After accounting for the spends on
new platforms, we believe an annual saving of ~GBP1 bn (>300 bp) is
possible by FY18, which should offset impact of negative mix from FY16.
■ RR, RR Sport scale-up is the key near-term trigger. While the RR and RR
Sport combined contribute ~30% to JLR's volumes, we estimate their EBITDA
contribution to be as high as ~70% given their high ASPs and margins. We
believe the volumes of RR and RR Sport can scale up from a monthly run-rate
of 10,000-11,000 in the last couple of months to 14,000-15,000 in coming
months, driving earnings upgrades. We raise our earnings estimates by ~5%
on higher volume assumptions at JLR, partially compensated by higher capex
and higher losses standalone. Our TP rises to Rs450.
Share price performance
80
100
120
140
160
200
250
300
350
400
Jan-12 May-12 Sep-12 Jan-13 May-13 Sep-13
Price (LHS) Rebased Rel (RHS)
The price relative chart measures performance against the S&P
BSE SENSEX IDX which closed at 20729.38 on 08/01/14
On 08/01/14 the spot exchange rate was Rs62.15/US$1
Performance over 1M 3M 12M Absolute (%) -5.2 -3.9 13.3 Relative (%) -2.7 -4.8 7.9
Financial and valuation metrics
Year 3/13A 3/14E 3/15E 3/16E Revenue (Rs mn) 1,888,176.3 2,356,073.4 2,709,395.0 3,142,644.0 EBITDA (Rs mn) 265,688.9 364,542.8 426,472.9 484,670.3 EBIT (Rs mn) 169,780.0 230,319.6 252,974.3 276,917.3 Net profit (Rs mn) 98,926.1 140,504.5 166,506.6 187,450.1 EPS (CS adj.) (Rs) 31.01 44.04 52.19 58.76 Change from previous EPS (%) n.a. 1.2 5.6 6.1 Consensus EPS (Rs) n.a. 42.4 50.5 57.7 EPS growth (%) -27.2 42.0 18.5 12.6 P/E (x) 11.9 8.4 7.1 6.3 Dividend yield (%) 0.6 1.3 1.3 1.3 EV/EBITDA (x) 5.0 3.7 3.1 2.6 P/B (x) 3.1 2.4 1.8 1.4 ROE (%) 28.0 32.0 28.8 25.3 Net debt/equity (%) 85.5 69.7 49.3 29.0
Source: Company data, Thomson Reuters, Credit Suisse estimates
Rating OUTPERFORM* Price (08 Jan 14, Rs) 370.25 Target price (Rs) (from 440.00) 450.00¹ Pot. upside (%) 21.5 Mkt cap (Rs mn) 1,013,265 (US$ 16,304) Enterprise value (Rs mn) 1,366,321 Number of shares (mn) 2,736.71 Free float (%) 66.0 52-week price range 399.8 - 255.3 ADTO - 6M (US$ mn) 45.6
*Stock ratings are relative to the coverage universe in each
analyst's or each team's respective sector.
¹Target price is for 12 months.
Research Analysts
Jatin Chawla
91 22 6777 3719
Akshay Saxena
91 22 6777 3825
CS's recent reports on Tata Motors
■ The story has more legs
■ Don’t ignore the mix, FY14 to be more like FY12
than FY13
■ FY13 annual report analysis
■ New RR to drive upgrades
09 January 2014
Tata Motors Ltd.
(TAMO.BO / TTMT IN) 2
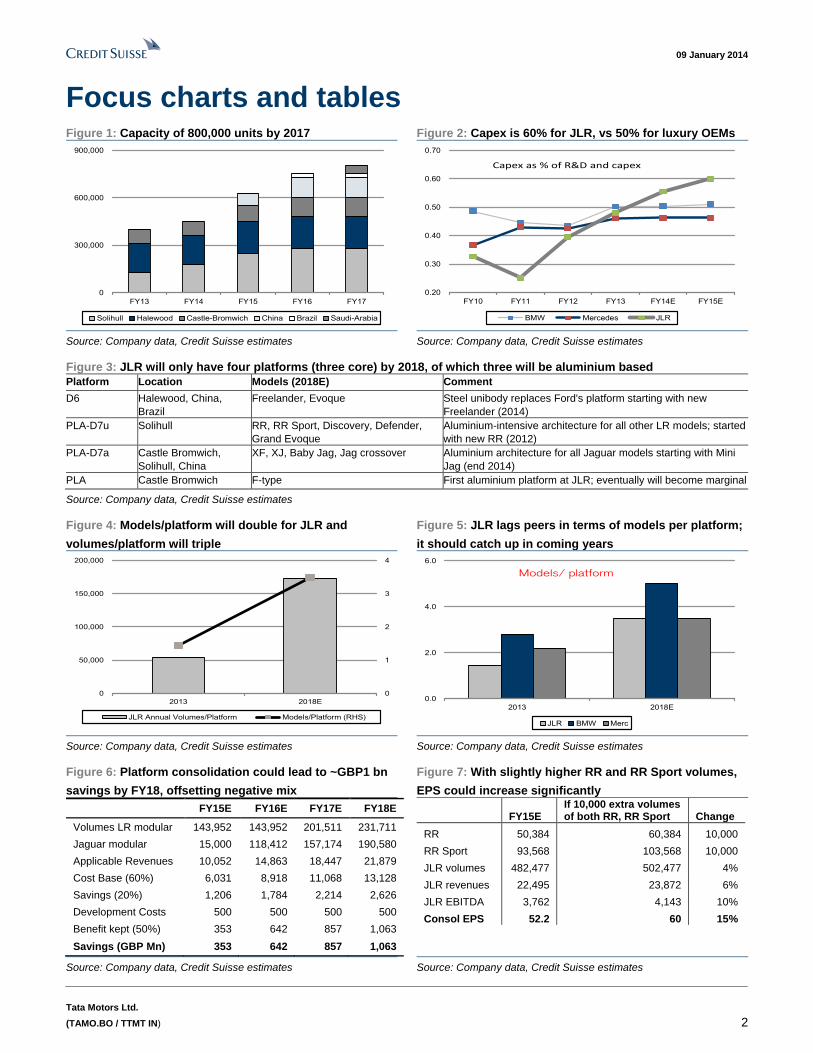
Focus charts and tables Figure 1: Capacity of 800,000 units by 2017 Figure 2: Capex is 60% for JLR, vs 50% for luxury OEMs
0
300,000
600,000
900,000
FY13 FY14 FY15 FY16 FY17
Solihull Halewood Castle-Bromwich China Brazil Saudi-Arabia
0.20
0.30
0.40
0.50
0.60
0.70
FY10 FY11 FY12 FY13 FY14E FY15E
BMW Mercedes JLR
Capex as % of R&D and capex
Source: Company data, Credit Suisse estimates Source: Company data, Credit Suisse estimates
Figure 3: JLR will only have four platforms (three core) by 2018, of which three will be aluminium based
Platform Location Models (2018E) Comment
D6 Halewood, China,
Brazil
Freelander, Evoque Steel unibody replaces Ford's platform starting with new
Freelander (2014)
PLA-D7u Solihull RR, RR Sport, Discovery, Defender,
Grand Evoque
Aluminium-intensive architecture for all other LR models; started
with new RR (2012)
PLA-D7a Castle Bromwich,
Solihull, China
XF, XJ, Baby Jag, Jag crossover Aluminium architecture for all Jaguar models starting with Mini
Jag (end 2014)
PLA Castle Bromwich F-type First aluminium platform at JLR; eventually will become marginal
Source: Company data, Credit Suisse estimates
Figure 4: Models/platform will double for JLR and
volumes/platform will triple
Figure 5: JLR lags peers in terms of models per platform;
it should catch up in coming years
0
1
2
3
4
0
50,000
100,000
150,000
200,000
2013 2018E
JLR Annual Volumes/Platform Models/Platform (RHS)
0.0
2.0
4.0
6.0
2013 2018E
JLR BMW Merc
Models/ platform
Source: Company data, Credit Suisse estimates Source: Company data, Credit Suisse estimates
Figure 6: Platform consolidation could lead to ~GBP1 bn
savings by FY18, offsetting negative mix
Figure 7: With slightly higher RR and RR Sport volumes,
EPS could increase significantly
FY15E FY16E FY17E FY18E
Volumes LR modular 143,952 143,952 201,511 231,711
Jaguar modular 15,000 118,412 157,174 190,580
Applicable Revenues 10,052 14,863 18,447 21,879
Cost Base (60%) 6,031 8,918 11,068 13,128
Savings (20%) 1,206 1,784 2,214 2,626
Development Costs 500 500 500 500
Benefit kept (50%) 353 642 857 1,063
Savings (GBP Mn) 353 642 857 1,063
FY15E
If 10,000 extra volumes of both RR, RR Sport Change
RR 50,384 60,384 10,000
RR Sport 93,568 103,568 10,000
JLR volumes 482,477 502,477 4%
JLR revenues 22,495 23,872 6%
JLR EBITDA 3,762 4,143 10%
Consol EPS 52.2 60 15%
Source: Company data, Credit Suisse estimates Source: Company data, Credit Suisse estimates
09 January 2014
Tata Motors Ltd.
(TAMO.BO / TTMT IN) 3
The story has more legs: Part 2 In our 10 Sep 2013 report, "The story has more legs," we highlighted how JLR's story is
much more beyond the success of new RR and RR Sport, and its annual sales could exceed
600,000 units by FY17E (~15% CAGR over FY13-17E). This impressive growth should be
driven by new launches in untapped segments (primarily Jaguar; Mini Jaguar: What to
expect) and new models on existing brands (primarily Land-Rover) as JLR has upped the
pace of refresh frequency (JLR catching up on refresh frequency will drive volume growth).
While the product plan was discussed in detail in this earlier report, here we explore how
JLR is readying to reach this scale along with its production and expansion plans.
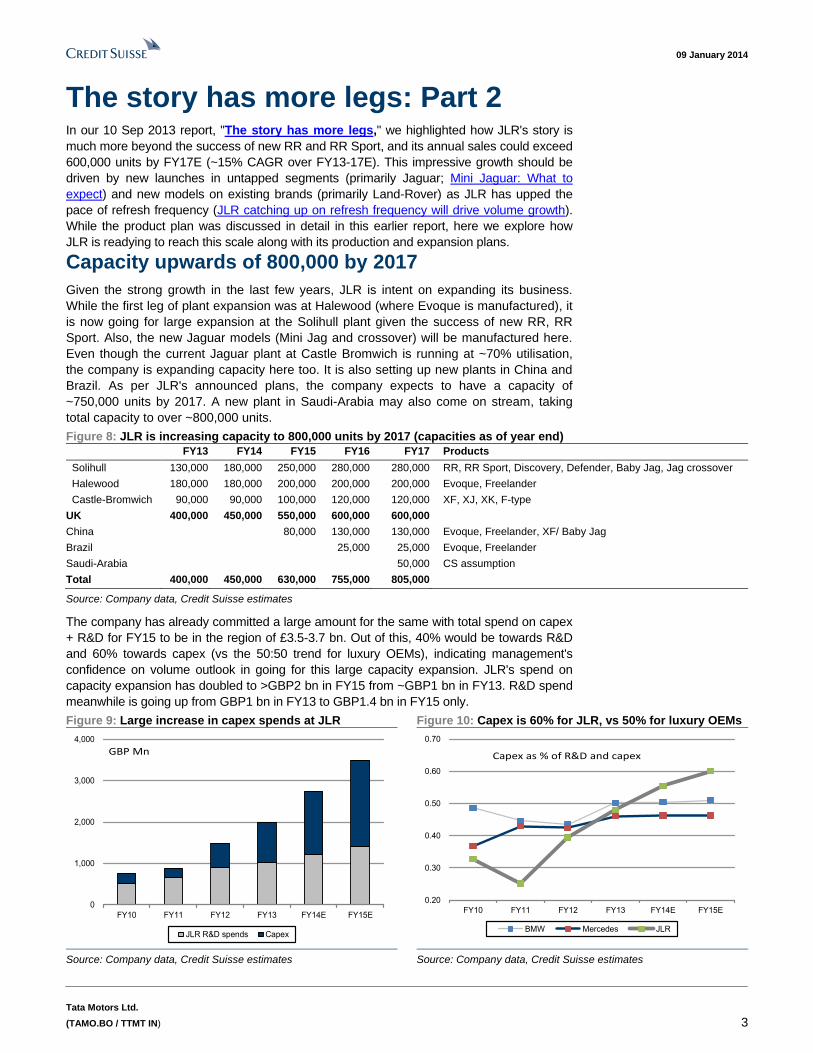
Capacity upwards of 800,000 by 2017
Given the strong growth in the last few years, JLR is intent on expanding its business.
While the first leg of plant expansion was at Halewood (where Evoque is manufactured), it
is now going for large expansion at the Solihull plant given the success of new RR, RR
Sport. Also, the new Jaguar models (Mini Jag and crossover) will be manufactured here.
Even though the current Jaguar plant at Castle Bromwich is running at ~70% utilisation,
the company is expanding capacity here too. It is also setting up new plants in China and
Brazil. As per JLR's announced plans, the company expects to have a capacity of
~750,000 units by 2017. A new plant in Saudi-Arabia may also come on stream, taking
total capacity to over ~800,000 units.
Figure 8: JLR is increasing capacity to 800,000 units by 2017 (capacities as of year end)
FY13 FY14 FY15 FY16 FY17 Products
Solihull 130,000 180,000 250,000 280,000 280,000 RR, RR Sport, Discovery, Defender, Baby Jag, Jag crossover
Halewood 180,000 180,000 200,000 200,000 200,000 Evoque, Freelander
Castle-Bromwich 90,000 90,000 100,000 120,000 120,000 XF, XJ, XK, F-type
UK 400,000 450,000 550,000 600,000 600,000
China 80,000 130,000 130,000 Evoque, Freelander, XF/ Baby Jag
Brazil 25,000 25,000 Evoque, Freelander
Saudi-Arabia 50,000 CS assumption
Total 400,000 450,000 630,000 755,000 805,000
Source: Company data, Credit Suisse estimates
The company has already committed a large amount for the same with total spend on capex
+ R&D for FY15 to be in the region of £3.5-3.7 bn. Out of this, 40% would be towards R&D
and 60% towards capex (vs the 50:50 trend for luxury OEMs), indicating management's
confidence on volume outlook in going for this large capacity expansion. JLR's spend on
capacity expansion has doubled to >GBP2 bn in FY15 from ~GBP1 bn in FY13. R&D spend
meanwhile is going up from GBP1 bn in FY13 to GBP1.4 bn in FY15 only.
Figure 9: Large increase in capex spends at JLR Figure 10: Capex is 60% for JLR, vs 50% for luxury OEMs
0
1,000
2,000
3,000
4,000
FY10 FY11 FY12 FY13 FY14E FY15E
JLR R&D spends Capex
GBP Mn
0.20
0.30
0.40
0.50
0.60
0.70
FY10 FY11 FY12 FY13 FY14E FY15E
BMW Mercedes JLR
Capex as % of R&D and capex
Source: Company data, Credit Suisse estimates Source: Company data, Credit Suisse estimates
09 January 2014
Tata Motors Ltd.
(TAMO.BO / TTMT IN) 4
In the midst of a massive platform consolidation drive
With smaller models like Mini Jaguar contributing to a significant part of incremental
volume growth in the future, JLR ASPs could come under pressure. This would imply that
revenue growth should be lower than volume growth for JLR. Moreover, given that higher
ASPs theoretically imply higher margins, margins too may come under pressure. However,
JLR is in the midst of a massive platform consolidation strategy which should generate
significant cost savings more than offsetting the same.
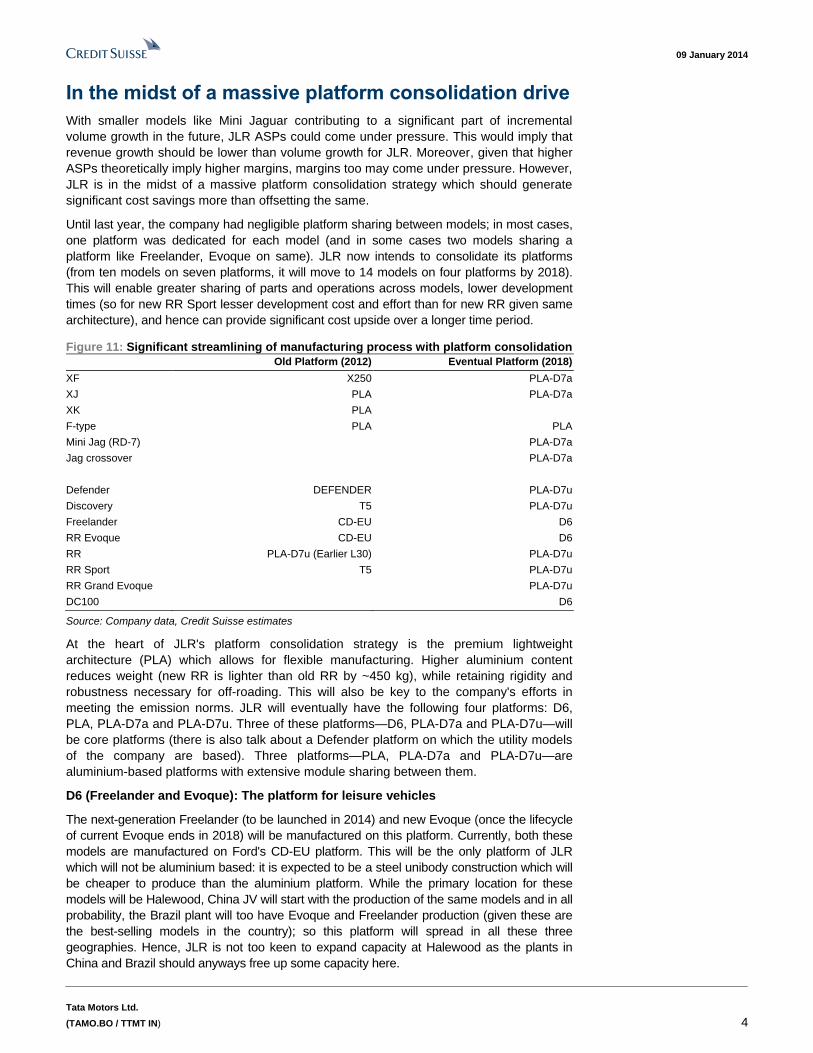
Until last year, the company had negligible platform sharing between models; in most cases,
one platform was dedicated for each model (and in some cases two models sharing a
platform like Freelander, Evoque on same). JLR now intends to consolidate its platforms
(from ten models on seven platforms, it will move to 14 models on four platforms by 2018).
This will enable greater sharing of parts and operations across models, lower development
times (so for new RR Sport lesser development cost and effort than for new RR given same
architecture), and hence can provide significant cost upside over a longer time period.
Figure 11: Significant streamlining of manufacturing process with platform consolidation
Old Platform (2012) Eventual Platform (2018)
XF X250 PLA-D7a
XJ PLA PLA-D7a
XK PLA
F-type PLA PLA
Mini Jag (RD-7) PLA-D7a
Jag crossover PLA-D7a
Defender DEFENDER PLA-D7u
Discovery T5 PLA-D7u
Freelander CD-EU D6
RR Evoque CD-EU D6
RR PLA-D7u (Earlier L30) PLA-D7u
RR Sport T5 PLA-D7u
RR Grand Evoque PLA-D7u
DC100 D6
Source: Company data, Credit Suisse estimates
At the heart of JLR's platform consolidation strategy is the premium lightweight
architecture (PLA) which allows for flexible manufacturing. Higher aluminium content
reduces weight (new RR is lighter than old RR by ~450 kg), while retaining rigidity and
robustness necessary for off-roading. This will also be key to the company's efforts in
meeting the emission norms. JLR will eventually have the following four platforms: D6,
PLA, PLA-D7a and PLA-D7u. Three of these platforms—D6, PLA-D7a and PLA-D7u—will
be core platforms (there is also talk about a Defender platform on which the utility models
of the company are based). Three platforms—PLA, PLA-D7a and PLA-D7u—are
aluminium-based platforms with extensive module sharing between them.
D6 (Freelander and Evoque): The platform for leisure vehicles
The next-generation Freelander (to be launched in 2014) and new Evoque (once the lifecycle
of current Evoque ends in 2018) will be manufactured on this platform. Currently, both these
models are manufactured on Ford's CD-EU platform. This will be the only platform of JLR
which will not be aluminium based: it is expected to be a steel unibody construction which will
be cheaper to produce than the aluminium platform. While the primary location for these
models will be Halewood, China JV will start with the production of the same models and in all
probability, the Brazil plant will too have Evoque and Freelander production (given these are
the best-selling models in the country); so this platform will spread in all these three
geographies. Hence, JLR is not too keen to expand capacity at Halewood as the plants in
China and Brazil should anyways free up some capacity here.
09 January 2014
Tata Motors Ltd.
(TAMO.BO / TTMT IN) 5
PLA (F-type): The sports car platform
This was the first aluminium architecture used in any vehicle of JLR, when the all-
aluminium XJ was launched in 2003. Since then it has been adopted in XK and F-type.
Eventually XJ will be moved to the PLA-D7a platform (once the new XJ is launched in
2017) while XK would be phased out. Hence, this will become a marginal platform with F-
type and its variants being the only products produced on it at Castle-Bromwich plant.
PLA-D7u: The platform for luxury vehicles
Both the PLA-D7u and the PLA-D7a were derived from the PLA. The new RR launched in
2012 was the first vehicle on this platform, followed by the new RR Sport in 2013 and it will
cover all LR models other than Freelander and Evoque. This aluminium-intensive
architecture supports better weight efficiency and has higher fuel economy in order to
meet emission norms. The other vehicles expected to come up on this platform are
Discovery (2016), Grand Evoque (2017) and, possibly, the Defender (2018) (although we
are slightly sceptical about this as a Defender vehicle on such an expensive platform will
probably not make sense). All these models will only be produced at Solihull, which is one
of the reasons for the large capacity increase at this location.
PLA-D7a/ iQ Al (all Jaguar vehicles): The platform for sedans
This platform will eventually cover all the Jaguar vehicles other than F-type. Mini Jaguar
(to be launched by the end of 2014) will be the first vehicle to adopt this platform. This will
be followed by Jaguar crossover (2015), new XF (2016) and new XJ (2017). While the old
Jaguar models (XF and XJ) will continue to be produced at Castle Bromwich, the new
models—Mini Jaguar and Jaguar crossover—will be manufactured at Solihull; hence, this
platform will be present at both the locations. In addition to this, either Mini Jaguar or XF
will be produced at the China JV.
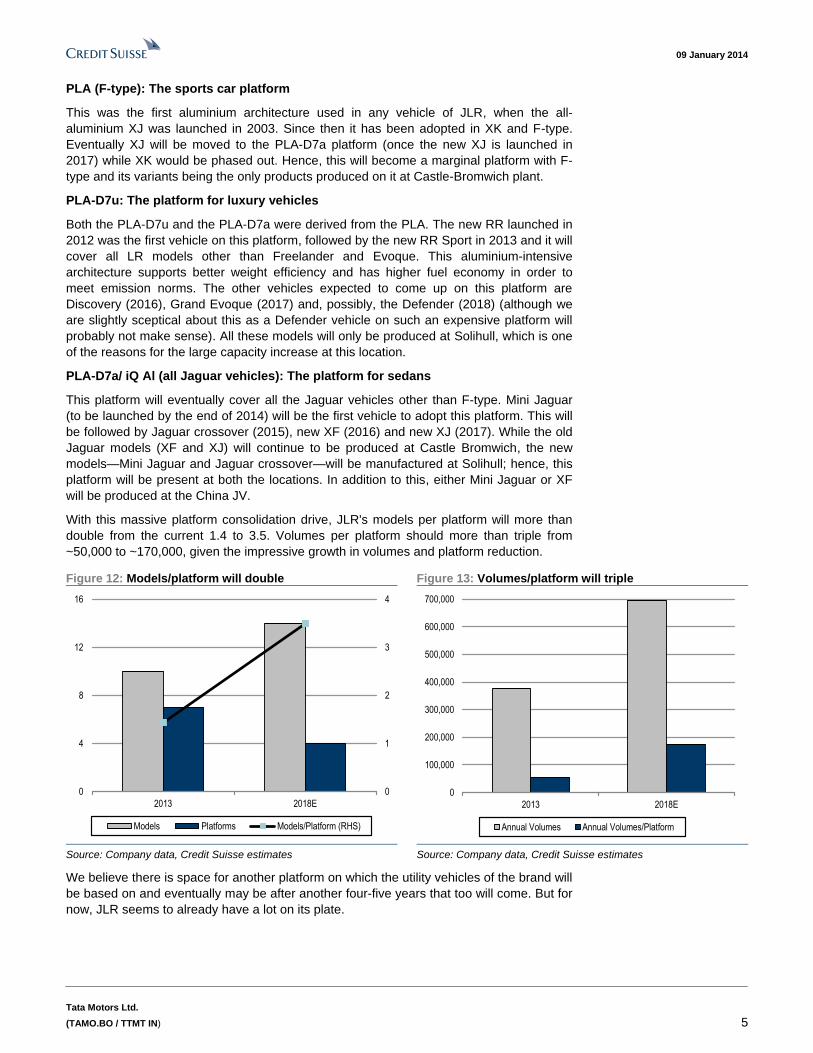
With this massive platform consolidation drive, JLR's models per platform will more than
double from the current 1.4 to 3.5. Volumes per platform should more than triple from
~50,000 to ~170,000, given the impressive growth in volumes and platform reduction.
Figure 12: Models/platform will double Figure 13: Volumes/platform will triple
0
1
2
3
4
0
4
8
12
16
2013 2018E
Models Platforms Models/Platform (RHS)
0
100,000
200,000
300,000
400,000
500,000
600,000
700,000
2013 2018E
Annual Volumes Annual Volumes/Platform
Source: Company data, Credit Suisse estimates Source: Company data, Credit Suisse estimates
We believe there is space for another platform on which the utility vehicles of the brand will
be based on and eventually may be after another four-five years that too will come. But for
now, JLR seems to already have a lot on its plate.
09 January 2014
Tata Motors Ltd.
(TAMO.BO / TTMT IN) 6
Catching up on German peers
We also look at the platform strategy of JLR's German peers—Audi, BMW and
Mercedes—and how it is evolving. In our note, "JLR catching up on refresh frequency will
drive volume growth," we highlighted how refresh frequency for JLR in the past had been
much greater than that of peers and how the company is stepping up to correct it. Similarly,
even in manufacturing practice, JLR seems to have been the most inefficient until now
with the least number of models/platform compared with peers, which the company would
gradually correct.
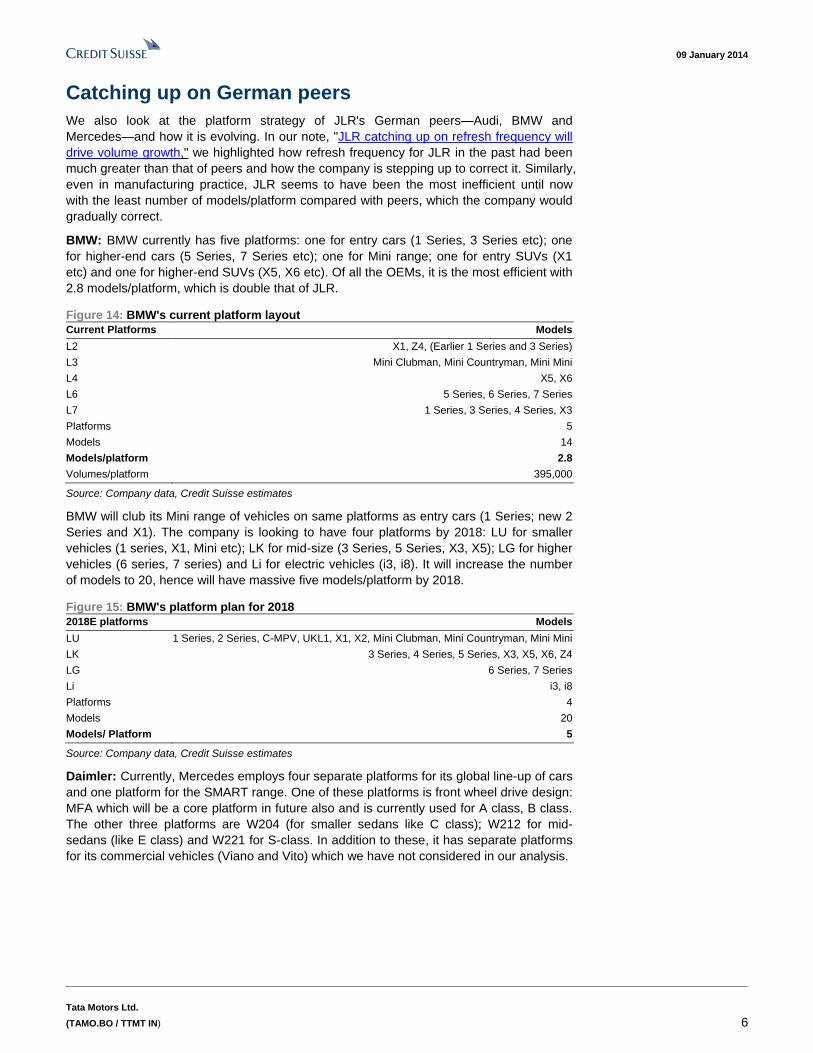
BMW: BMW currently has five platforms: one for entry cars (1 Series, 3 Series etc); one
for higher-end cars (5 Series, 7 Series etc); one for Mini range; one for entry SUVs (X1
etc) and one for higher-end SUVs (X5, X6 etc). Of all the OEMs, it is the most efficient with
2.8 models/platform, which is double that of JLR.
Figure 14: BMW's current platform layout
Current Platforms Models
L2 X1, Z4, (Earlier 1 Series and 3 Series)
L3 Mini Clubman, Mini Countryman, Mini Mini
L4 X5, X6
L6 5 Series, 6 Series, 7 Series
L7 1 Series, 3 Series, 4 Series, X3
Platforms 5
Models 14
Models/platform 2.8
Volumes/platform 395,000
Source: Company data, Credit Suisse estimates
BMW will club its Mini range of vehicles on same platforms as entry cars (1 Series; new 2
Series and X1). The company is looking to have four platforms by 2018: LU for smaller
vehicles (1 series, X1, Mini etc); LK for mid-size (3 Series, 5 Series, X3, X5); LG for higher
vehicles (6 series, 7 series) and Li for electric vehicles (i3, i8). It will increase the number
of models to 20, hence will have massive five models/platform by 2018.
Figure 15: BMW's platform plan for 2018
2018E platforms Models
LU 1 Series, 2 Series, C-MPV, UKL1, X1, X2, Mini Clubman, Mini Countryman, Mini Mini
LK 3 Series, 4 Series, 5 Series, X3, X5, X6, Z4
LG 6 Series, 7 Series
Li i3, i8
Platforms 4
Models 20
Models/ Platform 5
Source: Company data, Credit Suisse estimates
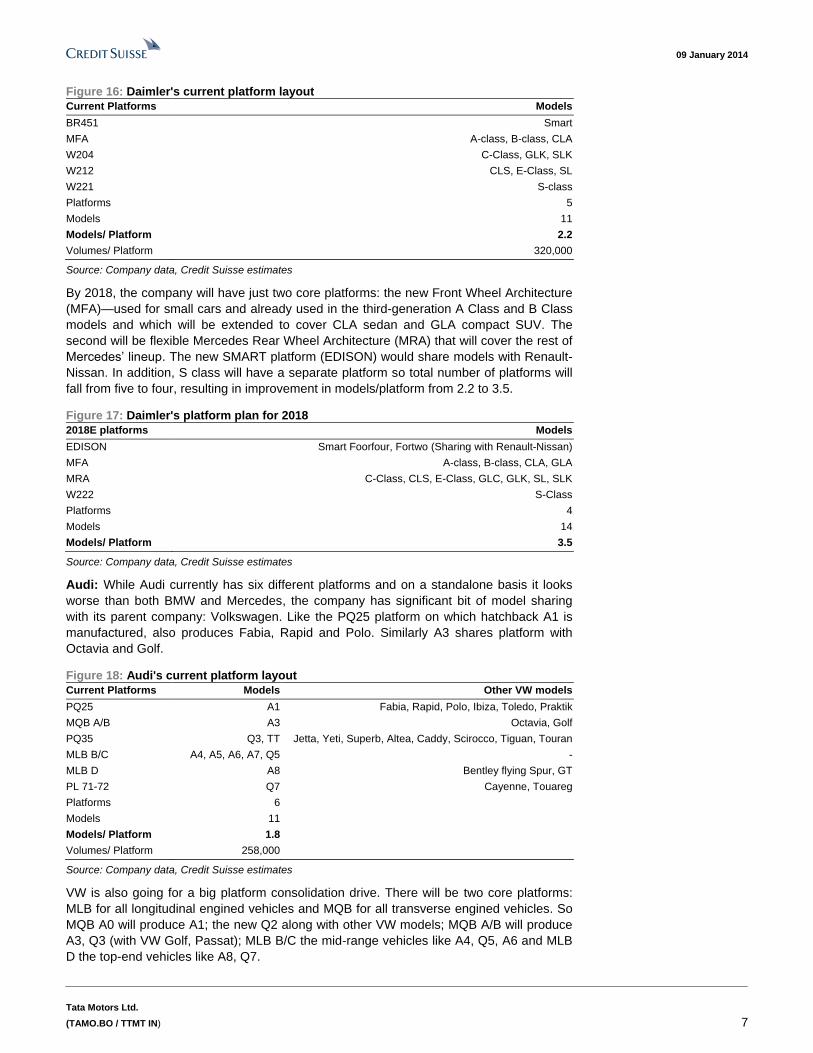
Daimler: Currently, Mercedes employs four separate platforms for its global line-up of cars
and one platform for the SMART range. One of these platforms is front wheel drive design:
MFA which will be a core platform in future also and is currently used for A class, B class.
The other three platforms are W204 (for smaller sedans like C class); W212 for mid-
sedans (like E class) and W221 for S-class. In addition to these, it has separate platforms
for its commercial vehicles (Viano and Vito) which we have not considered in our analysis.
09 January 2014
Tata Motors Ltd.
(TAMO.BO / TTMT IN) 7
Figure 16: Daimler's current platform layout
Current Platforms Models
BR451 Smart
MFA A-class, B-class, CLA
W204 C-Class, GLK, SLK
W212 CLS, E-Class, SL
W221 S-class
Platforms 5
Models 11
Models/ Platform 2.2
Volumes/ Platform 320,000
Source: Company data, Credit Suisse estimates
By 2018, the company will have just two core platforms: the new Front Wheel Architecture
(MFA)—used for small cars and already used in the third-generation A Class and B Class
models and which will be extended to cover CLA sedan and GLA compact SUV. The
second will be flexible Mercedes Rear Wheel Architecture (MRA) that will cover the rest of
Mercedes’ lineup. The new SMART platform (EDISON) would share models with Renault-
Nissan. In addition, S class will have a separate platform so total number of platforms will
fall from five to four, resulting in improvement in models/platform from 2.2 to 3.5.
Figure 17: Daimler's platform plan for 2018
2018E platforms Models
EDISON Smart Foorfour, Fortwo (Sharing with Renault-Nissan)
MFA A-class, B-class, CLA, GLA
MRA C-Class, CLS, E-Class, GLC, GLK, SL, SLK
W222 S-Class
Platforms 4
Models 14
Models/ Platform 3.5
Source: Company data, Credit Suisse estimates
Audi: While Audi currently has six different platforms and on a standalone basis it looks
worse than both BMW and Mercedes, the company has significant bit of model sharing
with its parent company: Volkswagen. Like the PQ25 platform on which hatchback A1 is
manufactured, also produces Fabia, Rapid and Polo. Similarly A3 shares platform with
Octavia and Golf.
Figure 18: Audi's current platform layout
Current Platforms Models Other VW models
PQ25 A1 Fabia, Rapid, Polo, Ibiza, Toledo, Praktik
MQB A/B A3 Octavia, Golf
PQ35 Q3, TT Jetta, Yeti, Superb, Altea, Caddy, Scirocco, Tiguan, Touran
MLB B/C A4, A5, A6, A7, Q5 -
MLB D A8 Bentley flying Spur, GT
PL 71-72 Q7 Cayenne, Touareg
Platforms 6
Models 11
Models/ Platform 1.8
Volumes/ Platform 258,000
Source: Company data, Credit Suisse estimates
VW is also going for a big platform consolidation drive. There will be two core platforms:
MLB for all longitudinal engined vehicles and MQB for all transverse engined vehicles. So
MQB A0 will produce A1; the new Q2 along with other VW models; MQB A/B will produce
A3, Q3 (with VW Golf, Passat); MLB B/C the mid-range vehicles like A4, Q5, A6 and MLB
D the top-end vehicles like A8, Q7.
09 January 2014
Tata Motors Ltd.
(TAMO.BO / TTMT IN) 8
Figure 19: Audi's platform plan for 2018
2018 platforms Models Other VW models
MQB A0 A1, Q2 Fabia, Rapid, Polo, Ibiza, Toledo, B-CUV
MQB A/B A3, C-MPV, Q3, Q4, TT Octavia, Golf, Jetta, Passat, Alhambra, Altea, C-CUV,
Leon, C-SUV, Praktik, Roomster, Superb, Yeti, Caddy
Van, CC, Scirocco, Sharan, Tiguan, Touran
MLB B/C A4, A5, A6, A7, Q5 Porsche Macan
MLB D A8, Q7 Phaeton, Touareg, Cayenne, Bentley E-CUV, Flying Spur,
GT, Lamborghini E-CUV
Platforms 4
Models 14
Models/ Platform 3.5
Source: Company data, Credit Suisse estimates
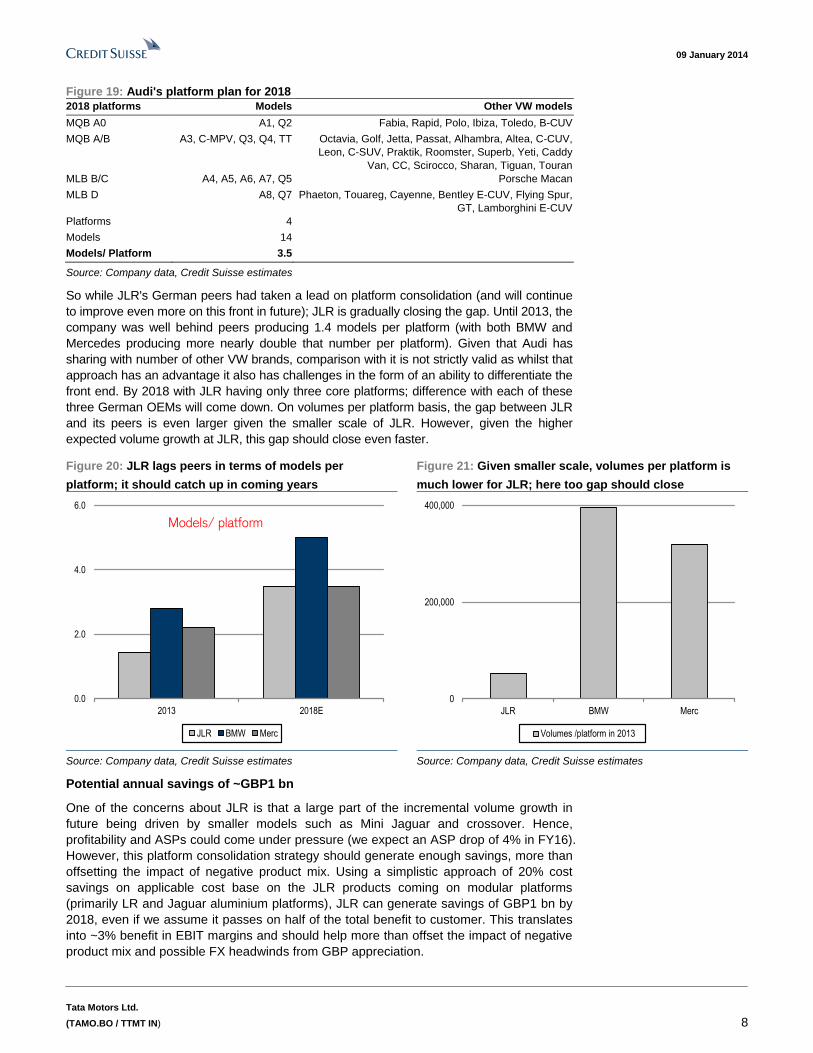
So while JLR's German peers had taken a lead on platform consolidation (and will continue
to improve even more on this front in future); JLR is gradually closing the gap. Until 2013, the
company was well behind peers producing 1.4 models per platform (with both BMW and
Mercedes producing more nearly double that number per platform). Given that Audi has
sharing with number of other VW brands, comparison with it is not strictly valid as whilst that
approach has an advantage it also has challenges in the form of an ability to differentiate the
front end. By 2018 with JLR having only three core platforms; difference with each of these
three German OEMs will come down. On volumes per platform basis, the gap between JLR
and its peers is even larger given the smaller scale of JLR. However, given the higher
expected volume growth at JLR, this gap should close even faster.
Figure 20: JLR lags peers in terms of models per
platform; it should catch up in coming years
Figure 21: Given smaller scale, volumes per platform is
much lower for JLR; here too gap should close
0.0
2.0
4.0
6.0
2013 2018E
JLR BMW Merc
Models/ platform
0
200,000
400,000
JLR BMW Merc
Volumes /platform in 2013
Source: Company data, Credit Suisse estimates Source: Company data, Credit Suisse estimates
Potential annual savings of ~GBP1 bn
One of the concerns about JLR is that a large part of the incremental volume growth in
future being driven by smaller models such as Mini Jaguar and crossover. Hence,
profitability and ASPs could come under pressure (we expect an ASP drop of 4% in FY16).
However, this platform consolidation strategy should generate enough savings, more than
offsetting the impact of negative product mix. Using a simplistic approach of 20% cost
savings on applicable cost base on the JLR products coming on modular platforms
(primarily LR and Jaguar aluminium platforms), JLR can generate savings of GBP1 bn by
2018, even if we assume it passes on half of the total benefit to customer. This translates
into ~3% benefit in EBIT margins and should help more than offset the impact of negative
product mix and possible FX headwinds from GBP appreciation.
09 January 2014
Tata Motors Ltd.
(TAMO.BO / TTMT IN) 9
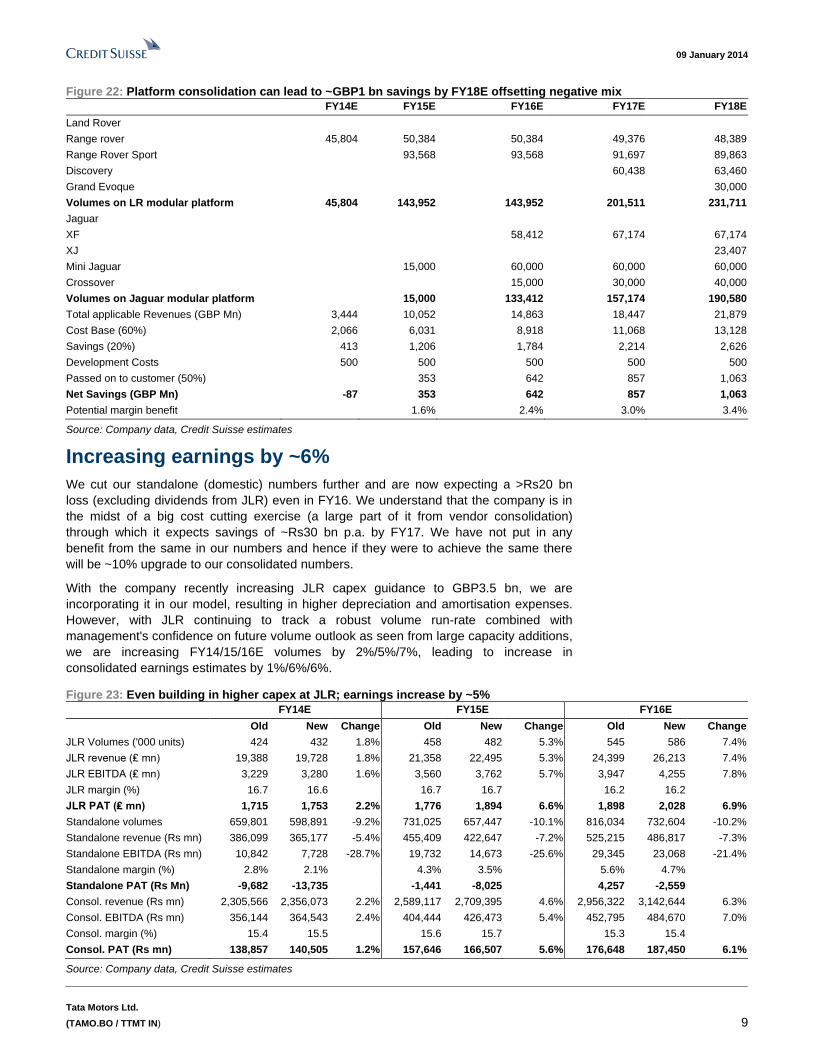
Figure 22: Platform consolidation can lead to ~GBP1 bn savings by FY18E offsetting negative mix
FY14E FY15E FY16E FY17E FY18E
Land Rover
Range rover 45,804 50,384 50,384 49,376 48,389
Range Rover Sport 93,568 93,568 91,697 89,863
Discovery 60,438 63,460
Grand Evoque 30,000
Volumes on LR modular platform 45,804 143,952 143,952 201,511 231,711
Jaguar
XF 58,412 67,174 67,174
XJ 23,407
Mini Jaguar 15,000 60,000 60,000 60,000
Crossover 15,000 30,000 40,000
Volumes on Jaguar modular platform 15,000 133,412 157,174 190,580
Total applicable Revenues (GBP Mn) 3,444 10,052 14,863 18,447 21,879
Cost Base (60%) 2,066 6,031 8,918 11,068 13,128
Savings (20%) 413 1,206 1,784 2,214 2,626
Development Costs 500 500 500 500 500
Passed on to customer (50%) 353 642 857 1,063
Net Savings (GBP Mn) -87 353 642 857 1,063
Potential margin benefit 1.6% 2.4% 3.0% 3.4%
Source: Company data, Credit Suisse estimates
Increasing earnings by ~6%
We cut our standalone (domestic) numbers further and are now expecting a >Rs20 bn
loss (excluding dividends from JLR) even in FY16. We understand that the company is in
the midst of a big cost cutting exercise (a large part of it from vendor consolidation)
through which it expects savings of ~Rs30 bn p.a. by FY17. We have not put in any
benefit from the same in our numbers and hence if they were to achieve the same there
will be ~10% upgrade to our consolidated numbers.
With the company recently increasing JLR capex guidance to GBP3.5 bn, we are
incorporating it in our model, resulting in higher depreciation and amortisation expenses.
However, with JLR continuing to track a robust volume run-rate combined with
management's confidence on future volume outlook as seen from large capacity additions,
we are increasing FY14/15/16E volumes by 2%/5%/7%, leading to increase in
consolidated earnings estimates by 1%/6%/6%.
Figure 23: Even building in higher capex at JLR; earnings increase by ~5%
FY14E FY15E FY16E
Old New Change Old New Change Old New Change
JLR Volumes ('000 units) 424 432 1.8% 458 482 5.3% 545 586 7.4%
JLR revenue (₤ mn) 19,388 19,728 1.8% 21,358 22,495 5.3% 24,399 26,213 7.4%
JLR EBITDA (₤ mn) 3,229 3,280 1.6% 3,560 3,762 5.7% 3,947 4,255 7.8%
JLR margin (%) 16.7 16.6 16.7 16.7 16.2 16.2
JLR PAT (₤ mn) 1,715 1,753 2.2% 1,776 1,894 6.6% 1,898 2,028 6.9%
Standalone volumes 659,801 598,891 -9.2% 731,025 657,447 -10.1% 816,034 732,604 -10.2%
Standalone revenue (Rs mn) 386,099 365,177 -5.4% 455,409 422,647 -7.2% 525,215 486,817 -7.3%
Standalone EBITDA (Rs mn) 10,842 7,728 -28.7% 19,732 14,673 -25.6% 29,345 23,068 -21.4%
Standalone margin (%) 2.8% 2.1% 4.3% 3.5% 5.6% 4.7%
Standalone PAT (Rs Mn) -9,682 -13,735 -1,441 -8,025 4,257 -2,559
Consol. revenue (Rs mn) 2,305,566 2,356,073 2.2% 2,589,117 2,709,395 4.6% 2,956,322 3,142,644 6.3%
Consol. EBITDA (Rs mn) 356,144 364,543 2.4% 404,444 426,473 5.4% 452,795 484,670 7.0%
Consol. margin (%) 15.4 15.5 15.6 15.7 15.3 15.4
Consol. PAT (Rs mn) 138,857 140,505 1.2% 157,646 166,507 5.6% 176,648 187,450 6.1%
Source: Company data, Credit Suisse estimates
09 January 2014
Tata Motors Ltd.
(TAMO.BO / TTMT IN) 10
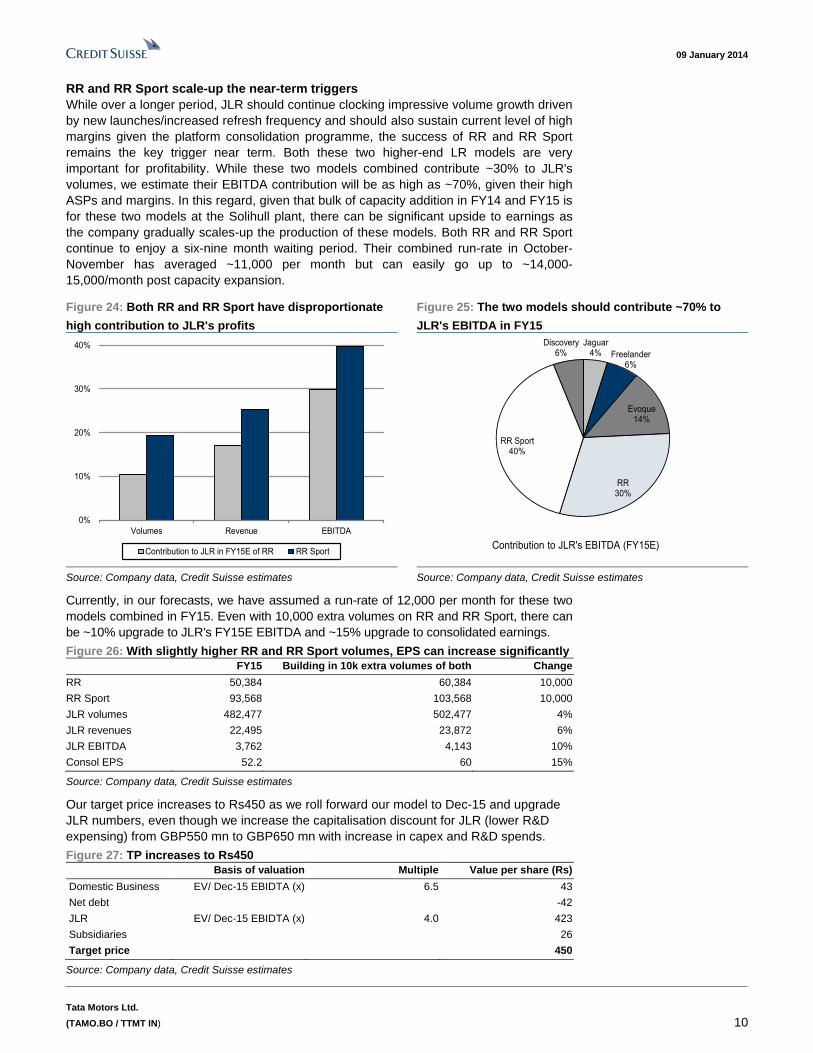
RR and RR Sport scale-up the near-term triggers
While over a longer period, JLR should continue clocking impressive volume growth driven
by new launches/increased refresh frequency and should also sustain current level of high
margins given the platform consolidation programme, the success of RR and RR Sport
remains the key trigger near term. Both these two higher-end LR models are very
important for profitability. While these two models combined contribute ~30% to JLR's
volumes, we estimate their EBITDA contribution will be as high as ~70%, given their high
ASPs and margins. In this regard, given that bulk of capacity addition in FY14 and FY15 is
for these two models at the Solihull plant, there can be significant upside to earnings as
the company gradually scales-up the production of these models. Both RR and RR Sport
continue to enjoy a six-nine month waiting period. Their combined run-rate in October-
November has averaged ~11,000 per month but can easily go up to ~14,000-
15,000/month post capacity expansion.
Figure 24: Both RR and RR Sport have disproportionate
high contribution to JLR's profits
Figure 25: The two models should contribute ~70% to
JLR's EBITDA in FY15
0%
10%
20%
30%
40%
Volumes Revenue EBITDA
Contribution to JLR in FY15E of RR RR Sport
Jaguar4% Freelander
6%
Evoque14%
RR30%
RR Sport40%
Discovery6%
Contribution to JLR's EBITDA (FY15E)
Source: Company data, Credit Suisse estimates Source: Company data, Credit Suisse estimates
Currently, in our forecasts, we have assumed a run-rate of 12,000 per month for these two
models combined in FY15. Even with 10,000 extra volumes on RR and RR Sport, there can
be ~10% upgrade to JLR's FY15E EBITDA and ~15% upgrade to consolidated earnings.
Figure 26: With slightly higher RR and RR Sport volumes, EPS can increase significantly
FY15 Building in 10k extra volumes of both Change
RR 50,384 60,384 10,000
RR Sport 93,568 103,568 10,000
JLR volumes 482,477 502,477 4%
JLR revenues 22,495 23,872 6%
JLR EBITDA 3,762 4,143 10%
Consol EPS 52.2 60 15%
Source: Company data, Credit Suisse estimates
Our target price increases to Rs450 as we roll forward our model to Dec-15 and upgrade
JLR numbers, even though we increase the capitalisation discount for JLR (lower R&D
expensing) from GBP550 mn to GBP650 mn with increase in capex and R&D spends.
Figure 27: TP increases to Rs450
Basis of valuation Multiple Value per share (Rs)
Domestic Business EV/ Dec-15 EBIDTA (x) 6.5 43
Net debt -42
JLR EV/ Dec-15 EBIDTA (x) 4.0 423
Subsidiaries 26
Target price 450
Source: Company data, Credit Suisse estimates
09 January 2014
Tata Motors Ltd.
(TAMO.BO / TTMT IN) 11
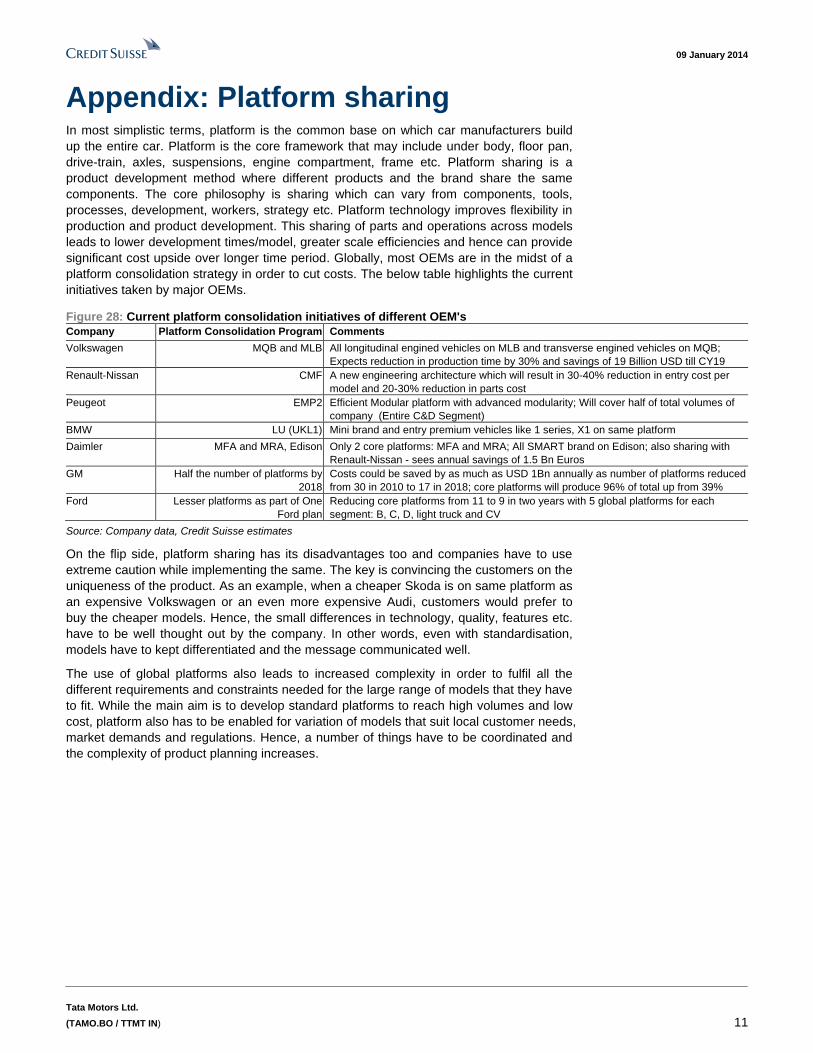
Appendix: Platform sharing In most simplistic terms, platform is the common base on which car manufacturers build
up the entire car. Platform is the core framework that may include under body, floor pan,
drive-train, axles, suspensions, engine compartment, frame etc. Platform sharing is a
product development method where different products and the brand share the same
components. The core philosophy is sharing which can vary from components, tools,
processes, development, workers, strategy etc. Platform technology improves flexibility in
production and product development. This sharing of parts and operations across models
leads to lower development times/model, greater scale efficiencies and hence can provide
significant cost upside over longer time period. Globally, most OEMs are in the midst of a
platform consolidation strategy in order to cut costs. The below table highlights the current
initiatives taken by major OEMs.
Figure 28: Current platform consolidation initiatives of different OEM's
Company Platform Consolidation Program Comments
Volkswagen MQB and MLB All longitudinal engined vehicles on MLB and transverse engined vehicles on MQB;
Expects reduction in production time by 30% and savings of 19 Billion USD till CY19
Renault-Nissan CMF A new engineering architecture which will result in 30-40% reduction in entry cost per
model and 20-30% reduction in parts cost
Peugeot EMP2 Efficient Modular platform with advanced modularity; Will cover half of total volumes of
company (Entire C&D Segment)
BMW LU (UKL1) Mini brand and entry premium vehicles like 1 series, X1 on same platform
Daimler MFA and MRA, Edison Only 2 core platforms: MFA and MRA; All SMART brand on Edison; also sharing with
Renault-Nissan - sees annual savings of 1.5 Bn Euros
GM Half the number of platforms by
2018
Costs could be saved by as much as USD 1Bn annually as number of platforms reduced
from 30 in 2010 to 17 in 2018; core platforms will produce 96% of total up from 39%
Ford Lesser platforms as part of One
Ford plan
Reducing core platforms from 11 to 9 in two years with 5 global platforms for each
segment: B, C, D, light truck and CV
Source: Company data, Credit Suisse estimates
On the flip side, platform sharing has its disadvantages too and companies have to use
extreme caution while implementing the same. The key is convincing the customers on the
uniqueness of the product. As an example, when a cheaper Skoda is on same platform as
an expensive Volkswagen or an even more expensive Audi, customers would prefer to
buy the cheaper models. Hence, the small differences in technology, quality, features etc.
have to be well thought out by the company. In other words, even with standardisation,
models have to kept differentiated and the message communicated well.
The use of global platforms also leads to increased complexity in order to fulfil all the
different requirements and constraints needed for the large range of models that they have
to fit. While the main aim is to develop standard platforms to reach high volumes and low
cost, platform also has to be enabled for variation of models that suit local customer needs,
market demands and regulations. Hence, a number of things have to be coordinated and
the complexity of product planning increases.
09 January 2014
Tata Motors Ltd.
(TAMO.BO / TTMT IN) 12
Companies Mentioned (Price as of 08-Jan-2014)
BMW (BMWG.F, €84.465) Daimler (DAIGn.DE, €62.21) Tata Motors Ltd. (TAMO.BO, Rs370.25, OUTPERFORM, TP Rs450.0) Volkswagen (VOWG_p.F, €200.05)
Disclosure Appendix
Important Global Disclosures
Jatin Chawla and Akshay Saxena, each certify, with respect to the companies or securities that the individual analyzes, that (1) the views expressed in this report accurately reflect his or her personal views about all of the subject companies and securities and (2) no part of his or her compensation was, is or will be directly or indirectly related to the specific recommendations or views expressed in this report.
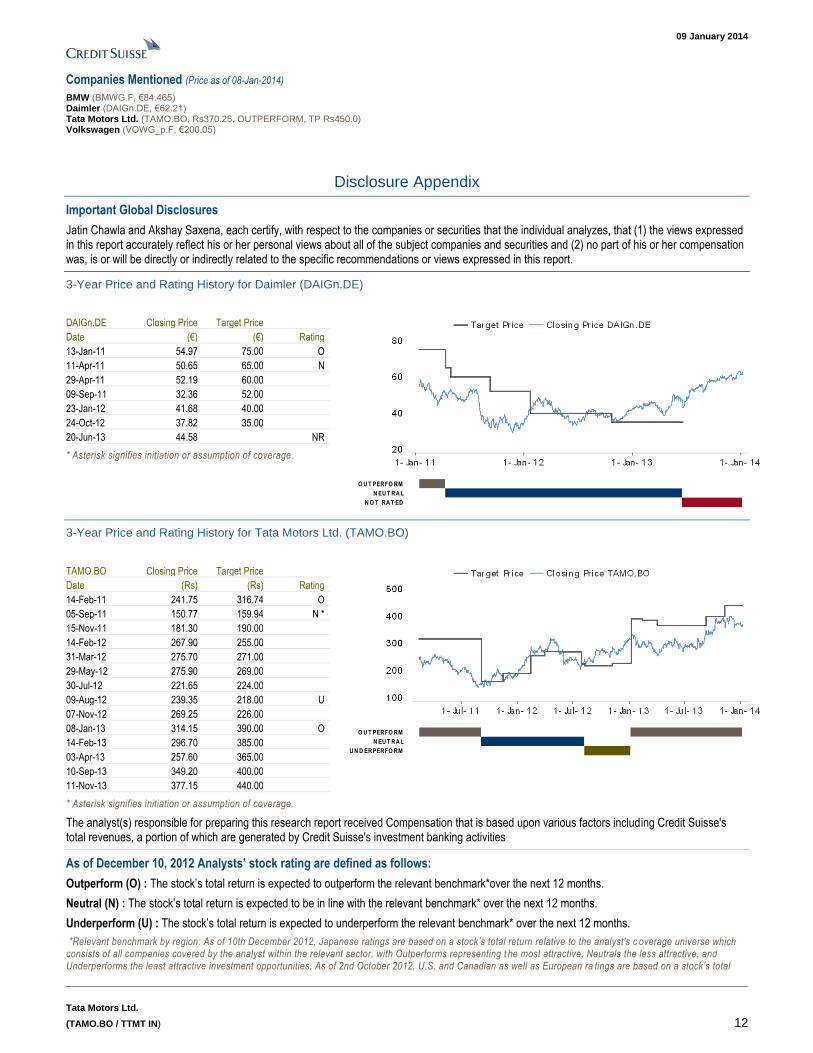
3-Year Price and Rating History for Daimler (DAIGn.DE)
DAIGn.DE Closing Price Target Price
Date (€) (€) Rating
13-Jan-11 54.97 75.00 O
11-Apr-11 50.65 65.00 N
29-Apr-11 52.19 60.00
09-Sep-11 32.36 52.00
23-Jan-12 41.68 40.00
24-Oct-12 37.82 35.00
20-Jun-13 44.58 NR
* Asterisk signifies initiation or assumption of coverage.
O U T PERFO RM
N EU T RA L
N O T RA T ED
3-Year Price and Rating History for Tata Motors Ltd. (TAMO.BO)
TAMO.BO Closing Price Target Price
Date (Rs) (Rs) Rating
14-Feb-11 241.75 316.74 O
05-Sep-11 150.77 159.94 N *
15-Nov-11 181.30 190.00
14-Feb-12 267.90 255.00
31-Mar-12 275.70 271.00
29-May-12 275.90 269.00
30-Jul-12 221.65 224.00
09-Aug-12 239.35 218.00 U
07-Nov-12 269.25 226.00
08-Jan-13 314.15 390.00 O
14-Feb-13 296.70 385.00
03-Apr-13 257.60 365.00
10-Sep-13 349.20 400.00
11-Nov-13 377.15 440.00
* Asterisk signifies initiation or assumption of coverage.
O U T PERFO RM
N EU T RA L
U N D ERPERFO RM
The analyst(s) responsible for preparing this research report received Compensation that is based upon various factors including Credit Suisse's total revenues, a portion of which are generated by Credit Suisse's investment banking activities
As of December 10, 2012 Analysts’ stock rating are defined as follows:
Outperform (O) : The stock’s total return is expected to outperform the relevant benchmark*over the next 12 months.
Neutral (N) : The stock’s total return is expected to be in line with the relevant benchmark* over the next 12 months.
Underperform (U) : The stock’s total return is expected to underperform the relevant benchmark* over the next 12 months.
*Relevant benchmark by region: As of 10th December 2012, Japanese ratings are based on a stock’s total return relative to the analyst's c overage universe which consists of all companies covered by the analyst within the relevant sector, with Outperforms representing t he most attractive, Neutrals the less attractive, and Underperforms the least attractive investment opportunities. As of 2nd October 2012, U.S. and Canadian as well as European ra tings are based on a stock’s total
09 January 2014
Tata Motors Ltd.
(TAMO.BO / TTMT IN) 13
return relative to the analyst's coverage universe which consists of all companies covered by the analyst within the relevant sector, with Outperforms representing the most attractive, Neutrals the less attractive, and Underperforms the least attractive investment opportunities. For Latin Ame rican and non-Japan Asia stocks, ratings are based on a stock’s total return relative to the average total return of the relevant country or regional benchmark; Austr alia, New Zealand are, and prior to 2nd October 2012 U.S. and Canadian ratings were based on (1) a stock’s absolute total return potential to its current share price and (2) the relative attractiveness of a stock’s total return potential within an analyst’s coverage universe. For Australian and New Zealand stocks, 12 -month rolling yield is incorporated in the absolute total return calculation and a 15% and a 7.5% threshold replace the 10-15% level in the Outperform and Underperform stock rating definitions, respectively. The 15% and 7.5% thresholds replace the +10-15% and -10-15% levels in the Neutral stock rating definition, respectively. Prior to 10th December 2012, Japanese ratings were based on a stock’s total return relative to the average total return of the relevant country or regional benchmark.
Restricted (R) : In certain circumstances, Credit Suisse policy and/or applicable law and regulations preclude certain types of communications, including an investment recommendation, during the course of Credit Suisse's engagement in an investment banking transaction and in certain other circumstances.
Volatility Indicator [V] : A stock is defined as volatile if the stock price has moved up or down by 20% or more in a month in at least 8 of the past 24 months or the analyst expects significant volatility going forward.
Analysts’ sector weightings are distinct from analysts’ stock ratings and are based on the analyst’s expectations for the fundamentals and/or valuation of the sector* relative to the group’s historic fundamentals and/or valuation:
Overweight : The analyst’s expectation for the sector’s fundamentals and/or valuation is favorable over the next 12 months.
Market Weight : The analyst’s expectation for the sector’s fundamentals and/or valuation is neutral over the next 12 months.
Underweight : The analyst’s expectation for the sector’s fundamentals and/or valuation is cautious over the next 12 months.
*An analyst’s coverage sector consists of all companies covered by the analyst within the relevant sector. An analyst may cov er multiple sectors.
Credit Suisse's distribution of stock ratings (and banking clients) is:
Global Ratings Distribution
Rating Versus universe (%) Of which banking clients (%)
Outperform/Buy* 43% (53% banking clients)
Neutral/Hold* 40% (49% banking clients)
Underperform/Sell* 15% (42% banking clients)
Restricted 2%
*For purposes of the NYSE and NASD ratings distribution disclosure requirements, our stock ratings of Outperform, Neutral, and U nderperform most closely correspond to Buy, Hold, and Sell, respectively; however, the meanings are not the same, as our stock rati ngs are determined on a relative basis. (Please refer to definitions above.) An investor's decision to buy or sell a security should be based on investment objectives, current holdin gs, and other individual factors.
Credit Suisse’s policy is to update research reports as it deems appropriate, based on developments with the subject company, the sector or the market that may have a material impact on the research views or opinions stated herein.
Credit Suisse's policy is only to publish investment research that is impartial, independent, clear, fair and not misleading. For more detail please refer to Credit Suisse's Policies for Managing Conflicts of Interest in connection with Investment Research: http://www.csfb.com/research and analytics/disclaimer/managing_conflicts_disclaimer.html
Credit Suisse does not provide any tax advice. Any statement herein regarding any US federal tax is not intended or written to be used, and cannot be used, by any taxpayer for the purposes of avoiding any penalties.
Price Target: (12 months) for Tata Motors Ltd. (TAMO.BO)
Method: We set a sum-of-the-parts (SOTP)-based target price of Rs450for Tata Motors. We value the domestic business (Rs43/share) at 6.5x Dec-15 EBIDTA (earnings before interest, depreciation, tax and amortisation). We value JLR (Rs423/share) at 4x Dec-15E EBIDTA, along with other subsidiaries (Rs26/share) and net of debt (Rs42/share).
Risk: The key risks that may impede achievement of our Rs450 target price for Tata Motors include: a slowdown in the Chinese luxury car market resulting in significant deterioration in both volumes and margins in China.
Please refer to the firm's disclosure website at https://rave.credit-suisse.com/disclosures for the definitions of abbreviations typically used in the target price method and risk sections.
See the Companies Mentioned section for full company names
The subject company (TAMO.BO, DAIGn.DE) currently is, or was during the 12-month period preceding the date of distribution of this report, a client of Credit Suisse.
Credit Suisse provided non-investment banking services to the subject company (TAMO.BO, DAIGn.DE) within the past 12 months
Credit Suisse has received compensation for products and services other than investment banking services from the subject company (TAMO.BO, DAIGn.DE) within the past 12 months
09 January 2014
Tata Motors Ltd.
(TAMO.BO / TTMT IN) 14
Important Regional Disclosures
Singapore recipients should contact Credit Suisse AG, Singapore Branch for any matters arising from this research report.
The analyst(s) involved in the preparation of this report have not visited the material operations of the subject company (TAMO.BO, DAIGn.DE) within the past 12 months
Restrictions on certain Canadian securities are indicated by the following abbreviations: NVS--Non-Voting shares; RVS--Restricted Voting Shares; SVS--Subordinate Voting Shares.
Individuals receiving this report from a Canadian investment dealer that is not affiliated with Credit Suisse should be advised that this report may not contain regulatory disclosures the non-affiliated Canadian investment dealer would be required to make if this were its own report.
For Credit Suisse Securities (Canada), Inc.'s policies and procedures regarding the dissemination of equity research, please visit http://www.csfb.com/legal_terms/canada_research_policy.shtml.
The following disclosed European company/ies have estimates that comply with IFRS: (DAIGn.DE).
Credit Suisse has acted as lead manager or syndicate member in a public offering of securities for the subject company (TAMO.BO) within the past 3 years.
As of the date of this report, Credit Suisse acts as a market maker or liquidity provider in the equities securities that are the subject of this report.
Principal is not guaranteed in the case of equities because equity prices are variable.
Commission is the commission rate or the amount agreed with a customer when setting up an account or at any time after that.
To the extent this is a report authored in whole or in part by a non-U.S. analyst and is made available in the U.S., the following are important disclosures regarding any non-U.S. analyst contributors: The non-U.S. research analysts listed below (if any) are not registered/qualified as research analysts with FINRA. The non-U.S. research analysts listed below may not be associated persons of CSSU and therefore may not be subject to the NASD Rule 2711 and NYSE Rule 472 restrictions on communications with a subject company, public appearances and trading securities held by a research analyst account.
Credit Suisse Securities (India) Private Limited ...................................................................................................... Jatin Chawla ; Akshay Saxena
For Credit Suisse disclosure information on other companies mentioned in this report, please visit the website at https://rave.credit-suisse.com/disclosures or call +1 (877) 291-2683.
09 January 2014
Tata Motors Ltd.
(TAMO.BO / TTMT IN) 15
References in this report to Credit Suisse include all of the subsidiaries and affiliates of Credit Suisse operating under its investment banking division. For more information on our structure, please use the following link: https://www.credit-suisse.com/who_we_are/en/This report may contain material that is not directed to, or intended for distribution to or use by, any person or entity who is a citizen or resident of or located in any locality, state, country or other jurisdiction where such distribution, publication, availability or use would be contrary to law or regulation or which would subject Credit Suisse AG or its affiliates ("CS") to any registration or licensing requirement within such jurisdiction. All material presented in this report, unless specifically indicated otherwise, is under copyright to CS. None of the material, nor its content, nor any copy of it, may be altered in any way, transmitted to, copied or distributed to any other party, without the prior express written permission of CS. All trademarks, service marks and logos used in this report are trademarks or service marks or registered trademarks or service marks of CS or its affiliates. The information, tools and material presented in this report are provided to you for information purposes only and are not to be used or considered as an offer or the solicitation of an offer to sell or to buy or subscribe for securities or other financial instruments. CS may not have taken any steps to ensure that the securities referred to in this report are suitable for any particular investor. CS will not treat recipients of this report as its customers by virtue of their receiving this report. The investments and services contained or referred to in this report may not be suitable for you and it is recommended that you consult an independent investment advisor if you are in doubt about such investments or investment services. Nothing in this report constitutes investment, legal, accounting or tax advice, or a representation that any investment or strategy is suitable or appropriate to your individual circumstances, or otherwise constitutes a personal recommendation to you. CS does not advise on the tax consequences of investments and you are advised to contact an independent tax adviser. Please note in particular that the bases and levels of taxation may change. Information and opinions presented in this report have been obtained or derived from sources believed by CS to be reliable, but CS makes no representation as to their accuracy or completeness. CS accepts no liability for loss arising from the use of the material presented in this report, except that this exclusion of liability does not apply to the extent that such liability arises under specific statutes or regulations applicable to CS. This report is not to be relied upon in substitution for the exercise of independent judgment. CS may have issued, and may in the future issue, other communications that are inconsistent with, and reach different conclusions from, the information presented in this report. Those communications reflect the different assumptions, views and analytical methods of the analysts who prepared them and CS is under no obligation to ensure that such other communications are brought to the attention of any recipient of this report. CS may, to the extent permitted by law, participate or invest in financing transactions with the issuer(s) of the securities referred to in this report, perform services for or solicit business from such issuers, and/or have a position or holding, or other material interest, or effect transactions, in such securities or options thereon, or other investments related thereto. In addition, it may make markets in the securities mentioned in the material presented in this report. CS may have, within the last three years, served as manager or co-manager of a public offering of securities for, or currently may make a primary market in issues of, any or all of the entities mentioned in this report or may be providing, or have provided within the previous 12 months, significant advice or investment services in relation to the investment concerned or a related investment. Additional information is, subject to duties of confidentiality, available on request. Some investments referred to in this report will be offered solely by a single entity and in the case of some investments solely by CS, or an associate of CS or CS may be the only market maker in such investments. Past performance should not be taken as an indication or guarantee of future performance, and no representation or warranty, express or implied, is made regarding future performance. Information, opinions and estimates contained in this report reflect a judgment at its original date of publication by CS and are subject to change without notice. The price, value of and income from any of the securities or financial instruments mentioned in this report can fall as well as rise. The value of securities and financial instruments is subject to exchange rate fluctuation that may have a positive or adverse effect on the price or income of such securities or financial instruments. Investors in securities such as ADR's, the values of which are influenced by currency volatility, effectively assume this risk. Structured securities are complex instruments, typically involve a high degree of risk and are intended for sale only to sophisticated investors who are capable of understanding and assuming the risks involved. The market value of any structured security may be affected by changes in economic, financial and political factors (including, but not limited to, spot and forward interest and exchange rates), time to maturity, market conditions and volatility, and the credit quality of any issuer or reference issuer. Any investor interested in purchasing a structured product should conduct their own investigation and analysis of the product and consult with their own professional advisers as to the risks involved in making such a purchase. Some investments discussed in this report may have a high level of volatility. High volatility investments may experience sudden and large falls in their value causing losses when that investment is realised. Those losses may equal your original investment. Indeed, in the case of some investments the potential losses may exceed the amount of initial investment and, in such circumstances, you may be required to pay more money to support those losses. Income yields from investments may fluctuate and, in consequence, initial capital paid to make the investment may be used as part of that income yield. Some investments may not be readily realisable and it may be difficult to sell or realise those investments, similarly it may prove difficult for you to obtain reliable information about the value, or risks, to which such an investment is exposed. This report may provide the addresses of, or contain hyperlinks to, websites. Except to the extent to which the report refers to website material of CS, CS has not reviewed any such site and takes no responsibility for the content contained therein. Such address or hyperlink (including addresses or hyperlinks to CS's own website material) is provided solely for your convenience and information and the content of any such website does not in any way form part of this document. Accessing such website or following such link through this report or CS's website shall be at your own risk. This report is issued and distributed in Europe (except Switzerland) by Credit Suisse Securities (Europe) Limited, One Cabot Square, London E14 4QJ, England, which is authorised by the Prudential Regulation Authority ("PRA") and regulated by the Financial Conduct Authority ("FCA") and the PRA. This report is being distributed in Germany by Credit Suisse Securities (Europe) Limited Niederlassung Frankfurt am Main regulated by the Bundesanstalt fuer Finanzdienstleistungsaufsicht ("BaFin"). This report is being distributed in the United States and Canada by Credit Suisse Securities (USA) LLC; in Switzerland by Credit Suisse AG; in Brazil by Banco de Investimentos Credit Suisse (Brasil) S.A or its affiliates; in Mexico by Banco Credit Suisse (México), S.A. (transactions related to the securities mentioned in this report will only be effected in compliance with applicable regulation); in Japan by Credit Suisse Securities (Japan) Limited, Financial Instruments Firm, Director-General of Kanto Local Finance Bureau (Kinsho) No. 66, a member of Japan Securities Dealers Association, The Financial Futures Association of Japan, Japan Investment Advisers Association, Type II Financial Instruments Firms Association; elsewhere in Asia/ Pacific by whichever of the following is the appropriately authorised entity in the relevant jurisdiction: Credit Suisse (Hong Kong) Limited, Credit Suisse Equities (Australia) Limited, Credit Suisse Securities (Thailand) Limited, having registered address at 990 Abdulrahim Place, 27 Floor, Unit 2701, Rama IV Road, Silom, Bangrak, Bangkok 10500, Thailand, Tel. +66 2614 6000, Credit Suisse Securities (Malaysia) Sdn Bhd, Credit Suisse AG, Singapore Branch, Credit Suisse Securities (India) Private Limited regulated by the Securities and Exchange Board of India (registration Nos. INB230970637; INF230970637; INB010970631; INF010970631), having registered address at 9th Floor, Ceejay House, Dr.A.B. Road, Worli, Mumbai - 18, India, T- +91-22 6777 3777, Credit Suisse Securities (Europe) Limited, Seoul Branch, Credit Suisse AG, Taipei Securities Branch, PT Credit Suisse Securities Indonesia, Credit Suisse Securities (Philippines ) Inc., and elsewhere in the world by the relevant authorised affiliate of the above. Research on Taiwanese securities produced by Credit Suisse AG, Taipei Securities Branch has been prepared by a registered Senior Business Person. Research provided to residents of Malaysia is authorised by the Head of Research for Credit Suisse Securities (Malaysia) Sdn Bhd, to whom they should direct any queries on +603 2723 2020. This report has been prepared and issued for distribution in Singapore to institutional investors, accredited investors and expert investors (each as defined under the Financial Advisers Regulations) only, and is also distributed by Credit Suisse AG, Singapore branch to overseas investors (as defined under the Financial Advisers Regulations). By virtue of your status as an institutional investor, accredited investor, expert investor or overseas investor, Credit Suisse AG, Singapore branch is exempted from complying with certain compliance requirements under the Financial Advisers Act, Chapter 110 of Singapore (the "FAA"), the Financial Advisers Regulations and the relevant Notices and Guidelines issued thereunder, in respect of any financial advisory service which Credit Suisse AG, Singapore branch may provide to you. This research may not conform to Canadian disclosure requirements. In jurisdictions where CS is not already registered or licensed to trade in securities, transactions will only be effected in accordance with applicable securities legislation, which will vary from jurisdiction to jurisdiction and may require that the trade be made in accordance with applicable exemptions from registration or licensing requirements. Non-U.S. customers wishing to effect a transaction should contact a CS entity in their local jurisdiction unless governing law permits otherwise. U.S. customers wishing to effect a transaction should do so only by contacting a representative at Credit Suisse Securities (USA) LLC in the U.S. Please note that this research was originally prepared and issued by CS for distribution to their market professional and institutional investor customers. Recipients who are not market professional or institutional investor customers of CS should seek the advice of their independent financial advisor prior to taking any investment decision based on this report or for any necessary explanation of its contents. This research may relate to investments or services of a person outside of the UK or to other matters which are not authorised by the PRA and regulated by the FCA and the PRA or in respect of which the protections of the PRA and FCA for private customers and/or the UK compensation scheme may not be available, and further details as to where this may be the case are available upon request in respect of this report. CS may provide various services to US municipal entities or obligated persons ("municipalities"), including suggesting individual transactions or trades and entering into such transactions. Any services CS provides to municipalities are not viewed as "advice" within the meaning of Section 975 of the Dodd-Frank Wall Street Reform and Consumer Protection Act. CS is providing any such services and related information solely on an arm's length basis and not as an advisor or fiduciary to the municipality. In connection with the provision of the any such services, there is no agreement, direct or indirect, between any municipality (including the officials, management, employees or agents thereof) and CS for CS to provide advice to the municipality. Municipalities should consult with their financial, accounting and legal advisors regarding any such services provided by CS. In addition, CS is not acting for direct or indirect compensation to solicit the municipality on behalf of an unaffiliated broker, dealer, municipal securities dealer, municipal advisor, or investment adviser for the purpose of obtaining or retaining an engagement by the municipality for or in connection with Municipal Financial Products, the issuance of municipal securities, or of an investment adviser to provide investment advisory services to or on behalf of the municipality. If this report is being distributed by a financial institution other than Credit Suisse AG, or its affiliates, that financial institution is solely responsible for distribution. Clients of that institution should contact that institution to effect a transaction in the securities mentioned in this report or require further information. This report does not constitute investment advice by Credit Suisse to the clients of the distributing financial institution, and neither Credit Suisse AG, its affiliates, and their respective officers, directors and employees accept any liability whatsoever for any direct or consequential loss arising from their use of this report or its content. Principal is not guaranteed. Commission is the commission rate or the amount agreed with a customer when setting up an account or at any time after that.
Copyright © 2014 CREDIT SUISSE AG and/or its affiliates. All rights reserved.
Investment principal on bonds can be eroded depending on sale price or market price. In addition, there are bonds on which investment principal can be eroded due to changes in redemption amounts. Care is required when investing in such instruments.
When you purchase non-listed Japanese fixed income securities (Japanese government bonds, Japanese municipal bonds, Japanese government guaranteed bonds, Japanese corporate bonds) from CS as a seller, you will be requested to pay the purchase price only.
AU0313