tax-benefit incidence of value added tax on food and ... · starting with the tax incidence of the...
TRANSCRIPT

Working Paper Series
Tax-benefit incidence of value added tax on food and medicine to fund progressive social expenditure Jaime Acosta-Margain
ECINEQ WP 2011 – 194

ECINEQ 2011-194
March 2011
www.ecineq.org
Tax-benefit incidence of value added tax on food and medicine to fund progressive
social expenditure
Jaime Acosta-Margain* Rice University
Abstract
In 2009, the Mexican Congress received a proposal of a generalized 2% increase in the statutory VAT rate, including currently untaxed food and medicine. Whereas opponents emphasized the regressive effect, supporters argued that progressivity of the compensatory expenditures included in the bill more than compensated the bottom income quintiles. In this paper I present a tax-benefit incidence of this proposal using national survey data on household’s income and consumption. Despite the regressive effect of the tax increase, the data shows that the progressive expenditure offsets this effect. Overall the proposal was progressive. This finding undermines the arguments in favor of keeping food and medicines exempt of VAT to prevent a regressive effects. This result also contributes to the debate about the regressive effects of a single VAT to all consumption and no exemptions. To illustrate that, I analyze the redistributive effect of this policy. The result is that the increase in public expenditure can offset the regressive effect of this policy. Keywords: Value added tax, tax-benefit incidence. JEL Classification: H20, H22, H27.
* Address of correspondence: [email protected]

PRELIMINARY DRAFT prepared for Society for the Study of Economic Inequality.
2
INTRODUCTION
Latin America is the most unequal region in the world with an average Gini coefficient of 0.51—
well above the world average of 0.41. This has led Latin American governments to pursue income
redistribution as one of the main goals of tax and expenditure policy.1 Mexico is not the exception
to this rule, with a Gini coefficient of 0.48, 2 the Mexican federal government has been struggling
to reduce income inequality with a broad social expenditure agenda.
Despite substantial progress to reduce income inequality a considerable income gap
between rich and poor households still persists.3 The top decile earns 37.62% of total pre-tax
income whereas the bottom percentile only 1.22% (Table A.1, column A). Congress has been
interested in the contribution of taxes and expenditure to narrow down this gap to the point that
every year requires the Minister of Finance a report on this matter.4
For that reason, equity is one of the main criteria in the evaluation of any tax reform.
Despite the importance of this normative principle, no serious analysis has been carried out upon
its approval in the Mexican congress. Instead, tax reform proposals have been labeled as
progressive or regressive base on a first appearance and its approval. On example of this is the
2009 tax reform proposal, referred as Poverty Tax Act (Iniciativa de Ley de la Contribucion para el
Combate de la Pobreza). The proposal consisted in removing the current Value Added Tax (VAT)
zero-rating on food and medicines with a 2% tax in order to expand a broad social expenditure
agenda. The federal government goals were to increase the federal government revenue and to
increase the progressivity of the combined effect of fiscal and expenditure policy. Congress
rejected it considering the regressive effect of taxation without considering the progressive effect
of the social spending expansion.
Despite the proposal represented a substantial fraction of resources (0.6% of GDP), no
study has analyzed the redistributive effect on income distribution. In this paper I provide
preliminary evidence of the reform’s redistribution impact based on national survey data on
1 For instance, Garcia and Salvato (2005) for Venezuela, Gasparin (1999) for Argentina and Haughton (1999) in the
case of Peru. In all these papers the finding is that government intervention is progressive 2 ENIGH (2008). Gini coefficient of the reconstructed pre-tax income. See footnote 1 in Table 1.
3 It is remarkable the effort made by social programs like Progresa -Oportunidades. According to Corbacho and
Schwarts (2000) the Gini coefficient in Mexico in 1992 was 0.57. 4 The report prepared by the Minister of Finance every year is Distribución del pago de impuestos y recepción del
gasto publico por deciles de hogares y personas. From here on I refer this as Minister of Finance (2010).

PRELIMINARY DRAFT prepared for Society for the Study of Economic Inequality.
3
household income and consumption from Encuesta Nacional de Ingreso y Gasto de los Hogares
(ENIGH). The estimation is mainly focused on the final effect on the imputed income net of taxes
and expenditure. The main result of my paper is that the proposal was indeed progressive: the
regressivity of the 2% VAT on food and medicines is compensated by the expenditure package
proposed: mainly a increase in education and the expansion of social programs like
Oportunidades, a program that assists 25 million of low-income people with conditional cash-
transfers to promote school attendance and medical checkups.
The contribution of this paper is that it is the first tax-benefit analysis of this proposal. This
is importance considering that the tax on food and medicines is one of the alternatives in the
current tax reform debate. The main lesson is that the regressive tax increase on food can be
offset by progressive expenditure expansion. This result gives political leverage as most of the
opponents based their argument on the lack of compensatory mechanisms to mitigate the
regressive effects. Likewise, this paper gives insights about future development in Mexican tax
policy debate of broaden the VAT base removing all the current exemptions.
In the first section, I show in detail the 2009 proposal: the tax increased and expenditure
expansion proposed. In the second section, I describe the methodology, definitions and the data
used in the tax benefit incidence analysis. In the third section, I present the results of the analysis
starting with the tax incidence of the VAT on food and medicines and then I proceed to analyze
the expenditure (benefit) incidence of the proposed compensatory expenditure. In the fourth
section, I set the guideline of a more extensive reform pursing the tax rate harmonization and
finally and in the last section I show my main conclusions.
1. The Value Added Tax and the 2009 Presidential Reform.
Since the nineties, the Mexican federal government has not generated enough tax revenue to
cover the expenditure programs. On one hand, the government largely relies on oil revenue from
the state-owned company Petroleos Mexicanos (PEMEX). This source of revenue has been
declining due to the exhaustion of Cantarell, the main offshore oil field in the Gulf of Mexico.
Indeed since 2000, national oil production has been falling to the point that in 2010 it was 14
percent below the 2000 levels: half a million barrels less.5 On the other hand, the federal
5 http://www.shcp.gob.mx/sitios/UnidadCSV/Documentos/index.html.

PRELIMINARY DRAFT prepared for Society for the Study of Economic Inequality.
4
government non-oil tax revenue increase has not been enough to compensate this shortfall. The
problem is that exemptions and loopholes that drastically reduce the potential income and
consumption tax revenue. For instance, the Value Added Tax (VAT) revenue (3.7 percent of
GDP), is below countries with lower GDP per capita, e.g. Bolivia (5.6) or Colombia (6.3) or
Ecuador (6.4). 6
The low VAT revenue is due to the differentiated VAT rates leave out a significant share of
consumption untaxed. In 2009, there were three VAT rates: a 15% rate for general consumption,
a reduced border VAT 10% 7and zero rates for food and medicine. Additionally, other goods like
transportation, medical services, books, magazines and rent payments, etc. were exempted of the
VAT8. The zero-rating on food accounts for most of tax revenue forgone due to exemptions as it
represents a fiscal expenditure of 10 billions USD (1.1 percent of GDP).9
For that reason, one of the strategies to increase the non-oil tax revenue has been to
increase the VAT on food and medicines pursuing a harmonization of the VAT to a single rate
with no exemptions. The 2009 proposal was a first step towards this direction as it increased 2%
the VAT rate on all consumption. This implied an increase of the statutory VAT rate from 15% to
17% for most of the goods and a 2% VAT on food and medicine.10
The proposal faced strong opposition in Congress based on concerns about the
regressive effect on the poorest households. People at the bottom of the income distribution
spend 44.3% of their income on food and medicine whereas those at the top spend 15.7%.11 The
main fear was that an increase of the VAT on these products would result in poor households
bearing the largest tax burden increase. The proposal was controversial to the point that
Congress only authorized an increase of 1% in the statutory rate but keeping food and medicine
untaxed at the current zero VAT rate.12
6 Barreix (2007).
7 REPECOS Regimen de Pequeños Contribuyentes and a reduced VAT rate (10%) in the Border Strip with the USA and
Guatemala. 8 The main difference between zero vat and exempt good is it classification in the law. In terms of its budgetary
impact, both categories represent fiscal expenditure. 9 http://www.shcp.gob.mx/INGRESOS/Ingresos_pres_gasto/presupuesto_gasto_fiscales_2010.pdf
10 Presidencia de la Republica (2009).
11 ENIGH (2008).
12 In 2010, the VAT increased to 16% for the previously 15% VAT and to 11% in the border strip with the USA and
Guatemala.

PRELIMINARY DRAFT prepared for Society for the Study of Economic Inequality.
5
Millions
Concept pesos %
Total 71,775 100%
I EDUCATION 24,492 34%
Scholarships Oportunidades 19,711 27%
Oportunidades Componente Educativo 18,921 26%
Programa Albergues Escolares Indigenas 789 1%
Investment in Public Schools 4,781 7%
Consejo Nacional Fomento Educativo 4,571 6%
Programa Infraestructura Basica atencion Pueblos Indigenas 210 0%
II HEALTH 19,476 27%
Seguro Popular 18,412 26%
Programa Comunidades Saludables 115 0%
Programa Caravanas de Salud 761 1%
Sistema Integral Calidad Salud 188 0%
III CASH- IN KIND TRANSFERS 27,807 39%
Desarrollo Humano Oportunidades 20,043 28%
Programa Apoyo Alimentario 4,834 7%
Programa de Empleo Temporal 2,930 4%
Source: Presidencia de la Republica (2009).
Despite the regressive effect of taxation, the federal government argued that the final
effect on households’ disposable income was progressive due to an expansion of progressive
taxation that would compensate low-income households. The federal government estimated that
the reform would generate 71 billions pesos (USD 5 billion or 0.6% of GDP) that were going to
fund social expenditure to mitigate the regressive effects of the tax increase. The expenditure
announced, shown in detail in Table 1, was distributed among: cash-in kind transfer programs
under the Programa de Apoyo Alimentario and Desarrollo Humano Oportunidades (39%),
Education: Scholarships through Oportunidades and Public School programs (34%) and Health:
an extension of the Seguro Popular and other programs (27%) a health program focused on low
income people.
Table 1. Expenditure proposal as compensatory mechanism
Whereas opponents of the proposals based their conclusions on the regressive effects of
taxation, supporters did the same based on the progressivity of the expenditure. No study has
considered the combined effect of this proposal. In the next section, I introduce the methodology
employed and the data that will be used the tax-benefit incidence to determined the reform’s final
effect on household’s income.
2. Tax-Benefit Incidence Analysis: Methodology and Data
The tax benefit incidence analysis assesses government’s budgetary effect (taxes and public
spending) on the effective distribution of benefits and burdens associated with fiscal policy. The

PRELIMINARY DRAFT prepared for Society for the Study of Economic Inequality.
6
goal is to answers questions like: Who bears the burden of taxation? Who benefits from public
expenditure? How the combined effect of the expenditure benefit and the tax burden affects the
income distribution? As starting point, the effect of government taxes and expenditure on
households’ income decile i can be represented by
pre tax after tax imputed disposable
i i i i iy y yτ ε− −
− = + = (1)
Where:
pre tax
iy
− is the pre-tax income
iτ is the tax paid
after tax
iy
− is the after-tax income
imputed
iε is the imputed expenditure benefit
disposable
iy is the final imputed disposable income net of taxes and expenditure
The budgetary impact is the resulting difference between the pre-tax income distribution
and the imputed disposable income net of taxes and expenditure that is households’ available
resources for consumption. Ideally, the budgetary impact should consider not only the change in
allocation, changes in taxes and expenditure paid by each household, but also how households
react towards this change. Ideally, the pre-tax income distribution is such that would have taken
place in the absence of taxes and expenditure as well as the behavioral responses to them.
Nevertheless, this distribution is unobservable and its estimation requires a general equilibrium,
an analysis beyond the scope of this paper given data restrictions and the complexity of these
behavioral responses. In this paper I used a reconstructed pre-tax given that the survey data
reports the after-tax income. 13
In this paper, a tax benefit analysis focuses on the allocation change leaving the
behavioral response as a separate problem. As Poterba (2007) mentions, in any tax change
there are two effects in the income distribution that should be considered. The first one is the
redistributive impact of taxes themselves given a pre-tax income distribution, this effect is the one
presented in this paper. The second effect is from changes in the pre-tax distribution due to
13
The adjustment was done with the following procedure. First, I adjusted households aggregate demand reported
in the System of National Accounts to the total autonomous income reported in the survey data.13
Second, I
subtracted the imputed taxes paid and expenditure received by income decile using the federal government balance
sheet and the tax burden and benefit received reported distribution reported by the Minister of Finance.

PRELIMINARY DRAFT prepared for Society for the Study of Economic Inequality.
7
behavioral responses. This is not captured by static analysis and its implications are not trivial.
However, the inclusions of these effects require information that is not available in almost any
country. The incorporation of the behavioral response requires the construction of theoretical
models that goes beyond the scope of the tax benefit incidence analysis.
Instead, the tax benefit incidence analysis is based on simplifying assumptions that allow
the quantification of the redistributive impact of taxation and expenditure. The computation is
focused on the regressivity of the tax increase vs. the progressivity of the expenditure. In other
words, how the VAT tax on food and medicines and the expenditure increase modify the
economic incidence of government on income distribution.
The departing point of this analysis is the pre-reform scenario, in the absence of VAT on
food and medicines. Regarding federal taxes, the first section of Table A.1 in the appendix shows
that the tax burden distribution, defined as tax payments as a fraction of income, is progressive as
the tax burden increases with income (column C). The progressivity of the tax system leads to a
reduction of the Gini coefficient from 0.482 of the pre-tax income distribution to 0.475 of the after
tax income. Nonetheless, the second section of this table shows that the main redistribution is
made through government expenditure as the bottom deciles receive the largest fraction of
expenditure (column E). These expenditure transfers have a significant impact on income at the
bottom of the distribution as in some cases they represent more than 100% of the after tax
income (column F). The progressivity of the expenditure translates into a substantial reduction in
potential consumption inequality, as the Gini coefficient of imputed income net of taxes and
expenditure drops to 0.421 (column G).
The income distribution in Table A.1 is the benchmark to assess the impact of the reform.
The first step of the analysis is the estimation of the tax incidence of the VAT on food and
medicines VAT
iτ∆ on the tax burden distribution and the change in the after-tax income distribution.
( )( )Post reform
pre tax VAT after tax
i i i iy yτ τ
−− −
− + ∆ = (2)
The second step is to analyze the effect that the expenditure increase increase
iε∆ , using the
proceeds of taxation, has on the expenditure distribution.
( ) ( ) ( )Post reform Post reform
after tax imputed increase disposable
i i i iy yε ε
− −−
+ + ∆ = (3)
PRELIMINARY DRAFT prepared for Society for the Study of Economic Inequality.
8
As an illustrative example, I also show the marginal effect of the reform isolating it from the
rest of taxes. That is for every peso taxed and spent through this reform what fraction is paid and
received by each income decile. Given that a conventional tax incidence analysis does not
consider behavioral responses to the VAT on food does not the incidence of the other taxes
remains constant as the as household’s consumption. Under these assumptions, the change in
disposable income is the resulting net transfer between the additional spending minus the
increase of the VAT burden defined as:
( )disposable increase VAT
i i iy ε τ∆ = ∆ − ∆ (4)
2.1 Tax incidence methodology
The first step is to assess the distribution of the tax payments i
τ Although the law is explicit about
who has to pay the taxes, statutory incidence, generally who ultimately bears the tax burden is
different, economic incidence. Tax incidence analysis has been an important area in Public
Finance since the seminal works of Musgrave et al. (1951) and Pechman and Okner (1974).14
The existing literature has used conventional assumptions to facilitate the computation of the
burden and it distribution. In this paper I will follow the conventional assumptions listed by Anwar
and Whalley (1991) in studies for developing countries.
The starting point is the estimation of the tax burden. Taxes usually impose excess
burdens on consumers: deadweight loss. On the efficiency ground the size of the burden is
relevant to analyze the welfare loss due to the tax, however given that tax incidence analysis is
focused on the equity impact of the tax (tax incidence) and not the efficiency impact (excess
burden losses), a conventional assumption is that the total tax burden coincides with the tax
revenue collected (tax burden assumption).
Similarly, I am assuming that the entire tax burden is shifted from producers to consumers
(shifting assumption). I assume that households pay the statutory rate of 15% on the taxable
consumption and no tax on the exempted VAT goods.15 Although some authors like Stern (1987),
have pointed out that estimation of the tax burden requires an estimation of the distribution
between consumer and producer based on the elasticities of supply and demand, the information
14
See Nssah (2008) and Martinez Vasquez (2001) for a literature review. 15
Some authors have assumed that households pay a fraction of VAT incorporated in the production of food or
medicine. For instance, Vargaz Telles (2009) assumes that households pay half of the statutory tax rate.
PRELIMINARY DRAFT prepared for Society for the Study of Economic Inequality.
9
provided by survey on households consumption is not enough for such calculations as the survey
only gives the amount of money spent without separate prices and quantities. 16 As in the
standard tax incidence analysis, the tax burden and the shifting assumptions allow the
computation without any explicit estimation of the estimation of elasticities of demand or supply.
The second step in the tax incidence analysis is to allocate the tax burden among different
income deciles. I use national consumption data from Encuesta Nacional de Ingreso y Gasto de
los Hogares (ENIGH 2008). The survey covers 35,000 households with consumption information
representative at the national level. For analytical purposes I use households’ monetary
consumption with adjusted prices to estimate the tax burdens.17 Using the categories listed in
Table A.2 in the appendix I grouped monetary consumption by VAT category. A summary of this
information is shown in Table A.3. The first row of this table shows that 49% of all consumption is
taxed at the general rate whereas the rest is either exempted or zero-rated. This is the main
reason why the VAT base is so small. Just food consumption represents 24% of all monetary
consumption whereas medicine 1%.
Table A.3 also shows the distribution of monetary expenditure by income decile. In the
case of goods taxed at the general rate and exempted goods (like transportation, education
services, rent and medical services) the top deciles spend a larger fraction of their consumption
than households at the bottom of the distribution (columns A and B). In contrast, the opposite
trend is observed in the case of the zero-rated food and medicines. In this case: the poorer the
household the bigger the share of total consumption spent on these goods (column C). In the
case of food, difference is remarkable as the share allocated by households at the bottom of the
distribution is three times the share allocated by households at the top (column C1). As I will show
in the following section, this consumption structure implies the progressive distribution observed in
the VAT burden distribution.
I use the consumption distribution to adjust the aggregate consumption data reported in
the System of National Accounts and the aggregate tax revenue. This is important to capture how
16
If q is the consumer price and the consumer is given p=(q-t), the effect of the tax on consumer prices will be given
by η/(η+ εp/q) where η and ε are respectively the elasticities of supply and demand. 17
The survey provides consumption at market value (VAT is included in the price). Therefore it is necessary to
estimate the VAT paid adjusting consumption first. Following Vargaz Telles (2009), the VAT paid by the family i for
the jth good is Tij=tjbjdij, where tj is the VAT rate, bj is the price given by the producer and dij the units demanded.
Given that the total expenditure reported in the survey gij is defined by gij=bjdij + Tij thus bjdij = gij-Tij which combined
with the definition of Tij, yields Tij=tj(gij-Tij) and rewriting Tij=[tj/(1+tj)]gij.

PRELIMINARY DRAFT prepared for Society for the Study of Economic Inequality.
10
the change in the VAT distribution affects the overall progressivity of the federal taxes. As
mentioned earlier, in the analysis of the reform I am not considering any change in the rest of the
taxes. For that reason I use the estimation of the Minister of Finance (SHCP) for the computation
of the tax burden distribution of the rest of federal taxes: income tax, social security payroll tax,
excise taxes (tobacco and alcohol and gasoline, etc.), car property tax (tenencia) and brand-new
tax.18
2.2 Benefit incidence methodology
A central issue in this paper is if the expenditure progressivity included in the reform proposal can
compensate the regressive effect o taxation. Evidently this depends on the public expenditure
effect on households after tax income. However, given its heterogeneous nature of government
spending, requires valuation assumptions that allow the calculation. In principle, this is a
challenge as how can we assess the effect of a new school or the improvement of health due
vaccination campaigns on households’ income? Whereas it is easier to measure cash transfers, it
is more difficult to measure the benefit accruing from public and private goods provided by
government: e.g. expenditure on health, education, etc. Usually we do not have market prices or
information about the value of such services. Even if we had markets for certain goods, as
Martinez Vazquez (2008) suggest, given that their supply is monopolized by the State, the price
would not reflect the marginal benefit to consumers. For these reasons, the standard assumption
in the literature, and followed in this paper, is that the benefit of the public expenditure is given by
the cost of provision paid by government.
Following Nssah (2008), Sehili et. al (2008) and Demery (2003), imputing the distribution
of value of government transfers by the cost of provision requires two steps. The first one is to
assess the cost of the public service using the government aggregate data. The second step is to
estimate the rate of use of each service by household decile from households’ survey data and
then derive the distribution of such imputed value. The estimation of the incidence of the
expenditure included in the 2009 reform proposal, shown in Table 1, follows this procedure
utilizing the methodology published by the Minister of Finance (SHCP).
18
Minister of Finance (2010).

PRELIMINARY DRAFT prepared for Society for the Study of Economic Inequality.
11
VAT rate: 15% VAT rate: 17% (incl. 2% on food and medicines)
VAT burden
Pre Tax as fraction VAT burden VAT burden as a fraction of Pre- Tax Income VAT
Income Income Distribution of Pre Tax Distribution Total General Medicaments payment
decile Distribution Income (%) VAT Rate Food and others increase (%)
A B C D E=E1+E2+E3 E1 E2 E3 F
Total 100.00 100.00 100.00
1 1.22 2.28 9.90 2.49 12.48 10.68 1.72 0.08 32.40
2 2.55 3.33 6.93 3.56 8.56 7.48 1.03 0.06 29.77
3 3.58 4.27 6.30 4.49 7.67 6.80 0.81 0.05 27.75
4 4.65 5.35 6.09 5.56 7.33 6.58 0.70 0.04 26.25
5 5.76 6.35 5.84 6.56 6.97 6.30 0.63 0.04 25.38
6 7.13 7.84 5.82 8.01 6.88 6.28 0.56 0.04 24.06
7 9.12 9.25 5.37 9.36 6.28 5.79 0.46 0.03 22.96
8 11.77 11.71 5.26 11.70 6.09 5.68 0.37 0.03 21.38
9 16.61 17.03 5.43 16.77 6.18 5.86 0.30 0.03 19.65
10 37.62 32.59 4.58 31.50 5.13 4.95 0.15 0.03 17.45
Source: ENIGH (2008) .
In the case of the investment on Public Schools, I took the average cost per student
estimated by the Minister of Education, Household benefit is determined by the number of
children in schooling age reported in the ENIGH (2008). In the case of Scholarships
Oportunidades, I used transfers information included in ENIGH (2008) and Minister of Finance
(2008). In the case of the expenditure on Health I use the rate of use of the three main health
institutions in Mexico: Instituto Mexicano del Seguro Social (IMSS), Instituto de Seguridad Social
y Servicios de los Trabajadores del Estado (ISSSTE) and Pemex reported in Minister of Finance
(2010). Finally, the cash and in-kind transfers I use the distribution of monetary transfers reported
in the income section of ENIGH (2008).
3. Tax-Benefit Incidence Analysis
3.1 The redistribution effect of the VAT increase on zero VAT goods
Based on the methodology shown in the previous section, Table 2 shows the pre and post reform
VAT burden distribution by income decile. The first section of the table shows that the VAT is
regressive, as the bottom 7 deciles bear a higher burden than their income share (column B), thus
the VAT burden as a fraction of pre tax income (column C) is around half for wealthier
households respect the ones at the bottom of the distribution.
Table 2. Change in VAT burden distribution

PRELIMINARY DRAFT prepared for Society for the Study of Economic Inequality.
12
Tax burden distribution (%) Total After tax income distribution (%) Change in income
Income Pre After Tax Pre After (% of Pre reform
decile Reform Reform Increase Reform Reform Pre-Tax Income)
A B B-A C D E E-D F
Gini
coefficient 0.475 0.476
1 1.09 1.34 0.25 35.33 1.23 1.21 -0.02 -2.77
2 1.53 1.85 0.32 33.41 2.64 2.62 -0.02 -1.71
3 2.35 2.67 0.33 25.50 3.69 3.67 -0.02 -1.44
4 3.38 3.70 0.32 20.75 4.76 4.74 -0.02 -1.30
5 4.34 4.66 0.32 18.39 5.88 5.86 -0.02 -1.20
6 5.94 6.23 0.28 15.49 7.23 7.22 -0.02 -1.13
7 8.15 8.32 0.17 12.55 9.21 9.20 -0.01 -0.98
8 11.14 11.18 0.04 10.59 11.83 11.83 0.00 -0.88
9 17.82 17.56 -0.26 8.61 16.50 16.52 0.01 -0.82
10 44.33 42.48 -1.85 5.62 37.02 37.14 0.11 -0.60
Source: ENIGH (2008).
The rest of Table 2 shows that the generalized increase of the 2% to a 17% general rate
and 2% VAT on food and medicines exacerbate the VAT regressivity. Comparing the VAT burden
before and after the reform we observe that the share paid by the bottom 7 deciles increases
(columns D and B). Regarding the VAT burden as a fraction of pre-tax income, we observe that
the 2% increase of zero VAT products is mainly borne by low income households as their tax
burden increase is larger than households at the top of the income distribution (columns E and C).
In particular, the VAT on food is the most regressive (column E2) as the fraction of the pre tax
income paid by the bottom decile represents more than ten times the fraction paid by the top
decile (1.72% vs 0.15%). Although with smaller differences, the VAT on medicine and other zero
VAT products are also regressive. This regressivity is translated into a disproportional increase of
low income households VAT liabilities (column F): 30% for the lower part of the income
distribution and 20% for the upper part.
Evidently this regressive effect raises concerns about how the reform modifies the
progressivity of the tax system. To illustrate this, Table 3 shows the VAT payments combined
with other excise and income taxes.19
Table 3. Tax burden distribution and after-tax income distribution
Columns A and B show that the reform reduces the tax burden of the top 2 deciles, in
particular for the top decile. This comes from the disproportional tax increase across the income
distribution (column C). The bottom decile increases its tax liability seven times more than the top
decile: 35.33% versus 5.62% resulting into a larger loss of after-tax income for first groups
19
That is the personal income tax (ISR) and the excise taxes on tobacco, gasoline and other goods: IEPS (Impuesto
Especial sobre la Produccion de bienes y Servicios), automobile taxes (Tenencia) and brand new car tax (ISAN).

PRELIMINARY DRAFT prepared for Society for the Study of Economic Inequality.
13
EDUCATION HEALTH CASH-IN KIND
Income Scholarship Investment in (Seguro TRANSFERS TOTAL
decile Oportunidades 1/ Public Schools 2/ Popular) 3/ (Oportunidades ) 1/ Distribution
A B C D E
1 34.03 18.42 19.85 33.33 28.87
2 18.32 15.66 16.03 18.42 17.56
3 12.57 13.42 11.96 12.72 12.52
4 9.42 11.03 10.69 9.43 9.88
5 6.28 9.56 8.91 6.36 7.24
6 7.33 8.59 8.14 7.24 7.60
7 4.71 7.40 6.62 4.82 5.45
8 3.14 6.53 6.62 3.29 4.37
9 2.62 5.50 6.36 2.63 3.83
10 1.57 3.90 4.83 1.75 2.68
Source: ENIGH (2008), Minister of Finance (2010) and Minster of Education (SEP).
1/ Based on scholarships received from income reported in ENIGH (2008)
2/ I consider the average cost per pupil published by Minister of Education (SEP). I multiply this cost by the
attendance to public primary schools by income decile reported in ENIGH (2008).
3/ Based on ENIGH (2008) I consider the number of beneficiaries of Seguro Popular by income decile.
(column F). Evidently this undermines the progressivity of the tax system shown in Table 1. As the
Gini coefficient of the After-tax income slightly increases after the reform is implemented (columns
D and E).These results are the main evidence for opponents to the proposal, as the exemption on
food prevents a highly regressive VAT. In general, countries that do not have these exemptions
tend to have a more regressive VAT.20 The next question to answer is if the progressivity of the
expenditure offets the regressive effect.
3.2 Benefit incidence results
As mentioned in the first section, the federal government proposed to use the proceeds of the tax
increase to fund the social programs listed in Table 1. The benefit incidence of each of the
programs included in the presidential proposal is highly progressive as a substantial fraction of the
expenditure is received by the first three deciles, in particular by the bottom decile. For instance,
the bottom decile receives 34% and 33% of the total expenditure on the Scholarship
Oportunidades and Cash-Kind transfers programs. Although slightly less progressive, the
expenditure on health and the investment in public schools also concentrate a substantial fraction
on the bottom four deciles. Overall, the compensatory effect of the expenditure proposal
combining the programs listed (column E) mostly benefits the bottom three deciles.
Table 4. Incidence of the programs included in the compensatory expenditure
20
For instance, Engel et al. (1999) show that in Chile, where food is not exempt the VAT is quite regressive.

PRELIMINARY DRAFT prepared for Society for the Study of Economic Inequality.
14
Proposal's VAT Federal Govt Combined Expenditure
Income Expenditure Increase Net Expenditure Net 80% Proposal + Net
decile Distribution 1/ Distribution 2/ Transfer Distribution 3/ Transfer 20% States Expend. Transfer
A B A-B C C-B D=80% B + 20% C D-B
100.00 100.00 100.00 100.00
1 28.87 3.45 25.43 11.80 8.35 25.46 22.012 17.56 4.62 12.94 10.50 5.88 16.15 11.533 12.52 5.52 7.00 10.00 4.48 12.01 6.50
4 9.88 6.54 3.34 9.80 3.26 9.86 3.32
5 7.24 7.50 -0.26 9.40 1.90 7.67 0.176 7.60 8.78 -1.19 10.50 1.72 8.18 -0.61
7 5.45 9.89 -4.44 10.00 0.11 6.36 -3.53
8 4.37 11.65 -7.29 10.00 -1.65 5.49 -6.16
9 3.83 15.58 -11.75 8.90 -6.68 4.84 -10.74
10 2.68 26.47 -23.79 9.10 -17.37 3.97 -22.50
Source: ENIGH (2008) and Minister of Finance 2010.
1/ Following the expenditure distribution of column E in Table 6.
2/ Given that this table only consider the tax and expenditure at the margin, I am only considering the distribution of the tax burden
increase. Note that this is different to the new VAT burden distribution show in Table 3 where I consider not only the 2% increase.
3/ As published in Minister of Finance (2010). This distribution is estimated using the same metothology that I am using in column A.
3.3 Does the expenditure proposed compensate the regressive effect of this policy?
The next question to answer is if the benefit incidence compensates the regressive effect of the
tax increase. In order to show the change in disposable income, Table 5 shows the implicit net
transfer per 100 pesos collected and spent by this reform, as defined in equation 4. The marginal
net transfer is computed considering the expenditure distribution (column A), distributed according
to the distribution shown in Table 4, minus the distribution of the VAT burden increase (column B).
The tax burden increase includes the 2% on food and medicaments plus the additional 2% in all
the consumption taxed at the general rate.
Table 5. Expenditure distribution per peso collected and spent in the proposal
The resulting net transfers are shown in column A-B. The first decile ends up with a
positive transfer of 25.43 pesos, as it receives 28.87 pesos through public expenditure and only
pays 3.45 pesos of VAT. On the other side, the top decile ends up with a negative transfer of
23.79 pesos (it just receives 2.68 pesos and pays 26.47 pesos). Considering the net transfers
throughout the income distribution, the government proposal redistributes income from the upper
half to the bottom half of the income distribution getting a quasi-symmetric structure of transfers:
note that the positive net transfer of the bottom decile equals the negative net transfer of top
deciles. Overall, the combined policy is progressive as the government offsets the regressive
effect of the taxation with the expenditure proposal.
PRELIMINARY DRAFT prepared for Society for the Study of Economic Inequality.
15
Table 5 also shows other possible scenarios once the reform was approved. One concern
is that the federal government, instead of expending the additional revenue in the programs
included in the presidential proposal, simply expands the federal expenditure (column C). In this
case the resulting net transfer (column C-B) , the expenditure is less progressive the resulting net
transfers redistribute income from the top three deciles to the rest of the distribution. Notice that in
this case the redistribution from the top deciles to the bottom deciles is not as large but the
redistribution is still progressive.
Another possibility is that the federal government cannot fully spend the additional
revenue. This case is possible because given the fiscal laws 20% of the federal non oil tax
revenue is directly transferred from the Federal Government to the States, being the latter who
decide how to use these funds. Therefore the compensatory expenditure would not mach the
amount taxed through the VAT increase. The last two columns in Table 5 consider this case.
Given the lack of information about the distribution of state governments’ expenditure, I assume
that the 20% spent by the state governments has the same distribution as the federal expenditure
shown in column C. The remaining 80% is assumed to be spent in the programs included in the
proposal. The resulting net payment (column D-B) shows the same quasi-symmetric structure as
in the previous case. The net payment by the top third of the distribution translates into net benefit
to the bottom third. Thus, the data suggest that even if the federal government does cannot use
all the funds in the expenditure proposal, the combined effect is progressive.
3.4 How the reform affects federal fiscal policy income redistribution?
The next question to answer is how the redistributive capacity of the government is modified by
the reform? Based on equations 2 and 3, Table 6 shows the effect of this policy on imputed
disposable income. On one side, as shown in Table 4, there is the regressive effect of the reform
in the total tax burden distribution, the VAT combined with the rest of the taxes. For easier
comparison, I repeat this change in Table 6 (column B-A). As mentioned previously, the reform
reduces the tax burden distribution of the top two deciles and increases the burden of the rest of
the distribution, in particular, from the second to the sixth decile. On the other side, Table 6 also
shows the progressive effect of the additional expenditure of 71 billions in the programs included
in the proposal (column D-C). After the reform, the bottom three deciles increase their share of
total expenditure.
PRELIMINARY DRAFT prepared for Society for the Study of Economic Inequality.
16
Taxes Burden Government Expenditure Disposable Income Change in
distribution (%) distribution (%) distribution (%) disposable
Income Pre After Difference Pre After Difference Pre After Difference income
decile Reform Reform (basis points) Reform Reform (basis points) Reform Reform (basis points) (% Pre reform level)
A B B-A C D D-C E F F-E G
Gini coefficient 0.421 0.416
1 1.09 1.34 0.25 11.80 12.76 0.96 2.34 2.51 0.17 7.42
2 1.53 1.85 0.32 10.50 11.00 0.50 3.46 3.56 0.10 2.93
3 2.35 2.67 0.33 10.00 10.22 0.22 4.35 4.41 0.06 1.34
4 3.38 3.70 0.32 9.80 9.78 -0.02 5.29 5.31 0.02 0.41
5 4.34 4.66 0.32 9.40 9.28 -0.12 6.25 6.25 0.00 -0.01
6 5.94 6.23 0.28 10.50 10.34 -0.16 7.58 7.57 -0.01 -0.08
7 8.15 8.32 0.17 10.00 9.74 -0.26 9.29 9.26 -0.03 -0.32
8 11.14 11.18 0.04 10.00 9.59 -0.41 11.64 11.58 -0.06 -0.51
9 17.82 17.56 -0.26 8.90 8.54 -0.36 15.71 15.62 -0.09 -0.57
10 44.33 42.48 -1.85 9.10 8.69 -0.41 34.10 33.93 -0.17 -0.50
Source: ENIGH (2008)
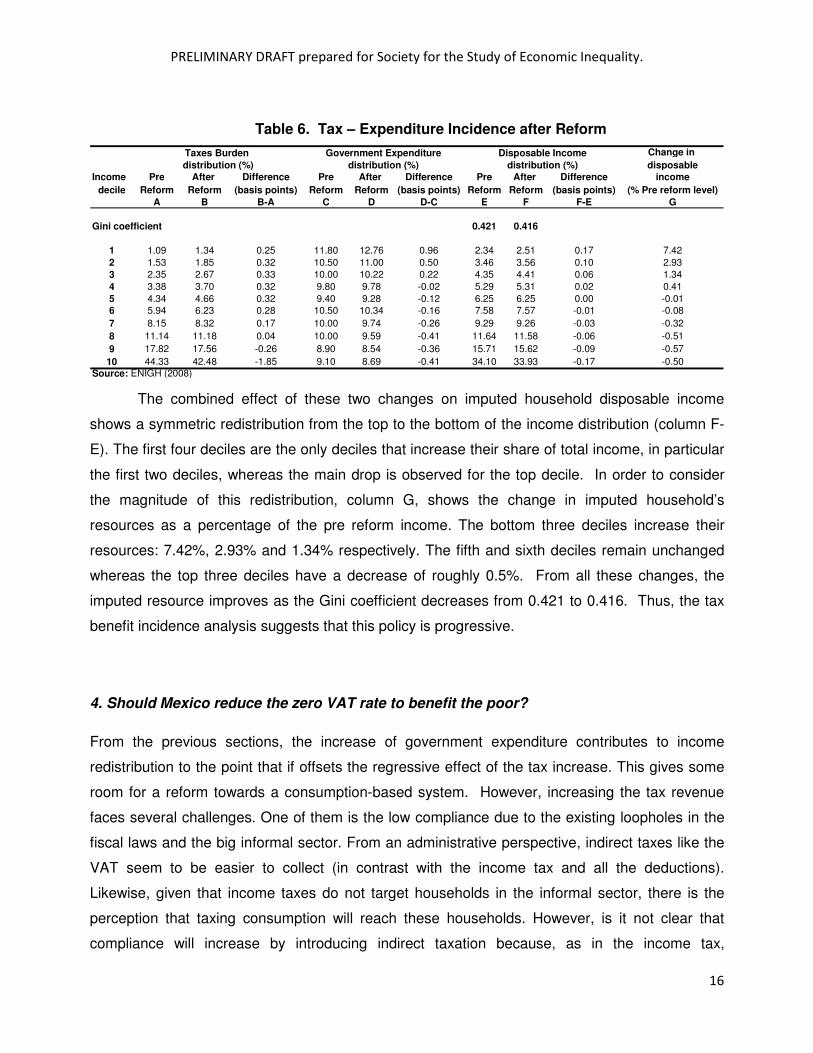
Table 6. Tax – Expenditure Incidence after Reform
The combined effect of these two changes on imputed household disposable income
shows a symmetric redistribution from the top to the bottom of the income distribution (column F-
E). The first four deciles are the only deciles that increase their share of total income, in particular
the first two deciles, whereas the main drop is observed for the top decile. In order to consider
the magnitude of this redistribution, column G, shows the change in imputed household’s
resources as a percentage of the pre reform income. The bottom three deciles increase their
resources: 7.42%, 2.93% and 1.34% respectively. The fifth and sixth deciles remain unchanged
whereas the top three deciles have a decrease of roughly 0.5%. From all these changes, the
imputed resource improves as the Gini coefficient decreases from 0.421 to 0.416. Thus, the tax
benefit incidence analysis suggests that this policy is progressive.
4. Should Mexico reduce the zero VAT rate to benefit the poor?
From the previous sections, the increase of government expenditure contributes to income
redistribution to the point that if offsets the regressive effect of the tax increase. This gives some
room for a reform towards a consumption-based system. However, increasing the tax revenue
faces several challenges. One of them is the low compliance due to the existing loopholes in the
fiscal laws and the big informal sector. From an administrative perspective, indirect taxes like the
VAT seem to be easier to collect (in contrast with the income tax and all the deductions).
Likewise, given that income taxes do not target households in the informal sector, there is the
perception that taxing consumption will reach these households. However, is it not clear that
compliance will increase by introducing indirect taxation because, as in the income tax,

PRELIMINARY DRAFT prepared for Society for the Study of Economic Inequality.
17
Tax Burden 1/ After Tax Income Imputed Household's Resources 2/
Pre Tax % change Change
Income Income Distribution (%) Tax Distribution (%) of Distribution (%) as % of
decile Distribution Current Flat VAT Increase Current Flat VAT After-Tax Current Flat VAT Current
(%) Tax % Tax Income Tax Level
A B C C-B D E F F-E G H I I-H J
Gini 0.482 0.475 0.482 0.421 0.411
coefficient
1 1.22 1.09 2.11 1.02 22.96 1.23 1.11 -0.13 -13.45 2.40 2.64 0.24 9.90
2 2.55 1.53 2.69 1.16 14.91 2.64 2.53 -0.11 -7.56 3.55 3.71 0.16 4.61
3 3.58 2.35 3.46 1.11 12.76 3.69 3.60 -0.09 -6.04 4.47 4.59 0.13 2.81
4 4.65 3.38 4.36 0.99 11.75 4.76 4.68 -0.08 -5.14 5.42 5.52 0.10 1.82
5 5.76 4.34 5.34 1.00 10.94 5.88 5.81 -0.07 -4.78 6.41 6.46 0.05 0.81
6 7.13 5.94 6.71 0.76 10.41 7.23 7.18 -0.05 -4.27 7.77 7.84 0.06 0.81
7 9.12 8.15 8.43 0.29 9.22 9.21 9.21 0.00 -3.57 9.53 9.56 0.03 0.29
8 11.77 11.14 11.49 0.34 8.52 11.83 11.81 -0.02 -3.75 11.94 11.86 -0.08 -0.65
9 16.61 17.82 17.18 -0.64 8.18 16.50 16.54 0.03 -3.40 16.12 15.89 -0.22 -1.38
10 37.62 44.33 38.24 -6.09 6.27 37.02 37.53 0.51 -2.26 34.99 34.52 -0.47 -1.34
Source: ENIGH (2008).
1/ Includes the VAT and the rest of the federal taxes. In the case of the Flat Tax, it is assumed an statutory rate of 15% to all consumption without
zero VAT goods.
2/ Government net transfers are the proportional part of expenditure corresponding to that decile. In this case I am not assuming any change
in the federal expenditure distribution. This the expenditure is distributes as in Table 1.
taxpayers underreport their transactions in order to avoid the VAT. Despite notable progress
made by the Federal Government during the last years the VAT avoidance is still an issue.21
Harmonizing the VAT tax rates would reduce the tax expenditure, that is the revenue
forgone through VAT zero rates and exemptions. For instance, the zero-rating on food and
medicine represents a fiscal expenditure of 1% of the GDP. Despite the potential increase in tax
revenue that this measure represents, the question is about the redistributive effect of this reform.
In order to answer this question, I simulate the hypothetical situation, where a harmonized Flat
VAT rate on all consumption is imposed. In this case all consumption is taxed at 15%, including
the zero VAT goods, and the rest of the income and excise taxes remain unchanged. Table 7
shows the implied effect on the tax burden and expenditure distribution. On the taxation side,
under the Flat Tax the progressivity of the tax system would be eliminated (columns B and C).
Notice that the two top deciles reduce their share of tax burden whereas the rest of the distribution
increases it. This reallocation is the result of the disproportional tax increase at the bottom of the
distribution (column D): whereas the tax liability of the bottom decile increases 23% the increase
of the top decile is just 6.17%. As a consequence the bottom of the distribution experiences the
largest fall of the after tax income (column G). The regressivity of this change is reflected by the
increase of the Gini coefficient (columns E and F). The after-tax income distribution under the Flat
Tax regime (column F) is the same than the Gini of the Pre Tax Income distribution (column A).
Table 7. Change in Incidence due the introduction of a VAT Fair Tax.
21
Fuentes Castro (2010) estimate a drop in the VAT avoidance from 23.22% in 2000 to 19.79% in 2007.
PRELIMINARY DRAFT prepared for Society for the Study of Economic Inequality.
18
For determining the impact on households’ disposable income I do not consider any
change in the expenditure distribution and I assume the same expenditure distribution shown
previously. 22 The change on household disposable income distribution (column I-H) shows a
progressive redistribution form the top three deciles to the rest of the distribution, in particular for
the first three deciles. In terms of percentage change (column J) these deciles would have a
percentage increase of the income of: 9.90%, 4.61% and 2.81% respectively whereas people at
the two top deciles observe a drop larger than one percent.
This preliminary result suggests that eliminating the zero VAT rate could benefit poor
households more than harm them. Thus it could happen that zero rate on food and medicines
although prevents the regressive effect of the taxation, it implies a substantially drop in
progressive expenditure. After all, it could be possible that poor households would be better off
paying the tax and getting back the additional expenditure.
CONCLUSIONS
This paper gives preliminary evidence that the generalize 2% VAT seems to be progressive. The
proposed progressive expenditure offsets the regressivity of eliminating the zero VAT rate on food
and medicine. The result is important as concerns about the regressivity of consumption taxes do
not consider the effect of public expenditures on household’s disposable income. This paper gives
a glimpse of this debate and suggests that consumption based taxation could be progressive. The
extent of these benefits depends on the compensatory mechanisms for the bottom of the
distribution. In order to pick the ideal compensatory mechanism, the impact of schooling and
health care expenditures and tax compliance across different income groups should be
considered.
For future research, several things can be addressed. For instance the quantification of
the benefits can be done without following the conventional assumption that the benefit of the
public expenditure is given by its cost of provision.23 The cost of provision does not necessarily
represent the improvement in household’s welfare. This brings up the issue of the fungibility of
22
Table 5 (column C). 23
As mentioned previously, assessing the impact of expenditures presents serious estimation issues, so studies like
Martinez Vazquez (2008) Nssah (2008), Sehili et. al (2008) and Demery (2003), Minister of Finance (2010) and Vargas
Tellez (2009) follow this assumption.

PRELIMINARY DRAFT prepared for Society for the Study of Economic Inequality.
19
services provided by government: do household value a dollar spent on health programs or a new
school worth the same as cash transfer? This question is essential as governments use
taxpayer’s money for the provision of public goods and services. For instance, in the expenditure
proposal analyzed in this paper, 61% of the new taxes are allocated through education and health
services and the rest to money transfers. Thus a correct assessing of the benefits is crucial to
determine the compensation of the regressive effect of taxation.
Similarly, the presence of the informal sector is important in a country like Mexico where
people at the bottom of the distribution live in rural areas where tax collection is limited. Although
the statutory tax rate implies taxing more these groups, it does not mean they will effectively pay
more. Low tax compliance among these groups might be a factor in favor of indirect taxation: as
low income people in the informal sector do not pay the taxes and get the benefits of the
expenditure increase.
Another crucial issue is the static nature of the analysis as no behavioral response is
assumed. For instance, conventional studies assume that total tax burdens coincide with the
revenue collected by the government. However, as Martinez Vazquez (2001) points out, the final
effect in real income might be larger than the actual taxes collected, implying social welfare loses.
This evidently depends on the behavioral response. Similarly, a static analysis implies that the
change in tax burden is immediate. This overlooks the incorporation of transitional cost that might
be relevant for comparing intergenerational welfare redistributions.
The use of a Computational General Equilibrium (CGE) model seems to be the natural
next step to incorporate the behavioral responses. The current literature (e.g. Diamond and
Zodrow (2005) Auerbach and Kotlikoff (1987) and Altig et. al. (1997) has been focused in
evaluating in other different dimensions. For instance, in efficiency ground, the model can test the
suggested efficiency gains suggested by Atkinson and Stiglitz (1976) that give no room to
consumption tax rates differentiation. Similarly, a CGE model would allow estimating the
additional revenue as in the presence of the informal as the revenue gains can not be as large as
they seem to be. The shift from the formal to the informal sector can reduce the revenue gains as
shown by Ab Iorweth and Whalley (2002).Thus as we can see this debate has a long way to go
not only in the political arena but also in the theoretical grounds.

PRELIMINARY DRAFT prepared for Society for the Study of Economic Inequality.
20
REFERENCES
Ab Iorweth, Aled, and John Whalley. 2002. “Efficiency considerations and the exemption of food
from sales and value added taxation”, Canadian Journal of Economics 35, 166-182.
Altig, David, Auerbach, Alan J., Kotlikoff, Laurence J., Smetters, Kent A. and Walliser, Jan , Simulating U.S. Tax Reform (October 1997). NBER Working Paper Series, Vol. w6248, pp. -, 1997. Available at SSRN: http://ssrn.com/abstract=226006 Atkinson, Anthony and Joseph E. Stiglitz, 1976. "The Design of Tax Structure: Direct Versus Indirect Taxation," Journal of Public Economics 6, pp. 55-75. Auerbach, Alan J. and Laurence J. Kotlikoff. 1987. Dynamic Fiscal Policy. Cambridge: Cambridge University Press. Barreix, Alberto, Jerónimo Roca and Luis Vilella (comp). 2007. Fiscal Policy and Equity Estimation of the Progressivity and Redistributive Capacity of Taxes and Social Public Expenditure in the Andean Countries. Inter-American Development Bank. Inter-American Development Bank. Blackburn, K., Cipriani, G.P., 2002. A model of longevity, fertility and growth. Journal of Economic Dynamics and Control 26, 187–204. Corbacho A. and Gerd Schwartz. 2002. Income Distribution and Social Policies in Mexico. What can we learn from the Data?. Lateinamerika Analysen 1, Februar 2002, S. 5-64. Hamburg: IIK Demery, Lionel. 2003. “Analyzing the Incidence of Public Spending.” In The Impact of Economic Policies on Poverty and Income Distribution: Evaluation Techniques and Tools, ed. François Bourguignon and Luis A. Pereira da Silva, 41–68.Washington, DC: World Bank Engel Eduardo M.R.A., Galetovic Alexander and Raddatz Claudio E. 1999. Taxes and Income Distribution in Chile: Some Unpleasant Redistributive Arithmetic. Journal of Development Economics, Vol. 59, Issue 1: 155-192. Emran, Shahe M. and Joseph E. Stiglitz .2005. “On selective indirect tax reform in developing
countries”. Journal of Public Economics 89, 599–623.
ENIGH (2008) Encuesta Nacional de Ingreso y Gasto de los Hogares. Data files available in http://www.inegi.org.mx/est/contenidos/espanol/proyectos/metadatos/encuestas/enigh_211.asp?s=est&c=10748 Fuentes Castro, Javier. 2010. Evasión Global de Impuestos: Impuesto sobre la renta, impuesto al valor agregado e impuesto especial sobre la producción y servicio no petrolero. ITESM. Garcia, G. and S Salvato. 2005. Equidad del sistema tributario y del gasto publico en Venezuela. Lima DFID-SG CSN-IDB. Gasaparin, L. 1999. Incidencia del Gasto Publico Social y de la Politica tributaria en la Argentina, in La distribución del ingreso en Argentina, Buenos Aires: FIEL.
PRELIMINARY DRAFT prepared for Society for the Study of Economic Inequality.
21
Hanushek, E.A., C.K.Y. Leung and K. Yilmaz (2001), “Redistribution through education and other transfer mechanisms”, Working Paper 8588 (National Bureau of Economic Research, Cambridge, MA). Marin, Jose Maria 2008. Contribución de 2% para el Combate a la Pobreza, CEFP de la Cámara de Diputados. Martinez-Vazquez, Jorge. 2001a. Mexico: An Evaluation of the Main Features of the Tax System, International Studies Program Working Paper # 01-12, November 2001 ------------, 2001b. The Impact of Budgets on the Poor: Tax and Benefit Incidence, International Studies Program Working Paper # 01-10, August 2001 -----------, 2008. The Impact of Budgets on the Poor: Tax and Expenditure Benefit Incidence Analysis. In Mieszkowki, Peter. 1969, “Tax Incidence Theory: The effect of Taxes on the Distribution of Income”, Journal of Economic Literature. 7:1103-24. Musgrave, Richard, JJ Carol, L.D Cook and L. Frane, 1951, “Distribution of Tax Payments by Income Groups: A Case Study for 1948”, National Tax Journal, 4:1-53 Musgrave, Richard, Case and Herman Leonard. 1974 “The distribution of fiscal Burdens and Benefits”, Public Finance Quartely 2: 259-311. Blanca Moreno-Dodson and Quentin Wodon (eds), “Public Finance for Poverty Reduction: Concepts and Case Studies from Africa and Latin America” Washington D.C.: The World Bank. Nsah, Essama. 2008 Assessing the redistributive effect of Fiscal Policy. The World Bank Poverty Reduction and Economic Management Network Policy Research Working Paper 4592, April 2008 Pechman J.A, and Benjamin Okner. 1974. Who Bears the Tax Burden? , Washington D.C.: Brookings Institution. Poterba, James M., 2007. "Income inequality and income taxation," Journal of Policy Modeling, Elsevier, vol. 29(4), pages 623-633. Presidencia de la Republica, 2009, Iniciativa de Ley de la Contribución del Combate a la Pobreza, Congreso de la Union. Minister of Finance, 2010. Distribución del pago de impuestos y recepción del gasto publico por deciles de hogares y personas. Resultados para el año 2008. Secretaria de Hacienda y Crédito Publico Samaniego R. 2010. Eficiencia Recaudatoria. Definición, estimación e incidencia de la evasión. ITAM. Sehili, Saloua and Wodon, Quentin (2008): Analyzing the Potential Impact of Indirect Tax Reforms on Poverty with Limited Data: Niger. Published in: Public Finance for Poverty Reduction:

PRELIMINARY DRAFT prepared for Society for the Study of Economic Inequality.
22
Non durable goods Services
Food Financial services related
Medicines with pensions and mortgages
Books Insurance
Gold and currency Rental housing
Water (Utilities) Public transportation
Financial assets Raffle and loteries
School fees and tuitions
Durable Goods Interest and loans
Land purchases Public shows
Houses
Source: Value Added Tax Act.
Concepts and Case Studies from Africa and Latin America (edited by Blanca Moreno-Dodson and Quentin Wodon, published in World Bank Directions in Development) (2008): pp. 345-370. Shah, Anwar and John Whalley. 1991. “Tax Incidence Analysis of Developing Countries: An Alternative View”, The World Bank Economic Review 5 (3):535-52. Stern Nicholas. 1987. Aspects of General Theory of Tax Reform. In David Newbery and Nicholas Stern (eds) “The Theory of Taxation for Developing Countries”. Washington, D.C.: The World Bank. Vargas Tellez, Octavio. 2009. Tax-Benefit Incidence. The Mexican experience during the last twenty years. Working Paper, Society for the Study of Economic Inequality.
APPENDIX
Table A.1 The Effects of Taxes and Expenditures on the Mexican Income Distribution
Pre-Tax Tax burden After-Tax Expenditure Imputed
Household Income fraction of Income fraction of disposable
Income Distribution 1/ Distribution 2/ Pre Tax distribution Distribution 3/ After-Tax income
decile (%) (%) Income (%) (%) (%) Income (%) distribution (%) 4/
A B C D E F G
Gini Coefficient 0.482 0.475 0.421
1 1.22 1.09 7.28 1.23 11.80 111.87 2.34
2 2.55 1.53 4.87 2.64 10.50 46.51 3.46
3 3.58 2.35 5.33 3.69 10.00 31.64 4.35
4 4.65 3.38 5.91 4.76 9.80 24.06 5.29
5 5.76 4.34 6.13 5.88 9.40 18.68 6.25
6 7.13 5.94 6.78 7.23 10.50 16.96 7.58
7 9.12 8.15 7.26 9.21 10.00 12.69 9.29
8 11.77 11.14 7.70 11.83 10.00 9.88 11.64
9 16.61 17.82 8.73 16.50 8.90 6.30 15.71
10 37.62 44.33 9.58 37.02 9.10 2.87 34.10
Source: ENIGH (2008), System of National Accounts and Minister of Finance's data.
1/ Adjusted household disposable income, published in National Accounts adjusted by taxes, pensions and net transfers. The paid taxes and the Social Security
contribution are added w hereas Government transfers like w elfare programs and subsidies (PROCAMPO, Oportunidades, etc) and pension payments (IMSS and
ISSSTE) are substracted. The distribution is estimated based on distribution of current income in INEGI (2008).
2/ For VAT and excise taxes I estimate the burden distribution from consumption data. For the rest of the taxes I use estimates from Minister of Finance (2010).
3/ Minister of Finance (2010).
4/ Government net tranfers are taxes paid minus expenditure received.
Table A.2. VAT exempted and zero-rated categories

PRELIMINARY DRAFT prepared for Society for the Study of Economic Inequality.
23
Monetary Consumption (A+B+C) on products taxed at:
Household General Exempt Zero VAT
Income Rate (15%) Goods 1/ Total Food Medicine Other
decile A B C=C1+C2+C3 C1 C2 C3
Average 49.9% 23.6% 26.5% 24.4% 1.0% 1.1%
1 37.2% 16.5% 46.3% 44.3% 1.1% 0.9%
2 38.5% 20.2% 41.3% 39.1% 1.1% 1.1%
3 40.0% 22.3% 37.6% 35.4% 1.1% 1.1%
4 42.4% 21.9% 35.7% 33.6% 0.9% 1.2%
5 43.0% 23.3% 33.7% 31.6% 1.1% 1.1%
6 45.4% 22.9% 31.8% 29.9% 0.8% 1.1%
7 47.0% 23.4% 29.5% 27.5% 0.9% 1.1%
8 49.8% 24.0% 26.2% 24.2% 0.9% 1.0%
9 53.7% 24.1% 22.1% 20.3% 0.9% 1.0%
10 58.7% 25.6% 15.7% 13.5% 1.0% 1.3%
Source: Encuesta Nacional de Ingreso Gasto de los Hogares. 2008
1/ Includes transportation, education services, rent and medical services, books.
Table A.3. Monetary Consumption by type of VAT Treatment
Table A.4 Federal Taxes burden distribution
Income Income Social Consumption Gasoline Car Car
group Tax Security Excise Excise Tax Property Sales
Payroll tax Taxes Tax Tax
Total 100 100 100 100 100 100
I -1.2 1.1 2.1 0.8 0.6 0.4
II -1.9 2.7 4.1 2.0 1.9 0.1
III -1.3 4.0 5.4 2.8 1.9 0.7
IV -0.4 5.4 7.5 4.3 3.3 0.5
V 0.6 6.7 8.7 5.9 5.2 1.4
VI 2.4 8.3 10.9 7.6 6.1 1.9
VII 5.9 10.5 12.8 9.4 8.2 3.9
VIII 11.0 13.3 12.0 13.7 10.2 9.8
IX 20.5 17.6 16.0 21.2 19.8 20.5
X 64.4 30.4 20.4 32.3 42.9 60.7
Source: Minister of Finance (2010)