tax credits for growing businesses a 2013 … article 3j report... · the tier designation formula...
TRANSCRIPT

TAX CREDITS FOR GROWING BUSINESSES ACT 2013 REPORT
June 1, 2013
State of North Carolina Department of Commerce
Labor & Economic Analysis Division
Secretary Sharon Decker
2
TABLE OF CONTENTS
EXECUTIVE SUMMARY 3
INTRODUCTION 5
EQUITY STUDY PART 1: Tier Designation Criteria and Alternative Measures 9
PART 2: Tier Designations and Counties with Low Populations 13
PART 3: Existing Businesses versus New Businesses 14
IMPACT STUDY PART 1: Distribution of Tax Credits Across 15
New and Existing Businesses and Industries
PART 2: Direct Costs and Benefits of Article 3J 17
PART 3: Business Recruitment and Expansion Related 21 Activities since 2005
PART 4: Use of Incentives by Other States 26
APPENDIX 30 Acknowledgments The Labor & Economic Analysis Division thanks Robert Bowles from the Department of Revenue for his contribution to this report.

3
EXECUTIVE SUMMARY In 2007, the North Carolina General Assembly enacted the Tax Credits for Growing Businesses Act, also known as Article 3J. Article 3J offers several types of tax credits to eligible taxpayers that undertake qualifying activities. Article 3J offers credits for:
Creating jobs – Companies that meet a minimum threshold of new full-time jobs created during the taxable year may claim a credit.
Investing in business property – Companies can claim a credit based on a percentage of the cost of capitalized, tangible personal property that is placed in service during the taxable year.
Investment in real property – Companies located in a Tier 1 county that invest at least $10 million in real property within a three-year period and create at least 200 new jobs within two years are allowed a credit equal to 30 percent of the eligible investment.
These credits may be used to offset up to 50 percent of the taxpayer’s state income tax, franchise tax, or gross premium tax liability. Companies must apply to receive the tax credits and provide specific financial information to the North Carolina Department of Revenue. Not all companies that are eligible for tax credits will claim them, nor will companies who are eligible claim all of their credits. As part of the Article 3J Act, every year the Department of Commerce ranks each county based on economic well-being and assigns it to one of three tiers. The rankings reflect the counties’ relative economic status based on four factors: 12-month unemployment rate, median household income, 36-month population growth rate, and per capita adjusted assessed property value. The 40 most distressed counties are designated as Tier 1, the next 40 are Tier 2, and the 20 least distressed are Tier 3. The tier designation of a county impacts the value of a company’s eligible credits; the more distressed a county, the larger the eligible amount of the credit for the specified activity. This tier system is incorporated into various state programs in addition to Article 3J credits. ABOUT THIS REPORT As required by G.S. 105-129.82, this report analyzes the Article 3J tax credit program. The report also describes the development tier designation factors, Department of Commerce business expansion-related and recruitment efforts, and the use of incentives in other states. The report contains two major components required by statute: an Equity Study and an Impact Study. The Equity Study reviews:
1. The tier designation formula including alternative measures for more equitable treatment of counties in similar economic circumstances;
2. Assignment of tiers and whether the applicable thresholds are equitable for smaller counties; and 3. Data on whether expanding North Carolina businesses receive fewer benefits than out-of-state
businesses that locate to North Carolina. The Impact Study analyzes the:
1. Distribution of Article 3J tax credits across new and expanding businesses and the distribution of Article 3J tax credits across industries;
2. Direct costs and benefits of the Article 3J tax credits;

4
3. Department of Commerce’s assigned and announced business recruitment and expansion-related activities since 2005 by county, industry, investment, and jobs; and
4. Use of incentives by other states. This report is based on tax returns and annual reports from Process Years 2011–2012 by the North Carolina Department of Revenue and announced business recruitment and expansion-related data from the Department of Commerce’s Business and Industry Division. EQUITY STUDY FINDINGS
Current tier designation criteria mix both short and long term indicators of economic distress. As a result, there are several counties that perform poorly in one or more indicators but are not among the most distressed counties in terms of final tier assignment. For example, there are 11 counties that rank in the 40 most distressed counties for at least two criteria but are designated Tier 2. Of these, three counties rank in the 40 most distressed counties for three criteria but are designated Tier 2.
Potential alternative criteria reviewed in this report were evaluated, including: o Use of standardized scores in the determination of a county’s Development Factor; o Lengthening the unemployment rate measurement to a 36-month average; o Inclusion of poverty rates; o Removing the use of property value assessments; and o Removing population thresholds for counties.
These alternative criteria did not significantly reduce the volatility of counties’ rankings as compared to the current method.
The low population adjustments that are a component of a county’s final tier ranking do meet the intent of the statute. However, there are counties that are more distressed according to the Development Factor ranking that do not receive the benefit of a lower tier designation. For example, there are seven counties with a total Development Factor that ranks in the 40 most distressed counties that are designated Tier 2, due to the adjustments for small counties.
IMPACT STUDY FINDINGS
Based on available data, 89 percent of businesses generating 3J credits are existing businesses, while 11 percent are new businesses to North Carolina.
Manufacturing accounted for 71 percent of establishments generating 3J credits, 78 percent of jobs created and 73 percent of business property investment in Process Years 2011-2012.
Between Process Years 2011 - 2012, 16,962 jobs were created by companies claiming Article 3J credits. Over $4.3 billion was invested in business and real property related to Article 3J credits.
Businesses in the most distressed counties are generating the most Article 3J job creation tax credits in terms of dollar value.
Between 2007 and 2012, the N.C. Department of Commerce announced 1,336 projects with over $26.4 billion investment and over 140,000 jobs. The manufacturing sector accounted for 71 percent of announced investment and 62 percent of announced job creation for that period. The majority of project announcements (56 percent) resulted from expansion-related activity of existing North Carolina businesses.
In 2012, for Department of Commerce projects, businesses announced investment totaling $3.48 billion and 16,506 jobs.
Statutory and discretionary economic development tools continue to be important tools in economic development, but incentive data is difficult to collect and compare across states.

5
INTRODUCTION As required by G.S. 105-129.82, this report analyzes the Article 3J tax credit program, describes the development tier designation factors, analyzes the Department of Commerce’s business expansion-related and recruitment efforts, and identifies the use of incentives in other states. The report contains two major components required by statute: an Equity Study and an Impact Study. The Equity Study reviews:
1. The tier designation formula, including alternative measures for more equitable treatment of counties in similar economic circumstances;
2. Tier assignments and whether the applicable thresholds are equitable for smaller counties; and 3. Data on whether expanding North Carolina businesses receive fewer benefits than out-of-state
businesses that locate to North Carolina. The Impact Study analyzes:
1. Distribution of Article 3J tax credits across new and expanding businesses and the distribution of Article 3J tax credits across industries;
2. Direct costs and benefits of the Article 3J tax credits; 3. Department of Commerce’s assigned and announced business recruitment and expansion-related
activities since 2005 by county, industry, investment, and job; and 4. Use of incentives by other states.
This report assesses tax returns and annual reports from Process Years 2011—2012 by the North Carolina Department of Revenue and announced business recruitment and expansion-related data from the Department of Commerce’s Business and Industry Division. The data covers the two-year period since the previous biennial report. ARTICLE 3J TAX CREDITS FOR GROWING BUSINESSES: PROGRAM OVERVIEW The Article 3J Tax Credits for Growing Businesses program went into effect on January 1, 2007. The General Assembly found (G.S. 105-129.80):
1. It is the policy of the State of North Carolina to stimulate economic activity and to create new jobs for the citizens of the State by encouraging and promoting the expansion of existing business and industry within the State and by recruiting and attracting new business and industry to the State.
2. Both short-term and long-term economic trends at the State, national, and international levels have made the successful implementation of the State's economic development policy and programs both more critical and more challenging, and the decline in the State's traditional industries, and the resulting adverse impact upon the State and its citizens, have been exacerbated in recent years by adverse national and State economic trends that contribute to the reduction in the State's industrial base and that inhibit the State's ability to sustain or attract new and expanding businesses.
3. The economic condition of the State is not static, and recent changes in the State's economic condition have created economic distress that requires a reevaluation of certain existing State programs and the enactment of a new program as provided in this Article that is designed to stimulate new economic activity and to create new jobs within the State.
4. The enactment of this Article is necessary to stimulate the economy and create new jobs in North Carolina, and this Article will promote the general welfare and confer, as its primary purpose and effect, benefits on citizens throughout the State through the creation of new jobs, an enlargement of the overall tax base, an expansion and diversification of the State's industrial base, and an increase in revenue to the State and its political subdivisions.
5. The purpose of this Article is to stimulate economic activity and to create new jobs within the State.

6
6. The State is in need of a focused tax credit program that encourages and facilitates economic growth and development within the State.
7. The resources of the State are not evenly distributed throughout the State and different communities have different abilities and needs in attracting and maintaining new and expanding business and industry.
Tax credits are awarded to eligible taxpayers that undertake qualifying activities in North Carolina: job creation; investment in business property; and investment in real property. Additional tax credits may be earned for projects in Urban Progress and Agrarian Growth Zones.1 These credits may be combined to offset up to 50 percent of the taxpayer’s state income, franchise, or gross premium tax liability. The following is a brief summary of the Article 3J program’s eligibility requirements and eligible activities, tier assignments, and Urban Progress and Agrarian Growth Zones. Eligibility To qualify for Article 3J Credits, the following eligibility requirements must be met (G.S. 105-129.83):
1. The primary activity at the business establishment must be one of the following: a) aircraft maintenance and repair; b) air courier services hub; c) company headquarters that creates at least 75 new headquarters jobs; d) customer service call centers; e) electronic shopping and mail order houses; f) information technology and services; g) manufacturing; h) motorsports facilities and motorsports racing teams; i) research and development; and j) warehousing and wholesale trade.
2. The average wage of all full-time workers employed by the taxpayer at the establishment during the taxable year must meet or exceed the applicable wage standard of the county in which the establishment is located. There is no wage standard in Tier 1 counties.
3. The taxpayer must offer qualifying health insurance for all full-time positions at the establishment and pay at least 50 percent of employee premiums.
4. The taxpayer certifies that, at the time the taxpayer claims the credit, there has not been a final determination unfavorable to the taxpayer with respect to an environmental disqualifying event.
5. The taxpayer certifies that, as of the time the taxpayer claims the credit at the establishment with respect to which the credit is claimed, the taxpayer has no citations under the Occupational Safety and Health Act that have become a final order within the past three years for willful serious violations or for failing to abate serious violations.
6. The taxpayer may not have overdue taxes.
County Tier Designations General Statute 143B-437.08 requires that the Department of Commerce annually ranks the state’s 100 counties based on economic well-being and assigns a tier designation to each. The development factor is based on 12-month average unemployment rate, median household income, 36-month population growth rate, and per
1 Municipalities with a population of at least 10,000 have the ability to define qualifying areas of poverty as Urban Progress Zones.
Counties that do not have a municipality with a population of at least 10,000, have the ability to define qualifying areas of poverty as Agrarian Growth Zones. Projects located within these zones receive enhanced Article 3J Credits.

7
capita adjusted assessed property value. These tier designations affect the financial value of the Article 3J tax credits. The 40 most distressed counties are designated as Tier 1, the next 40 are Tier 2, and the 20 least distressed are Tier 3. There are several caveats in the statute that affect tier designation. Any county that has a population of fewer than 12,000 people is automatically designated as a Tier 1 county. Any county with a population of fewer than 50,000 is automatically ranked one of the 80 most distressed counties. Any county with a population fewer than 50,000 people, and with more than 19 percent of its population below the federal poverty level, according to the most recent Federal decennial census, is automatically designated a Tier 1 county. Any county designated as a development Tier 1 area is automatically ranked one of the 40 most distressed counties until it has been a development Tier 1 area for at least two consecutive years. Urban Progress Zones (UPZ) and Agrarian Growth Zones (AGZ) As part of North Carolina’s Article 3J tax credits program, the Agrarian Growth Zone and the Urban Progress Zones provide economic incentives to stimulate new investment and job creation in economically distressed areas. Municipalities with a population of at least 10,000 have the ability to define qualifying areas of poverty as Urban Progress Zones (G.S. 143B-437.09). Counties that do not have a municipality with a population of at least 10,000 have the ability to define qualifying areas of poverty as Agrarian Growth Zones (G.S. 143B-437.010). Business development projects located within these zones receive enhanced Article 3J credits. Credit for Creating Jobs Eligible taxpayers that meet a minimum threshold of new full-time jobs created during the taxable year may claim a credit for each new job created. The credit is taken in equal installments over four years following the year the jobs are created. The job threshold and the credit amount per job are determined by the tier designation of the county in which the jobs are created. When jobs are created in Urban Progress Zones or Agrarian Growth Zones, the credit is increased by $1,000. If a resident of a zone or a long-term unemployed person2 is hired, the company is eligible for an additional $2,000 credit.
Table 1. Article 3J Job Creation Tax Credit Tier Designations
Tier 1 Tier 2 Tier 3 UPZ / AGZ
Job Threshold 5 10 15 5
Credit per Job $12,500 $5,000 $750 + $1,000
Source: General Statue 105-129.87
Credit for Investing in Business Property Eligible taxpayers may claim a credit based on a percentage of the cost of capitalized business property that is placed in service during the taxable year in excess of an applicable threshold. This credit is taken in equal installments over four years beginning the year after the property is first placed in service. The credit percentage and threshold are based on the tier designation of the county where the property is placed in service.
2 A long-term unemployed worker is an individual who has been totally unemployed for at least the preceding 26 consecutive weeks as
defined by the N.C. Employment Security Commission.

8
Table 2. County Tier Designation and Investment Threshold for Business Property Tax Credit
Tier 1 Tier 2 Tier 3 UPZ / AGZ
Threshold $0 $1 million $2 million $0
Credit % 7% 5% 3.5% 7%
Source: General Statue 105-129.88
Credit for Investment in Real Property Eligible taxpayers that invest at least $10 million in real property within a three-year period and create at least 200 new jobs within two years at an establishment located in a Tier 1 county are allowed a credit equal to 30 percent of the eligible real property investment (G.S. 105-129.89). This credit is taken in equal installments over seven years beginning the year after the property is used by an eligible business. To qualify for this credit, the taxpayer must obtain a written determination from the Department of Commerce.

9
EQUITY STUDY
PART 1: TIER DESIGNATION CRITERIA AND ALTERNATIVE MEASURES Part 1 analyzes the data collected for the most recent (2013) tier designations. Explanations of each criterion are provided along with a rationale for its use in the Development Factor formula. Because the Development Factor is the sum of rankings in four different economic indicators, it is possible for a county to rank in the 40 most distressed counties using one or even more than one indicator and yet not have a final Development Factor ranking in the top 40. It is also important to note that additional “automatically qualifying criteria” specified in statute apply to counties with low population and high poverty rates and will affect final tier designations. This section analyzes the relationships among the criteria and highlights patterns in these relationships when notable. The findings seek to identify what may cause counties with similar economic circumstances to be ranked differently according to final Development Factor sums. Alternative criteria and methodologies are also presented for consideration. TIER DESIGNATION CRITERIA Each November, the Department of Commerce must release updated county tier designations for the following calendar year. These rankings are based on economic criteria specifically required by the statute. G.S. 143B-437.08 defines the “Development Factor” as the sum of rankings across four economic criteria:
1. 12-Month Average Unemployment Rate – Counties are ranked by average rate of
unemployment from lowest to highest for the most recent 12 months for which data are
available.
2. Median Household Income – Counties are ranked by median household income from
highest to lowest for the most recent 12 months for which data are available.
3. 36-Month Population Growth Rates – Counties are ranked by percentage growth in
population from highest to lowest for the most recent 36 months for which data are
available. For the purposes of this section, population statistics do not include people
incarcerated in federal or state prisons.
4. Per Capita Adjusted Assessed Property Value – Counties are ranked by adjusted assessed
property value per capita as published by the Department of Public Instruction, from highest
to lowest, for the most recent taxable year.
12-Month Average Unemployment Rate – An unemployment rate represents the percentage of people in an area’s labor force (people currently working or seeking work) who are not employed. The unemployment rate is a lagged variable, meaning that it reflects changes that have occurred in the economy in the previous two or three quarters. The relatively short measurement period (one year) means that mass layoffs, new job creation, or downturns in specific industries have a large impact on a county’s ranking. Findings from analysis of 12-Month Average Unemployment Rate data:
12-Month Average Unemployment Rates calculated for the 2013 tier designations vary widely across the state—ranging from 6.3 percent to 17.4 percent with a median of 10.5 percent. The range for the counties with the 40 highest 12-Month Average Unemployment Rates is from 11.0 percent to 17.4 percent.
10
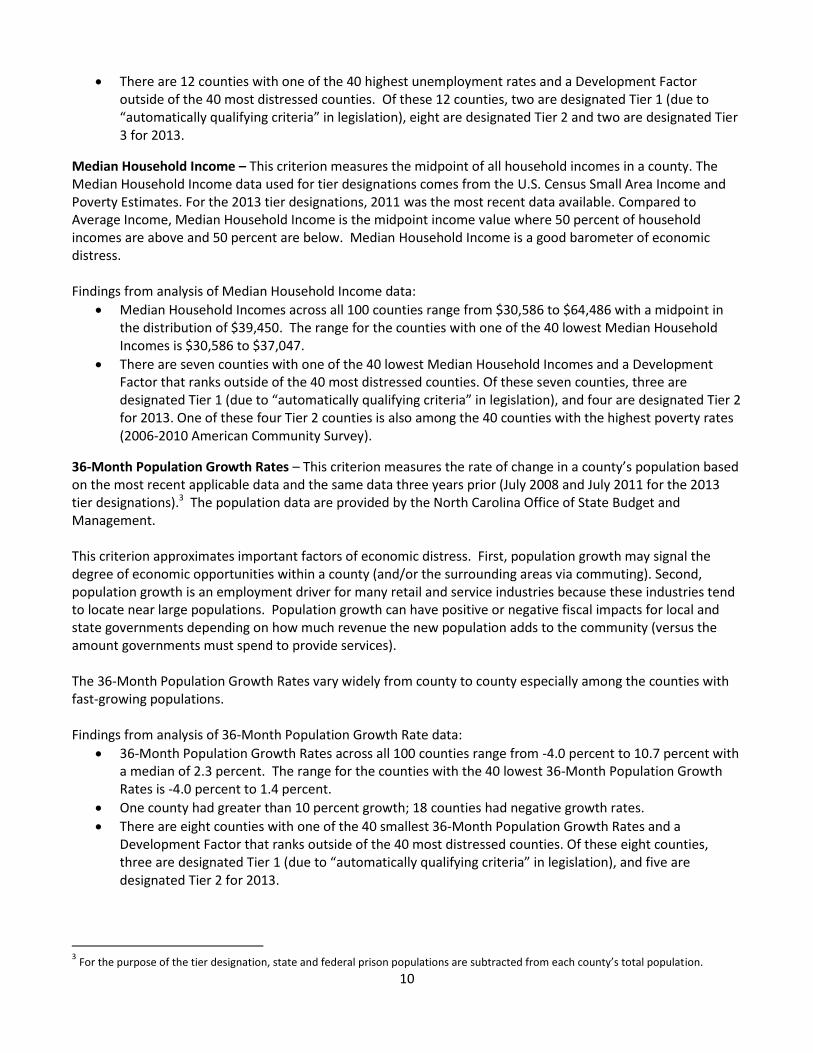
There are 12 counties with one of the 40 highest unemployment rates and a Development Factor outside of the 40 most distressed counties. Of these 12 counties, two are designated Tier 1 (due to “automatically qualifying criteria” in legislation), eight are designated Tier 2 and two are designated Tier 3 for 2013.
Median Household Income – This criterion measures the midpoint of all household incomes in a county. The Median Household Income data used for tier designations comes from the U.S. Census Small Area Income and Poverty Estimates. For the 2013 tier designations, 2011 was the most recent data available. Compared to Average Income, Median Household Income is the midpoint income value where 50 percent of household incomes are above and 50 percent are below. Median Household Income is a good barometer of economic distress. Findings from analysis of Median Household Income data:
Median Household Incomes across all 100 counties range from $30,586 to $64,486 with a midpoint in the distribution of $39,450. The range for the counties with one of the 40 lowest Median Household Incomes is $30,586 to $37,047.
There are seven counties with one of the 40 lowest Median Household Incomes and a Development Factor that ranks outside of the 40 most distressed counties. Of these seven counties, three are designated Tier 1 (due to “automatically qualifying criteria” in legislation), and four are designated Tier 2 for 2013. One of these four Tier 2 counties is also among the 40 counties with the highest poverty rates (2006-2010 American Community Survey).
36-Month Population Growth Rates – This criterion measures the rate of change in a county’s population based on the most recent applicable data and the same data three years prior (July 2008 and July 2011 for the 2013 tier designations).3 The population data are provided by the North Carolina Office of State Budget and Management. This criterion approximates important factors of economic distress. First, population growth may signal the degree of economic opportunities within a county (and/or the surrounding areas via commuting). Second, population growth is an employment driver for many retail and service industries because these industries tend to locate near large populations. Population growth can have positive or negative fiscal impacts for local and state governments depending on how much revenue the new population adds to the community (versus the amount governments must spend to provide services). The 36-Month Population Growth Rates vary widely from county to county especially among the counties with fast-growing populations. Findings from analysis of 36-Month Population Growth Rate data:
36-Month Population Growth Rates across all 100 counties range from -4.0 percent to 10.7 percent with a median of 2.3 percent. The range for the counties with the 40 lowest 36-Month Population Growth Rates is -4.0 percent to 1.4 percent.
One county had greater than 10 percent growth; 18 counties had negative growth rates.
There are eight counties with one of the 40 smallest 36-Month Population Growth Rates and a Development Factor that ranks outside of the 40 most distressed counties. Of these eight counties, three are designated Tier 1 (due to “automatically qualifying criteria” in legislation), and five are designated Tier 2 for 2013.
3 For the purpose of the tier designation, state and federal prison populations are subtracted from each county’s total population.

11
Adjusted Assessed Property Value Per Capita – This criterion is used to estimate the ability of counties to pay for public services. It accounts for each county’s tax base from real property, agricultural property, utility property and personal property. The most recent taxable year data (FY 2013-2014 for the 2013 tier designations) is provided by the Department of Public Instruction via the Low Wealth Supplemental Funding Formula. This figure is divided by population to create a per capita measure. One of the objectives of the Article 3J program is the “enlargement of the overall tax base.” The Development Factor represents a county’s ability to pay for services and infrastructure through the inclusion of the Adjusted Assessed Property Value Per Capita figure. This value varies widely from county to county, but changes relatively slowly over time, making it a good measure of long-term development. Findings from analysis of Adjusted Assessed Property Value Per Capita data:
The Adjusted Assessed Property Value Per Capita figure, across all 100 counties, ranges from $44,345 to $456,176 with a median of $89,356. The range for the 40 counties with the lowest AAPV value is $44,345 to $77,846.
There are 17 counties that are among the lowest 40 for Adjusted Assessed Property Value Per Capita, but are not among the 40 most distressed counties by Development Factor sum. Of these, 13 are designated Tier 2, two are designated Tier 1 (due to “automatically qualifying criteria” in legislation), and two are designated Tier 3.
Adjusted Assessed Property Value Per Capita and 36-Month Population Growth Rate exhibit a large average difference between each county’s rankings for the two criteria. This typically occurs in counties where a declining population artificially “boosts” the factor -- fewer people and a steady tax base means higher value per person.
Development Factor – The 12-Month Average Unemployment Rate, Median Household Income, 36-Month Population Growth Rate, and Adjusted Assessed Property Value Per Capita are combined to create a county Development Factor. This measure sums the ranking of all four criteria and represents the initial ordering of counties for tier designations (before “Adjustments for Certain Small Counties” and “Adjustments for Development Tier 1 Areas” are applied). The Development Factor provides a methodology for including multiple criteria in quantifying and comparing the relative economic distress of counties. Findings from analysis of relationships among criteria:
Rankings can obscure the degree of difference between two closely ranked counties. The differences between criteria values for two closely ranked counties are often greatest at the top and bottom of the distribution. For example, the highest Adjusted Assessed Property Value Per Capita value is 42.2 percent greater than the second highest value, while the second highest value is 9.1 percent higher than the third highest value.
There are seven counties with a Development Factor that ranks in the 40 most distressed counties that are designated Tier 2.
There are 11 counties that rank in the 40 most distressed counties for at least two criteria, but are designated Tier 2. Of these, three counties rank in the 40 most distressed counties for three criteria, but are designated Tier 2.
ALTERNATIVE MEASURES AND METHODOLOGIES State statute specifies which data are used in determining the development criteria, however other data are also available that could be used. This section presents alternative measures and methodologies for the Development Factor and the Tier Ranking System. In order to reduce the volatility of the tier ranking system (the degree to which counties move across tiers from year to year,) a number of alternative measures and methodologies have been suggested. These include using a

12
“Standardized Calculation” rather than the current “Absolute Calculation” for the assignment of tiers, as well as the addition and removal of several economic indicators in order to assess the effect on volatility. The following alternatives were examined: Use Standardized Scores Instead of Absolute Rankings to Determine Distressed County Sum – As mentioned earlier, rankings can obscure the degree of difference between two closely ranked counties. Adding together standardized scores instead of rankings for each Development Factor would allow the distressed county sum to better reflect a county’s status in the State compared to other counties without making a significant change to the tiers process. Also, since standardized scores are based on county values, they would be more sensitive to current county conditions than rankings. Remove Property Assessment Factor – While property value could be considered a proxy for the ability of a community to invest in physical infrastructure, it can be a misleading measurement. Counties with large parcels of federal owned land may appear more distressed than in actual fact due to lower average property values, while counties with large numbers of second homes may appear more prosperous because of higher property values, but year-round residents are actually less well-off. Alternative measures could include population density or private investment dollars per capita. Lengthen the Unemployment Rate Measurement to a 36-month Average – Extending the period of measurement for the unemployment rate will reduce the impact on tier ranks of singular events like plant closings while keeping the Development Factor responsive to those events. This will differentiate counties with chronic unemployment from those that suffer a short-term shock. Include Most Recent Poverty Rates – The percentage of a county’s residents living in poverty is a key measure of individual economic conditions. Adding poverty rates to the tier ranking formula would provide an important additional measurement of the county’s economic distress. The most recent measurement by the American Community Survey can be used to reflect current conditions by county. Remove Population Thresholds – Population growth over the preceding three years is used as a proxy for economic opportunities in the county and whether people (and jobs) are moving into the area. However, population thresholds are perceived as somewhat arbitrary cutoffs and may not contribute to the understanding of a county’s economic well-being as effectively as other measures. Conclusions: In order to assess the effect of using a new method of calculation as well as new combinations of economic indicators, a total of six new models were created and the results were compared to the past five years of actual tier rankings. Neither the standardized calculation nor substituting alternative criteria was found to meaningfully reduce volatility compared to the current model. In addition to these alternative measures, a decision to measure long-term and/or short-term economic distress could impact potential measures and tier ranking methodology. At present, the Article 3J Development Factor components are divided between long-term and short-term measures of economic distress. The authors note that in the tier designations, these two outlooks occasionally conflict.

13
PART 2: TIER DESIGNATIONS & COUNTIES WITH LOW POPULATIONS The second section of the Equity Study examines whether tier designations are equitable for counties with small populations. G.S. 143B-437.08 provides special provision for small counties via the section “Adjustment for Certain Small Counties,” which reads:
Regardless of the actual development factor, any county that has a population of less than 12,000 shall automatically be ranked one of the 40 highest counties, any county that has a population of less than 50,000 shall automatically be ranked one of the 80 highest counties, and any county that has a population of less than 50,000 and more than nineteen percent (19%) of its population below the federal poverty level according to the most recent federal decennial census4 shall automatically be ranked one of the 40 highest counties.
In the calculations for the 2013 economic development tiers, there are 47 counties that qualify for these adjustments (note: some counties that qualify for the top 80 and top 40 conditions also qualified for Tier 1 based on the Development Factor). Of the 39 counties with fewer than 50,000 in population, but greater than 12,000, 21 are designated Tier 1 and 18 are designated Tier 2 for 2013. All eight counties with fewer than 12,000 in population are designated Tier 1 for 2013. Based on the adjustments outlined above, the breakdown by condition is as follows:5
Population between 12,000 and 50,000 and poverty less than 19 percent (top 80) = 23 counties
Population between 12,000 and 50,000 and poverty greater than 19 percent poverty (top 40) = 16
counties
Fewer than 12,000 population (top 40) = 8 counties
4 Since the discontinuation of the Decennial Census Long Form, The US Census Bureau (Census) now collects economic data through the
American Community Survey (ACS). Census considers ACS to be a part of the Decennial Census Program. Both programs are governed by Title 13 of the U.S.C or the ‘Census Act’. 5 Regardless of poverty rate, all counties with fewer than 12,000 individuals are designated as Tier 1.

14
PART 3: EXISTING BUSINESS VERSES NEW BUSINESSES Part 3 examines the distribution of Article 3J tax credits between new and existing taxpayers to determine if new taxpayers are favored or receive more benefit. Article 3J tax credits are awarded to North Carolina companies based on their hiring and investment decisions. There is no implicit bias toward or against one type of company over another because any company meeting the specific program eligibility criteria may apply for the tax credits. There is no requirement on N.C. Department of Revenue forms to distinguish companies as either “new businesses” or as “existing businesses.” To determine if a taxpayer was either a “new business” or an “existing business” for the time period, the authors examined effective dates for companies generating 3J credits provided by the N.C. Department of Revenue6. If the taxpayer had an effective date of 2008 or later, the business was considered new7. Based on this methodology, 404 companies’ effective dates were identified out of all 410 businesses that generated Article 3J tax credits during DOR Process Years 2011 and 2012. Of those identified, 44 companies (11 percent) were identified as “new businesses” and 360 (89 percent) were identified as “existing businesses.”8
6 The effective date is the date the taxpayer's franchise or partnership account was set up with the NC Department of Revenue, and often
corresponds to the NC incorporation date reported by the Secretary of State. 7 The tax forms processed during Process Years 2011 and 2012 can include Tax Years 2009, 2010, and 2011. Therefore 2008 was chosen
as a base year to be considered a “new” business. 8 This methodology may understate the amount of new businesses in North Carolina for several reasons. For example, it is possible for an
existing business in North Carolina to start a new activity that may differ substantially enough to qualify as a “new” business or even industry, or for a smaller subsidiary of a company to exist in the state prior to a substantially larger related entity locating in the state.

15
IMPACT STUDY
PART 1: DISTRIBUTION OF TAX CREDITS ACROSS NEW AND EXISTING BUSINESSES AND BUSINESS TYPE Part 1 provides information on the distribution of Article 3J tax credits by new and existing businesses as well as business type. DISTRIBUTION OF ARTICLE 3J TAX CREDITS ACROSS NEW AND EXISTING BUSINESSES Article 3J tax credits are awarded to North Carolina companies based on their hiring and investment decisions. There is no implicit bias toward or against one type of company over another because any company meeting the specific program eligibility criteria may apply for the tax credits. There is no requirement on N.C. Department of Revenue forms to distinguish companies as either “new businesses” or as “existing businesses.” To determine if a taxpayer was either a “new business” or an “existing business” for the time period, the authors examined effective dates for companies generating 3J credits provided by the N.C. Department of Revenue.9 If the taxpayer had an effective date of 2008 or later, the business was considered new10. Based on this methodology, 404 companies’ effective dates were identified out of all 410 businesses that generated Article 3J tax credits during Process Years 2011 and 2012. Of those identified, 44 companies (11 percent) were identified as “new businesses” and 360 (89 percent) were identified as “existing businesses.”11 DISTRIBUTION OF ARTICLE 3J TAX CREDITS BY BUSINESS TYPE Businesses qualifying for 3J tax credits are required to fill out and submit to the Department of Revenue an Article 3J Qualifying Information form. This form provides space for each taxpayer to specify the type of qualifying business in which they are engaged. However, some taxpayers fail to properly report this information, resulting in some gaps in this data.
According to the information provided by taxpayers on submitted Article 3J Qualifying Information forms, Table 3 shows the distribution of business types generating a 3J credit during Process Years 2011-2012. The table also shows the distribution of jobs and investment associated with 3J credits over that same time period. This data makes it apparent that manufacturing establishments generate the largest portion of 3J tax credits. In addition, the wide majority of jobs and investment associated with 3J tax credits are generated through manufacturing businesses. Establishments engaged in all other business types accounted for only 29 percent of 3J tax credits, while creating 22 percent of jobs and 27 percent of business investment associated with 3J credits.
9 The effective date is the date the taxpayer's franchise or partnership account was set up with the NC Department of Revenue, and often
corresponds to the NC incorporation date reported by the Secretary of State. 10
The tax forms processed during Process Years 2011 and 2012 can include Tax Years 2009, 2010, and 2011. Therefore 2008 was chosen as a base year to be considered a “new” business. 11
This methodology may understate the amount of new businesses in North Carolina for several reasons. For example, it is possible for an existing business in North Carolina to start a new activity that may differ substantially enough to qualify as a “new” business or even industry, or for a smaller subsidiary of a company to exist in the state prior to a substantially larger related entity locating in the state.

16
Table 3: Article 3J Establishments, Jobs Created, and Investment by Business Type Process Years 2011-2012
Type of Business
% of
Establishments
% of
Jobs Created
% of
Investment
Manufacturing 71.0% 78.3% 72.6%
Wholesale trade 7.9% 1.4% 0.3%
Information technology and services 5.5% 6.6% 2.6%
Unspecified* 4.8% 1.5% 9.2%
Research and development 4.2% 3.4% 5.5%
Warehousing 2.9% 0.8% 3.3%
Company headquarters 1.3% 6.2% 3.5%
Aircraft maintenance and repair 1.0% 1.1% 2.9%
Customer service call center 0.6% 0.5% 0.0%
Motorsports racing team 0.4% 0.1% 0.0%
Electronic shopping and mail order house 0.1% 0.2% 0.0%
Motorsports facility 0.1% 0.0% 0.3%
Air courier services hub 0.0% 0.0% 0.0%
100.0% 100.0% 100.0%
*Bus iness Type not speci fied on tax forms
Source: Department of Revenue

17
PART 2: DIRECT COSTS AND BENEFITS OF ARTICLE 3J Part 2 provides an overview of the jobs and investment created and credits generated by the Article 3J Tax Credits for Growing Businesses Program. The N.C. Department of Revenue provided tax information based on tax returns from Process Years 2011 – 2012. The summary information provided here is not intended to be a comprehensive cost-benefit analysis as only direct costs and benefits are described. A summary of the dollar value of credits generated and taken by qualifying activity is presented as well as the associated jobs and investment created. While Article 3J is not entirely or solely responsible for these impacts, economic development tools such as Article 3J tax credits can incentivize business expansion and recruitment. SUMMARY OF CREDITS AND BENEFITS BY QUALIFYING ACTIVITY
12 Over the two year period from PY 2011 – PY 2012, Article 3J tax credits are associated with the creation of 16,962 jobs, over $4.3 billion in business property investment13, and over $39.2 million in real property investment.14 This activity generated $301.4 million in tax credits for eligible taxpayers. During this time period a total of $53.9 million of credits were taken by taxpayers. There is an important distinction between credits generated and credits taken. Credits generated are the maximum amount of credit earned by a taxpayer’s eligible spending activity during a specific reporting period. Credits taken represent only that amount which a particular taxpayer may take in a given tax year based on business profitability, tax liability, and required installment schedules. The Article 3J tax credits limit credits taken each year to 50 percent of the amount of tax against which it is claimed, reduced by the sum of all other tax credits allowed against that tax. In addition, credits for job creation and business property investment must be taken in equal installments over four years while credits for investing in real property must be taken in equal installments over seven years provided the taxpayer has sufficient tax liability to take the full amount of the installment. Unused credits may be carried forward for five to fifteen years. CREDIT FOR CREATING JOBS During PY 2011 – 2012, a total of 16,962 jobs were created by companies that applied for Article 3J tax credits, generating $85.6 million in tax credits for businesses. The majority of credits were generated in those counties identified as most distressed—Tier 1 counties. Job creation activity in Tier 2 counties generated $17.4 million in credits. Tier 3 counties generated $7.7 million in tax credits.
Table 4. Article 3J Jobs Created and Credits Generated by Tier Designation,
PY 2011-2012
Total Jobs Created
Credits Generated
Tier 1 4,817 $60,559,095
Tier 2 3,419 $17,397,000
Tier 3 8,726 $7,654,500
TOTAL 16,962 $85,610,595 Source: N.C. Department of Revenue
12
For a full description of the Article 3J tax credits including thresholds and requirements, please see the Introduction on p. 5. 13
In excess of applicable thresholds. 14
Only investments of at least $10 million creating 200 new jobs in Tier 1 counties are eligible for real property investment tax credits in Article 3J.

18
The following tables break out the job creation and credits generated through Article 3J by process year:
Table 5. Article 3J Jobs Created and Credits Generated, PY 2011
Total Jobs Created Credits Generated
Tier 1 1,877 $23,304,250
Tier 2 1,237 $6,249,000
Tier 3 3,145 $2,799,750
TOTAL 6,259 $32,353,000
Source: N.C. Department of Revenue
Table 6. Article 3J Jobs Created and Credits Generated, PY 2012
Total Jobs Created
Credits Generated
Tier 1 2,940 $37,254,845
Tier 2 2,182 $11,148,000
Tier 3 5,581 $4,854,750
TOTAL 10,703 $53,257,595
Source: N.C. Department of Revenue CREDIT FOR INVESTING IN BUSINESS PROPERTY For the two years that data are available (PY 2011-2012), over $4.3 billion was invested in business property related to Article 3J tax credits in excess of the applicable threshold amounts [Table 9]. During this period, over $1 billion was invested in Tier 1 counties. In Tier 2 counties, businesses investment totaled slightly over $651 million. Tier 3 counties accounted for $2.6 billion of business investment. The $4.3 billion of investment generated $204 million in tax credits for businesses. Tier 3 counties generated $99.7 million, followed by Tier 1 counties with $70.5 million in credits. Tier 2 counties accounted for the remaining $33.8 million in tax credits.
Table 9. Article 3J Investment in Business Property and Credits Generated by Tier Designation, PY 2011-2012
Total Investment Credits Generated
Tier 1 $1,028,276,407 $70,488,774
Tier 2 $651,659,504 $33,799,082
Tier 3 $2,632,812,741 $99,735,177
TOTAL $4,312,748,652 $204,023,033
Source: N.C. Department of Revenue

19
The following tables display the business property investment and credits generated for each of the two process years:
Table 10. Article 3J Investment in Business Property and Credits Generated by Tier Designation, PY 2011
Source: N.C. Department of Revenue
Table 11. Article 3J Investment in Business Property and Credits Generated, PY 2012
Total Investment Credits Generated
Tier 1 $472,580,619 $32,933,744
Tier 2 $504,239,133 $25,323,879
Tier 3 $1,477,934,780 $51,963,511
TOTAL $2,454,754,532 $110,221,134
Source: N.C. Department of Revenue
CREDIT FOR INVESTING IN REAL PROPERTY Only large investments in Tier 1 counties are eligible for the credit for investing in real property. The taxpayer must purchase and use at least $10 million of real property in an eligible business within a three-year period and create at least 200 new jobs within two years of the time the property is first used. The tax credit is 30 percent of the total investment amount and is claimed over a seven year period. For Process Years 2011 – 2012, $39.2 million of eligible investment in real property was made in Tier 1 counties, generating $11.8 million in credits [Table 13].
Table 13. Article 3J Investment in Real Property and Credits Generated, PY 2011-2012
Total Investment Credits Generated
PY 2011 $19,646,385 $5,893,915
PY 2012 $19,580,188 $5,874,057
TOTAL $39,226,573 $11,767,972
Source: N.C. Department of Revenue
Total Investment Credits Generated
Tier 1 $555,695,788 $37,555,030
Tier 2 $147,420,371 $8,475,203
Tier 3 $1,154,877,961 $47,771,666
TOTAL $1,857,994,120 $93,801,899

20
ARTICLE 3J CREDITS TAKEN Credits taken represent only that amount which a particular taxpayer may take in a given tax year based on business profitability, tax liability, and required installment schedules. Article 3J limits credits taken each year to 50 percent of the amount of tax against which it is claimed, reduced by the sum of all other tax credits allowed against that tax. In addition, credits for job creation and business property investment must be taken in equal installments over four years while credits for investing in real property must be taken in equal installments over seven years provided the taxpayer has sufficient tax liability to take the full amount of the installment. Unused credits may be carried forward. During Process Years 2011 and 2012, taxpayers have taken $53,920,821 worth of $301.4 million of credits generated.
Table 14. Value of Article 3J Credits Taken, PY 2011-2012
Year Job Creation Business Property
Investment
Real Property Investment
TOTAL
PY 2011 $3,321,157 $21,542,778 $595,728 $25,459,663
PY 2012 $5,417,293 $22,734,810 $309,055 $28,461,158
TOTAL $8,738,450 $44,277,588 $904,783 $53,920,821
Source: N.C. Department of Revenue

21
PART 3: BUSINESS RECRUITMENT AND EXPANSION-RELATED ACTIVITIES SINCE 2005 Part 3 assesses the Department of Commerce’s assigned and announced business recruitment and expansion-related activities for 2005 through 2012 by county, industry type, investment, and job creation. The following review of economic development activities — which is broader than Article 3J tax credit activity — encompasses projects and companies tracked by the Business and Industry Division. The Department of Commerce measures business recruitment and expansion-related activities in two ways. The first method tracks the number of projects assigned to business developers in any given year. Since business developers often work on individual projects for several years, the number of projects assigned annually is only a portion of their total activity. The second method tabulates announced capital investment and job creation for new and existing businesses. ASSIGNED BUSINESS DEVELOPMENT PROJECTS Since 2007, North Carolina has assigned an average of 419 new and expansion projects per year (Graph 1) to its business and industry developers. A project is designated as “new” if the business does not currently have any operations in North Carolina. An “expansion-related” project is defined as growth in workforce (including job retention) or investment at an existing company in the State. Companies new to North Carolina make up over half of all projects assigned.
Graph 1: Department of Commerce,
North Carolina Assigned Business Projects by Type, 2005-2012
Source: North Carolina Department of Commerce, Business & Industry 2013
2005 2006 2007 2008 2009 2010 2011 2012
309 284 235
279 255 270 244 237
145 139
156
160 178 167
155 152
New Projects Expansion-Related Projects
454 423
391
439 433 437 399 389

22
Announced Business Development Projects In 2012, the Department of Commerce announced 147 business projects (Graph 2). 55 percent of these announcements were expansions of existing businesses. Apart from 2006, expansion-related projects have consistently accounted for the majority of project announcements.
Graph 2: Department of Commerce, North Carolina Announced Business Projects by Type, 2005-2012
Source: North Carolina Department of Commerce, Business & Industry 2013
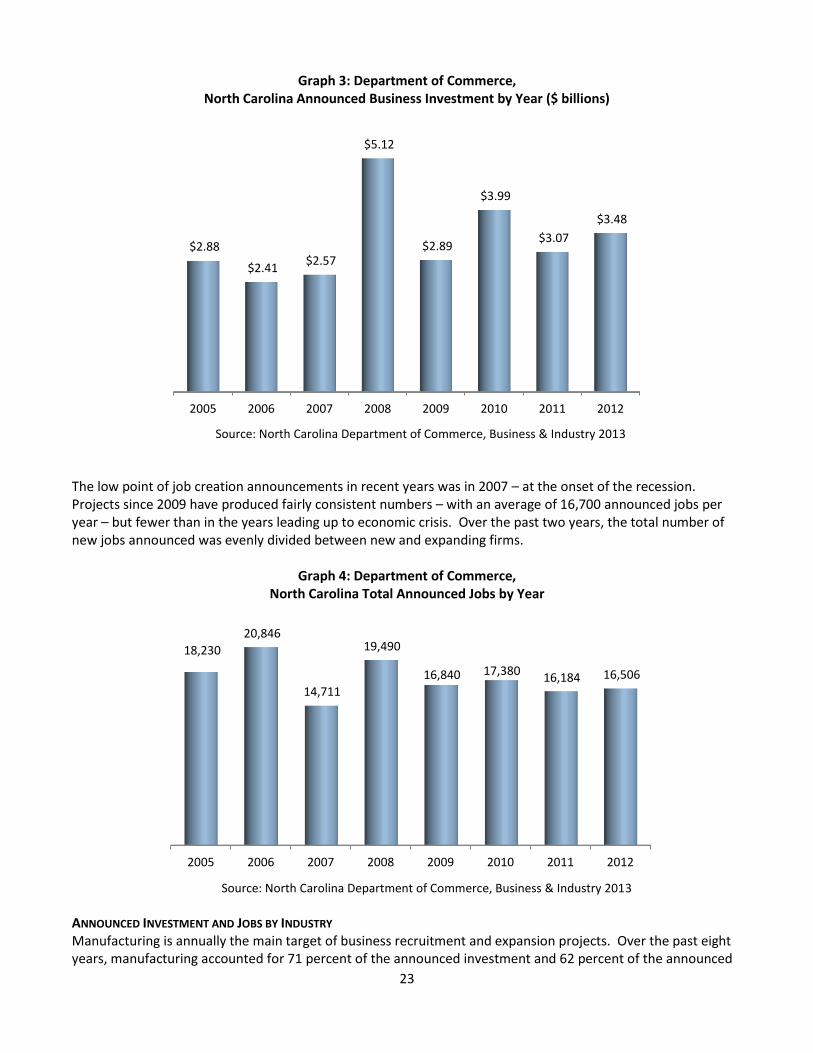
Announced business investment in 2012 totaled $3.48 billion (Graph 3), rebounding from a drop-off in 2011. 2012 represented the third highest investment over the past eight years. Between 2005 and 2007, expansion-related projects within existing companies were responsible for the majority of announced investment. However, in 2008, new businesses accounted for over 70 percent of announced investment. Similarly, new businesses generated 61 percent of all announced investment in 2010 and 64 percent in 2012. In 2009 and 2011, the ratio of announced investment was equally divided between new and existing businesses.
2005 2006 2007 2008 2009 2010 2011 2012
98 93 64 68 62 60 72 66
105 85
100 81 86 96
119
81
New Projects Expansion-Related Projects
178 164
149 148 156
191
147
203
23
Graph 3: Department of Commerce, North Carolina Announced Business Investment by Year ($ billions)
Source: North Carolina Department of Commerce, Business & Industry 2013 The low point of job creation announcements in recent years was in 2007 – at the onset of the recession. Projects since 2009 have produced fairly consistent numbers – with an average of 16,700 announced jobs per year – but fewer than in the years leading up to economic crisis. Over the past two years, the total number of new jobs announced was evenly divided between new and expanding firms.
Graph 4: Department of Commerce, North Carolina Total Announced Jobs by Year
Source: North Carolina Department of Commerce, Business & Industry 2013
ANNOUNCED INVESTMENT AND JOBS BY INDUSTRY Manufacturing is annually the main target of business recruitment and expansion projects. Over the past eight years, manufacturing accounted for 71 percent of the announced investment and 62 percent of the announced
2005 2006 2007 2008 2009 2010 2011 2012
$2.88
$2.41 $2.57
$5.12
$2.89
$3.99
$3.07
$3.48
2005 2006 2007 2008 2009 2010 2011 2012
18,230
20,846
14,711
19,490
16,840 17,380 16,184 16,506

24
new jobs in the Department of Commerce’s projects. Between 2005 and 2012, the following sectors have also been significant contributors to announced investments and jobs, but at much lower levels: Information (9%); Professional, Scientific, & Technical Services (5 percent); Wholesale Trade (4%); and Transportation & Warehousing (3%). Over the same time horizon, the following industries contributed to announced job creation: Professional, Scientific, & Technical Services (10%); Administrative & Support & Waste Management (5%); Finance & Insurance (5%); Information (4%); and Wholesale Trade (4%). In 2012, 71 percent of announced investment and 64 percent of announced jobs originated from the manufacturing sector. Graph 5 illustrates the ratio of announced job creation by sector since 2005.
Graph 5: Department of Commerce, North Carolina Announced Job Creation by Industry and Year
Source: North Carolina Department of Commerce, Business & Industry 2013
In addition to Manufacturing, the Information sector has significantly contributed to new job and investment announcements in recent years – particularly in investment. Graph 6 illustrates the ratio of industry-announced investment by year.
0%
10%
20%
30%
40%
50%
60%
70%
80%
90%
100%
2005 2006 2007 2008 2009 2010 2011 2012
Manufacturing
Professional, Scientific, andTechnical Services
Administrative andSupport / Waste Mgmt
Information
Transportation andWarehousing
Wholesale Trade
All Other Sectors

25
Graph 6: Department of Commerce, North Carolina Announced Investment by Industry and Year
Source: North Carolina Department of Commerce, Business & Industry 2013
Announced Investment and Jobs by County Appendix A contains a table that illustrates announced investment and job creation by county. The counties with the largest populations and workforces consistently had the largest amounts of announced business activity. In all, the Department of Commerce worked with over 1,300 companies that announced capital investment and/or job creation in 92 counties across the state between 2005 and 2012.
0%
10%
20%
30%
40%
50%
60%
70%
80%
90%
100%
2005 2006 2007 2008 2009 2010 2011 2012
Manufacturing
Professional,Scientific, andTechnical Services
Information
Wholesale Trade
Transportationand Warehousing
All Other Sectors

26
PART 4: USE OF INCENTIVES BY OTHER STATES State and local governments and regional and local economic development agencies have developed a variety of tools to support business expansion, aid small businesses and entrepreneurs, and recruit relocating firms. Statutory and discretionary tax incentives are among the most essential of those tools, and they are widely used by North Carolina and its neighboring states. This section compares North Carolina’s three types of tax credits offered under the Article 3J program to those offered in neighboring states. It also describes the use of incentives in business development and examines whether their importance in recruitment relocation and expansion decisions is increasing. This section notes that while the use of incentives as an economic development tool is commonplace, a broader set of strategies that includes business retention and small business support have also grown in importance. In addition to tax credits and grants, many states make use of local and state tax abatements, ports tax credits, workforce training tax credits, targeted rural economic development tools, technology development incentives and tax exemptions. STATUTORY TAX INCENTIVE PROGRAMS WIDELY USED IN NEIGHBORING STATES North Carolina’s regional competitors for attracting new companies, investment, and jobs— Georgia, Florida, South Carolina, Tennessee, and Virginia – include statutory incentives in their economic development toolboxes. The types of tax credits Article 3J provides to eligible taxpayers in North Carolina—Credit for Job Creation, Credit for Investment in Business Property, and Credit for Real Property Investment—are similar to those offered in neighboring states. Table 15 shows North Carolina’s neighboring states with statutory incentives that are functionally equivalent to North Carolina’s Article 3J.
Table 15: State Corporate Income Tax Credits Similar to North Carolina's 3J Credits
Job Creation Tax Credit – Most Southeastern states offer an incentive for job creation but the size, duration, and eligible industries vary. Florida’s Qualified Target Industry Tax Refund is that state’s most widely used job creation incentive. Georgia has three job credits: the Quality Job Tax Credit for companies that create jobs that pay wages at least 110% of the county average, the Mega Project Tax
Job Creation Tax Credit Capital Investment Tax Credit Real Property Tax Credit
North Carolina 3J Credit for Creating Jobs3J Credit for Investing in Business
Property
3J Credit for Investment in Real
Property
Georgia
Quality Jobs Tax Credit, Mega Project
Tax Credit, Qualified Business
Expansion Credit
Manufacturer's Investment Tax Credit N/A
Florida
Enterprise Zone Jobs Tax Credit,
Qualified Target Industry Refund,
Urban Job Tax Credit, Rural Job Tax
Credit, Jobs for the Unemployed Tax
Credit
Capital Investment Tax Credit,
Manufacturing and Spaceport
Investment Incentive Refund
Enterprise Zone Property Tax Credit
South CarolinaJob Tax Credit, Corporate
Headquarters Credit
Credit for Investing in an Economic
Impact Zone, Recycling Facility Tax
Credits
Corporate Headquarters Credit
Tennessee
Jobs Tax Credit, Rural Opportunity
Initiative Enhanced Job Tax Credit,
Jobs Tax Super Credit, Headquarters
Tax Credit
Industrial Machinery Tax Credit, Data
Center Tax CreditHeadquarters Tax Credit
VirginiaMajor Business Facility Job Tax Credit,
Enterprise Zone Job Creation GrantRecycling Equipment Tax Credit
Enterprise Zone Real Property
Investment Grant
27
Credit for projects making particularly large investments in the state, and Qualified Business Expansion Credit. Capital Investment Tax Credit – These credits are offered to encourage firms to expand and/or purchase equipment. Across states, they differ in size and duration. Some restrictions include the length of time a company needs to exist before receiving the incentive. For example, the Tennessee Industrial Machinery Tax Credit is three years, but may be expanded to five years for businesses investing less than $1 billion and to seven years for businesses investing $1 billion or more. Real Property Tax Credit – A number of states provide incentives for real property investment which, in some cases, is tied to capital investment tax credits or offered only in an enterprise zone (or county tier) program. In Virginia and Florida, real property credits are associated with enterprise zones, which are specific, distressed geographic areas targeted for economic revitalization. Other Tiered Systems – Like North Carolina, Georgia and South Carolina use a county tier system to rank its counties based on the level of economic distress to determine the size of various incentive awards.
ROLE OF INCENTIVES IN THE ECONOMIC DEVELOPMENT PROCESS Tax incentives remain a key focus of economic development policy. Area Development magazine’s 27th Annual Corporate Survey and 9th Annual Consultant Survey provides insight into which factors business executives and consultants consider most important when making site location decisions.15 Slightly more than half (54 percent) of executives say their companies have received and utilized incentives in the past. According to the survey, 70 percent of executives felt that incentives were very or somewhat important to location in a particular location. Among particular types of incentives considered most important when making a location decision, 69 percent of executives chose tax incentives (such as tax credits and exemptions). Among the consultants, 61 percent said incentives have always been of great importance to their clients, while 31 percent responded that incentives were more important now than in the past. Of the types of incentives clients considered when making a location decision, 74 percent of consultants listed tax incentives (such as tax credits and exemptions), making it the largest single type of incentive. An emphasis on incentives by consultants is not surprising, however, considering that negotiating incentives was listed as the second largest service provided to clients by the consultants (after location studies). However, the ranking of tax incentives as a top site selection factor in the corporate survey has fallen over the past few years—from #3 in 2011 to #9 in 2013 among executives. According to the authors of the survey, this may reflect the realization that “incentives can’t make up for high labor costs, poor highway access, a lack of skilled labor, or high energy or occupancy costs, i.e., they can’t make a bad deal good. Consequently, the respondents have adjusted their priorities,” (Area Development Magazine Special Presentation Q1 / Winter 2013). Therefore, while tax incentives remain important in states’ economic development portfolios, these survey results suggest that their importance may have recently been superseded by a variety of other economic development considerations. In addition to statutory incentives like Article 3J, North Carolina has made broad use of performance based discretionary incentives via the One North Carolina Fund and the Job Development Investment Grant program. Recent Department of Commerce research suggests that discretionary incentives remain a highly relevant part of economic development decisions among North Carolina’s competitor states. The special economic
15
The surveys included 200 executives, the majority of whom represented manufacturing firms, and 120 site consultants.

28
development-related packages used to entice particular companies often greatly enhance the economic development tools that are in statute. Most of North Carolina’s competitor states employ the use of “deal closing funds,” pools of discretionary cash used to attract and retain highly valued businesses and generally administered by governors’ offices. In addition, Florida, South Carolina, and Virginia all utilize performance-based discretionary grant programs similar to North Carolina’s Job Development Investment Grants (JDIG) program. These programs typically link grant awards to the jobs and business investment associated with particular projects. Additionally, a host of other incentives are deployed by various neighboring states, including job retention and job training grants. USE OF INCENTIVE INCREASING OR DECLINING North Carolina is certainly not alone in its use of statutory tax credits and discretionary economic development tools to support business expansion and recruitment. Nevertheless, it is difficult to determine the extent to which states’ use of incentives is increasing or declining. Attempts to aggregate state incentives data have been made by Good Jobs First, through their Subsidy Tracker, and recently through a New York Times generated database. However, these data sources are not comprehensive and do not track states’ incentives over consistent timelines (making it impossible truly compare states). Data collection on state incentives is made difficult for several reasons. First, the transparency and comprehensive nature of incentives reporting varies significantly across states. Some states report on certain economic development incentives, while neglecting others, resulting in an incomplete picture of incentives use. For instance, Virginia reports on business incentive payments and corporate income tax incentives, but does not seem to provide information on sales and use tax exemptions. In addition, incentives data is not considered public information in every state. Second, states differ widely in their methodology used to evaluate tax incentives. Some states use tax returns processed from previous years to generate actual costs associated with tax incentives, while other states project future values of tax expenditures. Third, determining what constitutes an economic development incentive is subjective. Most observers would consider cash grants to companies relocating jobs and investment to a particular state to be an economic development incentive. However, other incentives present a more nuanced approach to economic development, such as the exemption of certain business activities from sales taxes or the provision of job training funding to ensure that new or expanding businesses are able to properly staff new operations. Opinions may differ concerning the inclusion of these (and other) types of expenditures in an economic development or business incentives category. Coverage from media, business journals, and trade publications, suggest that there are more tax incentives offered today than ever. In late 2012, Area Development made the point that incentives have always been important to corporate site selectors.16 However, they point out that since the recent recession, depressed resources have caused states and localities to become more selective with economic incentives.17 States are increasingly tying incentive payments to job creation and business investment performance. States are also working to target preferred industries best suited for the regions and workforce. In May 2012, Site Selection magazine suggested that recent years have seen an increased number of states employing the use of “deal closing funds,” pools of discretionary cash used to attract and retain highly valued businesses.18 However, it may be the case that recently increased media scrutiny of states’ use of incentive packages to recruit companies has simply heightened public awareness of incentives use.
16
“Tax Rates, Exemptions, & Incentives: States Up their Game to Close Deals,” Area Development Online, November 2013. 17
“Economic Developers Working “Smarter” With Incentives,” Area Development Online, Winter 2013. 18
“Sealing the Deal,” Site Selection, May 12, 2012.

29
In a recent report for Michigan’s economic development public-private partnership, Angelou Economics suggests that recent years have seen states across the country take differing stances on the use of cash incentives oriented to the near-term versus delayed cash incentives. While many states have become more enthusiastic in their use of closing funds and similar incentive tools, other states have focused on less cash-intensive incentives due to tightening fiscal conditions.

30
APPENDICES APPENDIX A: Announced Investment and Jobs by Year and County (investment in $1,000s)
2005 2006 2007 2008 2009 2010 2011 2012
County Investment Jobs Investment Jobs Investment Jobs Investment Jobs Investment Jobs Investment Jobs Investment Jobs Investment Jobs
Alamance $7,600 190 $9,700 159 $33,500 130 $86,500 81 $7,000 42 $12,200 381 $0 - $34,275 399
Alexander $12,000 65 $0 0 $0 0 $275 65 $13,900 168 $0 0 $0 - $0 -
Alleghany $0 46 $0 0 $0 0 $0 0 $0 0 $0 0 $0 - $0 -
Anson $0 0 $0 0 $0 0 $10,300 87 $5,500 115 $0 0 $0 - $0 -
Ashe $40,400 307 $0 0 $26,000 0 $0 0 $0 0 $0 0 $4,600 58 $0 -
Avery $0 0 $0 0 $0 0 $0 0 $0 0 $0 0 $0 - $9,000 25
Beaufort $164,407 506 $5,500 65 $18,510 293 $14,000 270 $1,950 46 $9,650 738 $4,000 32 $15,600 172
Bertie $500 3 $0 0 $0 0 $0 0 $500 7 $0 0 $7,500 48 $0 -
Bladen $21,950 186 $81,300 251 $3,000 120 $1,500 79 $0 0 $0 0 $0 - $0 -
Brunswick $78,550 135 $12,000 34 $52,300 883 $0 0 $0 0 $4,800 8 $9,500 84 $33,000 105
Buncombe $80,000 123 $30,000 264 $23,000 220 $1,700 50 $9,845 136 $195,200 780 $117,446 611 $205,335 564
Burke $113,400 761 $14,050 102 $19,300 61 $33,400 243 $3,750 109 $7,920 348 $27,986 301 $13,300 242
Cabarrus $200,000 0 $46,526 712 $2,150 50 $15,000 500 $0 0 $83,800 246 $184,550 1,678 $47,000 200
Caldwell $0 380 $23,100 287 $15,000 509 $62,000 872 $14,385 127 $19,790 357 $3,330 68 $15,660 359
Camden $0 0 $0 0 $6,600 60 $0 0 $0 0 $0 0 $0 - $0 -
Carteret $13,000 60 $0 0 $0 0 $0 0 $0 0 $0 0 $0 - $0 -
Caswell $0 0 $2,100 24 $500 50 $0 0 $0 0 $0 0 $0 - $0 -
Catawba $52,700 728 $121,125 745 $0 0 $10,940 1,848 $1,008,500 799 $24,750 613 $26,900 505 $40,205 131
Chatham $25,500 65 $0 0 $1,000 14 $142,000 104 $1,000 24 $2,000 30 $0 - $2,910 86
Cherokee $1,000 25 $0 0 $19,050 99 $0 0 $2,000 40 $0 0 $5 28 $0 -
Chowan $3,700 62 $0 0 $6,000 41 $0 0 $5,400 44 $1,500 15 $5,000 46 $0 -
Clay $1,000 10 $0 0 $250 15 $450 12 $0 0 $0 0 $0 - $0 -
Cleveland $16,500 60 $71,240 956 $8,800 310 $29,350 222 $11,979 129 $342,700 362 $185,870 102 $916,300 638
Columbus $10,200 158 $32,700 230 $66,800 74 $4,060 72 $4,400 92 $0 0 $25,000 38 $26,600 64
Craven $24,000 123 $12,250 237 $5,000 50 $12,000 100 $53,000 6 $4,700 350 $52,030 149 $1,691 38
Cumberland $81,100 15 $3,900 30 $200,000 50 $204,500 75 $117,748 784 $3,500 3 $7,000 79 $63,536 548
Currituck $0 0 $0 0 $0 0 $0 0 $0 0 $0 0 $0 - $0 -
Dare $0 0 $0 0 $0 0 $0 0 $0 0 $0 0 $0 - $2,000 71
Davidson $12,500 80 $4,100 200 $32,700 788 $1,000 100 $12,000 328 $35,900 393 $2,000 225 $5,500 10
Davie $27,000 40 $10,500 143 $0 0 $4,000 24 $850 128 $31,700 169 $55,950 222 $107,300 750
Duplin $0 0 $0 0 $0 0 $0 0 $0 0 $18,407 94 $6,000 0 $0 -
Durham $197,500 1,003 $342,872 1,518 $102,929 932 $653,450 493 $448,283 1,726 $248,600 1,483 $226,200 612 $214,500 332

31
2005 2006 2007 2008 2009 2010 2011 2012
County Investment Jobs Investment Jobs Investment Jobs Investment Jobs Investment Jobs Investment Jobs Investment Jobs Investment Jobs
Edgecombe $0 0 $4,410 133 $7,000 100 $0 0 $5,650 155 $6,600 485 $142,980 672 $0 -
Forsyth $86,950 139 $26,306 171 $25,000 24 $50,358 501 $65,150 322 $426,000 392 $2,620 575 $286,100 1,270
Franklin $1,000 10 $5,500 0 $28,850 130 $3,300 10 $9,100 72 $0 0 $0 - $11,167 0
Gaston $209,000 700 $0 0 $0 0 $0 0 $0 0 $5,700 41 $73,500 186 $7,000 83
Gates $0 0 $0 0 $0 0 $0 0 $0 0 $0 0 $0 - $0 -
Graham $150 2 $0 0 $0 0 $2,000 205 $0 0 $5,400 0 $0 - $980 94
Granville $18,000 180 $0 0 $50,000 0 $0 0 $17,000 42 $0 0 $35,000 35 $0 -
Greene $0 0 $0 0 $6,465 89 $0 0 $0 0 $0 0 $0 - $0 -
Guilford $42,189 524 $117,100 1,165 $642,700 1,297 $155,425 1,893 $80,000 510 $479,250 542 $121,400 1,001 $179,751 1,547
Halifax $14,100 116 $1,686 81 $7,000 65 $0 0 $9,000 124 $65,000 700 $2,850 54 $110,000 350
Harnett $4,200 60 $0 0 $2,361 13 $0 0 $0 0 $0 0 $4,500 112 $0 -
Haywood $6,030 82 $0 0 $0 0 $0 0 $0 0 $3,500 75 $12,250 49 $0 -
Henderson $24,000 110 $5,000 50 $0 0 $700 30 $30,157 338 $0 0 $5,360 109 $112,000 170
Hertford $0 0 $0 0 $0 0 $0 0 $0 0 $52,000 53 $85,000 112 $2,000 45
Hoke $400 50 $20,700 67 $112,000 176 $800 27 $7,200 40 $0 0 $35,000 65 $29,900 21
Hyde $56,078 125 $0 0 $0 0 $0 0 $3,000 12 $0 0 $150 5 $350 5
Iredell $142,000 579 $8,500 150 $51,000 203 $213,428 337 $8,200 135 $42,000 237 $124,100 296 $95,350 166
Jackson $0 0 $0 0 $0 0 $0 0 $16,691 61 $0 0 $500 125 $0 -
Johnston $60,500 687 $7,600 118 $18,900 20 $0 0 $14,500 57 $198,400 465 $4,000 43 $33,000 199
Jones $0 0 $2,000 25 $400 50 $0 0 $0 0 $0 0 $0 - $0 -
Lee $0 0 $28,000 484 $20,000 42 $7,000 10 $0 0 $70,892 780 $15,040 103 $13,138 76
Lenoir $45,400 363 $4,250 37 $31,750 340 $1,035,764 3,063 $60,400 97 $12,400 344 $120,300 338 $0 -
Lincoln $52,100 100 $20,000 181 $0 0 $19,500 45 $0 0 $16,300 50 $58,400 372 $30,345 490
Macon $0 0 $0 0 $3,000 50 $2,600 32 $0 0 $0 0 $0 - $0 -
Madison $0 0 $0 0 $0 0 $0 0 $0 0 $0 0 $0 - $0 -
Martin $0 0 $600 65 $4,000 100 $4,630 310 $3,000 81 $0 0 $0 - $7,490 220
Mc Dowell $12,400 420 $1,200 25 $3,250 317 $4,350 58 $10,550 201 $4,910 171 $23,736 164 $550 64
Mecklenburg $100,662 1,730 $110,850 1,253 $8,500 849 $180,590 2,123 $117,640 4,975 $453,430 3,133 $228,502 2,251 $236,779 1,682
Mitchell $900 206 $0 0 $2,300 70 $0 0 $0 0 $0 0 $0 - $1,100 70
Montgomery $42,300 77 $0 0 $0 0 $5,500 23 $100,000 100 $0 0 $15,300 146 $500 50
Moore $0 0 $11,662 240 $4,000 86 $0 0 $2,330 72 $2,700 98 $0 - $1,000 22
Nash $39,070 1,612 $73,100 622 $16,825 155 $3,350 108 $0 0 $0 0 $0 - $89,785 277
New Hanover $144,000 219 $136,000 857 $25,000 25 $1,174,500 1,097 $25,000 30 $0 0 $15,000 25 $3,500 30
Northampton $6,169 43 $21,500 288 $0 0 $212,000 45 $100 0 $0 0 $0 - $7,000 42
Onslow $12,000 350 $0 600 $300 35 $0 0 $0 0 $1,250 30 $0 - $0 -
Orange $6,780 120 $1,250 15 $2,640 25 $0 0 $8,500 72 $0 0 $3,300 90 $2,000 25

32
2005 2006 2007 2008 2009 2010 2011 2012
County Investment Jobs Investment Jobs Investment Jobs Investment Jobs Investment Jobs Investment Jobs Investment Jobs Investment Jobs
Pamlico $0 0 $0 0 $0 0 $0 0 $0 0 $0 0 $0 - $0 -
Pasquotank $0 0 $0 0 $6,000 124 $0 0 $10,000 100 $2,900 63 $3,200 10 $0 -
Pender $4,800 55 $0 0 $5,000 55 $3,000 30 $0 0 $650 40 $0 - $0 -
Perquimans $0 0 $0 0 $0 0 $0 0 $0 0 $0 0 $0 - $0 -
Person $0 0 $7,850 130 $35,200 277 $0 0 $900 375 $191,700 312 $29,500 120 $24,100 131
Pitt $55,000 310 $90,320 215 $7,500 165 $0 0 $5,700 40 $0 0 $16,100 35 $71,100 40
Polk $0 0 $0 0 $820 28 $0 0 $0 0 $0 0 $0 - $860 25
Randolph $78,411 460 $104,000 171 $0 0 $28,000 222 $900 20 $169,300 530 $30,200 144 $0 -
Richmond $5,000 67 $73,500 225 $45,000 212 $32,000 42 $5,125 189 $19,000 250 $2,000 64 $6,675 122
Robeson $41,100 840 $37,250 463 $21,200 205 $13,500 187 $750 25 $30,786 306 $4,500 342 $0 -
Rockingham $49,600 275 $35,800 267 $115,113 389 $5,400 37 $3,840 45 $42,200 245 $10,417 249 $7,400 55
Rowan $2,000 135 $31,000 752 $82,000 45 $600 46 $49,224 529 $30,800 387 $63,600 114 $71,108 1,579
Rutherford $8,900 97 $8,168 551 $27,155 254 $3,100 1,300 $5,000 55 $463,497 95 $364,300 601 $19,200 707
Sampson $1,650 30 $775 10 $4,200 130 $200,000 100 $0 0 $12,511 65 $12,250 128 $4,250 90
Scotland $23,125 58 $0 0 $0 0 $19,300 175 $13,200 133 $600 45 $24,000 41 $59,650 187
Stanly $0 0 $9,000 87 $0 0 $21,400 182 $0 0 $11,300 74 $4,400 197 $0 -
Stokes $0 0 $0 0 $71,000 65 $30,000 0 $0 0 $0 0 $0 - $0 -
Surry $34,500 238 $5,200 146 $0 0 $140,030 82 $10,895 351 $4,500 38 $100,103 443 $8,420 45
Swain $0 0 $0 0 $0 0 $0 20 $0 0 $0 0 $0 - $0 -
Transylvania $20,000 110 $0 0 $0 0 $0 0 $0 0 $0 0 $500 15 $18,000 105
Tyrrell $0 0 $0 0 $0 0 $0 0 $0 0 $0 0 $0 - $0 -
Union $0 0 $41,760 451 $267,900 347 $4,000 4 $600 5 $27,350 101 $2,200 24 $2,300 36
Vance $9,300 220 $2,000 100 $1,750 18 $16,000 5 $2,314 345 $3,000 152 $89,700 256 $0 -
Wake $218,440 1,037 $473,900 3,628 $143,700 3,036 $120,050 1,498 $430,400 1,966 $47,110 491 $143,400 956 $89,950 1,237
Warren $0 0 $0 0 $0 0 $0 0 $0 0 $0 0 $0 - $0 -
Washington $250 1 $0 0 $0 0 $0 0 $5,330 144 $0 0 $0 - $0 -
Watauga $0 0 $0 0 $0 0 $0 0 $0 0 $0 0 $1,080 10 $0 -
Wayne $11,500 436 $6,200 182 $2,000 58 $7,875 122 $0 0 $0 0 $17,914 137 $3,000 44
Wilkes $1,500 42 $4,000 0 $0 0 $3,000 12 $0 0 $28,800 200 $4,800 114 $16,350 339
Wilson $6,300 84 $50,300 884 $5,300 123 $108,000 92 $0 0 $0 0 $15,400 85 $60,458 32
Yadkin $0 0 $0 0 $13,000 170 $7,000 120 $27,000 172 $8,000 20 $48,700 285 $0 -
Yancey $0 0 $0 0 $0 0 $0 0 $0 0 $0 0 $0 - $0 -
Totals $2,882,261 18,230 $2,411,199 20,846 $2,569,468 14,711 $5,124,475 19,490 $2,886,336 16,840 $3,986,852 17,380 $3,067,918 16,184 $3,477,317 16,506
Source: North Carolina Department of Commerce, Business & Industry Division, 2013
33
APPENDIX B: Legislative Requirements for Tax Credits for Growing Businesses Act, 2013 Report § 105-129.82. (See notes) Sunset; studies.
(a) Sunset. – This Article is repealed effective for business activities that occur on or after January 1, 2014. (b) Equity Study. – The Department of Commerce shall study the effect of the tax incentives provided in this Article on tax equity. This study shall include the following:
(1) Reexamining the formula in G.S. 143B-437.08 used to define development tiers, to include consideration of alternative measures for more equitable treatment of counties in similar economic circumstances. (2) Considering whether the assignment of tiers and the applicable thresholds are equitable for smaller counties. (3) Compiling any available data on whether expanding North Carolina businesses receive fewer benefits than out-of-State businesses that locate to North Carolina.
(c) Impact Study. – The Department of Commerce shall study the effectiveness of the tax incentives provided in this Article. This study shall include:
(1) Studying the distribution of tax incentives across new and expanding businesses and industries. (2) Examining data on economic recruitment for the period from 2005 through the most recent year for which data are available by county, by industry type, by size of investment, and by number of jobs, and other relevant information to determine the pattern of business locations and expansions before and after the enactment of this Article. (3) Measuring the direct costs and benefits of the tax incentives. (4) Compiling available information on the current use of incentives by other states and whether that use is increasing or declining.
(d) Report. – The Department of Commerce shall report the results of these studies and its recommendations to the General Assembly biennially with the first report due by June 1, 2009. (2006-252, s. 1.1; 2010-147, s. 1.1; 2012-36, s. 5.)