tax evasion and productivity: do –rms escape epl … · tax evasion and productivity: do –rms...
TRANSCRIPT
Tax evasion and productivity: do firms escape EPL through
informality? Evidence from a regression discontinuity design∗
Giuseppina Gianfreda†
Università della Tuscia and LLEE
Giovanna Vallanti ‡
LUISS "Guido Carli" and LLEE
April 12, 2017
Abstract
Tax compliance has costs and benefits which may depend on the institutional environment
in which firms operate. The relationship between tax evasion and productivity is not always
unambiguous and firm size can be a crucial issue whenever firms are constrained by the institu-
tional framework in a measure that depends on their size. We argue that firms may respond to
string employment protection legislation through accrued informality thus (partially) offsetting
the negative effect of tax evasion on productivity. We exploit the Italian dismissal legislation
imposing higher firing costs for firms with more than 15 workers and show that tax evasion
reduces job turnover for firms above the 15 workers threshold; furthermore, while the overall
effect of tax evasion on firms’productivity is negative, the differential effect for firms above the
threshold as compared to smaller firms is positive and significant.
Key words: tax evasion, EPL, productivity, firm size, RD estimation
JEL Classification: D02; D22; D24
∗We thank Barbara Petrongolo, Giovanni Notaro and Fabiano Schivardi for their useful comments and suggestionsand the seminar participants to the SIDE meeting in Turin and AIEL meeting in Trento. We are also grateful toValeria Foroni of the Italian Ministry of Justice and Silvia Dini of the Consiglio Superiore della Magistratura for theirhelp with the courts’data. All errors are ours.†Giuseppina Gianfreda, Università della Tuscia, DISUCOM, via Santa Maria in Gradi, 4. Phone: +390761357887.
Email: [email protected].‡Corresponding author: Giovanna Vallanti. Università LUSS "Guido Carli", Department of Economics and Fi-
nance, viale Romania 32, Rome 00197, Italy. Phone: +390685225910. Email: [email protected].
1 Introduction
Tax and social security evasion is a common phenomenon in both developing and developed countries.
The informal sector accounts for 10% to 20% of GDP in most OECD countries, 20% to 30% in
Southern European OECD countries and in Central European transition economies (Schneider and
Enste, 2000). The incidence of informality varies considerably both across and within countries.
Many factors explain this cross-country variation: (1) the level of taxation and fiscal regulations
(Loayza, 1996; Friedman et al., 2000; Loayza et al., 2005; Packard et al, 2012); (2) the strictness
of labour and product market regulations (Botero et al, 2003; Djankov et al., 2002; Loayza et al.,
2005; Packard et al, 2012); (3) the quality of institutions (Friedman et al., 2000; Scheneider, 2000;
Loayza et al., 2005; Packard et al, 2012).
In the recent literature, a growing attention has been devoted to tax compliance and informality
as a determinant of firms performance and, ultimately, of aggregate growth.1 The empirical evidence
shows that informality is detrimental for firms’productivity even when it is just partial. This may
occur for a number of reasons. Informal firms have a limited access to capital markets (Cull et al.,
2007) and to market support institutions and law enforcement (World Bank, 2007). Moreover, they
tend to invest less both in physical and human capital (Gandelman and Rasteletti, 2013). However,
if there are several reasons to believe that tax evasion and informality undermine productivity, firms
can resort to informality to cope with excess regulatory pressure. If this is the case the effect of tax
evasion on productivity may not be so clear cut. Indeed, formality implies costs which go beyond
the burden of taxes, such as compliance with legal requirements or rent seeking bureaucracy, so
that evasion may not necessarily be detrimental to growth (Sarte, 2000). Among the others, the
presence of high hiring and firing costs induced by rigid labour market regulation (e.g. EPL) may
create incentives for firms to hire (and possibly fire) workers in the informal sector (Bosch and
Esteban-Pretel, 2012; Di Porto et al, 2016) where labour adjustment costs are lower. As a result,
in an overregulated market, the flexibility resulting from informality may enable firms to operate
more effi ciently (Almeida and Carneiro, 2009, 2012). Ultimately, the decision of the firm to adjust
in the formal or informal sector depends on the tradeoff between the costs associated to regular and
irregular employment. If on the one hand formal contracts are subject to labour regulations (such
as EPL), on the other hand, the use of irregular workers implies costs in terms of exclusion from
certain public goods and services (e.g., social infrastructure, property rights and the justice system),
together with the possibility of fines and other punishments.
In this paper we analyze the effect of informality on the productivity of firms which are subject
1 In this paper we refer as informal economy to activities that per se are legal, but which are hidden to offi cialstatistics and authorities. We will use the terms underground, informal, unoffi cial interchangeably.
2
to different degree of labour market regulation (EPL). We argue that, in presence of high firing
costs, the possibility of access to the informal market may allow firms greater flexibility in their
employment and production decisions which, in turn, can lead them to operate more effi ciently and
increase productivity. As a result, the negative effect of stricter labour regulation on productivity
may be relatively smaller for firms facing lower informality costs.
We analyze the interaction between the costs of formal and informal employment and the effect on
firms’productivity by means of a regression discontinuity design (RDD) that exploits the variation
in EPL across Italian firms below and above an employment size threshold (15 employees), the
EPL provisions being more stringent above the 15-employee threshold. The discontinuous change in
legislation at the threshold should result in a discontinuous effect of the costs of access to informality
on firms’behavior. We use this idea to study two related aspects. First we consider whether in
presence of a large share of informality at the local level, as a proxy of the cost of employing
informal labour, firms’job reallocation in the formal labour market drops just above the threshold.
This implies that lower costs of informality reduce turnover of formal (regulated) jobs of firms facing
higher firing costs since these firms have a stronger incentive to create and destroy jobs in the
informal sector.2 Second, we analyze weather the negative effect of informality on the productivity
of firms just above the threshold is relatively abated as compared to the impact below the threshold.
Since it is diffi cult to obtain direct data on informality at firm level, we use tax evasion estimated
at the province level as a proxy of the costs for firms and workers of being informal in that particular
local labour market. We claim that in provinces with a higher level of tax evasion, the cost of
accessing the informal sector are lower and, therefore, firms can more easily use irregular workers as
a buffer stock for the regulated formal employment.
There are a number of issues concerning the identification of the causal effect of informality on
firm’s labour adjustments and productivity. First and foremost, it may be that attitude to going
informal, labor adjustments and productivity are driven by the same local unobserved factors such
as, for example,the degree of economic development, the quality of institutions, cultural factors.
Second, the risk of reverse causality should not be overlooked as tax compliance may be influenced
by labor market conditions and firms’performance.
In our empirical analysis, we address the potential endogeneity of our indicator of informality
by using a set of instruments which are shown to be disconnected from local business conditions,
namely the judges’turnover in civil courts and the timing of local (province) elections.
As far as judges’turnover within judicial districts is concerned, it is well known that tax com-
2There is a large empirical and theoretical literature which shows that strict EPL has a negative effect on bothjob creation and job destruction, reducing the overall turnover of regular jobs (Bertola et al, 1999; Blanchard andPortugal, 2001; Hijzen et al, 2013; Vindigni et al, 2015).
3
pliance depends on the level of the enforcement of legislation, which in turn is related to courts’
effi ciency. One of the determinants of Courts’internal organization has been shown to be the turnover
rate of the judges (Guerra and Tagliapietra, 2005). Judges turnover is not related to our depend
variables nor is determined by local factors; indeed the transfer of a judge is the result of independent
decisions taken from different agents and approved on the bases of objective circumstances provided
for by the law. It is then exogenous with respect to our empirical model.
As to the timing of local (province) level elections, the impact of the occurrence of elections on
the probability of auditing is a well-established result in the literature (Besley et al. 2014; Skouras
and Christodoulakis, 2013); a change in the (local) ruling coalition can represent a shock to local
entrenched powers and by this way influence the enforcement of tax regulation. Although Italian
provinces have no tax competence (as most taxes are established at the central Government level
while local taxes are decided upon and collected by municipalities) tax auditing and collection is
carried out a province level, within the same boundaries of province constituencies. In addition,
province elections occur at intervals which are established by law (i.e. every 5 years), therefore the
timing of election is exogenous.
The panel dimension of our data also allows to control for unobserved heterogeneity among
sectors and provinces via fixed effects. Therefore, our main results are not driven by cross-sectional
differences among districts, such as cultural, economic and social characteristics that may impact on
both labour market adjustments, firms’productivity and informality decisions. Finally, our results
are also robust to the inclusion of province-specific time dummies, which captures any time and
province variant omitted factors - such as local economic development and informal institutions3 -
which could influence both productivity and informality.
Our results show that lower costs of informality reduces labor reallocation rates in the formal
sector for firms facing higher firing costs confirming that they tend to adjust more on the informal
sector. Moreover, firms with higher firing costs experience productivity gains from informality
resulting from the opportunity to adjust in the unregulated sector. In other words, while the overall
effect of informality on productivity is still negative —in line with the literature —the incremental
effect of tax evasion on labor productivity for firms facing higher firing costs (i.e. firms above the 15
workers’threshold) is positive. A quantification of our results suggests that moving from the 90th
to the 10th percentile of the informality distribution (i.e. from the province of Avellino to Gorizia
in our sample), would lead to a 10 percentage points decrease in the turnover of formal employment
(more than 50 percent of the average turnover) for firms above the threshold relative to smaller firms
and an increase of productivity of about 15 percent.
3Guiso et al. (2004) show that informal institutions vary widely across Italian provinces producing significanteconomic effects.
4
The rest of the paper is organized as follows. The next section illustrates the institutional
background and discuss the istruments. Section 3 presents the main characteristics of the data.
Section 4 sets out the empirical methodology. The main results of the article are presented in
Section 5. In Section 6 we provide some robustness checks and Section 7 concludes.
2 Informality, labour regulation and firm productivity
To be done
3 The institutional background and the identification strategy
3.1 Employment protection legislation and the 15 employees threshold
According to Italy’s Statuto dei Lavoratori, passed in 1970, an individual dismissal is legal only when
it satisfies a just cause, e.g. it can be justified by an objective reason (concerning the production
activity for example) or subjective reasons, which are mainly related to misconduct on the part of
the worker. The worker has always the right to appeal the firm’s decision and the final outcome
ultimately depends on the court’s ruling on the specific case. If the worker does not appeal the firing
decision, or if the dismissal is ruled fair, the legislation does not impose any severance payment to
the firm.4 Conversely, when the dismissal is ruled unfair, the judge imposes a specific compensation
on the firm.
The maximum compensation to which unlawfully fired workers are entitled to varies with firm
size in two important dimensions. For firms with less than 16 employees, the unfairly dismissed
worker must be compensated with a fixed severance payment that varies between 2.5 and 6 months
of salary independently on the length of judicial procedure and with no obligation of reinstatement of
the dismissed worker. Conversely, for firms with more than 15 employees, to which Article 18 of the
Statuto dei Lavoratori applies, the worker is entitled to a compensation equal to forgone wages, social
security and health insurance contributions for a period from the date of the dismissal to the judicial
settlement of the case (with a minimum of 5 months and with no upper limits). Moreover he/she
can choose either to be reinstated in the firm or to be paid an additional financial compensation of
15 months of salary.5 This implies that: (a) firing costs for firms above the 15 employees threshold
are always higher than those for smaller firms; and (b) the cost of unfair dismissals increases with
the duration of the labour trial only for firms with more than 15 employees .
A number of papers have exploited the discontinuity in EPL at the 15 employees threshold in
4When the layoff is ruled fair, a common practice in Italy is that the labour union pays all the legal costs.5The recent reform of the Italian labour market, in force since July 18, 2012, has changed some of the rules related
to the termination of the employment relationship. In particular, also for firms with more than 15 employees, it hasbeen restricted reinstatement to certain specific cases of unfair or unjustified dismissal and introduced an upper limitup to 24 months’salary to the compensation a firm has to pay in case of unfair dismissal. The change in legislationdoes not affect our estimates, since our data covers the period 2006-2010.
5
Italy. These studies are mainly focused on identifying the overall effect of EPL on firm’s employment
decisions and productivity.6 Differently, our empirical strategy allows us to identify the extent to
which informality affects firms’productivity in different firing costs regimes. More specifically, our
identification scheme is based on the idea that the costs of informality are different for firms below
and above the threshold, i.e. firms subject to a stricter EPL may benefit more from hiring in the
informal sector. The discontinuity in firing legislation at the 15-employees threshold should allow
us to isolate the effect of interest (the differential impact of informality on productivity) from other
(unobserved) factors such as the degree of local economic development, quality of (local) institutions,
that may affect all firms within the same location.
3.2 The instrumental variables
In order to corroborate our results and control for the potential endogeneity of the indicator of
judicial ineffi ciency, we also present two-stage least squares (2SLS) estimates using two instruments
for the duration of labour trials: (1) the judges’turnover in judicial districts and (2) the timing of
lthe ocal (province) elections.
3.2.1 Judges’turnover
Tax compliance depends on the level of enforcement of legislation (detection and fines), which in
turn is related to the effciency of civil courts. It has been show that judges’turnover has a quite
strong impact on the effi ciency of Courts’ internal organization (Guerra and Tagliapietra, 2005).
Therefore this instrument is correlated with the extent of local informality through the effi ciency of
judicial courts and also satisfies the exclusion restriction as the transfer of judges from one offi ce
to another is the result of a number of decisions taken by agents at different levels of the judiciary
hierarchy who respond to different sets of incentives. The transfer generally follows a three-step
procedure: i) the publication of vacant positions to be filled ii) the request of the judge who is
willing to be transferred and occupy the vacant position; iii) the approval by the self-governing body
of the judiciary, the Consiglio Superiore della Magistatura (CSM). Judges’ turnover rate within
each districts depends on the number of vacant positions available which in turn is related to career
6Boeri and Jimeno (2005) study the effect of employment protection on lay-off probabilities by comparing smalland large firms. Garibaldi et al (2004), and Schivardi and Torrini (2008) assess the effects of employment protectionon the size distribution of Italian firms, by looking at the probability of firm size adjustments around the 15 employeethreshold. Similarly, Hijzen et al (2013) analyse the effect of different EPL provisions on the composition of workforce,worker turnover and productivity of firms above and below the 15 employees threshold. All these papers identify theeffect of employment protection by exploiting the fact that Italian firms with fewer than 15 employees are subject tolower dismissal costs than firms with more than 15 employees. Other studies exploit both the discontinuity in EPL atthe 15 employees threshold as well as the temporal variation in the legislation, in order to assess the effect of reformson job flows (Kluger and Pica, 2008), wages (Leonardi and Pica, 2013), productivity and capital deepening (Cinganoet al, 2015). Our study builds on these prior works in one major respect. Differently from the papers mentionedabove, the aim of our analysis is to isolate the economic effects of the varying degree of effi ciency of labour courts fromthe effect of the labour legislation itself, by exploiting both the discontinuity of EPL at the 15-employees thresholdas well as the cross-district and over-time variation of labour courts’effi ciency (and then firing costs).
6
advancements or retirement. Once a vacant position is created, the judge who is willing to be
transferred has to apply to the CSM; as a general rule, judges cannot be transferred to a different
assignment or district without their consent.7 Once applications are received, the CSM decides on
the basis of a competitive procedure among candidates. The criteria for the CSM collegial decision
are the following: competence, which is assessed on the basis of the functions so far carried out and
the judge’s capacities; the judge’s health status and his/her family members’ (offsprings, spouse,
parents and brothers/sisters if leaving with the judge, in some cases relatives and relatives-in-law);
family tie
s; merit (which also depends on the fact that in the past the judge has occupied vacancies
for which an urgent procedure had been set up or vacancies for which no application had been
received); seniority.8 Therefore, the complexity of the transfer procedure, to which the decisions
taken by different agents contribute, is such that the turnover rate in each district ends up to be
independent from (local) factors that might also affect firm-level outcomes.
Such conclusion is also supported by the data in our sample (see descriptive statistics in Table 1
below), which show no clear territorial pattern in the number of unfilled vacant positions (expressed
both in units and as a ratio of the total number of judges). Moreover, Figure 4 displays the sample
correlation between the average number of vacant positions (normalized to the number of judges in
offi ce) and the level of income per capita (as a proxy for the degree of local economic development).
The correlation is virtually zero. This supports our conclusion that the openings/closeness of a
vacant position in the labour courts is a complex process which is not related to local institutional
and economic characteristics.
3.2.2 Local political elections
The influence of electoral cycle on fiscal choices has been widely investigated since Nordhaus (1975).
Recent literature on this topic follows two main approaches. A strand of contributions build on
models based on information asymmetries between voters and politicians following Rogoff and Sibert
(1988) and Rogoff (1990): according to this line, politicians manipulate budgetary instruments to
signal their competency in electoral and pre-electoral periods. Another strand of literature focus on
tax choices as a tool to increase the probability of re-election; in this framework not only tax setting
7An important feature of the Italian judicial system is the principle of "inamovibilità", according to which ajudge can be transferred to a different Court or to a different assignment only upon his/her consent. The principleof "inamoviblità" is a constitutional provision aiming at assuring the independence of the judiciary, which could beundermined should a judge be compelled to quit his/her activity for suspension or transfer. There are some ecceptionsnamely the need to cover vacancies in cases established by law, as disciplinary actions or for reasons of "incompatibilitàambientale", i.e. the judge is considered incompatible with the workplace. The judge can appeal the CSM decisionin all cases.
8See the "Circolare 15098 of November 30, 1993 and subsequent amendments. Health status and familiy ties arenot taken in consideration for top positions, such as for example the Supreme Court.
7
but also the probability of auditing and controls can be influenced by the occurrence of an election.
On the empirical ground, focusing on German municipalities Foremny and Riedel (2014) show that
the growth rate of local business taxes is significantly lower in election periods while Skouras and
Christodoulakis (2013) find that around election audit activity by tax collector is reduced and
underreporting increases in Greece; Ronconi (2009) show that the occurrence of a political election
influence actual enforcement of labour legislation. In addition, other studies focus on the ruling
coalition attitude toward tax compliance of as a determinant of tax evasion: a change in the (local)
ruling coalition can represent a shock to local entrenched powers and by this way influence the
enforcement of tax regulation (Besley et al, 2014). Fantozzi and Raitano (2015) investigated tax
compliance in Italy as a result of a change in ruling parties and found an increase in self-employed
underreporting under centre-right coalition.
Building on these contributions, we instrument the tax gap at province level with a dummy
indicating the occurrence of a province election in the year. There are several reasons for choosing
province level elections. On the administrative point of view, the Italian territory is organized in
regions, provinces and municipalities.9 Although the Italian provinces have no a direct tax compe-
tence (as most taxes are established at the central Government level while local taxes are decided
upon and collected by municipalities),t a tax auditing and collection is carried out a province level,
within the same boundaries of province constituencies (by the so called “Direzioni Provinciali”).
Therefore, we interpret the occurrence of a province election as a potential shock to the local estab-
lished powers. Elections can bring a switch in the local ruling coalition, which may influence firms’
expectation about the severity of tax enforcement and by this way tax compliance. In addition,
province elections occur at intervals which are established by law (i.e. every 5 years),10 therefore
the timing of election is exogenous and the time of elections is different across provinces.11
4 Data sources
4.1 Firms data
Firm level data are drawn from AIDA (Analisi Informatizzata delle Aziende Italiane) produced by
Bureau van Dijk (BvD). BvD collects balance sheet data from the national Chambers of Commerce.
The version of Aida used in our analysis includes all Italian firms that have reported their financial
9From the administrative point of view, the Italian territory is organized in regions, provinces and municipalities.Provinces have administrative tasks in province areas and in inter municipality territory; they have coordination tasksand are in charge of the implementation of public works in various sectors, including the economic, productive, tradesectors; they carry out programming activity for the provincial territory.10 In the period under study the legislation regulating the election and the tasks of province level representatives
was the Testo Unico, G.U. n. 227 del 28 settembre 2000, s.o. n. 162/L. The legislation was reformed in 2014. Between2007 and 2010 elections occurred before the end of the natural term only in 13 provinces. In most cases anticipationwas due to the resignation of the President motivated by the choice to campaign in the Parliament election.11 In our sample period there are 98 elections episods: 8 in 2007, 20 in 2008, 68 in 2009 and 8 in 2010.
8
statement to the national Chamber of Commerce in the period 2007-2010, for a total of more than
800,000 Italian firms operating in all productive sectors. Apart from balance sheet data, Aida
provides a wide range of financial and descriptive information (industry and activity codes, firm age,
etc.) and the number of employees. Moreover, AIDA gives information on the location of firms at
a municipality level, allowing the match of firms’data with the courts’database.
The Aida database has a drawback, as it does not allow to distinguish between newly created
firms and firms that simply enter the sample at a given period t but were already operating in the
period before; similarly, it is not possible to identify firms’closures from firms that exit the sample
for other reasons. Therefore, we have restricted the analysis to continuing firms, e.g. firms that
are in the sample for at least two consecutive periods.12 Given this limitation and after cleaning
the database from outliers and missing information, our final sample consists of around 160,000
private firms operating in both the manufacturing and non manufacturing sectors.13 Observations
are annual and cover the period from 2007 to 2010. We define job reallocation at firm level as the
absolute value of the change in employment between two consecutive periods divided by the average
employment between the two periods (see Capellari et al. 2011; Kugler and Pica, 2008, Autor et al,
2007):
JT =|nft − nft−1|12 (nft + nft−1)
Labour productivity is obtained as the log of value added per worker. To preserve comparability
between treatment and control groups, we further restrict the sample to firms within the interval
10—20 employees, yielding a sample size of slightly more than 50,000 observations (19464 firms).
Tables 3 shows the descriptive statistics.
TABLE 1 AROUND HERE
In our sample the average firm has a value added per worker of around 61 thousands euros
and employs 14 workers. The average rate of job reallocation is around 19 percentage point. No
significant differences can be observed in the level of productivity and reallocation rates between
treatment and control groups.
12Our sample is therefore unbalanced and potentially includes entry and exit firms. In section XXX we providesome results obtained by using a balanced sample which includes only firms that are continuously observable everyyear from 2007 and 2010.13The sectors are: (1) Agriculture, forestry and fishing; (2) Mining and quarrying; (3) Food, beverages and to-
bacco;(4) Textiles; (5) Wood products; (6) Paper products, publishing and printing; (7) Refined petroleum, nuclearfuel and chemical products; (8) Rubber and plastic products; (9) Other non-metallic products; (10) Basic metalsand fabricated metal products; (11) Machinery and equipment; (12) Electrical and optical equipment; (13) Transportequipment; (14) Other manufacturing sectors; (15) Electricity, gas and water supply; (16) Construction; (17) Whole-sale and retail trade, Repairs; (18) Hotels and restaurants; (19) Transport and communications; (20) Other services.The financial and public sectors are excluded from the analysis.
9
4.2 Informality and tax gap data
The extent of underground activities and informal economy is diffi cult to detect and measure. Since
workers and firms who operate irregularly are unlikely to provide information on their hidden activi-
ties, this makes it diffi cult to obtain direct data on informality at firm level. Nevertheless, a number
of reliable indicators has been produced in order to measure the informal economy at a more ag-
gregate level. We use tax evasion estimated at the province level as a proxy of the costs for firms
and workers of being informal in that particular area.14 We claim that firms operating in provinces
with a higher level of tax evasion, face lower costs of accessing the informal sector and, therefore,
can more easily use irregular workers as a buffer stock for the regulated formal employment.15
Data on tax evasion for Italian provinces are provide by the Italian Revenue Agency (Agenzia
delle Entrate). The dataset contains data on the expected as well as the actual financial revenue
reported to fiscal authorities in the 107 Italian provinces from 2007 to 2010. The novelty of the
database relates to the methodology used to estimate tax gap based on an integration of the top-
down approach, based on the comparison and cross-checking (matching) between national accounts
and administrative fiscal data, and the bottom-up approach, based on results from fiscal audits
(Carfora et al., 2015). The indicator of tax evasion (tax_gap) has been constructed as the relative
difference of the expected and the reported revenue, i.e.
tax_gap =(expected revenue− reported revenue).
expected revenue.
Table 2 reports some descriptive statistics concerning the tax gap over the sample period 2007
to 2010 for the 107 Italian provinces, which are ranked from the most to the least tax compliant.
TABLE 2 AROUND HERE
The data show great territorial heterogeneity in the extent of tax evasion; for example, the
differences of the tax gap between the province at the 10th (Avellino) and 90th (Gorizia) percentile
of the tax compliant distribution ’is around 0.26 percentage points. The standard deviation across
provinces is quite large, being more than one third of the average. The within-district time-series
variation of tax gap is also substantial: the standard deviation normalized on the mean ranges from
0.03 (in Grosseto) to 0.21 (in Firenze), with a sample average of around 0.10. This descriptive
evidence suggests considerable heterogeneity in informality both cross-sectionally and over time.
14Clearly, employment informality and firm informality are different concepts. Nevertheless, one would expectemployment informality and firm informality to be highly correlated, as tax authorities could detect inconsistenciesbetween output and employment levels. We therefore decide to use tax gap in a given province as a proxy forinformality opportunity for firms set in that particular geographical area.15Tax evasion, and, more genereally, the extent of the shadow economy is related to the expected costs of being
informal. Typically this costs are specified in terms of exclusion from certain public goods and services (e.g., socialinfrastructure, property rights and the justice system), together with the possibility of fines and other punishments.
10
4.3 Data on judges turnover and elections
We draw data on the number of judges allocated to each judicial districts as well as on the number of
inbound and outbound judges from 2006 to 2010 from courts’self regulating body (CSM) database.
Judges turnover at district level is calculated as in Guerra and Tagliapietra (2015) according to the
following formula:
Turnover =100x(number of outbound judges+ number of inbound judges)
number of expected judges/
5 Empirical specification
We estimate the effect of informality on the turnover of formal jobs and labour productivity using
firm level data. At firm level, the size of firms plays a significant role in moderating the impact
of informality on firms adjustments and productivity. In our analysis, we exploit the discontinuity
of firing legislation at the 15-employees threshold to identify the causal effect of informality on
productivity.
In order to control for the fact that informality can be related to the local economic development,
we also include local per capita income. Moreover, estimating the impact of judicial ineffi ciency at
firm level allows us to enrich our controls on productivity. Given that (time variant) differences in
the regional underlying economic conditions (as GDP per capita) may not necessarily capture all
the factors affecting firm productivity (e.g. those factors related to the institutional environment
at large), depending on the specification considered we include a full set of district-by-year and
sector-by-year dummies. In this way we can rule out any possible source of endogeneity arising from
(time and district variant) omitted factors - not already captured by the income per capita - which
could influence both productivity and informality.
The model specification is as follows:
yrft = β1tax_gaprt + β2size
rf + β3(taxgap
rt × sizerf ) + β4incomert
+Xrftγ +Dη + ηf + u
rft (1)
where the dependent variable yrft is either the job turnover or productivity (log of value added)
depending on specification; tax_gaprt is the informality index (in log); sizerf is a dummy variable
which takes value 1 for large firms i.e. firms with number of employees larger than 15, and zero
otherwise;16 Xrfst are a set of other controls which include a polynomial of a third degree in firm
16We define firms as small if they have less than 15 employees in all years and large if they have more than 15
11
size, ηf stands for firm fixed effects which "absorb" any time-invariant unobservable attributes at
firm level, and in particular the effect of the different (time-invariant) EPL regime that applies to
firms above and below the 15 employees threshold. The indices r and t refer to provinces and year
respectively. D is the matrix of dummies that includes, depending on the specification considered,
district-by-year17 and industry-by-year dummies while urt is the error term. The coeffi cient on
tax_gaprt gives the common effect of trial length on small and large firms due to discounting,
while the interaction term tax_gaprt × sizerf captures the differential effect of informality induced
by the more strict EPL regimes on large firms productivity. Here again the variable tax_gaprt
is instrumented with :the judges’ turnover in judicial districts and the timing of local (province)
elections, while the interaction tax_gaprt × sizerf is instrumented by interacting each instruments
with the dummy sizerf .
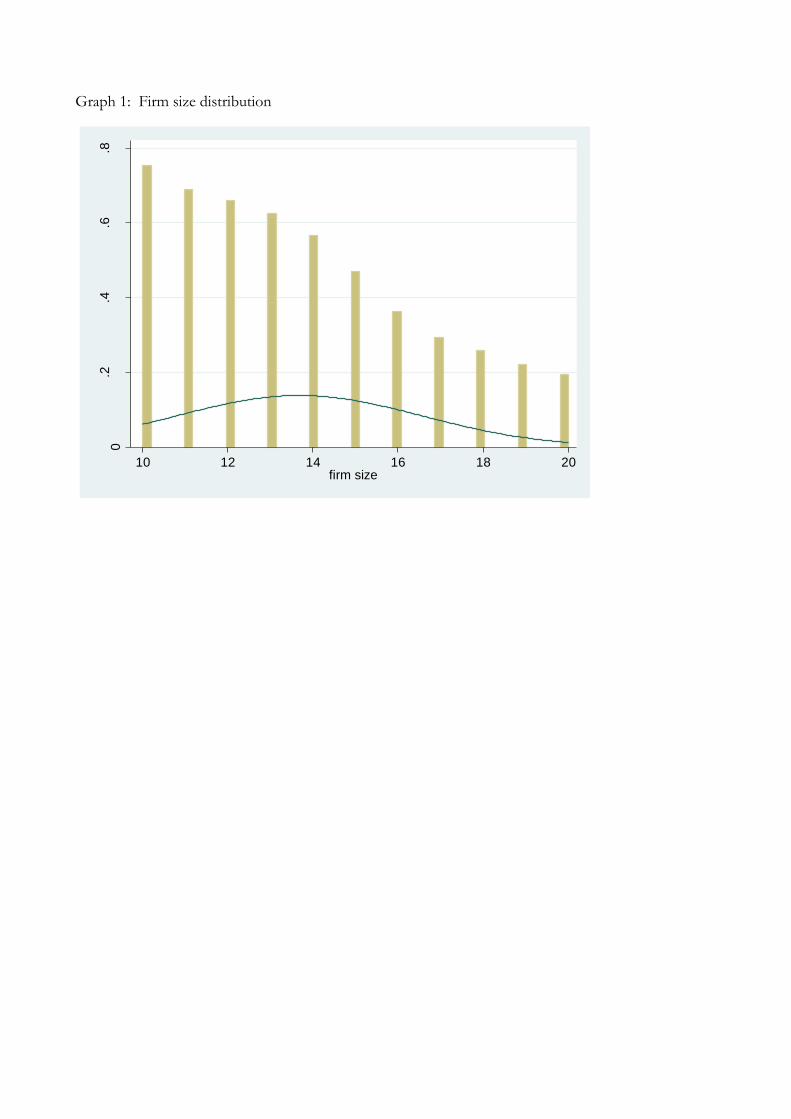
Our identification strategy relies on the assumption that firms do not endogenously sort in or
out of treatment. In specification 1, firm fixed effects capture all time-invariant unobserved factors
that may affect the propensity of firms to self-select above or below the threshold. Graph 1 displays
the distribution of firms between 10 to 20 workers. If any significant manipulation occurred because
of increased firing costs the graph should display a dip on the 15 workers threshold, which is not
observed; rather density smoothly declines with the increase in the number of workers.18
[GRAPH 1 HERE]
Unfortunately our data no not contain information on tax evasion at firm level, so we could not
directly infer any difference in tax compliance between small firms and big firms. Indeed firm fixed
effects cannot account for the selection induced by time varying factors as informality themselves.
The employment growth regressions reported in Section 5.2 suggest that the employment growth
regressions that informality does not affect firms propensity to grow around the threshold and
therefore lend further support to our identification strategy.19
We also address the potential endogeneity of tax evasion in two ways: i) we include firm’s fixed
effects; ii) we instrument tax_gap (and its interaction) with two instruments, namely the judges’
turnover in judicial districts and the timing of local (province) elections. The two instruments
employees in all years of the sample period. We also check the robustness of our results to a different thresholddefinition (see section 7.3) and to the inclusion in the sample of firms which move above and below the threshold overthe sample period. Results are available upon request.17The inclusion of district-by-year dummies allows to control for all district-specific time-varying characteristics (for
example, the quality of local infrastructure) which have the same effects across firms. Notice that this set of dummiesabsorbs the main effect of trials’length, as this variable only varies by district and time.18The same pattern is observed also in other studies on the Italian EPL, so that our graphical results on the of
significant manipulation are in line with a body of empirical analysis focusing on the effects of the discontinuity indismissal costs in Italy (Boeri and Jimeno, 2005; Schivardi and Torrini, 2008; Leonardi and Pica, 2013, Cingano et al.2014).19The result that EPL provisions do not affect firms propensity to grow is not new in the empirical literature. See
among the others, Cingano et al (2015), Leonardi and Pica (2013) and Schivardi and Torrini (2005) which examinethe effect of EPL on firms’size distribution below and above the 15 employees-threshold in Italy.
12
will be used in the IV regressions both separately and jointly, together with a full set of district
and district-year dummies (depending on the specification considered), thus producing three sets of
estimates. The results are remarkably robust to every specification. Moreover, in all regressions we
control for differences in the economic development at district level by including among the regressors
district per capita income (GDP). Finally, depending on the specification considered, we show that
our results are also robust to the inclusion of a full set of district-year and sector-year dummies.
In this way, we can rule out any possible source of bias arising from (time and district variant)
omitted factors - not already captured by the regional income per capita - which could influence both
productivity and judicial ineffi ciency, thus yielding further support to our identification strategy.
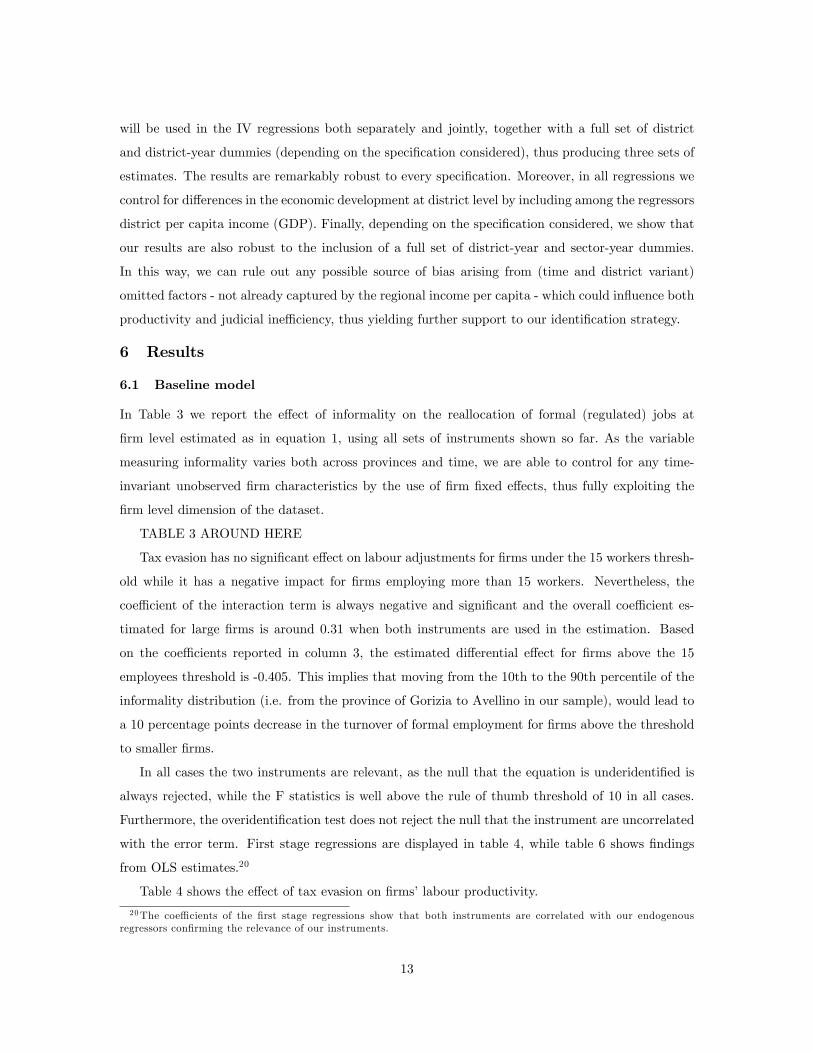
6 Results
6.1 Baseline model
In Table 3 we report the effect of informality on the reallocation of formal (regulated) jobs at
firm level estimated as in equation 1, using all sets of instruments shown so far. As the variable
measuring informality varies both across provinces and time, we are able to control for any time-
invariant unobserved firm characteristics by the use of firm fixed effects, thus fully exploiting the
firm level dimension of the dataset.
TABLE 3 AROUND HERE
Tax evasion has no significant effect on labour adjustments for firms under the 15 workers thresh-
old while it has a negative impact for firms employing more than 15 workers. Nevertheless, the
coeffi cient of the interaction term is always negative and significant and the overall coeffi cient es-
timated for large firms is around 0.31 when both instruments are used in the estimation. Based
on the coeffi cients reported in column 3, the estimated differential effect for firms above the 15
employees threshold is -0.405. This implies that moving from the 10th to the 90th percentile of the
informality distribution (i.e. from the province of Gorizia to Avellino in our sample), would lead to
a 10 percentage points decrease in the turnover of formal employment for firms above the threshold
to smaller firms.
In all cases the two instruments are relevant, as the null that the equation is underidentified is
always rejected, while the F statistics is well above the rule of thumb threshold of 10 in all cases.
Furthermore, the overidentification test does not reject the null that the instrument are uncorrelated
with the error term. First stage regressions are displayed in table 4, while table 6 shows findings
from OLS estimates.20
Table 4 shows the effect of tax evasion on firms’labour productivity.
20The coeffi cients of the first stage regressions show that both instruments are correlated with our endogenousregressors confirming the relevance of our instruments.
13
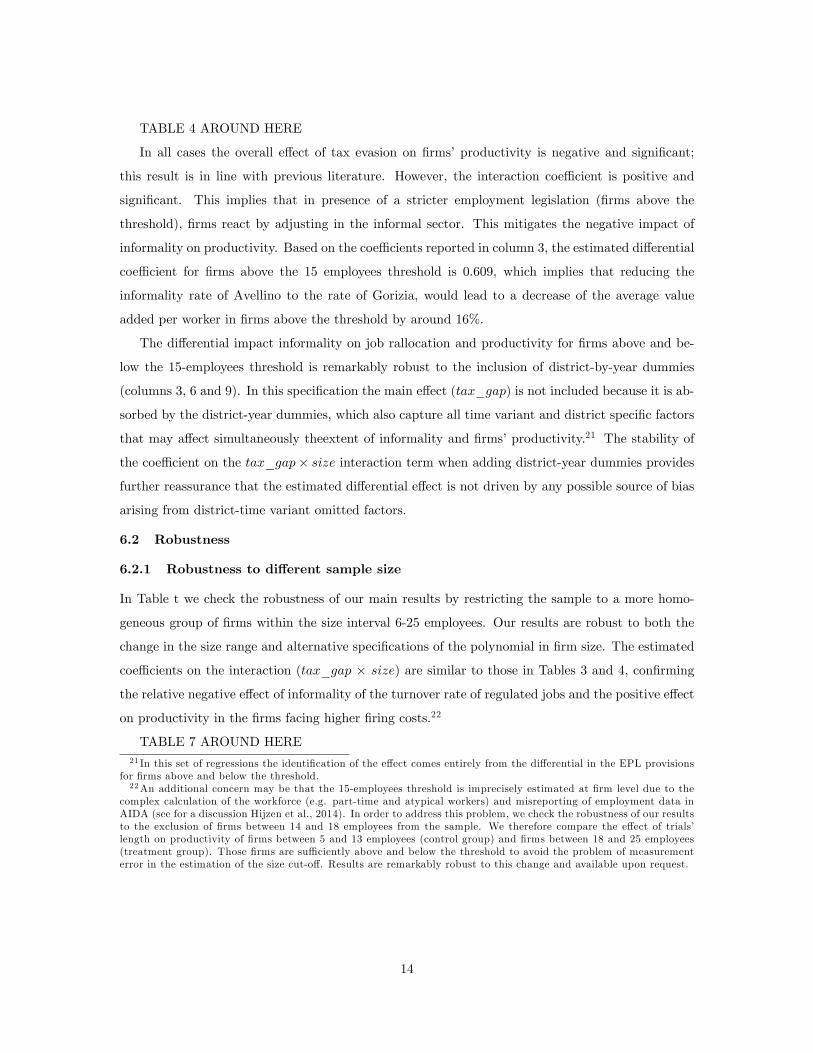
TABLE 4 AROUND HERE
In all cases the overall effect of tax evasion on firms’productivity is negative and significant;
this result is in line with previous literature. However, the interaction coeffi cient is positive and
significant. This implies that in presence of a stricter employment legislation (firms above the
threshold), firms react by adjusting in the informal sector. This mitigates the negative impact of
informality on productivity. Based on the coeffi cients reported in column 3, the estimated differential
coeffi cient for firms above the 15 employees threshold is 0.609, which implies that reducing the
informality rate of Avellino to the rate of Gorizia, would lead to a decrease of the average value
added per worker in firms above the threshold by around 16%.
The differential impact informality on job rallocation and productivity for firms above and be-
low the 15-employees threshold is remarkably robust to the inclusion of district-by-year dummies
(columns 3, 6 and 9). In this specification the main effect (tax_gap) is not included because it is ab-
sorbed by the district-year dummies, which also capture all time variant and district specific factors
that may affect simultaneously theextent of informality and firms’productivity.21 The stability of
the coeffi cient on the tax_gap× size interaction term when adding district-year dummies provides
further reassurance that the estimated differential effect is not driven by any possible source of bias
arising from district-time variant omitted factors.
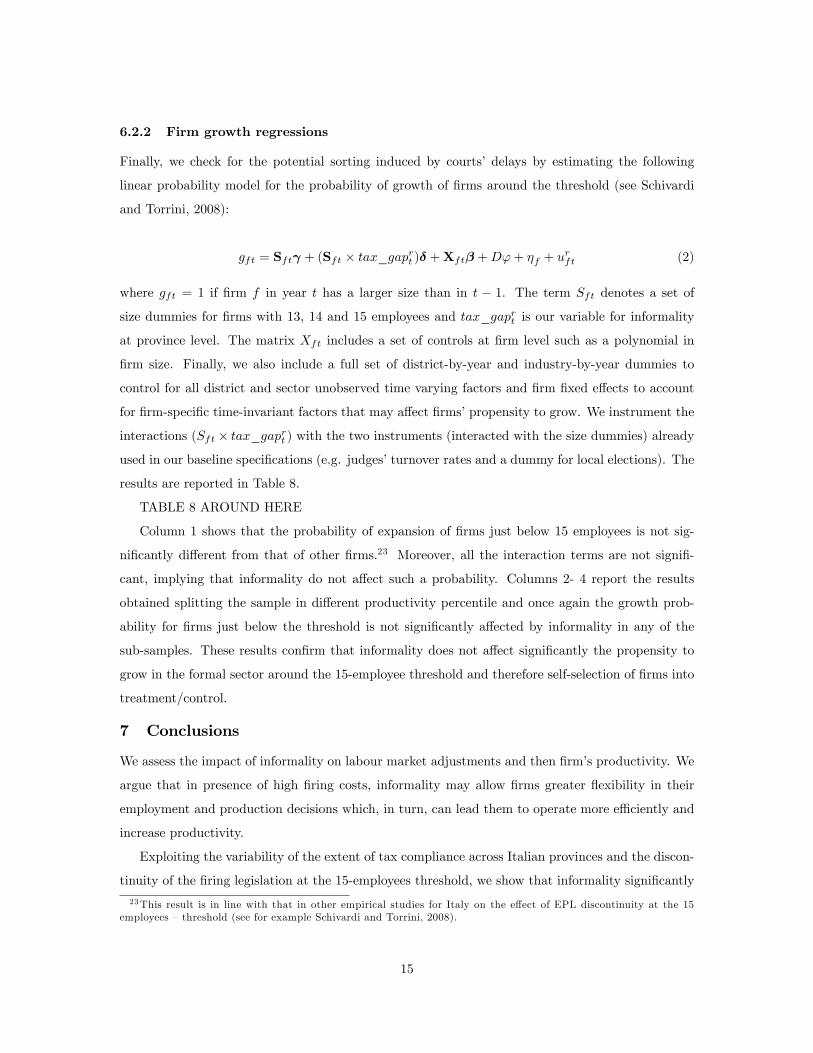
6.2 Robustness
6.2.1 Robustness to different sample size
In Table t we check the robustness of our main results by restricting the sample to a more homo-
geneous group of firms within the size interval 6-25 employees. Our results are robust to both the
change in the size range and alternative specifications of the polynomial in firm size. The estimated
coeffi cients on the interaction (tax_gap × size) are similar to those in Tables 3 and 4, confirming
the relative negative effect of informality of the turnover rate of regulated jobs and the positive effect
on productivity in the firms facing higher firing costs.22
TABLE 7 AROUND HERE21 In this set of regressions the identification of the effect comes entirely from the differential in the EPL provisions
for firms above and below the threshold.22An additional concern may be that the 15-employees threshold is imprecisely estimated at firm level due to the
complex calculation of the workforce (e.g. part-time and atypical workers) and misreporting of employment data inAIDA (see for a discussion Hijzen et al., 2014). In order to address this problem, we check the robustness of our resultsto the exclusion of firms between 14 and 18 employees from the sample. We therefore compare the effect of trials’length on productivity of firms between 5 and 13 employees (control group) and firms between 18 and 25 employees(treatment group). Those firms are suffi ciently above and below the threshold to avoid the problem of measurementerror in the estimation of the size cut-off. Results are remarkably robust to this change and available upon request.
14
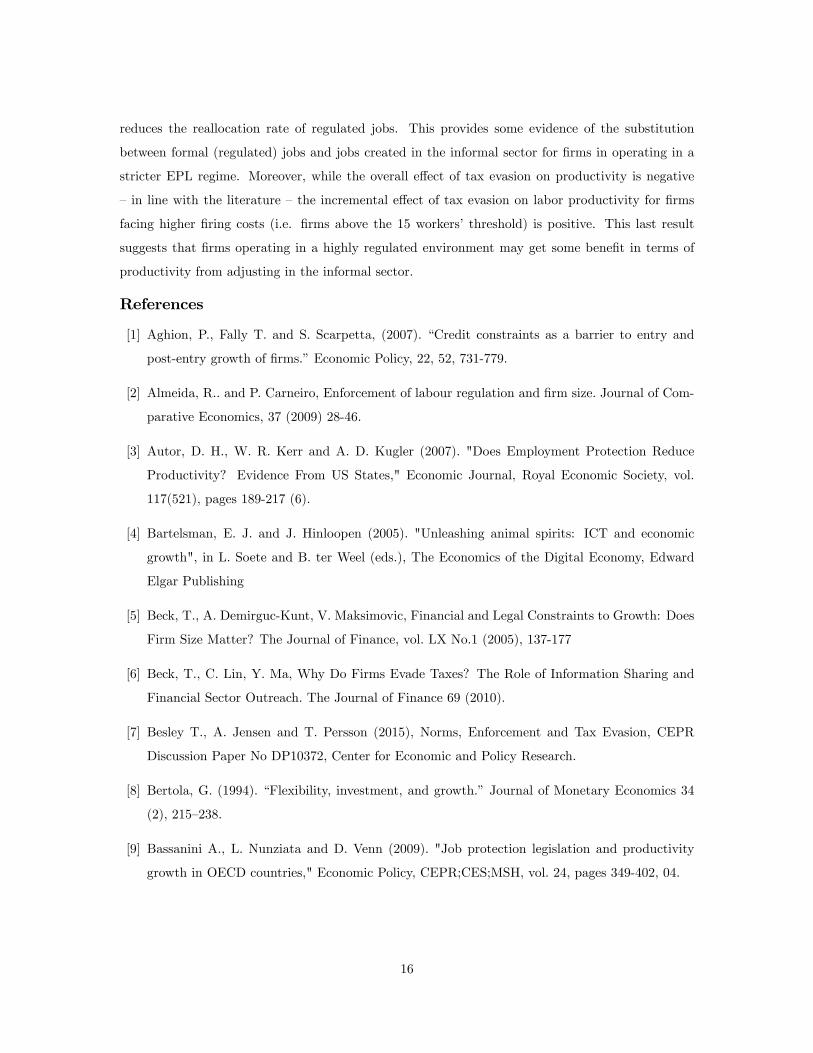
6.2.2 Firm growth regressions
Finally, we check for the potential sorting induced by courts’ delays by estimating the following
linear probability model for the probability of growth of firms around the threshold (see Schivardi
and Torrini, 2008):
gft = Sftγ + (Sft × tax_gaprt )δ +Xftβ +Dϕ+ ηf + urft (2)
where gft = 1 if firm f in year t has a larger size than in t − 1. The term Sft denotes a set of
size dummies for firms with 13, 14 and 15 employees and tax_gaprt is our variable for informality
at province level. The matrix Xft includes a set of controls at firm level such as a polynomial in
firm size. Finally, we also include a full set of district-by-year and industry-by-year dummies to
control for all district and sector unobserved time varying factors and firm fixed effects to account
for firm-specific time-invariant factors that may affect firms’propensity to grow. We instrument the
interactions (Sft × tax_gaprt ) with the two instruments (interacted with the size dummies) already
used in our baseline specifications (e.g. judges’turnover rates and a dummy for local elections). The
results are reported in Table 8.
TABLE 8 AROUND HERE
Column 1 shows that the probability of expansion of firms just below 15 employees is not sig-
nificantly different from that of other firms.23 Moreover, all the interaction terms are not signifi-
cant, implying that informality do not affect such a probability. Columns 2- 4 report the results
obtained splitting the sample in different productivity percentile and once again the growth prob-
ability for firms just below the threshold is not significantly affected by informality in any of the
sub-samples. These results confirm that informality does not affect significantly the propensity to
grow in the formal sector around the 15-employee threshold and therefore self-selection of firms into
treatment/control.
7 Conclusions
We assess the impact of informality on labour market adjustments and then firm’s productivity. We
argue that in presence of high firing costs, informality may allow firms greater flexibility in their
employment and production decisions which, in turn, can lead them to operate more effi ciently and
increase productivity.
Exploiting the variability of the extent of tax compliance across Italian provinces and the discon-
tinuity of the firing legislation at the 15-employees threshold, we show that informality significantly
23This result is in line with that in other empirical studies for Italy on the effect of EPL discontinuity at the 15employees —threshold (see for example Schivardi and Torrini, 2008).
15
reduces the reallocation rate of regulated jobs. This provides some evidence of the substitution
between formal (regulated) jobs and jobs created in the informal sector for firms in operating in a
stricter EPL regime. Moreover, while the overall effect of tax evasion on productivity is negative
—in line with the literature —the incremental effect of tax evasion on labor productivity for firms
facing higher firing costs (i.e. firms above the 15 workers’threshold) is positive. This last result
suggests that firms operating in a highly regulated environment may get some benefit in terms of
productivity from adjusting in the informal sector.
References
[1] Aghion, P., Fally T. and S. Scarpetta, (2007). “Credit constraints as a barrier to entry and
post-entry growth of firms.”Economic Policy, 22, 52, 731-779.
[2] Almeida, R.. and P. Carneiro, Enforcement of labour regulation and firm size. Journal of Com-
parative Economics, 37 (2009) 28-46.
[3] Autor, D. H., W. R. Kerr and A. D. Kugler (2007). "Does Employment Protection Reduce
Productivity? Evidence From US States," Economic Journal, Royal Economic Society, vol.
117(521), pages 189-217 (6).
[4] Bartelsman, E. J. and J. Hinloopen (2005). "Unleashing animal spirits: ICT and economic
growth", in L. Soete and B. ter Weel (eds.), The Economics of the Digital Economy, Edward
Elgar Publishing
[5] Beck, T., A. Demirguc-Kunt, V. Maksimovic, Financial and Legal Constraints to Growth: Does
Firm Size Matter? The Journal of Finance, vol. LX No.1 (2005), 137-177
[6] Beck, T., C. Lin, Y. Ma, Why Do Firms Evade Taxes? The Role of Information Sharing and
Financial Sector Outreach. The Journal of Finance 69 (2010).
[7] Besley T., A. Jensen and T. Persson (2015), Norms, Enforcement and Tax Evasion, CEPR
Discussion Paper No DP10372, Center for Economic and Policy Research.
[8] Bertola, G. (1994). “Flexibility, investment, and growth.”Journal of Monetary Economics 34
(2), 215—238.
[9] Bassanini A., L. Nunziata and D. Venn (2009). "Job protection legislation and productivity
growth in OECD countries," Economic Policy, CEPR;CES;MSH, vol. 24, pages 349-402, 04.
16
[10] Belot, M., J. Boone and J. Van Ours (2004). "Does the recent success of some OECD countries
in lowering their unemployment rates lie in the clever design of their labor market reforms?,"
Oxford Economic Papers, Oxford University Press, vol. 56(4).
[11] Belot, M., J. Boone and J. Van Ours (2007). "Welfare-Improving Employment Protection",
Economica, 74, 381—396.
[12] Bertola, G. (1992). "Labor Turnover Costs and Average Labor Demand," Journal of Labor
Economics, University of Chicago Press, vol. 10(4), pages 389-411.
[13] Bertola, G. (1994). "Flexibility, investment, and growth," Journal of Monetary Economics,
Elsevier, vol. 34(2), pages 215-238.
[14] Bertola, G. and R. Rogerson (1997). "Institutions and labor reallocation," European Economic
Review, vol. 41(6), pages 1147-1171.
[15] Besley, T. and R. Burgess (2004). "Can Labor Regulation Hinder Economic Performance?
Evidence from India," The Quarterly Journal of Economics, MIT Press, vol. 119(1), pages
91-134.
[16] Blanchard, O. and P. Portugal (2001). “What Hides behind an Unemployment Rate? Compar-
ing Portuguese and U.S. Labor Markets”, American Economic Review 91(1):187-207.
[17] Blanchard, O. and J. Wolfers (2000). "The Role of Shocks and Institutions in the Rise of
European Unemployment: The Aggregate Evidence," Economic Journal, vol. 110(462), pages
C1-33.
[18] Bloom, N (2009). "The impact of uncertainty shocks", Econometrica, vol. Vol. 77 (3), 623—685.
[19] Boeri, T. and J.F. Jimeno (2005). ‘The effects of employment protection: learning from variable
enforcement’, European Economic Review, vol. 49(8), pp. 2057—77.
[20] Bosch M. and J Esteban-Pretel (2012), Job Creation and Job Destruction in the Presence of
Informal Markets, Journal of Development Economics 98 pp. 270—286
[21] Botero J G, S. Djankov, R. La Porta, F. Lopez-de-Silanes, A. Shleifer (2004), “The Regulation
of Labour”, The Quarterly Journal of Economics, November
[22] Bottasso, A., Conti, M. and G. Sulis, (2016) "Firm Dynamics and Employment Protection:
Evidence from Sectoral Data," IZA Discussion Papers 9740, IZA.
17
[23] Chemin, M. (2012). "Does Court Speed Shape Economic Activity? Evidence from a Court
Reform in India," Journal of Law, Economics and Organization, vol. 28(3), pages 460-485.
[24] Chemin, M. (2009). "Do judiciaries matter for development? Evidence from India," Journal of
Comparative Economics, Elsevier, vol. 37(2), pages 230-250.
[25] Cingano, F., M. Leonardi, J. Messina and G. Pica (2015). “Employment Protection Legislation,
Capital Investment and Access to Credit: Evidence from Italy”, Economic Journal, forthcoming.
[26] Cingano, F., M. Leonardi, J. Messina and G. Pica (2010). “The Effect of Employment Protection
Legislation and Financial Market Imperfections on Investment: Evidence from a Firm-Level
Panel of EU Countries”, Economic Policy vol. 25, pages 117-163.
[27] Coviello D., Moretti L., Spagnolo G. and P. Valbonesi (2016). “Court Effi ciency and Procure-
ment Performance”2016, The Scandinavian Journal of Economics, forthcoming.
[28] Dabla Norris, E., M. Gradstein, G. Inchauste, What causes firms to hide output? The deter-
minants of informality. Journal of Development Economics 85 (2008) 1—27
[29] Davis, S. J., J. Haltiwanger and S. Schuh (1996). “Job Creation and Job Destruction”, MIT
press.
[30] Di Porto E., L. Elia and C.Tealdi (2016), Informal work in a flexible labour market, Oxford
Economic Papers, March pp.1—22
[31] Fantozzi, R. and M. Raitano, Political cycle and reported labour incomes in Italy: Quasi-
[32] Fortin, B., N. Marceau, L. Savard, Taxation, wage controls and the informal sector. Journal of
Public Economics 66 (1997) 293—312
[33] Friedman, E., S. Johnson, D. Kaufmann, P. Zoido-Lobaton, Dodging the grabbing hand: the
determinants of unoffi cial activity in 69 countries. Journal of Public Economics 76 (2000) 459—
493
[34] Djankov S. & R. La Porta & F. Lopez-De-Silanes & A. Shleifer (2003). "Courts," The Quarterly
Journal of Economics, 118(2): 453-517.
[35] Economic Forum (2014). The Global Competitiveness Report 2014-2015, Geneva,
www.weforum.org/gcr.
[36] Fabbri, D. (2010). "Law Enforcement and Firm Financing: Theory and Evidence", Journal of
the European Economic Association, 8(4): 776-816.
18
[37] Fraisse, H., F. Kramarz and C. Prost (2009). “Labor Court Inputs, Judicial Cases Outcomes
and Labor Flows: Identifying Real EPL”, Working papers 256, Banque de France.
[38] Gandelman N. and A. Rasteletti, (2013). "Credit Constraints, Sector Informality and Firm
Investments: Evidence from a Panel of Uruguayan Firms," Research Department Publications
IDB-WP-392, Inter-American Development Bank, Research Department.
[39] Garibaldi, P. and G., L. Violante (2005). ‘The employment effects of severance payments with
wage rigidities’, Economic Journal, vol. 115, pp. 799—832.
[40] Garibaldi, P., Pacelli, L., and A. Borgarello, ( 2004). Employment protection legislation and
the size of firms. Giornale degli economisti e annali di economia 63, 33—68.
[41] Giacomelli S. and C. Menon (2013). "Firm size and judicial effi ciency: evidence from the
neighbour’s court", Temi di discussione (Economic working papers) 898, Bank of Italy.
[42] Gomez-Salvador, R, Messina, J. and G. Vallanti (2004). "Gross job flows and institutions in
Europe," Labour Economics, Elsevier, vol. 11(4), pages 469-485.
[43] Guiso, L., Sapienza, P. and Zingales, L. (2004). "The role of social capital in financial develop-
ment", American Economic Review 94(3): 526 —556.
[44] Hijzen A., Mondauto L. and S. Scarpetta, (2013)."The Perverse Effects of Job-security Provi-
sions on Job Security in Italy: Results from a Regression Discontinuity Design," OECD Social,
Employment and Migration Working Papers 151, OECD Publishing.
[45] Hopenhayn, H. and R. Rogerson (1993). "Job Turnover and Policy Evaluation: A General
Equilibrium Analysis," Journal of Political Economy, vol. 101(5), pages 915-38.
[46] Ichino, A. and R. T. Riphahn (2005). ‘The effect of employment protection on worker effort:
a comparison of absenteeism during and after probation’, Journal of the European Economic
Association, vol. 3, pp. 120—43.
[47] ISTAT, (2001). La giustizia civile in Italia: funzionalità e processo di riforma, Informazioni n.3.
ISTAT, Rome.
[48] Jappelli, T, M. Pagano and M. Bianco (2005). "Courts and Banks: Effects of Judicial Enforce-
ment on Credit Markets," Journal of Money, Credit and Banking, vol. 37(2), pages 223-44.
[49] Koeniger W. and J. Prat, (2007). “Employment protection, product market regulation and firm
selection.”The Economic Journal, 117, F302-F332
19
[50] Kugler, A., and G. Pica, (2008). "Effects of Employment Protection on Worker and Job Flows:
Evidence from the 1990 Italian Reform", Labour Economics, Vol. 15 (1) pp. 78-95.
[51] Kugler, A. and M, Kugler (2009). Labor market effects of payroll taxes in developing countries:
evidence from Colombia , Economic Development and Cultural Change, vol. 57(2) pp. 335—58
[52] Kumar, K. B., R. G. Rajan and L. Zingales, (1999). "What Determines Firm Size?," NBER
Working Papers 7208, National Bureau of Economic Research, Inc.
[53] Lagos, R. (2006) "A Model of TFP", Review of Economic Studies, Wiley Blackwell, vol. 73(4),
pages 983-1007.
[54] Lederman D., N.V. Loayza, R.R. Soares (2005), Accountability and Corruption: Political In-
stitutions Matter. Economics and Politics, 17:1, pp 1-35
[55] Leonardi M. and G. Pica (2013). "Who Pays for it? The Heterogeneous Wage Effects of Em-
ployment Protection Legislation," Economic Journal, Royal Economic Society, vol. 123(12),
pages 1236-1278.
[56] Loayza, N.V. (1996), The Economics of the Informal Sector: A Simple Model and Some Em-
pirical Evidence from Latin America, Carnegie-Rochester Conference Series on Public Policy
45, 129-162.
[57] Messina, J. and G. Vallanti (2007). "Job Flow Dynamics and Firing Restrictions: Evidence
from Europe," Economic Journal, Royal Economic Society, vol. 117(521), 279-301, 06.
[58] Micco, A. and C. Page´s (2004). "Employment Protection and Gross Job Flows" Econometric
Society 2004 Latin American Meetings 295, Econometric Society.
[59] Mortensen, D.T. and C. A. Pissarides (1994). "Job Creation and Job Destruction in the Theory
of Unemployment," Review of Economic Studies, vol. 61(3), pages 397-415.
[60] Nordhaus, W., The political business cycle. Review of Economic Studies, 42, (1975) 169—190.
[61] Nunn N. (2007). "Relationship-Specificity, Incomplete Contracts, and the Pattern of Trade,"
The Quarterly Journal of Economics, MIT Press, vol. 122(2), pages 569-600, 05.
[62] Packard T., J. Koetll, C. E. Montenegro (2012), In from the Shadow. Integrating Europe’s
Informal Labour, The World Bank
[63] Palumbo G., Giupponi, G., Nunziata, L. and J. Mora-Sanguinetti (2013). Judicial performance
and its determinants, cross country perspective, OECD Economic Papers.
20
[64] Poschke, M. (2009). "Employment protection, firm selection, and growth," Journal of Monetary
Economics, Elsevier, vol. 56(8), pages 1074-1085.
[65] OECD (2006). “The Short-term labour market effects of structural reforms: Pain before the
gain?”The Employment Outlook, OECD, Paris.
[66] OECD (2013). “What makes civil justice effective?”, OECD Economics Department Policy
Notes, No. 18 June.
[67] OECD (2012). "Reviving growth and productivity", OECD “Better Policies”Series.
[68] Pissarides, C.A., (2000). Equilibrium Unemployment Theory, Cambridge MIT Press.
[69] Rajan, R. and L. Zingales (1998). “Financial Dependence and Growth”, The American Eco-
nomic Review 88: 559-586.
[70] Saint-Paul, G. (1993). "On the political economy of labor market flexibility", NBER Book Series
NBER Macroeconomics Annual, MIT Press, 151—96.
[71] Salvanes, K. G. (1997). " Market Rigidities and Labour Market Flexibility: An International
Comparison," Scandinavian Journal of Economics, vol. 99(2), pages 315-33.
[72] Sarte, P.-D., Informality and rent-seeking bureaucracies in a model of long-run growth- Journal
of Monetary Economics 46 (2000) 173-197
[73] Schaffer, M. E. (2010). "XTIVREG2: Stata module to perform extended IV/2SLS, GMM and
AC/HAC, LIML and k-class regression for panel data models," Statistical Software Components
S456501, Boston College Department of Economics, revised 22 Feb 2015.
[74] Schivardi, F. and R. Torrini, (2008). "Identifying the effects of firing restrictions through size-
contingent differences in regulation," Labour Economics, Elsevier, vol. 15(3), pages 482-511.
[75] Schneider, F. (2001) The Shadow Economy and Shadow Economy Labor Force: What Do We
(Not) Know?, IZA DP No. 5769
[76] Schneider, F. and D. Enste (2000), Shadow Economies: Size, Causes and Consequences, Journal
of Economic Literature 38/1, 73-110.
[77] Skouras, S. and N. Christodoulakis, Electoral misgovernance cycles: evidence from wildfires and
tax evasion in Greece, Public Choice (2014) 159:533—559
21

[78] Venn, D. (2009), “Legislation, Collective Bargaining and Enforcement: Updating the OECD
Employment Protection Indicators”, OECD Social, Employment and Migration Working Paper,
No. 89.
[79] World Bank (2012). Doing Business 2011. Washington, DC: World Bank Group
[80] World Bank (2013). Doing Business 2012. Washington, DC: World Bank Group.
22
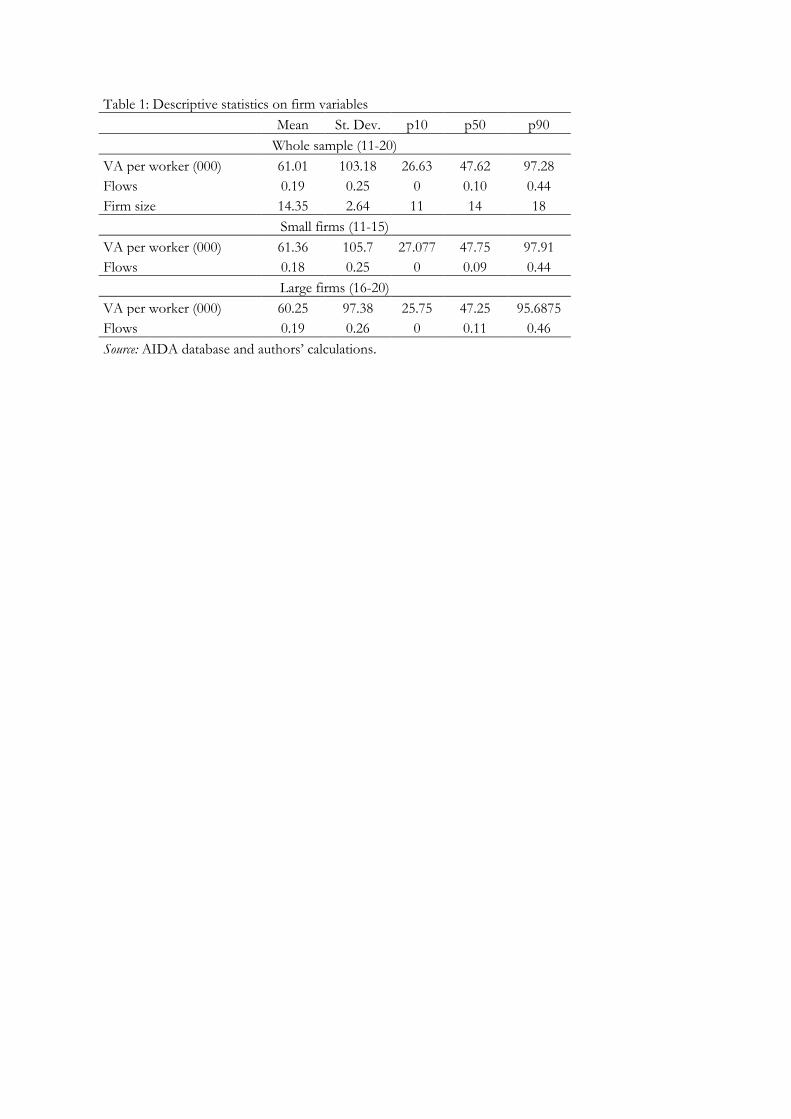
Table 1: Descriptive statistics on firm variables
Mean St. Dev. p10 p50 p90
Whole sample (11-20)
VA per worker (000) 61.01 103.18 26.63 47.62 97.28
Flows 0.19 0.25 0 0.10 0.44
Firm size 14.35 2.64 11 14 18
Small firms (11-15)
VA per worker (000) 61.36 105.7 27.077 47.75 97.91
Flows 0.18 0.25 0 0.09 0.44
Large firms (16-20)
VA per worker (000) 60.25 97.38 25.75 47.25 95.6875
Flows 0.19 0.26 0 0.11 0.46
Source: AIDA database and authors’ calculations.
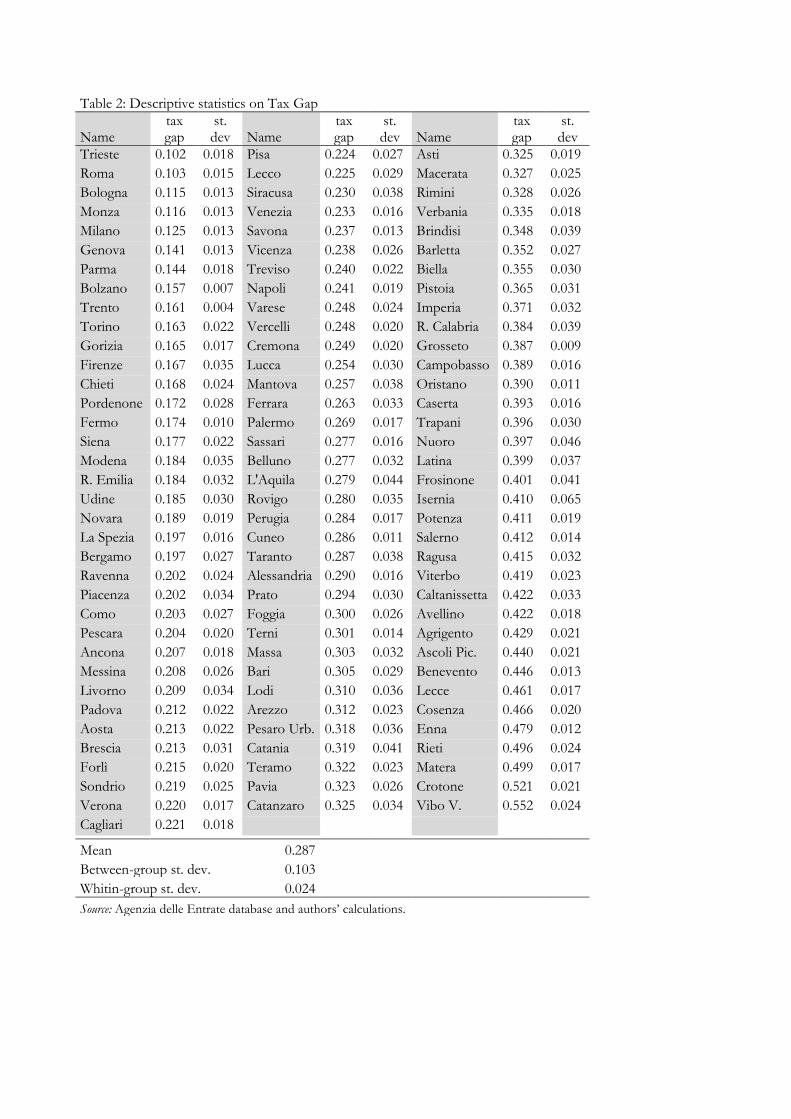
Table 2: Descriptive statistics on Tax Gap
Name tax gap
st. dev Name
tax gap
st. dev Name
tax gap
st. dev
Trieste 0.102 0.018 Pisa 0.224 0.027 Asti 0.325 0.019
Roma 0.103 0.015 Lecco 0.225 0.029 Macerata 0.327 0.025
Bologna 0.115 0.013 Siracusa 0.230 0.038 Rimini 0.328 0.026
Monza 0.116 0.013 Venezia 0.233 0.016 Verbania 0.335 0.018
Milano 0.125 0.013 Savona 0.237 0.013 Brindisi 0.348 0.039
Genova 0.141 0.013 Vicenza 0.238 0.026 Barletta 0.352 0.027
Parma 0.144 0.018 Treviso 0.240 0.022 Biella 0.355 0.030
Bolzano 0.157 0.007 Napoli 0.241 0.019 Pistoia 0.365 0.031
Trento 0.161 0.004 Varese 0.248 0.024 Imperia 0.371 0.032
Torino 0.163 0.022 Vercelli 0.248 0.020 R. Calabria 0.384 0.039
Gorizia 0.165 0.017 Cremona 0.249 0.020 Grosseto 0.387 0.009
Firenze 0.167 0.035 Lucca 0.254 0.030 Campobasso 0.389 0.016
Chieti 0.168 0.024 Mantova 0.257 0.038 Oristano 0.390 0.011
Pordenone 0.172 0.028 Ferrara 0.263 0.033 Caserta 0.393 0.016
Fermo 0.174 0.010 Palermo 0.269 0.017 Trapani 0.396 0.030
Siena 0.177 0.022 Sassari 0.277 0.016 Nuoro 0.397 0.046
Modena 0.184 0.035 Belluno 0.277 0.032 Latina 0.399 0.037
R. Emilia 0.184 0.032 L'Aquila 0.279 0.044 Frosinone 0.401 0.041
Udine 0.185 0.030 Rovigo 0.280 0.035 Isernia 0.410 0.065
Novara 0.189 0.019 Perugia 0.284 0.017 Potenza 0.411 0.019
La Spezia 0.197 0.016 Cuneo 0.286 0.011 Salerno 0.412 0.014
Bergamo 0.197 0.027 Taranto 0.287 0.038 Ragusa 0.415 0.032
Ravenna 0.202 0.024 Alessandria 0.290 0.016 Viterbo 0.419 0.023
Piacenza 0.202 0.034 Prato 0.294 0.030 Caltanissetta 0.422 0.033
Como 0.203 0.027 Foggia 0.300 0.026 Avellino 0.422 0.018
Pescara 0.204 0.020 Terni 0.301 0.014 Agrigento 0.429 0.021
Ancona 0.207 0.018 Massa 0.303 0.032 Ascoli Pic. 0.440 0.021
Messina 0.208 0.026 Bari 0.305 0.029 Benevento 0.446 0.013
Livorno 0.209 0.034 Lodi 0.310 0.036 Lecce 0.461 0.017
Padova 0.212 0.022 Arezzo 0.312 0.023 Cosenza 0.466 0.020
Aosta 0.213 0.022 Pesaro Urb. 0.318 0.036 Enna 0.479 0.012
Brescia 0.213 0.031 Catania 0.319 0.041 Rieti 0.496 0.024
Forlì 0.215 0.020 Teramo 0.322 0.023 Matera 0.499 0.017
Sondrio 0.219 0.025 Pavia 0.323 0.026 Crotone 0.521 0.021
Verona 0.220 0.017 Catanzaro 0.325 0.034 Vibo V. 0.552 0.024
Cagliari 0.221 0.018 Mean 0.287 Between-group st. dev. 0.103 Whitin-group st. dev. 0.024 Source: Agenzia delle Entrate database and authors’ calculations.
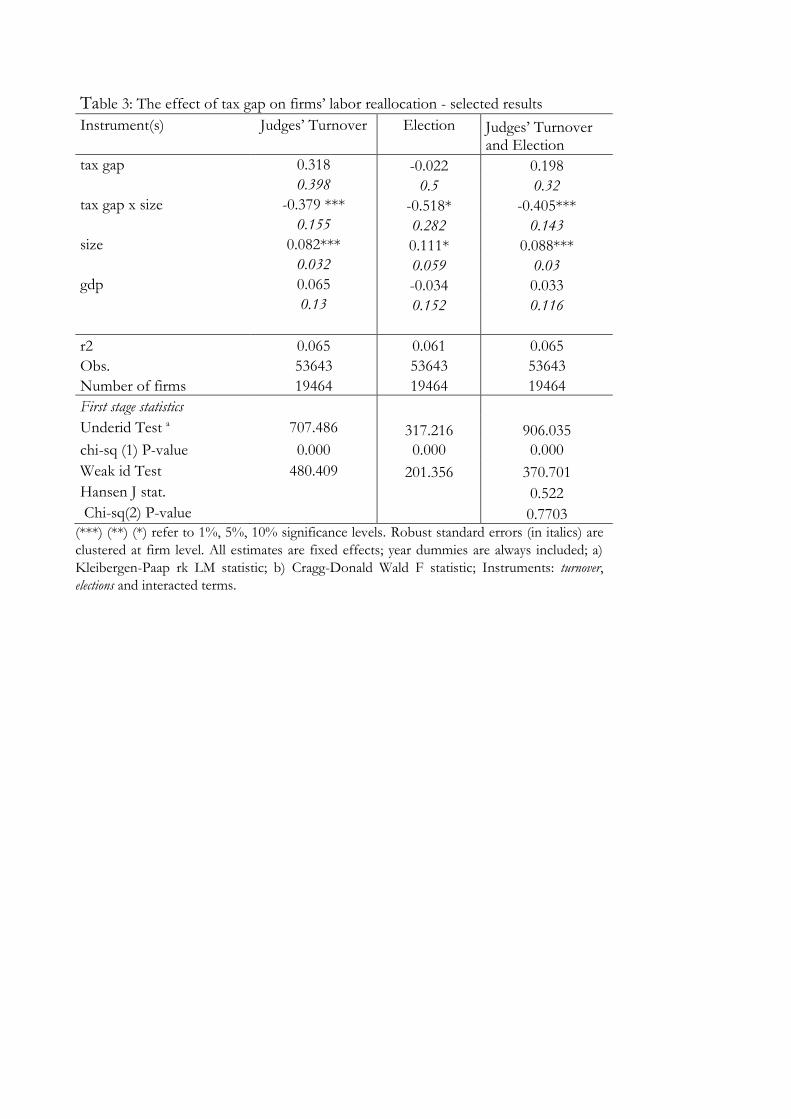
Table 3: The effect of tax gap on firms’ labor reallocation - selected results
Instrument(s) Judges’ Turnover Election Judges’ Turnover and Election
tax gap 0.318 -0.022 0.198 0.398 0.5 0.32
tax gap x size -0.379 *** -0.518* -0.405*** 0.155 0.282 0.143
size 0.082*** 0.111* 0.088*** 0.032 0.059 0.03
gdp 0.065 -0.034 0.033 0.13 0.152 0.116
r2 0.065 0.061 0.065
Obs. 53643 53643 53643
Number of firms 19464 19464 19464
First stage statistics Underid Test a 707.486 317.216 906.035
chi-sq (1) P-value 0.000 0.000 0.000
Weak id Test 480.409 201.356 370.701
Hansen J stat. 0.522
Chi-sq(2) P-value 0.7703
(***) (**) (*) refer to 1%, 5%, 10% significance levels. Robust standard errors (in italics) are
clustered at firm level. All estimates are fixed effects; year dummies are always included; a)
Kleibergen-Paap rk LM statistic; b) Cragg-Donald Wald F statistic; Instruments: turnover,
elections and interacted terms.
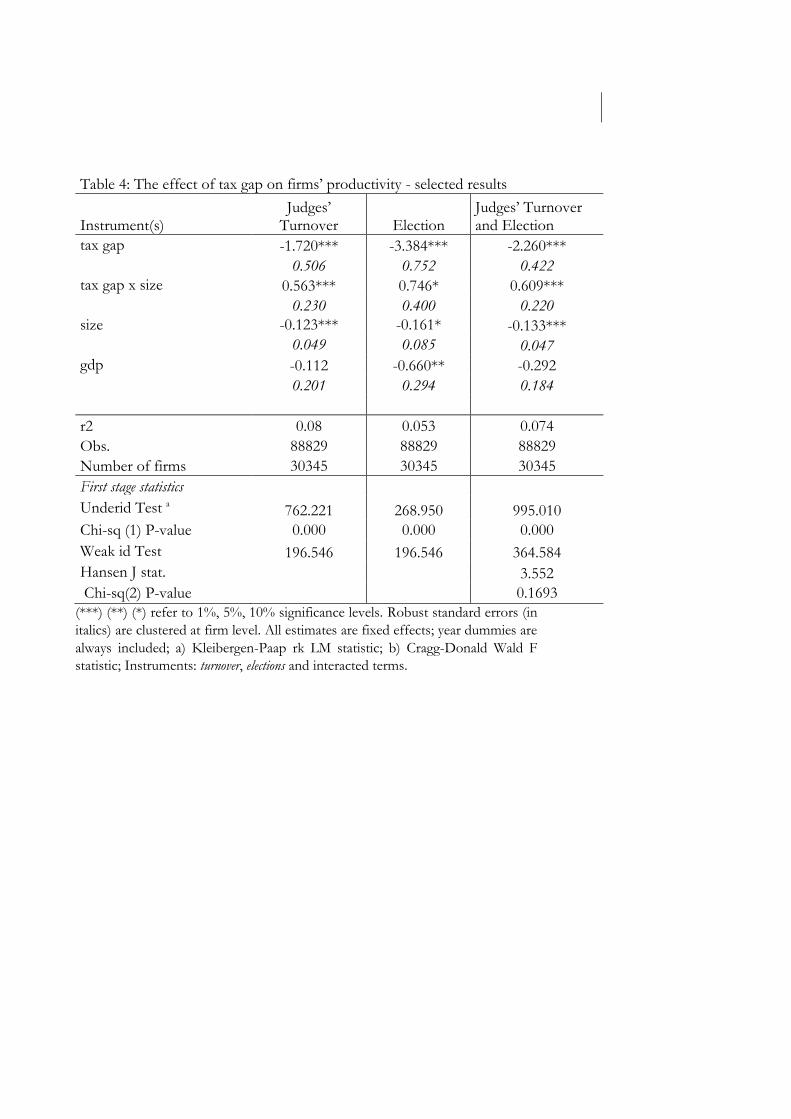
Table 4: The effect of tax gap on firms’ productivity - selected results
Instrument(s) Judges’
Turnover Election Judges’ Turnover and Election
tax gap -1.720*** -3.384*** -2.260*** 0.506 0.752 0.422
tax gap x size 0.563*** 0.746* 0.609*** 0.230 0.400 0.220
size -0.123*** -0.161* -0.133*** 0.049 0.085 0.047
gdp -0.112 -0.660** -0.292 0.201 0.294 0.184
r2 0.08 0.053 0.074
Obs. 88829 88829 88829
Number of firms 30345 30345 30345
First stage statistics
Underid Test a 762.221 268.950 995.010
Chi-sq (1) P-value 0.000 0.000 0.000
Weak id Test 196.546 196.546 364.584
Hansen J stat. 3.552
Chi-sq(2) P-value 0.1693
(***) (**) (*) refer to 1%, 5%, 10% significance levels. Robust standard errors (in
italics) are clustered at firm level. All estimates are fixed effects; year dummies are
always included; a) Kleibergen-Paap rk LM statistic; b) Cragg-Donald Wald F
statistic; Instruments: turnover, elections and interacted terms.
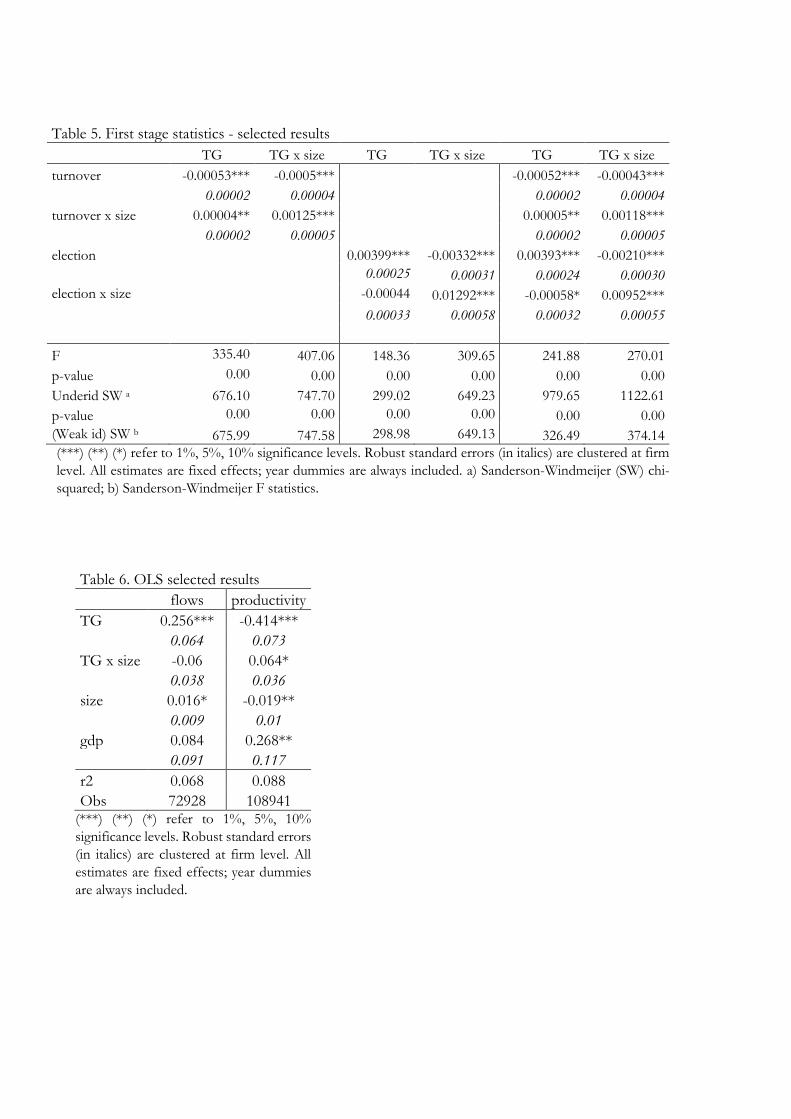
Table 5. First stage statistics - selected results
TG TG x size TG TG x size TG TG x size
turnover -0.00053*** -0.0005*** -0.00052*** -0.00043***
0.00002 0.00004 0.00002 0.00004
turnover x size 0.00004** 0.00125*** 0.00005** 0.00118***
0.00002 0.00005 0.00002 0.00005
election 0.00399*** -0.00332*** 0.00393*** -0.00210***
0.00025 0.00031 0.00024 0.00030
election x size -0.00044 0.01292*** -0.00058* 0.00952***
0.00033 0.00058 0.00032 0.00055
F 335.40 407.06 148.36 309.65 241.88 270.01
p-value 0.00 0.00 0.00 0.00 0.00 0.00
Underid SW a 676.10 747.70 299.02 649.23 979.65 1122.61
p-value 0.00 0.00 0.00 0.00 0.00 0.00
(Weak id) SW b 675.99 747.58 298.98 649.13 326.49 374.14
(***) (**) (*) refer to 1%, 5%, 10% significance levels. Robust standard errors (in italics) are clustered at firm
level. All estimates are fixed effects; year dummies are always included. a) Sanderson-Windmeijer (SW) chi-
squared; b) Sanderson-Windmeijer F statistics.
Table 6. OLS selected results
flows productivity
TG 0.256*** -0.414***
0.064 0.073
TG x size -0.06 0.064*
0.038 0.036
size 0.016* -0.019**
0.009 0.01
gdp 0.084 0.268**
0.091 0.117
r2 0.068 0.088
Obs 72928 108941 (***) (**) (*) refer to 1%, 5%, 10%
significance levels. Robust standard errors
(in italics) are clustered at firm level. All
estimates are fixed effects; year dummies
are always included.
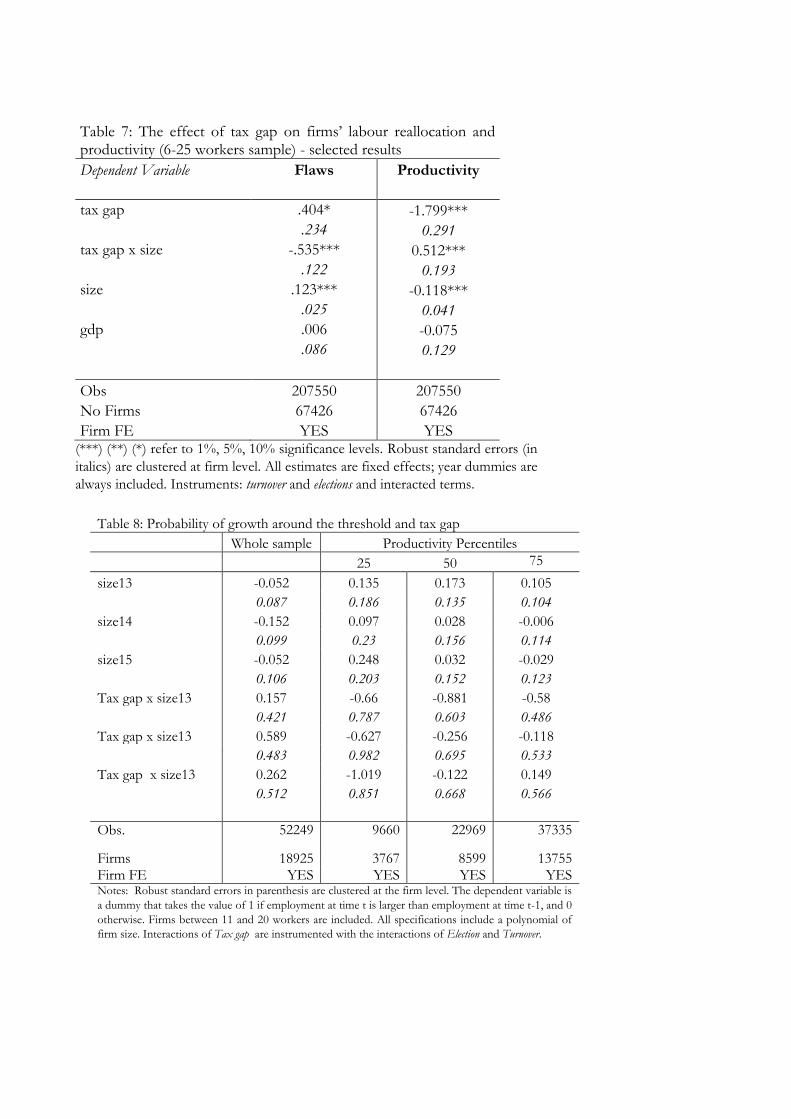
Table 7: The effect of tax gap on firms’ labour reallocation and productivity (6-25 workers sample) - selected results
Dependent Variable Flaws Productivity
tax gap .404* -1.799***
.234 0.291
tax gap x size -.535*** 0.512*** .122 0.193
size .123*** -0.118*** .025 0.041
gdp .006 -0.075 .086 0.129
Obs 207550 207550
No Firms 67426 67426
Firm FE YES YES (***) (**) (*) refer to 1%, 5%, 10% significance levels. Robust standard errors (in
italics) are clustered at firm level. All estimates are fixed effects; year dummies are
always included. Instruments: turnover and elections and interacted terms.
Table 8: Probability of growth around the threshold and tax gap
Whole sample Productivity Percentiles
25 50 75
size13 -0.052 0.135 0.173 0.105
0.087 0.186 0.135 0.104
size14 -0.152 0.097 0.028 -0.006
0.099 0.23 0.156 0.114
size15 -0.052 0.248 0.032 -0.029
0.106 0.203 0.152 0.123
Tax gap x size13 0.157 -0.66 -0.881 -0.58
0.421 0.787 0.603 0.486
Tax gap x size13 0.589 -0.627 -0.256 -0.118
0.483 0.982 0.695 0.533
Tax gap x size13 0.262 -1.019 -0.122 0.149
0.512 0.851 0.668 0.566
Obs. 52249 9660 22969 37335
Firms 18925 3767 8599 13755 Firm FE YES YES YES YES Notes: Robust standard errors in parenthesis are clustered at the firm level. The dependent variable is
a dummy that takes the value of 1 if employment at time t is larger than employment at time t-1, and 0
otherwise. Firms between 11 and 20 workers are included. All specifications include a polynomial of
firm size. Interactions of Tax gap are instrumented with the interactions of Election and Turnover.
Graph 1: Firm size distribution
0.2
.4.6
.8
Den
sity
10 12 14 16 18 20firm size