tax evasion dynamics in romania reflected by fiscal ... · tax evasion dynamics in romania...
TRANSCRIPT
Tax Evasion Dynamics in Romania Reflected by Fiscal Inspection Activities
Author1:
Corina-Maria ENE
bstract. The paper aims to provide a panoramic view of the dynamics of tax evasion in Romania, reflected in terms of fiscal inspection activities. The author used the official data published by the institutions with attributions on the line of identification and fighting against tax evasion
(National Agency of Fiscal Administration and Financial Guard) with the view to reflect the real situation concerning the number of inspections, quantify and sanction tax evasion for 2003-2008 periods. Although the number of fiscal inspections and the number of tax payers who have violated the rules of fiscal discipline decreased compared with 2003, the frequency of tax evasion remained. At the same time, based on the data referring to the level and dynamics of the tax dodger phenomenon appreciations have been made regarding the fiscal discipline of the Romanian tax payer and to the attitude of the qualified institutions in discovering and sanctioning the fraudulent tax evasion. In this respect, the author observed that the level of willingness of tax legislation in relation to the Romanian tax payer has not changed considerably. The level of identified tax evasion reported to real GDP increased slightly. This situation can be interpreted as a success of institutions in charge of identification and fighting of tax evasion, a result of the increase of fiscal inspection number and detection probability, but also a result of GDP growth at a rate lower than the identified tax evasion. The author has also tried to find a causality relation between the option for tax evasion and corruption. The author found that a corrupt environment facilitates the decision to evade depending on detection probability, penalty system and bribery level as discouraging factors for tax evasion. The level of identified tax evasion is smaller than the real level of entire tax evasion, an important part being impossible to determine because of corruption.
1 Corina–Maria Ene, Ph.D. Student, Assistant Professor, Hyperion University, Bucharest, e-
mail: [email protected]
A
Tax Evasion Dynamics in Romania
147
Key words: tax evasion, fiscal fraud, fiscal inspections, fiscal discipline, voluntary fiscal compliance, underground economy, corruption
JEL Classification: D70, D73, E62, H26, H30, H60, K34, K42, O17, P37
1. Introduction In post-revolutionary Romania, tax payers consider evasion as a true virtue, an attribute of an intelligent evil that offer the possibility to protect the property and monetary interests of the individual escapist regardless of social status and its financial position. To a lesser or greater extent, all countries face this problem. Government measures aim essentially to limit it as much as possible. The eradication is practically impossible. The legislative, economic and social situation has made the proliferation of tax evasion phenomenon possible. This is an important part of underground economy and it is ubiquitous in all areas of income generating activities. Taxation stimulates the Romanian tax payer’s ingenuity determining him to seek and apply different procedures in order to circumvent the law. Romania has also created the necessary and sufficient conditions for tax evasion: instability of tax legislation, inconsistencies and legislative gaps, useless law concerning tax evasion, bureaucratic corruption, but also the existence of a higher fiscal pressure, an unequal relation between taxation and taxpayer real capacity to pay tax obligations.
2. Observations on data processing and interpretation of results obtained
The author focused the study on the dynamics of identified tax evasion (fiscal fraud) based on data records of institutions in charge of identification and fighting of tax evasion. The management of taxes, contributions and other amounts owed to the general consolidated budget is the responsibility of the Romanian National Agency of Fiscal Administration, subordinated to the Ministry of Finance. That Agency has a number of bodies concerned with financial control, taxation and customs, namely the Financial Guard, the National Customs Authority, General Directorates of Public Finance, Department of Large Taxpayers and also the General Directorate of Fiscal Inspection Coordination. These structures carry out
C.-M. Ene
148
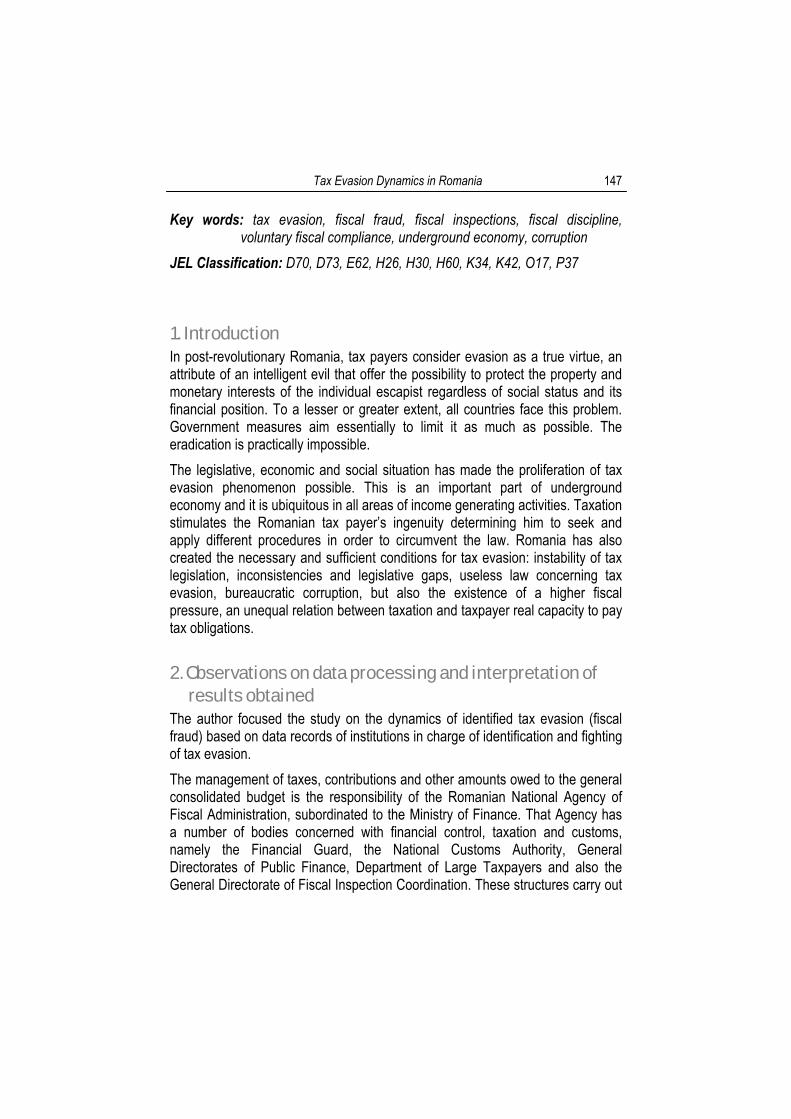
the operational and unannounced control with the purpose of preventing, detecting and combating any acts and facts of economic, financial and customs nature that may generate fiscal evasion. Studies and reports issued by the financial and fiscal control institutions are the result of individual inspections and are focused on the particular mechanisms and cases of fiscal fraud without properly addressing the fiscal policy measures to deal with problems effectively and on a long term. However, it should be noted that removal of a cause will not necessarily eliminate the effect. Public data concerning the number of inspections made by qualified institutions in discovering and sanctioning the fraudulent tax evasion and their results provide an overview of the tax evasion phenomenon in the period 2003-2008 (Table 1), but also offer some considerations regarding those bodies’ attitude.
Table 1
Evolution of tax evasion in Romania (2003-2008) Indicators
Years
Number of
inspections
Number of
identified tax
evasion cases
Share of tax evasion
cases in the total
number of inspections
(%)
The total amount of identified
tax evasion
(thousand lei)
The total amount of penalties imposed
(thousand lei)
The total amount
additionally incurred
(thousand lei)
Share of identified
tax evasion in GDP
(%)
2003 446822 195425 43.74 798900 1804700 2603600 0.405 2004 273020 120077 43.98 982350 1984522 2966872 0.397 2005 286903 115158 40.14 1746304 1137326 2883630 0.600 2006 252719 114750 45.41 1513000 2417000 3930000 0.440 2007 276853 108786 39.29 1828000 3039000 4867000 0.443 2008 287280 134970 46.98 3859000 5586000 9445000 0.770
Note: The total amount of penalties imposed include the penalties, fines, but also the properties and money sequestrated.
Source: National Agency of Fiscal Administration – Information on the results achieved by the institutions in charge of identification and fighting of tax evasion.
In spite of the decrease in number of inspections and taxpayers who have violated the rules of financial and fiscal discipline (compared to 2003, Figure 1), the frequency of tax evasion maintained on an average of 43% for the analised period.
Tax Evasion Dynamics in Romania
149
050000
100000150000200000250000300000350000400000450000500000
2003 2004 2005 2006 2007 2008
Inspections number Number of identified tax evasion cases
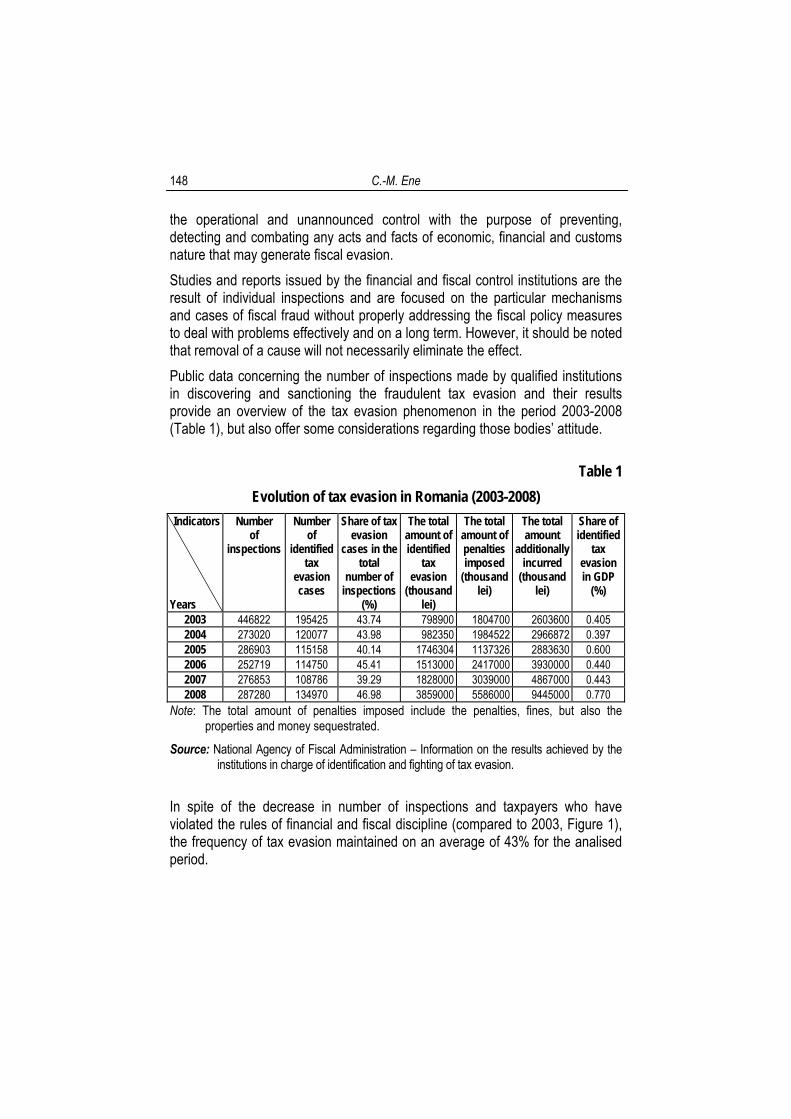
Source: National Agency of Fiscal Administration – Information on the results achieved by the institutions in charge of identification and fighting of tax evasion.
Figure 1. Number of fiscal inspections and number of identified tax evasion cases
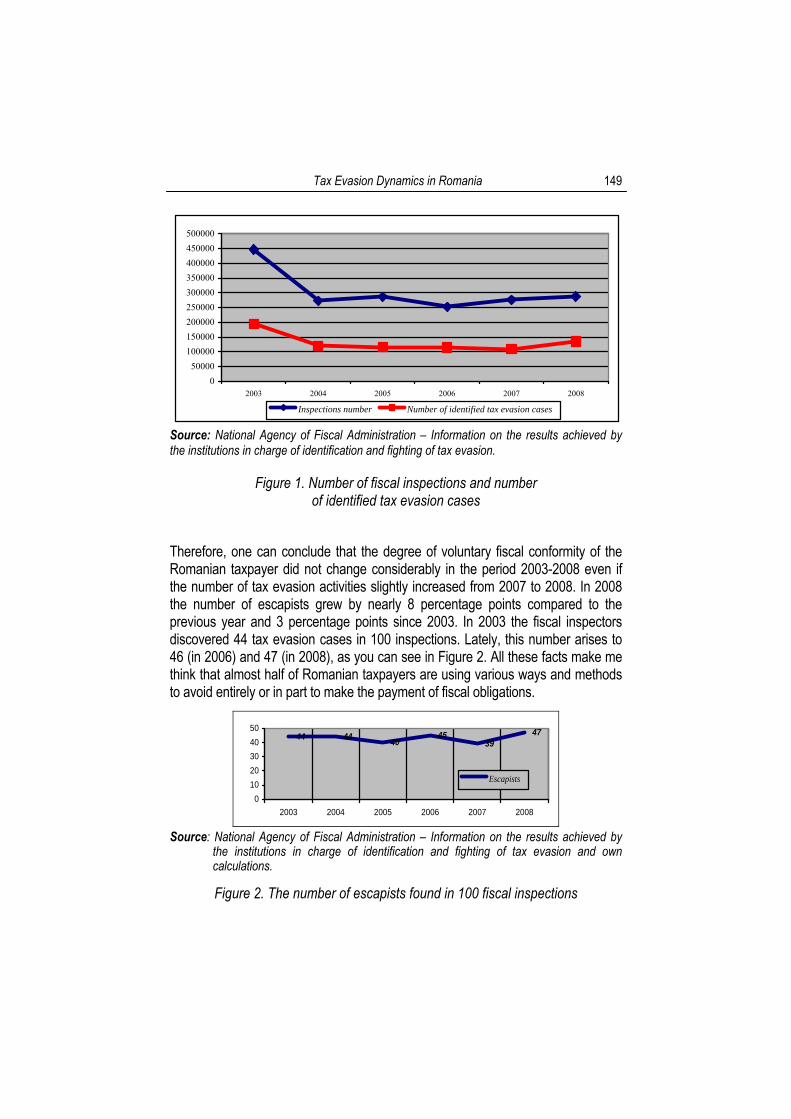
Therefore, one can conclude that the degree of voluntary fiscal conformity of the Romanian taxpayer did not change considerably in the period 2003-2008 even if the number of tax evasion activities slightly increased from 2007 to 2008. In 2008 the number of escapists grew by nearly 8 percentage points compared to the previous year and 3 percentage points since 2003. In 2003 the fiscal inspectors discovered 44 tax evasion cases in 100 inspections. Lately, this number arises to 46 (in 2006) and 47 (in 2008), as you can see in Figure 2. All these facts make me think that almost half of Romanian taxpayers are using various ways and methods to avoid entirely or in part to make the payment of fiscal obligations.
44 44 4045
3947
01020304050
2003 2004 2005 2006 2007 2008
Escapists
Source: National Agency of Fiscal Administration – Information on the results achieved by
the institutions in charge of identification and fighting of tax evasion and own calculations.
Figure 2. The number of escapists found in 100 fiscal inspections
C.-M. Ene
150
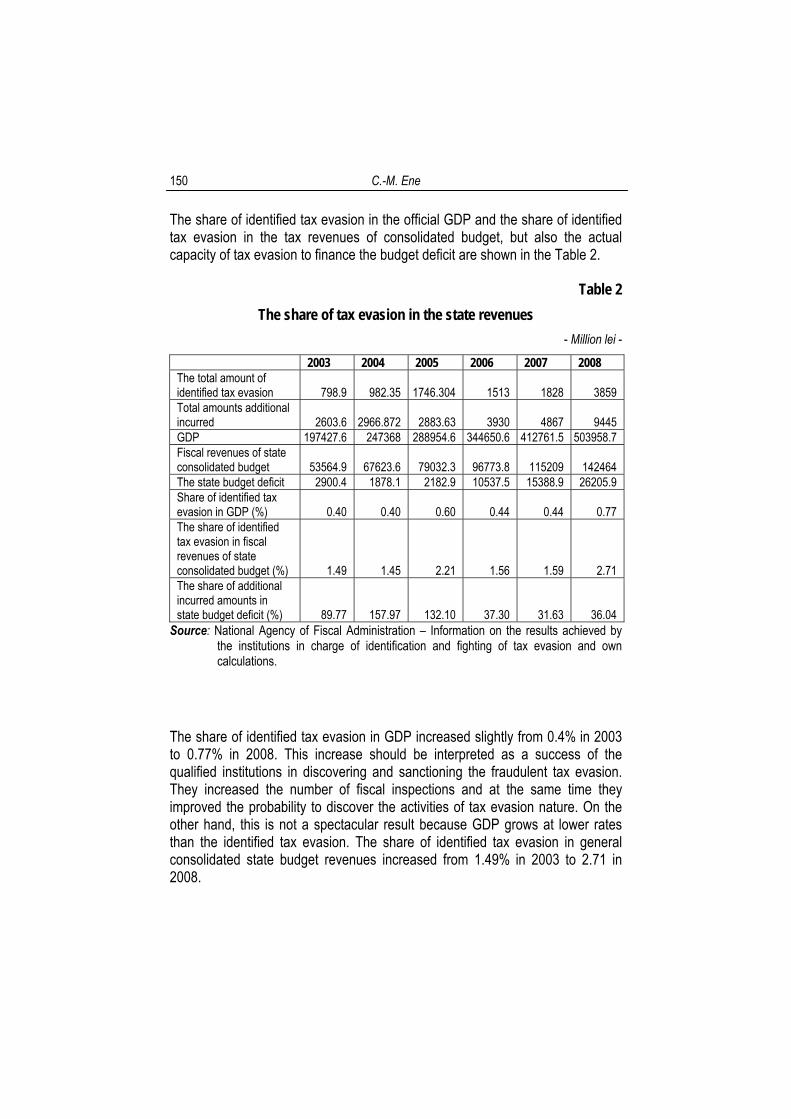
The share of identified tax evasion in the official GDP and the share of identified tax evasion in the tax revenues of consolidated budget, but also the actual capacity of tax evasion to finance the budget deficit are shown in the Table 2.
Table 2
The share of tax evasion in the state revenues - Million lei -
2003 2004 2005 2006 2007 2008 The total amount of identified tax evasion 798.9 982.35 1746.304 1513 1828 3859 Total amounts additional incurred 2603.6 2966.872 2883.63 3930 4867 9445 GDP 197427.6 247368 288954.6 344650.6 412761.5 503958.7 Fiscal revenues of state consolidated budget 53564.9 67623.6 79032.3 96773.8 115209 142464 The state budget deficit 2900.4 1878.1 2182.9 10537.5 15388.9 26205.9 Share of identified tax evasion in GDP (%) 0.40 0.40 0.60 0.44 0.44 0.77 The share of identified tax evasion in fiscal revenues of state consolidated budget (%) 1.49 1.45 2.21 1.56 1.59 2.71 The share of additional incurred amounts in state budget deficit (%) 89.77 157.97 132.10 37.30 31.63 36.04
Source: National Agency of Fiscal Administration – Information on the results achieved by the institutions in charge of identification and fighting of tax evasion and own calculations.
The share of identified tax evasion in GDP increased slightly from 0.4% in 2003 to 0.77% in 2008. This increase should be interpreted as a success of the qualified institutions in discovering and sanctioning the fraudulent tax evasion. They increased the number of fiscal inspections and at the same time they improved the probability to discover the activities of tax evasion nature. On the other hand, this is not a spectacular result because GDP grows at lower rates than the identified tax evasion. The share of identified tax evasion in general consolidated state budget revenues increased from 1.49% in 2003 to 2.71 in 2008.
Tax Evasion Dynamics in Romania
151
0
0,5
1
1,5
2
2,5
3
2003 2004 2005 2006 2007 2008
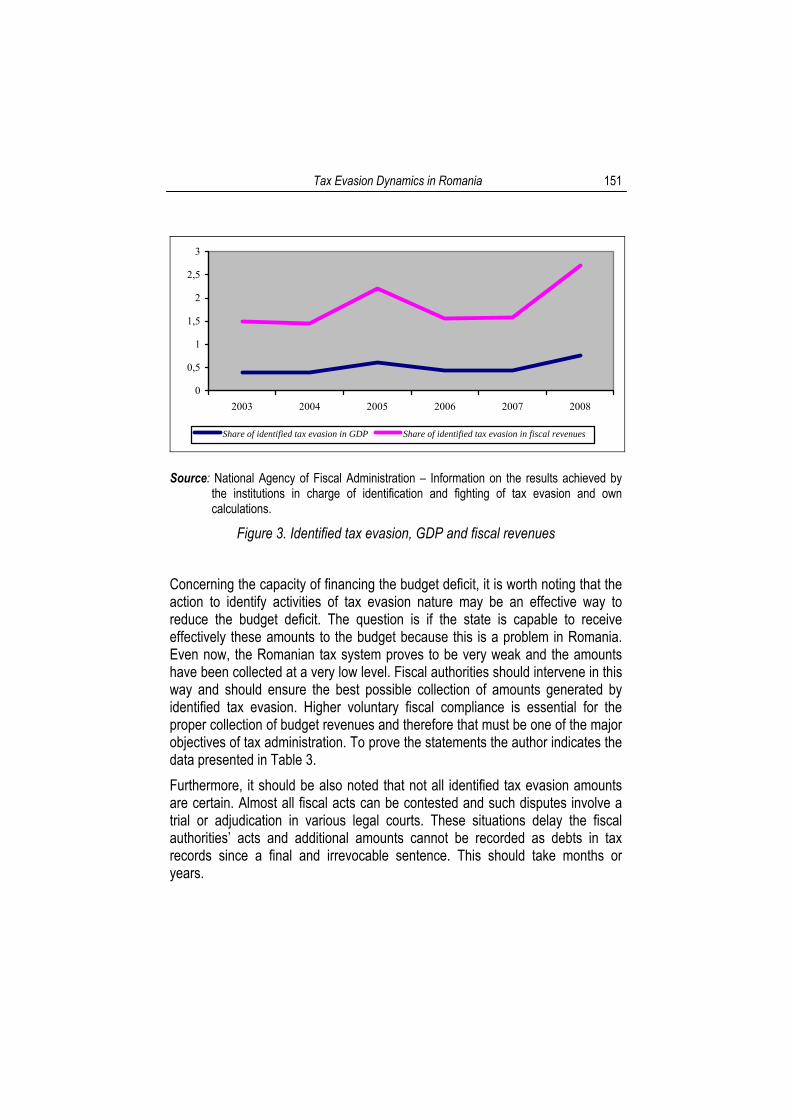
Share of identified tax evasion in GDP Share of identified tax evasion in fiscal revenues
Source: National Agency of Fiscal Administration – Information on the results achieved by
the institutions in charge of identification and fighting of tax evasion and own calculations.
Figure 3. Identified tax evasion, GDP and fiscal revenues
Concerning the capacity of financing the budget deficit, it is worth noting that the action to identify activities of tax evasion nature may be an effective way to reduce the budget deficit. The question is if the state is capable to receive effectively these amounts to the budget because this is a problem in Romania. Even now, the Romanian tax system proves to be very weak and the amounts have been collected at a very low level. Fiscal authorities should intervene in this way and should ensure the best possible collection of amounts generated by identified tax evasion. Higher voluntary fiscal compliance is essential for the proper collection of budget revenues and therefore that must be one of the major objectives of tax administration. To prove the statements the author indicates the data presented in Table 3. Furthermore, it should be also noted that not all identified tax evasion amounts are certain. Almost all fiscal acts can be contested and such disputes involve a trial or adjudication in various legal courts. These situations delay the fiscal authorities’ acts and additional amounts cannot be recorded as debts in tax records since a final and irrevocable sentence. This should take months or years.
C.-M. Ene
152
Table 3
Situation of fine amounts collection determined by Financial Guard - Thousands lei -
Indicator / Years 2004 2005 2006 2007 2008 Criminal complaints 1720 2009 2334 2375 4391 Fines set 108000 162000 193000 273000 251000 Fines collected 89000 122000 139000 178000 156000 Share of fines collected in fines set (%) 82,41 75,31 72,02 65,20 62,15 Confiscations* 154000 124000 89000 104000 131000 Damages** 362000 697000 746000 1400000 2194000 * The indicator “Confiscations” does not cover the value of unavailable goods that are subject to criminal complaints, cigarettes, alcohol and all goods that must be destroyed under the legal provisions. ** The damages are discovered by the Financial Guard exclusively and do not include losses related to this institution’s activity upon notification of a criminal police investigation.
Source: Financial Guard – Report on control activities in 2008.
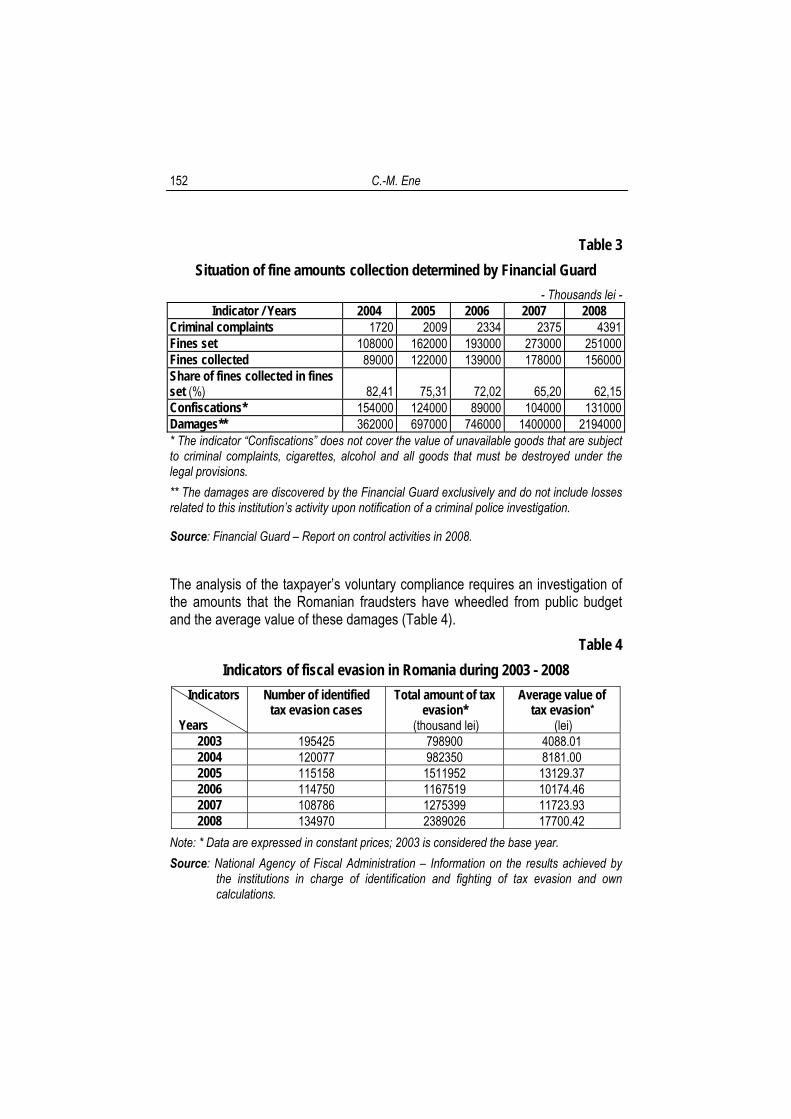
The analysis of the taxpayer’s voluntary compliance requires an investigation of the amounts that the Romanian fraudsters have wheedled from public budget and the average value of these damages (Table 4).
Table 4 Indicators of fiscal evasion in Romania during 2003 - 2008
Indicators Years
Number of identified tax evasion cases
Total amount of tax evasion*
(thousand lei)
Average value of tax evasion*
(lei) 2003 195425 798900 4088.01 2004 120077 982350 8181.00 2005 115158 1511952 13129.37 2006 114750 1167519 10174.46 2007 108786 1275399 11723.93 2008 134970 2389026 17700.42
Note: * Data are expressed in constant prices; 2003 is considered the base year. Source: National Agency of Fiscal Administration – Information on the results achieved by
the institutions in charge of identification and fighting of tax evasion and own calculations.
Tax Evasion Dynamics in Romania
153
0
2000
4000
6000
8000
10000
12000
14000
16000
18000
2003 2004 2005 2006 2007 2008
The average size of tax evasion
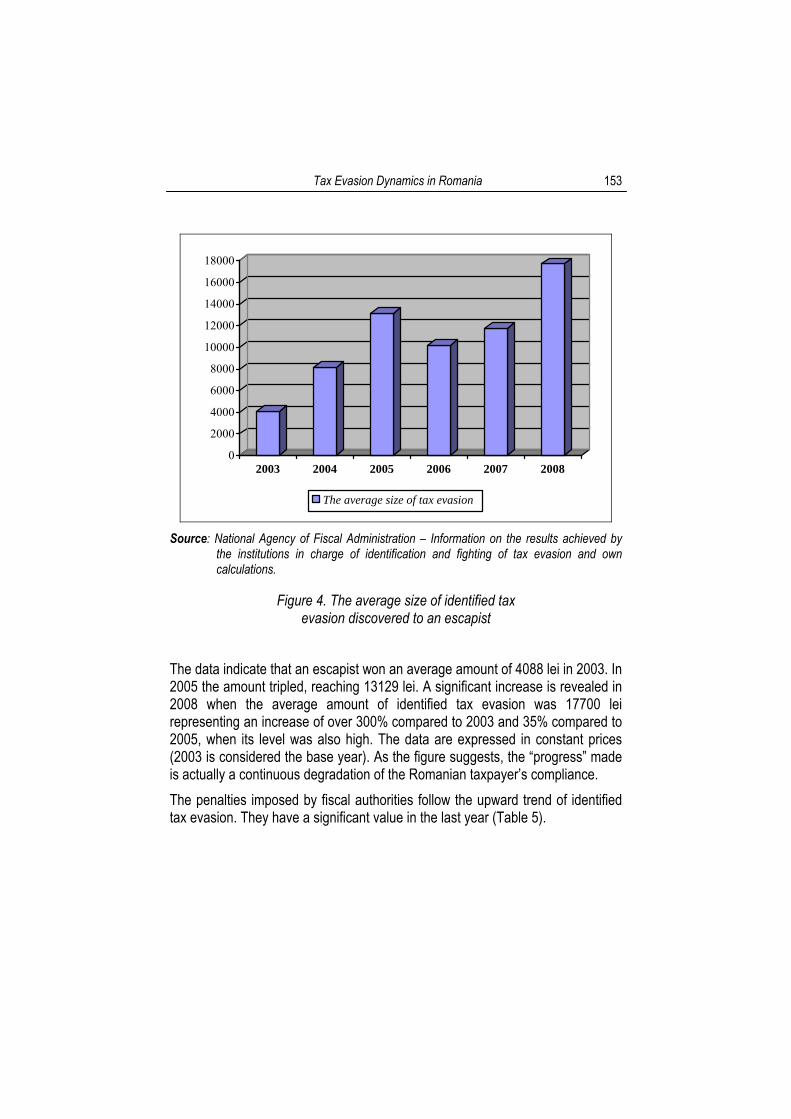
Source: National Agency of Fiscal Administration – Information on the results achieved by the institutions in charge of identification and fighting of tax evasion and own calculations.
Figure 4. The average size of identified tax evasion discovered to an escapist
The data indicate that an escapist won an average amount of 4088 lei in 2003. In 2005 the amount tripled, reaching 13129 lei. A significant increase is revealed in 2008 when the average amount of identified tax evasion was 17700 lei representing an increase of over 300% compared to 2003 and 35% compared to 2005, when its level was also high. The data are expressed in constant prices (2003 is considered the base year). As the figure suggests, the “progress” made is actually a continuous degradation of the Romanian taxpayer’s compliance. The penalties imposed by fiscal authorities follow the upward trend of identified tax evasion. They have a significant value in the last year (Table 5).
C.-M. Ene
154
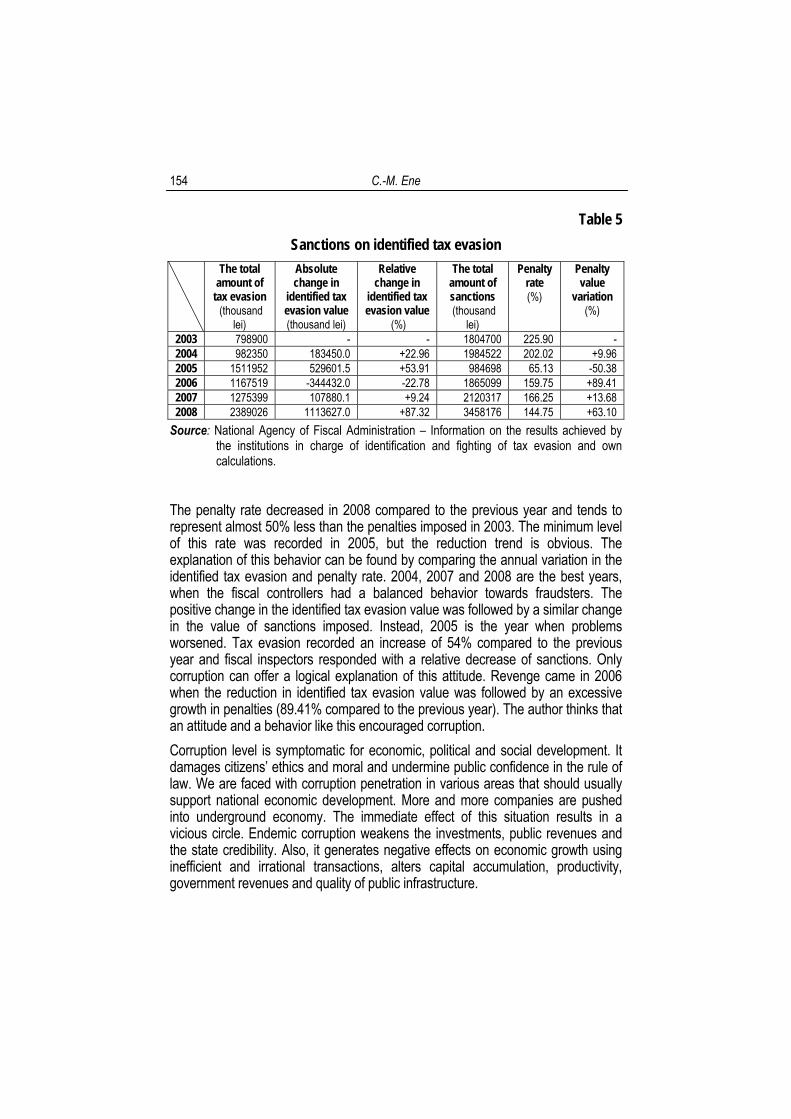
Table 5 Sanctions on identified tax evasion
The total amount of
tax evasion (thousand
lei)
Absolute change in
identified tax evasion value (thousand lei)
Relative change in
identified tax evasion value
(%)
The total amount of sanctions (thousand
lei)
Penalty rate (%)
Penalty value
variation (%)
2003 798900 - - 1804700 225.90 - 2004 982350 183450.0 +22.96 1984522 202.02 +9.96 2005 1511952 529601.5 +53.91 984698 65.13 -50.38 2006 1167519 -344432.0 -22.78 1865099 159.75 +89.41 2007 1275399 107880.1 +9.24 2120317 166.25 +13.68 2008 2389026 1113627.0 +87.32 3458176 144.75 +63.10
Source: National Agency of Fiscal Administration – Information on the results achieved by the institutions in charge of identification and fighting of tax evasion and own calculations.
The penalty rate decreased in 2008 compared to the previous year and tends to represent almost 50% less than the penalties imposed in 2003. The minimum level of this rate was recorded in 2005, but the reduction trend is obvious. The explanation of this behavior can be found by comparing the annual variation in the identified tax evasion and penalty rate. 2004, 2007 and 2008 are the best years, when the fiscal controllers had a balanced behavior towards fraudsters. The positive change in the identified tax evasion value was followed by a similar change in the value of sanctions imposed. Instead, 2005 is the year when problems worsened. Tax evasion recorded an increase of 54% compared to the previous year and fiscal inspectors responded with a relative decrease of sanctions. Only corruption can offer a logical explanation of this attitude. Revenge came in 2006 when the reduction in identified tax evasion value was followed by an excessive growth in penalties (89.41% compared to the previous year). The author thinks that an attitude and a behavior like this encouraged corruption. Corruption level is symptomatic for economic, political and social development. It damages citizens’ ethics and moral and undermine public confidence in the rule of law. We are faced with corruption penetration in various areas that should usually support national economic development. More and more companies are pushed into underground economy. The immediate effect of this situation results in a vicious circle. Endemic corruption weakens the investments, public revenues and the state credibility. Also, it generates negative effects on economic growth using inefficient and irrational transactions, alters capital accumulation, productivity, government revenues and quality of public infrastructure.
Tax Evasion Dynamics in Romania
155
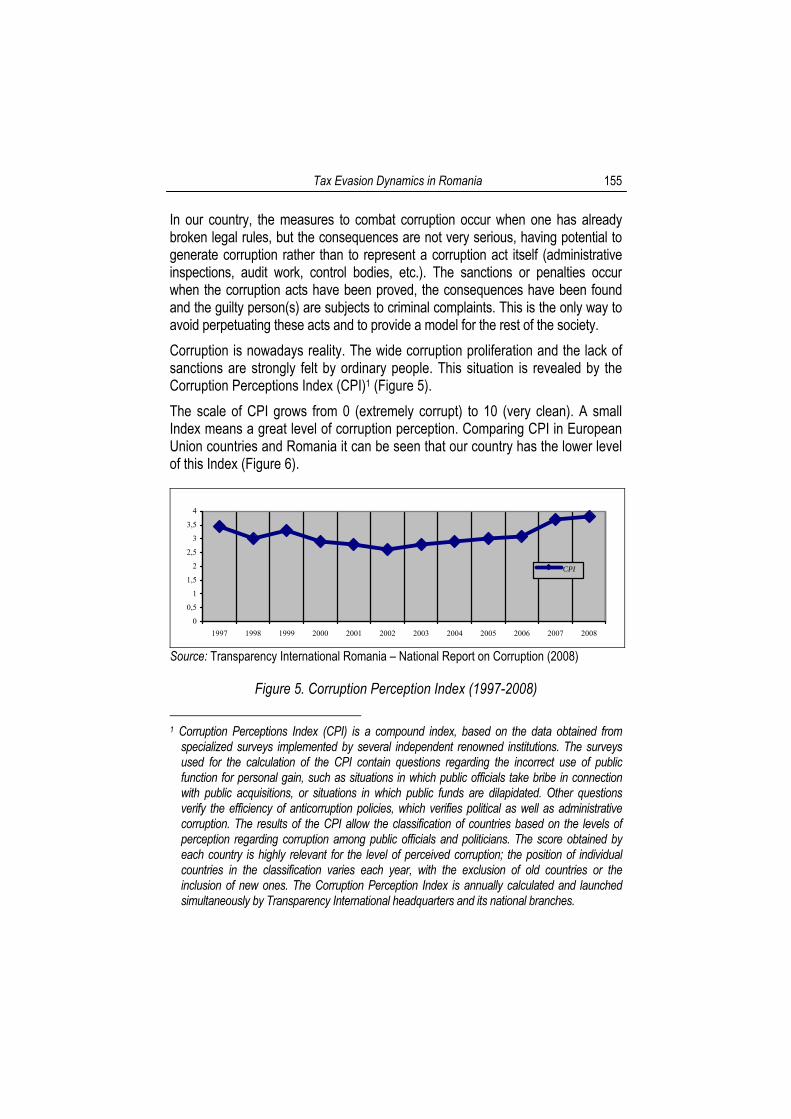
In our country, the measures to combat corruption occur when one has already broken legal rules, but the consequences are not very serious, having potential to generate corruption rather than to represent a corruption act itself (administrative inspections, audit work, control bodies, etc.). The sanctions or penalties occur when the corruption acts have been proved, the consequences have been found and the guilty person(s) are subjects to criminal complaints. This is the only way to avoid perpetuating these acts and to provide a model for the rest of the society. Corruption is nowadays reality. The wide corruption proliferation and the lack of sanctions are strongly felt by ordinary people. This situation is revealed by the Corruption Perceptions Index (CPI)1 (Figure 5). The scale of CPI grows from 0 (extremely corrupt) to 10 (very clean). A small Index means a great level of corruption perception. Comparing CPI in European Union countries and Romania it can be seen that our country has the lower level of this Index (Figure 6).
0
0,5
1
1,5
2
2,5
3
3,5
4
1997 1998 1999 2000 2001 2002 2003 2004 2005 2006 2007 2008
CPI
Source: Transparency International Romania – National Report on Corruption (2008)
Figure 5. Corruption Perception Index (1997-2008) 1 Corruption Perceptions Index (CPI) is a compound index, based on the data obtained from
specialized surveys implemented by several independent renowned institutions. The surveys used for the calculation of the CPI contain questions regarding the incorrect use of public function for personal gain, such as situations in which public officials take bribe in connection with public acquisitions, or situations in which public funds are dilapidated. Other questions verify the efficiency of anticorruption policies, which verifies political as well as administrative corruption. The results of the CPI allow the classification of countries based on the levels of perception regarding corruption among public officials and politicians. The score obtained by each country is highly relevant for the level of perceived corruption; the position of individual countries in the classification varies each year, with the exclusion of old countries or the inclusion of new ones. The Corruption Perception Index is annually calculated and launched simultaneously by Transparency International headquarters and its national branches.
C.-M. Ene
156
7,19
3,44
6,67
3
6,53
3,3
6,5
2,9
6,49
2,8
6,51
2,6
6,57
2,8
6,58
2,9
6,66
3
6,74
3,1
6,72
3,7
6,62
3,8
1997 1998 1999 2000 2001 2002 2003 2004 2005 2006 2007 2008
CPI for EU countries (average value) CPI for Romania
Source: Transparency International Romania – National Report on Corruption (2008)
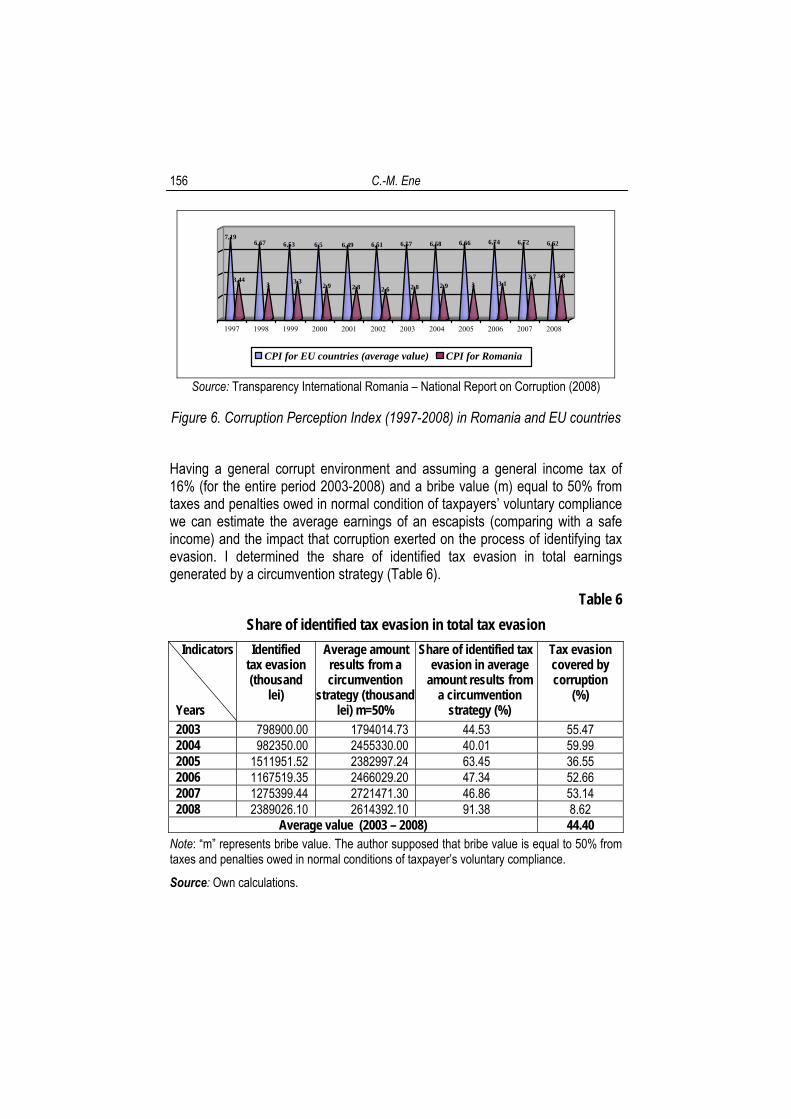
Figure 6. Corruption Perception Index (1997-2008) in Romania and EU countries Having a general corrupt environment and assuming a general income tax of 16% (for the entire period 2003-2008) and a bribe value (m) equal to 50% from taxes and penalties owed in normal condition of taxpayers’ voluntary compliance we can estimate the average earnings of an escapists (comparing with a safe income) and the impact that corruption exerted on the process of identifying tax evasion. I determined the share of identified tax evasion in total earnings generated by a circumvention strategy (Table 6).
Table 6 Share of identified tax evasion in total tax evasion
Indicators Years
Identified tax evasion (thousand
lei)
Average amount results from a circumvention
strategy (thousandlei) m=50%
Share of identified tax evasion in average
amount results from a circumvention
strategy (%)
Tax evasion covered by corruption
(%)
2003 798900.00 1794014.73 44.53 55.47 2004 982350.00 2455330.00 40.01 59.99 2005 1511951.52 2382997.24 63.45 36.55 2006 1167519.35 2466029.20 47.34 52.66 2007 1275399.44 2721471.30 46.86 53.14 2008 2389026.10 2614392.10 91.38 8.62
Average value (2003 – 2008) 44.40 Note: “m” represents bribe value. The author supposed that bribe value is equal to 50% from taxes and penalties owed in normal conditions of taxpayer’s voluntary compliance. Source: Own calculations.
Tax Evasion Dynamics in Romania
157
The calculation shows that less than half of the tax evasion is discovered because about 44% is protected by official corruption. The author assumes that the model is subjective and involves some assumptions and conditions, but it offers a causality relation between the option for tax evasion and corruption. The author found that a corrupt environment facilitates the decision to evade depending on detection probability, penalty system and bribery level as a discouraging factors for tax evasion. The level of identified tax evasion is smaller than the real level of entire tax evasion, an important part being impossible to determine because of corruption. Each monetary unit paid in the corruption area requires its recovery together with an illicit advantage, higher than legal earnings. As a result, corruption becomes one of the main causes of underground economy growth, generating a multiplier effect on the level of the fraud.
3. Conclusions The data analysis reveals that the most consistent tax evasion occurs in value added tax (VAT). As VAT has a very important contribution to the state budget revenues, I might say that tax evasion has a significant effect on the ability to finance public spending. There are some areas where fraud is more frequent such as building construction and civil engineering works, manufactures, retail trade in specialized stores, etc. Studies and reports issued by the financial and fiscal control institutions are the result of individual inspections and are focused on the particular mechanisms and cases of fiscal fraud without properly addressing the fiscal policy measures designed to deal with problems effectively and on a long term. However, it should be noted that removal of a cause will not necessarily eliminate the effect. The action to identify activities of tax evasion nature may be an effective way to reduce the budget deficit. The question is whether the state is capable to collect effectively these amounts to the budget because this is a problem in Romania. Even now, the Romanian tax system proved to be very weak and the amounts have been receipted at a very low level. Fiscal authorities should intervene in this way and should ensure the best possible collection of amounts generated by identified tax evasion.
4. Selective bibliography: 1. Bowles Roger A. (1999): Tax Policy, “Tax Evasion and Corruption” in Economies in Transition,
in Underground Economies in Transition. Unrecorded Activity, Tax Evasion, Corruption and Organized Crime, edited by Edgar L. Feige and Katarina Ott, Ashgate Publishing Ltd., 1999;
C.-M. Ene
158
2. Bîrle Vasile (2004): “Concepte privind frauda fiscală”, Revista de Finanţe Publice şi Contabilitate (RFPC) nr. 10/2004;
3. Ene Corina Maria (2006): “Estimări ale economiei subterane în România în contextul integrării europene”, prezentată la Sesiunea a VII-a de comunicări ştiinţifice a Facultăţii de Ştiinţe Economice a Universităţii Hyperion din Bucureşti, 10 mai 2006;
*** Transparency International Romania – National Report on Corruption 2008; *** Transparency International Romania – Report on Global Corruption Barometer, Policy and
Research Department, December 2007; *** National Agency of Fiscal Administration - Information on the results achieved by the
institutions in charge of identification and fighting of tax evasion; *** National Agency of Fiscal Administration – Performance Report 2007; *** National Agency of Fiscal Administration – Medium Term Strategy 2007 – 2011; *** Financial Guard – Reports on Inspection Activities; *** Internal Reports of the General Directorate of Financial Control; *** Internal Reports of General Directorate of Tax Inspection Coordination.