tax policy reform: the role of empirical evidence …uctp39a/jeaamirrleesfinal.pdf · tax policy...
TRANSCRIPT

TAX POLICY REFORM: THE ROLE OFEMPIRICAL EVIDENCE
Richard BlundellUniversity College London and Institutefor Fiscal Studies
AbstractTo understand the role of evidence in tax policy design, this paper organizes the empirical analysisof reform under five loosely related headings: (i) key margins of adjustment, (ii) measurement ofeffective tax rates, (iii) the importance of information and complexity, (iv) evidence on the size ofresponses, and (v) implications from theory for tax design. The context for the discussion is therecently published Mirrlees Review of tax reform. Although the Review focused on all aspects oftax reform, this paper highlights the taxation of earnings. It also comments on earnings taxation inthe context of VAT base-broadening reforms and the taxation of capital (JEL: H2, H3).
1. Introduction
How should evidence be used in the study of tax design? What is the appropriatebalance between theory and empirics? These questions lay at the heart of the MirrleesReview. Motivated by the aim to develop a broad set of principles for what makes agood tax system, the Review was an attempt to base tax reform on the large body ofeconomic theory and empirical evidence. It was inspired by the Meade Report (1978)with the idea to review tax design from first principles for modern open economies ingeneral and for the UK in particular. The UK over the past thirty years would be theworking laboratory.
The Mirrlees Review was published in two volumes: Dimensions of Tax Design(Mirrlees et al. 2010) bringing together expert evidence across a wide range of aspectsof tax reform, and Tax by Design (Mirrlees et al. 2011) setting out the conclusions andrecommendations. This paper examines the role of evidence used in the derivation ofthe recommendations for reform. It also examines the linkages between theory andempirical evidence. To maintain consistency and coherence in the discussion, the focus
Acknowledgments: I would like to thank the Editor, referee and participants at the JEEA Lecture at theAEA meetings and at the FBBVA Lecture in Madrid, for helpful comments. I am also grateful to myco-authors and co-editors on the Mirrlees Review for the many discussions over the course of the Review.All figures and tables not directly sourced are from the second volume of the Mirrlees Review, Tax byDesign (2011).E-mail address: [email protected]
Journal of the European Economic Association February 2012 10(1):43–77c© 2012 by the European Economic Association DOI: 10.1111/j.1542-4774.2011.01054.x

44 Journal of the European Economic Association
here will be on the taxation of earnings although the Review itself concerned all aspectsof the tax system. The discussion is organized loosely under five related headings:
(i) Key margins of adjustment.(ii) Measurement of effective tax rates.
(iii) The importance of information and complexity.(iv) Evidence on the size of responses.(v) Implications from theory for tax design.
The first of these headings highlights the importance of establishing empirical factsabout key aspects of behavior where we think taxes could have an impact. The secondreinforces a pervasive theme of the Review which was to consider the tax system as awhole and examine the wedge created by all aspects of the tax system, including theimplicit tax rates in the benefit and tax-credit systems. This also naturally motives thethird heading which relates to the understanding of the incentives implicit in the taxand benefit system by the individuals, households, and firms themselves and the stigmaand hassle costs involved by those accessing the system. The forth heading is the coreof any rigorous empirical analysis and concerns the robust measurement of the causalimpact of tax reforms. Here I suggest the use of a mix of (quasi-)experimental andstructural approaches with the experimental approaches acting as a ‘reality check’ onthe structural model. Structural models allow the study of behavior in counterfactualenvironments and it is difficult to envisage a complete empirical analysis of tax designanalysis that does not draw on such counterfactuals.
Under the final heading, these empirical relationships are brought together withthe structure of mechanism design from economic theory to determine efficiency costs,overall optimality, and improvements to tax design. There are three key ingredients toany optimal tax analysis: the accurate measurement of response elasticities, the detaileddescription of the distribution of income, and some view of social welfare weights.The first two of these are positive and can be learned from a careful evidence-basedanalysis. The last is normative and therefore something over which reasonable peoplemay differ. The aim here is to draw broad evidence-based conclusions while makingfairly weak assumptions on social welfare weights, perhaps assuming no more thanthat they are declining in some measure of equivalized income.
Why the focus on earnings taxation? Earnings taxation is ideally suited forexamining the role of evidence in tax design. There are substantial empirical resultson labor supply responses to tax reform for individuals and families, see Blundelland MaCurdy (1999) and Meghir and Phillips (2010) for surveys. This research hasemphasized the need to distinguish between the intensive and extensive margins oflabor supply—that is between the decision of whether to work or not and how muchto work, respectively. It has also shown clear differences in responses by age, gender,and family composition. Both of these observations are central to tax design. Further,tax return information provides additional evidence on taxable income elasticities,highly relevant for the design of earnings taxation, see Gruber and Saez (2002), forexample. We will argue that this evidence naturally supplements and extends work onemployment and hours of work responses to tax reform.

Blundell Tax Policy Reform 45
The next five sections of this paper reflect these five aspects of the empiricalanalysis of reform. This is not meant to imply that the taxation of earnings should standseparately from the design of the rest of the tax system. As the Review recommendationsvolume Tax by Design makes clear, any comprehensive reform must bring togetherall aspects of taxation. Indeed, the taxation of earnings bears the brunt of much ofthe tax reform proposals through the need to adjust for changes in redistribution andwork incentives induced by other aspects of the reform package. Therefore, to roundoff this paper, the discussion turns to the interplay between earnings tax design andbase-broadening reforms to VAT, as well as to the taxation of capital and reforms thatseek to align effective tax rates across all sources of income.
2. Key Margins of Adjustment
With the focus on earnings tax reforms, our analysis begins with the key changesin lifetime employment patterns over the last three decades. This sets the scene forunderstanding where, over their working life, individuals and families are most likely,and most able, to respond to tax reform.
The recent history of variation in hours and employment has been made up of threekey trends which we will argue also point to the three key margins where responses totax reform are most likely to occur: a decline in employment among men especiallyat older ages, a strong rise in employment and total hours of work for women, anda decline in employment among those in their late teens and early 20s reflecting theincrease in educational attainment over this period.
As has already been noted, an important distinction in analyzing labor supplyresponses is between the extensive (whether to work) and intensive (how much to work)margins of labor supply. Although it is the case that hours of work are often found torespond less than employment decisions, Blundell, Bozio, and Laroque (2011a) showthat the intensive and extensive margins both matter in explaining the broad changes intotal hours over the last three decades in the UK, France and the United States. But theymatter in different ways for different age and demographic groups. For men, variationsin the extensive margin occur mainly at the beginning and at the end of their workinglives. These are the schooling–work margins and the early retirement margins: Figure 1,from Blundell, Bozio, and Laroque (2011b), provides a broad view of employmentrates by age for the UK, France and the United States in 2007 (just before the onsetof the most recent recession). The similarity of average employment rates in 2007 formen aged 30–54 in these three economies is striking. It suggests that differences inemployment are concentrated at early and later points in the working life. Heckman(1993), Prescott (2004), Ohanian, Raffo, and Rogerson (2008), and Gruber and Wise(1999) have all pointed to the importance of the extensive margin at these points of thelife-cycle.
The extensive margin is not the end of the story. Figure 2 points out that hoursdifferences, conditional on employment, matter too for men and they matter acrossthe working life. Although it is unlikely that tax and benefit systems alone explain all

46 Journal of the European Economic Association
FIGURE 1. Male employment in the UK, 2007. Source: Blundell, Bozio, and Laroque (2011b).
FIGURE 2. Male total hours worked in the UK. Source: Blundell, Bozio, and Laroque (2011b).
these differences, in any discussions of tax reform it would seem unwise to play downthe intensive margin too much. 1
1. See also Chetty 2009.

Blundell Tax Policy Reform 47
FIGURE 3. Female employment in the UK, 2007. Source: Blundell, Bozio, and Laroque (2011b).
FIGURE 4. Female total hours worked in the UK, 2007. Source: Blundell, Bozio, and Laroque(2011b).
For women, Figures 3 and 4 show that hours conditional on employment andemployment itself both vary across the working lives. As was the case for men,average employment rates in 2007 were surprisingly close at ages between the late 20sand early 50s. Again, it is at the early and later periods in the working life where the

48 Journal of the European Economic Association
FIGURE 5. The change in total hours by age and gender. Source: Blundell, Bozio, and Laroque(2011a).
extensive margin choices become important. We will also point to important variationat the extensive margin for mothers with pre-school children and with lower levels ofeducation. Hours of work conditional on employment for women show more variationover the life-cycle, especially in the UK where there still remains a dip around child-bearing ages. For women with younger children it is not usually just an employmentdecision that is important, it is also whether to work part-time or full-time. Some ofthis variation in the UK we will be able to attribute to the specific design of the tax andbenefit system.
In the sections that follow we focus a little more in detail on what has happened tothe labor supply of women over the recent past and relate it to some of the key changesin tax and benefit policy. To wrap up the descriptive discussion in this section it is worthexamining the overall changes in labor supply in France, the United States and the UKover the three decades leading up to 2007. Figure 5 from Blundell, Bozio, and Laroque(2011a) presents such a breakdown of total hours worked by age and gender. The hugedeclines in total hours among men in the UK and France and the large rise in women’slabor supply in the United States dominate the picture. These changes in total hoursmask somewhat the key changes which have occurred at the extensive and intensivemargin. For example, it turns out the expansion for women at the extensive margin(employment) over this period is quite similar in the United States and France—whatdiffers is the distinctly different paths at the intensive margin.
To allocate total hours changes between the extensive and intensive margins is nota trivial exercise. While we observe the changes in hours per worker and employment,we do not know exactly how these changes contribute to the changes in total hours

Blundell Tax Policy Reform 49
worked. Blundell, Bozio, and Laroque (2011a) address this by developing bounds onthe changes at the extensive and intensive margins which allow such a decomposition.They consider how the overall average hours worked H per person varies over time andacross countries. Of course, this quantity differs across a person characteristics, ageand gender for instance. Suppose there are j = 1, . . ., J broad categories. The overallstatistic Ht is computed in any year t as an average of the total hours in category j, Hjt,with weights equal to the population shares qjt:
Ht =J∑
j=1
q jt Hjt .
They then write total hours of work Hjt as the product of hours per worker hjt andemployment in the labor market p jt :
Hjt = p jt h jt .
When we observe a change in yearly hours worked per person, Ht − Ht−1, wewould like to be able to know how much of the change is due to the intensive or extensivemargins. First define a structural effect St due to the change in the composition of thepopulation:
St =J∑
j=1
Hjt [q jt − q j,t−1].
Then measure the change due to the behavior of category j, holding the populationstructure constant as in date t − 1, as in a Laspeyres index:
� j t = q j,t−1[Hjt − Hj,t−1], (1)
then the total change across all J categories of workers is simply
�t =J∑
j=1
� j t , (2)
and we have by construction
Ht − Ht−1 = St + �t . (3)
The change in total hours for any category of workers reflecting changes at theintensive margin (hours per worker), and at the extensive margin (employment) satisfiestwo polar exact statistical decompositions:
� j t = q j,t−1{[h jt − h jt−1]p jt + [p jt − p jt−1]h jt−1
}(4)

50 Journal of the European Economic Association
or
� j t = q j,t−1{[h jt − h jt−1]p jt−1 + [p jt − p jt−1]h jt
}. (5)
The first term on the right-hand side is the intensive margin, weighted in the top formula(4) with the final employment rate (as in a Paasche index) and in the bottom formula(5) with the initial employment rate (as in a Laspeyres index). The second term isthe extensive margin (Laspeyres in (4), Paasche in (5)). The empirical counterparts tothese are given in Table 1.
The indices examine what part of any overall change in hours is attributableto changes at the extensive or intensive margin for any particular subgroup of thepopulation. The row [I-L, I-P] shows the bounds on the intensive margin, L standingfor Laspeyres (the change in hours being weighted by the initial employment rate), Pfor Paasche (final employment rate). Similarly, the Laspeyres index for the extensivemargin (E-L) (resp. E-P), given by the second term in equation (4) (resp. (5)), is equalto the change in employment multiplied by average hours worked at the initial (resp.final) date.2
Turning first to prime-age workers, the steep decline at the intensive margin forprime aged men in France and the UK relative to the United States is striking. For thisgroup the bounds are quite narrow and leave little room for ambiguity. These changesrepresent an enormous shift in the relative position of these countries. Table 1 tells usthat the extensive margin for prime-age men in Britain and in France also falls morethan in the United States, although there are declines in the United States too. Aswe have noted, for prime-age women it is the increase at the extensive margin thatis so extraordinary, especially in the United States and in France where the boundsin Table 1 suggest a very similar change and one that is nearly twice the size of thatexperienced in the UK. Intensive margins provide an interesting picture here, fallingback strongly in France, staying put in the UK while growing in the United States.
For older men and women there is a large decrease in hours per worker in France,similar in the UK, contrasting with an increase in the United States. There are falls atthe extensive and intensive margins for UK men but increases at the extensive marginfor UK women. This phenomenon is replicated to some extent across all countries andoffsets the stronger incentives to retire earlier in the UK and in France. The contrastwith the United States is stark, where at all margins and for both genders the boundspoint to positive changes for older workers. The changes among the young are alsosizable and predominantly negative. In France and the UK there are large falls foryoung men at both the extensive and intensive margin.
These changes inform us as to where labor supply is likely to be most responsiveto reform. They also set up the key question in the analysis of tax incentives and laborsupply: How well do structural economic models explain these changes in observedbehavior? For this we have to turn first to the measurement of the effective tax rates inthe tax and benefit system.
2. See Blundell, Bozio, and Laroque (2011a) for a more detailed analysis of the composition effects S.

Blundell Tax Policy Reform 51
TA
BL
E1.
The
exte
nsiv
ean
din
tens
ive
mar
gins
betw
een
1977
and
2007
.
You
th(1
6–29
)Pr
ime
aged
(30–
54)
Old
(55–
74)
All
Yea
rM
enW
omen
Men
Wom
enM
enW
omen
(16–
74)
FR�
−82
−38
−82
36−3
6−3
−195
[I-L
,I-P
][−
37,−
28]
[−23
,−19
][−
59,−
56]
[−35
,−49
][−
11,−
8][−
9,−1
0][−
185,
−183
][E
-L,E
-P]
[−54
,−45
][−
19,−
16]
[−27
,−23
][8
5,71
][−
28,−
25]
[7,6
][−
12,−
10]
UK
�−7
1−9
−70
39−4
210
−118
[I-L
,I-P
][−
42,−
36]
[−23
,−26
][−
48,−
45]
[−2,
−3]
[−22
,−19
][−
6,−8
][ −
161,
−167
][E
-L,E
-P]
[−35
,−29
][1
7,14
][−
25,−
22]
[41,
41]
[−23
,−20
][1
7,15
][5
0,43
]U
S�
−19
22−1
990
638
165
[I-L
,I-P
][−
6,−6
][1
,1]
[−5,
−5]
[14,
19]
[3,3
][3
,5]
[15,
17]
[E-L
,E-P
][−
13,−
13]
[21,
21]
[−14
,−14
][7
2,77
][3
,3]
[33,
35]
[148
,150
]
Not
e:I-
Pde
sign
sth
ePa
asch
em
easu
reof
the
inte
nsiv
em
argi
n,I-
Lth
eL
aspe
yres
mea
sure
,with
E-P
and
E-L
resp
ectiv
ely
for
the
exte
nsiv
em
argi
n,as
desc
ribe
dby
equa
tions
(4)
and
(5).
Sour
ce:B
lund
ell,
Boz
io,a
ndL
aroq
ue(2
011a
).

52 Journal of the European Economic Association
3. Effective Tax Rates
What of effective tax rates? To understand how taxes and benefits might affect laborsupply choices, we need to measure the effective work incentives implicit in the tax andbenefit system. To describe the distribution of incentives implicit in the tax and benefitsystem, there are two summary measures that are useful to document: the effectivemarginal tax rate (EMTR, that is the proportion of a small increase in earnings taken intax and withdrawn benefits) and the participation tax rates (PTR, the incentive to be inpaid work at all) defined by the proportion of total earnings taken in tax and withdrawnbenefits.
Perhaps the main (perceived) defects in current welfare/benefit systems is thatparticipation tax rates at the bottom remain very high. This is certainly the case inthe UK where effective marginal tax rates are well over 80% for some low-incomeworking families. As we will see, this is mainly due to the phasing-out of means-testedbenefits and tax credits. But high implicit tax rates at low incomes can be optimal forwelfare functions that place a high weight on redistribution.
Consider a typical budget constraint for a single mother. A complete analysis ofthe effective tax rate will combine the implicit tax rates in the benefit system, the taxcredit system and the income tax system. Figure 6 provides such a case study and
FIGURE 6. The interaction between taxes and benefits in the UK. Lone parent, with one child agedbetween one and four, earning the minimum wage (£5.80 per hour), with no other private incomeand no childcare costs, paying £80 per week in rent to live in a council tax Band B property in a localauthority setting council tax rates at the national average. Source: Blundell and Shephard (2010).

Blundell Tax Policy Reform 53
FIGURE 7. Average EMTRs for different family types.
shows the complexity arising from the cocktail of taxes and benefits. This constraintassumes all eligible benefits are accessed.3
One component of particular interest in the taxation of earnings is the tax-creditsystem which has become an increasingly important part of the effective tax systemfacing low earning families in many countries. In the UK, the earned income tax credit(called the Working Tax Credit, previously the Working Families Tax Credit) schemehas certain unique features. As with other tax credit systems, the UK system is designedto enhance income in work for those facing low rates of pay and/or higher costs of work.Figure 6 provides a case-study budget constraint for an example low-income singleparent. In the UK eligibility depends on an hours of work condition which consistsof a minimum hours rule at 16 hours per week with an additional hours-contingentpayment at 30 hours. There is also a family eligibility criterion which requires childrenin full-time education or younger. The tax credit then consists of an adult credit plusamounts for each child. There is a family net income eligibility threshold, above whichthe credit tapers away at 55%. Taken together with Income Support and other benefits,low-income earners in the UK can face a complex rate schedule with relatively higheffective tax rates. Indeed, families in receipt of other benefits would gain less fromthe WTC than otherwise equivalent families not receiving these benefits.
The distribution of these tax rates by income and family type in the UK is presentedin Figures 7 and 8. In an important sense it is the participation tax rate that is relevant forthe employment margin, and the marginal tax rate for the effort margin. The EMTRsand the PTRs can be negative as well as positive, but they are typically positive andoften high at lower incomes.
3. See Adam, Browne, and Heady (2010) for a more detailed overview.

54 Journal of the European Economic Association
FIGURE 8. Average PTRs for different family types.
Couples with one earner and lone parents are the two distinct groups in thepicture of average marginal tax rates by gross earnings in Figure 7. They face higheffective marginal tax rates when their earnings are low. High tax rates at low earningsare a distinctive feature of many tax systems and have led some commentators toquestion why lower-earning individuals face the highest tax rates. But any system thatredistributes income by targeting benefits towards families with low earnings and highneeds will induce high effective tax rates as a natural by-product.
The effective tax rates in Figures 7 and 8 indicate the strong redistribution towardslow-income families with children in the current UK tax system. Indeed, the moreaccurately the tax system targets low income, the higher the effective marginal tax rateon low earnings is likely to be. Not surprisingly therefore, tax schedules can easilypossess the feature of high effective marginal tax rates at low earnings. It is simply theresult of means-testing which is the flip-side of targeted redistribution. Whether it isoptimal or not will depend, as we shall see in what follows, on the responsiveness oflabor supply to these implicit tax rates, on the distribution of income and on the desireto redistribute to low-income families of a particular composition.
4. The Importance of Information and Complexity
The EMTRs and PTRs in Figures 7 and 8 are just local averages at each gross earningslevel. As evidenced in our discussion of the single-parent budget constraint in Figure 6,the current structure in the UK, and elsewhere, of multiple benefits with an array ofoverlapping means-tests leaves some people facing effective marginal tax rates of over90% (see Chapter 5 of Tax by Design for further details). This degree of complexity

Blundell Tax Policy Reform 55
FIGURE 9. The take-up of tax credits in the UK.
can leave some individuals unwilling and/or unable to access all the benefits and taxcredits to which they are eligible.
One way to formalize some of the issues surrounding information and complexityin earnings taxation is to allow individuals who are eligible for certain benefits andtax-credits not to participate or not to take-up. This reflects the idea that individualsmay not understand the system or they may find the stigma or hassle costs involved inparticipating in the benefit or tax credit program too high to be worthwhile.
Typically, take-up is an increasing function of the eligible amount of benefit ortax credit but full take-up is rarely achieved, and rates of take-up can be quite low,especially for families eligible to small amounts of benefit. In Figure 9 the take-uprate for married couples and lone parents in the UK is plotted according to the eligibleamount of Working Families Tax Credit (or its predecessor, Family Credit). Thismeasures the proportion taking-up among those we estimate to be eligible for somebenefit. It is plotted against the amount we estimate the family is eligible to. The figuresuggests that the stigma or information costs are increasingly overcome as the valueof take-up increases. This provides some insight into how to model take-up decisions.
To rationalize incomplete take-up of a benefit or tax credit program we followMoffitt (1983), and the subsequent developments in Blundell et al. (2000) and Brewer,Duncan, and Shephard (2007), and assume the presence of some stigma or hassle cost.This will provide an interpretation of Figure 9 and will also feed into our structuraleconometric specification. In turn it will help separate preferences from informationand stigma costs.
As an example, we can imagine representing the take-up cost as an amountsubtracted from the overall utility of families who claim tax credit. Suppose η represents

56 Journal of the European Economic Association
this utility cost, then we could write
η = X ′βη + εη, (6)
where X represents a vector of demographic and other household characteristics, βη
unknown parameter vector and εη unobserved heterogeneity. If the individual takes-upthen his utility would be reduced by η. Families who are entitled to the credit or benefitwill claim if the utility gain derived from the higher income exceeds the utility cost η.
The actual amount of taxes and benefits any individual worker receives (or pays)T will now depend on whether take-up occurs or not: we write P = 1 if take-up occursand P = 0 if not. Suppose an individual faces an hourly wage rate w and works hhours, then the net taxes paid will not only be a function of hours of work h and totalearnings wh but also whether P = 1 or 0. The tax function becomes
T = T (wh, h, P; X ). (7)
The net financial gain in work will depend on take-up, wages, and the choice of hours.This framework will be further developed when we return to the structural
econometric specification in Section 4.3. For now it is worth noting the practicaldifficulty of incorporating many different benefits. Moreover, because benefits and taxcredits are based on family income, incorporating several workers in each family isalso challenging.4
It is difficult to argue against any policy reform that clarifies which benefits andtax credits individuals are eligible to, and what the effective tax rates in the systemare. One clear implication for reform is that, to be effective, the tax and benefit systemrequires some integration of the various benefits and tax credits. This discussion oftake-up and the integration may indicate how to reduce the complexity of the tax andbenefit system but it does not tell us about the appropriate tax rate structure. For thiswe need to know about the size of behavioural responses. We now turn to the robustmeasurement of the impact of tax reform.
5. Evidence on the Size of Responses to Tax Reform
In Section 1, we documented the growth of female labor supply, changes in youthemployment and changes in early retirement behavior which must form the backdropto any earnings tax reform agenda. To these we add changes in demography, includinggrowth in single person and single-parent households.
An important distinction in analyzing labor supply responses for the purposes ofearnings tax design is between the extensive (whether to work) and intensive (howmuch to work) margins of labor supply. The microeconometric literature highlightsdifference between extensive/intensive responses (e.g. Heckman 1993; Blundell andMaCurdy 1999; Blau and Kahn 2007). Knowing precisely where the largest labor
4. Brewer, Duncan, and Shephard (2007) provide an excellent guide to the issues involved.

Blundell Tax Policy Reform 57
supply responses to incentives are to be found is a key ingredient in achieving a goodearnings tax design.
Of course, other responses affecting taxable income matter for earnings tax design,certainly for the rich and self-employed. Although for many workers the employmentand hours margins are the key measures of their labor supply, for other workers it is thelevel of effort, for any hour of work, that they can use to respond to tax incentives. Forothers still there will be exemptions and deductions which will allow them to changetheir taxable income with little change in their overall earnings. Acknowledging this,in Section 5, we will use the impact of taxation on taxable income to examine tax ratereform for top earnings.
5.1. Alternative Approaches to Measuring the Size of Responses
There are three dominant empirical approaches to the measurement of responses andall can prove useful in understanding earnings tax reform: the experimental approachusing randomized control trials (RCTs), the quasi-experimental approach using historicreforms, and the structural approach based on a formal optimization model ofindividual and family choices. There are many comprehensive reviews of quasi-experimental approaches, see Blundell and Costa-Dias (2009) and references therein.Although few in number, there are also some influential control-trial experiments onlabor supply which we will also briefly discuss.
It is difficult to envisage a full-fledged tax reform analysis that does not drawon a structural model. Policy simulation, and understanding the impact of particularrate structures, requires a model of decision-making and of the budget constraint.Herein though lies the difficulty; to fully specify the choice problem and the budgetconstraint inevitably requires assumptions for which we have relatively little empiricalfoundation.
In much of the literature on structural labor supply models, the complexity ofthe budget constraint has led researchers to approach estimation as a general discretechoice model with (unobserved) heterogeneity, see Blundell and MaCurdy (1999) fora review. For the most part these models have been estimated on cross-section surveysand do not attempt to directly model key changes in employment and hours, such asthose documented in Section 1. Integrating the structural approach to estimation withthe observed changes in incentives and policy reforms is an important step in derivingreliable structural models. There is an increasing recognition that changes in incentivesover time can, and should, be used directly to estimate labor supply parameters, seeChetty (2009). In an early example of this approach, Blundell, Duncan, and Meghir(1998) use exogenous changes in work incentives to estimate structural parametersfor female labor supply preferences at the intensive margin. They deal directly withendogenous selection and unobserved heterogeneity and, in doing so, are able to bringto bear the insights on transparent identification from the broader microeconometricand evaluation literature.

58 Journal of the European Economic Association
As we will argue, deriving convincing response effects from structural modelsis the key to tax design analysis. Experimental and quasi-experimental analyses havean important role to play in gauging the overall size of responses and in validatingstructural models. Further, we will see that some mechanism design problems intaxation can be expressed in terms of a small number of sufficient statistics, see Chetty(2008), some of which may be recoverable from quasi-experimental or experimentalanalysis. We suggest, at a minimum, quasi-experimental analyses of policy reformsshould be used as a method of validating structural models. Inevitably, the morecomprehensive and the more robust is the empirical evidence, the better we can addressthe tax design problem.
5.2. Randomized Control Trials
Experimental evaluations of tax and benefit policies are relatively rare, althoughthe active use of RCTs in tax policy has existed for some time. For example,the Seattle–Denver Income Maintenance Experiment (SIME/DIME) was one of asmall number of large-scale income maintenance/ negative income tax experimentsundertaken in the late 1960s and early 1970s in the United States. The idea was tomeasure the disincentive effects of cash transfers on the market work of those eligiblefor them, see Hurd (1976), Johnson and Pencavel (1980) and West (1979).
Ashenfelter and Plant (1990) use the SIME/DIME experiment to estimate anonparametric labor supply effects of the negative tax experiment. Nonetheless, intheir comprehensive review of field experiments in economics, Card, DellaVigna,and Malmendier (2011) find very few experimental studies that are directed towardsrecovering structural economic parameters. Even fewer directed at tax and benefitreform. They note that
as a result of the frustrations in dealing with the complex designs of the negative income taxexperiments (and with the confusing message that emerged from such designs) many respectedanalysts adopted the view that social experiments should be designed as simply as possible.This shift away from designs that explicitly attempt to model response variation to multipletreatments and toward a single manipulation has led to a new round of criticism that the socialexperiments are often “black boxes” that “...contribute next to nothing to the cumulative bodyof social science knowledge...” (Heckman and Smith 1995, p. 108).
Even so, experiments that are simply a single control treatment contrast can beuseful even in respect of a more theory-based analysis such as the tax design problemaddressed here. Experiments are typically designed to test a hypothesis of no effectof some particular policy against a one-sided alternative of a positive effect. Theyestimate an average effect of the policy and do so under relatively weak assumptions,provided the experiment is carried out correctly. They can therefore be used to assessthe reliability of theoretical prediction and/or gauge the overall size of incentive effectsin some tax or benefit reform.
Of the more recent randomized control trials in tax and welfare policy, perhaps themost successful and most influential has been the Canadian Self Sufficiency Program

Blundell Tax Policy Reform 59
FIGURE 10. SSP, employment rate by months after RA.
(SSP), see Card and Robins (1998). This was designed to answer the question as towhether financial incentives could encourage work among low-skilled lone parentswho had spent time on welfare. The aim of the SSP was to encourage employmentamong this group. The reform consisted of a 50% earnings supplement—effectivelya tax credit—for acquiring a job with at least 30 hours per week. This was paid onearnings up to an annual limit of $36,000 and, as in the case of earned income taxcredits, the SSP award was provided directly to the individual. The individual had tohave at least twelve months on welfare before they could be eligible.
The SSP has many design aspects that are similar to the British tax credits andthe US EITC. There were however three big differences—eligibility required at leasttwelve months on welfare receipt, the eligibility criterion of full-time employment hasto be satisfied within twelve months of program entry, and the program only lasted for36 months. All of this information was fairly well disseminated to the treatment group.
The impact on the employment rate for eligibles and controls is presented inFigure 10 – see Card and Hyslop (2005) for more details and for further references.The increase in monthly employment, at least at the twelve-month window, wassubstantial. It left no doubt that financial incentives could impact quite strongly onthe employment behavior of welfare mothers. However, by the end of the program theemployment effect has all but disappeared. We return to this latter point in Section 4.4in the discussion of the dynamic effects of tax and benefit programs.
5.2.1. Quasi-experiments Quasi-experiments are by definition ex-post analyses.They evaluate the impact of an historic policy through the comparison with a controlgroup who are ineligible but in many other aspects similar to the group targeted by the

60 Journal of the European Economic Association
FIGURE 11. The female employment rate in the UK by demographic type. Source: Blundell andShephard 2010.
policy. Typically, this takes the form of a difference-in-differences analysis, comparingoutcomes of eligibles and non-eligibles before and after the reform, estimating averageimpact of the reform on the targeted group—treatment on the treated. As in the caseof an experiment, what is learnt is typically only indirectly related to what is neededfor optimal design. But again, quasi-experiments form an excellent base from whichto (partially at least) validate structural models.
As an example of quasi-experimental validation analysis consider the analysisof earnings taxation among low-wage workers. In particular, the Working FamiliesTax Credit (WFTC) reforms in the UK described in Section 2. These were aimed atimproving net income in work for low wage parents. Our running example will againbe tax reform for single mothers. This was a group who, as we saw in Figure 5, couldface substantially improved work incentives in WFTC, certainly if their housing benefitand council tax payments were not too large.
The WFTC policy reform was enacted at the end of 1999 and Figure 11 showsthe employment rates for working-age women 1978 through 2005. A comparisonbetween single mothers (who are eligible) and single women without children (whoare not eligible) is the contrast of direct interest. The large fall in employment in theearly 1980s is finally turned around by the late 1990s, somewhat coincident with theWFTC reform. A more systematic analysis would control for observable differencesin age, education, etc., between these two groups. This is what a matched difference-in-differences does (see Blundell and Costa-Dias 2009, for example) and is what wewill use to validate our structural model in the next section.
Table 2 shows the average marginal impact of the WFTC reform for two data sets:the Labour Force Survey (used in Figure 11) and the smaller, but more detailed, FamilyResources Survey. The Family Resources Survey is what we use in policy simulationanalysis due to its comprehensive income measure. Both data sets point to a four to fivepercentage point increase in employment on a base of around 45% for single mothersin comparison to women without children. As we will see, this lines up quite well withthe predictions of our preferred structural model specification.

Blundell Tax Policy Reform 61
TABLE 2. Average impact of WFTC reform: Percentage employment.
Single mothers Average effect Standard error Sample size
Family Resources Survey 4.5 1.55 25,163Labour Force Survey 4.7 0.56 233,208
∗ Notes: Data for Spring 1996 to Spring 2002. Matching covariates: age, education, region, and ethnicity.
FIGURE 12. The hours distribution for single mothers, before the 16 hour rule.
Of course, the difference-in-differences estimator of the average impact doesnot come for free. It relies on two key assumptions: a common trends assumptionswhich states that time-varying unobservable differences must be common across thetwo groups, and a no-composition-shift assumption which states that cross-sectiondifferences in the composition of the two groups should not vary systematically. Bothare strong assumptions, even given the matching covariates. But at least these are usefuldescriptive statistics from which to judge the predictions of any structural model.
Before moving to the structural approach it is worth noting that tax credit reformsdo not just change the incentives for employment, they also change incentives for hoursof work. In the UK this is especially the case given the minimum weekly hours of workrequirement for eligibility. This allows a further quasi-experimental contrast. First wenote that the minimum weekly hours eligibility condition was moved from 24 hours to16 hours in 1992. Figures 12 and 13 provide the histogram of hours before and afterreform and show a strong shift towards a spike at 16 hours. The incentive at 16 hoursclearly has an impact on behavior (for further comparisons see Blundell and Shephard2010). Indeed the change in hours of work over this period is clear from Figure 14,and can be seen to follow the hours condition in the tax credit system moving from

62 Journal of the European Economic Association
FIGURE 13. The hours distribution for single mothers, after the 16 hour rule. Source: Blundell andShephard 2010.
FIGURE 14. Average annual hours of work: single mothers. Source: Blundell and Shephard 2010.
30 to 24 in the mid-1980s, and then to 16 in 1992. Average hours for working singlemothers falls systematically over this period.
We would be unhappy with any structural model that could not reproduce theseimportant contrasts before and after the various policy reforms. This places a stronger

Blundell Tax Policy Reform 63
requirement on the model than is often adopted in structural studies. The model notonly has to fit the cross-section distribution of hours and employment, it also has tobe able to explain the time series changes in the distribution of hours and employmentinduced by changes in the rules of the tax and benefit system.
5.3. Structural Models
The structural modeling approach is useful because it fully specifies all the elementsof the choice problem and the budget constraint. It therefore allows us to simulate theimpact of actual or hypothetical reforms. It also allows the comparison of reforms interms of their predicted behavior and deadweight loss. It will be a key component ofany optimal tax design too.
As we have already noted, these advantages are also the potential undoing ofthe structural approach. The specification of constraints and choice probabilitieswill typically be built on strong assumptions—about the distribution of unobservedheterogeneity, about the budget constraint for each worker, and about the optimizingframework from which choices are made. A complete structural model for hoursand employment choices will have to allow for unobserved work-related fixed costs,childcare costs, observed and unobserved heterogeneity, program participation take-upcosts.
There is now a long history in the specification of such models, see Hoynes(1996), Keane and Moffitt (1998), and van Soest (1995). There are many alternativespecifications for preferences, see Blundell and MaCurdy (1999). As an illustration,I follow the model developed in Blundell and Shephard (2010).5 Section 2 hasalready detailed the complexity of the budget constraint and Section 3 has stressed theimportance of stigma and hassle costs in modeling benefits and tax credits. Followingthe earlier discussion we focus on the employment and hours decision of a singleworker with children and the tax credit reform in the UK. As before, we represent theheterogeneity across individuals in observed characteristics by X and in unobservedcharacteristics by ε. In Section 3 above, we let P be a binary indicator for the take-upof tax credit. The participation cost of taking up is Pη(X, εη) which is subtracted fromutility.
We need now to be more specific about the form of utility over working hours hand consumption c for each individual. Consider a utility specification:
u(c, h, P; X, ε) = αy(X, εy)cθy − 1
θy+ αl(X, εl)
(1 − h/H )θl − 1
θl− Pη(X, εη),(8)
where θ y and θ l describe the shape of the marginal utility over consumption and hoursrespectively. The set of functions αy(X, εy), αl(X, εl), and η(X, εη) capture observedand unobserved preference heterogeneity. H is the total hours available for work andleisure.
5. Background programs and data are avaiable at http://www.ucl.ac.uk/uctp39a/lect.html, under SectionIII. Labour Supply and Tax Policy Simulation.

64 Journal of the European Economic Association
To make estimation tractable we need to make some assumptions over the variousdefinitions and functions in (8). Blundell and Shephard (2010) assume hours of work hare chosen from some finite set H, which in our main empirical results will correspondto the discrete weekly hours points H = {0, 10, 19, 26, 33, 40}. These hours pointscorrespond to the empirical hours ranges 0, 1–15, 16–22, 23–29, 30–36 and 37+respectively.6 They also set ln αy(X, ε) = X ′
yβy + εy and ln αl(X, εl) = X ′lβl . This is
clearly restrictive but, as we shall see in what follows, it appears to provide a reasonablyaccurate description of observed employment and hours for single parents in the UK.
As we noted in Section 3, the function η(X, εη) is included to reflect the possibledisutility associated with claiming in-work tax credits (P = 1), and its presence allowsus to rationalize less than complete take-up of tax credit programs. We denote P∗(h) ∈{0, E(h; X, ε)} as the optimal choice of program participation for given hours of workh, where E(h; X, ε) = 1 if the individual is eligible to receive tax credits at hours h,and zero otherwise. Assuming eligibility, it then follows that P∗(h) = 1 if and only if
u(c(h, P = 1; T, X, ε), h, P = 1; X, ε) ≥ u(c(h, P = 0; T, X, ε), h, P = 0; X, ε).
The choice of hours of work h affects consumption c through two main channels.Firstly, through its direct effect on labor market earnings and its interactions withthe tax and transfer system; secondly, working mothers purchase childcare for theirchildren which varies with maternal hours of employment.
Individuals face a budget constraint, determined by a fixed gross hourly wage rate(generated by a log–linear relationship of the form log w = X ′
wβw + εw) and the taxand transfer system T (wh, h, P; X ). Non-labor income, such as child maintenancepayments, enter the budget constraint through the dependence of the tax and transferschedule T on demographic characteristics X. To arrive at a measure of consumption c,in the absence of saving, we subtract both childcare expenditure and fixed work-relatedcosts, α f (X, ε f ) × 1{h>0}, from net income, wh − T (wh, h, P; X ).
The hours of childcare hc is assumed to vary stochastically with hours of workand demographic characteristics. Total weekly childcare expenditure is then givenby pchc, with pc denoting the hourly price of childcare. Empirically, this is modeledby assuming that pc follows some distribution pc ∼ Fc(·; Xc) which varies withdemographic characteristics.
Incorporating endogenous take-up of tax credits through cost η(X, εη), it thenfollows that the optimal choice of hours h∗ ∈ H maximizes
U (c(h, P∗(h); T, X, ε), h, P∗(h); X, ε),
subject to the various constraints already detailed.This brief outline of the key features of a structural model illustrates some of
the key ingredients and assumptions required, and this for a single worker decision.
6. In the Supplementary Material to the Blundell and Shephard paper the sensitivity of the results to afiner discretization of weekly hours are examined; the main results appear robust.

Blundell Tax Policy Reform 65
Family labor supply models require further assumptions, in particular the modeling ofjoint hours and employment choices, see Blundell et al. (2000) and Brewer, Duncan,and Shephard (2007). Blundell and MaCurdy (1999) and Meghir and Phillips (2010)give further insights in to structural modeling of labor supply.
Blundell and Shephard (2010) take this structural model specification to theUK Family Resources Survey data and argue that it does a good job of describingobserved behavior. For example, the model is used to simulate the WFTC reform. Thisis then compared with the simulated average response with the quasi-experimentalestimate described in Table 1. The simulated difference-in-differences parameter fromthe structural evaluation model is precise and does not differ significantly from thedifference-in-differences estimate itself.
5.4. Dynamics and Frictions?
Finding that a structural model does a reasonable job of predicting the changes ofreforms over time does not imply that it is the correct model, simply that it is notrejected. One area where we might expect the model to perform poorly is in capturingthe dynamics of labor supply. In particular, experience effects and adjustment frictions.In their study of the hours and employment changes around the tax credit reforms inthe UK, Blundell, Brewer, and Francesconi (2008) already note that changes seem totake place over a relatively short time, within a year or two, suggesting relatively smalladjustment costs. Of course, for the most part, these reforms occurred in a period ofeconomic expansion and we would not expect our structural model to provide a gooddescription of labor supply choices during a recession. Moreover, these reforms werelarge and well announced. Smaller tax reforms may have less impact, see Chetty et al.(2009).
But what about experience effects? That is the dynamic pay-off in terms of earningsand employment of being in the labor market. For some evidence on this for low-skillworkers we turn to the Canadian SSP. Figures 15 and 16 from the previously describedCanadian SSP control-trial experiment tell an interesting story. Recall that the SSPprogram is complete after 36 months from eligibility, and that eligibility can takeup to twelve months. By 50 months from baseline all the treatment group wouldhave completed the program. Indeed we saw, in Figure 10, that the treated had, onaverage, a sizable increase in employment. But did this translate into higher wages orearnings after the program was finished? Not according to these figures. There is littlenoticeable difference after 50 months in hourly wages or earnings, see also Card andHyslop (2005). It seems that experience effects, for this group at least, are negligible.In general, they may well be small for low-skill workers, explaining why relativelysimple models that ignore experience effects explain labor supply adjustments quitewell for these types of workers.
6. Implications from Theory for Tax Design
We have argued earlier that there are three key ingredients to any optimal tax analysis:the accurate measurement of response elasticities, the detailed description of the

66 Journal of the European Economic Association
FIGURE 15. SSP, hourly wages by months after RA.
FIGURE 16. SSP, monthly earnings by months after RA.
distribution of income, and some view of social welfare weights. The first two ofthese are positive and can be learned from a careful evidence-based analysis. The lastis normative and therefore something where opinions may differ. In this section wewill see how these come into play in the design of earnings taxation.
An important distinction we took from our discussion of labor supply responsesin sections 2 and 5 is between the extensive and intensive margins of labor supply.Why is this also important for tax design? The optimal taxation literature explores theconsequences for tax design (e.g. Diamond 1980; Saez 2002; Laroque 2005). Onceindividuals are allowed to respond to changes in the tax schedule by deciding whetheror not to work, as well as how hard to work, then the optimal tax schedule can changedramatically. In particular, when this employment decision becomes relatively more

Blundell Tax Policy Reform 67
important, optimal marginal tax rates can be lower (and perhaps even negative) forthose with low earnings capacity. As Brewer, Saez, and Shephard (2010) note:
a striking implication is that, if the government values redistribution then the participationtax rate should be negative for low earnings—in other words, low-income workers shouldreceive an earnings subsidy. Hence, in sharp contrast to the intensive model, the extensivemodel implies that earnings subsidies or work-contingent credits (such as the earned-incometax credit or the working tax credit) should be part of an optimal tax system.
This is one of the key lessons from recent optimal tax design. A large extensiveelasticity can turn around the impact of declining social weights, implying a highertransfer to low-wage workers than those out of work and a role for earned-income taxcredits.
A further key consideration in tax design is the way in which responses differacross individuals of different characteristics. Unless there are good redistributivereasons to do otherwise, tax rates will generally be lower on those types of individualswith more elastic responses.
Finally, the degree of inequality and of income uncertainty will also matter forearnings tax design. The past three decades or more has seen strong growth in earningsinequalities and a change in the nature of earnings risks. The redistributive elementof the earnings tax and benefit system acts, in part, as an insurance to earnings risks.As the nature of these risks changes and as underlying inequality grows, the balancebetween inequality and work incentives gets harder to balance. Designing an efficientstructure to the earnings tax and benefit system such that it achieves the desirabledistributional objectives becomes ever more salient.
6.1. Optimal Design for Low Income Workers
How should we think about an optimal design? We will assume that the governmentseeks to maximize social welfare subject to revenue constraints. Following on fromour running illustration of tax design for low-income single mothers, assume we wantto redistribute ‘£R’ to this group. What is the optimal way to do this?
Our aim will be to recover optimal tax/credit schedule in terms of earnings.There are two related approaches. The first to use the Diamond–Saez approximationin terms of extensive and intensive elasticities at different earnings. The secondapproach involves a complete Mirrlees optimal tax computation requiring a completespecification of choices and constraints.
The first approach is exemplified in the work of Saez (2002). He provides anintuitive expression for the tax rate schedule in terms of the extensive and intensiveelasticities, and simple summary measures of the distribution of earnings and the socialwelfare weights. The formula is only approximate and assumes away income effects,however as a guide to the setting of tax rates it is extremely informative, see Immervollet al. (2005). We return to these optimal tax formulas in our discussion of the optimaltop rate of tax in what follows.

68 Journal of the European Economic Association
The latter approach might be labeled the structural microeconometric approachto tax design—effectively, a stochastic mechanism design problem. In this case theoptimal tax model is the labor supply model. Consequently, all of the assumptionsconcerning behavior are also required for this analysis. The distribution of earnings,fixed costs of work, childcare, demographic differences, and unobserved heterogeneitydescribed in the previous section all influence choice of tax rate schedule.
Suppose we assume earnings (and certain characteristics) are all that is observableto the tax authority.7 Social welfare is represented by the sum of transformed utilities.Social welfare W is represented by the sum of transformed utilities:
W =∫
X,ε
∫ε
ϒ(U (c(h∗; T, X, ε), h∗; X, ε))d F(ε)dG(X, ε),
where function ϒ captures redistributive preferences.8
The government seeks to maximize W subject to revenue constraint:∫X,ε
∫ε
T (wh∗, h∗; X )d F(ε)dG(X, ε) ≥ T (≡ −R).
Blundell and Shephard (2010) control the preference for equality in social welafre bythe transformation function
ϒ(U |θ) = 1
θ× {(exp U )θ − 1} (9)
where θ < 0 favors equality of utilities.The objective is to find robust tax rate schedules for fairly general social welfare
weights. Given the structural parameter estimates, we can solve for optimal schedules.In their application Blundell and Shephard restrict to piecewise linear tax schedule(out-of-work income, nine marginal rates at breaks of £50 up to £400), with possiblehours contingent payments.
The key findings of the Blundell–Shephard analysis, under range of values for θ
(i.e. allowing different degrees of preference for inequality), are that optimal marginalrates are broadly increasing in earnings for all groups. The results also point to a shift ofout of work support towards families with younger children. This suggests an optimaltax schedule with tagging according to age of children. Moreover, pure tax credits arefound to be optimal at low earnings but only for those with school-aged children.
The analysis also found that hours contingent payments can improve design: ifhours are accurately observed a full-time bonus is desirable for low wage mothers witholder children. But measurement error and the possibility of hours manipulation arefound to weaken the argument for hours rules.
In the Review recommendations we not only stress reforms for lone parents, butalso for married parents, and older workers pre-retirement. From the examination ofresponse elasticities we recommended ‘tagging’ tax rates by age of (youngest) childfor mothers/parents and also at pre-retirement ages.
7. Blundell and Shephard (2010) relax this to allow for partial observability of hours to capture theminimum hours conditions in the British tax credit system.8. In this design problem we assume full take-up and do not include the stigma model used in estimatingthe preference parameters.

Blundell Tax Policy Reform 69
6.2. Tax Rates at the Top
At the top of the income distribution we take a rather different approach. Hours andemployment may not be the only, nor the most important, ways to change earnings inresponse to tax changes. When it comes to the taxation of top incomes, concerns aboutthe tax base come back into play. Feldstein (1995, 1999) makes a convincing casefor looking directly at taxable income. The more opportunities for exemptions anddeductions and the possibility to pass income through other lower tax jurisdictions,the more difficult it is to raise revenue from the top income earners. Consequently,we require a more general elasticity measure that captures these other avenues forresponse. The taxable income elasticity does just that.
A higher tax rate on a smaller base will raise less revenue and will probably beharder to sustain. To quote Slemrod and Kopczuk (2002):
When personal tax rates on ordinary income rise, evasion may increase, businesses may shiftto corporate form, there may be a rise in the consumption of deductible activities such ascharitable giving, and individuals may rearrange their portfolios and compensation packagesto receive more income as tax-preferred capital gains. These responses to higher taxes, and allothers, will show up in declines in taxable income, and there is a growing body of evidence,that, at least for high-income individuals, the elasticity of taxable income to the marginal taxrate is substantial.
It is hardly surprising therefore to find that the responsiveness of taxable incometo the tax rate is a key parameter on which the setting of top tax rates depends. Whatwe have to bear in mind is that the responsiveness itself will be affected by the taxbase. This elasticity can be expected to be larger the narrower the tax base. Given theneed to capture all these margins and the fact that effort is very hard to quantify, thebehavioral effect will require a different kind of measurement from that used to gaugehours and employment responses.
Consider an optimal top tax rate and suppose the welfare weight on top bracketincomes is negligible. The optimal rate will be the revenue maximizing rate—the Lafferrate. We first note that the top of the taxable income distribution is well approximatedby a Pareto distribution. Figure 17 shows this to be the case. Suppose we write e asthe taxable income elasticity, then Brewer, Saez, and Shephard (2010) show that therevenue maximizing rate is given by
t = 1/(1 + a · e),
where a is the Pareto parameter. For the UK, a is approximately 1.67, see Brewer andBrowne (2009).
To estimate e reliably is fraught with difficulties. Typically a difference-in-difference methodology is used, see Gruber and Saez (2002). When this approachis applied to past changes in tax rates among the top 1% in the UK, using the 2%–5%group as a control, the evidence to the Mirrlees Review suggested a preferred estimateof e of 0.46 with a standard error of 0.13.
Exploring various formulations of the differences-in-differences specification forthe UK, the estimate of e remains in the 0.35–0.55 range with a central value around

70 Journal of the European Economic Association
FIGURE 17. The Pareto distribution and the taxable income distribution at the top.
0.45, but is clearly quite fragile. An estimate of this magnitude would suggest theoptimal top 1% bracket rate of around 57%, close to the current top rate (includingindirect taxes). This analysis suggests little room for any further raising of the top rateof income tax in the UK without changes to the tax base for earned income itself.
7. Work Incentives, Redistribution and Base-Broadening Reforms
Earnings taxation plays a major role in getting the structure of tax design right acrossthe whole tax system. For example, a major recommendation from the Review is abroadening of the VAT tax base. This is especially important in the UK which hasone of the narrowest bases for VAT and has also just raised the standard rate to 20%.With many goods (food at home, children’s clothing, financial services) being zerorated or exempt, the potential welfare cost created by differential commodity taxationis large. Indeed, empirical evidence suggests that current indirect tax rates do not lineup with any reasonable justification. But broadening the base of VAT is not trivial. Onits own it would be regressive and would harm work incentives. To reap welfare gainsfrom base-broadening, distributional concerns have to be addressed and reduced workincentives redressed. Both of these require the careful redesign of earnings taxation.Earnings taxation becomes an integral part of the VAT reform.
Three key empirical observations about consumer behavior come into play whenthinking about justifying differential rates of VAT. First, some commodities are luxuriesand some are necessities. Differential commodity taxation can act as a redistributivemechanism. But they are an inefficient way of delivering redistribution given the otherdirect (earnings) tax instruments available. Secondly, nonseparabilities with laborsupply are important. Certainly this is a key justification in the optimal tax literaturefor differential commodity taxes with goods that are complementary to work bearing aheavier tax. Empirically these relate mainly to childcare and work-related expenditures.

Blundell Tax Policy Reform 71
Current VAT rates are quite different from these, see Crawford, Keen, and Smith (2010)for example. Finally, price elasticities differ with total expenditure and wealth. That isresponses, and therefore welfare costs, differ across the income distribution. To valuewelfare losses and calculate compensation these microeconomic differences matter alot.
The welfare gain from broadening the VAT is based on assumptions that areunlikely to hold in reality: weak separability between goods and leisure, commonpreferences, and competitive pricing by suppliers. Nonetheless, a broad uniform baseseems likely to be a good baseline from which to judge reform. Nonseparabilitiesare clearly evident but mainly in relation to work-related expenses. Preferences areheterogeneous but often differ by characteristics that are in the tax system, like familycomposition and family income. Differentials in tax rates across commodities seem tobe more motivated by redistributive concerns and the power of certain pressure groups:with food and children’s clothing belonging to the first and financial services to thesecond.
On its own, the base broadening of VAT in the UK would be regressive andweaken work incentives. Can a practical package avoid this? Tax by Design providesan illustration of how this can be done, implementing a reform package that achievescompensation while also avoiding significant damage to work incentives. Workingwith the existing set of UK direct tax and benefit instruments, the Review simulatedremoving almost all zero and reduced rates in the UK. This raises £24bn (with a 17.5%VAT rate) if no behavioral response. With responses, the empirical results suggest(in principle) every household could be compensated and still leave a £3bn to £5bnwelfare gain.
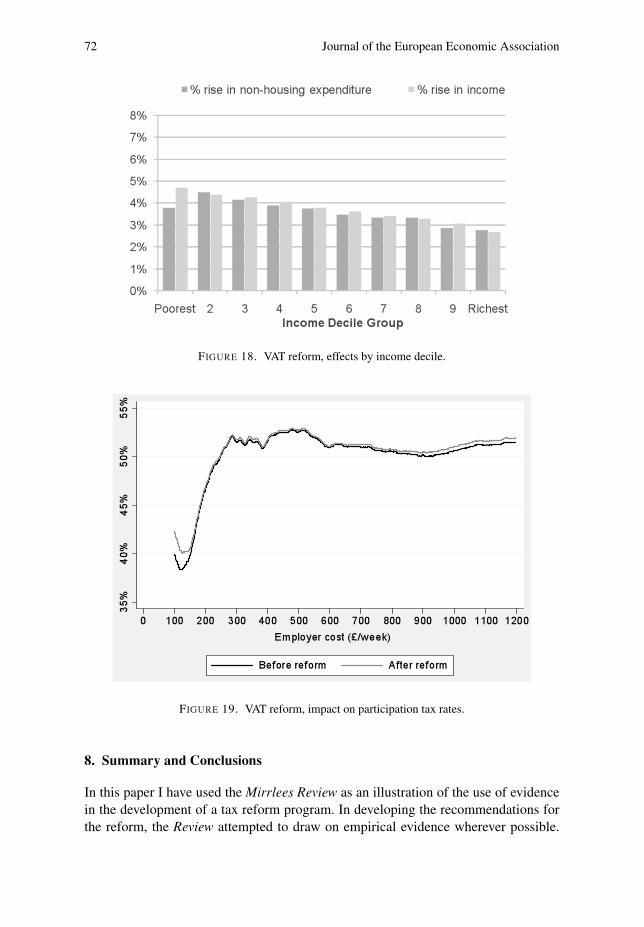
Summary results from the Review show the key interaction between earningstaxation and the base-broadening reform. These are summarized in Figures 18, 19 and20. Turning first to distributional concerns, Figure 18 shows that average percentagerises in the cost of living by income decile are more than compensated for by increasesin income. But what about work incentives? Figures 19 and 20 show that effective taxrates on earnings are also left largely unchanged at both the extensive and intensivemargin.
Other base-broadening reforms also require care in their interactions with earningstaxation. For example, in the discussion of capital taxation, the Review suggestsmoving towards an expenditure tax treatment of saving by providing an allowance forincome saved which effectively eliminates the tax on the normal return to saving. Thisprovides a framework for the integration of capital income taxation with corporatetaxation. Exempting the normal rate also gives neutrality between debt and equitycapital gains and dividends are treated in the same way and the resulting capital taxstructure overcomes the lock-in incentive from Capital Gains Tax. However, this alsorequires alignment between tax rates on corporate income, shareholder income, andlabor income. With progressive tax rates on labor income, progressive rates are alsorequired on shareholder income to avoid differential tax treatments of incorporatedand unincorporated firms—a lower progressive rate structure on shareholder incomethan on labor income reflecting the corporate tax already paid.
72 Journal of the European Economic Association
FIGURE 18. VAT reform, effects by income decile.
FIGURE 19. VAT reform, impact on participation tax rates.
8. Summary and Conclusions
In this paper I have used the Mirrlees Review as an illustration of the use of evidencein the development of a tax reform program. In developing the recommendations forthe reform, the Review attempted to draw on empirical evidence wherever possible.

Blundell Tax Policy Reform 73
FIGURE 20. VAT reform, impact on effective marginal tax rates.
The aim here was to show how to make the best use of all available evidence, frombroadly descriptive evidence to that gleaned from quasi/experimental evaluations andalso from structural model estimation.
Much of the discussion has focused on earnings tax design, partly for illustrativereasons but also because there is large body of evidence on labor supply and taxableincome responses to tax/benefit reform and to policy design. Wherever possible we haveargued for the use of well specified and carefully validated structural microeconometricmodels as the basis for design. In cases where we have less in the way of detailedstructural models to draw on, we have to use more general information on likely sizeresponse elasticities. In this we follow closely the lead in Saez (2002) and Brewer,Saez, and Shephard (2010).
Across the board, we have documented a key role for labor supply responses at theextensive and intensive margins. Both matter but differ by gender, age, education, andfamily composition. We found that labor supply responses for families with childrenvary by age of the youngest child. We also found different responses for older workersin pre-retirement years.
The results of our analysis suggested changing the rate structure to match lessonsfrom new optimal tax analysis. It pointed to lower marginal rates at the bottomof the earnings distribution. Means-testing should be less aggressive, at least forsome key groups. Tax credits should be better targeted to lower incomes and to thefamilies where labor supply is most responsive. We particularly stress reforms for loneparents, married parents, and older workers pre-retirement. From the examination of

74 Journal of the European Economic Association
response elasticities we recommended ‘tagging’ tax rates by age of (youngest) childfor mothers/parents and also at pre-retirement ages.
When put together, this reform agenda can be interpreted through a life-timeview of taxation, implying a life-cycle rearrangement of tax incentives and welfarepayments to match elasticities and early years investments, effectively redistributingacross the life-cycle, distinguishing by age of (youngest) child for mothers/parents andat pre-retirement ages. The simulation results in Tax by Design suggested significantemployment and earnings increases from such a reform package. The evidenceon taxable income elasticities implies limits to tax rises at the top of the incomedistribution. Tax reforms for this group are better directed towards base broadening toaddress tax avoidance and revenue shifting.
Finally, we noted how earnings taxation is also called on to undo the impact ondistributional and work incentives of the rest of any tax reform package.
References
Adam, Stuart, James Browne, and Chris Heady (2010). “Taxation in the UK.” In Dimensions ofTax Design: The Mirrlees Review, edited by James Mirrlees, Stuart Adam, Tim Besley, RichardBlundell, Steve Bond, Robert Chote, Malcolm Gammie, Paul Johnson, Gareth Myles, and JamesPoterba. Oxford University Press for Institute for Fiscal Studies.
Atkinson, Anthony and Thomas Piketty (2007). Top Incomes over the Twentieth Century: A Contrastbetween European and English-Speaking Countries. Oxford University Press.
Ashenfelter, Orley and Mark W. Plant (1990). “Nonparametric Estimates of the Labor Supply Effectsof Negative Income Tax Programs.” Journal of Labor Economics, 8, S396–415
Besley, Tim and Steve Coate (1992). “Workfare versus Welfare: Incentive Arguments for WorkRequirement in Poverty Alleviation Programs.” American Economic Review, 82(1), 249–261.
Blau, Fran and Larry Kahn (2007). “Changes in the Labor Supply Behavior of Married Women:1980–2000.” Journal of Labor Economics, 25, 393–438.
Blundell, Richard (2006). “Earned income tax credit policies: Impact and Optimality.” The 2005Adam Smith Lecture. Labour Economics, 13, 423–443.
Blundell, Richard, Antoine Bozio, and Guy Laroque (2011a). “Labour Supply and the ExtensiveMargin.” American Economic Review, 101(3), 482–486.
Blundell, Richard, Antoine Bozio, and Guy Laroque (2011b). “Extensive and Intensive Margins ofLabour Supply: Working Hours in the US, UK and France.” IFS Working Paper 11-01.
Blundell, Richard, Mike Brewer, and Marco Francesconi (2008). “Job Changes, Hours Changes AndThe Path Of Labour Supply Adjustment.” Journal of Labor Economics, 26, 421–453.
Blundell, Richard and Monica Costa-Dias (2009). “Alternative Approaches to Evaluation inEmpirical Microeconomics.” Journal of Human Resources, 44, 565–640.
Blundell, Richard, Alan Duncan, and Costas Meghir (1998). “Estimating Labour Supply Responsesusing Tax Policy Reforms.” Econometrica, 66, 827–861.
Blundell, Richard, Alan Duncan, Julian McCrae, and Costas Meghir (2000). “The Labour MarketImpact of the Working Families’ Tax Credit.” Fiscal Studies, 21(1) 75–103.
Blundell, Richard and Hilary Hoynes (2004). “In-Work Benefit Reform and the Labour Market.” InSeeking a Premier League Economy, edited by Richard Blundell, David Card, and Richard B.Freeman. University of Chicago Press.
Blundell, Richard and Thomas MaCurdy (1999). “Labour Supply: A Review of AlternativeApproaches.” In Handbook of Labour Economics, edited by Orley Ashenfelter and David Card.Elsevier.

Blundell Tax Policy Reform 75
Blundell, Richard, Costas Meghir, and Sarah Smith (2002). “Pension Incentives and the Pattern OfEarly Retirement.” Economic Journal, 112, C153–170.
Blundell, Richard, and Andrew Shephard (2010). “Employment, Hours of Work and the OptimalTaxation of Low Income Families.” IFS Working Paper W08/01. Forthcoming in Review ofEconomic Studies.
Brewer, Mike (2003). “The New Tax Credits.” IFS Briefing Note No. 25, www.ifs.org.ukBrewer, Mike, Alan Duncan, and Andrew Shephard (2007). “Did Working Families’ Tax Credit
Work? The Impact of In-Work Support on Labour Supply in Great Britain.” Labour Economics,13, 699–720.
Brewer, Mike, Emmanuel Saez, and Andrew Shephard (2010). “Optimal Household Labor IncomeTax and Transfer Programs.” In Dimensions of Tax Design: The Mirrlees Review, edited byJames Mirrlees, Stuart Adam, Tim Besley, Richard Blundell, Steve Bond, Robert Chote, MalcolmGammie, Paul Johnson, Gareth Myles, and James Poterba. Oxford University Press for Institutefor Fiscal Studies.
Brewer, Mike and James Browne (2009). “Can More Revenue be Raised by Increasing Income TaxRates for the Very Rich?” IFS Briefing Note No. 84.
Card, David, Stefano DellaVigna, and Ulrike Malmendier (2011). “The Role of Theory in FieldExperiments.” Journal of Economic Perspectives, 25(3), 39–62.
Card, David and Philip K. Robins (1998). “Do Financial Incentives Encourage Welfare RecipientsTo Work?” Research in Labor Economics, 17, 1–56.
Card, David and Dean Hyslop (2005). “Estimating the Effects of a Time-Limited Earnings Subsidyfor Welfare-Leavers.” Econometrica, 73, 1723–1770.
Chetty, Raj (2008). “Sufficient Statistics for Welfare Analysis: a Bridge between Structuraland Reduced-Form Methods.” National Bureau of Economic Research Working Paper14399.
Chetty, Raj (2009). “Bounds on Elasticities with Optimization Frictions: A Synthesis of Micro andMacro Evidence on Labor Supply.” National Bureau of Economic Research Working Papers15616.
Chetty, Raj, John N. Friedman, Tore Olsen, Luigi Pistaferri, and Anders Frederiksen (2009). “TheEffect of Adjustment Costs and Institutional Constraints on Labor Supply Elasticities: Evidencefrom Denmark.” Working paper, Harvard University.
Cogan, John (1981). “Fixed Costs and Labor Supply.” Econometrica, 49, 945–964.Crawford, Ian, Michael Keen and Stephen Smith (2010). “Indirect Taxation and VAT.” In Dimensions
of Tax Design: The Mirrlees Review, edited by James Mirrlees, Stuart Adam, Tim Besley, RichardBlundell, Steve Bond, Robert Chote, Malcolm Gammie, Paul Johnson, Gareth Myles, and JamesPoterba. Oxford University Press for Institute for Fiscal Studies.
Diamond, Peter (1980). “Income Taxation with Fixed Hours of Work.” Journal of Public Economics,13, 101–110.
Eissa, Nada and Jeffrey Liebman (1996). “Labor Supply Response to the Earned Income Tax Credit.”Quarterly Journal of Economics, 111, 605–637.
Feldstein, Martin S. (1995). “The Effect of Marginal Tax Rates on Taxable Income: A Panel Studyof the 1986 Tax Reform Act.” Journal of Political Economy, 103, 551–572.
Feldstein, Martin S. (1999). Tax Avoidance and the Deadweight Loss of the Income Tax. Review ofEconomics and Statistics, 4, 674–680.
Gruber, Jon and David Wise (1999). Social Security and Retirement around the World. NBER/TheUniversity of Chicago Press.
Gruber, Jon, and Emmanuel Saez (2002). “The Elasticity of Taxable Income: Evidence andImplications.” Journal of Public Economics, 84, 1–32.
Heckman, James J. (1974). “Shadow Prices, Market Wages, and Labor Supply.” Econometrica, 42,679–694.
Heckman, James J. (1979). “Sample Selection Bias as a Specification Error.” Econometrica, 47,153–161.

76 Journal of the European Economic Association
Heckman, James J. (1993). “What Has Been Learned About Labor Supply in the Past Twenty Years?”American Economic Review, 83(2), 116–121.
Heckman, James J and Jeffrey A. Smith (1995). “Assessing the Case for Social Experiments.” Journalof Economic Perspectives, 9(2), 85–110.
Hoynes, Hilary (1996). “Welfare Transfers in Two-Parent Families: Labor Supply and WelfareParticipation under AFDC-UP.” Econometrica, Econometric Society, 64(2), 295–332.
Hurd, Michael (1976). “The Estimation of Nonlinear Labor Supply Functions with Taxes from aTruncated Sample.” Center for the Study of Welfare Policy Research Memorandum 36, StanfordResearch Institute.
Johnson, Terry R. and John H. Pencavel (1980). “Utility-Based Hours Of Work Functions forHusbands, Wives, and Single Females Estimated from Seattle–Denver Experimental Data.”Socioeconomic Research Center Research Memorandum 71, SRI International.
Immervoll, Herwig, Henrik Kleven, Claus Kreiner, and Emmanuel Saez (2005). “Welfare Reform inEuropean Countries: A Microsimulation Analysis.” Economic Journal, 117, 1–44.
Keane, Mike and Robert Moffitt (1998). “A Structural Model of Multiple Welfare ProgramParticipation and Labor Supply.” International Economic Review, 39, 553–589.
Kopczuk, Wojciech (2005). “Tax Bases, Tax Rates and the Elasticity of Reported Income.” Journalof Public Economics, 89, 2093–2119.
Laroque, Guy (2005). “Income Maintenance and Labor Force Participation.” Econometrica, 73,341–376.
Liebman, Jeff (2002). “The Optimal Design of the Earned Income Tax Credit.” In Making Work Pay:The Earned Income Tax Credit and Its Impact on American Families, edited by Bruce Meyer andDouglas Holtz-Eakin. Russell Sage Foundation, New York.
Meade, James (1978). “The Structure and Reform of Direct Taxation: Report of a Committee Chairedby Professor J E Meade for the Institute for Fiscal Studies. George Allen and Unwin, London(http://www.ifs.org.uk/publications/3433).
Meghir, Costas and David Phillips (2010). “Labour Supply and Taxes.” In Dimensions of Tax Design:The Mirrlees Review, edited by James Mirrlees, Stuart Adam, Tim Besley, Richard Blundell,Steve Bond, Robert Chote, Malcolm Gammie, Paul Johnson, Gareth Myles, and James Poterba.Oxford University Press for Institute for Fiscal Studies.
Mirrlees, James A. (1971). “The Theory of Optimal Income Taxation.” Review of Economic Studies,38, 175–208.
Mirrlees, James, Stuart Adam, Tim Besley, Richard Blundell, Steve Bond, Robert Chote, MalcolmGammie, Paul Johnson, Gareth Myles, and James Poterba (eds) (2010). Dimensions of Tax Design:The Mirrlees Review. Oxford University Press for Institute for Fiscal Studies.
Mirrlees, James, Stuart Adam, Tim Besley, Richard Blundell, Steve Bond, Robert Chote, MalcolmGammie, Paul Johnson, Gareth Myles, and James Poterba (eds) (2011). Tax by Design: TheMirrlees Review. Oxford University Press for Institute for Fiscal Studies.
Moffitt, Robert (1983). “An Economic Model of Welfare Stigma.” American Economic Review,73(5), 1023–1035.
Moffitt, Robert (2005). “Welfare Work Requirements with Paternalistic Government Preferences.”Working paper, Johns Hopkins University.
Ohanian, Lee, Andrea Raffo, and Richard Rogerson (2008). “Long-Term Changes in Labor Supplyand Taxes: Evidence from OECD Countries, 1956–2004.” Journal of Monetary Economics, 55,1353–1362.
Ed Prescott (2004). “Why Do Americans Work So Much More than Europeans?” Federal ReserveBank of Minneapolis Quarterly Review, 28, 2–13.
Rogerson, Richard and Johanna Wallenius (2009). “Micro and Macro Elasticities in a Life CycleModel With Taxes.” Journal of Economic Theory, 144, 2277–2292.
Saez, Emmanuel (2002). “Optimal Income Transfer Programs : Intensive Versus Extensive LaborSupply Responses.” Quarterly Journal of Economics, 117, 1039–1073.
Stern, Nicolas (1986). “On the Specification of Labor Supply Function.” In Unemployment, Searchand Labour Supply, edited by R. Blundell and I. Walker. Cambridge University Press, pp.121–142.

Blundell Tax Policy Reform 77
Slemrod, Joel and Wojciech Kopczuk (2002). “The Optimal Elasticity of Taxable Income.” Journalof Public Economics, 84, 91–112.
Arthur van Soest (1995). “Structural Models of Family Labor Supply: A Discrete Choice Approach.”Journal of Human Resources, 30, 63–88.
West, Richard W. (1979). “The Effects of the Seattle and Denver Income Maintenance Experimentson the Labor Supply of Young Nonheads.” Center for the Study of Welfare Policy ResearchMemorandum 60, SRI International.