tax revenue in hamilton county tax study...8 mip report february 2018 tax revenue in hamilton county...
TRANSCRIPT

Tax Revenue inHamilton County
FEBRUARY 2018
An analysis of 2013-2017 tax revenues

Contents
4 Introduction
6 Executive Summary
8 Methodology
10 Findings
20 Conclusion
Tax Revenue in Hamilton County is an independent
research project conducted by the team at
Metro Ideas Project. The project was generously
supported by River City Company.
Primary Author
Joda Thongnopnua
Data Analysis
David Morton
Project Editor
David Morton
We are grateful to the staff at the Hamilton County
Assessor of Property’s office and at the City of
Chattanooga’s Treasury Division for their support and
cooperation in providing the data that underpins this
analysis.
Copyedited by Ashley Hopkins
METRO IDEAS PROJECT
1216 E. Main Street, Suite 102Chattanooga, TN 37408p: (423) [email protected]

Tax Revenue in Hamilton County
An analysis of 2013-2017 tax revenues

4 MIP Report February 2018 Tax Revenue in Hamilton County
Introduction
Property taxes are the primary source of stable revenue for nearly all local governments. This revenue is what determines a municipality’s capacity to provide essential social services, invest in roads and infrastructure, and educate its youth. A sound and well-functioning property tax system is an important consideration in evaluating overall municipal fiscal health.
In an effort to better understand our community, its revenue sources, and the impact of public policy and private investment, Metro Ideas Project (MIP) analyzed five years of property tax bills at the parcel level. This research examined over 1.2 million individual tax records from over 240,000 properties in Hamilton County, Tennessee. In this brief report, our analysis is limited to tax bills from two municipalities over five years: Hamilton County and the City of Chattanooga.
It is often difficult to get reliable local data on property taxes comparable by neighborhood. Previous analyses would allow analysis at the ZIP code level, but prove difficult to differentiate between commercial and residential rates. Furthermore, ZIP codes often encompass several neighborhoods with a wide variety of differing characteristics, including income, property values, and real estate trends. Far better is census tract level data, which are a stable set of geographic units with a plethora of additional data that are tracked by a variety of federal, state, and local agencies.
This level of granularity is an important factor in understanding a changing local economy, the role of density, and relative tax burden across multiple communities.
Census tracts are small, semipermanent subdivisions that are regularly updated prior to each decennial census—they are created with the help of local participants in coordination with the U.S. Census Bureau and generally follow visible and identifiable features (such as topographical features) and nonvisible legal boundaries. Census tracts vary widely in spatial size, as they are drawn to ideally encompass a population size between 1,200 and 8,000 people. Boundaries are drawn to be maintained over a long period of time to facilitate comparisons from census to census.
5Introduction Tax Revenue in Hamilton County
This brief not only shows which areas have high or low property tax burdens in relation to each other, but also provides the public with clear information on individual neighborhoods as they have grown and changed. Specific areas may see dramatic swings in tax bills as whole real estate markets become more desirable and expensive, or changes may be due to a few large developments in the area. Regardless, as the Chattanooga region continues to evolve, MIP hopes this brief will provide meaningful data for comparison as policymakers and residents consider how changes in its tax base affect quality of life and fiscal well-being.
As Chattanooga and Hamilton County continue to invest in an urban core and position themselves as a thriving midsize region, it is important to understand how the city’s and county’s tax bases are evolving in turn. Furthermore, identifying which areas may have seen a decline in tax revenue generation from previous years may point to warning signs of divestment or neighborhood distress.

6 MIP Report February 2018 Tax Revenue in Hamilton County
Executive Summary
Key Findings–2017:
• In what is traditionally considered the downtown Chattanooga footprint (Census Tracts 124, 16, 20 and 31), the total combined property tax yield is $32,208,925. This figure jumps to $44.5 million in combined city and county revenues when two North Chattanooga tracts (8 and 6) are added.
• Downtown Chattanooga property tax revenue was by far the highest grossing for both the city and county, with over $17.6 million in tax bills coming from just Census Tract 31 which comprises the bulk of the urban core.
• Downtown property tax revenue has grown 38.52 percent from 2013, resulting in an additional $4.9 million to the city and county tax base.
• Downtown also produced the highest amount of revenue per acre by a wide margin at $34,706, with the second- and third-highest (North Chattanooga and the Hamilton Place mall area) generating $19,504 and $8,886 per acre respectively.
• Downtown Chattanooga’s urban core contributed a combined $17.6 million to city and county coffers in 2017 across only 510 acres while, for comparison, the Hamilton Place mall area generated $13 million across 1,466 acres. That works out to a combined $34,706 in property tax revenues per acre generated downtown compared to $8,886 from the Hamilton Place mall area.
• By landmass, Chattanooga encompasses just shy of 25 percent of the county. Furthermore, the single census tract encompassing downtown Chattanooga’s urban core comprises less than one-tenth of 1 percent of the county’s geographic footprint but makes up nearly 4.5 percent of the county’s overall property tax revenues.
• While downtown Chattanooga produced the highest city and county revenues, larger commercial districts such as those containing Hamilton Place and Northgate malls, not surprisingly, contributed some of the highest city and county tax revenues, totaling a
7Executive Summary Tax Revenue in Hamilton County
combined value of just over $13 million and $11.6 million, respectively—although across much larger geographic areas than downtown Chattanooga.
• Commercial districts generally saw the highest amount of revenue growth; however, the primarily residential Clearwater Acres area saw the third-highest growth at 46.45 percent, higher than the downtown Chattanooga rate of growth.
• The downtown Chattanooga footprint (Census Tracts 31, 124, 16, and 20) contributes over $7.5 million to school funding in Hamilton County with Census Tract 31, composing the urban core, contributing over $4.2 million of that figure to Hamilton County Department of Education’s budget.
Downtown Chattanooga isn’t the only area contributing significantly to the local tax base. Areas in and around the Hamilton Place Mall generate large sums of local tax revenue, in part due to the size of many of the parcels billed in suburban commercial areas. Furthermore, some areas in unincorporated Hamilton County or smaller municipalities such as Lookout Mountain bring in significant revenues, as well.
Recent property millage rate increases across the Chattanooga region, including the City of Chattanooga and Hamilton County, have certainly affected revenue trends. However, while many areas within the city and county saw an increase in their property tax bills, median tax bill increases were highest in the North Chattanooga area.
While the fact that Downtown Chattanooga is the highest revenue generating area in the region is far from surprising, as are many downtown urban cores in cities across the country, but it’s the rapid rate of growth in a five-year period, the scale of Downtown Chattanooga’s revenue, and revenues generated per acre that stand out.

8 MIP Report February 2018 Tax Revenue in Hamilton County
Data for this project were provided by the Hamilton County assessor of property and the City of Chattanooga Finance and Administration Department.
MIP created database tables of each year’s property tax bills for Hamilton County and Chattanooga. There were 809,039 Hamilton County tax bills and 422,089 Chattanooga tax bills within the five-year analysis window (2013–2017).
From this raw data, MIP’s researchers generated unique addresses for each jurisdiction. There were 179,713 unique property addresses for Hamilton County and 89,745 for Chattanooga. The addresses were geocoded using Texas A&M’s geocoding engine in October 2017. This engine offered the most effective, accurate, and cost-efficient approach to geocoding over 232,000 unique addresses.
Table 1. Summary table of geocoded Hamilton County addresses
Reference Share of total Quantity
Exact parcel 0.6% 1,068
Address point 87% 156,352
Street segment 2.2% 3,993
City centroid 5.5% 9,809
State centroid 4.7% 8,491
Unmatchable 0% 0
Methodology
Note: Many addresses were not able to be geocoded and thus were not included in this analysis—this accounts for the variation of property counts within census tracts between city and county addresses.

9Methodology Tax Revenue in Hamilton County
Table 2. Summary table of geocoded Chattanooga addresses
Reference Share of total Quantity
Exact parcel 1.1% 995
Address point 85.2% 76,453
Street segment 2.9% 2,602
City centroid 10.8% 9,695
State centroid 0% 0
Unmatchable 0% 0
After the geocoding stage, MIP created two analysis tables—one for Hamilton County and another for Chattanooga. These tables combine tax bills and geocoded addresses referenced to street segment, address points, and exact parcels. These tables account for 89.8 percent of unique Hamilton County addresses and 89.2 percent of unique Chattanooga addresses.
Geocoded points in the analysis tables were matched against U.S. Census Bureau topologically integrated geographic encoding and referencing (TIGER) shapefiles to determine census tracts and ZIP codes. These points were also compared to city council and county commission district shapefiles from Hamilton County’s Geographic Information Systems Department.
To export final datasets as spreadsheets, MIP grouped tax bill locations by ZIP code, census tract, city council districts, and county commission districts. Per-acre calculations used the total area estimates contained in source shapefiles.
Finally, we eliminated census tracts with less than 100 properties as outliers.
This research does not include municipal tax data from Hamilton County municipalities other than the City of Chattanooga, such as Red Bank or Soddy-Daisy.

10 MIP Report February 2018 Tax Revenue in Hamilton County
Property tax data is a valuable tool in understanding how real estate markets have shifted and how investment in communities have affected the overall tax base of a municipality. This report seeks to answer three key questions regarding property tax revenue in Hamilton County and Chattanooga:
1. Which areas in Hamilton County and Chattanooga have the highest and lowest revenues, as a percentage of city and county total revenues?
2. Which areas in Hamilton County and Chattanooga produce the highest and lowest tax revenues on a per-acre basis?
3. Which areas in Hamilton County and Chattanooga have seen the highest and lowest rates of growth (or decline) in property tax bills?
Furthermore, there are additional questions that this brief addresses, as they are in the public interest, such as the amount of tax revenue contributed by certain areas (particularly downtown Chattanooga) to local schools.
While there are likely some obvious and less apparent reasons and factors that have contributed to these findings, this brief will not be drawing relationships to potentially causal factors (e.g., public policy, increased outside investment, philanthropic activity) beyond property tax rates themselves. That work, while important, is outside the scope of this brief. Rather, this brief seeks to outline the state of property tax revenue in Hamilton County across its many distinct areas.
Finally, this brief does not encourage nor intend to reflect a value judgment or holistic “ranking” of neighborhoods merely based off their tax revenues. As urban policy researchers, MIP recognizes that many areas, while not necessarily generating significant sums in tax revenues, can be enormously valuable to a city in nonmonetary ways; and high-revenue areas can, in fact, bring complicated and problematic factors to the municipalities they reside in. Commercial districts tend to bring in far higher revenues than most residential neighborhoods, as well. Thus, this brief should not carry any implication of a correlation between revenue contributed and rates of human capital or other unassociated value measures.
Findings

11Findings Tax Revenue in Hamilton County
Total Revenues
Map 1. Property Tax Total Revenues by Census Tract
Property tax revenues vary widely across the county. The downtown Chattanooga area generates more tax revenue at both the county and city levels than any other area in Hamilton County. Combined revenue in 2017 for the urban core tract of downtown Chattanooga was $17.6 million, over 1.27 times higher than the next-highest combined revenue source.
Other high revenue tracts include areas with high concentrations of commercial and retail properties, including Hamilton Place mall, Northgate, the Gunbarrel Road area, and the
12 MIP Report February 2018 Tax Revenue in Hamilton County
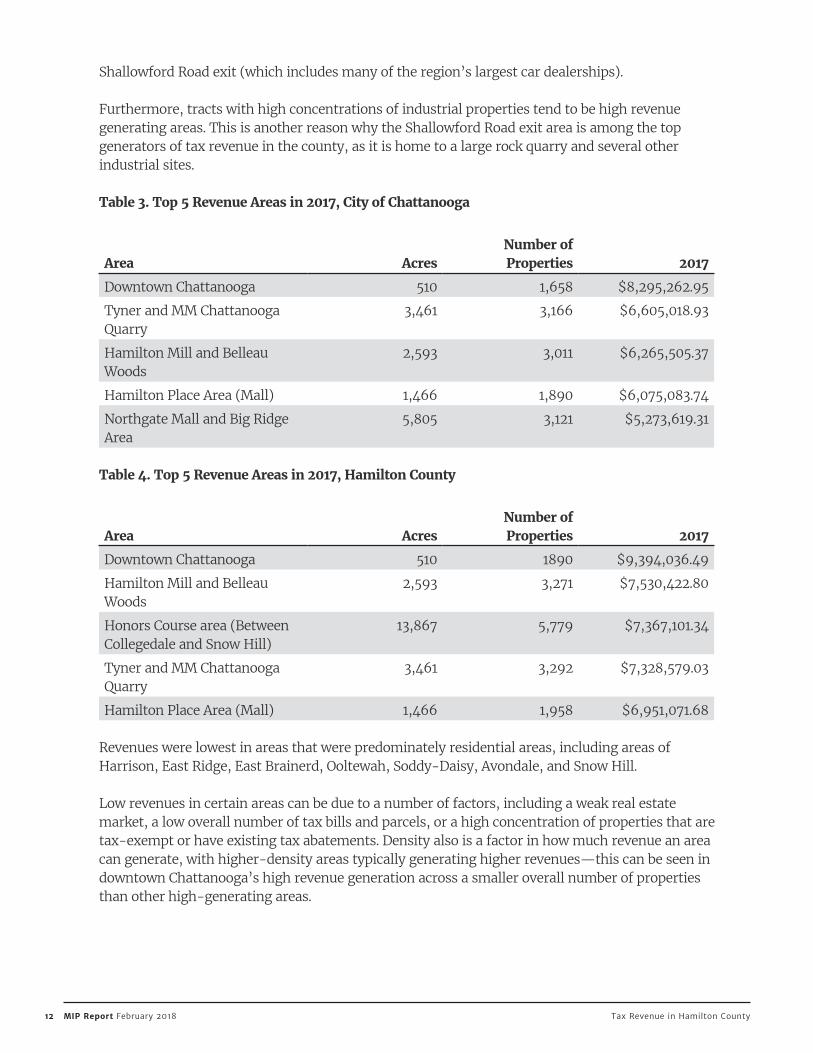
Shallowford Road exit (which includes many of the region’s largest car dealerships).
Furthermore, tracts with high concentrations of industrial properties tend to be high revenue generating areas. This is another reason why the Shallowford Road exit area is among the top generators of tax revenue in the county, as it is home to a large rock quarry and several other industrial sites.
Table 3. Top 5 Revenue Areas in 2017, City of Chattanooga
Area AcresNumber of Properties 2017
Downtown Chattanooga 510 1,658 $8,295,262.95
Tyner and MM Chattanooga Quarry
3,461 3,166 $6,605,018.93
Hamilton Mill and Belleau Woods
2,593 3,011 $6,265,505.37
Hamilton Place Area (Mall) 1,466 1,890 $6,075,083.74
Northgate Mall and Big Ridge Area
5,805 3,121 $5,273,619.31
Table 4. Top 5 Revenue Areas in 2017, Hamilton County
Area AcresNumber of Properties 2017
Downtown Chattanooga 510 1890 $9,394,036.49
Hamilton Mill and Belleau Woods
2,593 3,271 $7,530,422.80
Honors Course area (Between Collegedale and Snow Hill)
13,867 5,779 $7,367,101.34
Tyner and MM Chattanooga Quarry
3,461 3,292 $7,328,579.03
Hamilton Place Area (Mall) 1,466 1,958 $6,951,071.68
Revenues were lowest in areas that were predominately residential areas, including areas of Harrison, East Ridge, East Brainerd, Ooltewah, Soddy-Daisy, Avondale, and Snow Hill.
Low revenues in certain areas can be due to a number of factors, including a weak real estate market, a low overall number of tax bills and parcels, or a high concentration of properties that are tax-exempt or have existing tax abatements. Density also is a factor in how much revenue an area can generate, with higher-density areas typically generating higher revenues—this can be seen in downtown Chattanooga’s high revenue generation across a smaller overall number of properties than other high-generating areas.

13Findings Tax Revenue in Hamilton County
Table 5. Lowest 5 Revenue Areas in 2017, City of Chattanooga
Area AcresNumber of Properties 2017
Harrison 6,586 134 $207,119.77
Chester Frost Park Area 5,707 231 $351,691.58
Clearwater Acres (Middle Valley Rd under Thrasher Pike)
4,236 321 $432,517.25
Ooltewah (The Summit, Old Lee Hwy)
4,940 341 $452,944.87
Avondale 699 1,100 $522,337.93
Table 6. Lowest 5 Revenue Areas in 2017, Hamilton County
Area AcresNumber of Properties 2017
North Soddy-Daisy and South Graysville
38,007 1,095 $64,757.48
North Snow Hill 1,651 1,651 $454,026.81
Avondale 699 1,059 $545,447.41
East Missionary Ridge 365 672 $547,691.74
Chattanooga National Cemetery Area
434 984 $688,898.84
Revenues by acre
Consistent with findings by sum total of revenues generated, downtown Chattanooga is also the most efficient tax revenue generator by acre. The areas that produced the most combined tax revenue per acre in 2017 are downtown, North Chattanooga’s two census tracts, and the Hamilton Place mall area. However, downtown Chattanooga’s revenue per acre is 3.55 times higher than the next nearest tract in North Chattanooga—$34,706.44 to $9,812.10 per acre, respectively.
The significant difference separating downtown Chattanooga’s tax yield on a per-acre basis from the rest of the region is another demonstration of its tremendous value as a revenue generator for Hamilton County and the City of Chattanooga. In a 2013 report, Joseph Minicozzi—principal at Urban3, an Asheville, North Carolina-based urban planning firm—argued that investing in downtown pays on a per-acre basis and that the county and the city would do well to continue investing in revitalization efforts of its urban core. Simply from a tax yield perspective, our research bears out the logic in those recommendations.

14 MIP Report February 2018 Tax Revenue in Hamilton County
Table 7. Top 5 Revenue Areas in 2017 by Acre, Combined
Area Acres2017 City Revenue
2017 County Revenue Sum
Downtown Chattanooga 510 $16,275.32 $18,431.12 $34,706.44
North Shore (Barton/Frazier) 798 $4,424.00 $5,388.10 $9,812.10
North Shore (Cherokee) 462 $4,530.03 $5,162.51 $9,692.54
Hamilton Place Area (Mall) 1,466 $4,144.45 $4,742.05 $8,886.50
UTC Area 756 $3,300.58 $3,675.73 $6,976.31
Table 8. Lowest 5 Revenue Areas in 2017 by Acre, Combined
Area Acres 2017 County Revenue
North Soddy-Daisy and South Graysville
38,007 $1.70
Birchwood, Georgetown Area 3,0354 $25.62
North Snow Hill 16,369 $27.74
Sale Creek, Chickamauga Lake Area
27,219 $33.77
East Collegedale 13,015 $90.33
In particular, this data may prove particularly useful for elected officials across the region. As investment decisions warrant extended conversations on how to most effectively and equitably allocate resources, understanding tax yield in a geographic and density context is an important factor.

15Findings Tax Revenue in Hamilton County
Rate of tax revenue change
A priority for leaders, planners, and residents in any city is understanding how neighborhoods have changed over time and how their tax yield reflects trends in public and private investment, public policy, and market conditions.
In addition to analyzing 2017’s tax revenues by neighborhood, we also collected tax data going back an additional four years to 2013. We see trends in how areas adjacent to downtown Chattanooga, including Westside and West Chattanooga, have rapidly grown their tax yield due to increased development and a burst of investment. Furthermore, both of North Chattanooga’s census tracts have seen growth north of 40 percent from 2013.
Table 9. Top 5 Growth Areas1 by Revenue from 2013–2017, Combined
Area 2017 Sum 2016 Sum 2015 Sum 2014 Sum 2013 Sum % Change
Westside $4,366,446 $2,852,702 $1,777,759 $1,648,822 $1,696,584 157.37%
Falling Water $1,123,508 $965,120 $892,364 $778,827 $700,161 60.46%
West Chattanooga (W 20th, Broad, Howard High Area)
$4,877,586 $3,891,758 $3,664,830 $3,498,291 $3,317,427 47.03%
Clearwater Acres (Middle Valley Rd under Thrasher Pike)
$3,619,635 $3,484,274 $3,434,837 $3,362,199 $2,471,613 46.45%
North Shore (Barton/Frazier)
$7,833,595 $6,092,991 $5,853,220 $5,615,363 $5,369,803 45.88%
…
Downtown Chattanooga1 $17,689,299 $13,807,190 $13,131,932 $12,837,582 $12,770,502 38.52%
1 Downtown Chattanooga is included in Table 9 for the purposes of comparison.
By contrast, the lowest tax yield growth areas tended to be in low-income communities with relatively weak housing markets. In fact, two census tracts actually saw declines in overall tax yield, despite a recent assessment and strong overall regional growth in housing and land values.

16 MIP Report February 2018 Tax Revenue in Hamilton County
Table 10. Lowest 5 Growth Areas by Revenue from 2013–2017, Combined
Area 2017 Sum 2016 Sum 2015 Sum 2014 Sum 2013 Sum % Change
Orchard Village/Bushtown (N. Holtzclaw)
$1,672,449 $1,683,026 $1,718,073 $1,714,562 $1,735,950 -3.66%
Eastdale/Northbriar (TVRM)
$3,965,763 $3,942,926 $3,943,344 $3,986,223 $4,002,753 -0.92%
Amnicola $7,896,369 $7,503,675 $7,518,734 $7,571,569 $7,777,281 1.53%
Dodds Ave below East Lake
$1,672,319 $1,600,354 $1,599,104 $1,599,152 $1,609,519 3.90%
Greenwood Rd between Eastdale and Ridgeside
$1,606,019 $1,567,872 $1,542,416 $1,529,959 $1,531,989 4.83%
As the Chattanooga region continues to change, its tax base will, as well. Downtown’s annual tax yield has grown 38.5 percent, over $4.9 million, over five years, with much of its growth realized in the 2016–2017 year. Other areas adjacent to downtown have seen even more dramatic growth, including areas in and around North Chattanooga. Furthermore, some of Hamilton County’s suburbs (e.g., Falling Water and Middle Valley) have seen rapid growth as the county’s demographics shift—although still far smaller in total revenue generation than the county’s and city’s commercial and urban centers.

17Findings Tax Revenue in Hamilton County
Additional data for downtown Chattanooga
For the purposes of this report and to ensure consistency among geographic units of analysis, MIP isolated downtown Chattanooga to Census Tract 31—the tract that represents the urban core of the city.
Map 2. Tract 31
However, this section will detail some additional downtown-specific information. One major challenge in defining downtown merely by Tract 31 is that it misses major portions of the broader urban landscape traditionally considered “downtown Chattanooga.” To better understand the impact of the downtown area, we analyzed the tax yield when some census tract areas are combined.
Combined downtown yield
The scale of the gap between downtown’s tax yield and other areas of the county is staggering when the definition of downtown Chattanooga is expanded to include the three surrounding census tracts (124, 16, 20)—these areas consist of what is traditionally considered the downtown footprint by the Chattanooga-Hamilton County Regional Planning Agency. Those tracts, when combined, total a combined tax yield of $32,208,925.

18 MIP Report February 2018 Tax Revenue in Hamilton County
Map 3. Combined Tracts of Downtown with Jobs Density Heat Map
When both North Chattanooga tracts are added, which both include prominent parts of the city’s riverfront, the total yield exceeds $44.5 million in combined city and county revenues.
Employment demographics
A part of the reason that downtown Chattanooga is such a high tax yield locale within the area is its role as the central business district for the city. The downtown Chattanooga footprint, minus the North Chattanooga census tracts, contained nearly 33,000 jobs in the Chattanooga region in 2015.1 That accounts for 17 percent of all jobs in Hamilton County, per the U.S. Census Bureau’s LEHD (longitudinal employer household dynamics) origin-destination employment statistics (LODES) data. Furthermore, over 50 percent of the jobs in the region paid over $3,333 per month, and over 51 percent of the downtown Chattanooga workforce has some college education. That is a contrast to Hamilton County as a whole, which only sees 40 percent of its workforce earning over $3,333 a month and 43.9 percent having some college education.
1 2015 LODES data, via American Community Survey.

19Findings Tax Revenue in Hamilton County
Table 11. Downtown vs. County Workforce 2015 Data
Measure Hamilton County Downtown (All Tracts)
Total Primary Jobs 187,052 (100%) 32,969 (17.6%)
Jobs Earning ≥$3,333 per Month
74,898 (40%) 16,981 (51.5%)
Workers w/ Some College, Associate, or Higher
16,369 $27.74
82,036 (43.8%) 17,025 (51.6%) $33.77
Highest Industry by ShareHealth Care and Social
Services (14.8%)Finance and Insurance (20.6%)
School funding
As of 2017, the millage rate for schools for county taxes in Hamilton County is 1.2503 (or 24.8 percent of the overall tax rate), meaning that the downtown Chattanooga footprint (Census Tracts 31, 124, 16, and 20) contributes over $7.5 million to school funding in Hamilton County. Of that, the census tract composing the urban core alone (Tract 31) contributes over $4.2 million to the Hamilton County Department of Education’s (HCDE) budget—about 1 percent of HCDE’s annual budget in 2017.

20 MIP Report February 2018 Tax Revenue in Hamilton County
Conclusion
As the Chattanooga region continues to garner national attention and build on its reputation as an emerging midsize city, the fiscal health of the city and county is critical to ensuring that growth is sustainable and equitable.
Metro Ideas Project has compiled this report to serve as a resource but also as a series of metrics from which to establish a baseline moving forward. As cities change and evolve, it is natural for tax yield to fluctuate. However, it is important to track relative tax burdens and major changes—particularly in low-income or distressed areas.
Furthermore, this report should inform stakeholders, residents, and developers alike as they seek to be more strategic and data-driven in their decisions. Chattanooga’s urban core is a thriving and critical economic engine for the city, making up a substantial share of the city and county’s coffers. Sustained investment in the downtown area appears to produce substantial economic returns and ultimately grows the city and county’s property tax base. However, other commercial and residential areas also bring in significant resources. And areas that traditionally have a low tax revenue yield, or even have experienced a decline in the past five years, may be areas that are ripe for public investment to support the overall health of the community.
This report does not seek to provide a series of prescriptive and detailed policy recommendations, but rather more in-depth information and data about the nature of our resources and where they come from to better inform our community’s path forward.

21Research Independence Policy Tax Revenue in Hamilton County
Research Independence Policy
Metro Ideas Project has adopted a Research Independence Policy that disallows the methods or conclusions of our researchers to be adversely influenced by the interests of any third party—whether it be a political party, government donor, or non-governmental organization.
Metro Ideas Project retains final control over the contents and findings of its work but may research specific agreements with its clients, underwriters, and donors as to the conditions of its release to the public in accordance with these values.

This page intentionally left blank

This research report carries a Creative Commons Attribution 4.0 International license. This permits re-use of Metro Ideas Project content when proper attribution is provided. Uses of this work must provide appropriate credit to the organization and its authors, provide a link to the license, and indicate if any changes were made. You may do this in any reasonable man-ner, but not in any way that suggests the licensor endorses you or your use.
This means you are free to share and adapt Metro Ideas Project’s work, or include our content in derivative works.
For the full legal code of this Creative Commons license, please visit creativecommons.org.
If you have any questions about citing or reusing our work or would like to discuss how to best
utilize our research, visit metroideas.org.
