tax statistics – highlights
TRANSCRIPT

National TreasuryDepartment:
REPUBLIC OF SOUTH AFRICA
national treasury
Tax Statistics – Highlights 2010
A joint publication between National Treasury and the South African Revenue Service

2010Tax Statistics – Highlights
A joint publication between National Treasury and the South African Revenue Service

| 1
ABOUT THE PUBLICATION This 2010 Tax Statistics publication provides an overview of tax revenue collections for the fiscal periods 2004/05 to 2009/10, as well as information obtained from tax returns for the 2006 to 2009 tax years.
OBJECTIVES • To provide tables of statistics that will assist economists and research
professionals in the preparation and analysis of economic estimates as well as impact analyses in so far as tax revenue is a function of economic activity;
• To provide information that would be of use to those who require detailed taxpayer data per tax type;
• To provide the private sector with data to inform commercial decisions such as the selection of market segments on which to focus their marketing efforts; and
• To provide relevant role-players and stakeholders with information that will enhance policy decisions for the well-being of the public.
REVENUE COLLECTIONS Chapter 1: Revenue collections provides a summary of aggregate tax revenue collection trends.
For the 2009/10 fiscal year:
• Tax revenue collected amounted to R598.7 billion, a 4.2% decrease year-on-year attributable to the global financial crisis;
• Consequently budget revenue decreased to 23.6% of GDP; • Cost of revenue collection increased to 1.2%; • PIT, CIT and VAT remained the largest sources of tax revenue (±80%); • SARS has on register:
o close to 5.9 million individual taxpayers; o almost 1.9 million companies; and o 685 523 VAT vendors.
• R10.4 billion capital gains tax was raised in 2009/10; and • SARS was responsible for collecting ±98% of national budget revenue.
Highlights

2 |
PERSONAL INCOME TAX (PIT) Chapter 2: Personal income tax (PIT) gives an overview of assessed personal income tax revenues of registered individual taxpayers. It provides information on taxable income by income categories, age, gender and source of income, as well as on fringe benefits, allowances and other deductions.
Individual taxpayers’ assessed data for the 2008 tax year shows:
• 3.5 million assessed taxpayers who had an aggregate taxable income of R632.6 billion and a tax liability of R154.1 billion. There are, however, more taxpayers paying tax, as most taxpayers falling below R120 000 taxable income and those subject to SITE-only are not required to submit an income tax return and would therefore not be included in the 3.5 million assessed taxpayers.
• 28.8% were in the 35-44 age group and 56.7% were male; • 136 124 (3.9%) had business income; • Over 60% of taxable income derived from salaries, wages and remuneration; • The largest allowance claimed was the travel allowance; • Medical aid paid on behalf of employees was the largest fringe benefit; and • Contributions to retirement funding constituted the largest deductions. Number of assessed individual taxpayers and tax assessed, 2008
–
1 000
2 000
3 000
4 000
5 000
6 000
7 000
8 000
–
25 000
50 000
75 000
100 000
125 000
150 000
175 000
200 000
< 020
001
–30
000
50 0
01 –
60 0
0080
001
–90
000
110
001
–12
0 00
014
0 00
1 –
150
000
170
001
–18
0 00
020
0 00
1 –
210
000
230
001
–24
0 00
026
0 00
1 –
270
000
290
000
–30
0 00
032
0 00
1 –
330
000
350
001
–36
0 00
038
0 00
1 –
390
000
410
001
–42
0 00
044
0 00
1 –
450
000
470
001
–48
0 00
050
0 00
1 –
510
000
530
001
–54
0 00
056
0 00
1 –
580
000
625
001
–65
0 00
075
0 00
1 –
800
000
1 00
0 00
1 –
1 25
0 00
02
000
001
–3
000
000
10 5
00 0
01 +
R m
illio
n
Num
ber o
f tax
paye
rs
Taxable income group
Number of taxpayers
Tax assessed (R million)
2010 Tax Statistics

| 3
COMPANY INCOME TAX (CIT)
Chapter 3: Company income tax (CIT) is an overview of company income tax revenues. Information on taxable income by income category, sector and type of business entity is provided.
Companies’ assessed data for the 2008 tax year shows:
• 34.2% of the 473 034 companies assessed had positive taxable income, 35.2% had negative taxable income and 30.6% had taxable income equal to zero;
• 56.5% of income tax assessed was paid by 222 large companies with taxable income in excess of R200 million;
• The finance, wholesale trade and retail trade sectors collectively made up 50% of the assessed companies and were responsible for over 35% of tax assessed; and
• The mining and quarrying sector consisted of only 0.3% of total number of companies assessed. Their contribution to total assessed company income tax shrunk from 8.6% in 2006 to 5.7% in 2008.
Number of companies and tax assessed for companies, 2008
–
10 000
20 000
30 000
40 000
50 000
60 000
70 000
80 000
–
2 000
4 000
6 000
8 000
10 000
12 000
14 000
500
001
to 1
milli
on
1 m
illion
to 2
milli
on
2 m
illion
to 3
milli
on
3 m
illion
to 4
milli
on
4 m
illion
to 5
milli
on
5 m
illion
to 6
milli
on
6 m
illion
to 7
milli
on
7 m
illion
to 8
milli
on
8 m
illion
to 9
milli
on
9 m
illion
to 1
0 m
illion
10 m
illion
to 2
0 m
illion
20 m
illion
to 4
0 m
illion
40 m
illion
to 6
0 m
illion
60 m
illion
to 8
0 m
illion
80 m
illion
to 1
00 m
illion
100
milli
on to
200
milli
on
200
milli
on+
R m
illio
ns
Num
ber o
f tax
paye
rs
Taxable income group
Number of taxpayersTax assessed (R million)
Highlights
4 |
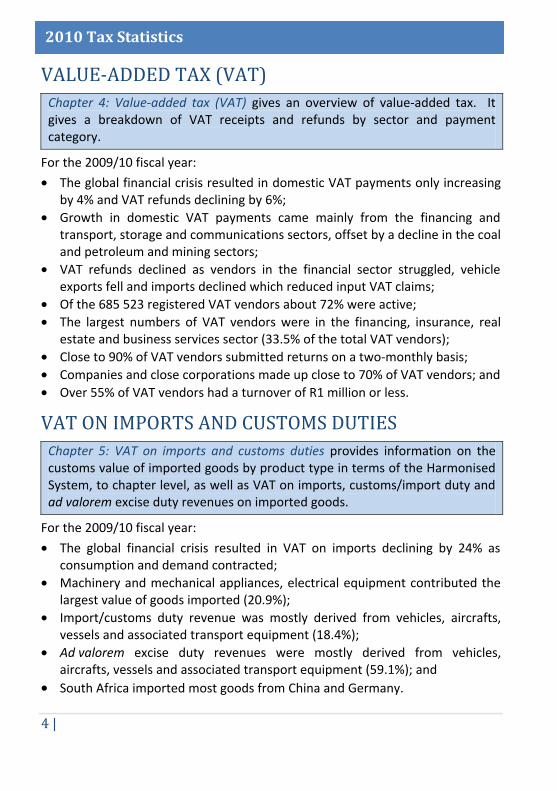
VALUE-ADDED TAX (VAT) Chapter 4: Value-added tax (VAT) gives an overview of value-added tax. It gives a breakdown of VAT receipts and refunds by sector and payment category.
For the 2009/10 fiscal year:
• The global financial crisis resulted in domestic VAT payments only increasing by 4% and VAT refunds declining by 6%;
• Growth in domestic VAT payments came mainly from the financing and transport, storage and communications sectors, offset by a decline in the coal and petroleum and mining sectors;
• VAT refunds declined as vendors in the financial sector struggled, vehicle exports fell and imports declined which reduced input VAT claims;
• Of the 685 523 registered VAT vendors about 72% were active; • The largest numbers of VAT vendors were in the financing, insurance, real
estate and business services sector (33.5% of the total VAT vendors); • Close to 90% of VAT vendors submitted returns on a two-monthly basis; • Companies and close corporations made up close to 70% of VAT vendors; and • Over 55% of VAT vendors had a turnover of R1 million or less.
VAT ON IMPORTS AND CUSTOMS DUTIES Chapter 5: VAT on imports and customs duties provides information on the customs value of imported goods by product type in terms of the Harmonised System, to chapter level, as well as VAT on imports, customs/import duty and ad valorem excise duty revenues on imported goods.
For the 2009/10 fiscal year:
• The global financial crisis resulted in VAT on imports declining by 24% as consumption and demand contracted;
• Machinery and mechanical appliances, electrical equipment contributed the largest value of goods imported (20.9%);
• Import/customs duty revenue was mostly derived from vehicles, aircrafts, vessels and associated transport equipment (18.4%);
• Ad valorem excise duty revenues were mostly derived from vehicles, aircrafts, vessels and associated transport equipment (59.1%); and
• South Africa imported most goods from China and Germany.
2010 Tax Statistics
1234567890123456789012345678901234567890123456789012345678901234567890123456789012345678901234567890123456789012345678901234567890123456789012345678901234567890 12345678901234567890123456789012345678901234567890123456789012345678901234567890123456789012345678901234567890123456789012345678901234567890123456789012345678901234567890123456789012345678901234567890123456789012345678901234567890123456789012345678901234567890123456789012345678901234567890123456789012345678901234567890123456789012345678901234567890123456789012345678901234567890123456789012345678901234567890123456789012345678901234567890123456789012345678901234567890123456789012345678901234567890123456789012345678901234567890123456789012345678901234567890123456789012345678901234567890123456789012345678901234567890123456789012345678901234567890123456789012345678901234567890123456789012345678901234567890123456789012345678901234567890123456789012345678901234567890123456789012345678901234567890123456789012345678901234567890123456789012345667890
The 2010 Tax Statistics publication is compiled with the latest available data from the South African Revenue Service (SARS) and National Treasury.
Some of the data may be incomplete and subject to revision.
The tables in Excel format are available for dowload on the websites of SARS and the National Treasury
Published by the National Treasury and SARS
To obtain copies of the publication please contact:
ECONOMIC TAX ANALYSIS UNITNational TreasuryPrivate Bag X115Pretoria0001South AfricaTel: +27 12 395 6546Fax: +27 12 315 5516www.treasury.gov.za
REVENUE PLANNING, ANALYLSIS AND REPORTING UNIT
South African Revenue ServicePrivate Bag X923
Pretoria0001
South AfricaTel: +27 12 422 5176
Fax: +27 12 422 5061email: [email protected]
www.sars.gov.za

A joint publication between National Treasury and the South African Revenue Service
Tax Statistics – Highlights