tbm prognoses for open-gripper and double … · 21.1 fjellsprengningsteknikk...
TRANSCRIPT
21.1
FJELLSPRENGNINGSTEKNIKK
BERGMEKANIKK/GEOTEKNIKK 2013
TBM PROGNOSES FOR OPEN-GRIPPER AND DOUBLE-SHIELD MACHINES:
CHALLENGES AND SOLUTIONS FOR WEAKNESS ZONES AND WATER
TBM prognoser for åpen-gripper og dobbelt-skjold maskiner: Utfordringer og løsninger
for svakhetssoner og vann
Dr. Nick Barton, Nick Barton & Associates
SUMMARY
World records for drill-and-blast tunnelling from Norway: we have at least two of them, and
world records for TBM advance rates from abroad, provide numbers in meters per day, per
week, and per month, which are difficult to believe for all who are distant from these
tunneling milestones. Unfortunately there are contrary and undesirable TBM records, which
are occasionally recurring events so not records, which see TBM stopped for years in fault
zones, or permanently buried in mountains. The many orders of magnitude range of
performance suggest the needs for better investigations, better choice of TBM, and better
facilities for improving the ground ahead of TBM, when probe-drilling indicates that this is
essential. Control of water, and improved behaviour in significant weakness zones and faults
demand pre-injection. Fortunately there are several signs that this is finally being recognized
by some TBM manufacturers. After improved performance during the learning curve, TBM
will generally decelerate as tunnel length and time increases. This means time-dependent
utilization, which is seldom quantified. Another important item for correct prognosis is the
recognition that reduced penetration rate PR can sometimes occur when thrust is increased by
the TBM operator, due to exceptionally resistant rock mass formations.
SAMMENDRAG
Verdensrekorder for inndrift i sprengte tunneler, minst to av disse tunnelene ligger i Norge, og
verdensrekorder for inndrift i TBM tunneler, utenlands, viser antall meter inndrifter per dag,
per uke og per mnd, som er vanskelige å fatte for alle som er langt borte fra disse milepælene
innenfor tunneldrift. Dessverre finnes det også stikk motsatte og uønskede TBM hendelser,
ikke TBM inndrifter, som viser TBM maskiner som har stått fast i forkastningssoner i årevis
eller som er permanent etterlatt inne i fjellet. Denne enorme forskjellen i TBM-inndrifter i
flere størrelsesorden, viser nødvendigheten av mer omfattende grunnundersøkelser, riktig valg
av TBM maskin type og viktigheten av bedre muligheter til å forbedre bergmassekvaliteten
foran TBM borekronen når sonderboringen viser at dette er helt avgjørende for inndriften.
Grunnvannskontroll og forbedret inndrift i store svakhetssoner og forkastninger krever
forbehandling med forinjeksjon. Heldigvis er det tegn som tyder på at disse signalene endelig
blir tatt hensyn til av noen TBM forhandlere. Etter at gradvis bedre inndrifter oppnås i
oppstartperioden vil TBM maskinene generelt oppnå avtagende inndrifter som funksjon av
økende tunnellengder og medgått tid. Bakgrunnen for dette er tidsavhengig utnyttelse, som
sjelden kvantifiseres i andres beregninger av inndrift. Et annet viktig tema er å akseptere at
redusert grad av inntrengnings rate (PR) oppnås selv om skyvetrykket på borekronen økes av
TBM operatøren, på grunn av en eksepsjonelt god bergmassekvalitet.
21.2
INTRODUCTION
During the last 10 years, Norwegian contractors have led the world in the fastest drill-and-
blast tunnelling rates, with 150m, 165m and even 176m in single 7x24 hour weeks. LNS and
Veidekke have had consistent rates of more than 100m/week for several months in specific
projects, and at the Svea coalmine access tunnel, in coal-measure rocks requiring significant
amounts of bolting and shotcreting, LNS achieved 100m per week or more for 32 weeks,
during a 54 week tunneling project with a 36 m2 cross-section and 5.8 km length. This is
actually better than many TBM project performances if one considers one year of tunneling.
However, and of course it is a very big however, TMB have incredible current world records
of 172m in 24 hours, 703m in one week, and 2163m in one month. Nevertheless, in the
record 3 to 4 m diameter class, the best monthly average is ‘only’1189m, and the world record
monthly average is ‘only’ 1352m, found in the 4 to 5m diameter class. Thanks to some
detailed TBM world record advance rate statistics provided by Robbins, it was possible to
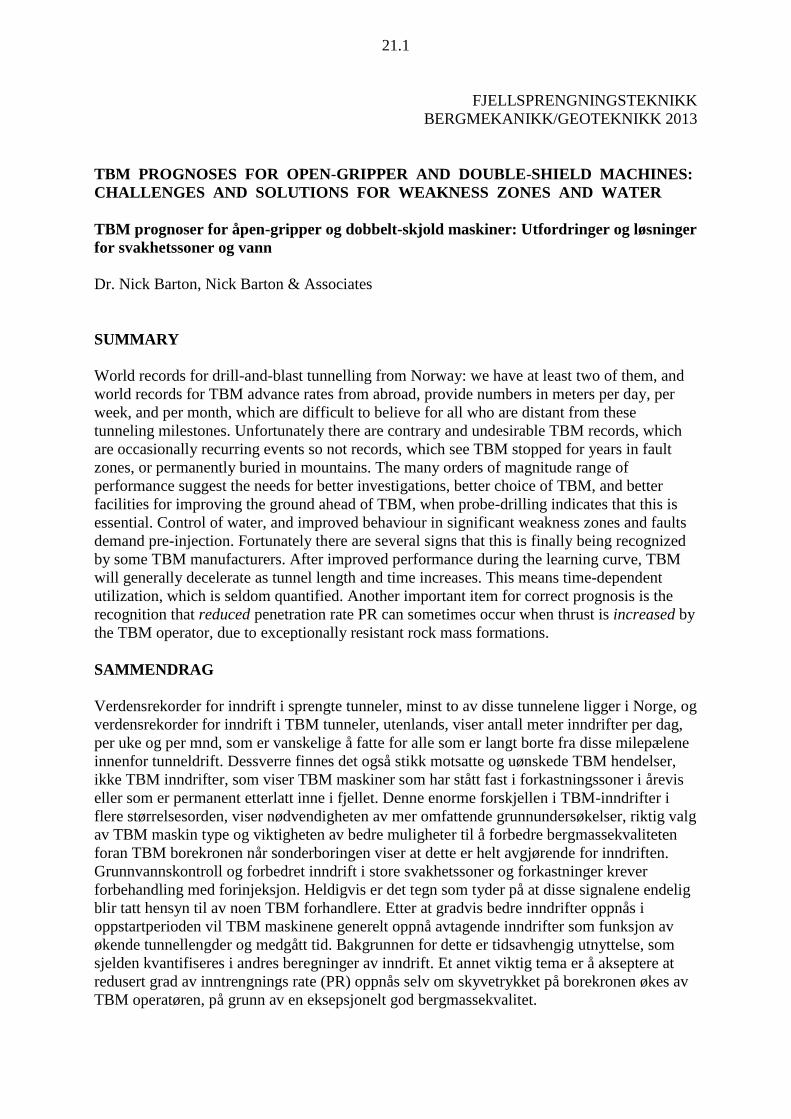
derive the record data shown in Figure 1. The 3 to 6m diameter class shown with the smallest
‘cubes’ is the mean of three sets of data given for 3-4m, 4-5m and 5-6m TBM, based on
assumed 24 hours, 168 hours and 720 hours. The 6 to10m diameter class shown with the
larger ‘cubes’ is the mean of four sets of data for 6-7m, 7-8m, 8-9m and 9-10m TBM.
Figure 1 Using a log-log-log plot of PR (penetration rate, left axis only) and AR (advance
rate in remainder of plotted area) and time T (total hours), the synthesized present world-
record data for different sizes of TBM is shown, based on data provided by Robbins, for all
sizes and several TBM manufacturers. The writer has converted day, week and month records
(given in meters) to the form AR (m/hr) by dividing by assumed 24, 168 and 720 hours. Data
from 8 countries are represented, chiefly USA and China. The record mean monthly data
plots at AR = 1.7 m/hr for the 3 to 6m class, and at AR = 1.1 m/hr for the 6 to 10m class, and
this is shown with two small circles. The larger crossed-circle to the right is 54 weeks for 5.8
km at Svea Tunnel, achieved during the LNS drill-and-blast record. This was driven in coal-
measure rocks and obviously required significant shotcreting and bolting, due to varied Q.
21.3
CASE RECORD EVIDENCE OF DECELERATION
There is an all too common habit of reporting utilization (U) of TBM without specifying the
time period involved. An estimated average daily utilization is especially an insufficient form
of prognosis. Since stand-stills are naturally excluded, the client may get an optimistic view of
likely performance. Utilization is estimated from the classic and most used TBM equation:
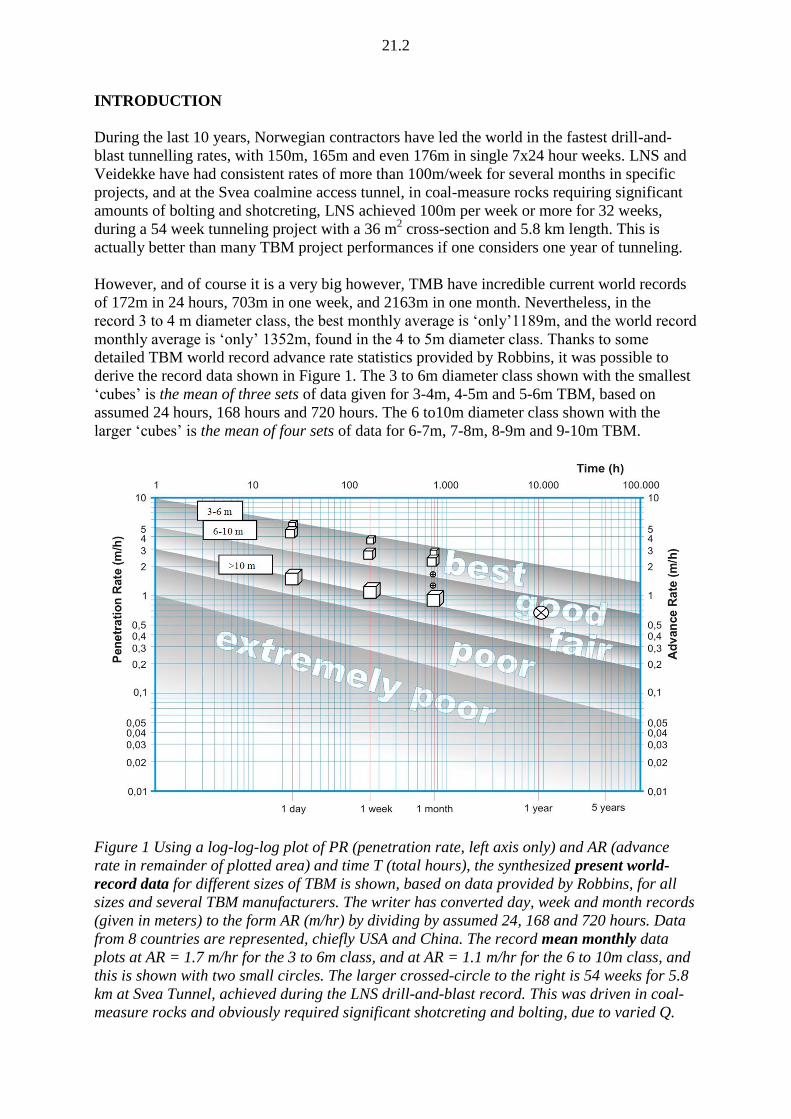
AR = PR x U (1)
where AR = (actual) advance rate in m/hr, and PR = penetration rate (for uninterrupted
boring) in m/hr. U is the fraction of time when boring has (or is expected) to actually occur, as
seen on the traditional ‘pie- or pizza-diagram’. For convenience U is usually expressed as a
percentage. Note that in Figure 2, U has been expressed as Tm
. This is explained in Table 1.
Figure 2 Trends from open-gripper case records representing 145 cases and approximately
1000km of TBM tunneling. The five typical ‘lines’ of performance are the same as shown in
Figure 1. The source of this smoothed data is shown in Figure 3. Barton (2000).
As illustrated by the world records of Figure 1, and as illustrated by 1000 km of mostly open-
gripper case records, summarized in Figure 2 from Barton (2000), there is actually a time-
dependent element in U which is conveniently ignored in a remarkable number of tunnel
magazine articles and even in TBM prognoses. Since a client pays for a completed tunnel, a
false impression of actual hours (T) is obtained if inevitable standstills are excluded. There are
approximately 24 x 7 x 51 ≈ 8730 hours of work in one year, and during TBM standstills the
clock is still running, with tunnel completion likely delayed. When U is replaced by Tm
more
realistic prognoses are possible. Many TBM projects come in ‘late’ due to ignorance of this
element of time / length.

21.4
Figure 3 A total of 145 case-records provided the above raw data for best (red), average
(green), and bad-ground (blue) performance, plotted on a log PR – log T – log AR graph
(Barton, 2000). ‘Unexpected events’ appear to be strongly correlated to low Q-values, as
seen more clearly in Figure 2. This aspect will be discussed later when discussing faults.
Table 1 Deceleration gradients (-m) for the five trends-of-performance lines. A specific 56
km of double-shield performance (two Wirth TBM, two Herrenknecht TBM) is also indicated,
but as shown in a later case record, this (optimistic) and at best halving of gradient (-m) may
not apply in tough cases, and is hardly evident in the record mean-monthly performances
(small circles shown in Figure 1). An EPB machine may double these double-shield gradients.
PERFORMANCE
LINE
#
DECELERATION
gradient
(-) m (units of LT-2
)
WR (world records)
1, 2, (good, fair)
3, 4 (poor, extremely poor)
(trends from 145 cases)
-0.13 to -0.17
-0.17, -0.19
-0.21, -0.25
(ca. 1000 km of mostly
OPEN-GRIPPER cases)
DOUBLE-SHIELD
(at Guadarrama)
-0.08 to -0.12
(4 x 14 km)
21.5
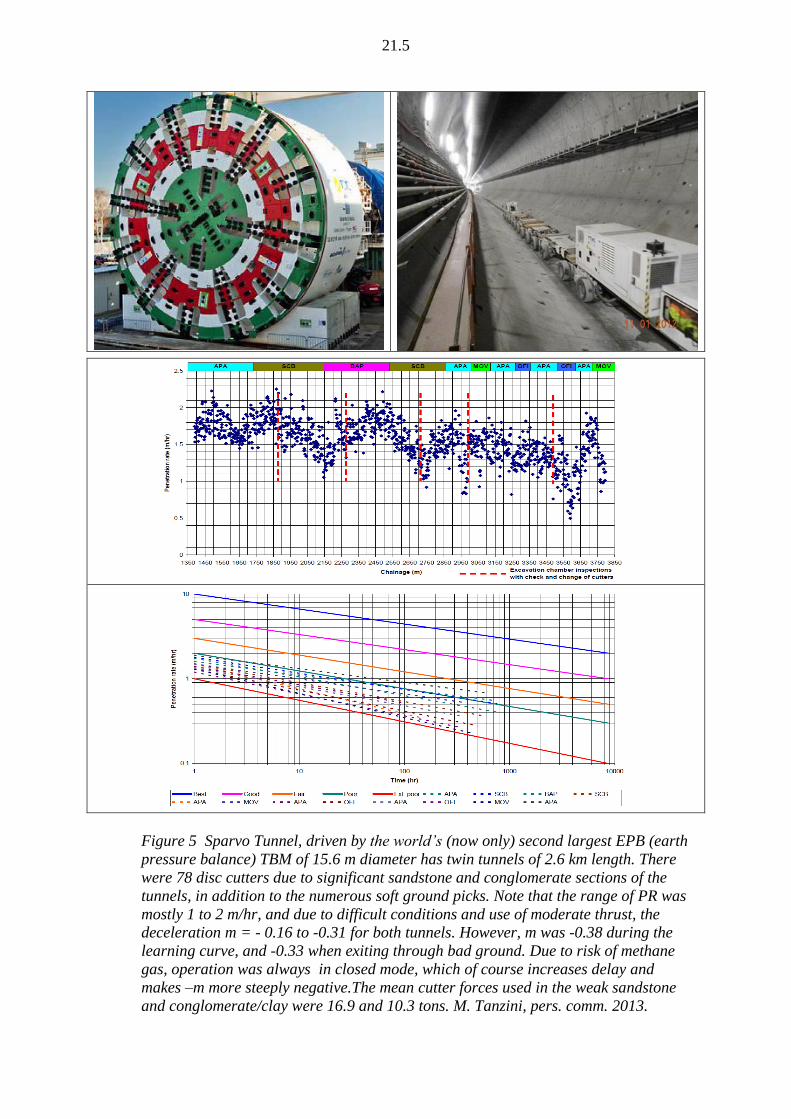
Figure 5 Sparvo Tunnel, driven by the world’s (now only) second largest EPB (earth
pressure balance) TBM of 15.6 m diameter has twin tunnels of 2.6 km length. There
were 78 disc cutters due to significant sandstone and conglomerate sections of the
tunnels, in addition to the numerous soft ground picks. Note that the range of PR was
mostly 1 to 2 m/hr, and due to difficult conditions and use of moderate thrust, the
deceleration m = - 0.16 to -0.31 for both tunnels. However, m was -0.38 during the
learning curve, and -0.33 when exiting through bad ground. Due to risk of methane
gas, operation was always in closed mode, which of course increases delay and
makes –m more steeply negative.The mean cutter forces used in the weak sandstone
and conglomerate/clay were 16.9 and 10.3 tons. M. Tanzini, pers. comm. 2013.
21.6
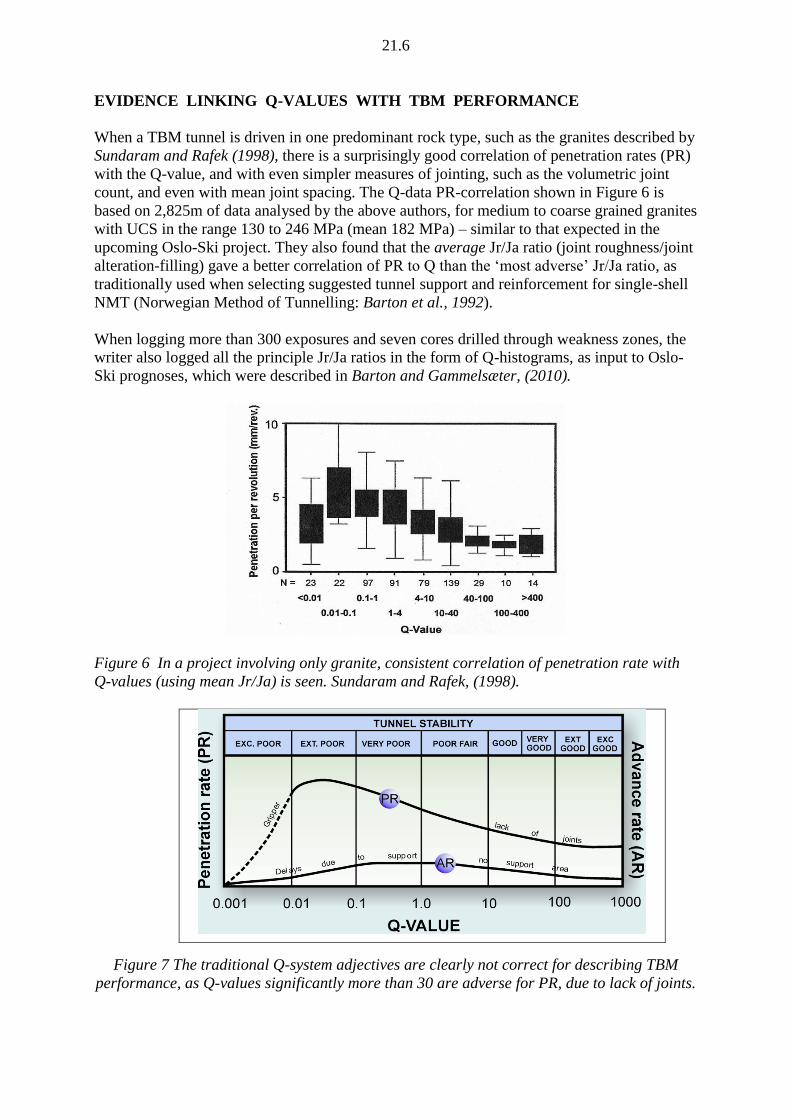
EVIDENCE LINKING Q-VALUES WITH TBM PERFORMANCE
When a TBM tunnel is driven in one predominant rock type, such as the granites described by
Sundaram and Rafek (1998), there is a surprisingly good correlation of penetration rates (PR)
with the Q-value, and with even simpler measures of jointing, such as the volumetric joint
count, and even with mean joint spacing. The Q-data PR-correlation shown in Figure 6 is
based on 2,825m of data analysed by the above authors, for medium to coarse grained granites
with UCS in the range 130 to 246 MPa (mean 182 MPa) – similar to that expected in the
upcoming Oslo-Ski project. They also found that the average Jr/Ja ratio (joint roughness/joint
alteration-filling) gave a better correlation of PR to Q than the ‘most adverse’ Jr/Ja ratio, as
traditionally used when selecting suggested tunnel support and reinforcement for single-shell
NMT (Norwegian Method of Tunnelling: Barton et al., 1992).
When logging more than 300 exposures and seven cores drilled through weakness zones, the
writer also logged all the principle Jr/Ja ratios in the form of Q-histograms, as input to Oslo-
Ski prognoses, which were described in Barton and Gammelsæter, (2010).
Figure 6 In a project involving only granite, consistent correlation of penetration rate with
Q-values (using mean Jr/Ja) is seen. Sundaram and Rafek, (1998).
Figure 7 The traditional Q-system adjectives are clearly not correct for describing TBM
performance, as Q-values significantly more than 30 are adverse for PR, due to lack of joints.
21.7
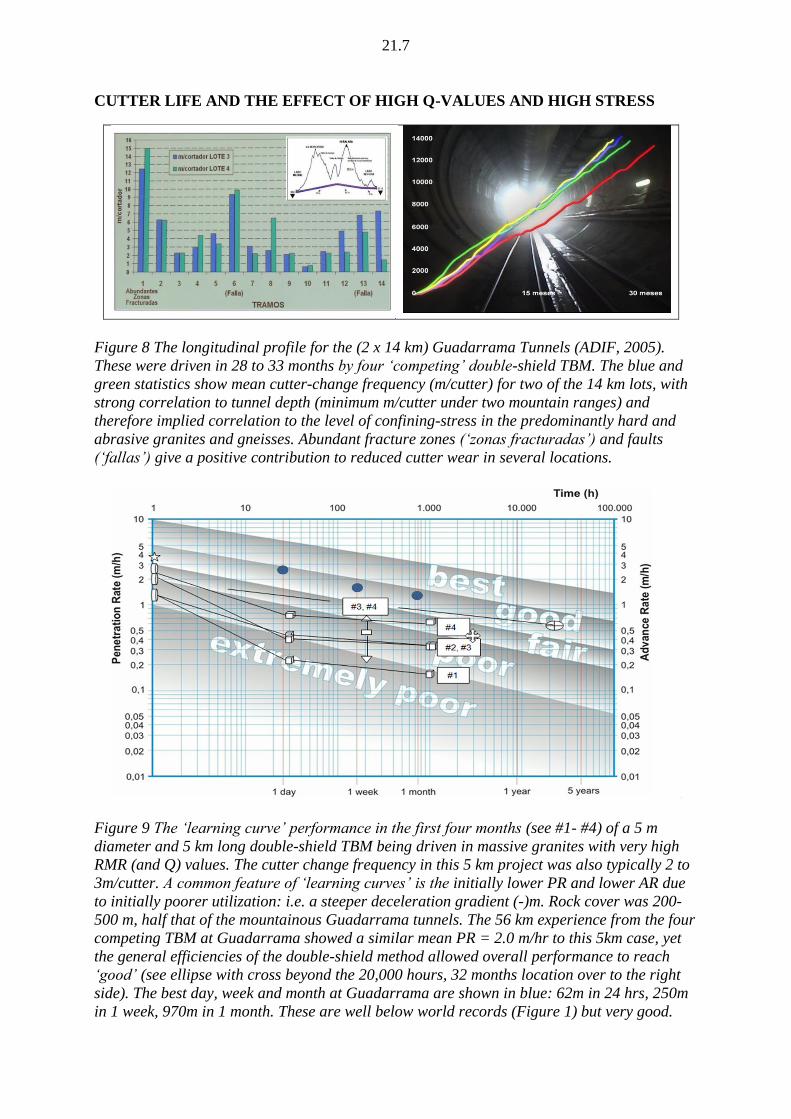
CUTTER LIFE AND THE EFFECT OF HIGH Q-VALUES AND HIGH STRESS
Figure 8 The longitudinal profile for the (2 x 14 km) Guadarrama Tunnels (ADIF, 2005).
These were driven in 28 to 33 months by four ‘competing’ double-shield TBM. The blue and
green statistics show mean cutter-change frequency (m/cutter) for two of the 14 km lots, with
strong correlation to tunnel depth (minimum m/cutter under two mountain ranges) and
therefore implied correlation to the level of confining-stress in the predominantly hard and
abrasive granites and gneisses. Abundant fracture zones (‘zonas fracturadas’) and faults
(‘fallas’) give a positive contribution to reduced cutter wear in several locations.
Figure 9 The ‘learning curve’ performance in the first four months (see #1- #4) of a 5 m
diameter and 5 km long double-shield TBM being driven in massive granites with very high
RMR (and Q) values. The cutter change frequency in this 5 km project was also typically 2 to
3m/cutter. A common feature of ‘learning curves’ is the initially lower PR and lower AR due
to initially poorer utilization: i.e. a steeper deceleration gradient (-)m. Rock cover was 200-
500 m, half that of the mountainous Guadarrama tunnels. The 56 km experience from the four
competing TBM at Guadarrama showed a similar mean PR = 2.0 m/hr to this 5km case, yet
the general efficiencies of the double-shield method allowed overall performance to reach
‘good’ (see ellipse with cross beyond the 20,000 hours, 32 months location over to the right
side). The best day, week and month at Guadarrama are shown in blue: 62m in 24 hrs, 250m
in 1 week, 970m in 1 month. These are well below world records (Figure 1) but very good.

21.8
The cutter life statistics of the two projects described in Figures 8 and 9, emphasize the
importance of the NTH/NTNU cutter life index CLI, which has been an important part of the
writer’s prognosis model QTBM from the start. On a number of occasions, the results of NTNU
rock testing and especially CLI results have been requested, where QTBM is being used at a
foreign project.
Figure 10 The cutter life index CLI, developed at NTH/NTNU in the 1990’s is an important
performance indicator, especially when combined with measures of the degree of jointing,
such as the ‘NTH joint Class’ or the Q or RMR value. NTH, 1994.
A combination of four factors: low CLI (as for granite, granitic gneiss, quartzite), high quartz
content, high UCS (obviously linked with these rock types) and massive sparsely jointed rock,
with for instance Q-values > 100, and RMR > 80 is an inevitable ‘recipe’ for frequent cutter
change statistics. When the above factors are combined with significant depth of cover, the
additional confining-pressure acting across the face of the tunnel, and directly adding to the
difficulty of chip formation, many cause cutter life to dip below 2m/cutter, and on occasion
even below 1m/cutter. Clearly this will be a significant task for the daily/nightly maintenance
shift, and besides the time for replacement of say 10 cutters, there will be the added effect that
for some of the 10 to15 hours of boring, a number of cutters will have become sub-standard.
While on the subject of maintenance shifts, it is unfortunately a fact of life that in the case of
double-shield TBM which are convenient for allowing simultaneous PC-element ring
assembly, there will only be the possibility of observing and approximately logging the rock
conditions, when the machine has stopped for cutter change. The ‘inner climate’ with hot
cutters and sauna-like conditions at first, are not conductive to easy Q or RMR or
NTH/NTNU joint class mapping. The writer has been a consultant at some TBM sites where
only the smallest engineering geologists get to log the data in the confined space, and must
share their observations with colleagues (and with the consultants).
It is therefore remarkable that certain authors who will not be named, both in Norway and
Italy and elsewhere, are happy to present other’s ‘data’ showing apparently poor correlation
of PR statistics and Q TBM values, when in reality the only rock mass quality logging was at
15, 20 or 25m intervals (each 24 hours) when the TBM was stopped for maintenance, because
the rock could not be observed while boring. Worse still, Q was mostly obtained by
subsequent estimation from RMR logging, since original authors were not at first aware of
QTBM, so they ‘retro-actively’ estimated QTBM. Is this a valid basis for critique? Most of the
case record data seen in Figure 3 were obtained from open-gripper TBM projects, where rock
mass conditions were well described on a continuous basis, and not only by the most agile
engineering geologists at well-spaced intervals.

21.9
CUTTER THRUST COMPARED TO ROCK MASS STRENGTH
Recent trials with instrumented cutter bearings in Austria, described by Entacher et al., 2013
have demonstrated the actual complexity, though logical nature of cutter force distributions.
Of necessity one divides net thrust by the number of cutters, to estimate mean thrust per
cutter, and then can compare this with a measure of rock strength. The reality, as shown in
Figure 10, is that cutter thrust oscillates strongly about the assumed mean, and in addition
varies across the face of the tunnel if the resistance to chip and block formation also varies.
This of course will be linked to the relative dominance of massive or jointed/foliated rock.
Figure 11 Normal forces monitored during three consecutive cutterhead revolutions (a–c)
and the averaged forces of these figures compared with the corresponding geological
mapping (d). These interesting measurements were made recently at the Koralm tunnel in
Austria, and were reported by Entacher et al., 2013.
These cutter force oscillations will often be present when the rock mass is frequently varying
across the face, which means that comparison of assumed mean cutter force, such as 20, 25 or
even 30 tons per cutter, with the resistance of the rock is going to be an approximate exercise.
Nevertheless it is an obvious advantage if the estimate of resistance of the rock is as realistic
as possible. This means that the rock mass and not the rock material should be used. To base
penetration rate prognoses only on rock UCS values is to invite inaccuracies. And to not
compare assumed cutter thrust with any measure of rock strength is an invitation to greater
lack of reality. The reasons for insisting on this ‘thrust/strength’ comparison are illustrated in
four examples in Figure 12. Only if the TBM has sufficient thrust in relation to rock mass
strength will one obtain the expected result of increased penetration rate with increased thrust.

21.10
Figure 12 The ‘logical’ expectation of increased penetration rate with increased thrust from
the operator (diagrams 1 and 3: clockwise from top-left) may not be experienced if a TBM is
underpowered in relation to very hard massive rock. Only one of these experiences (the
shale/limestone case, #2) is outdated in relation to available thrust, but is given for
illustration. (See Barton, 2000 for review of these cases).
Figure 13 There is a logical correlation between penetration rate (given here in m/hr) and the
Q-value. Massive rock slows progress, and if UCS (σc) is also high, a slower penetration rate
is inevitable. Low UCS and low Q-value (but not too low) are positive, as in the left-hand
bottom corner. Boring in hard quite high-quality rock masses, as mostly expected in the Oslo-
Ski tunnels, will frequently move PR towards the top right-hand corner: i.e. combining high
Q, high UCS, with lower PR. From Innaurato et al., (1991).
21.11
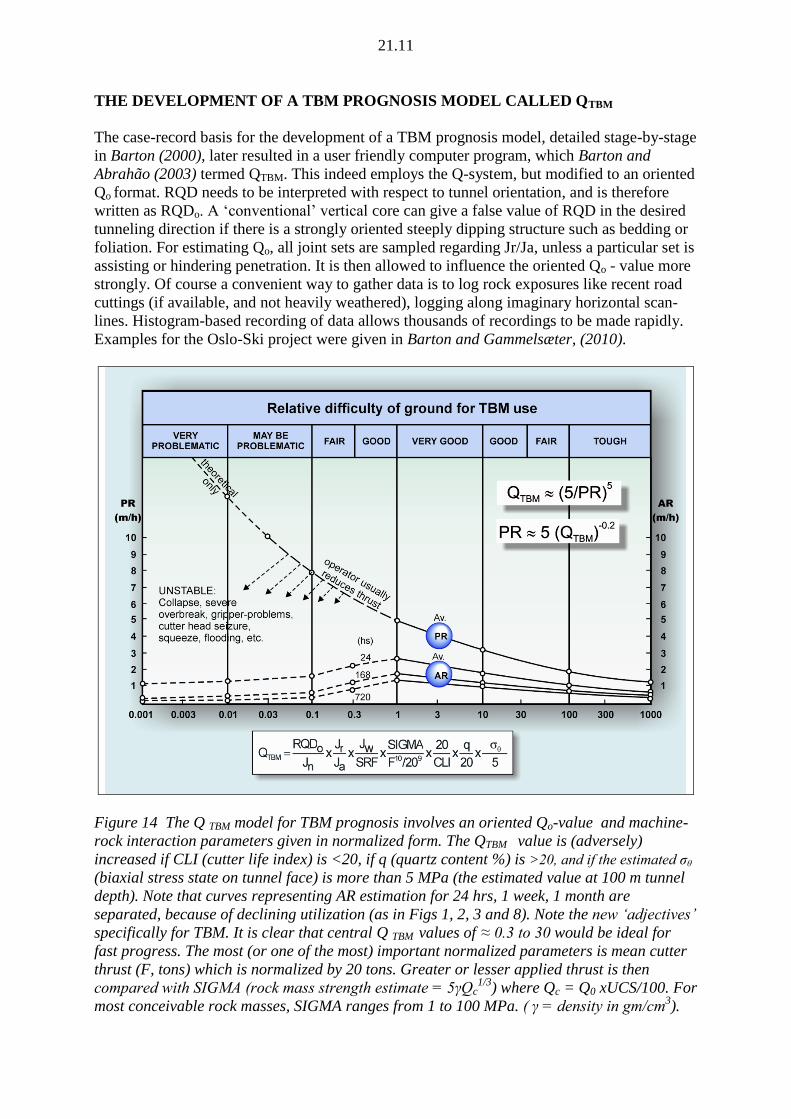
THE DEVELOPMENT OF A TBM PROGNOSIS MODEL CALLED QTBM
The case-record basis for the development of a TBM prognosis model, detailed stage-by-stage
in Barton (2000), later resulted in a user friendly computer program, which Barton and
Abrahão (2003) termed QTBM. This indeed employs the Q-system, but modified to an oriented
Qo format. RQD needs to be interpreted with respect to tunnel orientation, and is therefore
written as RQDo. A ‘conventional’ vertical core can give a false value of RQD in the desired
tunneling direction if there is a strongly oriented steeply dipping structure such as bedding or
foliation. For estimating Qo, all joint sets are sampled regarding Jr/Ja, unless a particular set is
assisting or hindering penetration. It is then allowed to influence the oriented Qo - value more
strongly. Of course a convenient way to gather data is to log rock exposures like recent road
cuttings (if available, and not heavily weathered), logging along imaginary horizontal scan-
lines. Histogram-based recording of data allows thousands of recordings to be made rapidly.
Examples for the Oslo-Ski project were given in Barton and Gammelsæter, (2010).
Figure 14 The Q TBM model for TBM prognosis involves an oriented Qo-value and machine-
rock interaction parameters given in normalized form. The QTBM value is (adversely)
increased if CLI (cutter life index) is <20, if q (quartz content %) is >20, and if the estimated σθ
(biaxial stress state on tunnel face) is more than 5 MPa (the estimated value at 100 m tunnel
depth). Note that curves representing AR estimation for 24 hrs, 1 week, 1 month are
separated, because of declining utilization (as in Figs 1, 2, 3 and 8). Note the new ‘adjectives’
specifically for TBM. It is clear that central Q TBM values of ≈ 0.3 to 30 would be ideal for
fast progress. The most (or one of the most) important normalized parameters is mean cutter
thrust (F, tons) which is normalized by 20 tons. Greater or lesser applied thrust is then
compared with SIGMA (rock mass strength estimate = 5γQc1/3
) where Qc = Q0 xUCS/100. For
most conceivable rock masses, SIGMA ranges from 1 to 100 MPa. ( γ = density in gm/cm3).

21.12
The principles of the QTBM prognosis model
• Allow the Q-value to assist in determining delays due to support requirements (it
therefore effects – where appropriate - the deceleration gradient -m) and overall AR.
• Allow the Q-value, and critical rock-cutter, and rock mass-machine parameters to also
determine the speed of cutting (therefore effecting slower or faster PR).
• These dual legitimate roles of Q were not understood by Blindheim (2005) (See ‘A
critique of QTBM’, and Barton (2005) reply, both published in TTI, London).
Figure 15 Example of estimated input data for the 11th
zone modelled.
Figure 16 The graphic output concerning the calculated PR and mean AR (both in m/hr) for
the above eleven separate zones. Only one of the faulted rock / weakness zones (dips below
‘horizon’) is predicted to cause trouble with the assumed double-shield TBM. A weighted
mean of about 10,000 hours for 8 km of tunnelling is predicted for this double-shield TBM.

21.13
FAULT AND WEAKNESS ZONES AND THEIR REPRESENTATION IN QTBM
The fundamental difficulties of tunneling through fault zones, and modeling this successfully,
can be summarized by the following series of very simple equations, which provide a
convincing explanation of why so much time (T) can be lost in an unexpected fault zone. The
key to this understanding is that the universal but variable deceleration gradient (-m) is
strongly linked to low Q-values. Low Q-values and high negative deceleration gradients
(meaning low utilization) go hand-in-hand. U cannot then be independent of time T.
Double-shield TBM with push-off liner capabilities may also get severely delayed if the zone
is serious, as over-boring (void development in front of, to one side, or above the cutter-head)
can just as easily develop ahead of these machines as ahead of open-gripper TBM, unless pre-
injection in the one case, or spiling has been performed. New facilities for this are illustrated
later in this section. In the meantime, inflow of water might be occurring in an uncontrolled
manner (and for too long), with groundwater drawdown as a likely result in the case of
shallow tunnels. Risk analysis should address such consequences and their mitigation.
We need three basic equations to understand potential delays in fault zones. (The following
nomenclature will be used as before: AR= advance rate, PR= penetration rate, U= utilization,
expressed as a fraction, for any chosen total time period T in hours). Firstly:
AR = PR x U (all TBM must follow this) (1)
U = Tm
(2)
(Due to the reducing utilization with time, advance rate decelerates, see Figures 1, 2, and 3)
T = L / AR (3)
(Obviously time needed for advancing length L must be equal to L/AR – in fact this also
applies to walking. With continuous boring T = L/PR).
Therefore by simple substitution we have the following:
T = L / (PR x Tm) (T appears on both sides of the equation: the final expression for T is:)
T = (L / PR) 1 / ( 1+m )
(4)
This is a very important equation for TBM, if one accepts the case record evidence that (-)m is
strongly related to low Q-values in fault zones and significant weakness zones. It is important
because very negative (-)m values make the component 1/(1+m) too big. If the fault zone is
wide (large L) and PR is low (no use of grippers, water problems) then L/PR gets too big to
tolerate a big component 1/(1+m) in equation 4. It is easy (in fact much too easy) to calculate
an almost ‘infinite’ time for a fault zone using this ‘theo-empirical’ equation. The writer
knows of four permanently buried, usually fault-destroyed, occasionally rock-burst destroyed
TBM (Pont Ventoux, Dul Hasti, Pinglin, Jinping II). There are certainly many more, and the
causes may be related to equation 4 logic. Fault zones will remain a serious threat to TBM
tunneling as we know it, unless the extremely poor rock mass qualities associated with fault
zones can be improved by drainage and pre-grouting, specifically where Q < 0.1.
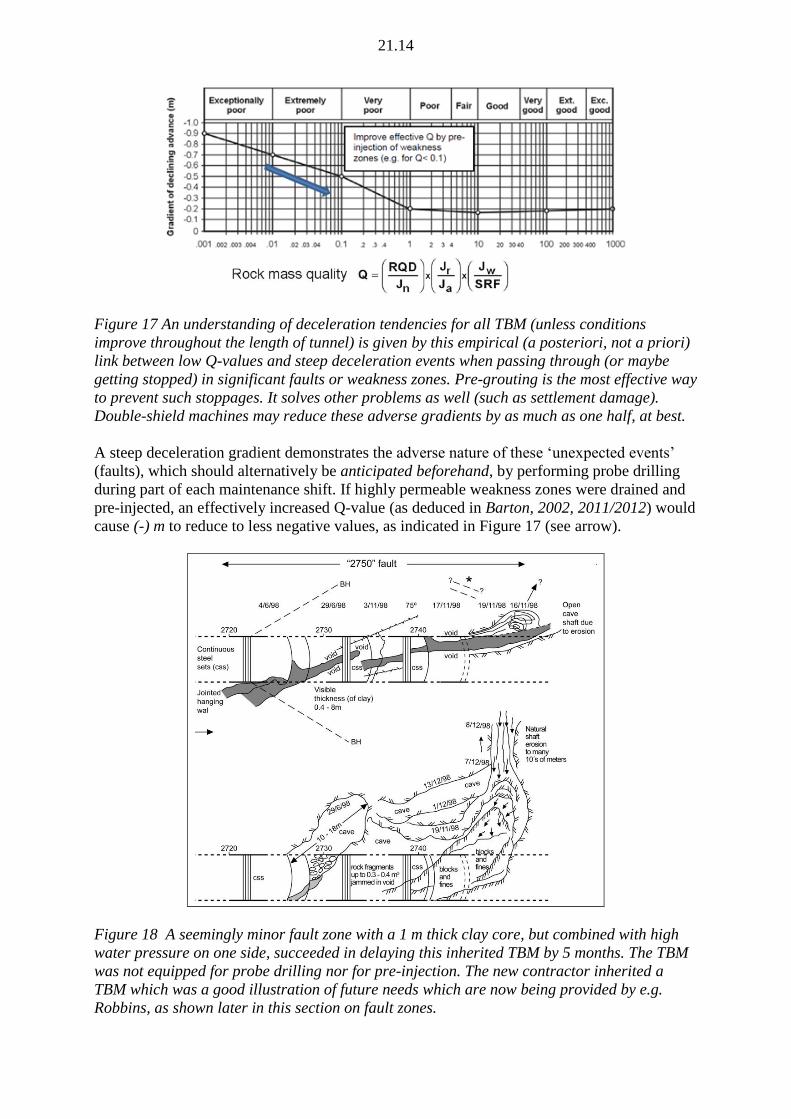
21.14
Figure 17 An understanding of deceleration tendencies for all TBM (unless conditions
improve throughout the length of tunnel) is given by this empirical (a posteriori, not a priori)
link between low Q-values and steep deceleration events when passing through (or maybe
getting stopped) in significant faults or weakness zones. Pre-grouting is the most effective way
to prevent such stoppages. It solves other problems as well (such as settlement damage).
Double-shield machines may reduce these adverse gradients by as much as one half, at best.
A steep deceleration gradient demonstrates the adverse nature of these ‘unexpected events’
(faults), which should alternatively be anticipated beforehand, by performing probe drilling
during part of each maintenance shift. If highly permeable weakness zones were drained and
pre-injected, an effectively increased Q-value (as deduced in Barton, 2002, 2011/2012) would
cause (-) m to reduce to less negative values, as indicated in Figure 17 (see arrow).
Figure 18 A seemingly minor fault zone with a 1 m thick clay core, but combined with high
water pressure on one side, succeeded in delaying this inherited TBM by 5 months. The TBM
was not equipped for probe drilling nor for pre-injection. The new contractor inherited a
TBM which was a good illustration of future needs which are now being provided by e.g.
Robbins, as shown later in this section on fault zones.

21.15
Figure 19. Exceptional problems in faulted meta sandstones, with the need for a top-heading
to release the cutter-head. Shen et al., 1999. Such stoppages provided the opportunity for
replacing cutter-head ‘armour’ which was worn out every 4 to 5 km, as also at the
Guadarrama tunnel project in mostly granites and gneisses. Many smaller delays and larger
delays like this are contributing to T and therefore to a steeper (-) m than generally
acknowledged by designers or by those offering constant m/month tunneling.
Figure 20 A pilot tunnel for drainage and pre-injection across to the main tunnels, as used
successfully at the Channel Tunnels in chalk-marl, was not successful at the Pinglin Tunnel
project in Taiwan, due to numerous cutter-head blockages and need for side-access drifts (at
least 13 times). In addition the contractor had great difficulty even drilling stable holes for
pre-injection, due to the intensely jointed, sheared and clay-coated joints and slickensides in
the very hard meta-sandstones. Photo: Chris Fong.
21.16
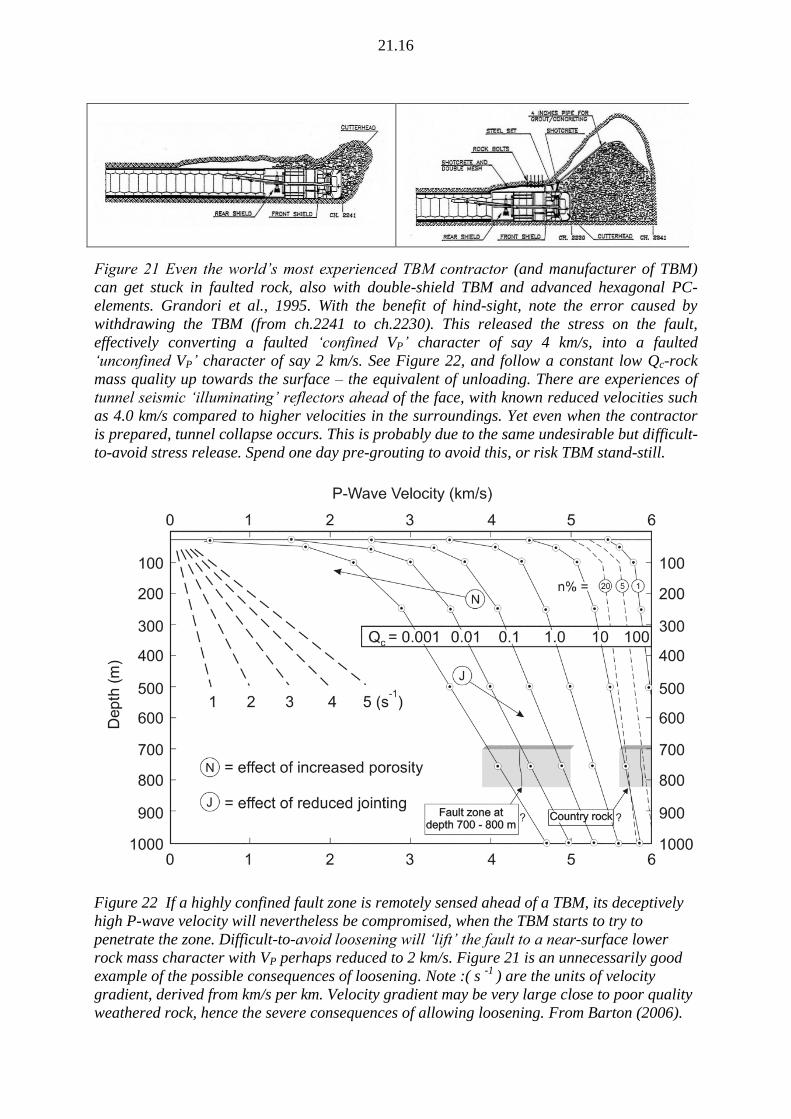
Figure 21 Even the world’s most experienced TBM contractor (and manufacturer of TBM)
can get stuck in faulted rock, also with double-shield TBM and advanced hexagonal PC-
elements. Grandori et al., 1995. With the benefit of hind-sight, note the error caused by
withdrawing the TBM (from ch.2241 to ch.2230). This released the stress on the fault,
effectively converting a faulted ‘confined VP’ character of say 4 km/s, into a faulted
‘unconfined VP’ character of say 2 km/s. See Figure 22, and follow a constant low Qc-rock
mass quality up towards the surface – the equivalent of unloading. There are experiences of
tunnel seismic ‘illuminating’ reflectors ahead of the face, with known reduced velocities such
as 4.0 km/s compared to higher velocities in the surroundings. Yet even when the contractor
is prepared, tunnel collapse occurs. This is probably due to the same undesirable but difficult-
to-avoid stress release. Spend one day pre-grouting to avoid this, or risk TBM stand-still.
Figure 22 If a highly confined fault zone is remotely sensed ahead of a TBM, its deceptively
high P-wave velocity will nevertheless be compromised, when the TBM starts to try to
penetrate the zone. Difficult-to-avoid loosening will ‘lift’ the fault to a near-surface lower
rock mass character with VP perhaps reduced to 2 km/s. Figure 21 is an unnecessarily good
example of the possible consequences of loosening. Note :( s -1
) are the units of velocity
gradient, derived from km/s per km. Velocity gradient may be very large close to poor quality
weathered rock, hence the severe consequences of allowing loosening. From Barton (2006).
21.17
TBM DESIGN ASPECTS FOR TACKLING WEAKNESS ZONES
Some seemingly obvious points about TBM design for more successful penetration of faults
and serious weakness zones can be grouped in the following categories.
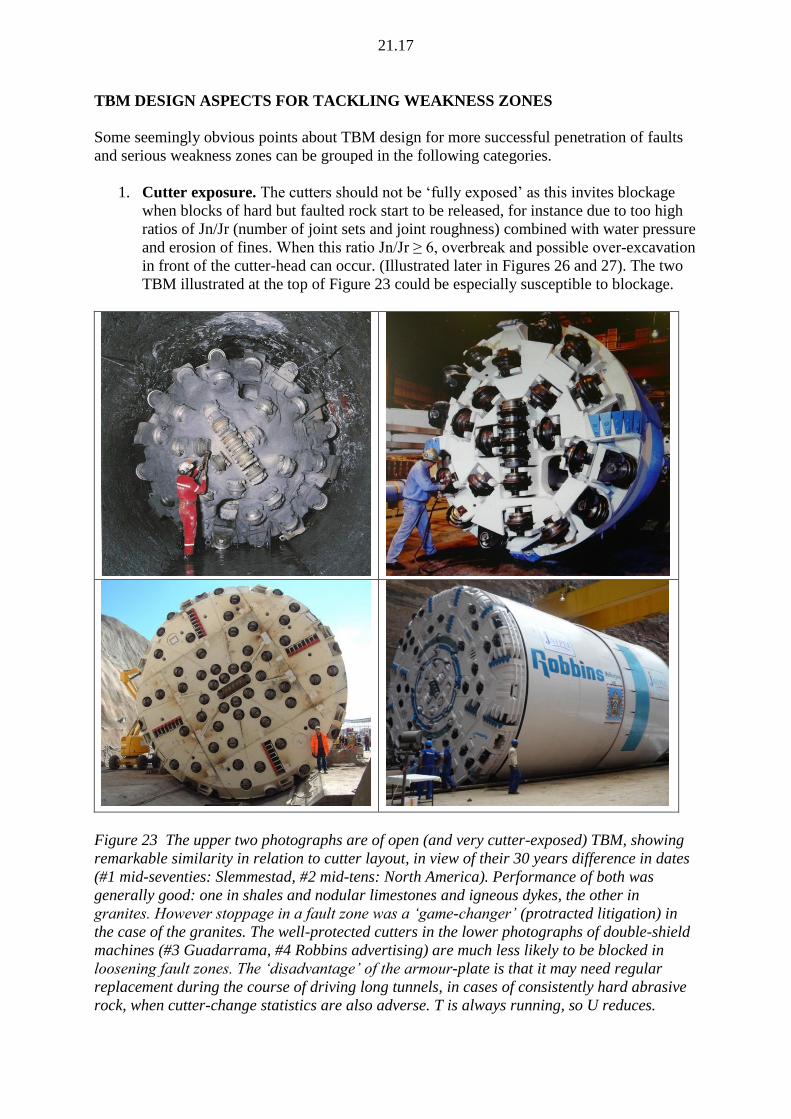
1. Cutter exposure. The cutters should not be ‘fully exposed’ as this invites blockage
when blocks of hard but faulted rock start to be released, for instance due to too high
ratios of Jn/Jr (number of joint sets and joint roughness) combined with water pressure
and erosion of fines. When this ratio Jn/Jr ≥ 6, overbreak and possible over-excavation
in front of the cutter-head can occur. (Illustrated later in Figures 26 and 27). The two
TBM illustrated at the top of Figure 23 could be especially susceptible to blockage.
Figure 23 The upper two photographs are of open (and very cutter-exposed) TBM, showing
remarkable similarity in relation to cutter layout, in view of their 30 years difference in dates
(#1 mid-seventies: Slemmestad, #2 mid-tens: North America). Performance of both was
generally good: one in shales and nodular limestones and igneous dykes, the other in
granites. However stoppage in a fault zone was a ‘game-changer’ (protracted litigation) in
the case of the granites. The well-protected cutters in the lower photographs of double-shield
machines (#3 Guadarrama, #4 Robbins advertising) are much less likely to be blocked in
loosening fault zones. The ‘disadvantage’ of the armour-plate is that it may need regular
replacement during the course of driving long tunnels, in cases of consistently hard abrasive
rock, when cutter-change statistics are also adverse. T is always running, so U reduces.
21.18
2. Cutter ‘protection’ with armour plating across the face of the cutter-head is a good
way to prevent seizure due to block-fall wedging. However, there is a price to pay
which may be experienced when driving long tunnels in hard abrasive rocks: the
armour may need in-tunnel replacement at 4 to 5 km intervals. This is obviously not
an ‘over-night’ repair like multiple-cutter change, requiring worker, welder, and
lifting-gear access ahead-of-the-cutter-head, when in a stable and preferably dry zone.
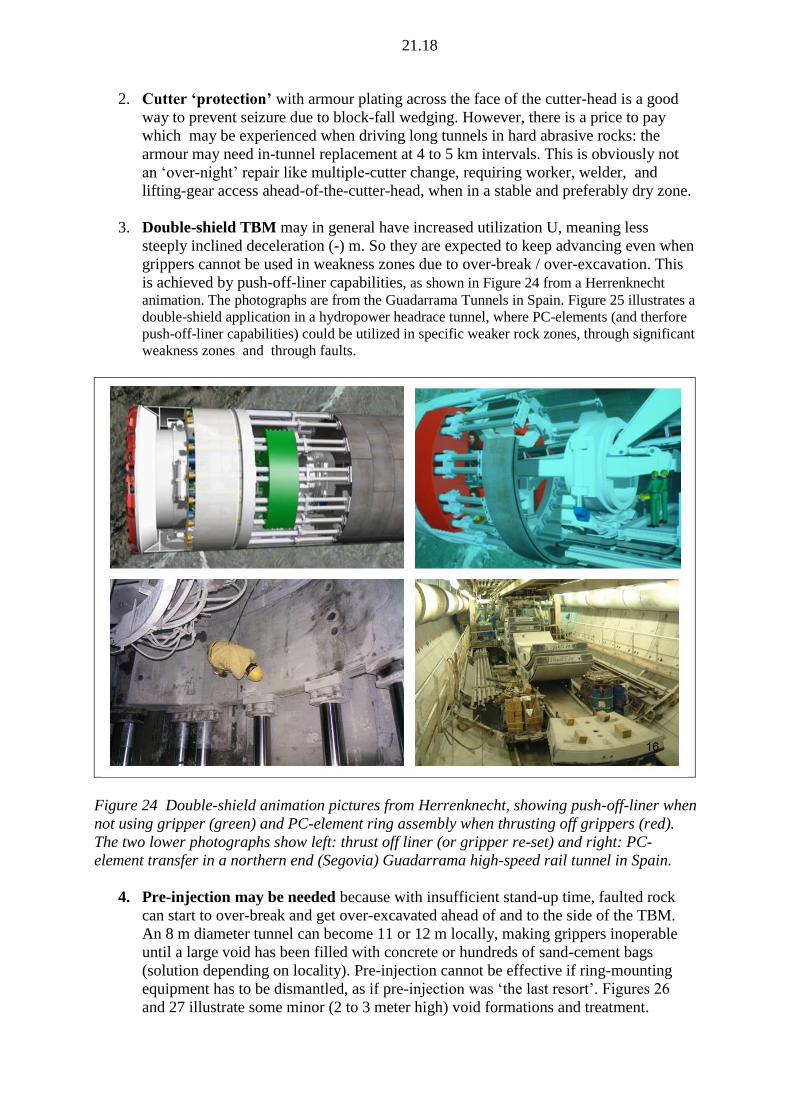
3. Double-shield TBM may in general have increased utilization U, meaning less
steeply inclined deceleration (-) m. So they are expected to keep advancing even when
grippers cannot be used in weakness zones due to over-break / over-excavation. This
is achieved by push-off-liner capabilities, as shown in Figure 24 from a Herrenknecht
animation. The photographs are from the Guadarrama Tunnels in Spain. Figure 25 illustrates a
double-shield application in a hydropower headrace tunnel, where PC-elements (and therfore
push-off-liner capabilities) could be utilized in specific weaker rock zones, through significant
weakness zones and through faults.
Figure 24 Double-shield animation pictures from Herrenknecht, showing push-off-liner when
not using gripper (green) and PC-element ring assembly when thrusting off grippers (red).
The two lower photographs show left: thrust off liner (or gripper re-set) and right: PC-
element transfer in a northern end (Segovia) Guadarrama high-speed rail tunnel in Spain.
4. Pre-injection may be needed because with insufficient stand-up time, faulted rock
can start to over-break and get over-excavated ahead of and to the side of the TBM.
An 8 m diameter tunnel can become 11 or 12 m locally, making grippers inoperable
until a large void has been filled with concrete or hundreds of sand-cement bags
(solution depending on locality). Pre-injection cannot be effective if ring-mounting
equipment has to be dismantled, as if pre-injection was ‘the last resort’. Figures 26
and 27 illustrate some minor (2 to 3 meter high) void formations and treatment.
21.19
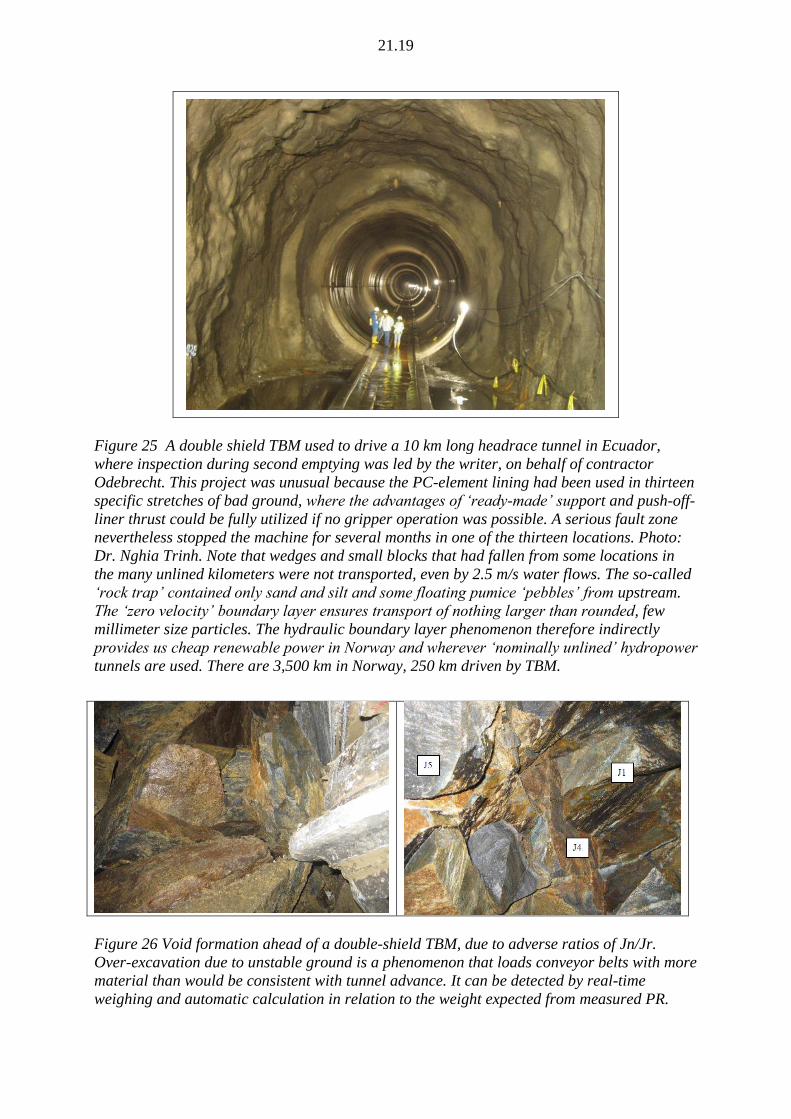
Figure 25 A double shield TBM used to drive a 10 km long headrace tunnel in Ecuador,
where inspection during second emptying was led by the writer, on behalf of contractor
Odebrecht. This project was unusual because the PC-element lining had been used in thirteen
specific stretches of bad ground, where the advantages of ‘ready-made’ support and push-off-
liner thrust could be fully utilized if no gripper operation was possible. A serious fault zone
nevertheless stopped the machine for several months in one of the thirteen locations. Photo:
Dr. Nghia Trinh. Note that wedges and small blocks that had fallen from some locations in
the many unlined kilometers were not transported, even by 2.5 m/s water flows. The so-called
‘rock trap’ contained only sand and silt and some floating pumice ‘pebbles’ from upstream.
The ‘zero velocity’ boundary layer ensures transport of nothing larger than rounded, few
millimeter size particles. The hydraulic boundary layer phenomenon therefore indirectly
provides us cheap renewable power in Norway and wherever ‘nominally unlined’ hydropower
tunnels are used. There are 3,500 km in Norway, 250 km driven by TBM.
Figure 26 Void formation ahead of a double-shield TBM, due to adverse ratios of Jn/Jr.
Over-excavation due to unstable ground is a phenomenon that loads conveyor belts with more
material than would be consistent with tunnel advance. It can be detected by real-time
weighing and automatic calculation in relation to the weight expected from measured PR.

21.20
Figure 27 Suggested solution for void formation: an after-the-event measure that is actually
too late, as a few meters per day may be the limits of advance if the zone of over-excavation
continuues for several weeks. Note that a tunnel fire can be caused if too large volumes of
chemical grout mix are needed for void filling. ‘Waiting for the smoke’ (to clear), is unexpect-
edly different from ‘waiting for the train’ on a pie-diagram. The problem with this TBM was
that ring-mounting equipment had to be dismantled before pre-injection drilling could be
performed, clearly not the ideal choice of priority if faulted rock is expected. How to do both
(build rings and pre-inject) when both were needed was not satisfactorily adressed.
Figure 28 One stage closer to the ideal TBM (Robbins: Wallis, 2012) with full
acknowledgement of the possible need of pre-injection with minimum delay. This ‘all
conditions’ tunneller may be closer to the ideal than universal double-shield concepts, as
presently seen, but advances by all manufactures are occurring on a regular basis. It seems
finally to be acknowledged that rock masses (and hydro-geologies) can exceed the
capabilities of ‘standard’ TBM. Burials and stand-stills have forced this acknoledgement, but
it has taken the costly consequences of many decades of stoic optimism, under the costly
motto: ‘because the tunnel is long we chose TBM’. This decision has enhanced risk of delays
more than most other decisions in tunnelling history.
21.21
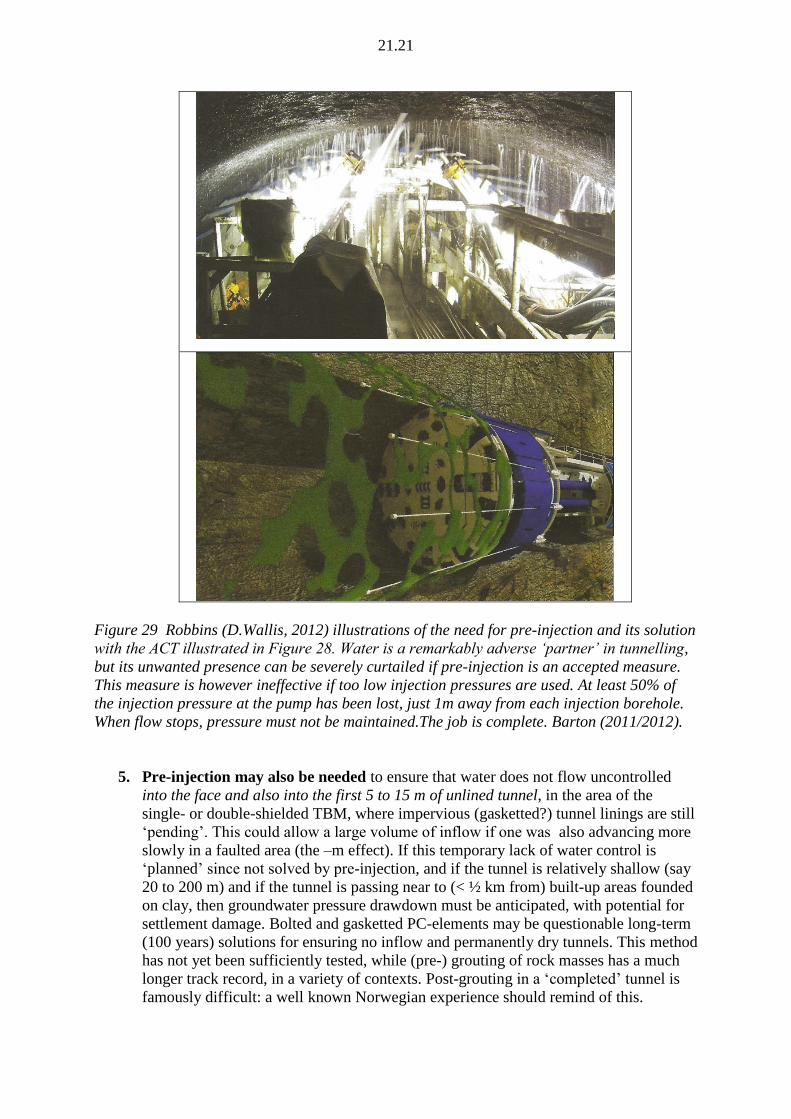
Figure 29 Robbins (D.Wallis, 2012) illustrations of the need for pre-injection and its solution
with the ACT illustrated in Figure 28. Water is a remarkably adverse ‘partner’ in tunnelling,
but its unwanted presence can be severely curtailed if pre-injection is an accepted measure.
This measure is however ineffective if too low injection pressures are used. At least 50% of
the injection pressure at the pump has been lost, just 1m away from each injection borehole.
When flow stops, pressure must not be maintained.The job is complete. Barton (2011/2012).
5. Pre-injection may also be needed to ensure that water does not flow uncontrolled
into the face and also into the first 5 to 15 m of unlined tunnel, in the area of the
single- or double-shielded TBM, where impervious (gasketted?) tunnel linings are still
‘pending’. This could allow a large volume of inflow if one was also advancing more
slowly in a faulted area (the –m effect). If this temporary lack of water control is
‘planned’ since not solved by pre-injection, and if the tunnel is relatively shallow (say
20 to 200 m) and if the tunnel is passing near to (< ½ km from) built-up areas founded
on clay, then groundwater pressure drawdown must be anticipated, with potential for
settlement damage. Bolted and gasketted PC-elements may be questionable long-term
(100 years) solutions for ensuring no inflow and permanently dry tunnels. This method
has not yet been sufficiently tested, while (pre-) grouting of rock masses has a much
longer track record, in a variety of contexts. Post-grouting in a ‘completed’ tunnel is
famously difficult: a well known Norwegian experience should remind of this.
21.22
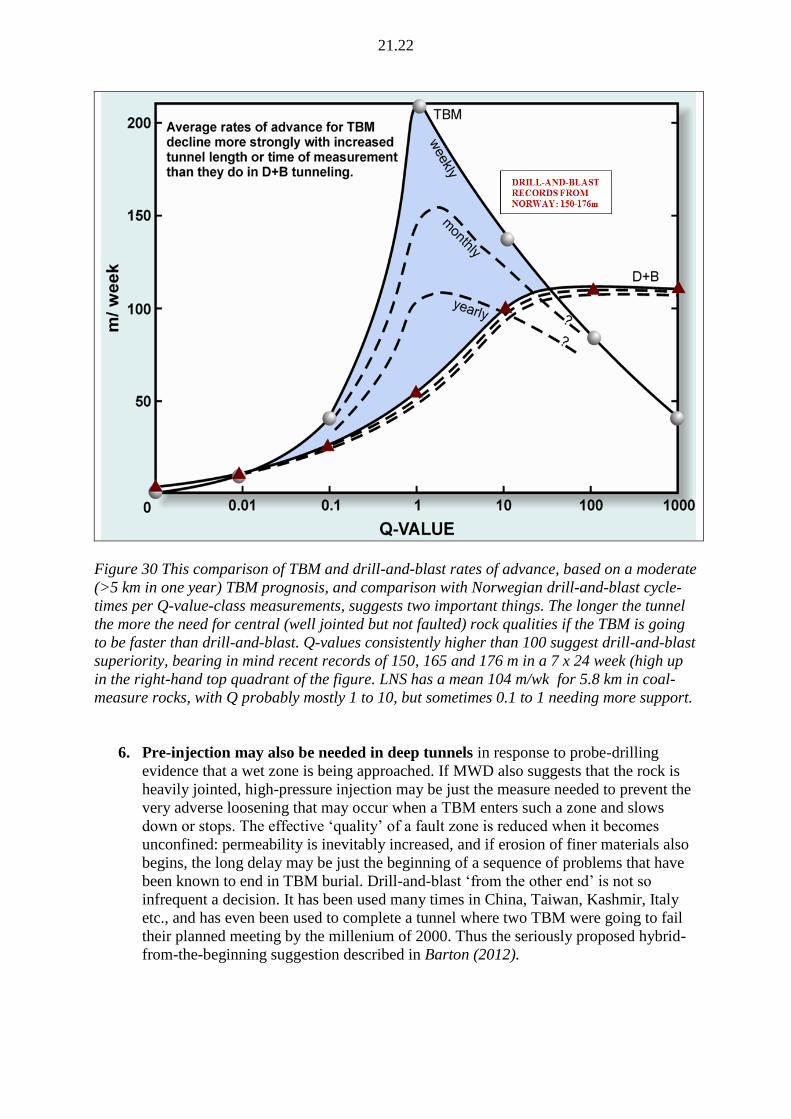
Figure 30 This comparison of TBM and drill-and-blast rates of advance, based on a moderate
(>5 km in one year) TBM prognosis, and comparison with Norwegian drill-and-blast cycle-
times per Q-value-class measurements, suggests two important things. The longer the tunnel
the more the need for central (well jointed but not faulted) rock qualities if the TBM is going
to be faster than drill-and-blast. Q-values consistently higher than 100 suggest drill-and-blast
superiority, bearing in mind recent records of 150, 165 and 176 m in a 7 x 24 week (high up
in the right-hand top quadrant of the figure. LNS has a mean 104 m/wk for 5.8 km in coal-
measure rocks, with Q probably mostly 1 to 10, but sometimes 0.1 to 1 needing more support.
6. Pre-injection may also be needed in deep tunnels in response to probe-drilling
evidence that a wet zone is being approached. If MWD also suggests that the rock is
heavily jointed, high-pressure injection may be just the measure needed to prevent the
very adverse loosening that may occur when a TBM enters such a zone and slows
down or stops. The effective ‘quality’ of a fault zone is reduced when it becomes
unconfined: permeability is inevitably increased, and if erosion of finer materials also
begins, the long delay may be just the beginning of a sequence of problems that have
been known to end in TBM burial. Drill-and-blast ‘from the other end’ is not so
infrequent a decision. It has been used many times in China, Taiwan, Kashmir, Italy
etc., and has even been used to complete a tunnel where two TBM were going to fail
their planned meeting by the millenium of 2000. Thus the seriously proposed hybrid-
from-the-beginning suggestion described in Barton (2012).
21.23
CONCLUSIONS
1. It is misleading to quote a single utilization % for a given TBM project, and worse still
to not specify a time interval. It is also misleading to assume that a given tunnel can be
driven at an average e.g. 400 m/month. The correct way to specify likely TBM
progress is with a time-dependent utilization which in reality is a deceleration
gradient, where the final point on the line (log AR, log T) gives the overall AR in
m/hr. The advance rate is not a constant in time, as can be seen in Table 2.
2. For example a world record of 16km in one year would have an overall mean AR ≈
2m/hr. Table 2 on the next page shows what would be more normal for TBM, for
instance 8 km in one year with overall mean AR ≈ 1.0 m/hr, or 4 km in one year with
overall mean AR ≈ 0.5 m/hr. This does not mean that AR = 0.5 m/hr for a one-month
period of measurement: it would be significantly higher than 0.5 m/hr.
3. The LNS drill-and-blast record for Svea Tunnel (5.8 km in 54 weeks) lies between the
last two TBM examples, with overall mean AR = 0.64 m/hr. Drill-and-blast has an
essentially horizontal (non-decelerating) log AR – log T trend, if one ignores the
‘instantaneous’ PR during each blast. As the tunnel gets longer, more lorries are used,
and there are more kilometers of muck transport. There are no cutters to change every
24 hours, nor cutter-face armour to be replaced each 5 km when driving in hard
abrasive rock. Repairs to key equipment can be done more quickly outside the tunnel.
There is also equipment on stand-by: a virtual impossibility with TBM. This means
less risk.
4. For an owner, who waits for a completed tunnel, it is not so interesting that a TBM has
best days of 50 or 60 m, or best weeks of 400 to 500 m, or that a drill-and-blast
contractor produces 80 m of tunnel in two shifts totaling 120 hours. Total time T is
what actually counts before cars or trains (or water or sewage) can start their
respective journeys through the completed tunnels.
5. The lines of deceleration for three of the TBM performance categories shown in
earlier figures were initially derived from hard rock cases from Norway and the USA,
and were presented by Barton (1996). Penetration rates can be consistently as low as 2
m/hr, if the rock mass has too high quality, such as Q >100. The 145 cases from
approx.1000 km of mostly open-gripper case records which were analysed later by
Barton (2000) (see Figures 2 and 3) largely confirmed the trends shown in this (1996)
Table 2. Note that 8640 hours in a ‘7/24’ year assumes 360 days, the usual maximum.
6. The final tunnel progress will be a composite affair, with various typical PR through
different rock mass domains, and various typical but time-dependent utilizations,
which in practice means various (-) m and various AR through the different domains.
The QTBM prognosis method is designed to capture these potential differences, and
combine them by means of length-dependent and/or time-dependent weighted mean
estimation.
7. Pre-injection following ‘discovery’ of its need by probe-drilling, is especially
important for TBM, but has been much neglected because of the temptation to go fast
or to try to maintain unrealistic ‘constant’ average monthly productions. TBM are ‘in
21.24
the way’ when it comes to fault zones, unless they are equipped to be able to act like a drill
jumbo when this is urgently needed. There are encouraging signs that this is now occurring.
(Wallis, 2012).
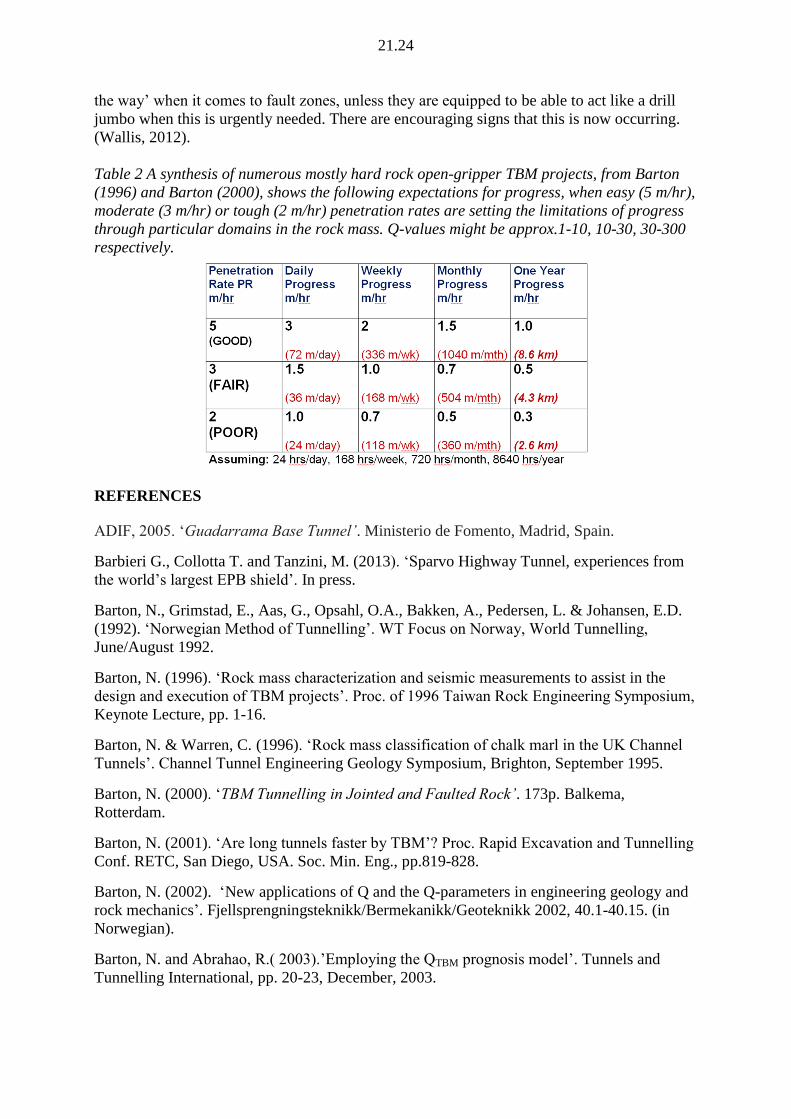
Table 2 A synthesis of numerous mostly hard rock open-gripper TBM projects, from Barton
(1996) and Barton (2000), shows the following expectations for progress, when easy (5 m/hr),
moderate (3 m/hr) or tough (2 m/hr) penetration rates are setting the limitations of progress
through particular domains in the rock mass. Q-values might be approx.1-10, 10-30, 30-300
respectively.
REFERENCES
ADIF, 2005. ‘Guadarrama Base Tunnel’. Ministerio de Fomento, Madrid, Spain.
Barbieri G., Collotta T. and Tanzini, M. (2013). ‘Sparvo Highway Tunnel, experiences from
the world’s largest EPB shield’. In press.
Barton, N., Grimstad, E., Aas, G., Opsahl, O.A., Bakken, A., Pedersen, L. & Johansen, E.D.
(1992). ‘Norwegian Method of Tunnelling’. WT Focus on Norway, World Tunnelling,
June/August 1992.
Barton, N. (1996). ‘Rock mass characterization and seismic measurements to assist in the
design and execution of TBM projects’. Proc. of 1996 Taiwan Rock Engineering Symposium,
Keynote Lecture, pp. 1-16.
Barton, N. & Warren, C. (1996). ‘Rock mass classification of chalk marl in the UK Channel
Tunnels’. Channel Tunnel Engineering Geology Symposium, Brighton, September 1995.
Barton, N. (2000). ‘TBM Tunnelling in Jointed and Faulted Rock’. 173p. Balkema,
Rotterdam.
Barton, N. (2001). ‘Are long tunnels faster by TBM’? Proc. Rapid Excavation and Tunnelling
Conf. RETC, San Diego, USA. Soc. Min. Eng., pp.819-828.
Barton, N. (2002). ‘New applications of Q and the Q-parameters in engineering geology and
rock mechanics’. Fjellsprengningsteknikk/Bermekanikk/Geoteknikk 2002, 40.1-40.15. (in
Norwegian).
Barton, N. and Abrahao, R.( 2003).’Employing the QTBM prognosis model’. Tunnels and
Tunnelling International, pp. 20-23, December, 2003.

21.25
Barton, N. (2005). Comments on ’A critique of QTBM’ by Blindheim. Tunnels and Tunnelling
International, pp.16-19.
Barton, N. & B. Gammelsæter, (2010). ‘Application of the Q-system and QTBM prognosis to
predict TBM tunnelling potential for the planned Oslo-Ski rail tunnels’. Nordic Rock
Mechanics Conf., Kongsberg, Norway, pp.56-65.
Barton, N. (2011/2012). ‘Assessing Pre-Injection in Tunnelling’. Tunnelling Journal,
Dec.2011/Jan. 2012, pp. 44-50.
Barton, N. (2012). ‘Reducing risk in long deep tunnels by using TBM and drill-and-blast
methods in the same project – the hybrid solution’. Keynote lecture. Risk in Underground
Construction. J. Rock Mech. and Geotech. Eng., 4(2): pp.115-126, CSRME, Wuhan. Chinese
Academy of Engineering.
Barton, N. (2012). ‘Hybrid TBM and Drill-and-Blast from the start’. Tunnelling Journal, Dec.
2012, pp.22-32.
Blindheim, O.T. (2005). ‘A critique of QTBM’. Tunnels and Tunnelling International. June, pp.
32-35.
Entacher, M., G.Winter and R.Galler (2013). ‘Cutter force measurement on tunnel boring
machines – Implementation at Koralm tunnel’. Journal of Tunnelling and Underground Space
Techology. 38, pp. 487-496.
Grandori,R., M.Jaeger, F.Antonini & L.Vigl, (1995). ‘Evinos-Mornos Tunnel - Greece.
Construction of a 30 km long hydraulic tunnel in less than three years under the most adverse
geological conditions’. Proc. RETC. San Francisco, pp.747-767.
Innaurato, N., Mancini, R., Rodena, E. & Zaninetti, A. (1991). ‘Forecasting and effective
TBM performances in a rapid excavation of a tunnel in Italy’. Proc. 7th
ISRM congress,
Aachen. Wittke (ed.) 2: 1009-1014. Rotterdam: Balkema.
McKelvey, J.G., E. A. Schultz, T. A. B. Helin, & O. T. Blindheim, (1996). ‘Geotechnical
analysis in S. Africa’. World Tunnelling, November 1996, pp.377-390.
Nelson, P., T D O'Rourke, & F H Kulhawy, (1983). ‘Factors affecting TBM penetration rates
in sedimentary rocks’. 24th
US symposium on rock mechanics, Texas A&M Univ.
NTH, (1994). ‘Full face tunnel boring’. [In Norwegian: ‘Fullprofilboring av tunneler’.]
Prosjektrapport, anleggsdrift 1-94. Trondheim: NTH.
Shen, C.P., Tsai, H.C., Hsieh, Y.S. & Chu, B. (1999). ‘The methodology through adverse
geology ahead of Pinglin large TBM’. Proc. RETC. Orlando, FL. Hilton & Samuelson (eds).
Ch.8: pp. 117-137.Littleton, CO: Soc. for Mining, Metallurgy, and Exploration, Inc.
Sundaram, N.M. and Rafek, A.G. (1998). ‘The influence of rock mass properties in the
assessment of TBM performance’. Proc. 8th
IAEG congress, Vancouver. Moore & Hungr
(eds). pp.3553-3559. Rotterdam: Balkema.
Willis, D. (2012). ‘TBM probe drilling and pre-grouting – FIVE THINGS TO KNOW’.
Tunnelling Journal, July 2012, pp. 43-45.