tcl communications 2016 q1 results ppt eng
TRANSCRIPT

TCL COMMUNICATION TECHNOLOGY HOLDINGS LIMITED (2618.HK)
Q1 2016 Results Presentation Hong Kong · 20 April 2016

2
BUSINESS REVIEW & OUTLOOK
FINANCIAL HIGHLIGHTS
Q & A
AGENDA

FINANCIAL HIGHLIGHTS

4 FINANCIAL HIGHLIGHTS
Total Sales Vol.
(’000 units)
Incl. Sales Vol. of Smart Devices (’000 units)
Total ASP (US$)
Revenue
Gross Profit Margin (%)
Net Profit
Net Profit Margin (%)
Basic EPS (HK Cents)
Income Statement
(HK$ Million)
Q1 2016 Q1 2015 Change (%)
17,141 15,780 +9%
8,812 9,707 -9%
41.8 54.7 -24%
5,554 6,690 -17%
19.4% 19.1% +0.3%
9 185 -95%
0.2% 2.8% -2.6%
1.12 15.11 -93%

5
1.2
2.5 3.4
5.2 4.3
5.4
6.8
9.6
6.0 5.9 6.2 7.3
4.7 1.2
1.5
2.1
2.3
1.2
1.3
1.0
1.1
0.7 0.6 0.9
1.0
0.9
2.4
4.0
5.5
7.5
5.5
6.7
7.8
10.7
6.7 6.5 7.1
8.3
5.6
0
2
4
6
8
10
12
Q12013
Q22013
Q32013
Q42013
Q12014
Q22014
Q32014
Q42014
Q12015
Q22015
Q32015
Q42015
Q12016
Smart Devices Feature Phones and Other Products
Revenue (HK$ Billion)
QUARTERLY REVENUE OF HANDSETS & OTHER PRODUCTS

6
63
289
513
1,099
718
986
1,339 1,315
990
0
350
700
1,050
1,400
Q12014
Q22014
Q32014
Q42014
Q12015
Q22015
Q32015
Q42015
Q12016
QUARTERLY SALE VOLUME OF TABLETS CONTINUOUS AND STEADY VOLUME GROWTH
Volume (‘000 unit)

7 SMARTPHONE SALES VOLUME PROPORTION & ASP REFINED PRODUCT PORTFOLIO STRATEGY
37.0
41.8
45.4
50.2 52.2 52.4 53.4
55.1 54.7
47.1
42.0 43.3 41.8
17%
27%
34%
40%
46% 53%
58% 62% 62%
56% 53%
55% 51%
0%
10%
20%
30%
40%
50%
60%
70%
80%
90%
100%
0
10
20
30
40
50
60
70
Q12013
Q22013
Q32013
Q42013
Q12014
Q22014
Q32014
Q42014
Q12015
Q22015
Q32015
Q42015
Q12016
ASP (US$) Smart Devices Proportion
Smart Devices Proportion (%)
ASP (US$)

8 GROSS MARGIN TREND SUSTAINABLE HEALTHY RANGE
17.4% 19.0% 19.3% 19.1% 19.5%
21.8% 23.4%
19.4%
0.0%
10.0%
20.0%
30.0%
2012 2013 2014Q1
2015Q2
2015Q3
2015Q4
2015Q1
2016
Product Competitiveness
Economies of Scale
Pricing and Currency Strategy
Brand Value and Customer
Relationship
Continuous Cost-Down Effort
GP Margin (%)
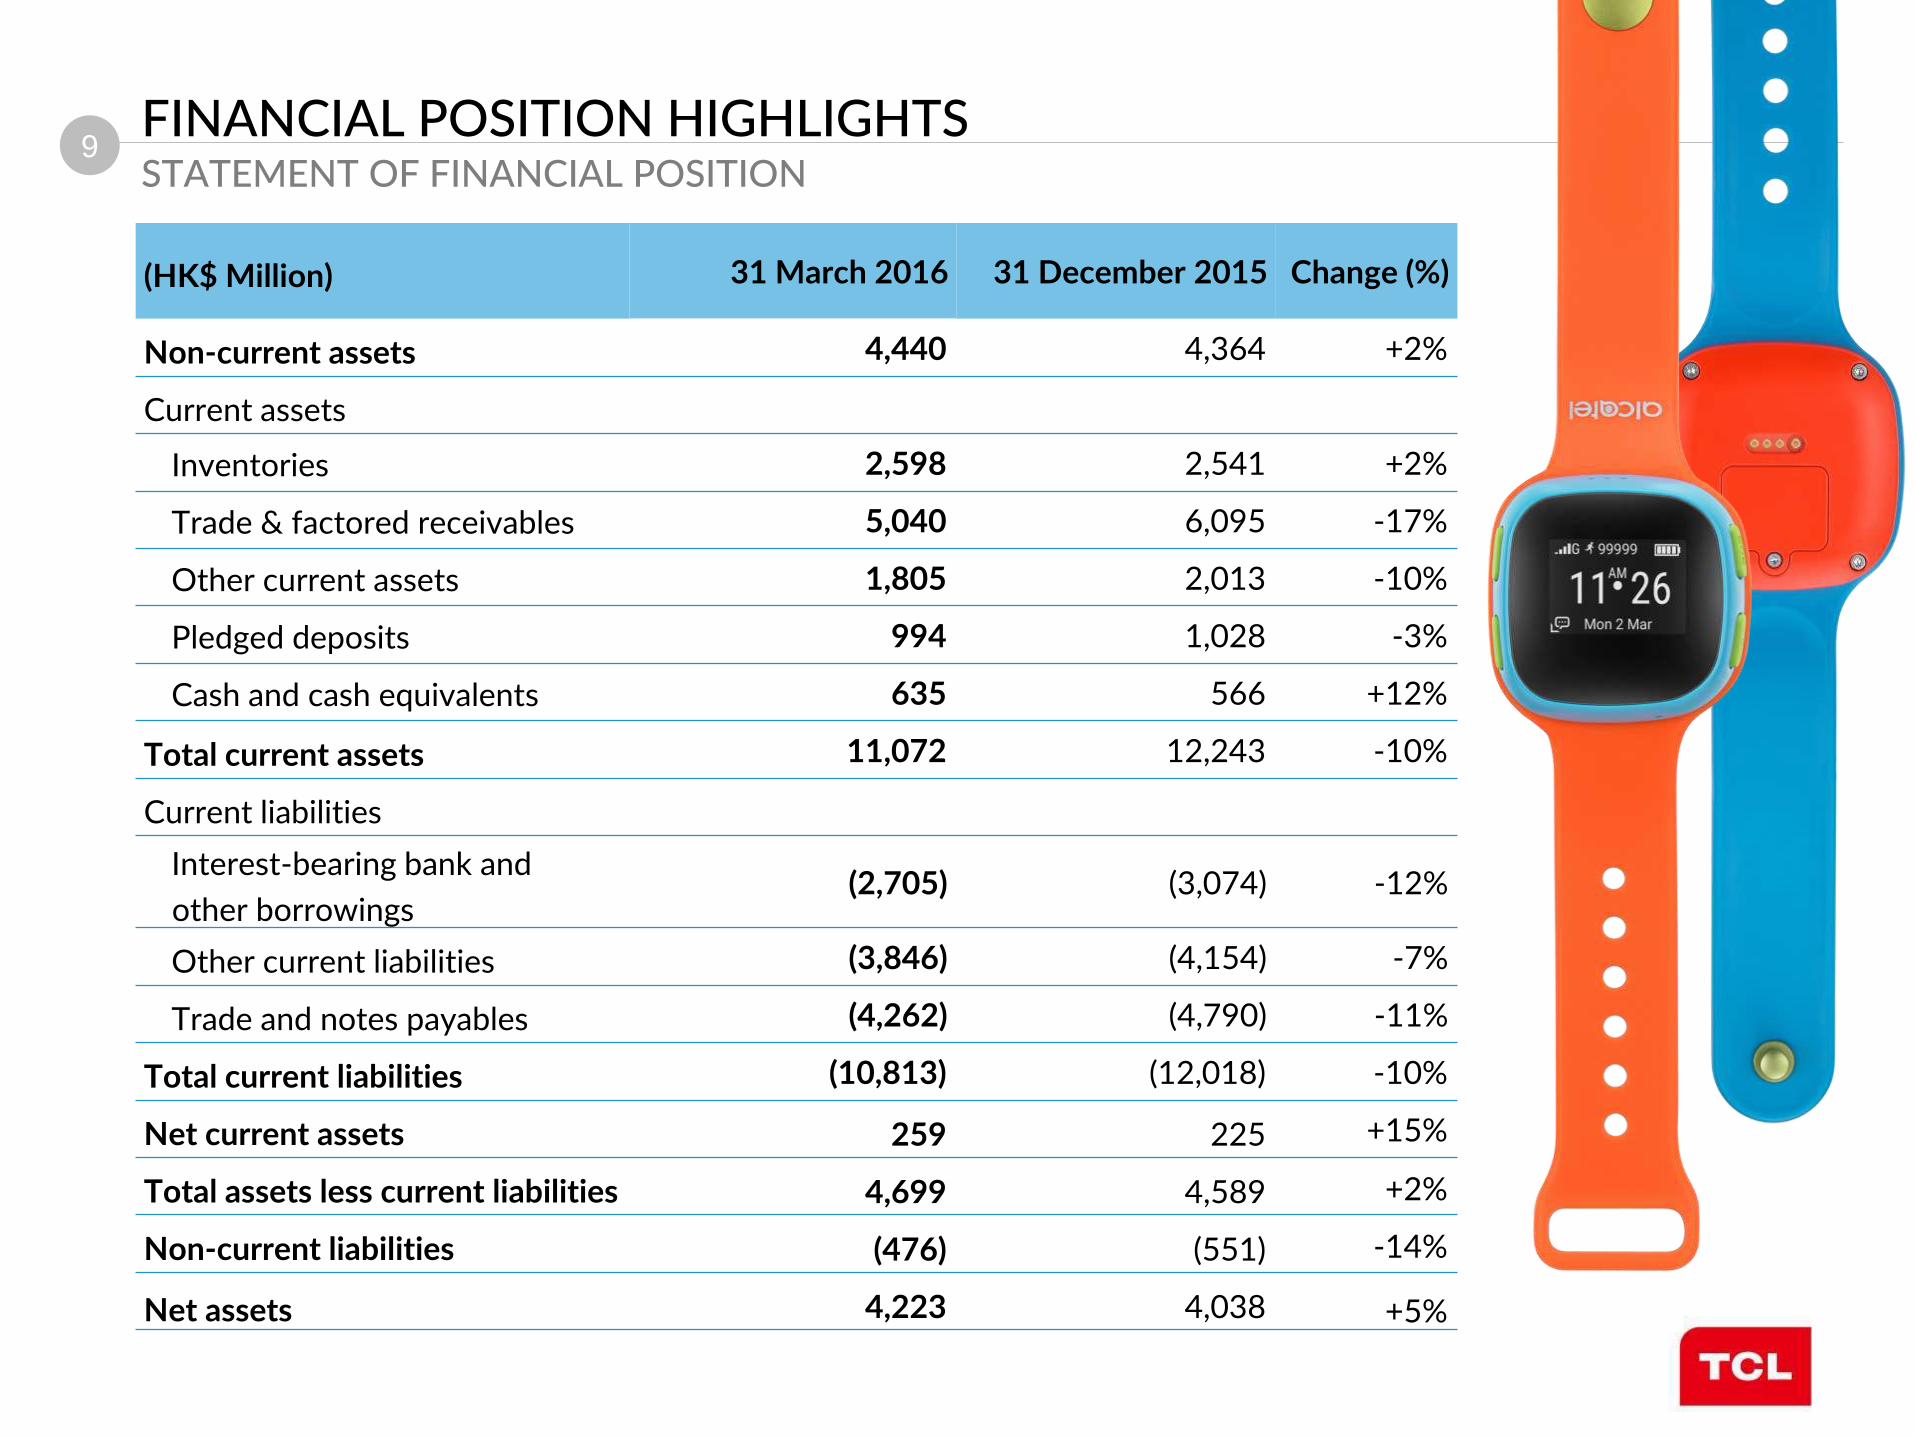
9 FINANCIAL POSITION HIGHLIGHTS STATEMENT OF FINANCIAL POSITION
(HK$ Million) 31 March 2016 31 December 2015 Change (%)
Non-current assets 4,440 4,364 +2%
Current assets
Inventories 2,598 2,541 +2%
Trade & factored receivables 5,040 6,095 -17%
Other current assets 1,805 2,013 -10%
Pledged deposits 994 1,028 -3%
Cash and cash equivalents 635 566 +12%
Total current assets 11,072 12,243 -10%
Current liabilities
Interest-bearing bank and
other borrowings (2,705) (3,074) -12%
Other current liabilities (3,846) (4,154) -7%
Trade and notes payables (4,262) (4,790) -11%
Total current liabilities (10,813) (12,018) -10%
Net current assets 259 225 +15%
Total assets less current liabilities 4,699 4,589 +2%
Non-current liabilities (476) (551) -14%
Net assets 4,223 4,038 +5%

10 KEY FINANCIAL RATIOS
31 March 2016 31 December 2015
Gearing Ratio 19% 20%
Current Ratio 1.02 1.02
Trade Receivables Turnover Days* 84 89
Inventories Turnover Days ** 26 26
NAV Per Share HK$ 3.27 HK$ 3.16
* Excluding factored trade receivables
** Only inventories in factory

BUSINESS REVIEW & OUTLOOK

12 Q1 2016 OVERVIEW
RESULTS
BUSINESS OVERVIEW
• Sales Volume: 17.1 million units, up 9% YoY (including 8.8 million units of smart devices, down 9% YoY) Ranked No.5 of the Global Top 10 Handset Brand (Source: 2015 FY Gartner and Company Data)
• Revenue: HK$ 5.6 billion, down 17% YoY
• Net Profit: HK$ 9 million, down 95% YoY
• Basic EPS: Decreased to 1.12 HK cents from 15.11 HK cents
• Healthy gross margin: Implemented a more stringent approach in controlling risks and focused on business with high profitability. Gross margin remained at a healthy level of over 19%.
• Continuous growth in tablet sales volume:
Quarterly tablet sales volume has increased steadily over the past 2 years. In Q1 2016, tablet sales volume increased 38% YoY to 1.0 million units.
• Sustainable growth in internet applications and service business:
In Q1 2016, the cumulative number of activated users of mobile Internet application platforms increased almost 2 times YoY to 29.4 million; while the settlement amount of third party payment increased for more than 2 times YoY to HK$2.4 billion.
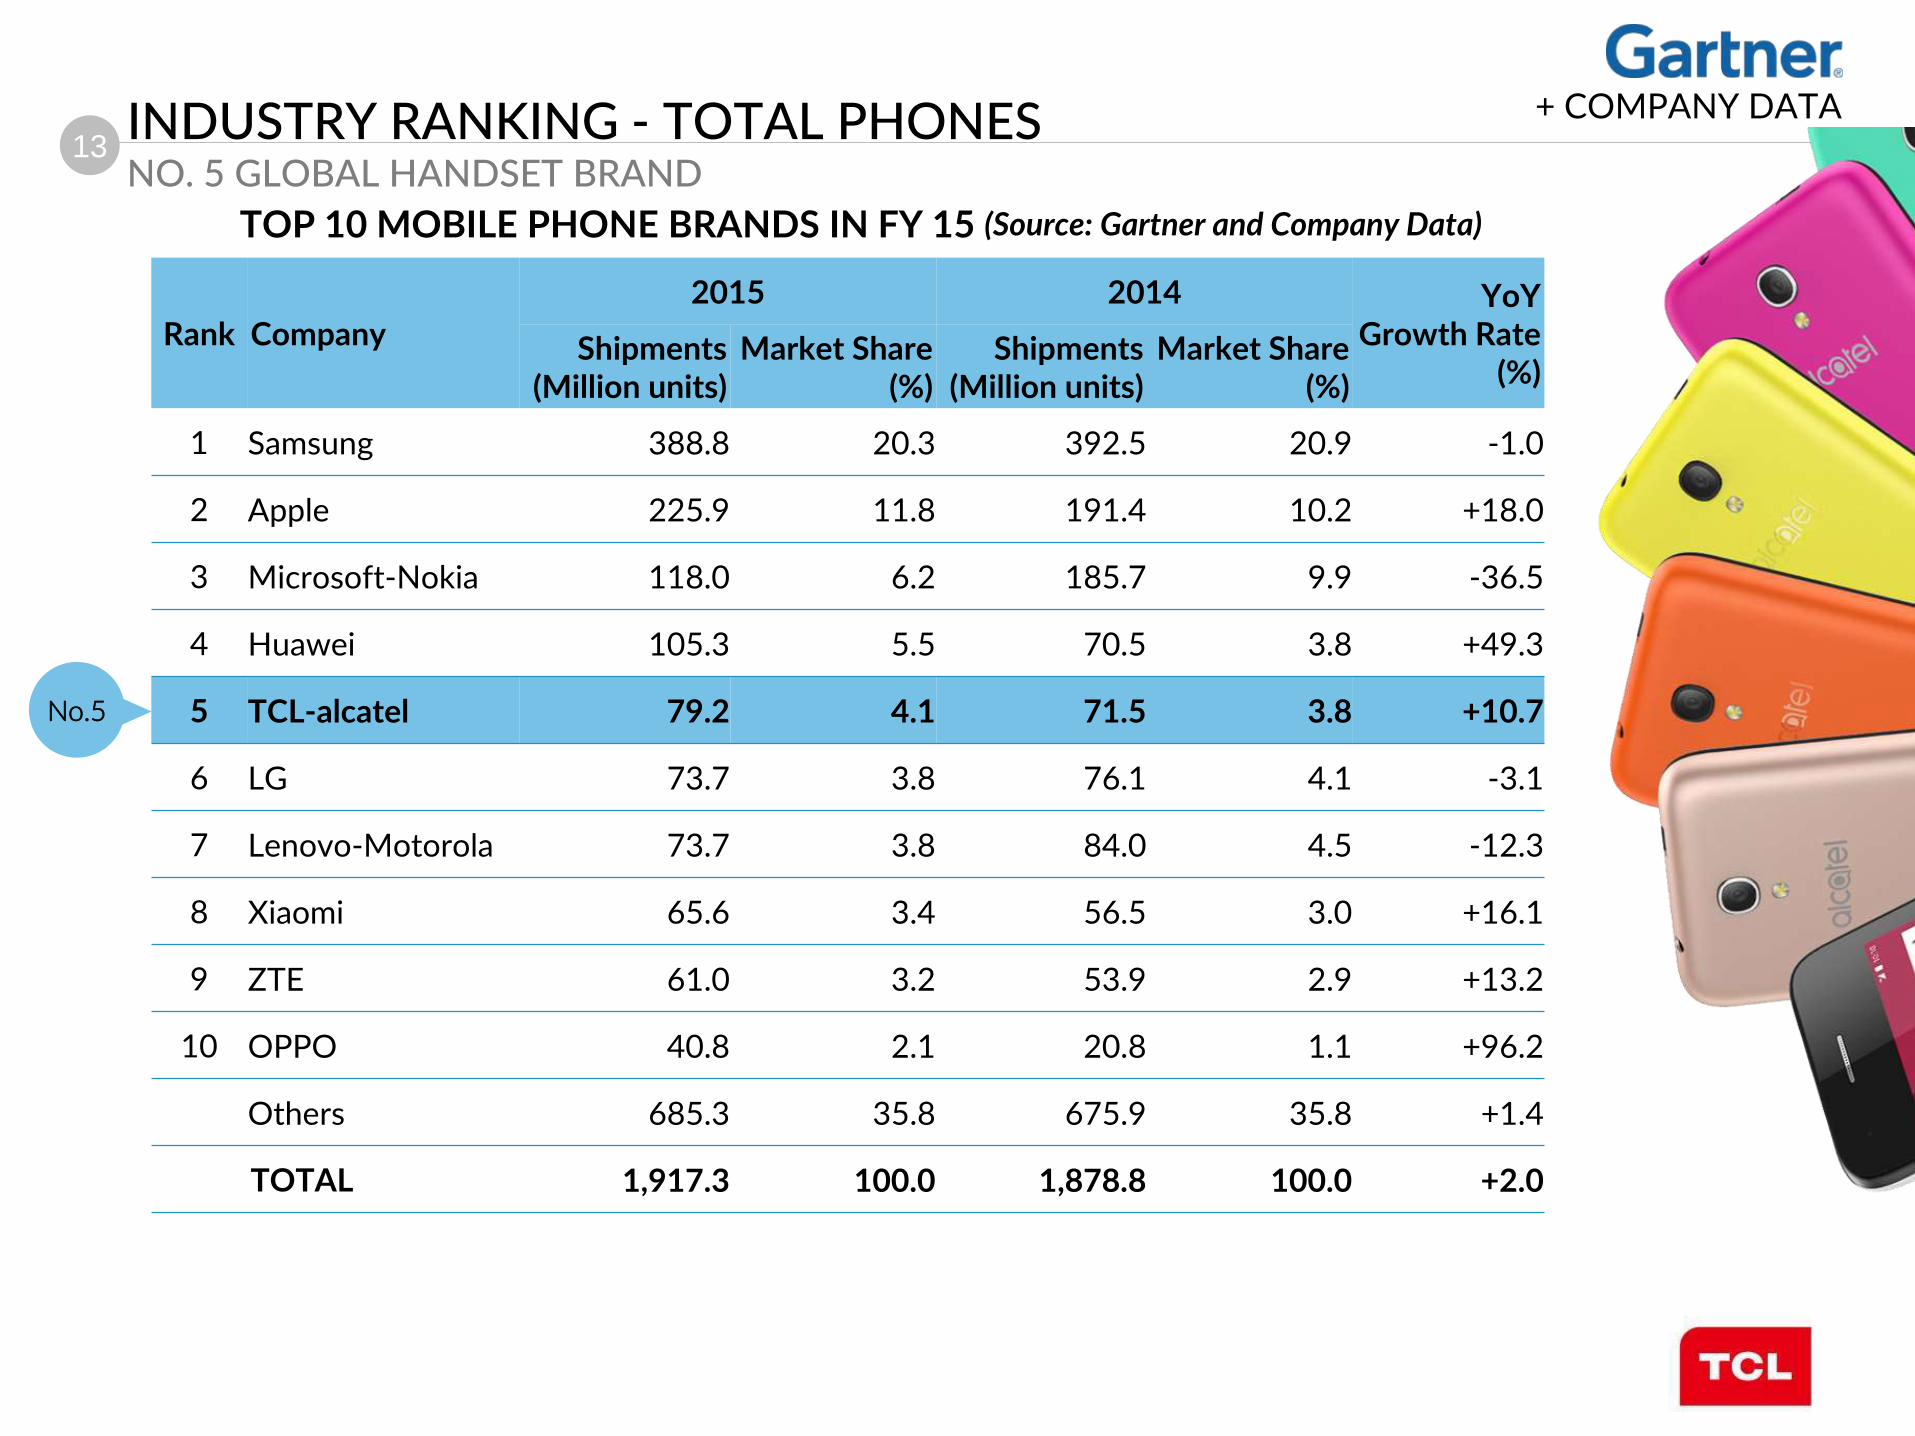
13 INDUSTRY RANKING - TOTAL PHONES NO. 5 GLOBAL HANDSET BRAND
+ COMPANY DATA
Rank Company
2015 2014 YoY Growth Rate
(%) Shipments
(Million units) Market Share
(%) Shipments
(Million units) Market Share
(%)
1 Samsung 388.8 20.3 392.5 20.9 -1.0
2 Apple 225.9 11.8 191.4 10.2 +18.0
3 Microsoft-Nokia 118.0 6.2 185.7 9.9 -36.5
4 Huawei 105.3 5.5 70.5 3.8 +49.3
5 TCL-alcatel 79.2 4.1 71.5 3.8 +10.7
6 LG 73.7 3.8 76.1 4.1 -3.1
7 Lenovo-Motorola 73.7 3.8 84.0 4.5 -12.3
8 Xiaomi 65.6 3.4 56.5 3.0 +16.1
9 ZTE 61.0 3.2 53.9 2.9 +13.2
10 OPPO 40.8 2.1 20.8 1.1 +96.2
Others 685.3 35.8 675.9 35.8 +1.4
TOTAL 1,917.3 100.0 1,878.8 100.0 +2.0
TOP 10 MOBILE PHONE BRANDS IN FY 15 (Source: Gartner and Company Data)
No.5
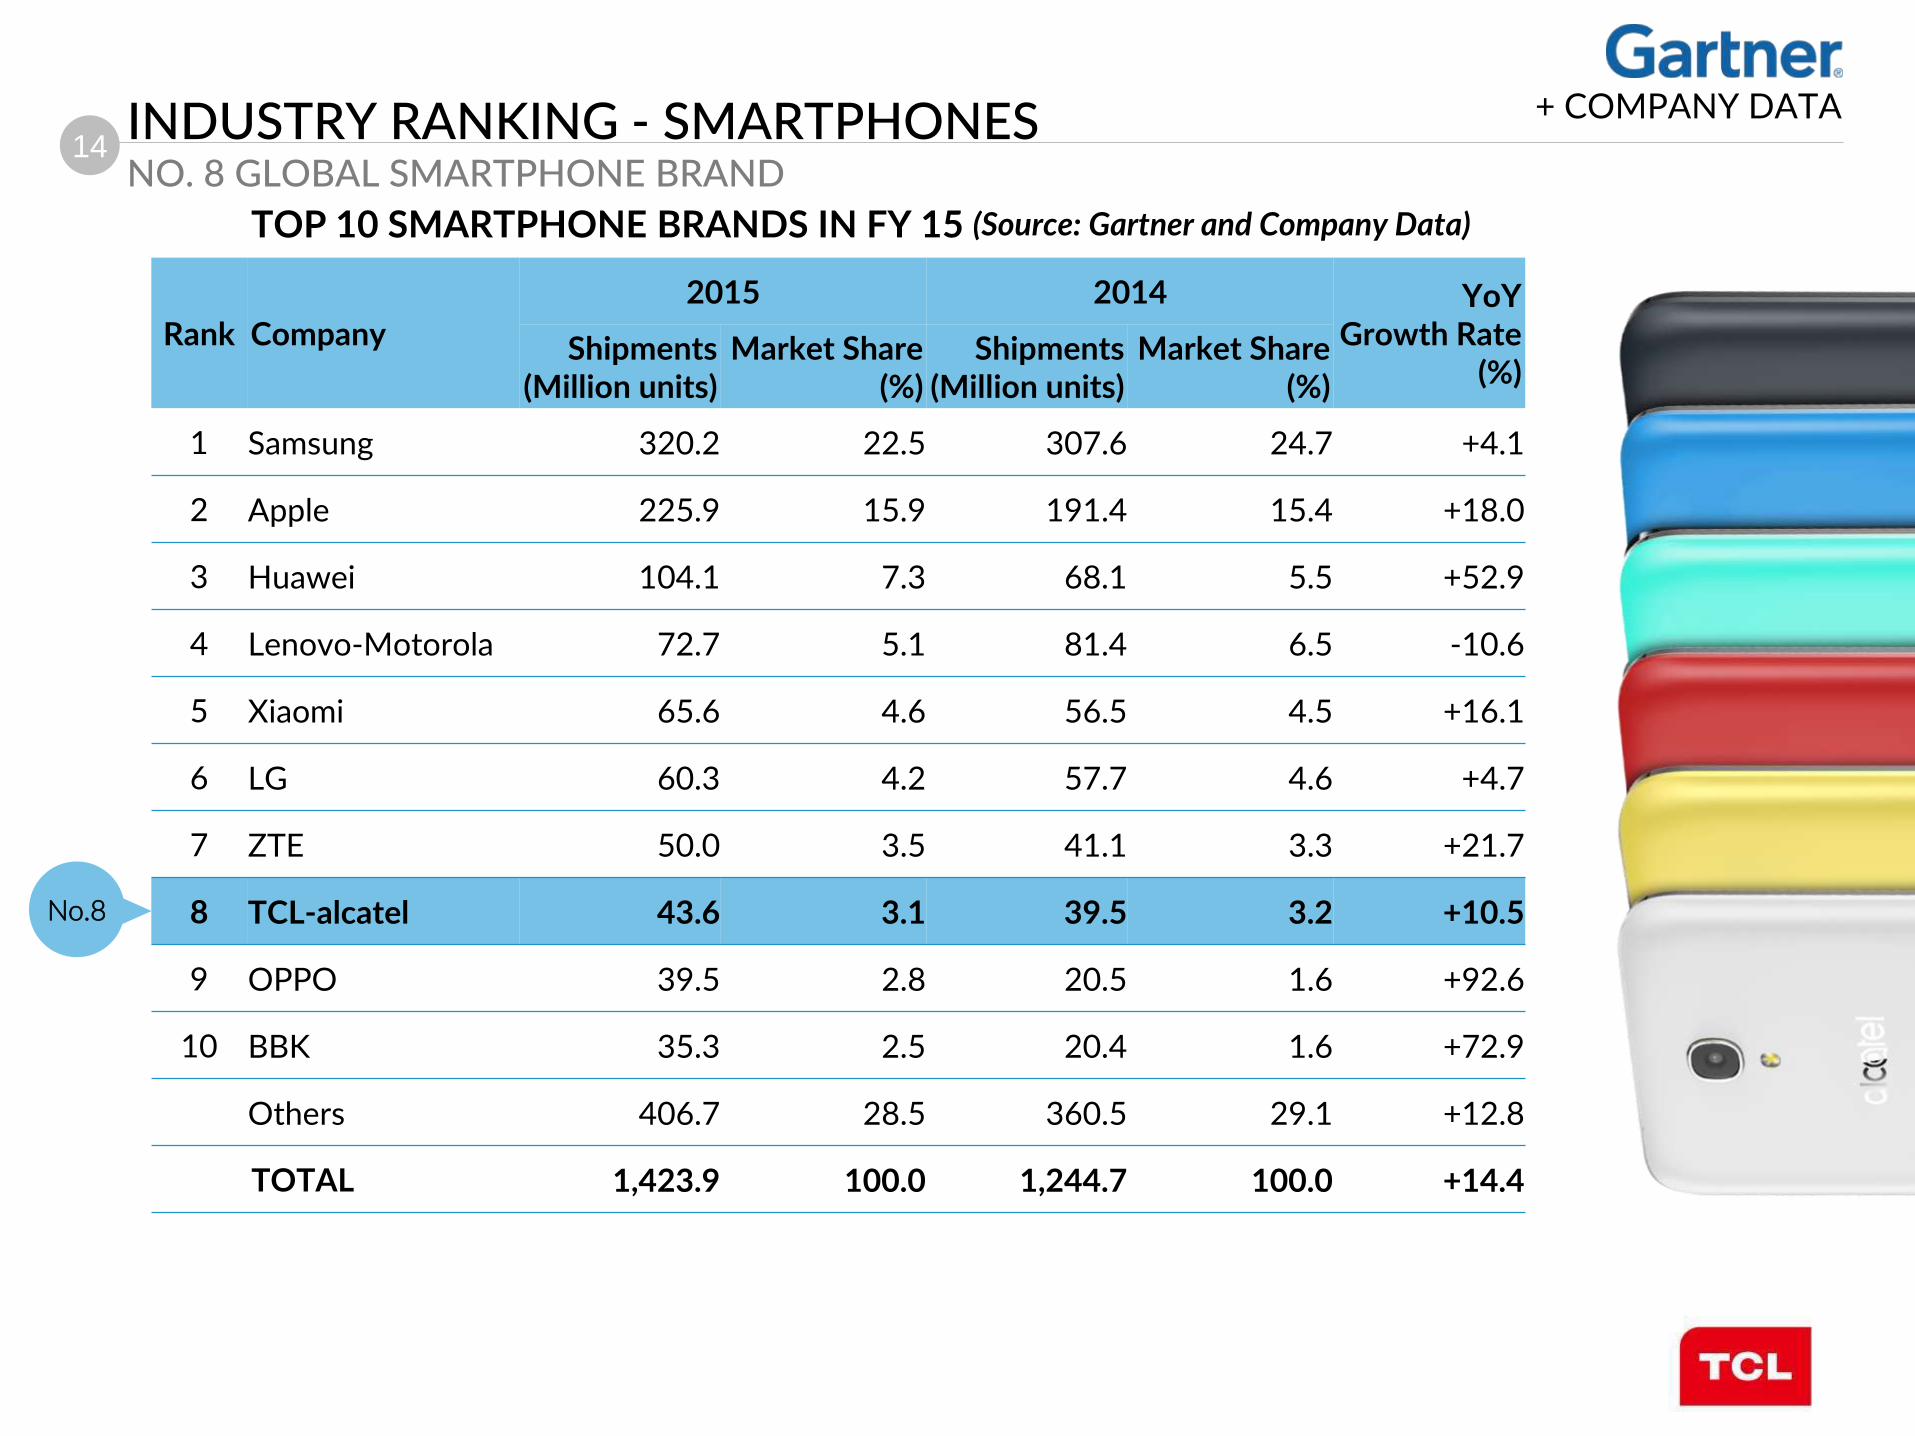
14 INDUSTRY RANKING - SMARTPHONES NO. 8 GLOBAL SMARTPHONE BRAND
+ COMPANY DATA
Rank Company
2015 2014 YoY Growth Rate
(%) Shipments
(Million units) Market Share
(%) Shipments
(Million units) Market Share
(%)
1 Samsung 320.2 22.5 307.6 24.7 +4.1
2 Apple 225.9 15.9 191.4 15.4 +18.0
3 Huawei 104.1 7.3 68.1 5.5 +52.9
4 Lenovo-Motorola 72.7 5.1 81.4 6.5 -10.6
5 Xiaomi 65.6 4.6 56.5 4.5 +16.1
6 LG 60.3 4.2 57.7 4.6 +4.7
7 ZTE 50.0 3.5 41.1 3.3 +21.7
8 TCL-alcatel 43.6 3.1 39.5 3.2 +10.5
9 OPPO 39.5 2.8 20.5 1.6 +92.6
10 BBK 35.3 2.5 20.4 1.6 +72.9
Others 406.7 28.5 360.5 29.1 +12.8
TOTAL 1,423.9 100.0 1,244.7 100.0 +14.4
TOP 10 SMARTPHONE BRANDS IN FY 15 (Source: Gartner and Company Data)
No.8

15 INDUSTRY RANKING - TABLETS NO. 7 GLOBAL TABLET BRAND
+ COMPANY DATA
Rank Company
2015 2014 YoY Growth Rate
(%) Shipments
(Million units) Market Share
(%) Shipments
(Million units) Market Share
(%)
1 Apple 50.6 25.9 64.4 28.6 -21.4
2 Samsung 30.7 15.7 37.1 16.5 -17.2
3 Lenovo 11.0 5.6 11.2 5.0 -2.2
4 Huawei 6.9 3.5 3.0 1.3 +130.1
5 Asus 6.1 3.1 10.1 4.5 -39.6
6 Amazon 4.6 2.4 5.2 2.3 -11.5
7 TCL-alcatel 4.4 2.2 2.0 0.9 +122.0
8 LG 4.2 2.1 2.6 1.2 +60.7
9 Microsoft 3.4 1.8 2.3 1.0 +46.3
10 Acer 2.6 1.3 4.5 2.0 -43.0
Others 70.6 36.4 82.8 36.7 -17.1
TOTAL 195.1 100.0 225.2 100.0 -13.4
TOP 10 TABLET BRANDS IN FY 15 (Source: Gartner and Company Data)
No.7

16 Q1 2016 GEOGRAPHICAL REVENUE BREAKDOWN
NORTH AMERICA
29%
LATIN AMERICA
16%
EUROPE 39%
MEA 6%
APAC 4%
CHINA 6%
FEATURE PHONES & OTHER PRODUCTS SMART DEVICES
NORTH AMERICA
34%
LATIN AMERICA
26%
EUROPE 23%
MEA 8%
APAC 4%
CHINA 5%

17
2.11
1.36
0.0
1.0
2.0
3.0
Q12015
Q12016
1.76 1.84
0.0
1.0
2.0
3.0
Q12015
Q12016
+4%
-36%
NORTH AMERICA • Sales volume: 3.9 million units, up 13% YoY;
Revenue: HK$1.84 billion, up 4% YoY
• Sales volume of smart devices: 2.2 million units, up 14% YoY
• Q4 2015 sales volume ranking (Source: Gartner & Company data):
North America: No. 5 (Total phones); No. 6 (Smartphones)
• Expanded tablet sales through major operator channels, recording
continuous growth
• Q2 business plan: Solidify operator channels and widen open market
channels, increase sales of 4G products
LATIN AMERICA • Sales volume: 4.7 million units, down 13% YoY;
Revenue: HK$1.36 billion, down 36% YoY
• Sales volume of smart devices: 2.5 million units, down 25% YoY
• Q4 2015 sales volume ranking (Source: Gartner & Company data):
Latin America: No. 2 (Total phones); No. 3 (Smartphones); No. 4 (Tablets)
Mexico: No. 2 (Total phones); No. 3 (Smartphones); No. 4 (Tablets)
Chile: No. 2 (Total phones); No. 5 (Smartphones); No. 1 (Tablets)
• Implemented stringent controls on currency and credit risks, maintained
a leading position in entry-level smartphone market
• Q2 business plan: Continue to monitor currency risk exposure, enrich
product mix to increase product competitiveness
Revenue (HK$ Billion)
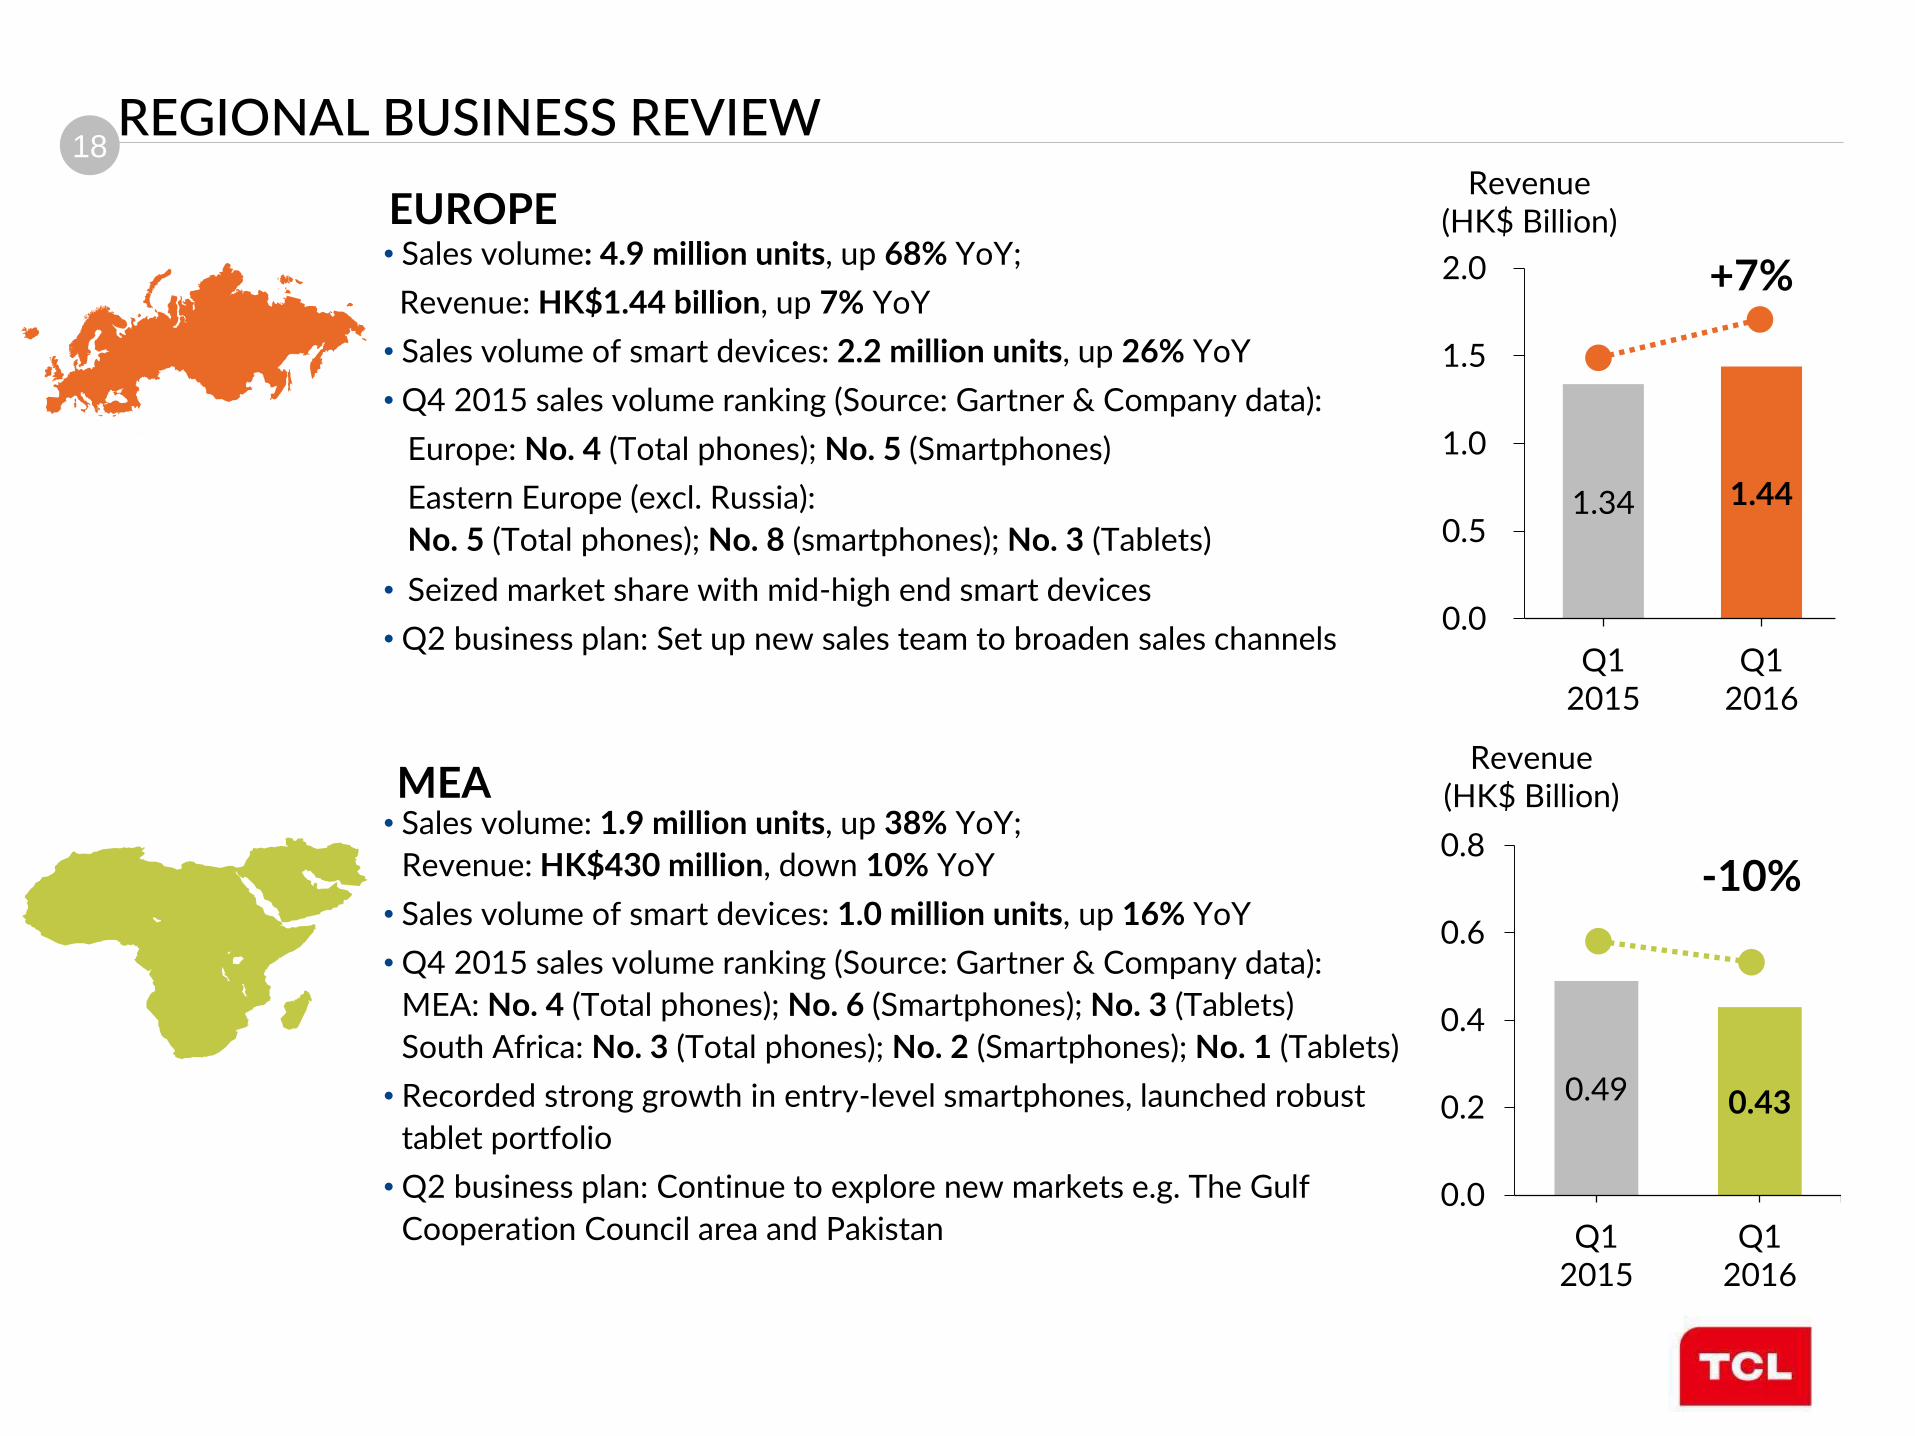
REGIONAL BUSINESS REVIEW Revenue
(HK$ Billion)
18
1.34 1.44
0.0
0.5
1.0
1.5
2.0
Q12015
Q12016
0.49 0.43
0.0
0.2
0.4
0.6
0.8
Q12015
Q12016
REGIONAL BUSINESS REVIEW
EUROPE
MEA
+7%
-10%
• Sales volume: 4.9 million units, up 68% YoY;
Revenue: HK$1.44 billion, up 7% YoY
• Sales volume of smart devices: 2.2 million units, up 26% YoY
• Q4 2015 sales volume ranking (Source: Gartner & Company data):
Europe: No. 4 (Total phones); No. 5 (Smartphones)
Eastern Europe (excl. Russia):
No. 5 (Total phones); No. 8 (smartphones); No. 3 (Tablets)
• Seized market share with mid-high end smart devices
• Q2 business plan: Set up new sales team to broaden sales channels
Revenue (HK$ Billion)
Revenue (HK$ Billion)
• Sales volume: 1.9 million units, up 38% YoY;
Revenue: HK$430 million, down 10% YoY
• Sales volume of smart devices: 1.0 million units, up 16% YoY
• Q4 2015 sales volume ranking (Source: Gartner & Company data):
MEA: No. 4 (Total phones); No. 6 (Smartphones); No. 3 (Tablets)
South Africa: No. 3 (Total phones); No. 2 (Smartphones); No. 1 (Tablets)
• Recorded strong growth in entry-level smartphones, launched robust
tablet portfolio
• Q2 business plan: Continue to explore new markets e.g. The Gulf
Cooperation Council area and Pakistan

19
0.84
0.25 0.0
0.5
1.0
1.5
Q12015
Q12016
0.15 0.23
0.0
0.1
0.2
0.3
0.4
Q12015
Q12016
REGIONAL BUSINESS REVIEW
APAC
CHINA
+58%
-70%
Revenue (HK$ Billion)
Revenue (HK$ Billion)
• Sales volume: 0.7 million units, up 132% YoY;
Revenue: HK$230 million, up 58% YoY
• Sales volume of smart devices: 0.4 million units, up 90% YoY
• Streamlined local operation, reinforced strategic collaboration with
operators
• Q2 business plan: Implement stringent controls on currency risk,
concentrate resources to develop key countries, realign sales
channels
• Sales volume: 1.0 million units, down 55% YoY;
Revenue: HK$250 million, down 70% YoY
• Sales volume of smart devices: 0.5 million units, down 68% YoY
• Announced new brand identity, redefined market position,
implemented premium products strategy
• Q2 business plan: Develop operators and open markets in parallel,
establish strategic partnership with major distributors
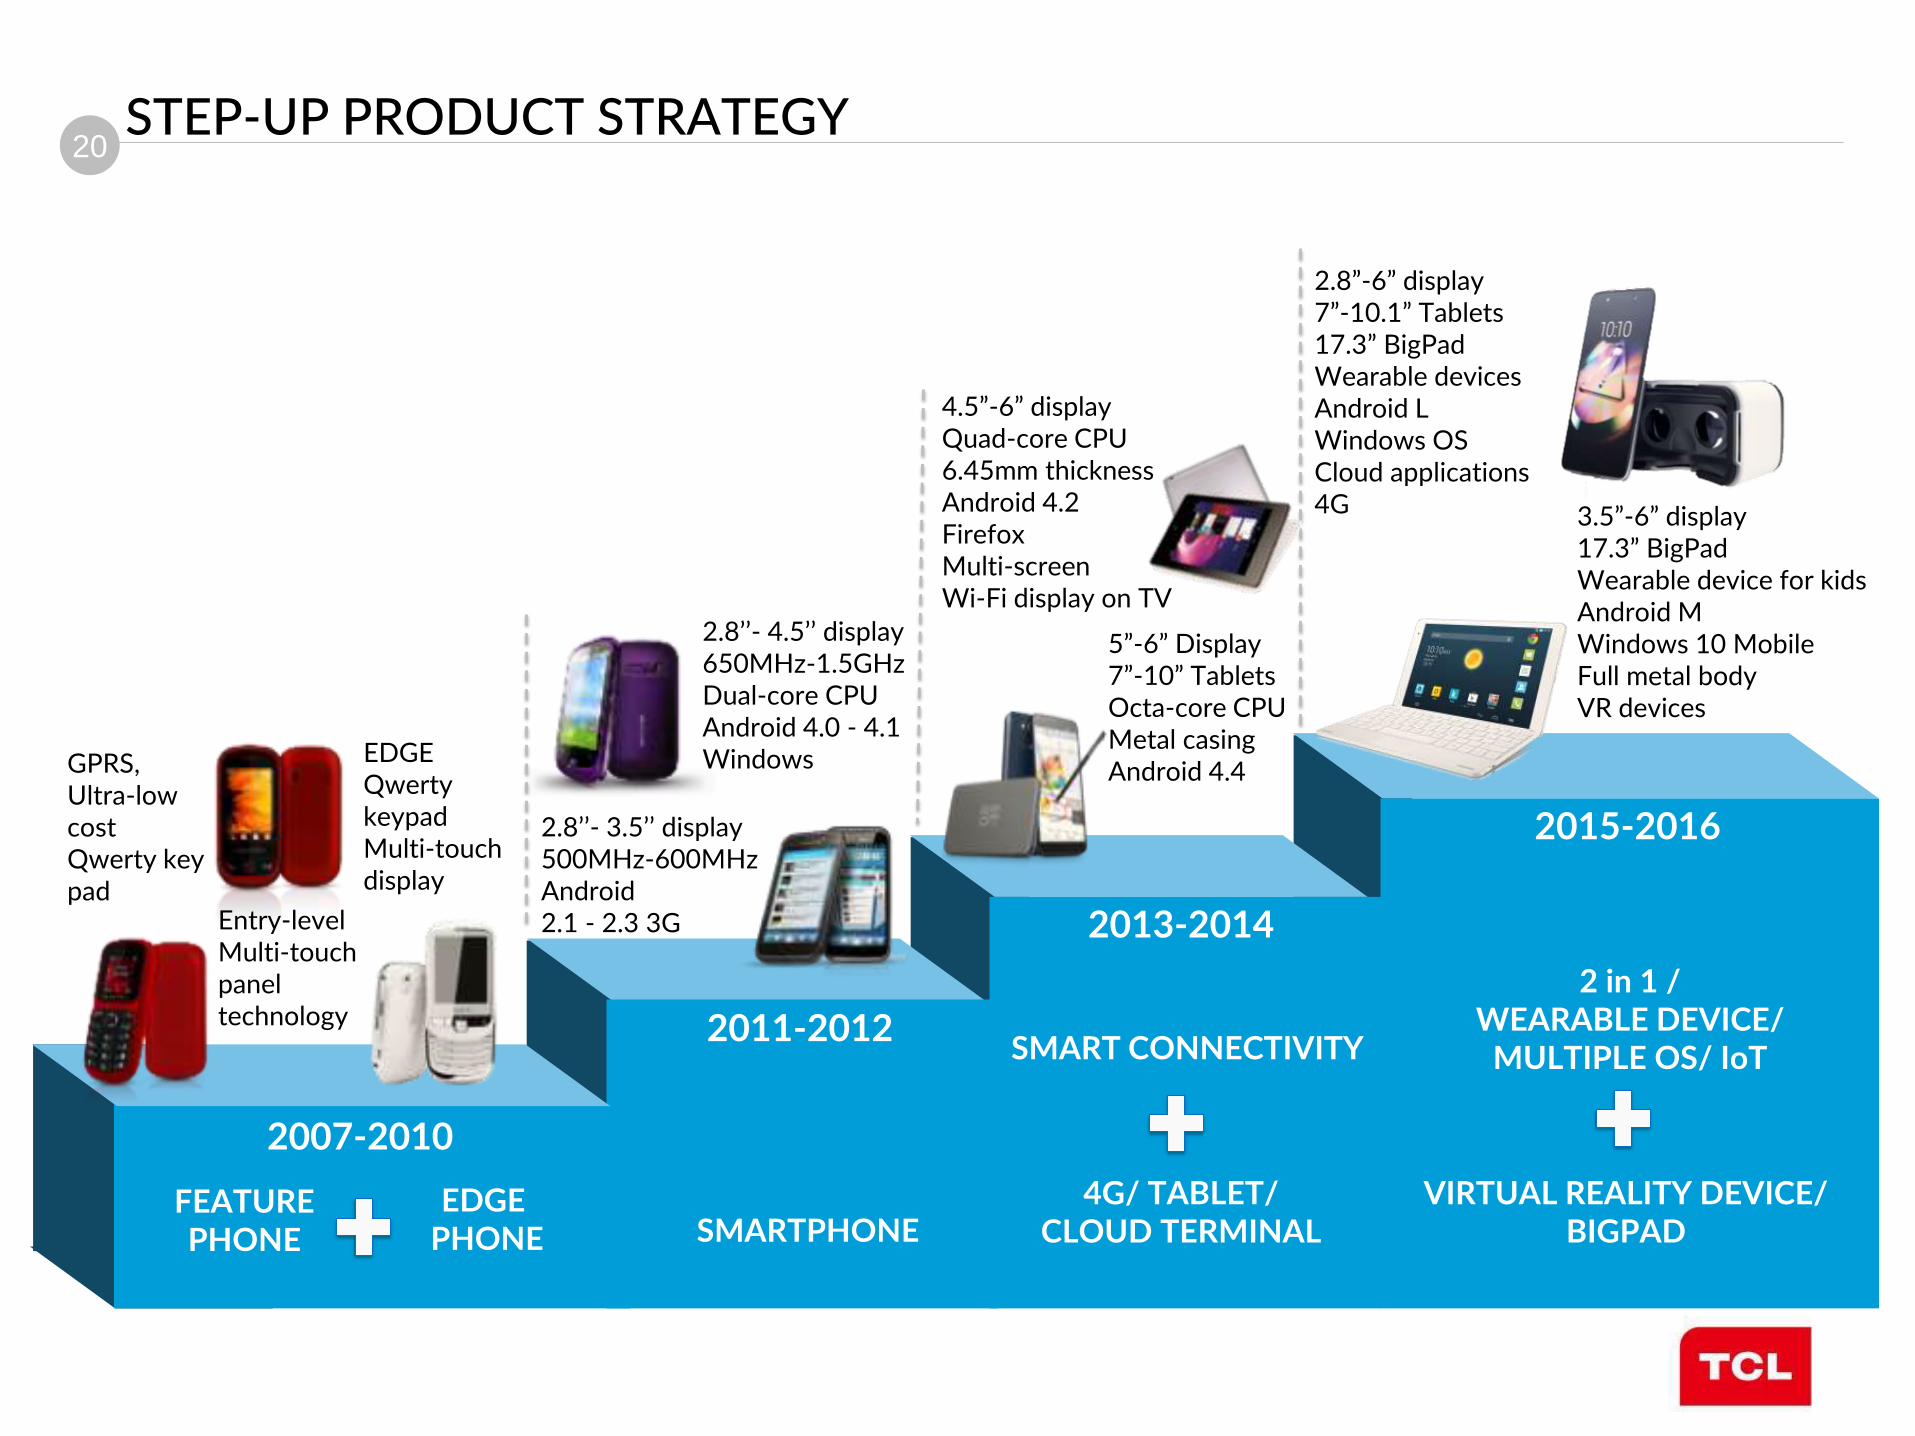
20 STEP-UP PRODUCT STRATEGY
2007-2010
FEATURE PHONE
EDGE PHONE
2011-2012
2013-2014
2015-2016
GPRS, Ultra-low cost Qwerty key pad Entry-level
Multi-touch panel technology
EDGE Qwerty keypad Multi-touch display
2.8’’- 3.5’’ display 500MHz-600MHz Android 2.1 - 2.3 3G
SMARTPHONE
SMART CONNECTIVITY
4G/ TABLET/ CLOUD TERMINAL
2 in 1 / WEARABLE DEVICE/
MULTIPLE OS/ IoT
VIRTUAL REALITY DEVICE/ BIGPAD
2.8’’- 4.5’’ display 650MHz-1.5GHz Dual-core CPU Android 4.0 - 4.1 Windows
5‛-6‛ Display 6‛-10‛ Tablets Octa-core CPU Metal casing Android 4.4
4.5‛-6‛ display Quad-core CPU 6.45mm thickness Android 4.2 Firefox Multi-screen Wi-Fi display on TV
2.8‛-6‛ display 6‛-10.1‛ Tablets 16.3‛ BigPad Wearable devices Android L Windows OS Cloud applications 4G 3.5‛-6‛ display
16.3‛ BigPad Wearable device for kids Android M Windows 10 Mobile Full metal body VR devices

21
PRODUCTS SELECTED BY GLOBAL MAINSTREAM OPERATORS & DISTRIBUTORS
NORTH AMERICA
LATIN AMERICA
EUROPE CHINA
APAC
MEA
·

22
IDOL 4 Series received 14 recognitions at MWC 2016
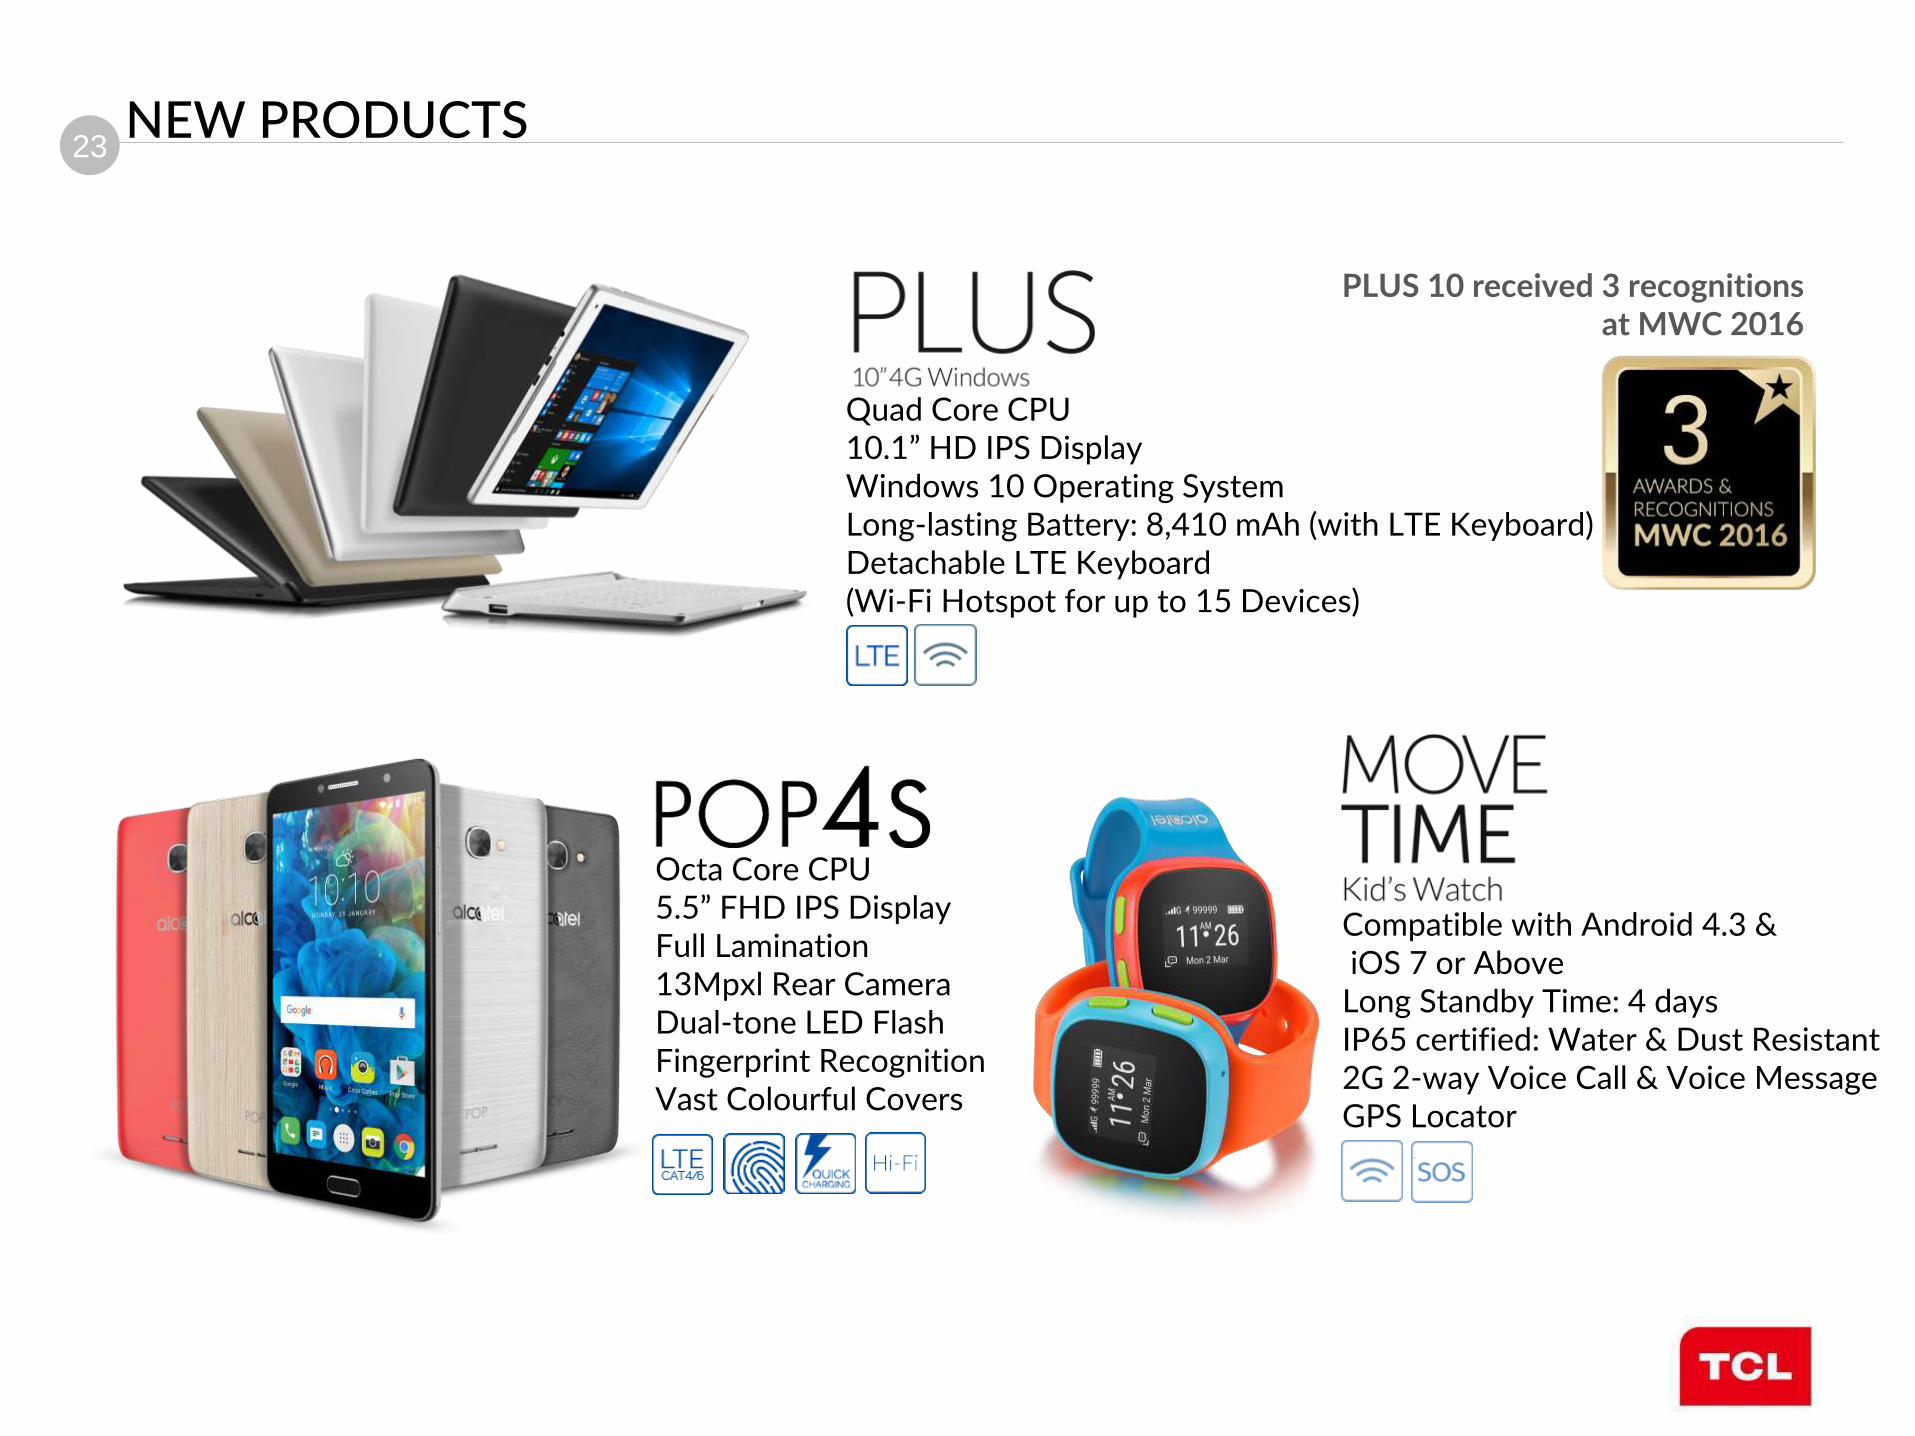
NEW PRODUCTS
Octa Core CPU 5.2'‘ FHD IPS Display Slim Body: 7.1 mm 13 Mpxl Rear Camera, Dual-tone LED Flash Augmented Multimedia Experience with Boom Key
Octa Core CPU 5.5‛ QHD AMOLED Display
Ultra Slim Body: 6.99 mm 16 Mpxl Rear Camera, Dual-tone LED Flash
Augmented Multimedia Experience with Boom Key VR–in-the-Box
23
Quad Core CPU 10.1‛ HD IPS Display Windows 10 Operating System Long-lasting Battery: 8,410 mAh (with LTE Keyboard) Detachable LTE Keyboard (Wi-Fi Hotspot for up to 15 Devices)
PLUS 10 received 3 recognitions at MWC 2016
NEW PRODUCTS
Compatible with Android 4.3 & iOS 7 or Above Long Standby Time: 4 days IP65 certified: Water & Dust Resistant 2G 2-way Voice Call & Voice Message GPS Locator
Octa Core CPU 5.5‛ FHD IPS Display Full Lamination 13Mpxl Rear Camera Dual-tone LED Flash Fingerprint Recognition Vast Colourful Covers
24
01 02
03 04
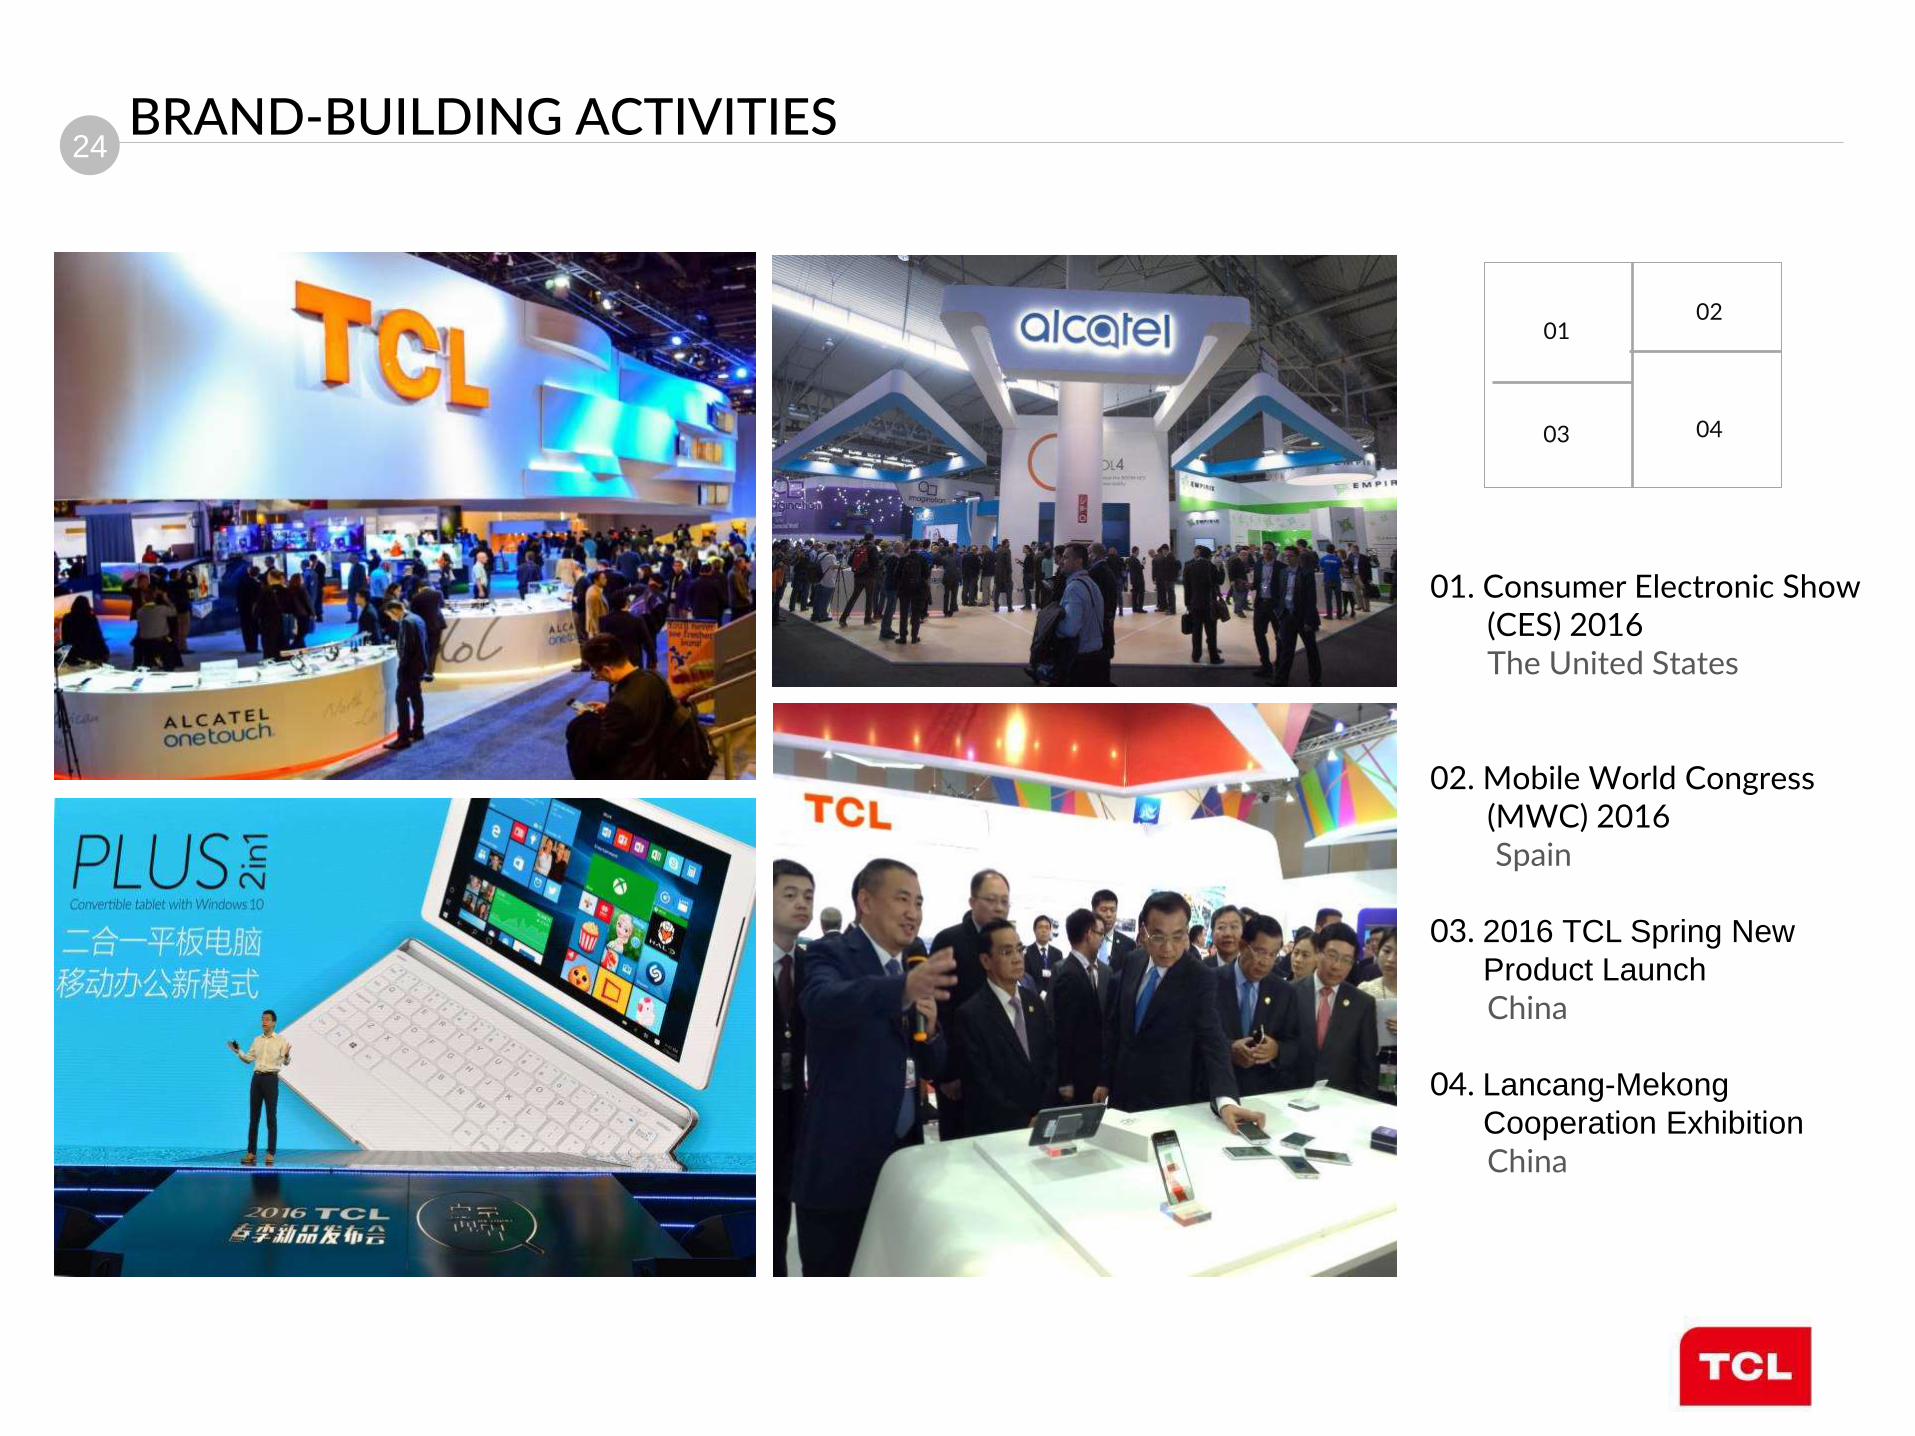
BRAND-BUILDING ACTIVITIES
01. Consumer Electronic Show (CES) 2016 The United States 02. Mobile World Congress (MWC) 2016 Spain 03. 2016 TCL Spring New
Product Launch
China 04. Lancang-Mekong
Cooperation Exhibition
China

25 OUTLOOK
CHALLENGES
EXECUTION PLANS
GOALS & FORECAST
Global economy remains in the doldrums with soft consumer spending
Currency fluctuations pose a continuing headwind for sales growth
Business risks from emerging markets are mounting
Due to the prevailing weak macro economy, the net profit in 1H 2016 may record a
significant year-on-year decline. Nevertheless, if the reception of the newly launched
products goes well as expected, the revenue of 2H 2016 may be improved.
4G smartphones and tablets will continue to be the main growth drivers in 2016
Strive to develop the new ‚Product + Service‛ business model and generate sustainable
service income
Gradually transform into a ‚Global smart mobile devices ecosystem corporation‛ by
anchoring on ‚Smart devices + Cloud-based platform + Internet services‛ foundation
Continue to implement stringent credit control and hedging policies to
mitigate the impact of currency fluctuation
Restructure regional businesses and strengthen the three pillars of growth:
key emerging markets, North America & Europe
Optimise product portfolio by increasing sales focus on user-centric and
cost-competitive mid-high end products
Strengthen new brand image and realign marketing strategy to promote
brand awareness
Maintain a balance between sales growth and sound operation

Q & A
THANK YOU Disclaimer
The information contained herein should not be utilized for any legal purposes in regards to any investment decision or results. In particular, this document does not constitute any recommendation or invitation for subscribing for or sale and purchase of any securities of TCL Communication Technology Holdings Limited (the The Company hereby expressly disclaims any liability for any loss or damage resulting from or in connection with any reliance by any investor on the information contained herein.
A number of forward-looking statements may be made during this presentation. Forward-looking statements are any statements that are not historical facts. These forward-looking statements are based on the current expectations of the Company and there can be no assurance that such expectations will prove to be correct. Because forward-looking statements involve risks and uncertainties, the actual results could differ materially from these statements.