tcrp report 64: guidebook for developing welfare-to-work
TRANSCRIPT
TRANSPORTATION RESEARCH BOARD
Guidebook for DevelopingWelfare-to-Work
Transportation Services
TRANSIT COOPERATIVERESEARCHPROGRAMTCRP
REPORT 64
Sponsored by
the Federal
Transit Administration
NATIONAL RESEARCH COUNCIL
TCRP OVERSIGHT AND PROJECT SELECTION COMMITTEE
CHAIRLINDA S. WATSONCorpus Christi RTA
MEMBERSDANNY ALVAREZMiami-Dade Transit AgencyGORDON AOYAGIMontgomery County GovernmentJEAN PAUL BAILLYUnion Internationale des Transports PublicsJ. BARRY BARKERTransit Authority of River CityLEE BARNESBarwood, Inc.RONALD L. BARNESCentral Ohio Transit AuthorityGERALD L. BLAIRIndiana County Transit AuthorityANDREW BONDS, JR.Parsons Transportation Group, Inc.ROBERT I. BROWNSTEINBooz-Allen & Hamilton, Inc.NURIA I. FERNANDEZFTARONALD L. FREELANDMaryland MTACONSTANCE GARBERYork County Community Action Corp.SHARON GREENESharon Greene & AssociatesKATHERINE M. HUNTER-ZAWORSKIOregon State UniversityROBERT H. IRWINBritish Columbia TransitJOYCE HOBSON JOHNSONNorth Carolina A&T State UniversityCELIA G. KUPERSMITHGolden Gate Bridge, Highway and
Transportation DistrictPAUL J. LARROUSSERutgers, The State University of New JerseyDAVID A. LEEConnecticut TransitEVA LERNER-LAMThe Palisades Consulting Group, Inc.ROBERT H. PRINCE, JR.Massachusetts Bay Transportation AuthorityRICHARD J. SIMONETTAPrima Facie, Inc.PAUL P. SKOUTELASPort Authority of Allegheny CountyPAUL A. TOLIVERKing County MetroAMY YORKAmalgamated Transit Union
EX OFFICIO MEMBERSWILLIAM W. MILLARAPTAKENNETH R. WYKLEFHWAJOHN C. HORSLEYAASHTOROBERT E. SKINNER, JR.TRB
TDC EXECUTIVE DIRECTORLOUIS F. SANDERSAPTA
SECRETARYROBERT J. REILLYTRB
TRANSPORTATION RESEARCH BOARD EXECUTIVE COMMITTEE 2000
OFFICERS
Chair: Martin Wachs, Director, Institute of Transportation Studies, University of California at BerkeleyVice Chair: John M. Samuels, Senior Vice President-Operations Planning & Support, Norfolk Southern
Corporation, Norfolk, VAExecutive Director: Robert E. Skinner, Jr., Transportation Research Board
MEMBERS
THOMAS F. BARRY, JR., Secretary of Transportation, Florida DOTJACK E. BUFFINGTON, Associate Director and Research Professor, Mack-Blackwell National Rural
Transportation Study Center, University of ArkansasSARAH C. CAMPBELL, President, TransManagement, Inc., Washington, DCANNE P. CANBY, Secretary of Transportation, Delaware DOTE. DEAN CARLSON, Secretary of Transportation, Kansas DOTJOANNE F. CASEY, President, Intermodal Association of North AmericaJOHN L. CRAIG, Director, Nebraska Department of RoadsROBERT A. FROSCH, Sr. Research Fellow, John F. Kennedy School of Government, Harvard
UniversityGORMAN GILBERT, Director, Oklahoma Transportation Center, Oklahoma State UniversityGENEVIEVE GIULIANO, Professor, School of Policy, Planning, and Development, USC, Los AngelesLESTER A. HOEL, L.A. Lacy Distinguished Professor, Depart. of Civil Engineering, University of
VirginiaH. THOMAS KORNEGAY, Executive Director, Port of Houston AuthorityTHOMAS F. LARWIN, General Manager, San Diego Metropolitan Transit Development BoardBRADLEY L. MALLORY, Secretary of Transportation, Pennsylvania DOTJEFFREY R. MORELAND, Sr. VP-Law and Chief of Staff, Burlington Northern Santa Fe Corp.,
Fort Worth, TX SID MORRISON, Secretary of Transportation, Washington State DOTJOHN P. POORMAN, Staff Director, Capital District Transportation Committee, Albany, NYWAYNE SHACKELFORD, Senior VP, Gresham Smith & Partners, Alpharetta, GA MICHAEL S. TOWNES, Exec. Dir., Transportation District Commission of Hampton Roads,
Hampton, VATHOMAS R. WARNE, Executive Director, Utah DOTARNOLD F. WELLMAN, JR., VP, Corporate Public Affairs, United Parcel Service, Washington, DCJAMES A. WILDING, President and CEO, Metropolitan Washington Airports AuthorityM. GORDON WOLMAN, Prof. of Geography and Environmental Engineering, Johns Hopkins UniversityDAVID N. WORMLEY, Dean of Engineering, Pennsylvania State University
EX OFFICIO MEMBERS
MIKE ACOTT, President, National Asphalt Pavement Association SUE BAILEY, National Highway Traffic Safety Administrator, U.S.DOT KELLEY S. COYNER, Research and Special Programs Administrator, U.S.DOT MORTIMER L. DOWNEY, Deputy Secretary of Transportation, U.S.DOT NURIA I. FERNANDEZ, Acting Administrator, Federal Transit Administration, U.S.DOT RUSSELL L. FUHRMAN (Maj. Gen., U.S. Army), Acting Commander, U.S. Army Corps of Engineers JANE F. GARVEY, Federal Aviation Administrator, U.S.DOT JOHN GRAYKOWSKI, Acting Administrator, Maritime Administration, U.S.DOT EDWARD R. HAMBERGER, President and CEO, Association of American Railroads CLYDE J. HART, JR., Acting Deputy Administrator, Federal Motor Carrier Safety Administration,
U.S.DOT JOHN C. HORSLEY, Exec. Dir., American Association of State Highway and Transportation Officials JAMES M. LOY (Adm., U.S. Coast Guard), Commandant, U.S. Coast Guard WILLIAM W. MILLAR, President, American Public Transportation Association JOLENE M. MOLITORIS, Federal Railroad Administrator, U.S.DOT MARGO OGE, Director, Office of Transportation and Air Quality, U.S. EPAVALENTIN J. RIVA, President and CEO, American Concrete Pavement Association ASHISH K. SEN, Director, Bureau of Transportation Statistics, U.S.DOT KENNETH R. WYKLE, Federal Highway Administrator, U.S.DOT
TRANSIT COOPERATIVE RESEARCH PROGRAM
Transportation Research Board Executive Committee Subcommittee for TCRPMARTIN WACHS, Institute of Transportation Studies, University of California at Berkeley (Chair)NURIA I. FERNANDEZ, FTA, U.S.DOTLESTER A. HOEL, University of VirginiaTHOMAS F. LARWIN, San Diego Metropolitan Transit Development BoardWILLIAM W. MILLAR, American Public Transportation AssociationJOHN M. SAMUELS, Norfolk Southern Corporation, Norfolk, VAWAYNE SHACKELFORD, Gresham Smith & Partners, Alpharetta, GAROBERT E. SKINNER, JR., Transportation Research Board
T R A N S P O RTAT I O N R E S E A R C H B OA R D — N AT I O N A L R E S E A R C H C O U N C I L
NATIONAL ACADEMY PRESSWASHINGTON, D.C. — 2000
T R A N S I T C O O P E R A T I V E R E S E A R C H P R O G R A M
TCRP REPORT 64
Research Sponsored by the Federal Transit Administration in Cooperation with the Transit Development Corporation
SUBJECT AREAS
Planning and Administration • Public Transit
Guidebook for DevelopingWelfare-to-Work
Transportation Services
MULTISYSTEMS, INC.Cambridge, MA
with
ECOSOMETRICS, INC.Bethesda, MD
MUNDLE & ASSOCIATES, INC.Philadelphia, PA
SIMON & SIMON RESEARCH ASSOCIATES, INC.Elk Ridge, MD
TRANSIT COOPERATIVE RESEARCH PROGRAM
The nation’s growth and the need to meet mobility,environmental, and energy objectives place demands on publictransit systems. Current systems, some of which are old and in needof upgrading, must expand service area, increase service frequency,and improve efficiency to serve these demands. Research isnecessary to solve operating problems, to adapt appropriate newtechnologies from other industries, and to introduce innovations intothe transit industry. The Transit Cooperative Research Program(TCRP) serves as one of the principal means by which the transitindustry can develop innovative near-term solutions to meetdemands placed on it.
The need for TCRP was originally identified in TRB SpecialReport 213—Research for Public Transit: New Directions,published in 1987 and based on a study sponsored by the Urban M a s sTransportation Administration—now the Federal Transit Admin-istration (FTA). A report by the American Public T r a n s p o r t a t i o nAssociation (APTA), Transportation 2000, also recognized the needfor local, problem-solving research. TCRP, modeled after thelongstanding and successful National Cooperative HighwayResearch Program, undertakes research and other technical activitiesin response to the needs of transit service providers. The scope ofTCRP includes a variety of transit research fields including plan-ning, service configuration, equipment, facilities, operations, humanresources, maintenance, policy, and administrative practices.
TCRP was established under FTA sponsorship in July 1992.Proposed by the U.S. Department of Transportation, TCRP wasauthorized as part of the Intermodal Surface TransportationEfficiency Act of 1991 (ISTEA). On May 13, 1992, a memorandumagreement outlining TCRP operating procedures was executed bythe three cooperating organizations: FTA, the National Academies,acting through the Transportation Research Board (TRB); and the Transit Development Corporation, Inc. (TDC), a nonprofiteducational and research organization established by APTA.TDC is responsible for forming the independent governing board,designated as the TCRP Oversight and Project Selection (TOPS)C o m m i t t e e .
Research problem statements for TCRP are solicited periodicallybut may be submitted to TRB by anyone at any time. It is theresponsibility of the TOPS Committee to formulate the researchprogram by identifying the highest priority projects. As part of theevaluation, the TOPS Committee defines funding levels andexpected products.
Once selected, each project is assigned to an expert panel,appointed by the Transportation Research Board. The panels prepareproject statements (requests for proposals), select contractors, andprovide technical guidance and counsel throughout the life of theproject. The process for developing research problem statements andselecting research agencies has been used by TRB in managingcooperative research programs since 1962. As in other TRB activ-ities, TCRP project panels serve voluntarily without compensation.
Because research cannot have the desired impact if products failto reach the intended audience, special emphasis is placed ondisseminating TCRP results to the intended end users of theresearch: transit agencies, service providers, and suppliers. TRBprovides a series of research reports, syntheses of transit practice,and other supporting material developed by TCRP research. APTAwill arrange for workshops, training aids, field visits, and otheractivities to ensure that results are implemented by urban and ruraltransit industry practitioners.
The TCRP provides a forum where transit agencies cancooperatively address common operational problems. The TCRPresults support and complement other ongoing transit research andtraining programs.
TCRP REPORT 64
Project H-15A FY’98ISSN 1073-4872ISBN 0-309-06664-6Library of Congress Control Number 00-136356
© 2000 Transportation Research Board
Price $55.00
NOTICE
The project that is the subject of this report was a part of the Transit CooperativeResearch Program conducted by the Transportation Research Board with theapproval of the Governing Board of the National Research Council. Suchapproval reflects the Governing Board’s judgment that the project concerned isappropriate with respect to both the purposes and resources of the NationalResearch Council.
The members of the technical advisory panel selected to monitor this project andto review this report were chosen for recognized scholarly competence and withdue consideration for the balance of disciplines appropriate to the project. Theopinions and conclusions expressed or implied are those of the research agencythat performed the research, and while they have been accepted as appropriateby the technical panel, they are not necessarily those of the TransportationResearch Board, the National Research Council, the Transit DevelopmentCorporation, or the Federal Transit Administration of the U.S. Department ofT r a n s p o r t a t i o n .
Each report is reviewed and accepted for publication by the technical panelaccording to procedures established and monitored by the TransportationResearch Board Executive Committee and the Governing Board of the NationalResearch Council.
To save time and money in disseminating the research findings, the report isessentially the original text as submitted by the research agency. This report hasnot been edited by TRB.
Special Notice
The Transportation Research Board, the National Research Council, the TransitDevelopment Corporation, and the Federal Transit Administration (sponsor ofthe Transit Cooperative Research Program) do not endorse products ormanufacturers. Trade or manufacturers’ names appear herein solely because theyare considered essential to the clarity and completeness of the project reporting.
Published reports of the
TRANSIT COOPERATIVE RESEARCH PROGRAM
are available from:
Transportation Research BoardNational Research Council2101 Constitution Avenue, N.W.Washington, D.C. 20418
and can be ordered through the Internet athttp://nationalacademies.org/trb/
Printed in the United States of America
9781-00 FM 1/18/01 2:00 PM Page ii
FOREWORDBy Staff
Transportation ResearchBoard
TCRP Report 64, "Guidebook for Developing Welfare-to-Work TransportationServices," provides information about the role of transportation in supporting welfare-to-work initiatives and identifies practical strategies to improve access to job opportu-nities for former welfare recipients making the transition to work. The Guidebookdescribes service approaches that include modifications to existing mass transit ser-vices, coordination between transportation services, ride-sharing programs, automobileownership programs, and collaborations between faith-based and community-basedgroups. The report should be useful to transit planners, decision makers, and socials e rvice and transportation providers.
New welfare laws created needs and opportunities for states and local governmentsto provide improved access and mobility for poor and low-income persons, many ofwhom do not or cannot afford to drive. The new time limits and work-based require-ments are forcing social service agencies and providers of both public and private trans-portation to rethink the way transportation services are provided.
Among the ideas that hold promise is better coordination and integration of exist-ing transportation services including those offered by employers, social service agen-cies, faith-based groups, nonprofit organizations, schools, and transit agencies. Theability to leverage resources more effectively and efficiently can offer improvementsin mobility.
It is also important that localities know which transportation strategies work andwhich do not. Research was needed to identify ways to enhance coordination andexplore the critical factors that determine success or failure in providing employmenttransportation services.
Multisystems, Inc., in association with Ecosometrics, Inc.; Howard/Stein-HudsonAssociates, Inc.; Mundle & Associates, Inc.; and Simon & Simon Research and Asso-ciates, Inc. formed the research team for TCRP Project H-15A and prepared the guide-book and the final report. To achieve the project objective of developing a practitioner'sguide to evaluate methods and outcomes that promote and enhance mobility and accessto job opportunities for former welfare recipients, the researchers explored how newpartnerships could expand the ability of transportation providers to more effectivelyplan, operate, and finance services in urban, suburban, and rural areas. Additionally, toaccomplish the project objective, the researchers identified and analyzed how best toleverage resources and services that most effectively respond to the transportationneeds of welfare recipients and low-income persons.
Research activities included an extensive literature review, focus groups withstakeholders in welfare-to-work activities, and a series of on-site case studies.
The final report, the companion to this guidebook, is titled "Welfare to Work:Integration and Coordination of Transportation and Social Services." It can be found
9781-00 FM 1/18/01 2:00 PM Page iii

on the TCRP web site (www4.national-academies.org/trb/crp.nsf) as TCRP WebD o cument 16. The report provides a review of the issues and needs related to welfarereform and summarizes the provisions of federal welfare reform legislation, the demo-graphic characteristics and travel patterns of welfare recipients, the unique challengesof welfare-related transportation, and the implications for service strategies. Further,the final report describes available funding programs as well as innovative programson the state and local levels. Also, a program evaluation and the lessons learned fromeach case study are included.
9781-00 FM 1/18/01 2:00 PM Page iv
Table of Contents
EXECUTIVE SUMMARY
PART 1. INTRODUCTION
CHAPTER 1. INTRODUCTION _________________________________________ 1-1Information Sources ___________________________________________ 1-1Road Map __________________________________________________ 1-2
CHAPTER 2. ISSUES AND NEEDS ______________________________________ 2-1Transportation Barriers for Welfare Recipients _______________________ 2-1Implications for Transportation __________________________________ 2-7
PART 2. PROGRAM ELEMENTS
CHAPTER 3. PARTNERS IN CHANGE ____________________________________ 3-1Coming to the Table ___________________________________________ 3-1Achieving Consensus __________________________________________ 3-6
CHAPTER 4. IDENTIFYING DATA ELEMENTS ________________________________ 4-1Target Population _____________________________________________ 4-1Employment Opportunities ______________________________________ 4-3Transportation Resources _______________________________________ 4-4Support Services _____________________________________________ 4-7
CHAPTER 5. IDENTIFYING UNMET NEEDS _________________________________ 5-1Use of Geographic Information Systems ____________________________ 5-3Learning from Welfare Recipients _________________________________ 5-3Stakeholder Participation _______________________________________ 5-5
CHAPTER 6. SERVICE STRATEGIES _____________________________________ 6-1Modifications to Existing Services ________________________________ 6-1Shuttles, Circulators, and Feeder Services __________________________ 6-2Night Owl Services ___________________________________________ 6-2Service Coordination __________________________________________ 6-3Mobility Manager _____________________________________________ 6-3Ridesharing and Subscription Services _____________________________ 6-4Entrepreneurial Services _______________________________________ 6-4Automobile Strategies _________________________________________ 6-5Travel Information ____________________________________________ 6-5Child-Care Transporation _______________________________________ 6-6One-Stop Centers _____________________________________________ 6-7Subsidies and Incentives _______________________________________ 6-7
CHAPTER 7. DEFINING THE PROGRAM ___________________________________ 7-1Develop a Service Plan ________________________________________ 7-1Estimate Program Costs ________________________________________ 7-2Identify Funding Opportunities ___________________________________ 7-4Combining Funding Sources ____________________________________ 7-10Develop a Funding Plan _______________________________________ 7-12
CHAPTER 8. MEASURING SUCCESS ____________________________________ 8-1Deciding What to Measure ______________________________________ 8-1Selecting Indicators ___________________________________________ 8-2How to Measure Program Performance _____________________________ 8-2How to Measure Customer Benefits _______________________________ 8-3How to Measure Societal Benefits ________________________________ 8-4Data Requirements ____________________________________________ 8-5Challenges __________________________________________________ 8-6
PART 3. NEW PARTNERSHIPS, NEW OPPORTUNITIES
CHAPTER 9. WORKING WITH THE COMMUNITY ______________________________ 9-1AdVANtage II: Sojourner - Douglas College __________________________ 9-2Good News Garage ____________________________________________ 9-6Lower San Antonio Transportation Support Project ___________________ 9-10San Diego Workforce Partnership ________________________________ 9-15
CHAPTER 10. WORKING WITH AGENCIES _________________________________ 10-1AdVANtage Van Service Entrepeneurs Project _______________________ 10-2Conta Costa County __________________________________________ 10-7Metropolitan Transportation Commission/AC Transit ________________ 10-11New Jersey Statewide County and Community Transportation Plans ____ 10-17Pinellas County Transportation Disadvantaged Program ______________ 10-21Santee Wateree Regional Transportation Authority _________________ 10-25Transit Authority of River City _________________________________ 10-30
PART 4. CONCLUSIONS
CHAPTER 11. LESSONS LEARNED _____________________________________ 11-1
APPENDIX A. RESOURCES
APPENDIX B. FEDERAL FUNDING PROGRAMS
APPENDIX C. FEDERAL FUNDING GUIDANCE
APPENDIX D. CASE STUDY CONTACTS
APPENDIX E. SAMPLE SURVEY FORM
APPENDIX F. SAMPLE DATA COLLECTION FORM
COOPERATIVE RESEARCH PROGRAMS STAFF
ROBERT J. REILLY, Director, Cooperative Research ProgramsCHRISTOPHER JENKS, Manager, Transit Cooperative Research ProgramGWEN CHISHOLM, Senior Program OfficerEILEEN P. DELANEY, Managing Editor
PROJECT PANEL H-15A
CHARLES CARR, Mississippi DOT (Chair)MARSHA BECKWITH, Payne Memorial Outreach, Baltimore, MDLOIS A. BELL, U.S. Department of Health and Human Services AURELIA JONES-TAYLOR, Delta Area Rural Transit System, Clarksdale, MS WADE LAWSON, South Jersey Transportation Authority, Atlantic City, NJLINDA A. LOVEJOY, Wisconsin DOT JAMES F. McLAUGHLIN, Los Angeles County Metropolitan Transportation AuthorityJANET ZOBEL, National Urban League, New York, NYDOUG BIRNIE, FTA Liaison RepresentativeSEAN G. LIBBERTON, FTA Liaison Representative JON M. WILLIAMS, TRB Liaison Representative
ACKNOWLEDGMENTSThe research for this guidebook was performed under TCRP Proj-
ect H-15A by Multisystems, Inc., Ecosometrics, Inc., Simon & SimonResearch and Associates, Inc., and Mundle & Associates, Inc.
Susan Bregman of Multisystems is the Principal Investigator forthis study. She was responsible for the overall supervision of theresearch and is the primary author of this Guidebook. Jon Burkhardtof Ecosometrics, Rosalyn Simon of Simon & Simon Research andAssociates, and Janet Kraus of Mundle & Associates led the case
study research efforts for their respective firms. Other researchersfor this efforts included Patricia Monahan and Rosemary Mathiasat Multisystems, Andrew Lynd at Mundle & Associates, and JamesHedrick and Adam McGavock at Ecosometrics. Nicki Rohloff,Kevin Newton, and Augustus Kelley at Multisystems provided edi-torial, word processing, and production support.
The guidance of Gwen Chisholm, the TCRP Program Officer forthe project, and the Project Panel is also acknowledged.
9781-00 FM 1/18/01 2:00 PM Page viii
Executive SummaryThis guidebook was developed as part of the Transit Cooperative ResearchProgram (TCRP) Project H-15A, Welfare to Work: Integration and Coordinationof Transportation and Social Services. The project’s goal was to examine therole of transportation in supporting welfare-to-work initiatives and to identifypractical strategies to improve access to job opportunities for former welfarerecipients making the transition to work. The advice presented in this guidebookis based on in-depth interviews with transportation providers, social serviceagencies, and nonprofit organizations across the country.
Issues and NeedsWelfare reform legislation changed the structure of the U.S. welfare system.The strengthened emphasis on moving individuals from welfare to work has hadsignificant implications for a wide range of support services, from child care tojob training to transportation. Specifically, welfare recipients face a number oftransportation barriers, including the following:
• Nationally nearly three out of four welfare recipients live in center cities or inrural areas, while job growth has focused on the suburbs.
• Jobs in the retail and service industries typically require entry-levelemployees to work at night and on weekends.
• Most welfare recipients do not own cars.
• While urban residents generally have convenient access to transit services,those systems were never intended to get city dwellers to the suburbs –especially at night or on weekends.
• More than one-half of rural residents live in areas with minimal transit serviceor none at all.
• Women with young children – especially single mothers – are especially likelyto incorporate multiple stops into their work trips.
• Welfare recipients may have difficulty using a bus schedule.
Transit Cooperative Research Program
Page ES-2
States, counties, and communities have responded to this challenge with avariety of traditional and innovative strategies. This document guides thereader through the planning and implementation process for developing welfare-related transportation services, using lessons from exemplary programs.
Partners in ChangeAs state and local governments have begun to address the challenges of welfarereform, new cooperative relationships have emerged. Partners in these newcollaborations have included any or all of the following:
• Transportation providers, including public and private transit andparatransit operators serving the general public and agency clients, vanpoolprograms, private shuttle operators, and taxi services
• Social service providers, including agencies administering TemporaryAssistance for Needy Families (TANF) program benefits and support services(e.g., training, placement, and child care)
• Employers and job developers, including representation from the areaprivate industry council or workforce investment board
• Community- and faith-based organizations that work with members ofthe targeted population and may have transportation resources available
• Planners, including representatives from metropolitan planningorganizations (MPOs); councils of governments (COGs); departments oftransportation (DOTs); or state, county, or local planning departments
• Elected officials, who can play a key role in obtaining community andpolitical support for recommended programs
Through the planning process, stakeholders can share their specializedknowledge as they develop transportation strategies that incorporate the bestelements of their differing disciplines. The individuals and the organizationsthey represent must work together to move their ideas into reality. Strong andcommitted leadership can help ensure that the differences among participantswork to enrich the process. The first test of the group process is achievingconsensus on a set of goals and objectives to guide program development andimplementation.
During the early phases of project planning, goals and objectives will help definethe basic program elements – such as targeted customers – and guide theneeds assessment process. During program implementation, goals andobjectives will help define the evaluation process. And throughout programplanning and development, the goals and objectives will help keep participantsfocused on the project outcome.
Guidebook for Developing Welfare-to-Work Transportation Services
Page ES-3
Identifying Data ElementsPlanning a welfare-to-work transportation program typically begins with a needsassessment. A needs assessment is intended to answer the following questions:
• Who are the target transportation customers?
• Where are job opportunities located?
• Where are support services located?
• What transportation alternatives are available to them now?
• What transportation barriers do they face?
The data elements commonly associated with welfare-to-work planning can bereadily obtained from a variety of sources, including local welfare agencies,transit operators, and the federal government.
Identifying Unmet NeedsAfter assembling information about travel patterns and transportation resources,stakeholders can begin to assess the transportation barriers and gaps in servicethat program participants encounter. Many tools and resources are available fordefining these transportation needs and barriers. These include use ofcomputerized mapping systems to represent the geographic relationshipsamong program participants, travel destinations, and transit services; marketresearch techniques like surveys to gather information about travel patterns andtransportation resources; and techniques like focus groups, communitymeetings, and structured interviews to obtain personal accounts of travel needsand transportation barriers.
Service StrategiesHistorically, welfare offices met the transportation needs of their clients byreimbursing them for transportation costs; typically they provided bus passes,taxi vouchers or mileage allowances. Welfare reform has complicated thetransportation needs of welfare recipients considerably, however, and states andlocalities are struggling to serve their clients in this new environment. The rangeof service strategies that have been developed to support welfare-relatedtransportation needs include the following:
• Modifications to existing services, including changes in route alignment orschedule to serve employment centers, to meet work shifts, or to minimizetransfers
• Shuttles, circulators, and feeder services to improve mobility within alocal area or to provide connections to the regional transit network
Transit Cooperative Research Program
Page ES-4
• Night owl services for late-night workers
• Coordination among existing public and private transportation services
• Mobility manager to coordinate the delivery of a range of transportationprograms and services
• Ridesharing and subscription services
• Automobile-based strategies, including vehicle donation and purchaseprograms
• Entrepreneurial services that train welfare recipients to providetransportation services to other community members
• Travel information, including multilingual materials and computerized tripplanning services
• Child-care transportation
• Fare subsidies and incentives
• One-stop centers that consolidate services for welfare recipients
Defining the ProgramAfter deciding what type of service best suits the identified travel needs of thetarget market, planners can define the program in more detail.
A service plan outlines program resource requirements and can be used todevelop a budget and funding plan. Elements of a service plan include thefollowing:
• Target market
• Route or service area
• Service characteristics
• Service span
• Frequency
• Reservation policy
• Vehicle requirements
• Operating arrangements
Guidebook for Developing Welfare-to-Work Transportation Services
Page ES-5
• Maintenance
• Staffing
• Fare policy
• Coordination
• Organizational responsibilities
While these elements focus on transit operations a service pan can easily beadapted to other welfare-related transportation programs.
Based on the information in the service plan, program developers can estimatecosts. Transportation costs traditionally fall into three categories: capital,operating, and administrative.
The next step, after estimating program costs, is to identify fundingopportunities and to develop a funding plan. Service providers have turnedto a wide variety of funding sources – from federal grants to donated labor.Three major federal funding programs may be used to support welfare-to-worktransportation programs. These are the TANF block grant program,administered by the U.S. Department of Health and Human Services; theWelfare-to-Work formula and competitive grant program, administered by theU.S. Department of Labor; and the Job Access and Reverse Commute grantprogram, administered by the U.S. Department of Transportation. Several stateshave used federal formula or block grant funds to support local or regionalwelfare-to-work transportation programs, often on a competitive basis. Someprograms have received grants or donations from private funding sources,including foundations, faith-based organizations, and nonprofit communityorganizations.
Measuring SuccessMeasuring the effectiveness of welfare-to-work transportation programsprovides valuable feedback to staff, stakeholders and funding sources about theprogram’s activities and results. The first step is to select an evaluationapproach. This usually falls into one of three broad categories:
• Program performance, to track the resources used to support the program
• Customer benefits, to assess the direct impacts on program participants
• Societal benefits, to evaluate overall social costs and benefits
Transit Cooperative Research Program
Page ES-6
Performance indicators are characteristics that are tracked to measure howwell a program achieves an outcome. Each indicator will have one or moretargets, which are specific objectives for measuring indicators. The specificcriteria used for evaluating a program may blend strategies traditionallyassociated with transportation programs with those used by human servicesproviders.
Defining data needs is a critical – and often overlooked – step in the evaluationprocess. Program staff must determine what information best answers theevaluation questions posed for the project and how that information can becollected.
New Partnerships, New OpportunitiesHistorically, welfare offices met the transportation needs of their clients byreimbursing them for transportation costs; typically they provided bus passes,taxi vouchers, or mileage allowances. Welfare reform has complicated thetransportation needs of welfare recipients considerably, however, and states andlocalities are struggling to serve their clients in this new environment.
Case studies are summarized in Chapters 9 and 10, describing exemplaryprograms that provide transportation services to welfare recipients and, in somecases, other low-income workers. The highlighted programs have used a varietyof creative strategies to address customer needs and are organized by theirsponsorship. In some cases, multiple agencies jointly sponsored a singleprogram.
Programs that use the resources of community groups and faith-basedorganizations include the following:
• AdVANtage II, at Sojourner-Douglas College in Baltimore, Maryland, whichhelps students at this community-based college to provide transportationservices as van operators.
• Good News Garage, in Burlington, Vermont, a faith-based program thatrefurbishes donated automobiles and turns them over to low-incomeresidents.
• Lower San Antonio Transportation Support Project, in Oakland,California, provides trip planning and support services to give community-based organizations in this multicultural neighborhood.
• San Diego Workforce Partnership, in San Diego, California, whichcoordinates resources from church groups and nonprofit organizations toprovide work-related transportation.
Guidebook for Developing Welfare-to-Work Transportation Services
Page ES-7
Agency-based programs include the following:
• AC Transit Neighborhood Circulator, which provides night-timeconnections between rail stations and a residential community in NorthRichmond, California.
• AdVANtage, in Anne Arundel County, Maryland, which trains welfarerecipients to operate van services.
• Contra Costa County Social Services Department, in Martinez,California, which is making vans available to TANF participants to providetransportation services for community organizations and child-care facilities.
• Metropolitan Transportation Commission, in the San Francisco BayArea, California, which is facilitating a county-based planning process anddeveloping transportation resource guides.
• Pinellas County Metropolitan Planning Organization, in Clearwater,Florida, which administers a menu of transportation options for TANFrecipients.
• Santee-Wateree Regional Transportation Authority Flex Routes, inSumter, South Carolina, which coordinates work-related transportation withservices for human service agency clients.
• State of New Jersey, which developed a comprehensive county-basedtransportation planning process.
• State of South Carolina, which developed an interagency planning programto support local efforts.
• Transit Authority of River City, in Louisville, Kentucky, whose servicesinclude a one-stop center and a late-night subscription shuttle to supportsecond- and third-shift workers.
• TransPac in Pleasant Hill, California, a regional planning agency thatprovides transportation incentives and traveler information.
These programs were selected because they approached the transportationneeds of their clients in innovative ways. For example, two programs inMaryland trained participants to operate their own van services. Severalprograms incorporated participation from community-based and faith-basedorganizations, and others had extensive outreach programs to ensure thatpotential customers had a voice in program development. Even the programssponsored by traditional transportation and social service providers includednontraditional elements. Several transit authorities have introduced late-night
Transit Cooperative Research Program
Page ES-8
shuttles to serve second- and third-shift workers, while a rural agency in SouthCarolina found a way to combine work trips with agency transportation.
Lessons LearnedCommunities have responded to the challenges of moving people from welfareto work with a wide range of strategies, from modest bus route extensions tocreative collaborations with community-based organizations. Approaches towelfare-related transportation generally reflect the characteristics of thecommunity, the complexity of the transportation barriers that welfare clientsencounter, and sometimes the requirements of the funding sources. Many citiesalready have extensive transit networks; in these locations, programs have oftenfocused on transporting individuals from urban neighborhoods to suburban jobsites. Rural and suburban programs have faced a different challenge: providinga means for people living in widely dispersed locations to access urban andsuburban job centers. Irrespective of operating setting, many programs havealso addressed the specialized transportation needs of shift workers and parentswith young children.
Because traditional transportation approaches often do not address theseneeds, communities have developed creative transportation strategies.Innovations, as shown in the case studies, range from late-night subscriptionshuttles to automobile donation programs to transportation services operated byTANF clients themselves. Although the program details vary substantially, thelessons that have emerged from these programs are quite similar. They fit intofive general categories:
• Collaboration
• Leadership
• Communication
• Creativity
• Sustainability
The lessons learned from these programs are summarized here:
Foster collaboration among human service, transportation and otherorganizations. Joining forces enabled social service and transportationprograms to translate their agency-specific experience into cooperative efforts.For several programs, the involvement from faith-based, community-based, andgrass roots organizations was a key factor.
Guidebook for Developing Welfare-to-Work Transportation Services
Page ES-9
Start at the top. Building coordination into the process has the potential tonarrow the distance between transportation and social services.
The committed leadership of an individual or organization can help tocarry a project from planning to implementation. While steeringcommittees and advisory groups play a critical role in planning welfare-relatedtransportation, a strong leader can motivate diverse stakeholders and ensurethat their differences enrich the planning process.
Do not underestimate the importance of maintaining communicationamong program staff, participants, and stakeholders. Clearcommunication starts with consensus on program goals and extends throughoutplanning and implementation.
Incorporate creative approaches to welfare-related transportation.Because traditional transportation services do not easily meet the transportationneeds of welfare recipients, many communities developed innovative responsesto welfare reform. Despite their diversity, these programs share one commontrait: Program planners were “thinking outside the box.”
Design programs for the long run. Successful programs have incorporatedstrategies to ensure that results can be sustained over time for targeted TANFclients and in some cases the general public. Some organizations, especiallytransportation agencies, have built upon existing services and capitalized onavailable support services. Transit agencies, in particular, may be able to adapttransportation services to serve community transportation needs beyond welfareto work. Given recent changes in the job market – including the growth ofsuburban employment, service industries, and the “24/7” culture – manytransportation strategies designed for welfare recipients can easily serve othercommuters as well. As ridership grows, transit agencies may be able tointegrate these new welfare-related services into their agency operating plans,providing passengers with long-term stability.
Part 1: Introduction
CHAPTER 1
IntroductionThis guidebook was developed as part of the Transit Cooperative ResearchProgram (TCRP) Project H-15A, Welfare to Work: Integration and Coordination ofTransportation and Social Services. The project’s goal was to examine the role oftransportation in supporting welfare-to-work initiatives and to identify practicalstrategies to improve access to job opportunities for former welfare recipientsmaking the transition to work. Service approaches described in this guidebookinclude modifications to existing mass transit services, better coordination andintegration of available transportation services, ridesharing programs, automobileownership programs, and subsidies for transportation costs. Also of note arecoordinated planning processes, which have fostered new collaborationsbetween social service and transportation providers, involvement of faith-basedand community-based organizations, and creative use of public and privatefunding sources to support improvements in mobility.
Information SourcesThe advice presented in this guidebook is based on in-depth interviews withtransportation providers, social service agencies, and nonprofit organizationsacross the country. Case studies profiled programs of the following agencies ororganizations:
• AC Transit, in Oakland, California
• Anne Arundel County Department of Social Services in Annapolis, Maryland
• Contra Costa County Social Services Department, in Martinez, California
• East Bay Asian Local Development Corporation, in Oakland, California
• Good News Garage, in Burlington, Vermont
• Metropolitan Transportation Commission, in Oakland, California
• Pinellas County Metropolitan Planning Organization, in Clearwater, Florida
• San Diego Workforce Partnership, in San Diego, California
Transit Cooperative Research Program
Page 1-2
• Santee-Wateree Regional Transportation Authority, in Sumter, South Carolina
• Sojourner - Douglass College in Baltimore, Maryland
• State of New Jersey
• State of South Carolina
• Transit Authority of River City, in Louisville, Kentucky
• TransPac in Pleasant Hill, California
Key findings from the case studies are excerpted throughout this report, alongwith information and advice from other exemplary programs. In addition, thecase studies are included in their entirety.
Road MapThis guidebook presents practical advice for developing and implementingwelfare-related transportation services. Guidance is based on the experience ofthe transportation and social service providers interviewed. The book isorganized into four parts, as summarized here.
Part 1 introduces the challenges of providing welfare-related transportation.
••••• Chapter 1 provides background on TCRP Project H-15A and this guidebook.
••••• Chapter 2 summarizes the issues and needs associated with welfare-to-work transportation.
Part 2 focuses on the practical aspects of developing a transportation programand includes a series of how-to chapters.
••••• Chapter 3 describes the new partnerships and collaborations participating inplanning welfare-related transportation.
••••• Chapter 4 provides guidance on gathering basic background data on welfareparticipants and their transportation needs.
••••• Chapter 5 describes various approaches to defining unmet transportationneeds, including quantitative statistical analysis and qualitative data review.
••••• Chapter 6 describes various strategies for service implementation.
••••• Chapter 7 summarizes the steps needed to develop a service plan, programbudget, and funding plan and highlights potential funding sources.
Guidebook for Developing Welfare-to-Work Transportation Services
Page 1-3
••••• Chapter 8 discusses approaches to program evaluation and monitoringresults.
Part 3 presents the case studies documenting exemplary welfare-relatedtransportation programs.
••••• Chapter 9 profiles the new partnerships that have emerged withcommunity- and faith-based programs.
••••• Chapter 10 highlights programs sponsored by transportation, planning, andsocial services agencies.
Part 4 synthesizes the research findings and summarizes elements common tosuccessful programs.
••••• Chapter 11 summarizes lessons learned.
Appendices include relevant source materials, sample forms, and guides toadditional resources.
CHAPTER 2
Issues and NeedsIn 1996, federal welfare reform legislation created a new emphasis on movingindividuals from welfare to work. The Personal Responsibility and WorkOpportunity Reconciliation Act replaced the Aid for Families with DependentChildren (AFDC) program with block grant funding and mandatory workrequirements. The new welfare program, which shifted many administrative andpolicy responsibilities to the state level, imposed a five-year lifetime limit onwelfare benefits and a two-year deadline for placing most recipients in jobs, jobtraining, or vocational education programs.
Welfare reform legislation changed the structure of the U.S. welfare system.The strengthened emphasis on moving individuals from welfare to work has hadsignificant implications for a wide range of support services, from child care tojob training to transportation. Many welfare recipients have difficulty obtainingreliable, affordable, and convenient transportation alternatives. The majority ofwelfare recipients do not own a car, and many entry-level jobs are located in thesuburbs, well beyond easy transit access. Compounding the problem, employersmay require individuals to work night and weekend shifts, and parents may haveto coordinate work transportation with child-care responsibilities.
Solving the transportation problem has required new collaborations amongpublic agencies and private organizations, innovative services, and creativefunding strategies. This section summarizes the transportation barriers thatwelfare recipients face and the implications for travel planning and programdevelopment.
Transportation Barriers for Welfare RecipientsThe commuting difficulties faced by individuals making the transition fromwelfare to work have been widely documented. Some of the information isanecdotal; consider the following examples.
• In Louisville, Kentucky, a woman worked in a suburban hospital on the 3:00p.m. to 11:00 p.m. shift. While she could take the bus to work in theafternoon, no public transportation was available for her return trip at night.
Transit Cooperative Research Program
Page 2-2
Instead, she had to choose between walking for four hours or riding a bicyclefor two hours — both of which required travel on suburban roads with limitedvisibility.
• Cathie J. was a single mother in Vermont who raised three children onwelfare after her divorce. When her children were grown, she enrolled in atraining program and was hired as a pharmacy technician in Burlington. Fora while she was able to drive a car that a friend had given her. But after thecar broke down, she had to rely on her retired uncle to drive her to work – aforty-minute round trip twice a day.1
• In rural Virginia, a public assistance recipient takes transit to her job at aday-care center – one way only. Because the local transit system offers nomid-day service, she must walk home from work, take a taxi, or depend onrelatives. Her three children use a cab to reach their day care at a cost of $70a month; a relative picks them up in the evening to save the cab fare.2
• “Transportation is a problem because I have had a bad experience before,”said a Chinese-speaking woman in Oakland, California. “One time, I waswaiting for a bus for one and a half hour. Another time, I was waiting for thebus with my two small children and I got robbed.”3
Stories like these highlight the transportation challenges that many welfarerecipients face in finding and keeping jobs – multiple bus trips, incompatibleschedules, long walks to suburban job sites, concerns about safety, reliance onfriends and relatives, and expensive taxi rides.
Survey data and statistical analyses have also documented the challengesassociated with providing transportation to welfare recipients. The following is anoverview of these various transportation barriers that welfare clients face.
Access to Transportation ServicesMost welfare recipients do not own automobiles. The U.S. Department of Healthand Human Services has estimated that, on average, about 7 percent of familiesreceiving TANF benefits own an automobile and that these vehicles had anaverage reported value of $895.4 This national average shows significant localvariation, however. California alone accounted for more than one-half of thereported automobiles and ownership rates exceeded 20 percent in Kentucky,Kansas, and Hawaii. In contrast, fewer than 1 percent of TANF familiesreported autos in states like New York, Maryland, and Michigan. While thesestatewide averages can provide a snapshot of automobile availability, thenumbers should be interpreted with caution. Until recently, families receivingwelfare benefits were limited to one car valued at less than $1,500. Most stateshave increased this asset ceiling, but participants may still under-report thenumber and value of household automobiles.
Guidebook for Developing Welfare-to-Work Transportation Services
Page 2-3
Without cars, welfare clientsmust rely on other modes oftransportation – walking,bicycling, sharing rides withfriends and relatives, and,when available, mass transit.Urban residents generally haveaccess to mass transit services.For example, in Essex County,New Jersey, which includesNewark, it has been estimatedthat 98 percent of welfareclients live within a five-minutewalk of a bus route (calculatedas one-quarter mile) and alllive within a mile of busservice.5 In rural andsuburban areas, however, thepicture changes noticeably.Some 38 percent of ruralresidents live in areas withoutany public transit service andanother 28 percent live in areas with negligible service.7 Suburbs fallsomewhere in between. Looking this time at some of New Jersey’s suburbancounties, it has been estimated that 50-70 percent of welfare clients live within afive-minute walk of transit in places like Somerset, Gloucester, and MiddlesexCounties.8
As the next sections show, however, living near transit is only part of thesolution. Given changes in employment and commuting patterns, the transitservices available to welfare clients may not take them where they need to go orwhen they have to get there.
Spatial MismatchGrowth in America’s suburbs has had profound impacts on transportation andland-use patterns in the last several decades. Residents and jobs have bothmoved from the nation’s center cities into surrounding suburbs, while transitsystems have not kept pace. Between 1980 and 1990, the nation’s suburbsgained 17.5 million people while the central cities lost 500,000.9 Suburbanemployment has also grown in the last few decades, again at the expense ofcentral cities. Between 1967 and 1987, Philadelphia lost 64 percent of itsmanufacturing jobs, and Chicago, New York City, and Detroit each lost morethan half. In many cases, these jobs were relocated from the center city to thesuburbs. In Detroit, for example, the city lost 100,000 jobs during the 1980s,
Where Do WelfareRecipients Live?Welfare recipients overwhelminglylive in the nation’s metropolitanareas, but not necessarily thecenter cities. In 1993, the CensusBureau looked at thecharacteristics of women ofchildbearing age (defined as 15-44years) receiving AFDC benefits.Among these women, who makeup the majority of people onwelfare, 56 percent lived in centercities, 25 percent in suburbs, and19 percent in rural areas.6
Transit Cooperative Research Program
Page 2-4
while the surrounding suburbs gained 250,000 jobs.10 Nationally, nearly two-thirds of new jobs created during the 1980s were located in the suburbs.11 Andby 1990, the suburban share of jobs grew from 37 percent to 42 percent.12
Many of these suburban jobs would be quite attractive to welfare recipients – ifthey could get there. Unfortunately, most transit systems focus on urbantransportation needs, placing many of these jobs out of reach for prospectiveemployees without cars. Even when suburban employers are located withinwalking distance of transit – and transit schedules match work shifts – trips tendto be long, they may require transfers, and the walk from transit to the job sitemay not be pedestrian friendly.
Researchers in Ohio were among the first to document this gap betweensuburban jobs and available transit services. Using geographic informationsystems (GIS) software, they examined transit routes serving Clevelandneighborhoods with high concentrations of public assistance recipients. Theirstudy found that residents from these areas could not easily reach jobs thatmatched their skill levels. Inner-city residents with cars could reach about one-third of the available jobs in about 20 minutes; doubling their travel time gavethem access to about three-quarters of the job openings. For those withoutvehicles, however, access worsened significantly. With a 40-minute commute ontransit, inner-city residents could reach 8-15 percent of the appropriate jobs inthe metropolitan area. Doubling their commute time to 80 minutes, theseresidents were only able to reach 40-44 percent of the appropriate jobopenings.13
Other studies have identified similar examples of the “spatial mismatch” betweensuburban job opportunities and concentrations of unemployed city residents. Inthe Atlanta metropolitan area, researchers determined that only 43 percent ofentry-level jobs in Cobb County were accessible by transit, and most of theserequired a 1- to 2-hour commute.14 Another study showed that welfare clientsliving in Boston could reach just 14 percent of employers in a job-rich suburbanemployment center within 60 minutes by transit – and none within 30 minutes.Even more discouraging, nearly one-half of these employers could not bereached by transit within 2 hours.
It is important to recognize that these analyses of spatial mismatch generallyreflect the availability of fixed-route transit. When more flexible forms oftransportation are considered, including ridesharing and demand-responseservices, access may improve considerably. For example, a study of twodisadvantaged communities in the Los Angeles area showed that more workersused carpools than transit for their work trips.15 Such analyses indicate theimportance of considering the role of flexible services in addition to conventionalfixed-route transit when providing welfare-to-work transportation.
Guidebook for Developing Welfare-to-Work Transportation Services
Page 2-5
Temporal MismatchAccording to the U.S. Department of Labor, about 15.2 million people – almost17 percent of full-time adult workers – normally worked a shift other than aregular daytime schedule in 1997.16 Nontraditional hours are particularlyprevalent in the service industries, where many welfare recipients are expected tofind employment. These industries typically operate around the clock, 24 hoursa day, 7 days a week (popularly referred to as “24/7”), and many entry-levelemployees are assigned to the second and third shifts and/or weekend work. Forexample, 42 percent of full-time workers in bars and restaurants workednontraditional shifts in 1997, as did 35 percent of employees in theentertainment and recreation fields, and 28 percent of those working in retailestablishments.17
These work schedules are particularly difficult to serve with transit. Most systemsdo not operate 24 hours a day, and many offer limited weekend and eveningservice – especially in rural and suburban areas. This temporal mismatch leavesmany welfare recipients without the benefit of public transportation to travel toand from their places of employment.
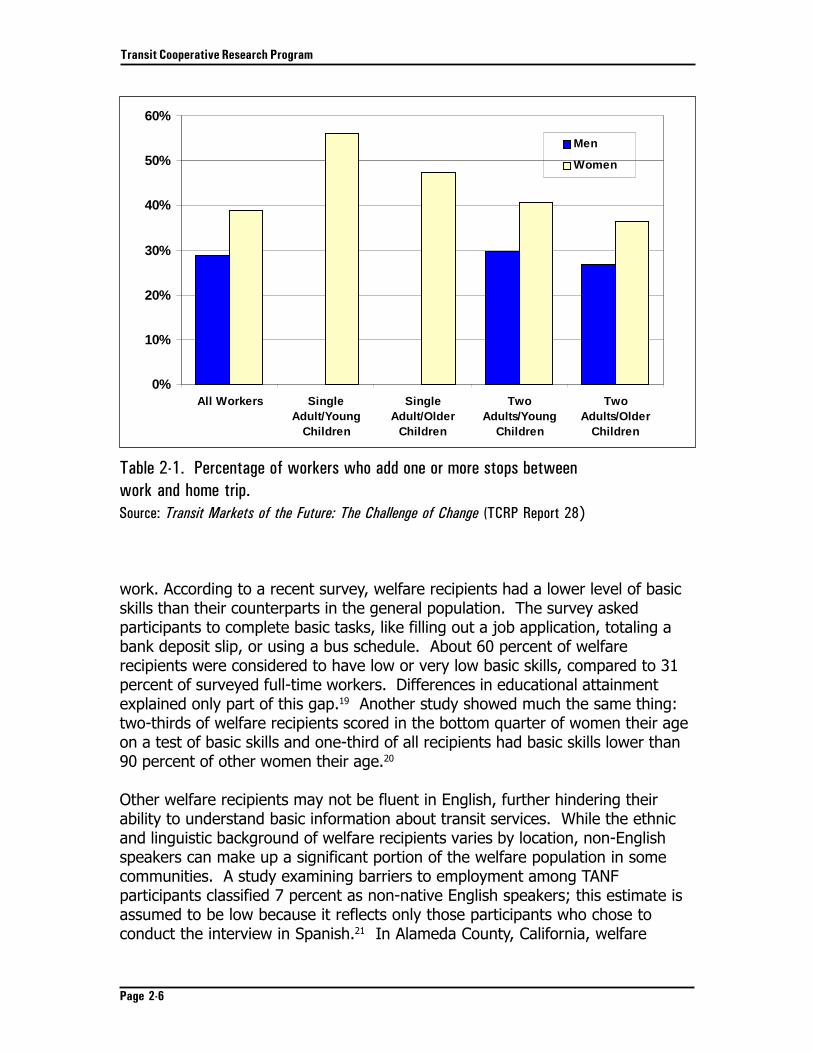
Trip ChainingAnother challenge of providing transportation service to the welfare population isthe need to serve multiple stops. According to the U.S. Department of Labor,most welfare recipients are single mothers. As Table 2-1 shows, womenworkers in general – and working mothers in particular – are likely to link tripstogether, by dropping off children at school or day care on the way to work orstopping at the grocery store on the way home. Survey research has shown thatabout 39 percent of working women incorporate one or more stops betweenwork and home; this increases to 56 percent of single mothers with youngchildren. 18 This action of linking one or more trips together, known totransportation planners as “trip chaining,” has significant implications fortransportation. Transit passengers cannot easily make multiple trips, given theneed to coordinate several schedules and possibly pay more than one fare. Notsurprisingly, then, trip chaining has been associated with increased auto use.
Information GapsInformation about transportation services may be difficult for welfare clients andtheir caseworkers to obtain or to understand. Such information gaps may resultfrom the need to travel between jurisdictions or service areas or to understandcomplicated fare arrangements. Sometimes difficulties arise because welfarerecipients have trouble reading bus schedules or route maps because of literacyor language problems.
Although the majority of welfare recipients have completed high school, manylack the basic skills they need to address day-to-day problems at home or at
Transit Cooperative Research Program
Page 2-6
work. According to a recent survey, welfare recipients had a lower level of basicskills than their counterparts in the general population. The survey askedparticipants to complete basic tasks, like filling out a job application, totaling abank deposit slip, or using a bus schedule. About 60 percent of welfarerecipients were considered to have low or very low basic skills, compared to 31percent of surveyed full-time workers. Differences in educational attainmentexplained only part of this gap.19 Another study showed much the same thing:two-thirds of welfare recipients scored in the bottom quarter of women their ageon a test of basic skills and one-third of all recipients had basic skills lower than90 percent of other women their age.20
Other welfare recipients may not be fluent in English, further hindering theirability to understand basic information about transit services. While the ethnicand linguistic background of welfare recipients varies by location, non-Englishspeakers can make up a significant portion of the welfare population in somecommunities. A study examining barriers to employment among TANFparticipants classified 7 percent as non-native English speakers; this estimate isassumed to be low because it reflects only those participants who chose toconduct the interview in Spanish.21 In Alameda County, California, welfare
Table 2-1. Percentage of workers who add one or more stops betweenwork and home trip.Source: Transit Markets of the Future: The Challenge of Change (TCRP Report 28)
0%
10%
20%
30%
40%
50%
60%
All Workers SingleAdult/Young
Children
SingleAdult/Older
Children
TwoAdults/Young
Children
TwoAdults/Older
Children
Men
Women
Guidebook for Developing Welfare-to-Work Transportation Services
Page 2-7
clients came in speaking more than 20 languages in a recent month; English wasby far the most common, at 79 percent of the cases, but other major linguisticgroups included Spanish (6%) and Vietnamese (5%).
Implications for TransportationThese, then, are some of the transportation barriers that welfare recipientsencounter:
• Nationally nearly three out of four welfare recipients live in center cities or inrural areas, while job growth has focused on the suburbs.
• Jobs in the retail and service industries typically require entry-levelemployees to work at night and on weekends.
• Most welfare recipients do not own cars.
• While urban residents generally have convenient access to transit services,those systems were never intended to get city dwellers to the suburbs –especially at night or on weekends.
• More than one-half of rural residents live in areas with minimal transit serviceor none at all.
• Women with young children – especially single mothers – are especially likelyto incorporate multiple stops into their work trips.
• Welfare recipients may have difficulty using a bus schedule.
It should come as no surprise, then, that transportation is a major barrier togetting or keeping a job. In a recent survey of former welfare participants, onein four identified transportation as one of the greatest obstacles to jobretention.22
States, counties, and communities have responded to this challenge with avariety of traditional and innovative strategies. The following chapters guide thereader through the planning and implementation process for developing welfare-related transportation services, using lessons from exemplary programs.
Notes1 Harriet Webster, “The Good News Garage.” Family Circle, Vol. 112, No. 9 (June 22, 1999), p. 16.
2 Jennine Miller. “Welfare Reform in Rural Areas: A Special Community Transportation Report.”Community Transportation. September/October 1997.
Transit Cooperative Research Program
Page 2-8
3 Selena Spain. Lower San Antonio Welfare to Work Partnership: Focus Group Results. NationalEconomic Development & Law Center, Oakland, California. September 1998.
4 U.S. Department of Health and Human Services, Administration for Children and Families.Temporary Assistance for Needy Families (TANF) Program: First Annual Report to Congress.August 1998. Table 7:16, “TANF Families with Countable Assets by Type of Asset, October 1996– June 1997.”
5 Richard K. Brail, Jeffrey Doshna, Sudha Maheshwari, Graciela Cavicchia, and Jia Wei. Assessmentof Public Transportation Opportunities for WorkFirst New Jersey Participants. Prepared for theOffice of Policy and Planning, New Jersey Department of Human Services. July 1997.
6 Bureau of the Census. “Mothers Who Receive AFDC Payments – Fertility and SocioeconomicCharacteristics.” Statistical Brief 95-2. March 1995.
7 Jon E. Burkhardt, James L. Hedrick, and Adam T. McGavock. Assessment of the Economic Impactsof Rural Public Transportation. TCRP Report 34. Transportation Research Board, National ResearchCouncil, Washington, DC. 1998.
8 Richard K. Brail, Jeffrey Doshna, Sudha Maheshwari, Graciela Cavicchia, and Jia Wei. Assessmentof Public Transportation Opportunities for WorkFirst New Jersey Participants. Prepared for theOffice of Policy and Planning, New Jersey Department of Human Services. July 1997.
9 Bureau of Transportation Statistics. Transportation Statistics Annual Report. 1997.
10 Scott Bogren. “Work Trips Take New Routes,” Community Transportation. November 1996.
11 Urbitran Associates, Inc., with Multisystems, Inc., SG Associates, Inc., and Robert Cervero, Ph.D.Improving Transit Connections for Enhanced Suburban Mobility. TCRP Project B-6. Unpublished.Phase I Interim Report: A Review of Current Practices to Enhance Suburban Mobility. August 1995.
12 Bureau of Transportation Statistics. Transportation Statistics Annual Report. 1997.
13 Claudia Coulton, Laura Leete, and Neil Bania. Housing, Transportation and Access to SuburbanJobs by Welfare Recipients in the Cleveland Area. Mandel School of Applied Social Sciences, CaseWestern Reserve University. Prepared for the Fannie Mae Foundation Policy Research Roundtable,Johns Hopkins University, Baltimore, Maryland. July 22, 1997.
14 Community Transportation Association of America. Access to Jobs: A Guide to InnovativePractices in Welfare-to-Work Transportation. Prepared pursuant to a grant from the Federal TransitAdministration. January 1998.
15 Jim McLaughlin and Jim Sims. “Integrated Rideshare Information Services with PublicTransportation Resources To Meet the Transportation Needs of Welfare to Work in Los AngelesCounty.” In Proceedings of the 1998 Bus Operations, Technology, and Management Conference.American Public Transit Association. May 1998.
Guidebook for Developing Welfare-to-Work Transportation Services
Page 2-9
16 Bureau of Labor Statistics. “Workers on Flexible and Shift Schedules in 1997 Summary.” Pressrelease issued on March 26, 1998.
17Bureau of Labor Statistics. “Workers on Flexible and Shift Schedules in 1997 Summary.” Press releaseissued on March 26, 1998.
18 Sandra Rosenbloom. Transit Markets of the Future: The Challenge of Change. TCRP Report 28.Transportation Research Board, National Research Council, Washington, DC. 1998.
19 Hans P. Johnson and Sonya M. Tafoya. “The Basic Skills of Welfare Recipients: Implications forWelfare Reform.” Copyright 1999 Public Policy Institute of California, San Francisco, CA. All rightsreserved. [Online] Available at www.ppic.org.
20 Julie Strawn. “Beyond Job Search or Basic Education: Rethinking the Role of Skills in WelfareReform.” Center for Law and Social Policy, April 1998. [Online] Available at www.clasp.org.
21 Sheila R. Zedlewski. “Work Activity and Obstacles to Work among TANF Recipients.” The UrbanInstitute. Assessing the New Federalism, Series B, N. B-2, September 1999. [Online] Available atwww.urban.org.
22 Anu Rangarajan. “Keeping Welfare Recipients Employed: A Guide for States Designing JobRetention Services.” Off Welfare and Into Work: A Report Series of the Postemployment ServicesDemonstration. Mathematica Policy Research, Inc., Princeton, NJ. June 1998. [Online] Available atwww.mathematica-mpr.com.

Part 2: Program Elements
CHAPTER 3
Partners in ChangeAs state and local governments have begun to address the challenges of welfarereform, new cooperative relationships have emerged. Partners in these newcollaborations have included transportation providers, human service agencies,departments of transportation, regional planning associations, community-basedorganizations, faith-based groups, workforce development agencies, employers,and educational institutions. Each group brings to the table a unique set ofissues, perspectives, and skills. Initially these partnerships may be reluctant,perhaps created by mandate; sometimes they can be characterized byskepticism and self-interest. But over time, perhaps with the guidance of acommitted leader, they can capitalize on common interests and diverse skills todevelop innovative solutions that help individuals make the transition fromwelfare to work. This chapter identifies the range of potential partners in theplanning process.
Coming to the TableIdentifying the right partners is the first step in a successful welfare-relatedtransportation planning process. These partners, often known as “stakeholders,”include representatives from agencies and organizations that have a vestedinterest in the outcome of the program. In Hartford, Connecticut, jobs accessplanners coined a phrase to describe their partnership. They referred tothemselves as a BORPSAT – a bunch of the right people sitting around the table.The expression has been widely copied and freely adapted. As one transitgeneral manager put it, “Get everybody to the table who will come.” A plannerat another agency added, “Err on the side of inclusion,” another planner added.“Invite individuals even if you don’t think they will participate. People come tothe table throughout the process.”
Stakeholders in the transportation planning process should be recruited toensure that the interests of both customers and service providers are bothrepresented. Ideally, those at the table should include decision-makers – orthose with direct access to decision-makers – since these individuals can moveprograms from plans to action. They may include any or all of the following:
••••• Transportation providers, including public and private transit andparatransit operators serving the general public and agency clients, vanpoolprograms, private shuttle operators, and taxi services
Transit Cooperative Research Program
Page 3-2
••••• Social service providers, including agencies administering TANF programbenefits and support services (e.g., training, placement, and child care)
••••• Employers and job developers, including representation from the areaprivate industry council or workforce investment board
••••• Community- and faith-based organizations that work with members ofthe targeted population and may have transportation resources available
••••• Planners, including representatives from metropolitan planning organizations(MPOs), councils of government (COGs), departments of transportation(DOTs), or state, county, or local planning departments
••••• Elected officials, who can play a key role in obtaining community andpolitical support for recommended programs
Many of these stakeholders may not have worked together before, and may notbe familiar with the special challenges of welfare-to-work transportation.Transportation providers, for example, may not have direct experience withserving the changing needs of welfare participants as they make the transitionfrom support services to employment. Caseworkers, on the other hand, may notbe familiar with the costs and operating characteristics of differenttransportation alternatives. And participants from the private sector may havelimited experience working with public funding sources. Through the planningprocess, stakeholders can share their specialized knowledge as they developtransportation strategies that incorporate the best elements of their differingdisciplines.
These partnerships, especially those achieved between transportation and socialservices providers, can also help change the direction of policy and regulations.In states or localities where welfare reform plans do not incorporatetransportation elements, the planning process may highlight the need to do so inthe future. Opportunities for better data collection and information sharing maysimilarly be identified, along with strategies for on-going program collaborationand coordination.
Some of the potential stakeholders and lead organizations in the transportationplanning process are described in the following sections.
Transportation ProvidersTransportation providers often have the technical expertise and the resourcesneeded to plan and implement a welfare-related transportation project. In someareas, transit operators have taken the lead. For example, the Transit Authorityof River City (TARC) operates a late-night subscription service in Louisville,Kentucky. As a regional transit operator, TARC already had much of the
Guidebook for Developing Welfare-to-Work Transportation Services
Page 3-3
organizational and management infrastructure required to introduce this newservice. Similarly, the Santee Wateree Regional Transportation Authority wasable to expand its on-going service for Medicaid clients to serve low-incomeworkers at no additional cost by using existing vehicles and drivers. Some transitagencies have provided key support by donatingtechnical assistance or physical assets. In Baltimore,for instance, the Maryland Mass TransitAdministration (MTA) donated three vans to thefleet for the AdVANtage II program, which helpedlow-income individuals operate transportationservices. The MTA staff also provided technicaladvice to project staff as they purchased additionalvehicles for their fleet.
Social Service ProvidersAs the agencies that work most closely with TANF recipients, social serviceproviders have a clear understanding of the issues and obstacles of welfare-related transportation. Some social service agencies have taken the lead indeveloping welfare-related transportation programs. In suburban Maryland, theAnne Arundel County Department of Social Services helped develop andimplement the AdVANtage micro-enterprise program to train and subsidize publicassistance recipients to offer transportation services to other DSS recipients foremployment-related activities. The Contra Costa County Social ServicesDepartment, in California, is administering a similar program designed to trainwelfare participants to provide community transportation services, includingtransportation to school and child care.
Departments of TransportationDOTs can bring to the table their detailed understanding of area transportationconditions and resources. At the state level, DOTs may oversee planning andoperations for multiple transportation modes, including transit, highway, andridesharing programs, which gives them a unique perspective on the potentialopportunities for developing coordinated strategies for welfare-relatedtransportation. DOTs also have access to various funding sources that may haveapplications for welfare-related programs. Finally, in rural areas, DOTs canserve as regional planning agencies and provide support and coordination forlocal communities and agencies to develop welfare-related transportationprograms. For example, the Wisconsin DOT worked with the Department ofWorkforce Development to create an Interdepartmental Task Force onEmployment and Transportation to encourage on-going dialogue betweendepartments, coordinate activities, and identify issues associated with welfare-related transportation. Similarly, the South Carolina DOT has established anInteragency Steering Committee on Coordinated Transit with a goal of improvingtransportation services throughout the state. Among other activities, the
Transit Cooperative Research Program
Page 3-4
committee used its influence to allocate federal program funds in KershawCounty to support the local Flex Route system.
Planning AgenciesRegional and local planning organizations oftenhave experience coordinating complex projectsand frequently participate in welfare-to-workplanning efforts. MPOs, in particular, have acentral role to play in developing welfare-relatedtransportation programs. MPOs, which consist ofelected officials and transportation providerswithin a metropolitan area, are responsible foradopting regional transportation plans andimprovement programs. In many parts of thecountry, MPOs maintain regional databases with Census information and otherrelevant statistical data. Moreover, the Federal Transit Administration (FTA) hasrequired MPO participation in the Job Access and Reverse Commute program.In large urban areas (with more than 200,000 people), MPOs are responsible forselecting applicant programs for federal consideration; in smaller areas (between50,000 and 200,000 people), MPOs recommend projects to the state, whichselects the final applicants. In addition, all projects receiving federal fundsunder this program must be included in the MPO’s Transportation Programbefore receiving the grant.
This regional perspective and planning experience often makes theseorganizations well qualified to lead welfare-to-work programs. For example, thePinellas County Metropolitan Planning Organization administers this Floridacounty’s welfare-to-work transportation program. With state designation as theCommunity Transportation Coordinator for the county, the MPO becameresponsible for managing the county’s services for transportation disadvantagedresidents. As the cooperative transportation planning committee for sixjurisdictions in Central Contra Costa County, California, TransPac hasimplemented a series of trip planning activities and ridesharing incentives.Finally, in Massachusetts, the Metropolitan Area Planning Council is coordinatingwelfare-related transportation activities in the Boston region; programs includeexpanded job counseling, transit incentives, and an Internet-based transit tripplanner.
Private Industry CouncilsOrganized under the federal Job Training Partnership Act, private industrycouncils (PICs) were charged originally with planning and overseeing education,job training, and employment programs for low-income individuals. Recentlythey have emerged as key players in welfare-to-work planning and programs.
Guidebook for Developing Welfare-to-Work Transportation Services
Page 3-5
Congress awarded PICs almost $3 billion tooversee local welfare-to-work efforts, and theU.S. Department of Labor has identified PICs asone of the organizations eligible to receiveWelfare-to-Work funds. PIC membership isdrawn from both the public and private sectors,but private employers must make up themajority of PIC membership. Because they arerepresentative of all sectors of the community,these public-private partnerships can helpfacilitate relationships among transportationproviders, social service agencies, andemployers.
Community-Based OrganizationsCommunity-based organizations are especially well-positioned to participate inwelfare reform activities. These groups, with close ties to their constituents, canhelp bridge the gap between welfare consumers and the sometimes facelessbureaucracies that deliver services and benefits. The East Bay Asian LocalDevelopment Corporation (EBALDC), a nonprofit group in Oakland, California, iscoordinating a welfare-related transportation program that trains counselors atcommunity-based organizations to provide trip planning services forneighborhood TANF recipients. The transportation counselors share a languageand culture with their clients, many of whom are recent immigrants, creating anatmosphere of trust and support. The San Diego/Imperial Chapter of theAmerican Red Cross made its fleet of buses, which are owned and operated byregional social services agencies, available to provide welfare-relatedtransportation. In Maryland, the Anne Arundel County Department of SocialServices collaborated with local branches of the Young Women’s ChristianAssociation (YWCA) to develop and implement a transportation micro-enterpriseprogram that trained public assistance recipients to operate community-basedtransportation services. The YWCAs, with their long history of supporting womenin the community, provided training, social support structure, and follow-up withprogram participants.
Faith-Based OrganizationsLike community groups, faith-based organizations have a long tradition ofsupporting people in need. Welfare reform has brought new opportunities forreligious congregations and groups such as Catholic Charities and Jewish FamilyServices to work in partnership with communities and government organizationsto provide support services for TANF participants. In Vermont, Lutheran SocialServices of New England provided start-up funding and on-going support for theGood News Garage, which makes automobiles available to low-income residents.
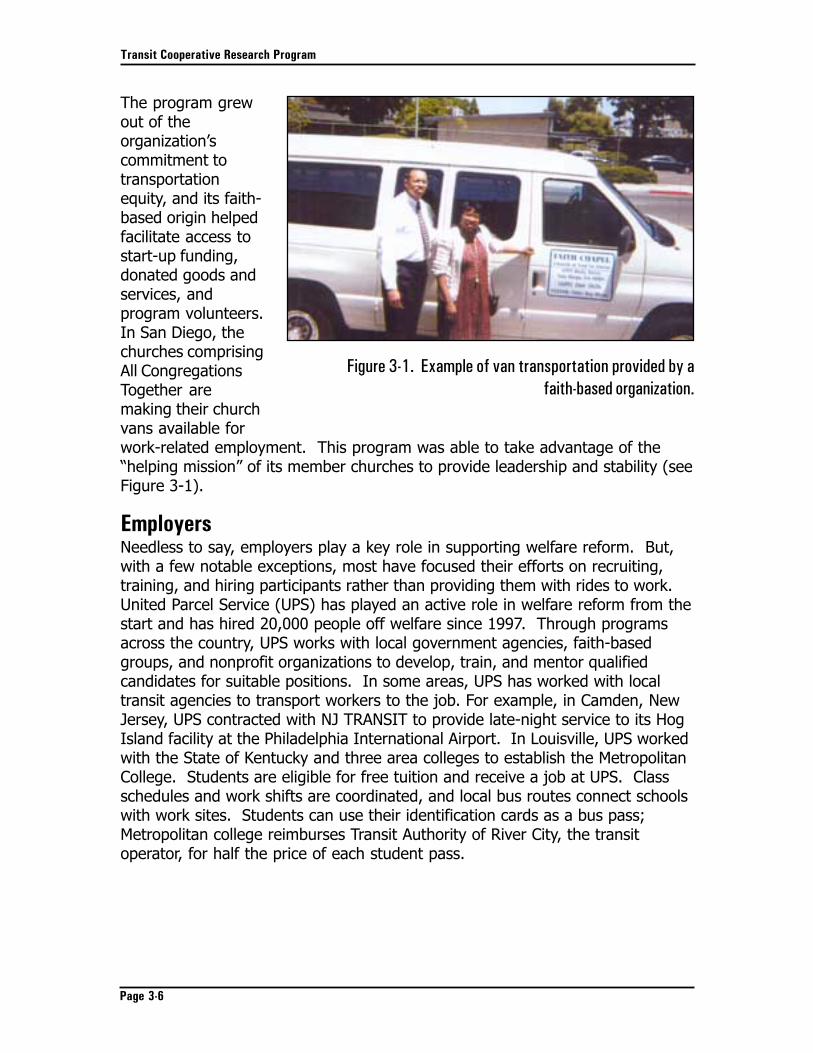
Transit Cooperative Research Program
Page 3-6
The program grewout of theorganization’scommitment totransportationequity, and its faith-based origin helpedfacilitate access tostart-up funding,donated goods andservices, andprogram volunteers.In San Diego, thechurches comprisingAll CongregationsTogether aremaking their churchvans available forwork-related employment. This program was able to take advantage of the“helping mission” of its member churches to provide leadership and stability (seeFigure 3-1).
EmployersNeedless to say, employers play a key role in supporting welfare reform. But,with a few notable exceptions, most have focused their efforts on recruiting,training, and hiring participants rather than providing them with rides to work.United Parcel Service (UPS) has played an active role in welfare reform from thestart and has hired 20,000 people off welfare since 1997. Through programsacross the country, UPS works with local government agencies, faith-basedgroups, and nonprofit organizations to develop, train, and mentor qualifiedcandidates for suitable positions. In some areas, UPS has worked with localtransit agencies to transport workers to the job. For example, in Camden, NewJersey, UPS contracted with NJ TRANSIT to provide late-night service to its HogIsland facility at the Philadelphia International Airport. In Louisville, UPS workedwith the State of Kentucky and three area colleges to establish the MetropolitanCollege. Students are eligible for free tuition and receive a job at UPS. Classschedules and work shifts are coordinated, and local bus routes connect schoolswith work sites. Students can use their identification cards as a bus pass;Metropolitan college reimburses Transit Authority of River City, the transitoperator, for half the price of each student pass.
Figure 3-1. Example of van transportation provided by afaith-based organization.
Guidebook for Developing Welfare-to-Work Transportation Services
Page 3-7
Achieving ConsensusIdentifying stakeholders is just the first step in the planning process. Theseindividuals and the organizations they represent must work together to movetheir ideas into reality. Strong and committed leadership can help ensure thatthe differences among participants work to enrich the process. Leaders may beappointed by the oversight organization (such as a state department of humanservices), or the stakeholders themselves may select a chairman. Sometimesthe leadership of a single individual helps to carry the project; in other cases, anagency or organization can carry the banner. Regardless of who takes the lead,the right program champion can move a program from concept to success.
The first test of the group process is achieving consensus on a set of goals andobjectives to guide program development and implementation. Goals andobjectives serve two major purposes. First, they define the steps and actionsneeded to accomplish the program. And, second, they define specific measuresfor tracking program performance
Goals are intended to set overall direction for a program. For example, aprogram may have as a goal: “To provide TANF participants with affordabletransportation alternatives.”
Effective goals incorporate the following characteristics:
••••• Be specific – Can you determine whether you have accomplished the goal?
••••• Be measurable – Can you track progress toward the goal?
••••• Reflect consensus – Does the goal distill the diverse perspectives of theprogram stakeholders?
••••• Set a time frame – Does the goal include a target date for achieving theintended action?
••••• Be realistic – Does the group have the legal or jurisdictional authority toaccomplish this goal?
••••• Be challenging – Does the goal encourage stakeholders to move beyondthe status quo and realize new accomplishments?
Objectives are the steps taken to accomplish each goal. They are quitespecific in nature and represent individual milestones along the path toaccomplish a goal. For example, one objective associated with the preceding
Transit Cooperative Research Program
Page 3-8
goal might be: “To subsidize out-of-pocket expenditures for TANF clients.”Objectives should be measurable by quantitative or qualitative means tofacilitate on-going program evaluation.
During the early phases of project planning, goals and objectives will help definethe basic program elements – such as the targeted customers – and guide theneeds assessment process. During program implementation, the goals andobjectives will help define the evaluation process. And throughout programplanning and development, the goals and objectives will help keep participantsand stakeholders moving along a single path and focused on the projectoutcome. The next several chapters describe these steps in program planning,implementation, and evaluation.
CHAPTER 4
Identifying Data ElementsPlanning a welfare-to-work transportation program typically begins with a needsassessment. A needs assessment is intended to answer the following questions:
• Who are the target transportation customers?
• Where are job opportunities located?
• Where are support services located?
• What transportation alternatives are available to them now?
• What transportation barriers do they face?
This chapter summarizes the data elements commonly associated with welfare-to-work planning and potential data sources. This information will allow plannersto assess travel patterns and needs of welfare recipients and to identify thetransportation resources currently available to them.
Target PopulationThe project should clearly define its target market. Potential customers forwelfare-related transportation services may include any or all of the following:
• Current TANF clients participating in job search and work-related activities
• Former TANF clients who have made the transition to employment
• “Hard-to-serve” TANF clients eligible for U.S. Department of Labor Welfare-to-Work programs
• Children of current and former TANF clients
• Agency clients, including recipients of General Assistance and Medicaid
• Low-income individuals
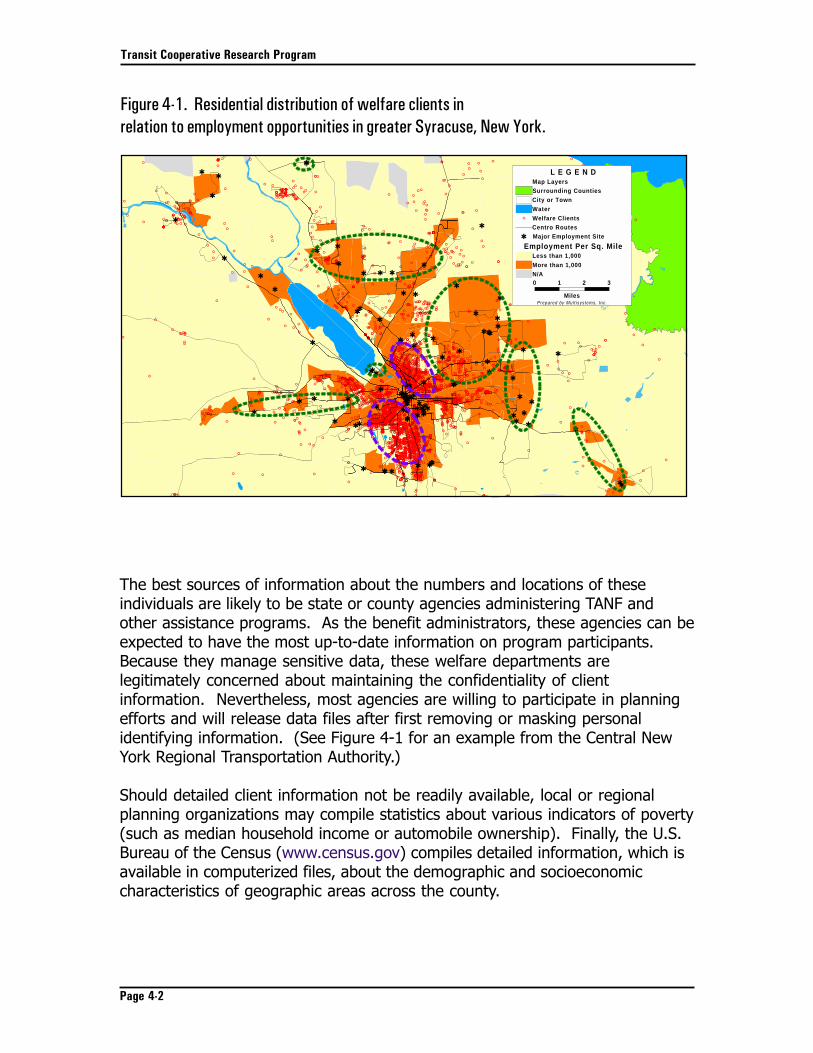
Transit Cooperative Research Program
Page 4-2
The best sources of information about the numbers and locations of theseindividuals are likely to be state or county agencies administering TANF andother assistance programs. As the benefit administrators, these agencies can beexpected to have the most up-to-date information on program participants.Because they manage sensitive data, these welfare departments arelegitimately concerned about maintaining the confidentiality of clientinformation. Nevertheless, most agencies are willing to participate in planningefforts and will release data files after first removing or masking personalidentifying information. (See Figure 4-1 for an example from the Central NewYork Regional Transportation Authority.)
Should detailed client information not be readily available, local or regionalplanning organizations may compile statistics about various indicators of poverty(such as median household income or automobile ownership). Finally, the U.S.Bureau of the Census (www.census.gov) compiles detailed information, which isavailable in computerized files, about the demographic and socioeconomiccharacteristics of geographic areas across the county.
Figure 4-1. Residential distribution of welfare clients inrelation to employment opportunities in greater Syracuse, New York.
%
%
%
%
%%%%
%
%
%%
% %%%%%%%
%%%
%
%
%
%%
%%%%%%
%
%
%
%
%
%
%
%%%%%%%%
%%%%%%%
%%
%%%%%%%
%
%%%
%
%
%%
%
%%%%%%
%%
%%%%%%%%%%
%%
%
%
%
%
%
%
%
%
%
%
%%%%%%%
%
%%
%
%
%
%
%%
%%%%
%
%%
%
%
%%%%%%
%
%%%%
%
%
% %
%
%%%
%%
%
%%%
%%
%%%
%%%
%% %%%%
%
%
%
%
%
%%
%
%
%
%
%
%
%
%%
%%
%%%%%%%%%%%%%%%%
%
%%%%
%
%%
%
%
%
%
%%
%
%
%%
%%%
%
%%%%
%
%
%%%%
%%%
%
%%%%%%%%%%%
%%%%%%%%%%%
%%%%
%%%%%%
%%%%%%%
%%%%%
%%%%
%
%%%%%%%
%%%%%%%%%%
%%%
%%%%%%%%%%%%%%%%%%
%%%%
%%%%%%%%%
%%%%%%%%%%%%
%
%
%%
%
%
%%
%%%%%
%%%%%
%%%%%%%%%
%
%%%%%%%
%%%%%%%%%
%
%
%%%%%%%
%%%%%%%%%%%%%
%%%%%%%%%%%%%
%%%%%%%
%%%%%%%%
%%%%
%%%%%%%%%%%%%%%%%%%%%%%%%%%%%%%%%%%%%%%%%%%%
%%%%%%%%%%%%%%%%%%%%%%%
%%%%%%%%%%%%%%%%%%%%
%%%%%%%%%%%%
%%%%%%%%%%%%%%%%%%%%%%%%%%%%%%
%%%%%%%%%%%%%%%%%%%%%%%%%
%%%%%%%%%%%%
%%%%%%%%%%%%%%%%%%%%%%%%%%%%
%%%%%%%%%%%%%%%%%%%%%%%%%%%%%%%%
%%
%%%%%
%%
%%%%%%%
%%%
%%
%%%%%%%%%%%%%%
%%%%%%%%%%%%%%%%%%%%%%%%%%%%%%%%%%
%%%%%%%%%%%%%%
%%%%%%%%%
%%%%%%%%%%%%%%%%%%%
%%%%%%%%%%%%%%%%%%%%
%%%%%%%%%%%%%%%%%%%%%%%%%%%%%%%%%%%%%%%%%%%%%%%%%%%%%%%%
%%%%%%%%%%%%%%%%%%%%%%%%%%%%%%%%%%%%%%%%%%%%%%%%%%%%%%%%%%%%%%%%%%%%
%%%%%%%%%%%%%%%%%%%%%%%%%%%%%%%%%%%%%%%%
%%%%%%%%%%%%%%%%%%
%%
% %%%%%%%%%%%%%%%%
%%%%%%%%%
%%%%%%%%%%%%%
%%%%%%%%%%%%%%%%%%%%%%%%%%%%%%
%%%%%%%%%%%%%%%%%%%%%%%%%%%%%%%%%%%%%%%%%%%%%%%%%%%%%%%%%
%%%%%%%%%%%%%
%%%%%%%%%%
%%%%%%%%%%%%%%%%%
%%%%%%%%%
%%%%%%%%%%%%%%%%%%%%
%%%%%%%%%%%%%%%%%%%%%%%
%%%%%%%%%%%%%%%%%
%%%%%%%%%%%%%%%%%%%%%%%%%%%%%%%%%%%%%%%%%%%%%%%%%%%%%%%%%%%%%%%%%%
%%%%%%%%%%%%%%%%%%%%%%%%%%%%%%%%%%
%%%%%%%%%%%%%%%%%%%
%%%%%%%%%%%%
%%%%%%%%%%%%%%%%%%%%%%%%%
%%%%%%%%%%%%%%%%%%%%%%%%%%%%%%%%%%%%%%%
%%%%%%%%%%%%%%%%%%
%%%%%%%%%%%%%%%%%%%%%%%%%%%%%%%%%%%%%%%%%
%
%%%%%%%%%
%%%%%%%%%%%%%%%%%%%%%%%%%%%%
%%%%%
%%%%%%%%%%%%
%%%%%%%%%%%%%%%%%%%%%%%%%%
%%%%%%%%%%%%%%%%%%%%
%%%%%%%%%%%%%%%%%%%%%
%%%%%%%%%%%
%%%%%%%%%%%%%%%%%%%%%%%%%
%%%%%%%%%%%%%%%%%%%%%%%%%%%%%%%%%%%%%%%
%%%%%%%%%%%%%%%
%%%%%
%%%%%%%%%%%%%%%%%%%%%%%%%%%%%%%%%%%%%%%%%%%%%%%%%%%%%%%%%%%%%%%%%%%%
%%%%%%%%%%%%%%%%%%%%%%%%%%%%%%%%
%%%%%%%%
%%%%%%%%%%%%
%%%%%%%%%%%%%%%%%%%%%%%%%%%%%%%%%%%
%%%%%%%%%%%%%%%%%%%%
%%%%%%%%%%%%%%%%%%%%%%%%%%%%%%%%%%
%
%%%%%%%%%%%%%%%
%%%
%%%%%%%%%%%%%%
%%%%%%%%%%%%%%%%%%%%%%%%%%%%%%%%%%%%%%%%%%%%%%%%%%%%%%
%%
%
%%%%%
%%%
%
%% %%
%
%%
%%%%%%
%%
%%
%
% %%
%%%%%
%%%%%%%%
%%%%%
%%%%%%%%%%%%%%%%%%%%
%%
%%
%%%%% %
%%
%
%
%
%%%%%%%%%%%%%%%%%%%%%%%%%%%%%
%%%%%%%%%%%%%%%
%%%%%%%%%%%%%%%%%%%%%%
%%%%%%%%%%%%%
%%%%%%%%%%%%%%%%%%%%%%%%%%%%%%%%%%%%%%%%%%%%%%%%
%%%%%%%%%%%%%%%%%%%%%%%%%%%%%%%%%%%%%%%%%%%%
%%%%%%%%%%%%%%%%%%%%%%%%%%%%%%%%%%%%%
%%%%%%%%%
%%%%%%%%%
%
%
%%%%%%%%%%%%
%%%%%%%%%%%%%%%
%%%%%
%
%%%%
%
%%%
%%
%
%
%
%
%
%
%
%
%%%%
%%%
%
%%%
%
% %
%%
%
%%%%%%%
%%%%%%%%%%%%
% %
%%
%
%
%%
% %
%%
%
%%
%
%
%% %
%%%%%%%%%%%%%%%%%%%%%%%%%%%
%%%%%%%%%%%%
% %
%
%
%
%%
%%
%
%%%
%%%%%%%%%%%%%%%%%%%%%%%%%%%%%
%
%
%%%%%%%%%%
%
%%
% %%%%
%%%%%%
%%%%%%%%
%%
%
%%
%
%%
%%
%
%
%
%
%
%%%%% %%%%%%%%%
%%%%%
%
%
%%%%%%
%%%%%%%%%%%
%%%%%%%%%%%
%
%%%%%%%%%%
%%%%%%%%%
%%%%%%%%%%%%%%%%%%%%%%%%%%%%%%
%%
%%%%%%%%%%%%%%%%%%%%%%%%%%%%%%%%%%%%%%%%
%%%%%%%%%%%%%%%%%%%%%%%%%%%%%%%%%%%
%%%%%%%%%%%%%
%%%%%%%%%%%%%%%%%%%%%%%%%%%
%%%%%%%%%%%%%%%%%%%%%%
%%%%%%%%%%%%%%%%%%%%%%%%%%%%%
%%%%%%%%%%%%%%%%%%%%%%%%%%%%%%%%%%%%%%%%%%%%%%%%%%%%%%%%%%%%%%%
%%%%%%%%%%%%%%%%%%%%%%%%%%%%%
%%%%%%%%%%%%%%%%%%%%%%%%%%%%%%%%%
%%%
%%%%%%%%%%%%%%%%%%%%%%%%%%%%%%%%%%
%%%%%%%%%%
%%%%%%%%%%%%
%%%%%%%%%%%%%%%
%%%%%%%%%%%
%%%%
%
%%%%%%%%%%%%%%%%%%%
%%%%%%%%%%%%%%
%%%%%%%%%%%%
%%%%%%%%%%%%%%%%%%%
%%%%%%%%%%%%%%%%%%%%%%
%%%%%%
%%%%%
%%%%%%%%%%%
%%%%%%%%%%%%%%%%%%%
%%%%%%%%%%%%%%%%%%%%%%%
%%%%%%%%%%%%%%%%%%%%%%%%%%%%%%
%%%%%%%%%%%%%%%%%%%%%%%%
%%%%%%%%%%%%%%%%%%%%
%%%%%%%%%%%%%%%%%
%%
%%%%%%%%%%%%%%%%%%%%%%%%%%%%%%%%%%%%%%%%%%%%%%%%%%%
%%%%%%%%%%%%%%%%%%%%%%%
%%%%%%%
%%%%%%%%%%%%%%%%%%%
%%%%%%%%
%%%%
%%%%%%%%%%%%%%%%%%%%%%%%%%%%%%%
%%%%%%%%%%%%%%%%%%%%%%%%%%%%%%%%%
%%%%%%%%%%%%%%%%%%%%%%%%%%%%%%%%%%
%%%%%%%%%%%%%%
%%%%
%%%%%%%%%%%%%%%%%%%%%%%%%%%%%%%%%%%%%%%%%%%%%%%%%%%%%%%%%%%%%%%%%%%%%%%%%%%%%%%%
%%%%%%%%%%%%%%%%%%%%%%%%%%%%%%%%%%%%%%%%%%%%%%%%%%%%%%%%%%%%%%%%%%%%%%%%%%
%%%%%%
%%%%%%%%%%%%%%%%%%%%%%%%%%%%%%%%%%%%%%%%%%%%%%%%%%%%%%%%%%
%%%%%%%%%%%%%%%%%%%%%
%%%%%%%%%%%%%%%%%%%%%%%%%%%%%%%%%%%%%%%
%%%%%%%%%%%%%%%%%%%%%%%%%
%
%%%%%%%%%%%
%%%%%%
%%%
%%%%%
%%%%%%%%%%%%%%%%%%%
%%%%%%%%%%%%%%%%%%%%%%%%%%%%%%%%%%%%%%%%%%%%%%%%
%%%%%%%%%%%%%%%%%%%%%%%%%%%%
%%%%%%%%%%%%%%%%%%%%%%%%%%%%%
%%%%%%%%%%%%
%%%%%
%%%%%%%%%%%%%%%%%%%%%%
%%%%%%%%%%%%
%%%%%%%%%%%%%%%%%%%%%%%%%%%%%%%%%%%%%%%%%
%%%%
%
%%%%%%%%%%%%%%%%%%%%%%%%
%
%%%
%
%
%%%%%%
%%%%%
%
%%%%%%%
%%%
%%%%%%%%
%%%%%%
%%%%%%%%%%
%%%%%
%%%%%%%%%%%%%%%%%%%%%%%%%%%%%%%%%
%%%%%%%%%%%%%%%%%%%%
%%%%%%%%
%%%%%%%%%%%%%%%%%%%%%%%%%%%%%%%
%%%
%%%%%%%%%%%%%%%%%%%%%%%%%
%%%
%%
%%%%%
%%%%
%%%%%%
%
%
%%%%%%% %
%%%%%%%%%%
%%%%%
%
%%%
%
%%%%%%%%%%%%%
%%%%%%%%%%%%%%%%%%%%%%%%%%%%
%%%%%%%%%%%%%%%%%%%%%%%%%%%%%%%%%%%%%%%%%%%%%%%%%%%%%%%%%%
%%%%%%%%%%%%%%%%%%%%%%%%%%%%%%%%%%%%%%%%%%%%%%%
%%%%%%%%%%%%%%%%%%%%%%%%%%%%%%%%
%%%%%%%%%%
%%%%%%%%%%%%%%%%%%%
%%%%%%%%%%%%%%%%%%%%%%%%%%%%
%%%%%%%
%%%%%%%%%%%%%%%%%%%%%%%%%%%%%%
%%%%%%%%%%%%%%
%%%%%
%%%%%%%
%%%%%
%%%%%
%%%%%%%%%%%%
%%%%%%%%%%%%%%%%%%%%%%%%%%
%%%%%%%%%%%%%%%%%%%%%%%%
%%%%%
%%%
%%%%%%%%%%%%%%%%%%%%%%%%%%%%%%%%%%
%%%%%%%%%%%%%
%%%%%%%%%%%%%%%%%%%%%%%%%%%
%%% %%%%%%%
%%%%%%%
%%%%%%%%%%%%%%%%%%
%%%%%%%
%%% %%%
%
%%%%%%
%%%%%%%%
%%
%%
%%%%%%%%%%%
%%%%%
%%%%%%%%%%
%%%
%% %
%%%%%%%%%%%%%%%%%%%%
%%%%%%
%%%%%%%
%%%%%
%
%%%%%%
%%
% %
%%%%
%
%%
%
%%
%%%%%%%
%
%
%%%%%%%%
%%%%%%%
%%
%%%%
%%%%
%%%%%
%%%
%%%%%%%
%%
%%
%%%
%%%%%%
%%%
%%%
%%%%%%%%%%%%%%%%%%%%
%%%%
%%%%
%%
%%
%%%%
%%%%
%%%%%%%
%%%%
%%%%%%%%%%%
%%
%%%%%%%%%%%%%%%%%%
%
%%%%%%
%%%%%%%%%%%
%%%% %
%%%%%
%
%
%%%%
%%%%%%%%
%%%%%%%
%%%
%% %
%
%
%%
%
%%%%%%%%%%%%%%%%%%%%
%
%%%
%
%
%
%
%%%%
%
%%%%%%%%%%%%%%%%%%%%%%%
%%%
%%%%%%%%%%%%%%%
%
%%
%%
%%%%
%%
%
%%% %
%
%%
%
%%
%
%
%%
%
%
%
%
%
%
%
%%
%%%%
%
%
%
%%
%%%
%%%%
%%%%%%%%%%%
%
% %%%
%
%%% %%%%%%%%%%%%%%%%%%%%
%%
% %
%
%%
%%
%%
%%
%
%
%
%%
%%
%
%%
%%
%%%
%
%%% %%%
%%
%
%
%
%
%
%%
%
%
%
%
%
%
%
%
%
%%
%
%
%
%%
%%
%
%%%
%
%
%
%
%
%%
%
%
%
%
%%
%
%%%%%
%%%
%%
%%
%
%
%
%
%
%
%
%
%
%
%%%%%
%
%%%%%
%
%
<
<
<
<<
<
< <
<
<
<
<
<<<
<
<< <
<
<
<
<
<<<<
<<<
<
<<<
<<
<
< <
<
<
<<
<
<
< <<<
<<<<<
<
<<<<<<<<<<
<<<
<
<<<<<<<
<<<<
<
<
<
<
<
<
<
<
<
<
<<
<
<
<<
<
<<<
<
<
<
<
<
<
<
<
<
<<
0 31 2
MilesPrepared by Mul t isystems, Inc.
L E G E N DMap LayersSurrounding CountiesCity or TownWater
% Welfare ClientsCentro Routes
< Major Employment Site
Employment Per Sq. MileLess than 1,000More than 1,000N/A
Guidebook for Developing Welfare-to-Work Transportation Services
Page 4-3
Employment OpportunitiesInformation about employment opportunities is another critical data element forwelfare-to-work transportation planning and service delivery applications.
Two types of employment data are usually available: information about specificemployers and overall employment summaries. Information about specificemployers typically includes information about the type of employer and thenumber of jobs on site. In some cases, information may be available aboutactual and potential job openings. In contrast, information about overallemployment may include data about the total number of jobs in a geographicarea and, possibly, recent or projected employment trends.
Sources of information on employment range from job openings listed in thenewspaper to extensive databases maintained by public and privateorganizations. Some readily available sources include the following:
••••• Local Agencies. Local sources are a good starting place for compilingemployment data, although data quality will vary in timeliness and accuracy.Many regional and local planning agencies, transit authorities, chambers ofcommerce, labor departments, libraries and other organizations may havecompiled employment information for various purposes.
••••• ES-202. The Covered Employment and Wages program of the Bureau ofLabor Statistics (www.bls.gov) collects and aggregates data to countywidesummaries by industry. This information, commonly referred to as ES-202data, does not include information about specific companies and is mostuseful for general planning efforts.
••••• Census Bureau. The U.S. Bureau of the Census (www.census.gov) collectsand maintains information about employment and commuting patterns fordifferent geographic units, including census block groups, cities, and counties.Summary Tape Files (STF) contain statistical data, including employment fordifferent industries and job classifications. The Census TransportationPlanning Package (CTPP) contains detailed data about commuting patterns bytransportation mode.
••••• Private Databases. Data on employers may be purchased from severalprivate sources. R.L. Polk & Company provides information to a widevariety of corporations. Polk collects employment data via a variety of means,including telephone directories and the U.S. Securities and ExchangeCommission. The Dun and Bradstreet Million Dollar Database containsemployment information on over 1,260,000 U.S. public and privatebusinesses (www.dnbmdd.com). Information includes company address,
Transit Cooperative Research Program
Page 4-4
contact, number of employees working at each particular address, StandardIndustrial Classification (SIC) code system, sales volume and otherinformation. Data sources include Dun and Bradstreet associates as well asthird-party business and government sources.
Employment databases often contain informationabout the industry or job classifications, whichmay be helpful in targeting jobs for welfareparticipants. Most databases use the SIC Code orthe new North American Industry ClassificationSystem (NAICS), which classify establishments bytype of economic activity. The NAICS is replacingthe SIC system and was developed to providenew comparability in statistics about businessactivity across North America.
Transportation ResourcesCollecting information about available transportation resources will enableplanners and policy-makers to better understand the relationship between travelneeds and service alternatives (see Figure 4-2). The inventory of transportationservices may include some or all of the following:
• Public and private transit services (e.g., bus, rail, demand-response,paratransit)
• Ridesharing services (e.g., commuter vanpools)
• Taxis
• Private shuttles (e.g., employers)
• Supporting services (e.g., park-and-ride facilities, fare voucher programs,guaranteed ride home services)
The following information should be collected for each type of transportationservice operating in the study area:
• Route or service area
• Schedule, including frequency, days and hours of operation
• Fare structure and payment options
• Wheelchair accessibility
• Service access (e.g., fixed-route, reservation, subscription)
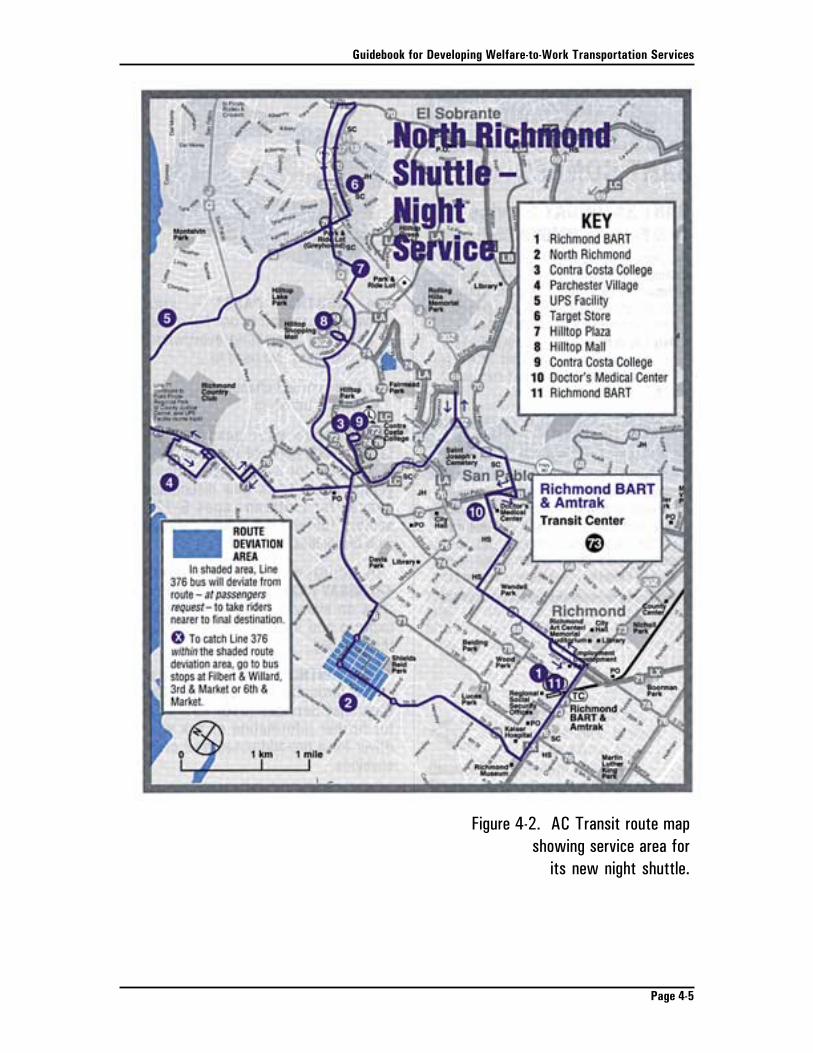
Guidebook for Developing Welfare-to-Work Transportation Services
Page 4-5
Figure 4-2. AC Transit route mapshowing service area for
its new night shuttle.
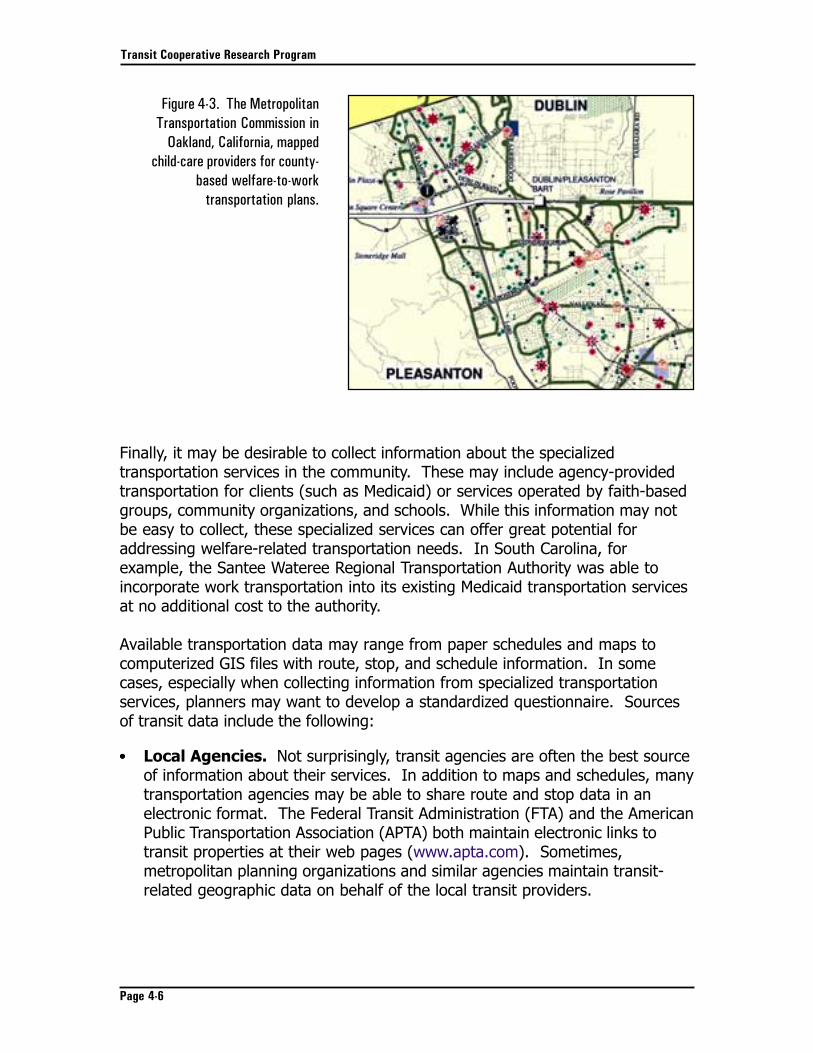
Transit Cooperative Research Program
Page 4-6
Finally, it may be desirable to collect information about the specializedtransportation services in the community. These may include agency-providedtransportation for clients (such as Medicaid) or services operated by faith-basedgroups, community organizations, and schools. While this information may notbe easy to collect, these specialized services can offer great potential foraddressing welfare-related transportation needs. In South Carolina, forexample, the Santee Wateree Regional Transportation Authority was able toincorporate work transportation into its existing Medicaid transportation servicesat no additional cost to the authority.
Available transportation data may range from paper schedules and maps tocomputerized GIS files with route, stop, and schedule information. In somecases, especially when collecting information from specialized transportationservices, planners may want to develop a standardized questionnaire. Sourcesof transit data include the following:
••••• Local Agencies. Not surprisingly, transit agencies are often the best sourceof information about their services. In addition to maps and schedules, manytransportation agencies may be able to share route and stop data in anelectronic format. The Federal Transit Administration (FTA) and the AmericanPublic Transportation Association (APTA) both maintain electronic links totransit properties at their web pages (www.apta.com). Sometimes,metropolitan planning organizations and similar agencies maintain transit-related geographic data on behalf of the local transit providers.
Figure 4-3. The MetropolitanTransportation Commission in
Oakland, California, mappedchild-care providers for county-
based welfare-to-worktransportation plans.
Guidebook for Developing Welfare-to-Work Transportation Services
Page 4-7
••••• Federal Transit Administration. FTA maintains a geographic database ofnearly all transit systems across the country. Several different databaseshave been developed, including fixed-route systems, level of service (e.g.,frequency, schedule information, fare structure, and wheelchair accessibility),and ADA complementary paratransit service. Information is available, inspreadsheet format, for more than 550 transit agencies, using 1994-1997data. Users can download any of these transit networks directly from thesite at geolab.moakley.bridgew.edu/ftp_site/ftp.htm.
Support ServicesSome TANF clients will require transportation for certain support services,including child care, job search activities, and job training. The complex tripchains that result for these individuals may be difficult to serve withconventional transit. State or county welfare and social service agencies are agood starting point for information about child-care programs and services.At the federal level, the U.S. Department of Health and Human ServicesAdministration for Children and Families (www.acf.dhhs.gov) can provide statecontacts. Several sites on the Internet contain information about child-careservices. For example, the Child Care Parent Provider Information Network, anationwide service, lists information at www.childcare-ppin.com; a searchdirectory of this site allows parents to locate child-care providers in their city.(See Figure 4-3 for a sample map showing child-care providers.) Likely sourcesof information about job training sites include private industry councils,workforce investment boards, and state and county welfare offices.
CHAPTER 5
Identifying Unmet NeedsAfter assembling information about travel patterns and transportation resources,stakeholders can begin to assess the transportation barriers and gaps in servicethat program participants encounter. While these will vary from location tolocation, typical needs and issues include the following:
• Work schedules that require late-night or weekend commuting
• Mismatch between residential locations and employment centers
• Long travel times because of multiple transfers or infrequent service
• Concerns about safety walking to or waiting at train stations or bus stops
• Difficulties of balancing multiple destinations for child care and employment
• Complexities of coordinating multiple operators, schedules, and fare levels
• Affordability of transit fares and passes
• Difficulty obtaining or understanding information about transportationservices because of language or literacy barriers
• High costs of acquiring, registering, insuring, and maintaining automobiles
Many tools and resources are available for defining these transportation needsand barriers, including statistical data analysis, computerized maps, interviewswith TANF recipients and service providers, surveys, and focus groups.
This chapter highlights the analytical tools available for quantitative andqualitative assessment of transportation needs and service gaps. These includeuse of computerized mapping systems to represent the geographic relationshipsamong program participants, travel destinations, and transit services; marketresearch techniques like surveys to gather information about travel patterns andtransportation resources; and techniques like focus groups, communitymeetings, and structured interviews to obtain personal accounts of travel needsand transportation barriers.
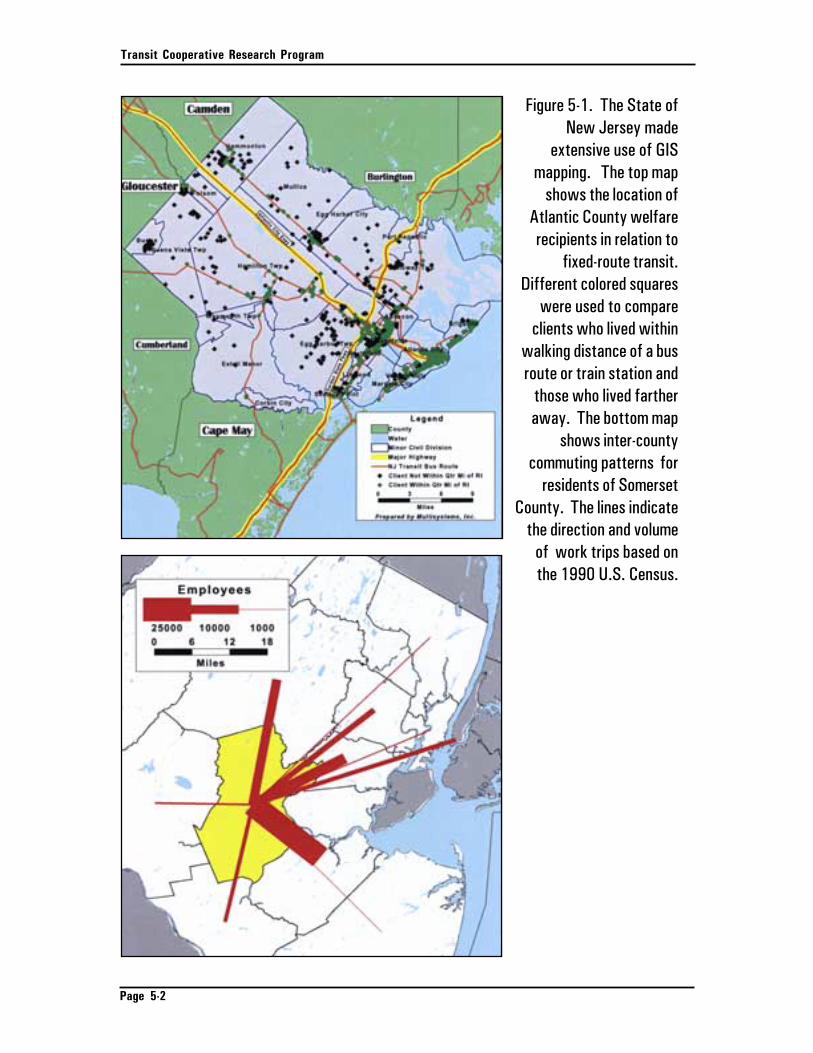
Transit Cooperative Research Program
Page 5-2
Figure 5-1. The State ofNew Jersey made
extensive use of GISmapping. The top map
shows the location ofAtlantic County welfarerecipients in relation to
fixed-route transit.Different colored squares
were used to compareclients who lived within
walking distance of a busroute or train station and
those who lived fartheraway. The bottom map
shows inter-countycommuting patterns for
residents of SomersetCounty. The lines indicate
the direction and volumeof work trips based onthe 1990 U.S. Census.
Guidebook for Developing Welfare-to-Work Transportation Services
Page 5-3
Use of Geographic Information SystemsGeographic Information Systems (GIS) link databases with computer mappingcapabilities, allowing the information to be displayed graphically. Because ofthis ability to display complex data in an easily understood form, GIS analysishas become a widely used tool for planning and implementing welfare-to-worktransportation programs. By mapping the location of TANF participants, jobs,day care, and other support services in relation to current fixed-route transitsystem, analysts and policy-makers can begin to assess the spatial mismatchesbetween transit services and transportation needs. With additional informationabout transit, jobs, and services such as hours of operation, shift times, and daycare program hours, temporal mismatches can also be identified and displayed.Most of the data sources described in Chapter 4 can be used for GIS analysis.
GIS analysis can assist in policy development by identifying the potential oftransit services to meet access to jobs needs. In the San Francisco Bay Area,the Metropolitan Transportation Commission (MTC) used GIS analysis to identifytransportation barriers and service gaps for participants in the state’s CalWORKsprogram. MTC plotted the home location of welfare clients, fixed-route transitservices, and potential employers. To protect the confidentiality of welfareclients, individual addresses were not shown on the maps; instead addresseswere geocoded to a one-quarter-mile grid. (Geocoding assigns geographiccoordinates, usually latitude and longitude, to a data element so that it can berepresented on a map.) In New Jersey, GIS analysis was used to calculate thenumber of welfare recipients who had convenient transit access to jobs andsupport services – and those who did not – based on the distance between theirhomes and a bus stop or train station (see Figure 5-1). In cities, where transitaccess was generally good, the state focused on improving existing transitservices and expanding its transit pass program. In rural and suburban areas,where residents had more limited transit access, the state concentrated itsplanning efforts on nontraditional solutions, including flexible and demand-response services.
Learning from Welfare RecipientsAs the target customers for transportation services, TANF participants have aunique role in the planning process. Program participants know theirtransportation needs better than anyone else and involving them in the planningprocess can yield enormous benefits. Their experiences juggling thecomplexities of their own commuting trips with the travel requirements of one ormore children can provide detailed and practical guidance to those developingservice strategies. In some cases, TANF clients have participated directly inplanning transportation alternatives; in other situations, caseworkers or jobcounselors represented the interests of their clients through stakeholdermeetings and participation on advisory panels. Some strategies for involvingwelfare recipients in the planning process are summarized here.
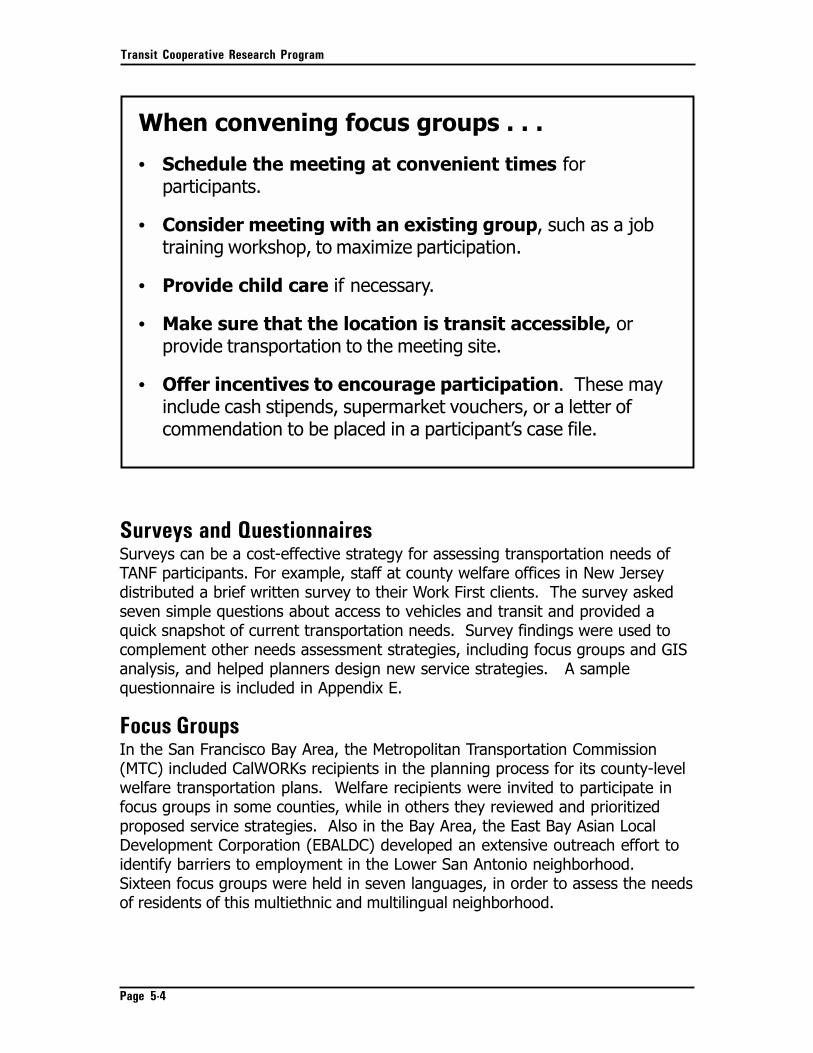
Transit Cooperative Research Program
Page 5-4
Surveys and QuestionnairesSurveys can be a cost-effective strategy for assessing transportation needs ofTANF participants. For example, staff at county welfare offices in New Jerseydistributed a brief written survey to their Work First clients. The survey askedseven simple questions about access to vehicles and transit and provided aquick snapshot of current transportation needs. Survey findings were used tocomplement other needs assessment strategies, including focus groups and GISanalysis, and helped planners design new service strategies. A samplequestionnaire is included in Appendix E.
Focus GroupsIn the San Francisco Bay Area, the Metropolitan Transportation Commission(MTC) included CalWORKs recipients in the planning process for its county-levelwelfare transportation plans. Welfare recipients were invited to participate infocus groups in some counties, while in others they reviewed and prioritizedproposed service strategies. Also in the Bay Area, the East Bay Asian LocalDevelopment Corporation (EBALDC) developed an extensive outreach effort toidentify barriers to employment in the Lower San Antonio neighborhood.Sixteen focus groups were held in seven languages, in order to assess the needsof residents of this multiethnic and multilingual neighborhood.
When convening focus groups . . .
• Schedule the meeting at convenient times forparticipants.
• Consider meeting with an existing group, such as a jobtraining workshop, to maximize participation.
• Provide child care if necessary.
• Make sure that the location is transit accessible, orprovide transportation to the meeting site.
• Offer incentives to encourage participation. These mayinclude cash stipends, supermarket vouchers, or a letter ofcommendation to be placed in a participant’s case file.
Guidebook for Developing Welfare-to-Work Transportation Services
Page 5-5
Stakeholder ParticipationStakeholders in the welfare-related transportation planning process can be animportant resource during program development and implementation. Asdiscussed in Chapter 3, stakeholders may include transportation operators,social service providers, public agencies, elected officials, communityorganizations, faith-based groups, job councils, and employers. Theserepresentatives often have first-hand knowledge of the unique challenges ofserving the needs of TANF participants. Planners can tap into this experience inseveral ways. First, interviews with stakeholders, either one-on-one or in smallgroups, can yield detailed information about specific transportation needs,service gaps, and barriers. Second, when stakeholders sit on project steeringcommittees, they can help facilitate access to data, review programalternatives, and help build consensus and support. Finally, stakeholders maybe invited to attend community meetings to discuss transportation needs andpotential solutions in a larger setting.
CHAPTER 6
Service StrategiesHistorically, welfare offices met the transportation needs of their clients byreimbursing them for transportation costs; typically they provided bus passes,taxi vouchers or mileage allowances. Welfare reform has complicated thetransportation needs of welfare recipients considerably, however, and states andlocalities are struggling to serve their clients in this new environment.
States and local governments have developed a wide range of implementationstrategies to support welfare reform. In densely populated areas, it has beenpossible to modify existing bus routes to serve new employment centers or off-peak work shifts, with a special focus on the needs of reverse commuters. Inlower density areas, service strategies may include coordinated transit andhuman services transportation programs, brokerages, ridesharing, and – anincreasingly popular option – programs to sell or lease donated vehicles towelfare clients. Some welfare-to-work programs have integrated multiplestrategies to better serve the diverse needs of their clients. The followingsections describe a variety of implementation strategies, including new andmodified transit services, service coordination and brokerages, ridesharing,automobile ownership programs, and one-stop centers.
Modifications to Existing ServicesMany localities have introduced new transit services or modified existing routesto provide welfare-related transportation. Frequently these services aredesigned to serve specific employment centers, to meet work shifts, or tominimize transfers. Many were designed to serve reverse commuters – cityresidents who work in the suburbs. In North Richmond, California, the Alameda-Contra Costa Transit District (AC Transit) worked with the local private industrycouncil to design a new community-based route. Route 376 ran once an hourfrom 7:00 p.m. to 2:00 a.m. to connect a rail station, commercial district, andresidential neighborhood. The Transit Authority of River City (TARC) introducedan express bus service between inner-city Louisville, Kentucky, and a majorindustrial park. The Southeastern Pennsylvania Transportation Authority(SEPTA), which serves the Philadelphia metropolitan area, extended bus routesto serve business centers and industrial parks, introduced reverse commuteexpress services, and added service to routes serving workers on late shifts.
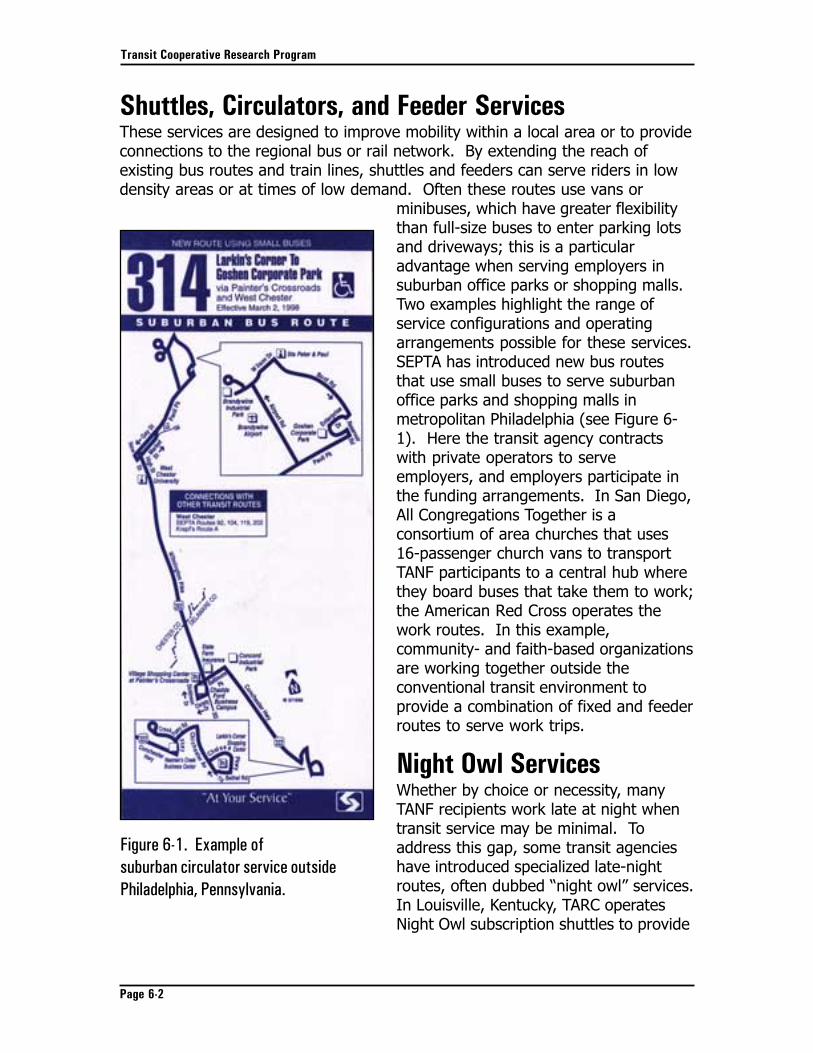
Transit Cooperative Research Program
Page 6-2
Shuttles, Circulators, and Feeder ServicesThese services are designed to improve mobility within a local area or to provideconnections to the regional bus or rail network. By extending the reach ofexisting bus routes and train lines, shuttles and feeders can serve riders in lowdensity areas or at times of low demand. Often these routes use vans or
minibuses, which have greater flexibilitythan full-size buses to enter parking lotsand driveways; this is a particularadvantage when serving employers insuburban office parks or shopping malls.Two examples highlight the range ofservice configurations and operatingarrangements possible for these services.SEPTA has introduced new bus routesthat use small buses to serve suburbanoffice parks and shopping malls inmetropolitan Philadelphia (see Figure 6-1). Here the transit agency contractswith private operators to serveemployers, and employers participate inthe funding arrangements. In San Diego,All Congregations Together is aconsortium of area churches that uses16-passenger church vans to transportTANF participants to a central hub wherethey board buses that take them to work;the American Red Cross operates thework routes. In this example,community- and faith-based organizationsare working together outside theconventional transit environment toprovide a combination of fixed and feederroutes to serve work trips.
Night Owl ServicesWhether by choice or necessity, manyTANF recipients work late at night whentransit service may be minimal. Toaddress this gap, some transit agencieshave introduced specialized late-nightroutes, often dubbed “night owl” services.In Louisville, Kentucky, TARC operatesNight Owl subscription shuttles to provide
Figure 6-1. Example ofsuburban circulator service outsidePhiladelphia, Pennsylvania.
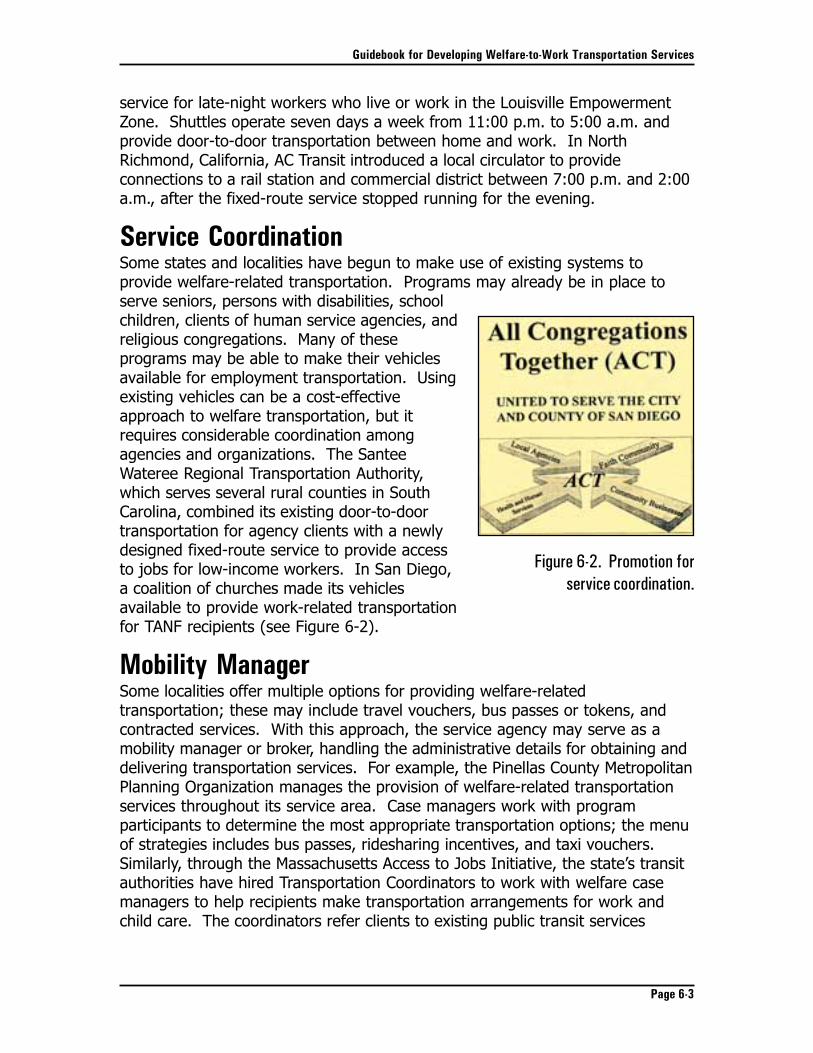
Guidebook for Developing Welfare-to-Work Transportation Services
Page 6-3
service for late-night workers who live or work in the Louisville EmpowermentZone. Shuttles operate seven days a week from 11:00 p.m. to 5:00 a.m. andprovide door-to-door transportation between home and work. In NorthRichmond, California, AC Transit introduced a local circulator to provideconnections to a rail station and commercial district between 7:00 p.m. and 2:00a.m., after the fixed-route service stopped running for the evening.
Service CoordinationSome states and localities have begun to make use of existing systems toprovide welfare-related transportation. Programs may already be in place toserve seniors, persons with disabilities, schoolchildren, clients of human service agencies, andreligious congregations. Many of theseprograms may be able to make their vehiclesavailable for employment transportation. Usingexisting vehicles can be a cost-effectiveapproach to welfare transportation, but itrequires considerable coordination amongagencies and organizations. The SanteeWateree Regional Transportation Authority,which serves several rural counties in SouthCarolina, combined its existing door-to-doortransportation for agency clients with a newlydesigned fixed-route service to provide accessto jobs for low-income workers. In San Diego,a coalition of churches made its vehiclesavailable to provide work-related transportationfor TANF recipients (see Figure 6-2).
Mobility ManagerSome localities offer multiple options for providing welfare-relatedtransportation; these may include travel vouchers, bus passes or tokens, andcontracted services. With this approach, the service agency may serve as amobility manager or broker, handling the administrative details for obtaining anddelivering transportation services. For example, the Pinellas County MetropolitanPlanning Organization manages the provision of welfare-related transportationservices throughout its service area. Case managers work with programparticipants to determine the most appropriate transportation options; the menuof strategies includes bus passes, ridesharing incentives, and taxi vouchers.Similarly, through the Massachusetts Access to Jobs Initiative, the state’s transitauthorities have hired Transportation Coordinators to work with welfare casemanagers to help recipients make transportation arrangements for work andchild care. The coordinators refer clients to existing public transit services
Figure 6-2. Promotion forservice coordination.
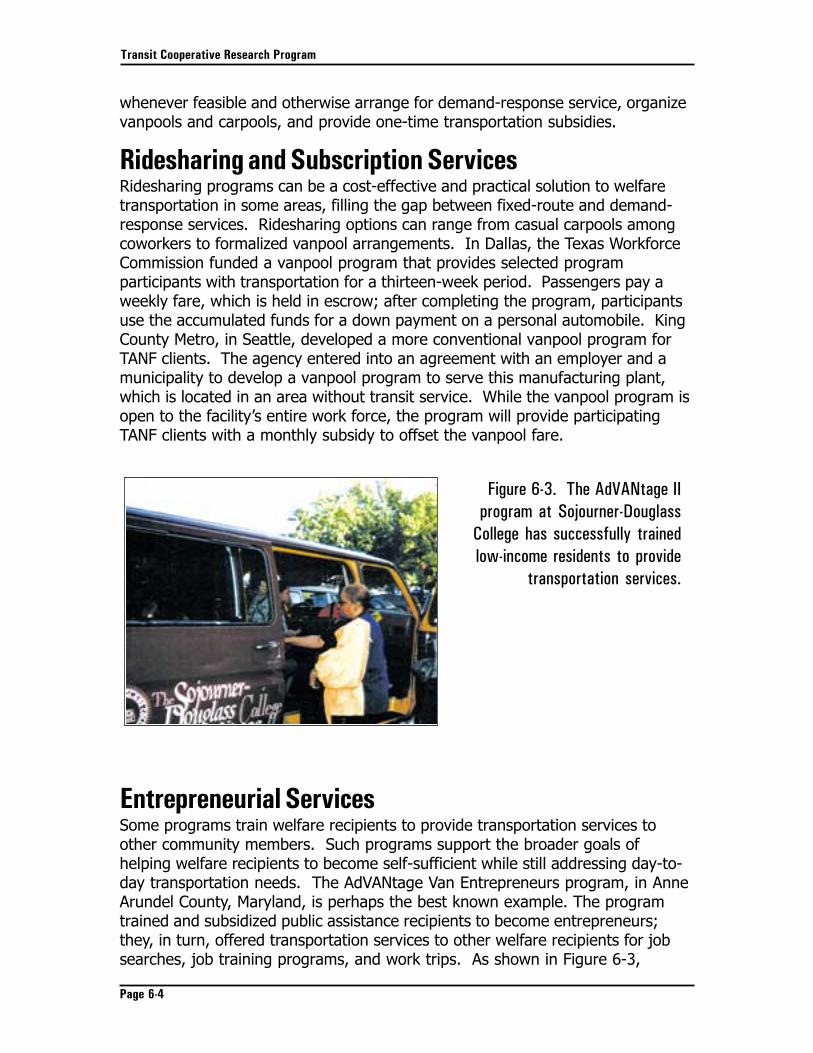
Transit Cooperative Research Program
Page 6-4
whenever feasible and otherwise arrange for demand-response service, organizevanpools and carpools, and provide one-time transportation subsidies.
Ridesharing and Subscription ServicesRidesharing programs can be a cost-effective and practical solution to welfaretransportation in some areas, filling the gap between fixed-route and demand-response services. Ridesharing options can range from casual carpools amongcoworkers to formalized vanpool arrangements. In Dallas, the Texas WorkforceCommission funded a vanpool program that provides selected programparticipants with transportation for a thirteen-week period. Passengers pay aweekly fare, which is held in escrow; after completing the program, participantsuse the accumulated funds for a down payment on a personal automobile. KingCounty Metro, in Seattle, developed a more conventional vanpool program forTANF clients. The agency entered into an agreement with an employer and amunicipality to develop a vanpool program to serve this manufacturing plant,which is located in an area without transit service. While the vanpool program isopen to the facility’s entire work force, the program will provide participatingTANF clients with a monthly subsidy to offset the vanpool fare.
Entrepreneurial ServicesSome programs train welfare recipients to provide transportation services toother community members. Such programs support the broader goals ofhelping welfare recipients to become self-sufficient while still addressing day-to-day transportation needs. The AdVANtage Van Entrepreneurs program, in AnneArundel County, Maryland, is perhaps the best known example. The programtrained and subsidized public assistance recipients to become entrepreneurs;they, in turn, offered transportation services to other welfare recipients for jobsearches, job training programs, and work trips. As shown in Figure 6-3,
Figure 6-3. The AdVANtage IIprogram at Sojourner-Douglass
College has successfully trainedlow-income residents to provide
transportation services.
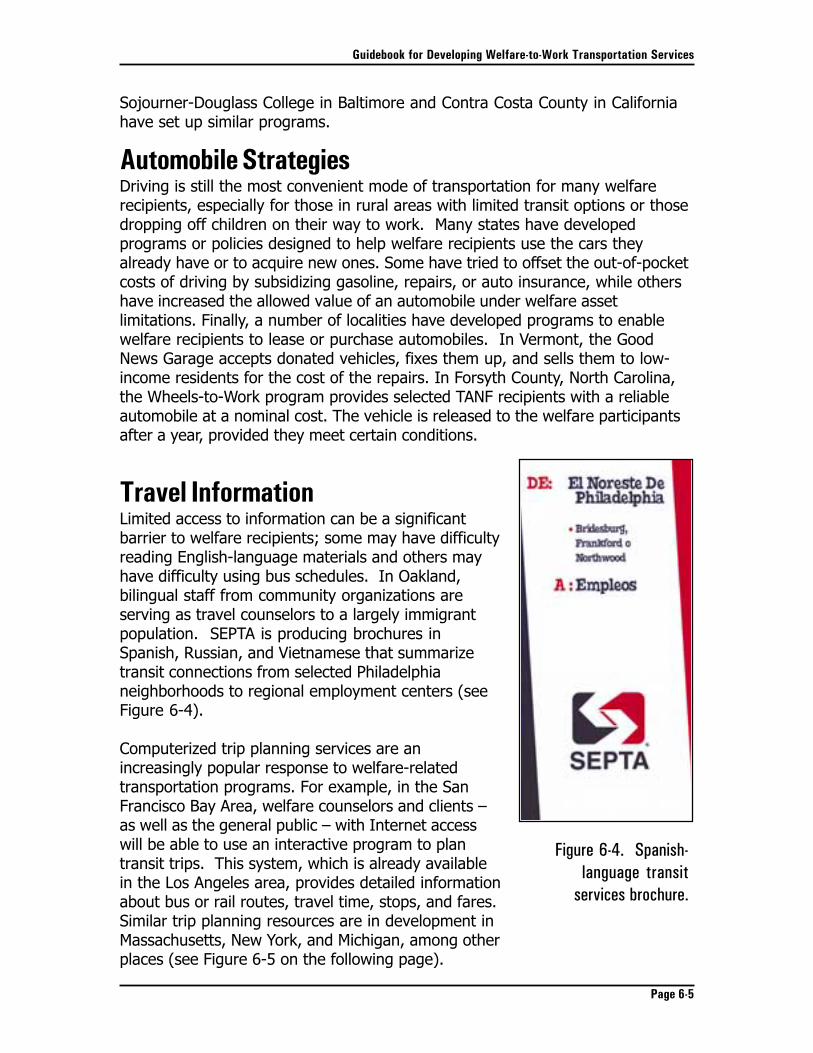
Guidebook for Developing Welfare-to-Work Transportation Services
Page 6-5
Sojourner-Douglass College in Baltimore and Contra Costa County in Californiahave set up similar programs.
Automobile StrategiesDriving is still the most convenient mode of transportation for many welfarerecipients, especially for those in rural areas with limited transit options or thosedropping off children on their way to work. Many states have developedprograms or policies designed to help welfare recipients use the cars theyalready have or to acquire new ones. Some have tried to offset the out-of-pocketcosts of driving by subsidizing gasoline, repairs, or auto insurance, while othershave increased the allowed value of an automobile under welfare assetlimitations. Finally, a number of localities have developed programs to enablewelfare recipients to lease or purchase automobiles. In Vermont, the GoodNews Garage accepts donated vehicles, fixes them up, and sells them to low-income residents for the cost of the repairs. In Forsyth County, North Carolina,the Wheels-to-Work program provides selected TANF recipients with a reliableautomobile at a nominal cost. The vehicle is released to the welfare participantsafter a year, provided they meet certain conditions.
Travel InformationLimited access to information can be a significantbarrier to welfare recipients; some may have difficultyreading English-language materials and others mayhave difficulty using bus schedules. In Oakland,bilingual staff from community organizations areserving as travel counselors to a largely immigrantpopulation. SEPTA is producing brochures inSpanish, Russian, and Vietnamese that summarizetransit connections from selected Philadelphianeighborhoods to regional employment centers (seeFigure 6-4).
Computerized trip planning services are anincreasingly popular response to welfare-relatedtransportation programs. For example, in the SanFrancisco Bay Area, welfare counselors and clients –as well as the general public – with Internet accesswill be able to use an interactive program to plantransit trips. This system, which is already availablein the Los Angeles area, provides detailed informationabout bus or rail routes, travel time, stops, and fares.Similar trip planning resources are in development inMassachusetts, New York, and Michigan, among otherplaces (see Figure 6-5 on the following page).
Figure 6-4. Spanish-language transit
services brochure.
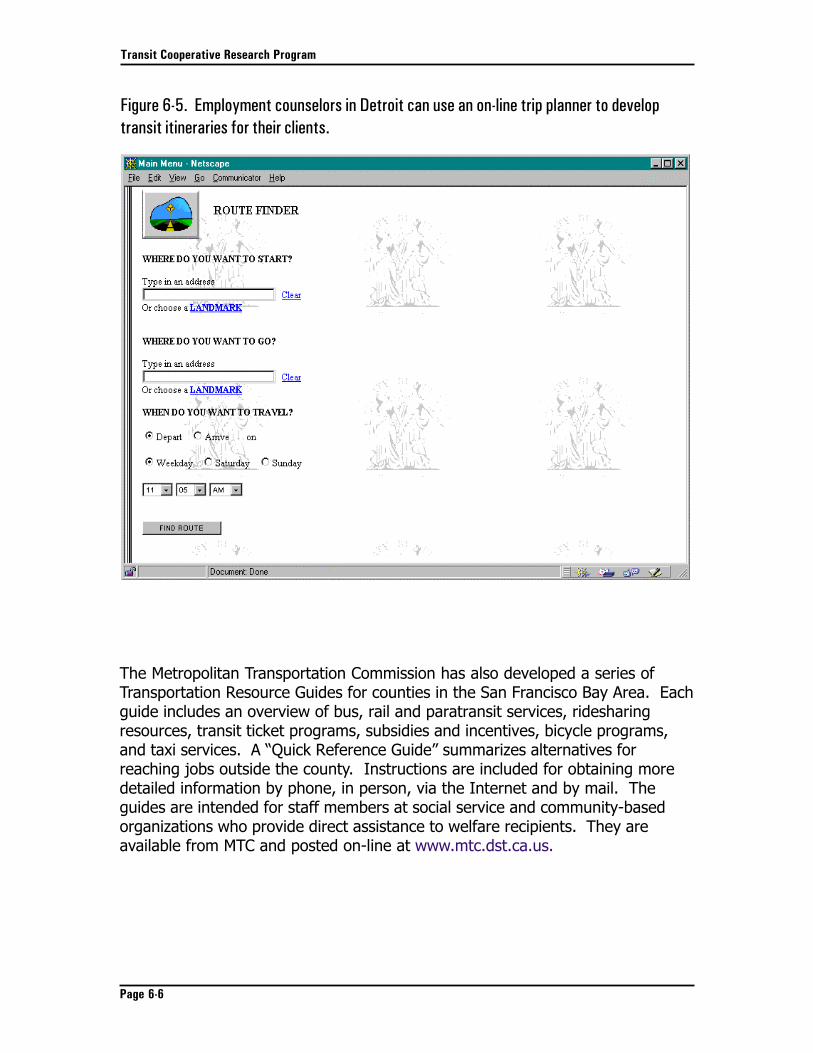
Transit Cooperative Research Program
Page 6-6
The Metropolitan Transportation Commission has also developed a series ofTransportation Resource Guides for counties in the San Francisco Bay Area. Eachguide includes an overview of bus, rail and paratransit services, ridesharingresources, transit ticket programs, subsidies and incentives, bicycle programs,and taxi services. A “Quick Reference Guide” summarizes alternatives forreaching jobs outside the county. Instructions are included for obtaining moredetailed information by phone, in person, via the Internet and by mail. Theguides are intended for staff members at social service and community-basedorganizations who provide direct assistance to welfare recipients. They areavailable from MTC and posted on-line at www.mtc.dst.ca.us.
Figure 6-5. Employment counselors in Detroit can use an on-line trip planner to developtransit itineraries for their clients.
Guidebook for Developing Welfare-to-Work Transportation Services
Page 6-7
Child-Care TransportationSeveral organizations have tackled the complicated needs of providing child-caretransportation. The Contra Costa County Social Services Department (SSD) isoverseeing a program to train welfare recipients to provide communitytransportation services, including transportation to school and child care. TheMassachusetts Access to Jobs program provides child-care transportation if noother alternative is available. Also in Massachusetts, the Lowell Regional TransitAuthority operates a van that fills in the gaps for parents who do not have otheralternatives for child-care transportation. The authority’s van can carry sixchildren plus a monitor and operates five days a week, seven hours a day.
One-Stop CentersSome localities have developed integrated one-stop centers that consolidate avariety of services for welfare recipients, including transportation. The NiaTravel and Employment Center houses employment services, a transit center,and a number of small businesses in West Louisville, Kentucky. As a result,patrons can work with a job counselor to identify potentialemployers and then consult a transit staffer across the hallfor personalized bus trip planning. In San Diego, welfare-related transportation services originate at a communitycenter that also provides child care.
Subsidies and IncentivesTransPac, the cooperative transportation planningcommittee for six jurisdictions in Central Contra CostaCounty, California, offers TANF participants incentives to support approximately60 days of transit use or ridesharing activities. Recipients may receive transitpasses, gasoline vouchers for carpool or “school-pool” participation, or vanpoolfare subsidies. Similarly, the case workers in Pinellas County, Florida, can offertheir clients transit passes, gasoline credit cards, and mileage reimbursements fordrivers who transport TANF participants. Massachusetts transportationcoordinators may provide one-time subsidies, including payment of automobileinsurance, driver’s license fees, car loans, leases, and repairs for donatedvehicles.
CHAPTER 7
Defining the ProgramAfter deciding what type of service best suits the identified travel needs of thetarget market, planners and stakeholders can define the program in more detail.A service plan outlines program resource requirements and can be used todevelop a budget and funding plan.
Develop a Service PlanA service plan identifies the program operating approach and resourcerequirements. Traditionally used as part of the transit planning process, aservice plan can be adapted to different approaches to meeting welfare-to-worktransportation needs. A transit service plan includes the following elements.
••••• Target market – Who will use the service? TANF recipients, low-incomeindividuals, or other groups?
••••• Route or service area – Where will the service operate?
••••• Service characteristics – Is this fixed, flexible, or demand-responseservice?
••••• Service span – What days of the week does the service operate? At whattimes does it start and end?
••••• Frequency – How often does the route run?
••••• Reservation policy – If service is flexible or demand-response, what is thepolicy for making reservations? How far in advance? Whom do patrons call?
••••• Vehicle requirements – How many vehicles are required? Does the plancall for full-size conventional buses, mini-buses, vans, automobiles, orsomething else? Do the vehicles need to accommodate passengers inwheelchairs? Is special equipment required, like radios/cellular telephonesfor drivers? Would vehicles be leased or purchased?
••••• Operating arrangements – Who will operate the service? The existingtransit operator, human service agency, nonprofit organization, or a private
Transit Cooperative Research Program
Page 7-2
contractor? Does the provider have legal authority to operate within theselected service area?
••••• Maintenance – Who will maintain the vehicles and facilities?
••••• Staffing – How many bus drivers are required? What are the staffingrequirements for maintenance, administration, planning, dispatching,counseling, reservations, marketing, and other program activities?
••••• Fare policy – Will passengers pay fares or a fee for service? How willrevenues be collected? Are fareboxes required?
••••• Coordination – What kind of coordination is needed with other programs,agencies, organizations, and community groups?
••••• Organizational responsibilities – Who will be responsible forimplementing each element of the program?
While these elements focus on transit operations, a service plan can easily beadapted to other welfare-related transportation programs. For example, staffingrequirements for a vehicle donation program might include mechanics to assessand refurbish donated vehicles. A trip planning program would not need buses,but it likely would require new computers, specialized software, and Internetaccess. Service span could be translated into office hours for some programs;service area could mean site location for a one-stop center.
Estimate Program CostsBased on the information in the service plan, program developers can estimateprogram costs. Transportation costs traditionally fall into three generalcategories: capital costs, operating costs, and administrative costs.
Capital CostsCapital costs are one-time or infrequently recurring costs of long-term assets,such as vehicles, land, stations, and buildings. These costs often include relatedexpenses, such as depreciation and property taxes. Capital costs may include:
• Vehicles, including purchase or leasing cost
• Vehicle depreciation
• Other assets, including purchase or leasing cost for maintenance equipment,buildings, and other major assets
• Depreciation on other assets
Guidebook for Developing Welfare-to-Work Transportation Services
Page 7-3
Operating CostsOperating costs are recurring costs associated with system operations andmaintenance. Operating costs usually exclude such fixed costs as depreciationon plant and equipment, interest paid for loans on capital equipment, andproperty taxes on capital items. Operating costs may include the following:
• Labor and fringe benefits for operators, dispatchers, maintenance staff, andothers
• Services, such as contracts for security
• Materials and supplies, including fuel, oil, tires, and parts
• Rent and utilities at operating facilities
• Casualty and liability costs
• Taxes, including vehicle registration fees
• Purchased or contracted transportation services
• Miscellaneous expenses, including tolls
Administrative CostsAdministrative costs are recurring costs not directly related to operations andmaintenance. They may include costs associated with program management,administration, marketing, and similar functions. Administrative costs mayinclude the following:
• Labor and fringe benefits for management and administrative staff
• Professional and technical services
• Materials and supplies, including office supplies
• Rent and utilities for office space
• Insurance for professional services
• Taxes
• Miscellaneous costs, such as travel and meetings, advertising, dues andsubscriptions for professional associations
The next step, after estimating program costs, is to identify fundingopportunities and to develop a funding plan.
Transit Cooperative Research Program
Page 7-4
Identify Funding OpportunitiesTransportation strategies developed to support welfare-related transportationneeds can be expensive to provide. Many operate in low-density areas outsidetraditional commuting hours without the economies of scale that allow efficientprovision of transit service. The federal government is making some fundsavailable, but localities have been exploring other funding sources as well. Thissection describes available federal funding programs, as well as innovativeprograms on the state and local levels.
Federal Funding SourcesThree major federal funding programs may be used to support welfare-to-worktransportation programs: (1) the Temporary Assistance to Needy Families(TANF) block grant program, administered by the U.S. Department of Health andHuman Services; (2) the Welfare-to-Work formula and competitive grantprogram, administered by the U.S. Department of Labor; and (3) the JobAccess and Reverse Commute grant program, administered by the U.S.Department of Transportation.
Temporary Assistance to Needy Families Block GrantsAfter passage of the federal Personal Responsibility and Work OpportunityReconciliation Act, several separate federal welfare programs (Aid to Familieswith Dependent Children, Job Opportunities and Basic Skills Training, andEmergency Assistance) were combined into a single new block grant to statescalled Temporary Assistance to Needy Families (TANF). The U.S. Department ofHealth and Human Services Administration for Children and Families administersthe program.
States may use the new TANF block grants to finance transportation and othersupport services that will make it easier for welfare recipients to find and retainemployment, or help to achieve other goals of the welfare reform effort. TANFfunds may be used for the following transportation purposes:
• Reimbursement or a cash allowance to TANF recipients for work-relatedtransportation expenses
• Contracts for shuttles, buses, carpools or other services for TANF recipients
• Purchase of vehicles for the provision of service to TANF recipients
• Purchase of public or private transit passes or vouchers
• Loans to TANF recipients for the purpose of leasing or purchasing a vehiclefor work travel
• Programs to obtain and repair vehicles for use by TANF recipients
Guidebook for Developing Welfare-to-Work Transportation Services
Page 7-5
• One-time payments to recipients to cover expenses such as auto repair orinsurance
• Payment of “necessary and reasonable” costs for new or expandedtransportation services for use by TANF recipients
• Assistance to TANF recipients with the start-up of a transportation service
• Transfer to a Social Services Block Grant to provide transportation servicesfor disadvantaged residents of rural and inner-city areas
• Payment of TANF agency expenses associated with planning transportationservices for TANF recipients
Certain restrictions apply to the use of TANF funds. TANF funds may not be usedto construct or purchase buildings or facilities. Furthermore, TANF funds maynot be used to subsidize transportation services for individuals who are notreceiving TANF benefits. If such individuals use a TANF-funded service, or if theTANF agency participates with another agency to provide transportationservices, only the expenses associated with eligible TANF recipients’ use ofthose services may be allocated to the TANF program.
TANF funds also may not replace other federal funds that normally would beused to provide those services. If funds from another federal agency, such asthe Federal Transit Administration (FTA), are currently used to providetransportation services that will be used by TANF recipients, TANF funds may notbe substituted for those other funds. Funding for the TANF program wasauthorized at $16.5 billion annually through FY 2002.
Welfare-to-Work GrantsIn FY 1998-1999 the U.S. Department of Labor (DOL) awarded a series offormula and competitive Welfare-to-Work grants to states and communitiesdesigned to benefit the hardest-to-employ TANF recipients. Eligible participantswere defined as follows:
• Long-term recipients faced with two out of three significant barriers toemployment (lack of a high school diploma or GED and poor reading or mathskills, a substance abuse problem requiring treatment, and an unsatisfactorywork history); or
• Recipients scheduled to lose TANF benefits within 12 months; or
• Noncustodial parents of a minor child whose custodial parent falls within oneof the categories above.
Transit Cooperative Research Program
Page 7-6
Funds were available for job readiness and employment activities, jobplacement, post-employment services, and job-retention and support servicessuch as child care, substance abuse treatment, housing assistance, andtransportation. A local match of one dollar for every two dollars of federal grantfunds was required; up to 50 percent of matching funds could be in the form ofthird-party in-kind contributions.
Eligible activities were similar to those authorized under the TANF block grants,with the following restrictions. Welfare-to-Work funds could be used only fortransportation services not otherwise available to the participant and only forindividuals participating in an allowable welfare-to-work activity. Welfare-to-Work funds cannot be used as a local match for other federal programs, withthe exception of the Job Access and Reverse Commute Program. Finally,Welfare-to-Work grants could not be used as loans or down payments forindividuals to lease or purchase a vehicle for work-related travel.
Grants totaled $3 billion for the two-year period; DOL is seeking reauthorizationof the program.
Seventy-five percent of the program funds (excluding some set-aside programs)were distributed as formula grants to states. Formula allocations were basedon (1) the percentage of the national TANF population living in the state and (2)the percentage of national poverty population living in the state. Each statewas guaranteed a minimum allotment of 0.25 percent of the available amount.
States were required to prepare a plan for approval by the Secretary of Laborthat included strategies to promote and encourage coordination with the statedepartment of transportation, metropolitan planning organizations, transitoperators, and other transportation providers. States were required to pass atleast 85 percent of their allocations to Private Industry Councils (PICs) orWorkforce Development Boards (WDBs) established by the Job TrainingPartnership Act. One-half of a state’s funds were to be spent in areas where 7.5percent or more of the population is living in poverty. Not more than one-halfwas to be allocated to areas within a state with a high concentration of adultswho have been receiving TANF assistance for 30 months or more and a highnumber of unemployed individuals.
Twenty-five percent of the $3 billion in Welfare-to-Work funds were distributedon a competitive basis to cities, counties, or PICs; private for-profit andnonprofit organizations, community-based and faith-based organizations,educational institutions, and workforce development organizations were eligibleto apply in conjunction with these entities. Priority was given to urban areaswith high concentrations of poverty and rural areas in the grant award process.
Guidebook for Developing Welfare-to-Work Transportation Services
Page 7-7
The competitive grants were distributed through three rounds of an applicationprocess during FY 1998-1999. Organizations selected had up to three years tospend the grant funds. The grant funds were awarded as follows:
• In Round 1 (May 1998), $186 million was awarded to 51 competitiveprograms.
• In Round 2 (November 1998), $273 million was awarded to 75 programs in44 states and the District of Columbia.
• In Round 3 (September 1999), 64 programs in 34 states and the District ofColumbia received $222 million.
The grant awards were split approximately 70/30, with 70 percent of the grantsgoing to urban areas with high concentrations of poverty and 30 percent of thegrants to rural projects. Successful applications combined innovative,collaborative and sustainable welfare-to-work strategies designed to enablerecipients to obtain employment, increase earnings, or receive support serviceswhile making the transition from welfare to work. Several of the projectsselected pertained solely to transportation needs of welfare-to-workparticipants, or had transportation included as one facet of the support servicesprovided by the program.
Job Access and Reverse Commute GrantsThe Transportation Equity Act for the 21st Century, referred to as TEA-21,authorized the Job Access and Reverse Commute (JARC) grant program to helpdevelop transportation services to link welfare recipients and others with jobsand support services.
Projects must be the result of a coordinated human services/public transitplanning process in order to be eligible for funding and may include:
• Capital, operating, or associated capital maintenance expenses
• Promotion of transit use by employees with nontraditional work shifts
• Promotion of use of transit vouchers by eligible individuals
• Promotion of employer-sponsored transportation
• Subsidy for addition of reverse commute services
• Subsidy for purchase/lease of vehicle(s) by nonprofit organizations fordedicated employment shuttles
Transit Cooperative Research Program
Page 7-8
• Other activities to facilitate the use of transit for access to jobs for welfarerecipients and eligible low-income individuals
Funds may not be used for planning or coordination activities.
Funds are awarded on a competitive basis. The federal share of the costs ofprojects funded under this program will be 50 percent. However, other federalfunds (e.g., TANF or DOL grants) may be used for the local share.
TEA-21 authorizes $150 million annually for the Job Access program for fiveyears starting in FY 1999. Guaranteed funding levels began at $50 million in FY1999 and increase to $150 million by FY 2003. In each year, $10 million is to beset aside for reverse commute projects that provide access to suburban jobs forpeople living in inner-city or nonurbanized areas.
In the first round of JARC grants, FTA awarded more than $70.8 million to 167projects in 42 states and the District of Columbia. California received thelargest number of grants (18), followed by New York (13), New Jersey (12),Maryland (11) and Ohio (11). Transit agencies sponsored the majority ofsuccessful applications. However, funding also was awarded for projectssponsored by other agencies such as state departments of transportation, cityand county governments, metropolitan planning organizations, social/humanservice agencies and other nonprofit organizations.
Other Federal ResourcesIn addition to these federal programs, which specifically target welfare-to-workactivities, other federal programs are available to support transportationplanning, capital expenditures, and operating assistance. For example,transportation is an allowable support service under Social Services Block Grants,Community Services Block Grants, Medicaid, and the Workforce Investment Act.A detailed list of other federal resources is included in Appendix A.
State Funding ProgramsSome states have used federal TANF block grant or Welfare-to-Work formulafunds to support local or regional welfare-related transportation services. In NewJersey, for example, the state department of transportation set up aTransportation Innovation Fund (TIF) to provide seed money for local or regionaltransportation programs. Any county, municipality, public agency, private entity,or nonprofit organization may apply to the fund for seed money to initiateinnovative transportation solutions. Multiagency, multicounty, or regional projectsare encouraged.
The first round of TIF grants served as the required match for the FTA’s JobAccess and Reverse Commute Competitive Grants. The TIF grants were
Guidebook for Developing Welfare-to-Work Transportation Services
Page 7-9
awarded in two separate categories: TIF Community Transportation Grants,funded by state transportation funds; and TIF Welfare-to-Work Grants, fundedby U.S. DOL Welfare-to-Work grants. Total funding for TIF grants for FY 1999was $2 million for both grant categories. The DOT encourages fundingapplications to fall in the range of $100,000 to $150,000, with a maximum grantamount of $250,000. Eligibility criteria for the grants included the following:1
• Proposed project must cite evidence of coordination with the local CountyTransportation Coordination Steering Committee.
• Proposal must describe an on-going process for identifying and prioritizingtransportation needs.
• Proposed project must be part of a coordinated system that includes “towork” transportation services.
• Proposal must describe how a demonstrated gap in transportation service isbeing met.
• Proposal must include an on-going funding strategy which explains how theinitiative will be fully funded after TIF dollars are exhausted.
• Proposal must embrace a deficit-funding approach, using TIF dollars to fill ashort-term funding gap not met using existing funding sources.
TIF Community Transportation Grants are available for projects serving thegeneral population. TIF Welfare-to-Work Grants are restricted to helping thehardest-to-serve target populations as defined by the U.S. DOL and the NewJersey State Employment and Training Commission (SETC).2
Proposals are expected to combine funds from multiple sources. The InnovationFund will not fund more than 50 percent of any initiative, and preference will begiven to programs obtaining more than 15 percent of their funding from sourcesother than state and federal programs. Grant recipients will have up to 24months to spend program funds. Additional information on the TIF grantprogram can be found at www.state.nj.us/transportation/workforce/TIF.
Other states have set up similar competitive programs, including Michigan,Connecticut, and California.
Private Funding SourcesPrivate funding sources are playing a major role in supporting welfare-to-worktransportation. Programs have received grants and donations from a widerange of private sources, including foundations, employers, nonprofit communityorganizations, and faith-based organizations. Some examples are cited below.
Transit Cooperative Research Program
Page 7-10
• In Vermont, the Good News Garage is affiliated with the Lutheran SocialServices of New England with the assistance of volunteers from the areaLutheran churches. To support its transportation-related programs, theGarage received grants from Wheat Ridge Ministries, the Lutheran ChurchMissouri Synod World Relief Fund, Aid Association for Lutherans, LutheranBrotherhood, as well as the support from the Gift Fund of Lutheran SocialServices of New England, the sponsoring agency.
• Goodwill Industries is participating in automobile ownership programs inColorado and North Carolina, while United Way of Greater Tucson isassessing area transportation needs and resources.
• The San Diego/Imperial Chapter of the American Red Cross joined forceswith a coalition of local churches to provide transportation services insouthern California.
• The McKnight Foundation of Minneapolis, Minnesota, initiated the FamilyLoan Program in 1984 to help family members pay for unexpected expensesthat could interfere with their ability to keep a job or stay in school. In 1994,Family Service America entered into a partnership with the foundation toreplicate the Family Loan Program nationally. In addition to 12 programs inMinnesota, pilot programs are underway in Indianapolis, Indiana; Kansas City,Missouri; Milwaukee, Wisconsin; and Akron, Ohio. Most of the loans havebeen for cars, which have helped individuals better achieve their work andeducation goals. In fact, while some three out of four loan recipients werereceiving government assistance at the time of their loan application, theiruse of public assistance dropped by 40 percent within 2 years.
• UPS subsidizes transportation services to a number of its facilities, includingsites in Philadelphia, Hartford (Connecticut), and Louisville (Kentucky).
• In Missouri, more than 30 banks are participating in the FUTURES automobileloan program.
Although the role of the private sector in supporting welfare-relatedtransportation is still evolving, these programs show potential areas forparticipation.
Combining Funding SourcesMany programs have adopted a creative approach to funding by combiningmultiple funding sources to support a single program. The federal governmentin particular has taken specific steps to ensure that programs reflectcollaboration in planning and implementation. The Departments of Health andHuman Services, Labor, and Transportation have jointly issued guidance on theuse of federal funding sources to help states and communities take “full
Guidebook for Developing Welfare-to-Work Transportation Services
Page 7-11
advantage of existing resources to develop seamless, integrated servicesaddressing the transportation challenge of moving people from welfare to work.” 3
The FTA’s Job Access and Reverse Commute grant program, in particular, isintended to support coordinated regional programs. According to the jointlyissued Training and Guidance Letter (see Appendix C):
All projects funded under this program must be the result of acollaborative planning process that includes transportationproviders, agencies administering TANF and WtW funds, humanservices agencies, employers, metropolitan planning organizations,States, and affected communities and individuals. In addition, theprogram is expected to leverage other local funds that are eligibleto be expended for transportation and encourage a coordinatedapproach to transportation services.
The eligibility requirements and program parameters of each funding sourcefurther encourage such collaboration. For example, DOL Welfare-to-Work grantshave targeted a narrowly defined group of hard-to-serve TANF recipients, whilethe FTA Job Access and Reverse Commute program extends its reach to welfarerecipients and other low-income individuals. And while TANF funds may be usedto provide loans to lease or purchase vehicles, the Welfare-to-Work programspecifically excludes this application. Accordingly, many welfare-to-workprograms, including those profiled in this guidebook, have woven togethermultiple funding sources. For example, the State of New Jersey used formulaWelfare-to-Work funds to match grants awarded through the FTA Job Accessand Reverse Commute program.
Others have pieced together federal, state, local, and private funds to supporttheir programs.
• AC Transit, for example, funded service expansion on a late-night shuttle witha combination of agency operating funds, county sales tax revenues, and aFTA Job Access and Reverse Commute grant.
• TARC obtained an FTA Livable Communities Initiative to provide start-upcapital funding for the Nia Center and Night Owl Service and uses its ownoperating budget, supplemented with federal Congestion Management andAir Quality (CMAQ) funds, to operate the Night Owl. A federal Job Accessand Reverse Commute grant will allow the Night Owl to expand its servicearea.
• In Philadelphia, SEPTA operates the Horsham Breeze, which serves severalsuburban employers. Montgomery County, Pennsylvania, funds weekdayservice on the route, while individual employers support evening andSaturday service.
Transit Cooperative Research Program
Page 7-12
• Sojourner-Douglass College launched its AdVANtage II program with fundsfrom the Baltimore County Department of Social Services and technicalassistance from the Maryland Mass Transit Authority.
• Since its inception in 1996, the Good News Garage has combined fundingfrom numerous public and private sources, including its sponsoringorganization Lutheran Social Services of New England, the federalgovernment, private donations, and revenues from the sale of refurbishedcars.
• The Contra Costa County Department of Social Services combined a Welfare-to-Work grant from the U.S. DOL with matching TANF funds distributedthrough the State of California to support its shuttle van program.
These examples show the range of approaches to funding welfare-to-worktransportation programs – from federal grants to private donations. Whilefederal funding programs (including those disbursed through state agencies) area major source of support, many programs have assembled multiple fundingstreams for this purpose. Some of these coordinated approaches responded tothe federal requirements to demonstrate collaborative planning efforts. Otherswere practical responses to funding constraints or limitations on use.Regardless of the reason, this coordinated approach to funding welfare-to-worktransportation programs has come to typify the spirit of cooperation associatedwith welfare reform.
Develop a Funding PlanThe cost information developed earlier will form the basis of a funding plan thatoutlines the strategy for financing the proposed services. As the previoussection outined, numerous public and private funding sources are available tosupport welfare-to-work transportation. For each relevant funding source,planners should document the following:
••••• Funding level – How large is this funding source? How large are typicalgrants?
••••• Eligibility requirements – Is the program eligible to receive fundingthrough this source? Is the organization eligible to receive funding from thissource?
••••• Matching requirements – Does the funding source require the applicant tomatch a percentage of the funds? What is the share?
••••• Timing – When are the funds available? What is the application deadline?
••••• Sustainability – Is the source available for start-up funding only, or can itbe used for on-going program support?
Guidebook for Developing Welfare-to-Work Transportation Services
Page 7-13
••••• Program elements – What program elements are eligible for funding?Operating? Capital? Administrative? Planning?
••••• Target users – Does the funding source target particular programparticipants, such as TANF clients only?
••••• Application requirements – What is the process for applying for funding?What information is required?
••••• Coordination requirements – Does the funding source require evidence ofcollaboration among agencies?
••••• Reporting requirements – What information are funding recipientsrequired to collect and report to the funding agency?
After assessing the different financing sources, planners can develop a strategyfor pursuing one or more funding programs to support the proposed welfare-related transportation program.
Notes1 New Jersey Department of Transportation Office of Workforce and Community Transportation and
New Jersey Department of Human Services Office of Policy and Planning. “Proposed Guidelines:Transportation Innovation Fund.” Draft. January 12, 1998.
2 New Jersey Department of Transportation Office of Workforce and Community Transportation. “FY ’99Transportation Innovation Fund Program Guidelines and Application Procedures” November, 1998.
3 U.S. Department of Labor, Employment and Training Administration. Use of TANF, WtW, and JobAccess Funds for Transportation. June 1, 2000. [Online] Available at www.fta.dot.gov.
CHAPTER 8
Measuring SuccessMeasuring the effectiveness of welfare-to-work transportation programsprovides valuable feedback to staff, stakeholders, and funding sources about theprogram’s activities and results. Documenting activities and measuring outcomescan offer insight into the program’s performance and can help staff answerquestions like the following:
• Does the program make a difference in the lives of participants?
• How can the program be improved?
• Does the program comply with the rules and requirements of fundingsources?
Moreover, quantifying program progress can position program staff to seek on-going sources of funding. According to an executive at the United Way, “Today’sdonors require more than just a warm feeling in return for their contribution.They want to be sure their investment produces a result, that it makes ameasurable difference in their community.”1
This chapter discusses the basic steps in evaluating a welfare-to-worktransportation program: deciding what to measure, how to measure it, and howto collect the data to do so.
Deciding What To MeasureThe first step for program staff is to select an evaluation approach. This usuallyfalls into one of three broad categories:
••••• Program performance, to track the resources used to support the program(“Is this the most efficient strategy to meet client needs?”)
••••• Customer benefits, to assess the direct impacts on program participants(“Has this service expanded access to jobs?”)
••••• Societal benefits, to evaluate overall social costs and benefits (“How hascounty TANF participation changed?”)
Transit Cooperative Research Program
Page 8-2
The evaluation direction should reflect the goals and objectives developed earlierin the planning process and incorporate input from program staff, stakeholders,participants, and other interested parties.
Selecting IndicatorsFor each question or program outcome to be evaluated, one or moreperformance indicators will be defined. Performance indicators arecharacteristics that are tracked to measure how well a program achieves anoutcome. Each indicator will have one or more targets, which simply arespecific objectives for measuring indicators.
The specific criteria for evaluating a program may blend evaluation strategiestraditionally associated with transportation programs with those used by humanservices providers. For programs receiving federal grants, the first step is toreview the regulations governing the relevant funding program. Welfare-to-Work grants, for example, focus on employment and require recipients to trackvarious aspects of job placement. Job Access and Reverse Commute grantsfocus instead on monitoring improvements in access to employment;organizations receiving these FTA grants are asked to monitor serviceperformance characteristics and changes in accessibility to employmentopportunities. Other indicators will reflect the program performance relative toits goals and the evaluation questions. Finally, selection of performanceindicators should take into account the availability of data and the staffresources to collect and analyze the required information.
For example, managers assessing program performance may choose to trackprogram participation (“How many clients use the service?”) or costs (“Howmuch does it cost to serve the program’s customers?”). Assessments ofcustomer service may review changes in access (“Does the program help clientsreach more jobs?”) or convenience (“Has commuting time changed?”). Finally,assessments of social benefits may identify changes in TANF participation (“Havecounty expenditures on TANF benefits changed?”) or regional economic impacts(“Have statewide sales tax revenues increased?”).
After identifying the elements that will be measured, program staff has to definetargets for assessing program performance, costs, and benefits. The specifictargets will vary with the size and scope of the program and can be expected tochange over time.
How To Measure Program PerformanceTraditional transit programs often use three types of indicators to measureprogram performance: cost efficiency, service effectiveness, and costeffectiveness.
Guidebook for Developing Welfare-to-Work Transportation Services
Page 8-3
• Cost efficiency measures the amount of transportation services produced inrelation to the resources expended. Widely used measures include totaloperating cost per vehicle service hour and total operating cost per vehicleservice mile. In other words, how much does it cost – including labor,materials, and supporting services – to make service available to passengersfor one hour or one mile? Capital costs are excluded from this measure.The lower the unit cost, the greater the efficiency achieved.
• Service effectiveness measures consumption of transportation services inrelation to the amount of service available. Typical measures includepassengers per vehicle service hour and passengers per vehicle service mile.The more passengers per mile or hour, the higher the level of serviceeffectiveness.
• Cost effectiveness measures service consumption in relation to resourcesexpended. Measures may include operating cost per passenger or totalrevenue as a percentage of operating cost. The lower the cost perpassenger, or the greater the revenue in relation to expenditures, the morecost-effective the service.
These measures can easily be adapted to nontraditional programs. Forexample, a vehicle donation program may calculate cost effectiveness as totalprogram cost to assign a vehicle to a TANF recipient. A resource center, on theother hand, might track service effectiveness as intake interviews per staff hour.Some sample performance indicators that may be used to assess performanceof welfare-related programs are presented below:
• Number of bus passes issued
• Passengers per revenue-hour
• Operating costs per passenger
• Number of transit itineraries prepared by caseworkers
• Number of personal vehicles delivered to TANF clients
• Number of passengers who require transfers
• Number of individuals to operate van services
How To Measure Customer BenefitsMeasures of customer benefits may include a combination of quantitative andqualitative indicators. Program managers may choose to track changes inservice quality, access to employment, and job retention. Service quality, whichcan be defined as the difference between service delivery and customer
Transit Cooperative Research Program
Page 8-4
expectations, includes numerous attributes. In the context of welfare-relatedtransportation, these may include travel time, number of transfers, reliability,and safety. Managers may also choose to track improved access to transit; GISanalysis can easily be used to calculate factors like the change in jobs withinwalking distance of a new shuttle or route extension. Sample performancemeasures to track changes in customer benefits are listed below:
• Percentage of jobs located within one-quarter mile of fixed-route transit
• Change in out-of-pocket transportation costs
• Average length of job retention
• Number of passengers who require transfers
• Change in average travel time
How To Measure Societal BenefitsOne way to measure overall societal benefits of welfare-related transportation isto conduct a benefit-cost analysis. Calculating a benefit-cost ratio allowsprojects to be ranked and compared, facilitating an assessment of whichtransportation strategies achieve the greatest benefits relative to costs.
The principal measure of program benefits is income from employment,which could be assumed based on prevailing wage rages or obtained fromparticipants as part of a follow-up survey. The benefit obtained from reducedgovernment payments after people find jobs could also be estimated or,alternatively, obtained from special studies and surveys. On the cost side, thetotal costs of the project (both reimbursed and donated) would be tallied foreach project that is assessed. It is important that all costs are included becausethe costs would otherwise be skewed in favor of the projects with the greatestdonations. The general methodology to be used in estimating benefits and costfollows.
• Estimate the number of persons using transportation assistance from thelocal program to access work or work-related activities, annually.
• Estimate the annual value of that benefit per person.
• Multiply number of persons by benefit per person to obtain total benefitestimate.
• Estimate the total cost of providing this benefit and compare total costs withtotal benefits achieved.
Using these steps, it is possible to estimates a program’s impacts in relation toits costs.
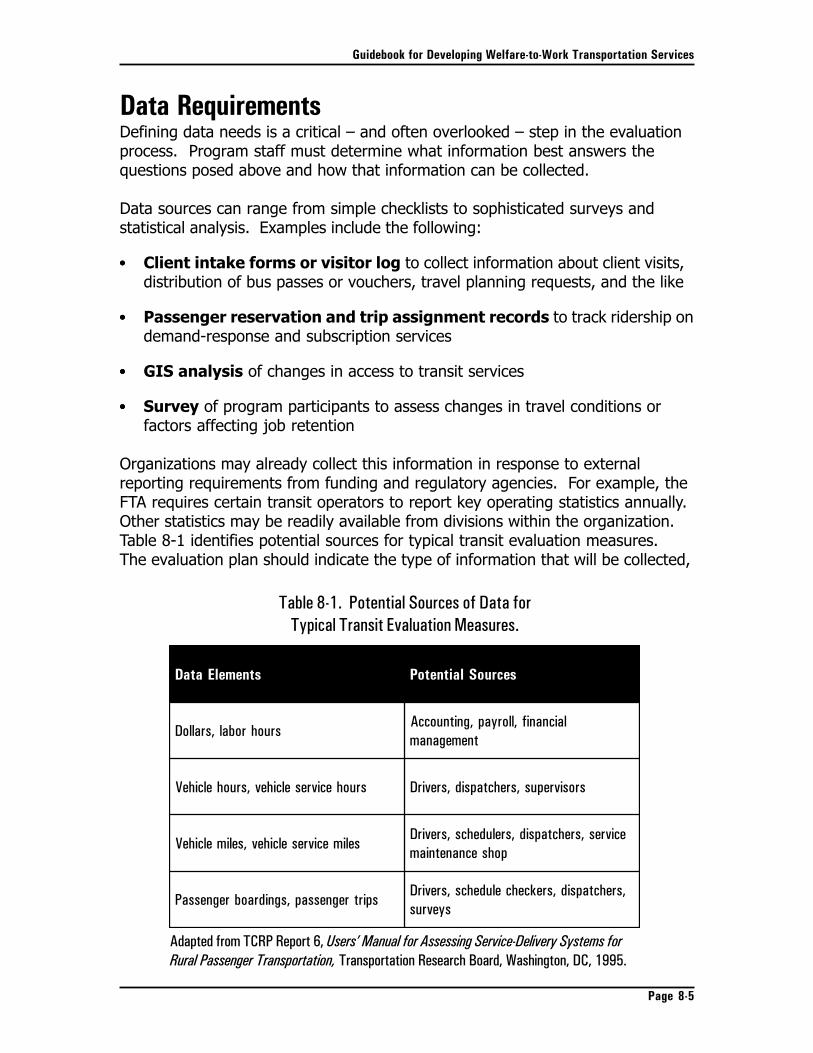
Guidebook for Developing Welfare-to-Work Transportation Services
Page 8-5
Data RequirementsDefining data needs is a critical – and often overlooked – step in the evaluationprocess. Program staff must determine what information best answers thequestions posed above and how that information can be collected.
Data sources can range from simple checklists to sophisticated surveys andstatistical analysis. Examples include the following:
••••• Client intake forms or visitor log to collect information about client visits,distribution of bus passes or vouchers, travel planning requests, and the like
••••• Passenger reservation and trip assignment records to track ridership ondemand-response and subscription services
••••• GIS analysis of changes in access to transit services
••••• Survey of program participants to assess changes in travel conditions orfactors affecting job retention
Organizations may already collect this information in response to externalreporting requirements from funding and regulatory agencies. For example, theFTA requires certain transit operators to report key operating statistics annually.Other statistics may be readily available from divisions within the organization.Table 8-1 identifies potential sources for typical transit evaluation measures.The evaluation plan should indicate the type of information that will be collected,
Adapted from TCRP Report 6, Users’ Manual for Assessing Service-Delivery Systems forRural Passenger Transportation, Transportation Research Board, Washington, DC, 1995.
stnemelEataD secruoSlaitnetoP
sruohrobal,sralloDlaicnanif,lloryap,gnitnuoccA
tnemeganam
sruohecivreselcihev,sruohelciheV srosivrepus,srehctapsid,srevirD
selimecivreselcihev,selimelciheVecivres,srehctapsid,sreludehcs,srevirD
pohsecnanetniam
spirtregnessap,sgnidraobregnessaP,srehctapsid,srekcehceludehcs,srevirD
syevrus
Table 8-1. Potential Sources of Data forTypical Transit Evaluation Measures.
Transit Cooperative Research Program
Page 8-6
determine whether a system is already in place to collect that data, identify thedata source, and assign responsibility for collecting the data. A sample datacollection form is included in Appendix F.
ChallengesThe evaluation process must take into account the unique characteristics ofwelfare-related transportation, many of which result from the need toconsolidate elements of transportation and social service programs. Afundamental difference between transportation and social service programs ishow they define their client base. Transportation programs generally focus onoverall ridership, while social service programs historically have tracked theprogress of individuals. This difference is reflected in funding and evaluationpractices. TANF funds, including those disseminated by the U.S. DOL, targetindividuals; FTA programs address programs and services. The respectiveevaluation requirements for programs funded through these sources mirrorthese different missions. Organizations combining these funding sources tosupport a single program will have to design an evaluation plan that takes bothsets of requirements into account.
Data collection also poses a set of challenges for welfare-related transportationprograms. Many communities – including some of those profiled in thisguidebook – do not collect sufficient data to evaluate their progress.Organizations may choose to target limited staff and funding resources onproviding transportation and related services rather than documenting theirefforts. In some cases, the information resides in different agencies in differentformats, making analysis unwieldy. When programs do collect information, theytend to focus on documenting specific elements of program performance, suchas customer participation and service costs. They are less likely to collect dataabout the employment status of program participants over time, which limitstheir ability to answer questions about societal benefits of their program.
Nevertheless, an effective approach to program evaluation can help sustainsuccess. First, evaluation allows staff to track progress over time and to modifythe program in response to identified trouble spots. For example, in PinellasCounty, Florida, program staff reassessed the level of incentive payments afterdata showed low use of carpooling services.
Second, quantifying program progress can position program staff to seek on-going sources of funding. Program funding sources want to see results, and awell-defined evaluation process can produce the information that potentialsponsors want to see. This is a particular benefit to welfare-relatedtransportation programs, many of which receive start-up funding for limitedperiods of time.

Guidebook for Developing Welfare-to-Work Transportation Services
Page 8-7
Notes1 Gary Ostroke, “Investing in Results.” News and Views: United Way of America’s Executive Newsletter
(vol. 2, issue 7), October 6, 1997. [Online] Available at www.unitedway.org.
Part 3: New Partnerships,
New Opportunities
CHAPTER 9
Working with the CommunityThis chapter summarizes four case studies describing exemplary programs thatprovide transportation services to welfare recipients and, in some cases, otherlow-income workers. The programs highlighted here have all benefited fromcollaborative relationships with community groups, educational institutions, andfaith-based organizations to address welfare-related transportation needs.They include the following:
••••• AdVANtage II, at Sojourner-Douglas College in Baltimore, Maryland, whichhelps students at this community-based college to provide transportationservices as van operators.
••••• Good News Garage, in Burlington, Vermont, a faith-based program thatrefurbishes donated automobiles and turns them over to low-incomeresidents.
••••• Lower San Antonio Transportation Support Project, in Oakland,California, which provides trip planning and support services to fivecommunity-based organizations in this multicultural community.
• San Diego Workforce Partnership, in California, which coordinatesresources from church groups and nonprofit organizations to provide work-related transportation.
All of the profiled programs responded to the transportation needs of theirclients by developing innovative partnerships with community programs,nonprofit organizations, and religious institutions. Some of the programsincorporated extensive outreach efforts to ensure that potential customers had avoice in program development. Finally, each program worked to empowerwelfare recipients and other low-income individuals by helping them obtain theskills and resources they needed to be self-sufficient – and to remain that way.
Transit Cooperative Research Program
Page 9-2
CASE
study
AdVANtage II: Sojourner - Douglass CollegeRecognizing that many job opportunities are located in the outlying suburbanareas, the Baltimore City Department of Social Services (BCDSS) formedpartnerships with several agencies and community-based organizations toaddress this challenge. To help bridge the gapbetween available jobs and eligible employees, BCDSSworked with Sojourner-Douglass College (SDC) andthe Maryland Mass Transit Administration (MTA) toinitiate a van service and entrepreneurial micro-enterprise program. The goal was to train publicassistance recipients as entrepreneurs who, in turn,provided transportation services to other recipients asthey searched for employment, attended job trainingand commuted to and from work. Sojourner-Douglass College is the State of Maryland’s only predominately African-American,urban, baccalaureate institution and specializes in educating the “nontraditionalstudent.” The average age of the student body is 38. Most students work orvolunteer full-time, in addition to raising families. In collaboration with BCDSS,SDC launched the AdVANtage II program. This initiative was closely modeledafter the AdVANtage Van Service and Micro-Enterprise Project in Anne ArundelCounty. (See Chapter 10.) The Community Transportation Association ofAmerica (CTAA) provided technical assistance, relevant transportationinformation and contacts.
The AdVANtage II ModelFunded with a grant of $650,600 from BCDSS, AdVANtage II intended to providetransportation services for up to 500 welfare-to-work recipients as theyconducted job searches and traveled to training sites and job assignments. Inaddition, 24 selected welfare recipients would train as self-employedtransportation providers, as well as certified Minority Business Enterpriseowners.
Once applicants were identified, they were required to complete a two-stepapplication process. After their basic reading, mathematical, and comprehensionskills were tested, applicants interviewed with two members of the project team.Twenty-five candidates were selected for the first incoming class.
Because the program was originally designed for applicants to lease vansthemselves, applicants were required to be creditworthy. When the participantscould not obtain individual bank loans, AdVANtage II had to acquire the vans.The project bought decommissioned sedans and station wagons from public andprivate companies. All of the vans are accessible to passengers with disabilities.The tax-exempt status of the college also allowed the acquisition of some
Guidebook for Developing Welfare-to-Work Transportation Services
Page 9-3
vehicles at no cost. MTA helped launchthe program by donating the first threevans of the fleet, as well as inspectingand refurbishing others. In addition,MTA technicians served as technicaladvisors to the project staff while theypurchased five other vehicles fromauctions.
Entrepreneurs participated in anintensive one-year training curriculumthat covered basic business,transportation, and marketing skills,along with assistance with incorporationas Minority Business Enterprises.Experienced transportation industry consultants designed the curriculumspecifically for the program. Members from the Service Corps of RetiredExecutives (SCORE) also served as consultants and mentors to the participants,helping them refine their business plans. After its first year, AdVANtage IItransformed 18 former welfare recipients into transportation owners/operators.
AdVANtage II ServiceAdVANtage II provides affordable transportation assistance for low-incomeindividuals and welfare recipients traveling to job training, searches, and sites.Ninety-five percent is reverse commute service. A fleet of 28 vans (including 10spares) serves scheduled routes to Anne Arundel County, Cecil County, District ofColumbia, Harford County, and Howard County. AdVANtage services operate onfixed-route schedules and are designed in conjunction with MTA to fill in servicegaps without competing with existing bus routes (see Figure 9-1).
Baltimore City riders can access the service at five origination points throughoutthe city. Eighty-five percent of the riders are transitioning welfare recipientswho use public transportation to reach the pick up points. Passenger fares rangefrom $4.00 to $9.00. Actual costs average $4.00 to $11.00 daily, but may besubsidized by TANF or employers. The TANF assistance is temporary, usuallyterminating after two months of full-time employment. Employers occasionallycontribute transportation costs, also on a time-limited basis.
AdVANtage II operates an average of 240 trips daily. Using a manual schedulingand routing system, service begins as early as 4:00 a.m. Monday through Fridayand runs until 12:30 a.m. Weekend service begins at 10:30 a.m. and runs until9:00 p.m. During the summer, the drivers also carry an average of 60 childrenper day to recreational activities and field trips.
Transit Cooperative Research Program
Page 9-4
AdVANtage II has proven to be a successful venture, with 18 van enterprises stillin operation. An evaluation process and customer satisfaction survey are indevelopment. Staff is working to transition the training program into a businessbeyond the initial funding period.
Lessons LearnedAfter careful review of the project, the AdVANtage II staff recognized severalproblems and issues that needed improvement and tried to continue programdevelopment accordingly.
••••• Unrealistic Start-Up Budget. After assessing the needs of the program,the project staff realized that a more realistic budget would have been closerto $1.5 million for the first year of operation. They based their funding needon the experiences of a suburban Maryland Department of Social Servicesprogram that managed a paratransit operation. Originally, they did notconsider the geographic and demographic differences between urbanBaltimore and suburban Baltimore County.
••••• Corporate Structure. The project is still in partnership with Sojourner-Douglass College. After the initial grant expired, AdVANtage II formed acompany with the College to keep the business afloat. AdVANtage II, LLC, isfunded by Sojourner-Douglass College; drivers are subcontractors toAdVANtage II. “This project would not have been more than a pipe dreamwithout the extensive support from Sojourner Douglass,” notes AdVANtage IIProject Director Jamal Mubdi-Bey.
For more information:Jamal Mubdi-Bey, DirectorOffice of Community OutreachSojourner-Douglass College500 North Caroline StreetBaltimore, Maryland 21205(410) 276-0306 x241(410) 276-1572 [email protected]
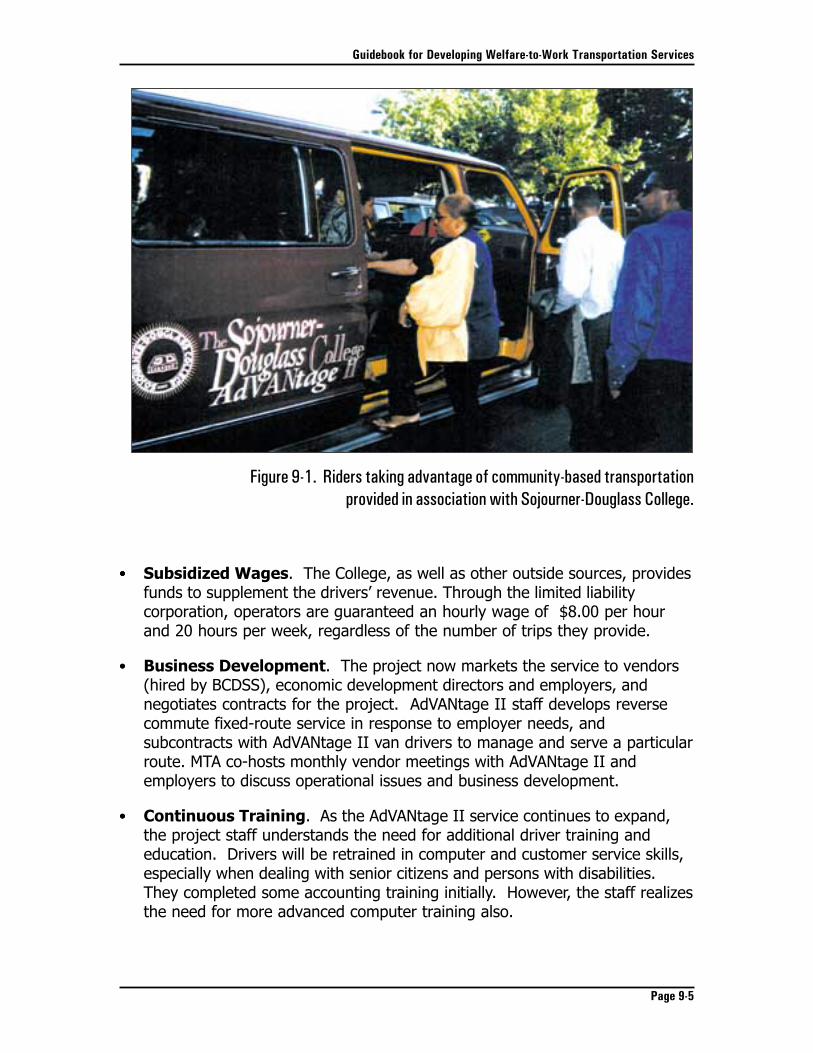
Guidebook for Developing Welfare-to-Work Transportation Services
Page 9-5
••••• Subsidized Wages. The College, as well as other outside sources, providesfunds to supplement the drivers’ revenue. Through the limited liabilitycorporation, operators are guaranteed an hourly wage of $8.00 per hourand 20 hours per week, regardless of the number of trips they provide.
••••• Business Development. The project now markets the service to vendors(hired by BCDSS), economic development directors and employers, andnegotiates contracts for the project. AdVANtage II staff develops reversecommute fixed-route service in response to employer needs, andsubcontracts with AdVANtage II van drivers to manage and serve a particularroute. MTA co-hosts monthly vendor meetings with AdVANtage II andemployers to discuss operational issues and business development.
••••• Continuous Training. As the AdVANtage II service continues to expand,the project staff understands the need for additional driver training andeducation. Drivers will be retrained in computer and customer service skills,especially when dealing with senior citizens and persons with disabilities.They completed some accounting training initially. However, the staff realizesthe need for more advanced computer training also.
Figure 9-1. Riders taking advantage of community-based transportationprovided in association with Sojourner-Douglass College.
Transit Cooperative Research Program
Page 9-6
ChallengesAlthough there were many successes, managing the transition from welfarerecipient to business owner is very challenging.
The most demanding obstacles facing the project were by far, financial.Acquisition of vehicles remained the most difficult challenge, due to theunsatisfactory credit histories of the clients. Financial constraints also forced thestaff to reduce the number of entrepreneurs, but they were able to work moreefficiently and effectively with a smaller, more qualified group.
Working with former welfare recipients also presented some culturalobstacles. BCDSS counsels some very difficult, “hard to place” clients.Baltimore City has the state’s largest number of residents who have remained onwelfare for more than five years, making the transition even more difficult.Compared to the rest of the United States, Maryland ranks lowest with thepercentage of residents who are transitioning off welfare by actively job huntingand working.
Staying in touch with van drivers also proved to be a challenge. In theinitial stages of recruitment, many of the candidates were difficult to reachbecause they did not own cellular telephones. Project staff quickly understoodthe importance of supplying van operators with telephones. Time managementbecame an issue with some of the transitioning clients, since being at workregularly and on time was a departure from their normal routine.
Finally, drivers need an on-going source of financial support during theirtransition to self-sufficiency, perhaps for as long as three years. As a result,the AdVANtage II staff anticipates that it will expand the types of services itoffers the van operators in the future, as well as continue the financial, trainingand mentoring support it currently provides.
Good News GarageThe Good News Garage, located in Burlington,Vermont, is a vehicle ownership program created andmanaged by Lutheran Social Services of New England,Inc. (LSSNE). The Good News Garage refurbishesautomobiles donated by individuals from NewEngland, New York, and New Jersey and sells them toeligible Vermont residents for the cost of the repairs.The concept of “transportation equity” for low-incomefamilies and individuals is central to the mission of theGood News Garage.
CASE
study
Guidebook for Developing Welfare-to-Work Transportation Services
Page 9-7
The Good News Garage began operationsin July 1996 with a start-up grant of$35,000 from Wheat Ridge Ministries. Theprogram currently has an annual budget of$415,000. Funding sources include LSSNE,grants from private and public agencies,private donations, and revenues from thesale of refurbished cars. The garage islocated in a former motorcycle repair facility in downtown Burlington.
RecipientsThe Good News Garage’s donated wheels program targets low-income residentsof Vermont. Eligibility is limited to those with a monthly income that does notexceed 150 percent of the federal poverty level, and applications fromindividuals with a need for transportation to work are given priority. In the nearfuture, access to public transit service (to the places and at the times that theapplicant needs to travel to work or training) will also be considered asapplications are evaluated. The Vermont Department of Social Welfare (DSW)also refers participants in Reach Up, the job-readiness component of Vermont’sTANF program, to the Good News Garage. In a satellite program in Vermont’sNortheast Kingdom, the Good News Garage provides vehicles for individualstrained and hired through a program funded with a federal DOL competitivegrant.
To date, 244 individuals have received cars from the Good News Garage. About300 individuals are currently on the waiting list, with an average wait of aboutsix months. While the program does not track ethnic or racial background ofvehicle recipients, staff believes that program clients probably mirror the ethnic/racial make-up of the Burlington population, of which about 4 percent are peopleof color. Most vehicle recipients are single mothers. Over time, the Good NewsGarage has seen more applicants and recipients in tougher financialcircumstances, and a growing number of refugees, particularly from Bosnia.
Vehicle Donation ProcessThe Good News Garage has no shortage of vehicles, most of which are donatedby private individuals. The Good News Garage is recognized by the InternalRevenue Service (IRS) as a not-for-profit charity, so donors are entitled toreceive a tax deduction for the retail value of their donated vehicle, asdetermined by the donor. With some exceptions, the project considers only cars10 years old or younger. About 5 percent of the vehicles donated to the GoodNews Garage are older model imported or luxury cars. Since such vehicleswould not be economical for recipients to operate and maintain, they arereconditioned and sold to the public at market prices to generate additionalrevenue for the program.
Transit Cooperative Research Program
Page 9-8
On average, it takes seven hours to make each vehicle reliable and to passinspection. To keep repair costs low, no body work is included, and radios or airconditioning systems are not repaired. On average, repairs cost $773; nomark-up for administration is added.
The vehicle recipient gets a detailed, itemized repair bill. Since many recipientshave never owned a car before, they are also given a packet developed by theGood News Garage’s Shop Manager with information about proper operation andmaintenance of an automobile, tips about dealing with repair shops, andsuggested garages for on-going maintenance.
In addition to the cost of repairs, vehicle recipients are expected to pay forregistration, title, state inspection, sales tax, and insurance. As part of theReach Up program, the DSW can provide up to $400 per client for assistancewith transportation, which may be applied toward Good News Garage vehiclerepairs.
Program FeedbackSeveral vehicle recipients offered the following commentsabout their experience with the Good News Garage:
• A reliable car, obtained at an affordable price, relieved agreat deal of stress from their lives and made it mucheasier to take children to school or doctors’ appointments,attend meetings, or get to work or training.
• All would recommend the Good News Garage withouthesitation to a friend who needed transportation.
• Although the bus system could meet local Burlington travel needs, the serviceis neither extensive nor frequent enough to make it a useful alternative fortraveling outside of Burlington. Without their Good News Garage cars,individuals would not be able to make necessary trips to other destinations,including the state capital in Montpelier.
• Participants appreciated the inspection checklist and itemized bill theyreceived with their vehicles. They felt they could trust the Good NewsGarage in a way they had not been able to trust mechanics or garages in thepast. This was especially important to female recipients, who may lack thetechnical knowledge to deal confidently with automotive maintenanceprofessionals, and to all recipients who do not have the resources to replaceor repair items unnecessarily or repeatedly until a problem is fixed.
• One recipient noted the need for a garage that low-income families can trustand expressed a desire to take her car to the Good News Garage for routine
Guidebook for Developing Welfare-to-Work Transportation Services
Page 9-9
maintenance.
• Participants understood that the Good News Garage staff plainly wants tohelp them solve their transportation problems. That the mission of theprogram is so clearly communicated to applicants and vehicle recipients, andso sincerely felt by the Good News Garage staff, appears to have much to dowith the personality of Director Hal Colston and the tone he sets for theorganization.
Participants only had one suggestion for improving the program. They asked tobe told where they stood on the waiting list and howlong it would take to obtain a vehicle.
Program EvaluationIn order to measure and evaluate the program’ssuccess, a survey questionnaire was distributed to thefirst group of vehicle recipients in January 1999.Nearly 90 percent of the 26 survey respondents had agross monthly household income of $1,500 or less. Nearly 70 percent needed avehicle to get a job, keep a job, or find a better-paying job, and nearly 46percent were single parents who needed a vehicle to transport children (multipleresponses were allowed). When asked about the single most important benefitthat they gained from having their Good News Garage car, over 63 percentidentified access to a job or training. Other benefits included increased incomeand better access to medical care, child care, affordable housing, andeconomical shopping opportunities. The survey will be distributed to newrecipients every six months, and the results accumulated.
Program Lessons LearnedStaff offered the following observations, which may apply to a variety ofwelfare-related transportation programs:
• The assistance of volunteers, both during start-up and on-going operation ofthe program, is invaluable.
• Starting a new program or nonprofit venture is a slow process with manylogistical problems. Take the time to do formal planning. Start on a smallscale and quietly, so that any issues that are likely to cause resistance to theprogram are not highlighted from the beginning. Give local support a chanceto build.
• Collaboration among public agencies, the state legislature, and faith-based,community and nonprofit organizations in Vermont was a major factor in theimplementation of the Good News Garage and continues to be important tothe program’s growth. Gaining public support and funding has enabled theprogram to hire a critical mass of staff, which in turn generated more
Transit Cooperative Research Program
Page 9-10
For more information:Hal ColstonLutheran Social Services of New England, Inc.One Main StreetSuite 214Burlington, VT 05401802-864-6017802-864-6033 [email protected]
opportunities for successful outcomes.
• Choose the right people to staff the program.
• The faith-based origin of the Good News Garage was important because ofLSSNE’s emphasis on developing and supporting programs to help people livemeaningful lives, and the access to critical start-up funding, donated goodsand services for start-up and a pool of volunteers.
• The program director’s personal faith in the program’s concept; his dedicationto its creation; and his clear communication of its mission to program staff,vehicle recipients, agency partners and funding sources have been majorfactors in the success of the program.
• The simpler and more understandable the program is, the easier it is toimplement and the more successful it will be.
• The results of a formal program evaluation process that measures successand tracks outcomes is very useful when approaching potential fundingsources for support.
Lower San AntonioTransportation Support ProjectThe East Bay Asian Local Development Corporation(EBALDC), created in 1975, works with community-based groups, nonprofit organizations, churches,
CASE
study
Guidebook for Developing Welfare-to-Work Transportation Services
Page 9-11
schools, and merchant associations in Oakland, California, and neighboringcommunities. In 1998 EBALDC convened the Lower San Antonio Welfare toWork Partnership, a collaborative of community-based organizations, interfaithorganizations, and public agencies working to develop a welfare-to-work plan forthis Oakland neighborhood. Lower San Antonio, which has a large concentrationof Asian and Mexican immigrants, has one of the highest levels ofunemployment in the area. (Figure 9-2 illustrates one of the planning initiativesfor this community.)
Program DescriptionAs part of the initial needs assessment for the welfare-to-work plan, EBALDCcoordinated 16 focus groups in and around the Lower San Antonioneighborhood. Focus groups were designed to identify both the job interests ofTANF recipients and the barriers to employment that they encountered. Focusgroups were held in seven languages: Cambodian, Chinese, English, Low Lao,Mien, Spanish, and Vietnamese.
EBALDC selected twelve community-based organizations to host the focusgroups. EBALDC provided these organizations with technical assistance and thefollowing research tools:
• Screener instrument to ensure that focus group participants wererepresentative of the neighborhood population
• Survey instrument to collect information about each participant’s jobinterests, barriers to employment, and work experience
• Focus group discussion outline to gather qualitative information about jobinterests and barriers to employment
The focus groups consisted of 6-8 individuals who lived in the Lower San Antoniocommunity and who had received TANF benefits for more than two years. Thecommunity organizations were responsible for recruiting and screeningparticipants to ensure that they met the criteria, using the brief questionnaireprovided by EBALDC. Each community organization provided a bilingual meetingfacilitator and recorder, meeting space, and refreshments for participants.EBALDC provided training for meeting facilitators and recorders. The hostorganization was expected to prepare a set of English-language meeting noteswithin a week of each focus group. Each host organization received a stipend of$900 for its efforts; focus group participants received $30 for their time.
Program FindingsFocus group participants identified three major barriers to employment:language, child care, and transportation. About half said that transportation is
Transit Cooperative Research Program
Page 9-12
keeping them from finding a job. Among the transportation issues cited werecost, safety, and routing/scheduling problems, as highlighted below.
• Participants were frustrated with bus and rail schedules – especially lack ofservice for graveyard and swing shifts – and long travel times. Some focusgroups summed it up neatly: “Jobs are too far away.”
• Some focus group participants indicated that commuting costs were too high(although others considered transit affordable).
• About 40 percent of the women in focus groups did not know how to drive ordid not have a valid driver’s license.
• Women, in particular, were concerned about safety, especially when travellingat night or early in the morning. Some women recounted prior badexperiences: “One time, I was waiting for a bus for one and a half hour.Another time, I was waiting for the bus with my two small children and Igot robbed.”
Figure 9-2. TheLower San AntonioNeighborhood Plan
identified strategiesfor revitalizing this
multiculturalOakland
neighborhood.
Guidebook for Developing Welfare-to-Work Transportation Services
Page 9-13
Transportation Support ProgramBased on these focus group findings, EBALDC developed the Lower San AntonioTransportation Support Project. Working in collaboration with RIDES for BayArea Commuters, EBALDC is providing transportation support to five community-based organizations. Each organization designated a transportation counselor toprovide trip planning services for TANF clients.
RIDES provides training for the counselors, administers incentives for clients touse transit or ridesharing (e.g., vouchers), and tracks program use. Theprogram also provided funding for computers with Internet access to supporttrip planning.
Counselors will work with clients to identify transportation alternatives to helpthem move into the work force. Resources available to the counselors, who arebilingual, include area transportation resource guides, transit maps andschedules, fare information, regional telephone travel information and – in the
For more information:Margaret GalbraithProgram AssociateEast Bay Asian Local Development Corporation310 8th Street, Suite 200Oakland, CA 94607510-287-5353 x425510-763-4143 [email protected]
Jeffrey BecerraCommute Services ManagerRIDES for Bay Area Commuters, Inc.1333 Broadway, Suite 601Oakland, CA 94612-1906510-893-7665510-622-0201 [email protected]
Transit Cooperative Research Program
Page 9-14
near future – Internet-based transit trip planning services. Counselors will beavailable to assist clients with new transportation needs when they change jobs.
What To ExpectThe program’s goal is to remove transportation as a barrier to employment andto help community residents become self-sufficient.
This program was designed to serve at least 35 clients per year; additionalincentives were available to the community organizations for increasing theirannual client base to 45.
EBALDC is conducting a qualitative assessment of the program to track the“rhyme and reason of success.” An intake form and log were developed to trackclient progress. (For example, did clients miss work because of transportation?)As part of the evaluation, counselors will track origin-destination pairs thatclients cannot make.
Lessons Learned• For EBALDC, an established nonprofit community development organization,
working in transportation was a new experience. For RIDES, the Bay Area’sridesharing organization, the challenge was learning about welfare-relatedissues.
• For both organizations, however, one of the major challenges of this projectwas understanding the complex requirements of available funding sources –the strings attached – and finding creative ways to tap into these resources.
• One of the advantages of working with community-based organizations istheir responsiveness to their clients. These organizations are not constrainedby bureaucratic requirements and “will not lose clients in the shuffle.”Moreover, members of the target population typically do not speak English,rarely leave their community, and find transit intimidating. The transportationcounselors at community organizations speak the same language as theirclients and are sensitive to their cultures, thus increasing the level of comfortand trust. Clients, in turn, may find it easier to seek transit information froma member of their community than from the bus company. Also, becausecommunity-based organizations are local, clients do not have to leave theirneighborhood to obtain help and support.
• Community organizations may have more leeway to combine funding sourcesthan public agencies. But because the project took advantage of county andfederal funds, planners had to respond to the challenges of coordinatingefforts when funding arrived at different – and not always predictable – rates.
Guidebook for Developing Welfare-to-Work Transportation Services
Page 9-15
San Diego Workforce PartnershipThe San Diego Workforce Partnership, Inc., wascreated in 1974 through an official agreementbetween the City and County of San Diego. Servingas San Diego’s regional Private Industry Council, thePartnership provides comprehensive training,placement and career planning for individualsthroughout San Diego.
In July 1998, the Partnership collaborated with several local faith-based,community, and state organizations to develop a welfare-to-work program toaddress child-care and transportation issues, develop employment opportunities,and enhance the community’s capacity to support residents who are transitioningfrom welfare to the workplace. The resulting Work First Community ResourceCenter received $5 million from the U.S. DOL Welfare-to Work competitive grantprogram. The 18-month project began in October 1998.
The project targets residents of an impoverished inner city area in southeasternSan Diego. About 60 percent of the residents in this diverse community areHispanic, 23 percent are African American, 11 percent are white, and 5 percentare Asian. The community is also home to a significant number of refugees fromCentral Africa and East Asia. Major employment centers are at least five milesfrom the targeted neighborhood and are difficult to reach without specializedtransportation. Limited near-by job opportunities, a lack of adequate culturallyappropriate child-care services, and inadequate transportation services furthercompound the barriers to employment among targeted program participants.
The San Diego Regional Welfare to Work Transportation Coalition was formed toaddress these transportation needs. Coalition members include the City andCounty of San Diego, the American Red Cross, regional transportation plannersand operators, San Diego Department of Health and Human Services, San DiegoAssociation of Governments (SANDAG) and the San Diego WorkforcePartnership, Inc. The Coalition developed a transportation network to supportthe Work First Community Resource Center, using the resources of twoexperienced transportation providers: San Diego/Imperial Chapter of theAmerican Red Cross and All Congregations Together (ACT).
The San Diego/Imperial Chapter of the American Red Cross has providedtransportation for more than 60 years and driver training for the past 19 years.As the Coordinated Transportation Services Agency for San Diego (CTSA), theRed Cross maintains a fleet of 80 buses that are owned and operated byregional social services agencies, and uses a computerized scheduling anddispatch system to coordinate the regional paratransit services.
CASE
study
Transit Cooperative Research Program
Page 9-16
Recognizing the potential powerful role of the faith community, the San DiegoHealth and Human Services Agency collaborated with local churches to establishAll Congregations Together (ACT) in 1996. This nonprofit organization wasestablished to develop and implement community projects that promote self-sufficiency. Among its programs, ACT established Community Link (ComLink) tomeet the transportation needs of welfare recipients who are making thetransition to the workplace. In the program, member churches lease their vansto ACT during down times to transport recipients and their children to and fromchild care, training, and/or employment.
Service DescriptionThe collaborating organizations worked to develop nontraditional transportationservices that would build on ACT’s existing ComLink service. The memberchurches were eager to help and learn how their contributions could be bestutilized. Research through local census data and maps indicated that fixed-route service would be the most efficient and effective way to transport workersfrom the target community to the region’s major employment areas. The RedCross and other Coalition members designed fixed routes to 3 majoremployment centers:
• Factory jobs along the Mexican border
• Ship-building, manufacturing, and service jobs along the Pacific Coast
• Manufacturing, hi-tech, entry-level corporate, and service jobs in thecentral city
As shown in Figure 9-3, routes originate at the Community Resource Center atChollas View, which serves as a transportation hub. The Red Cross uses 20-passenger buses to provide transportation 24 hours a day, 7 days a week.
The Red Cross/CTSA worked with ACT to integrate the existing ComLinktransportation services with the new program. ACT transports programparticipants and their children to and from the hub in 16-passenger church vans.For some, child-care services are available at the Chollas View site; for othersthe ACT van service transports children to their designated care takers. At thehub, recipients board their respective buses for work. The ACT van feederservice operates from 6:00 a.m. Monday to 10:00 p.m. Saturday. The Red Crossfills in with curb-to-curb or public transit feeder service when the vans are in usefor church purposes. Funded as part of the DOL grant, the transportation serviceis provided at no cost to the recipients until they have successfully maintainedunsubsidized employment for 6 months.
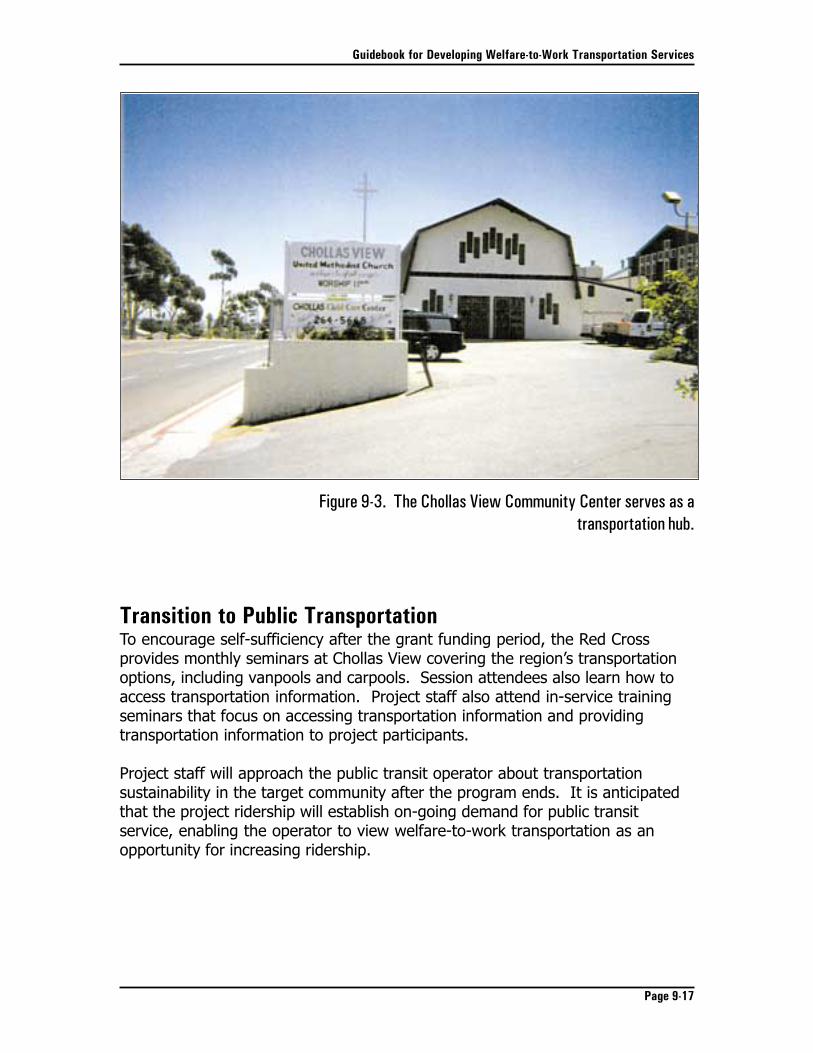
Guidebook for Developing Welfare-to-Work Transportation Services
Page 9-17
Transition to Public TransportationTo encourage self-sufficiency after the grant funding period, the Red Crossprovides monthly seminars at Chollas View covering the region’s transportationoptions, including vanpools and carpools. Session attendees also learn how toaccess transportation information. Project staff also attend in-service trainingseminars that focus on accessing transportation information and providingtransportation information to project participants.
Project staff will approach the public transit operator about transportationsustainability in the target community after the program ends. It is anticipatedthat the project ridership will establish on-going demand for public transitservice, enabling the operator to view welfare-to-work transportation as anopportunity for increasing ridership.
Figure 9-3. The Chollas View Community Center serves as atransportation hub.
Transit Cooperative Research Program
Page 9-18
Training for Transportation-Related JobsIn addition to providing transportation services, project staff intend to place 100recipients in unsubsidized jobs in transportation-related occupations, includingdelivery, shuttle, and bus drivers. Jobs will be developed at a regional shuttlevan operator, the American Red Cross, San Diego Transit, and UPS.
The Red Cross is training qualified participants to obtain Commercial Driverlicenses (Class B Driver). Both the Red Cross and ACT are providing participantswith paid work experience (subsidized by the project) in a shuttle service setting.Participants learn how the driver deals with multiple stops and handlingpassengers. Participants will also obtain work experience in clerical andcommunity settings to learn how to dispatch and track shuttle runs andschedules. Participants with Class C licenses and good driving records are beingtrained to drive ACT vans to transport recipients and their children to and fromthe hub or public transportation routes. ACT will also provide post-employmentand job retention services at the Community Resource Center.
Lessons LearnedAlthough the Community Resource Center will open later than anticipated,transportation service is currently operating as planned. Thus far the projectappears to be a success; the following points and lessons learned are offered asadvice to others seeking to establish similar programs.
The key component for success is collaboration. The Coalition evolved intoa group with a shared mission because of the relationships that developedbetween the individuals representing the various organizations. According to aCoalition member, “It’s people and relationships, not organizations…”
For more information:Linda Womack, Administrative CoordinatorSan Diego Workforce Partnership, Inc.1551 Fourth Avenue, Suite 600San Diego, California 92101(619) 238-1445(619) 235-8105 [email protected]
Guidebook for Developing Welfare-to-Work Transportation Services
Page 9-19
• In the beginning there was considerable overlap of services among theproviders, and numerous turf issues had to be resolved. The partners had tolearn to “own” the project and how to cooperate as a group to achieve theintended goals. This process required a lot of team-building exercises. TheWorkforce Partnership was able to help many of the other organizations tosort out their turf issues, by focusing not only on what each group wantedbut also what each group could contribute.
• The learning process is dynamic and on-going. Not every issue can beanticipated at the start.
• Some partners will play a larger role than others, but ownership is still sharedamong all participants.
• It is important to recognize that liability is also shared. Accordingly, it isimportant to review arrangements and agreements to ascertain liability (i.e.,insurance, lease agreements, etc.).
The participation of the churches was a key ingredient for success.Consistent with their “helping mission,” the churches wanted to participate inwelfare reform efforts and also sought to make more efficient use of their vans.They were eager to contribute as well as learn about efficient transportationservice delivery.
• When meetings got a little off kilter, “the reverends were able to step in andcalm everyone down.” In addition, the churches are willing to accept traineesas potential employees that traditional employers may not accept. In severalinstances, participants seemed more comfortable with the mentoring style ofthe churches.
• On the other hand, it can be difficult for secular organizations to work withfaith-based groups. The challenge for the church groups was to movebeyond “thinking and acting from the heart” to deal with the realities of grantrules and regulations.
• Because many agencies do not want to fund religious groups, some churchorganizations have attached themselves to a collaborative or formed anonprofit corporation to create an umbrella organization for communityservice. For example, ACT is a nonprofit, public benefit organization. Themajority of the members of its board of directors are communityrepresentatives, rather than religious leaders.
Programs must be tailored to meet the unique needs of eachcommunity. Efforts should be concentrated in an area where everyone wantsto participate. It is critical to have a community that really cares about its future
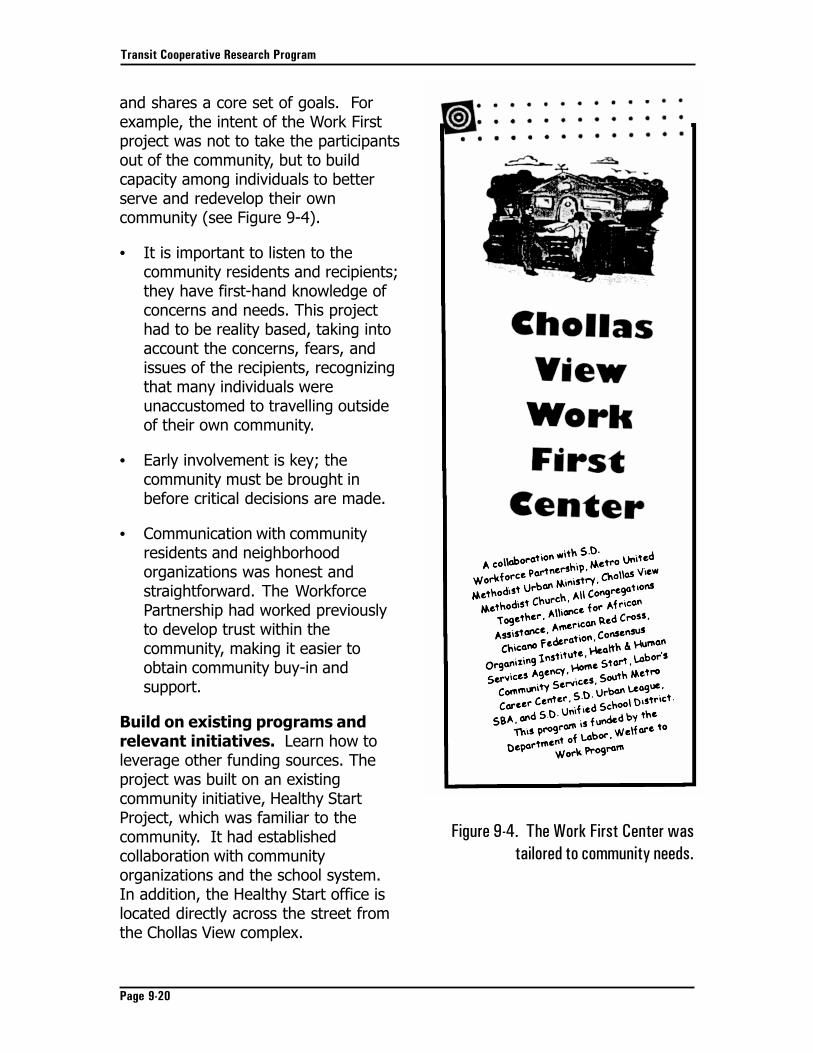
Transit Cooperative Research Program
Page 9-20
and shares a core set of goals. Forexample, the intent of the Work Firstproject was not to take the participantsout of the community, but to buildcapacity among individuals to betterserve and redevelop their owncommunity (see Figure 9-4).
• It is important to listen to thecommunity residents and recipients;they have first-hand knowledge ofconcerns and needs. This projecthad to be reality based, taking intoaccount the concerns, fears, andissues of the recipients, recognizingthat many individuals wereunaccustomed to travelling outsideof their own community.
• Early involvement is key; thecommunity must be brought inbefore critical decisions are made.
• Communication with communityresidents and neighborhoodorganizations was honest andstraightforward. The WorkforcePartnership had worked previouslyto develop trust within thecommunity, making it easier toobtain community buy-in andsupport.
Build on existing programs andrelevant initiatives. Learn how toleverage other funding sources. Theproject was built on an existingcommunity initiative, Healthy StartProject, which was familiar to thecommunity. It had establishedcollaboration with communityorganizations and the school system.In addition, the Healthy Start office islocated directly across the street fromthe Chollas View complex.
Figure 9-4. The Work First Center wastailored to community needs.
Guidebook for Developing Welfare-to-Work Transportation Services
Page 9-21
Sustainability should be the ultimate project goal. It is extremelyimportant to build a lasting infrastructure to continue service delivery beyond theterm of the project. It is critical to build capacity within the community forsustainability. For example, Metro United Methodist Urban Ministry will continueproject management and solicitation of funding sources. The Childcare Institutehas capacity for 36 placements. The income from paid child-care services willserve as program operating revenue. The public transit operator will beapproached for continuing support of the fixed-route service, and consumers willbe educated to identify other transportation options.