tcww eliminate 1 sg -...
TRANSCRIPT

1
Online Student Guide
The Quality Group. All Rights Reserved

2
Table of Contents
LEARNING OBJECTIVES ...................................................................................................................................... 3 INTRODUCTION .................................................................................................................................................... 3 EXPOSE -‐‑ STOP THE STOPS (STS) .......................................................................................................................................... 3 ELIMINATE -‐‑ STOP THE STOPS (STS) ................................................................................................................................... 3
1. IDENTIFY THE PROBLEM .............................................................................................................................. 3 RESPONSE TEAM ........................................................................................................................................................................ 4 PROBLEM ANALYSIS .................................................................................................................................................................. 4 DEFINE THE DESIRED STATE .................................................................................................................................................. 5
2. IDENTIFY ROOT CAUSES ............................................................................................................................... 6 ROOT CAUSE ANALYSIS: THREE BASIC STEPS ..................................................................................................................... 6 CAUSE AND EFFECT TOOLS ...................................................................................................................................................... 6 WHAT IS A ROOT CAUSE? ......................................................................................................................................................... 6 THE 5 WHYS ............................................................................................................................................................................... 7 THE 5 WHYS: KEY BENEFITS .................................................................................................................................................. 7 HOSPITAL SCENARIO ................................................................................................................................................................. 7 5 WHYS EXAMPLE ..................................................................................................................................................................... 8
SELECT AND IMPLEMENT A SOLUTION ........................................................................................................ 8 MOONSHINING ............................................................................................................................................................................ 9 TRYSTORMING ............................................................................................................................................................................ 9 PARETO CHART .......................................................................................................................................................................... 9
SUMMARY ............................................................................................................................................................. 10
© 2012 by The Quality Group. All rights reserved. Version 5.0 January, 2012 Terms of Use This guide can only be used by those with a paid license to the corresponding course in the e-‐Learning curriculum produced and distributed by The Quality Group. No part of this Student Guide may be altered, reproduced, stored, or transmitted in any form by any means without the prior written permission of The Quality Group. Trademarks All terms mentioned in this guide that are known to be trademarks or service marks have been appropriately capitalized. Comments Please address any questions or comments to your distributor or to The Quality Group at [email protected].

3
Learning Objectives
Upon completion of this course, student will be able to: • Look at the Eliminate step of The Curtiss-‐Wright Way process • Show how the use of 5 Whys, Moonshining, Trystorming, and Pareto Analysis are key tools in the
relentless pursuit of root cause
Introduction
Expose -‐ Stop The Stops (STS) In the previous module you saw how the Stop the Stops process for Exposing, Eliminating, and Excelerating a problem is a key component of the Curtiss-‐Wright Way. You saw how managers following Leader Standard Work are accountable for implementing and monitoring visual management tools to expose waste and identify stops.
Eliminate -‐ Stop The Stops (STS) In this module we will look at the fourth step in The Curtiss-‐Wright Way, Eliminate. Here we will introduce tools and techniques which get at the heart of Operational Excellence – stop the stops problem solving, visual management, leader standard work and accountability. We'll also see how the use of tools like 5 Whys, Moonshining, Trystorming, and Pareto Analysis are key in the relentless pursuit of root cause. 1. Identify the Problem
Recall that The Curtiss-‐Wright Way requires continuous problem solving by everyone in the company. Our success depends on how quickly and efficiently we can stop the stops. Let’s go back to our previous example of the manufacturing cell with the problem of mixed or incorrect materials coming from the warehouse. In the Expose step we use Leader Standard Work and visual management tools to expose and quantify the

4
problem. Once the problem is identified, a response team will focus on finding and eliminating root cause. Response Team In this case, the line stops several times due to incorrect parts that are provided with a job order. The response team will assess the situation and bring in experts as needed. The team will execute a Focused Improvement Event following a five-‐step problem solving process to define the problem, determine root causes, implement fixes to eliminate the problem, and follow up. Once the problem is eliminated, the team and workers in the area will celebrate and be recognized for their success.
In this module we'll focus on the first three steps of the problem solving process. In the Expose step we identified the problem and in the eliminate step we will define the problem in detail and identify root causes. Once the solution is selected it will be implemented. In the final step the team will celebrate and promote the solution. Once the new process is in place they will follow up to ensure that the problem has been permanently fixed, and excelerate. Problem Analysis Before we can solve a problem we must define it. This is the first attempt by the team to document what is known about a problem, and what additional information needs to be collected to assist the problem solving effort. The analysis can be done several ways. This is an example of a typical format.
5
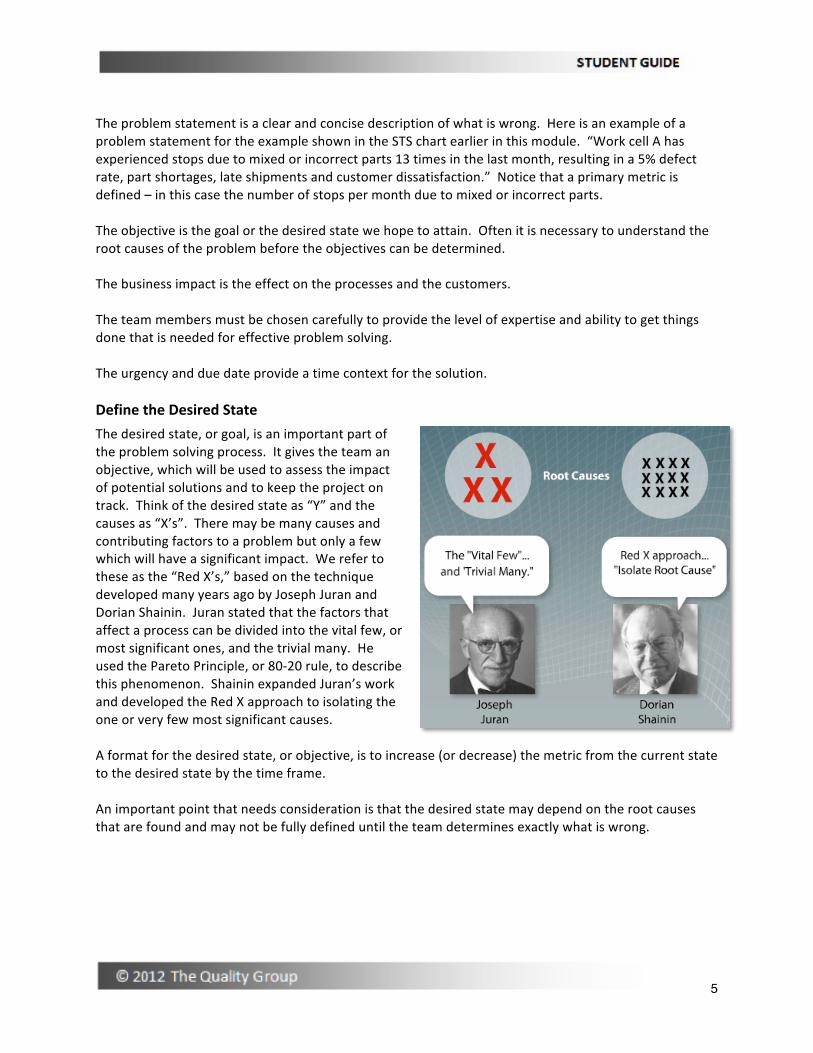
The problem statement is a clear and concise description of what is wrong. Here is an example of a problem statement for the example shown in the STS chart earlier in this module. “Work cell A has experienced stops due to mixed or incorrect parts 13 times in the last month, resulting in a 5% defect rate, part shortages, late shipments and customer dissatisfaction.” Notice that a primary metric is defined – in this case the number of stops per month due to mixed or incorrect parts. The objective is the goal or the desired state we hope to attain. Often it is necessary to understand the root causes of the problem before the objectives can be determined. The business impact is the effect on the processes and the customers. The team members must be chosen carefully to provide the level of expertise and ability to get things done that is needed for effective problem solving. The urgency and due date provide a time context for the solution. Define the Desired State The desired state, or goal, is an important part of the problem solving process. It gives the team an objective, which will be used to assess the impact of potential solutions and to keep the project on track. Think of the desired state as “Y” and the causes as “X’s”. There may be many causes and contributing factors to a problem but only a few which will have a significant impact. We refer to these as the “Red X’s,” based on the technique developed many years ago by Joseph Juran and Dorian Shainin. Juran stated that the factors that affect a process can be divided into the vital few, or most significant ones, and the trivial many. He used the Pareto Principle, or 80-‐20 rule, to describe this phenomenon. Shainin expanded Juran’s work and developed the Red X approach to isolating the one or very few most significant causes. A format for the desired state, or objective, is to increase (or decrease) the metric from the current state to the desired state by the time frame. An important point that needs consideration is that the desired state may depend on the root causes that are found and may not be fully defined until the team determines exactly what is wrong.
6
2. Identify Root Causes
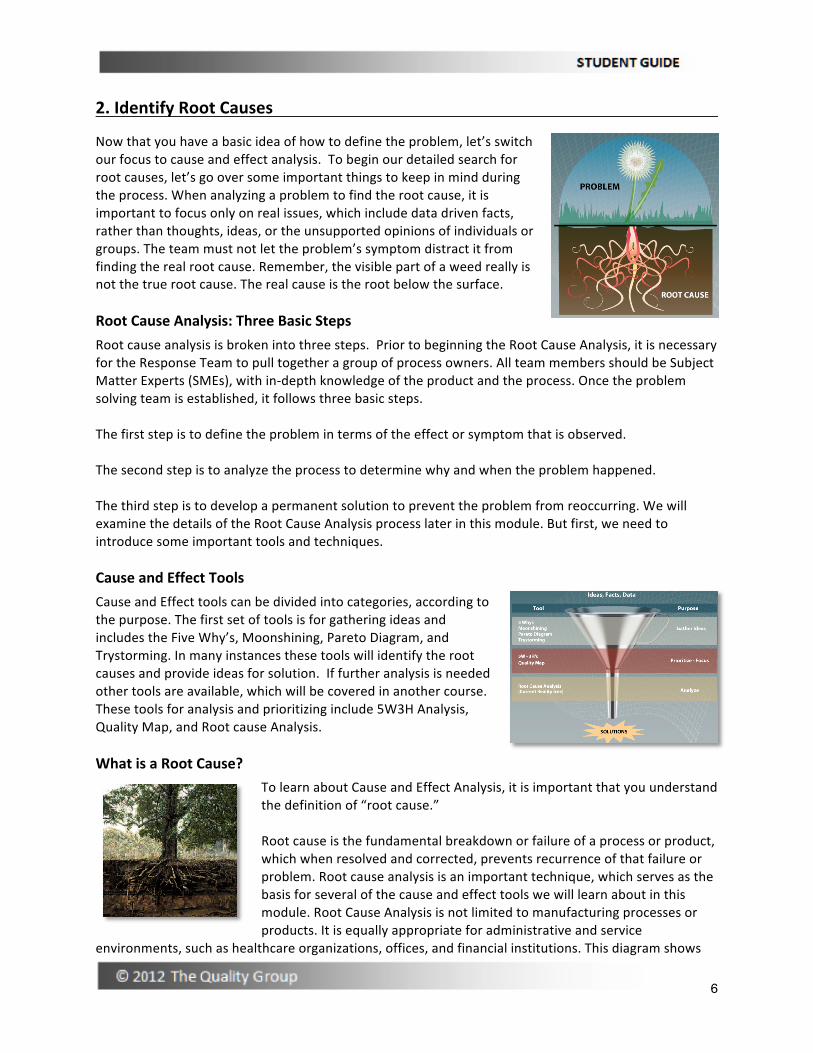
Now that you have a basic idea of how to define the problem, let’s switch our focus to cause and effect analysis. To begin our detailed search for root causes, let’s go over some important things to keep in mind during the process. When analyzing a problem to find the root cause, it is important to focus only on real issues, which include data driven facts, rather than thoughts, ideas, or the unsupported opinions of individuals or groups. The team must not let the problem’s symptom distract it from finding the real root cause. Remember, the visible part of a weed really is not the true root cause. The real cause is the root below the surface. Root Cause Analysis: Three Basic Steps Root cause analysis is broken into three steps. Prior to beginning the Root Cause Analysis, it is necessary for the Response Team to pull together a group of process owners. All team members should be Subject Matter Experts (SMEs), with in-‐depth knowledge of the product and the process. Once the problem solving team is established, it follows three basic steps. The first step is to define the problem in terms of the effect or symptom that is observed. The second step is to analyze the process to determine why and when the problem happened. The third step is to develop a permanent solution to prevent the problem from reoccurring. We will examine the details of the Root Cause Analysis process later in this module. But first, we need to introduce some important tools and techniques. Cause and Effect Tools Cause and Effect tools can be divided into categories, according to the purpose. The first set of tools is for gathering ideas and includes the Five Why’s, Moonshining, Pareto Diagram, and Trystorming. In many instances these tools will identify the root causes and provide ideas for solution. If further analysis is needed other tools are available, which will be covered in another course. These tools for analysis and prioritizing include 5W3H Analysis, Quality Map, and Root cause Analysis. What is a Root Cause?
To learn about Cause and Effect Analysis, it is important that you understand the definition of “root cause.” Root cause is the fundamental breakdown or failure of a process or product, which when resolved and corrected, prevents recurrence of that failure or problem. Root cause analysis is an important technique, which serves as the basis for several of the cause and effect tools we will learn about in this module. Root Cause Analysis is not limited to manufacturing processes or products. It is equally appropriate for administrative and service
environments, such as healthcare organizations, offices, and financial institutions. This diagram shows

7
that garden plants are dying, and it lists four causes. Can you tell which is the root cause? Here, the root cause of the problem is not apparent and, to find it, we need to do a basic “Root Cause Analysis.” The 5 Whys The Five Whys is a simple problem solving technique used to quickly get to the root of a problem. It serves as the basis for many Root Cause Analysis methods. The 5 Whys was made popular in the 1970s by the Toyota Production System. The strategy involves looking at any problem and asking the questions, "Why?" and "What caused this problem?” over and over, until the root cause can be determined.
Although this simple technique is referred to as the Five Whys, the two questions may be asked as many times as necessary, depending on the complexity of the problem. Very often, the answer to the first "Why?" will prompt another "Why?"; the answer to the second "Why" will then prompt another "Why?", and so on. Hence, the name the Five Whys strategy.
The 5 Whys: Key Benefits Some key benefits of the Five Whys include the following: It helps teams quickly determine the root cause of a problem. It is a structured approach to solve problems as they occur. It serves as a framework for a team to work through a more complex problem. It is simple, and easy to learn and apply. Hospital Scenario Let’s look at an example of how to use the Five Whys of Root Cause Analysis. Here, our scenario is a problem in a hospital. In this example, the team begins by defining the problem as “delays in hospital

8
patient medication turnaround time.” Next, the team of SMEs analyzes why the problem happened by asking “Why?” five times, as follows: 1. Why? The nurses have to wait for medication deliveries to the unit work area. 2. Why? Preparation of the first I.V. dosage takes too long. 3. Why? Too much time is wasted in the medication preparation area. 4. Why? Excessive walking is required between prep area workstations. 5. Why? The work area layout is inefficient. At this point, the team is satisfied that the inefficient work area layout is the real root cause of the problem. 5 Whys Example Here is an example of how a team might use the Five Whys strategy in the problem we identified earlier with the STS Chart and Problem Statement.
First, the team defines the problem as the “wrong part received from the stockroom.” Next, the team asks “Why” this problem occurred, and it determines that the part in stock was labeled with the wrong part number. This prompts the team to ask “Why” the part in stock was labeled with the wrong part number. It determines that the part was labeled wrong at the supplier. The team continues with this process, asking “Why?” three more times, and comes up with the three subsequent causes you see here.
At this point, the team must determine whether it has asked “Why” enough times to reach the root cause, or if it can go deeper into the analysis. In this scenario, the team may need to continue its analysis to determine why the drawings awaiting a change order approval caused a problem with a supplier. Select and Implement a Solution

9
Now that we have identified the root causes, it’s time to select and implement the solution. Moonshining Moonshine is a practical application of the "use your wits, not your wallet" and "no excuses, just find a way to do it" philosophies for breakthrough improvement. Moonshining means to think outside of your organization or process to find innovative ideas to solve problems.
For example, an automobile manufacturer was looking for ways to improve the purchase order, delivery, and invoice process for car stereo systems. The system was very complicated and required several paper-‐based transactions. An innovative team in one of their moonshining sessions looked at the way a clothing retailer handled restocking for catalog sales. The result was the complete elimination of all paper transactions including purchase orders, shippers, and invoices. Computer terminals that tied into the company’s order management system were installed in the supplier’s facility. Every time a stereo system was installed in a new car, an order for a
replacement was automatically sent to the supplier’s terminal. New units were delivered at least once per day, directly to the installation department. They were paid based on the number of units that were installed. The electronic order system was installed using existing equipment. Trystorming Another technique that works closely with Moonshining is Trystorming. Once the ideas are generated through Moonshining, the team will try the ideas and new methods through rapid prototyping. It’s based on the philosophy of “try it before you buy it” and can be used to try new ideas and, if they fail, learn from them and try again until you find an optimal solution. In our previous example, the automotive manufacturer tried several methods and arrangements until the lowest cost solution that met the needs of both companies was found. Pareto Chart Data analysis is an important step to provide the basis for applying the cause and effect tools. There are many things a data analysis can show about the behavior of a process at a particular point in time or over a period of time. The Pareto Chart is a graphic overview of the types and frequency of product or process defects. It ranks problems from the most frequent, called the Vital Few, to the least frequent, or the Trivial Many, in descending order from left to right, or top to bottom. To show how a Pareto chart works in the problem solving environment, let’s look at a restaurant that is having problems with
10
frequent customer complaints and bad reviews. The process improvement team compiled customer surveys and put the results into a Pareto diagram. As you can see, parking problems and rude waiters topped the list and the solutions were clear. However, they needed more information regarding the cooking problems and created a second-‐level Pareto chart to identify specific complaints. This shows that the customers complained most about a long wait and cold food, which prompted the team to search for innovative ways to reduce the cycle time between the customer order and delivery of a hot meal. Summary
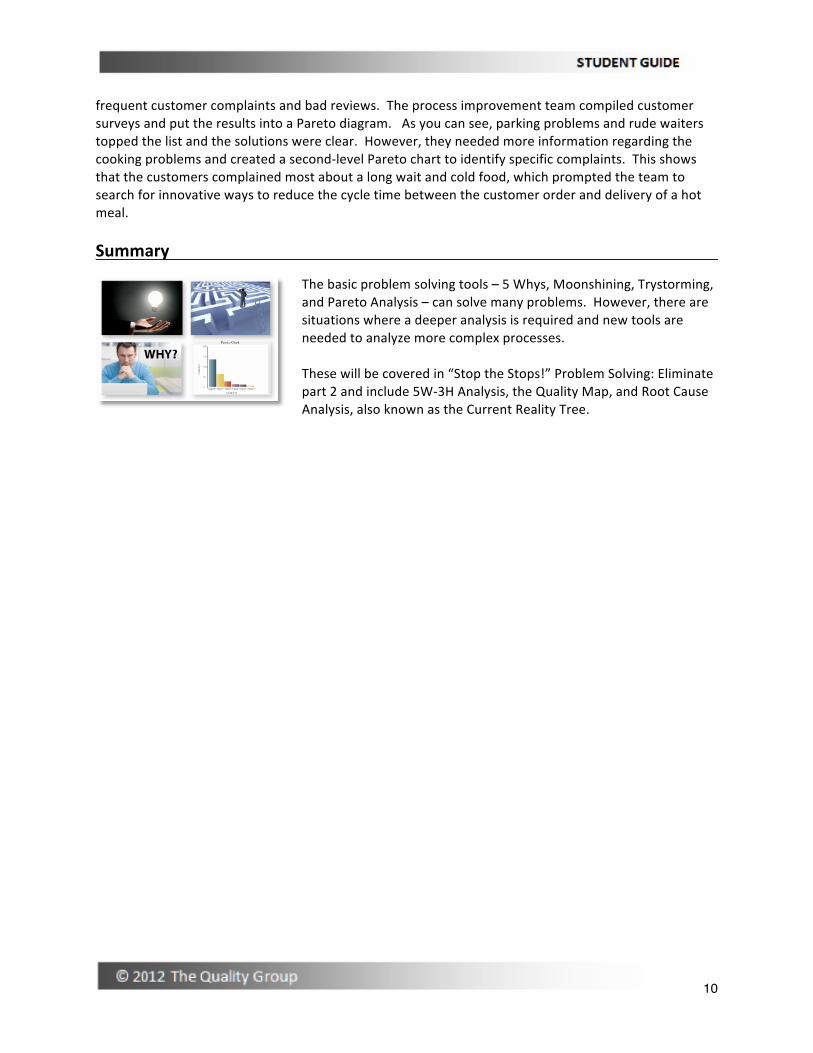
The basic problem solving tools – 5 Whys, Moonshining, Trystorming, and Pareto Analysis – can solve many problems. However, there are situations where a deeper analysis is required and new tools are needed to analyze more complex processes. These will be covered in “Stop the Stops!” Problem Solving: Eliminate part 2 and include 5W-‐3H Analysis, the Quality Map, and Root Cause Analysis, also known as the Current Reality Tree.