teacher attitudes towards gifted education in rural school
TRANSCRIPT

Western Kentucky UniversityTopSCHOLAR®
Masters Theses & Specialist Projects Graduate School
Spring 2018
Teacher Attitudes Towards Gifted Education inRural School DistrictsJennifer Smith SheffieldWestern Kentucky University, [email protected]
Follow this and additional works at: https://digitalcommons.wku.edu/theses
Part of the Gifted Education Commons, and the Social and Philosophical Foundations ofEducation Commons
This Thesis is brought to you for free and open access by TopSCHOLAR®. It has been accepted for inclusion in Masters Theses & Specialist Projects byan authorized administrator of TopSCHOLAR®. For more information, please contact [email protected].
Recommended CitationSheffield, Jennifer Smith, "Teacher Attitudes Towards Gifted Education in Rural School Districts" (2018). Masters Theses & SpecialistProjects. Paper 2077.https://digitalcommons.wku.edu/theses/2077

TEACHER ATTITUDES TOWARDS GIFTED EDUCATION IN RURAL SCHOOL DISTRICTS
A Specialist Project Presented to
The Faculty of the School of Teacher Education Western Kentucky University
Bowling Green, Kentucky
In Partial Fulfillment Of the Requirements for the Degree
Specialist in Education
By Jennifer Sheffield
May 2018


I dedicate this thesis to my husband, Mike Sheffield, for always supporting me in my
ongoing journey as an educator.

iv
ACKNOWLEDGMENTS
To begin, I would like to thank Dr. Julia Roberts, Mahurin Professor for Gifted
Education, Executive Director of The Center for Gifted Studies at Western Kentucky
University, and my advisor and specialist project committee chair, for believing in my
abilities as an educator and continually providing me multiple opportunities to grow and
learn as a professional in the field of gifted education.
I would like to express my gratitude to the other members of my specialist project
committee as well. I am grateful to Dr. Toni Szymanski for urging me forward when my
progress on this project was flagging and taking time during her evenings and weekends
to explain the basics of statistical analysis. I appreciate Dr. Tracy Inman’s unwavering
support as both a colleague and a friend, and her steadfast efforts to push me to become a
better writer.
I extend my appreciation to Dr. Françoys Gagné, of the University of Montréal,
for graciously allowing me to utilize the survey instrument he developed for this study.
I would also like to thank my colleague in the field of gifted education and
frequent writing partner, Tyler Clark, for sharing the trials and triumphs of the research
process; Melissa Biggerstaff and Rendy Belcher from the Green River Regional
Educational Cooperative for reminding that if I can churn out federal grants I can handle
writing a thesis for a specialist project; and my father, Gene Stinchcomb, for instilling in
me a belief in the values of education and activism.
Lastly, I would like to thank all of my students – past, present, and future – for
feeding my spirit as an educator.

v
TABLE OF CONTENTS
List of Figures ................................................................................................................ vi
List of Tables ................................................................................................................ vii
Abstract ....................................................................................................................... viii
Introduction .................................................................................................................... 1
Literature Review ............................................................................................................ 2
Method ......................................................................................................................... 11
Results .......................................................................................................................... 14
Discussion ..................................................................................................................... 21
References .................................................................................................................... 26
Appendix: Survey Instrument ........................................................................................ 35

vi
LIST OF FIGURES
Figure 1. Acceleration: Frequency of Scores ................................................................. 18

vii
LIST OF TABLES
Table 1. National Center for Education Statistics Urban-Centric Locale Codes ............... 2
Table 2. Student Demographics 2016-17 ....................................................................... 12
Table 3. Subscales Used for This Study ......................................................................... 14
Table 4. Correlations Between the Subscales ................................................................. 16
Table 5. Means, Minimum/Maximum Scores, and Standard Deviations for
Full Sample ..................................................................................................... 17
Table 6. Analysis of Variance by Graduate/Non-Graduate............................................. 19
Table 7. Descriptive Statistics Graduates/Not Graduates ............................................... 20
Table 8. Analysis of Variance of Responses by District ................................................. 21

viii
TEACHER ATTITUDES TOWARDS GIFTED EDUCATION
46 Pages
IN RURAL SCHOOL DISTRICTS
Jennifer Sheffield May 2018
Directed by: Julia Roberts, Antonia Szymanski, and Tracy Inman
School of Teacher Education Western Kentucky University
The purpose of this study was to determine the attitudes of teachers in rural
locales towards giftedness and gifted education. Gagné and Nadeau’s (1991) Opinions
About the Gifted and Their Education was used as the survey instrument. A total of 78
teachers from four public school districts in Kentucky classified as rural participated in
the study. The respondents indicated slightly positive attitudes toward the need for
specialized instruction for gifted students and the social value of giftedness but slightly
negative mindsets towards acceleration. These results as a whole mirrored the findings of
several previous studies utilizing the same survey instrument. However, individual
teacher’s attitudes varied widely, with some very negative responses and some more
positive, rendering the results determined using averaged scores from the full sample a
somewhat inaccurate indicator of broad-scope, overall teacher mindset towards gifted
education. When comparing the attitudes towards acceleration of teachers who had
graduated from the district in which they teach to those who graduated from a district
outside of where they teach, a significantly more negative attitude was indicated in
teachers who remained within their home districts. Further study is recommended to
determine if this could be an influence of more traditional and anti-intellectual mindsets
often found in rural communities and if it has any effect on the quality of services and
programming opportunities available to gifted students in rural locales.

1
Introduction
Gifted students exist across different socio-economic demographic groups in the
United States as well as in different geographical areas. High-ability learners can hail
from high-density urban areas, leafy suburban enclaves, or far-flung rural communities.
Nearly 50 percent of all public-school districts in the United States are located in small
towns and rural communities, and nearly 20 percent of all public-school students - over
9,000,000 - live in rural areas as defined by the National Center for Education Statistics
(U.S. Department of Education, 2014; NCES, 2006). Gifted students in rural settings are
underrepresented in the body of research in fields of both rural education and gifted
education (Azano, Callahan, Missett, & Brunner, 2014; Puryear & Kettler, 2017). In the
last few decades, much attention has been paid to barriers of race, gender, and poverty in
identifying and providing opportunities to gifted students, but little research has been
focused on geographical barriers endemic to rural locales (Stambaugh, 2015; Colangelo,
Assouline, & New, 1999).
Enrollment in rural schools in the United States continues to grow, out-pacing
non-rural enrollment growth, with ever-increasing rates of poverty, diversity, and
students with special needs (Johnson, Showalter, Klein & Lester, 2014). As the student
population in rural areas continues to increase and diversify, it is important for
researchers to examine the unique challenges inherent to this population in order to
ensure equity in identification and services to gifted students in these locales.
Regular education classroom teachers have an influential role in whether the
needs of gifted students are effectively met in public schools (Szymanski & Shaff, 2013).
They function both as gatekeepers, through teacher nomination of students for referral for

2
gifted identification, and as facilitators, planning the curriculum and delivering
instruction to gifted students within their mainstream classrooms. To effectively address
the needs of gifted students, teachers must understand the characteristics and needs of
gifted students and reject myths about giftedness that persist in the field of education
(Cross, 2002). Although approximately 31 percent of all public-school teachers are
employed in rural schools (Jimerson, 2003), little research exists specific to rural
teachers’ perceptions and attitudes towards gifted students and gifted education (Azano et
al., 2014).
Literature Review
Although varying definitions of rural are seen across the literature, the most
commonly used definition for locale in education research is the National Center for
Educational Statistics Urban-Centric Codes (2006), as described in Table 1.
Table 1
NCES Urban-Centric Locale Categories for Rural Classification
Locale Definition
Rural - Fringe Census-defined rural territory that is less than or equal to 5 miles
from an urbanized area, as well as rural territory that is less than or
equal to 2.5 miles from an urban cluster
Rural - Distant Census-defined rural territory that is more than 5 miles but less than
or equal to 25 miles from an urbanized area, as well as rural territory
that is more than 2.5 miles but less than or equal to 10 miles from an
urban cluster
3
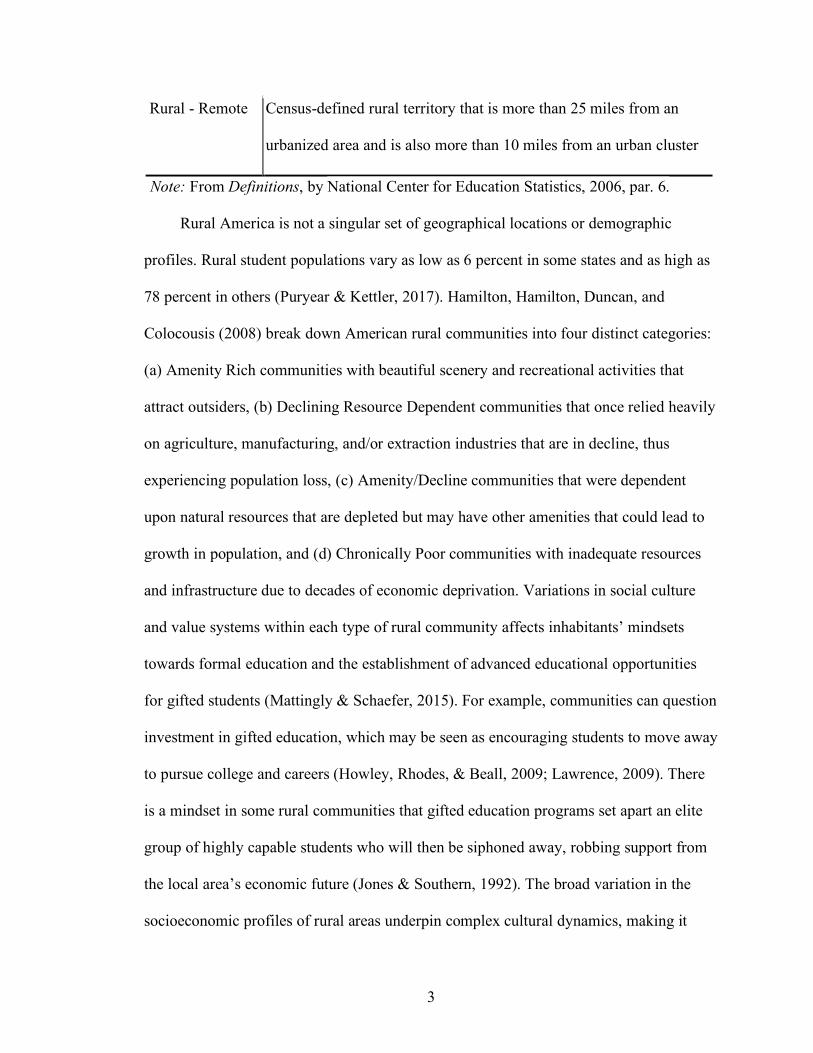
Rural - Remote Census-defined rural territory that is more than 25 miles from an
urbanized area and is also more than 10 miles from an urban cluster
Note: From Definitions, by National Center for Education Statistics, 2006, par. 6.
Rural America is not a singular set of geographical locations or demographic
profiles. Rural student populations vary as low as 6 percent in some states and as high as
78 percent in others (Puryear & Kettler, 2017). Hamilton, Hamilton, Duncan, and
Colocousis (2008) break down American rural communities into four distinct categories:
(a) Amenity Rich communities with beautiful scenery and recreational activities that
attract outsiders, (b) Declining Resource Dependent communities that once relied heavily
on agriculture, manufacturing, and/or extraction industries that are in decline, thus
experiencing population loss, (c) Amenity/Decline communities that were dependent
upon natural resources that are depleted but may have other amenities that could lead to
growth in population, and (d) Chronically Poor communities with inadequate resources
and infrastructure due to decades of economic deprivation. Variations in social culture
and value systems within each type of rural community affects inhabitants’ mindsets
towards formal education and the establishment of advanced educational opportunities
for gifted students (Mattingly & Schaefer, 2015). For example, communities can question
investment in gifted education, which may be seen as encouraging students to move away
to pursue college and careers (Howley, Rhodes, & Beall, 2009; Lawrence, 2009). There
is a mindset in some rural communities that gifted education programs set apart an elite
group of highly capable students who will then be siphoned away, robbing support from
the local area’s economic future (Jones & Southern, 1992). The broad variation in the
socioeconomic profiles of rural areas underpin complex cultural dynamics, making it

4
nearly impossible to generalize research findings as applicable to rural communities
across the United States.
The makeup of the rural student population in the United States is overwhelmingly
white, but these data do not accurately represent the demographic makeup of rural
schools as a whole. If viewed on a national scale, 25 percent of students in rural areas are
non-White, and this percentage continues to increase at a rapid rate (Howley et al., 2009;
Johnson, Showalter, et al., 2014). Demographics vary widely in different geographic
regions and states. For example, in the South, there are pockets of rural schools in
poverty with majority African American populations, Hispanic populations in rural
schools in the Southwest are rapidly increasing, and many rural school populations are
heavily Native American and Hawaiian and Pacific Islander in other regions (Lavalley,
2018; Showalter, Klein, Johnson, & Hartman, 2017). By 2009, several states, including
Hawaii, New Mexico, Alaska, Arizona, and California, reported minority students made
up over 50 percent of their rural student population (Howley, et al., 2009).
As a group, rural students tend to have different educational and life experiences
compared with their urban and suburban peers (Lewis, 1999). Questions and examples on
standardized tests often refer to resources or situations that exist in everyday life in more
urbanized settings but are rare in rural ones (Lewis, 1999). This bias can lead to lower
scores on tests used for gifted identification purposes, thus limiting opportunities for rural
children regardless of culture (Spicker, Southern, & Davis, 1991). The persistent
underrepresentation of minority and/or low-income students in gifted programs (Ford
2010; Ford, 2013; 1998; McBee, 2006; Ramos, 2010) should also be addressed within the
context of rural school districts as distinct from those in urban and suburban areas.

5
Rural Schools: Unique Challenges Related to Gifted Education
Researchers have noted many challenges to adequately serving the needs of gifted
and talented students within impoverished and geographically-isolated rural school
districts (Azano et al., 2014). Rural schools face many of the same barriers to meeting the
academic and social-emotional needs of gifted students from low-income and poverty
backgrounds as do suburban and urban schools. However, many rural schools face
additional challenges such as geographical barriers, lack of adequately trained teachers,
fewer program options, elevated transportation costs, and disproportionately lower levels
of national financial support than urban and large suburban communities (Colangelo,
Assouline, & New, 2001; Cross & Burney, 2005; Johnson & Strange, 2007). Plucker
(2013) identified poverty, rural provincialism, limited financial and human resources, and
negative perceptions of gifted programs as factors that challenge delivery of services for
gifted students in rural schools. The rate of child poverty in rural communities is, on
average, higher than in urban and suburban areas (Malhoit, 2005) thus in many U.S.
states, the term rural has become synonymous with poor. These factors contribute to
decreased opportunities for gifted students, both academically and socially, in rural
communities with high levels of poverty.
Limited funding is a pervasive reality in rural schools (Howley et al., 2009;
Malhoit, 2005). This problem has been exaggerated since the 2008 recession, with 34
states decreasing their financial support to rural schools (Richards & Stambaugh, 2015).
Rural school districts designate proportionately less funding for gifted programs than do
their suburban and urban counterparts (Moon, Callahan, Oh, & Hailey, 2012; Richards &
Stambaugh, 2015). In fact, teachers of the gifted can be perceived as an unaffordable and

6
unnecessary luxury; therefore, human and financial capital are often redirected away
from high-achieving students to those students needing academic remediation and
intervention in order improve their performance enough to satisfy benchmark indicators
for accountability purposes (Azano et al., 2014; Colangelo et al., 2001). It is necessary to
gain understanding of rural teachers’ mindsets towards gifted education in order to
inform professional learning and resource allocation decisions that will improve the
quality of opportunities available to gifted students in those regions.
Rural schools generally pay teachers less, which leads to difficulties recruiting
and retaining experienced and highly-qualified teachers (Arnold, Newman, Gaddy &
Dean, 2005; Croft, 2015; Jimerson, 2003). Therefore, rural schools often have a higher
proportion of new teachers (those in first or second year of teaching) as compared to
schools in small towns and suburban areas (Mattingly & Schaefer, 2015). Additionally,
small student populations equate to smaller teaching staff, which can limit course
offerings available to advanced students. Funding additional staff is often not an option,
and requiring existing staff to pursue the advanced coursework necessary to achieve
multiple certifications is often cost-prohibitive and hindered by limited access
geographically as compared to suburban and rural areas (Lavalley, 2018). The lack of
ability to maintain adequate teaching staff in many rural schools further exacerbates the
challenge of providing appropriate service options to gifted students.
Reininger (2012) found that 80 percent of U.S. teachers remain within a 13-mile
radius of their hometown when seeking employment. “Rural schools often operate under
a de facto ‘grow your own’ system in seeking and developing new teacher talent”
(Lavalley, 2018, p. 15) relying on the locally available pool of teacher candidates. Often

7
these teachers grew up in the local community and attended the same rural school
districts in which they are now employed as teachers. Research has indicated that rural
teachers across the United States are more likely to have graduated from a less selective
college than teachers in other locales (Fowles, Butler, Cowen, Streams, & Toma, 2014;
Player, 2015), and better qualified teachers from rural areas tend not to return to their
hometowns. Rural schools report increased difficulty in filling teacher vacancies at the
middle and high school levels, especially for STEM-related positions (Player, 2015).
Having hard-to-fill positions can lead administrators to retain poor-performing teachers
due to the difficulty in finding qualified replacements (Johnson, Mitchel, & Rotherham,
2014). Less-qualified teachers, in turn, then develop the next generation of teacher
candidates from that region, continuing the cycle. Myths and misconceptions about the
characteristics and needs of gifted students may remain unchallenged without an influx of
more highly-qualified teachers with appropriate training in gifted education. Research is
needed to explore if this geographically-circular teacher pipeline contributes to the
perpetuation of negative perceptions of gifted education in rural areas.
Attitudes towards Gifted Education and Gifted Students
Understanding the attitudes of teachers towards gifted education is important, as
they implement the instructional practices necessary to ensure gifted students are
appropriately challenged in their classrooms and schools. Scholars in the field of gifted
education have been studying the attitudes of regular education teachers towards gifted
students and gifted education since the mid-20th century (Justman & Wrightstone, 1956;
Peachman, 1942; Tannenbaum, 1962) with no clear positive or negative results emerging
as a whole. Some research suggested teachers generally had positive attitudes overall

8
towards gifted learners (Gagné, 1983; McCoach & Siegle, 2007). Other studies found
teachers had positive attitudes to most aspects to gifted education such as the social value
of giftedness and the need for special academic accommodations such as special classes
but concurrently retained a more negative mindset towards grade acceleration (Allodi &
Rydelius, 2008; Lassig, 2009; Perković Krijan, Jurčec, & Borić, 2015; Watts, 2006). One
study focusing explicitly on teacher attitudes towards acceleration for gifted students
(Siegle, Wilson, & Little, 2013) found the majority of teachers sampled at a summer
conference on gifted education felt positively about acceleration, but more broad-based
samples of public school teachers at large tended to express more negative views (Jones
& Southern, 1992; Rambo & McCoach, 2012). Some results showed teachers harbored
more negative attitudes in general towards giftedness (Cramond & Martin, 1987; Geake,
& Gross, 2008), while others showed mixed results, with both positive and negative
attitudes towards the gifted (Copenhaver & McIntyre, 1992; Megay-Nespoli, 2001;
Morris, 1987; Rubenzer & Twaite, 1979). Although the McCoach and Siegle (2007)
study showed teachers had an overall neutral attitude towards gifted education, there was
quite a bit of variability among the individual teachers’ responses. Some teachers had
strongly positive attitudes while others were extremely negative, leading the researchers
to conclude that attitudes towards gifted education would be more accurately assessed on
an individual basis as opposed to generalized as a whole.
Some studies focusing exclusively on attitudes of preservice teachers towards
gifted students have suggested a positive effect on teacher attitudes after teachers
received information and training on the needs of gifted students (Morris, 1987; Plunkett
& Kronborg, 2011; Troxclair, 2013). However, Baudson and Preckel’s (2013)

9
comparative study of prospective and practicing teachers did not identify any differences
in attitudes towards gifted students, counteracting the idea that more training and
exposure to gifted students leads to more positive attitudes, which mirrors McCoach and
Siegle’s (2007) assertion that the majority of prior studies have shown teachers’ implicit
mindsets towards the gifted tend to remain stable throughout their career.
The search for predictors of teachers’ attitudes towards gifted education has also
yielded ambiguous results. Jones and Southern (1992) found that teachers in rural school
districts expressed more negative perceptions towards acceleration than those in urban
schools. In a survey of Canadian teachers, Bégin and Gagné’s (1994) research isolated
two factors, socioeconomic status and contact with giftedness, as significant predictors of
positive attitudes towards gifted education. Grayson and Hall (1992) also found
respondents with higher socioeconomic status showed more positive attitude towards
giftedness. However, McCoach and Siegle (2007) noted that most existing studies either
failed to use a random sample or a representative sample of teachers, rendering results
that are not generalizable to any broad population of teachers. This further highlights the
need to establish a research base focused on teachers in rural locales, while also selecting
random samples of teachers from areas with similar demographic and/or socioeconomic
characteristics in order to produce results which can be reasonably generalized to teachers
in similar rural areas.
The existing body of research literature suggests an overall sense of ambivalence
in teachers towards gifted students and gifted education (Cross, Cross, & Frazier, 2013).
Anti-intellectualism occurs in many subsets of American society, including rural culture
(Howley, Howley, & Pendarvis, 1995). Children are encouraged to do their best in

10
school, but an implicit message lies underneath that gifted students should not excel
beyond the capabilities of their classroom peers - they should not be too smart (Cross,
2002). Many teachers express concerns about gifted children not fitting in socially if
accelerated - a fear connected to society’s tendency to reject those seen as outsiders
(Geake & Gross, 2008). Gifted students’ behaviors may not fall within those considered
“normal,” a range narrowed even further by traditional cultural and religious beliefs in
rural communities and pressure to not stand out or excel can be more extreme (Lawrence,
2009). The egalitarian nature of rural society creates concern over gifted education being
elitist (Gross, 1997). Teachers experience these mixed messages (Cross et al., 2013)
which may explain support for gifted services often coming with the caveat “only if it
does not result in resources being taken away from classes of average students” (Grayson
& Hall, 1992, p. 22). Another aspect of ambivalence towards gifted education services in
rural areas is the necessity for students to eventually leave the community to pursue
higher education opportunities (Mattingly & Schaefer, 2015). A deeper examination of
how these cultural beliefs and messages affect teacher attitudes towards gifted education
is needed.
Purpose
Despite the fact there are over 400,000 teachers in rural areas of the United States
(Jimerson, 2003), no current research specifically focuses on attitudes of teachers in
public schools in rural communities towards giftedness and gifted education. The purpose
of this present study is to examine teachers’ attitudes towards gifted students and gifted
education in rural schools and determine any differences in attitudes between teachers

11
who live in and/or graduated from the rural districts in which they teach, and those who
do not.
Research questions for this paper include the following:
Research Question 1: What are teachers’ attitudes toward gifted students and gifted
education in rural areas?
Research Question 2: What differences in attitudes towards gifted students and gifted
education exist between teachers who live within the rural districts in which they teach
and those who do not?
Research Question 3: What differences in attitudes towards gifted students and gifted
education exist between teachers who graduated from the rural districts in which they
teach and those who did not?
Method
The purpose of this study is to investigate teachers’ attitudes towards giftedness
and gifted education within public school districts categorized as rural by NCES, to
determine if any differences in attitudes exist between teachers who live within the rural
districts in which they teach and those who do not and between teachers who graduated
from the rural districts in which they teach and those who did not.
Sample
The population for this study consisted of a convenience sample of inservice
teachers (n = 78) working in elementary, middle, and high schools in four different,
nonadjacent public school districts in Kentucky categorized as either Rural-Fringe or
Rural-Remote according to the NCES (2006) locale codes. The districts were drawn from
different regions in Kentucky (two in the South Central area, one in the North Central

12
region, and one in the far Northern sector). Although all four districts are categorized as
rural and have predominantly White student populations, there are distinct differences in
their demographic and socioeconomic profiles, such as districts having large differences
in population (i.e., from 647 to 14,986) or percentages of non-White students (i.e., 6% to
33%) (see Table 2).
Table 2
Student Demographics 2016-17
District
Total
Enrollment
Low
Income
(F/R
Lunch
Eligible)
White
African-
American
Hispanic
Asian
Two or
more
races
District 1 1,826 63.3% 94.0% 0.4% 4.1% 0.3% 1.2%
District 2 6,868 55.3% 66.9% 7.2% 20.2% 0.9% 4.5%
District 3 647 81.7% 73.4% 11.7% 3.6% 0.3% 10.8%
District 4 14,986 56.8% 69.1% 9.3% 9.1% 7.3% 4.5%
Note: From District Report Card by Kentucky Department of Education, 2018.
Demographic data collected from respondents (see Appendix) showed a mean of
12.81 years of teaching experience with a standard deviation of 8.95 years.
Approximately 97.5% of the teachers reported that their schools offered gifted programs
while 2.5% reported that their schools did not. Slightly less than 79% of the respondents
indicated that they worked with gifted learners on a regular basis; just over 21% indicated
they did not. Just under 60% of the respondents indicated that they live within the rural

13
school district in which they work, while 40% commute from outside the community.
One third of the teachers who responded were graduates of the districts in which they are
currently teaching, while two-thirds graduated elsewhere.
Procedure
Approval from the Institutional Review Board was obtained prior to
distribution of the survey. An email containing information about the purpose of the
study, an informed consent statement, and a link to the online survey were sent to
principals and/or district instructional supervisors to distribute to teachers under their
supervision in participating schools and districts. No personal identifying information
was collected from respondents.
Description of Instrumentation/Measurement Procedures
Teachers’ attitudes toward giftedness and gifted education were measured using
the Gagne´and Nadeau attitude scale, Opinions About the Gifted and Their Education (F.
Gagné, personal communication, April 30, 2017), a 34-item questionnaire designed to
measure six factors related to attitudes toward the gifted. All items on the scale were
measured using a 5-point Likert-type scale, where 1 = totally disagree and 5 = strongly
disagree. This survey originally categorized the 34 items into six subscales as follows:
Scale 1: Needs and Support, Scale 2: Resistance to Objections, Scale 3: Social Value,
Scale 4: Rejection, Scale 5: Ability Grouping, and Scale 6: School Acceleration (see
Appendix for the survey instrument).
The researcher followed the example of other researchers and conducted
exploratory psychometrics and data analysis. Reliability was calculated for the scales
according to the scoring sheet provided by Gagne´ and Nadeau (F. Gagné, personal

14
communication, April 30, 2017). Some subscales had very low reliability (i.e., <.5) which
led the researcher to question whether the results would be valid. Looking at prior
research by McCoach and Siegle (2007) and Troxclair (2013), it was apparent that others
had similar problems with psychometrics of the instrument.
Results
Based on the factor loadings, three main factors were determined (see Table 3).
The items in the first factor related to statements that placed a priority on meeting the
needs of other students rather than focusing on individual gifted learners and was thus
labeled Common Good. This subscale contains eight items and has a Cronbach’s alpha
reliability of .635 in the present sample. The second factor comprised items focusing on
grade skipping and was labeled Acceleration. This subscale contains five items and has a
Cronbach’s alpha of .751 in the sample. The third factor focused on social perception and
the value of providing accommodations and was labeled Value and Needs. This subscale
contains five items and has a Cronbach’s alpha of .624 in the sample.
Table 3
Subscales Used for This Study
Subscale 1: Common Good (8 questions, alpha = .635)
4. Special programs for gifted children have the drawback of creating elitism.
*6. When the gifted are put in special classes, the other children feel devalued.
12. We have a greater moral responsibility to give special help to children with
difficulties than to gifted children.
*20. Gifted children should be left in regular classes, since they serve as an
intellectual stimulant for the other children.

15
*21. By separating students into gifted and other groups, we increase the labelling
of children as strong-weak, good-less good, etc.
23. The gifted are already favored in our schools.
26. Taxpayers should not have to pay for special education for the minority of
children who are gifted.
30. Since we invest supplementary funds for children with difficulties, we should
do the same for gifted.
Subscale 2: Acceleration (5 questions, alpha = .751)
*7. Most gifted children who skip a grade have difficulties in their social
adjustment to a group of older students.
8. Gifted children are often bored in school.
11. The gifted waste their time in regular classes.
*29. When skipping a grade, gifted students miss important ideas (they have
“holes” in their knowledge).
34. A greater number of gifted children should be allowed to skip a grade.
Subscale 3: Value and Needs (5 questions, alpha = .624)
13. Gifted persons are a value resource for our society.
14. The specific educational needs of the gifted are too often ignored in our
schools.
24. In order to progress, a society must develop the talents of gifted individuals to
the maximum.
31. Often, gifted children are rejected because people are envious of them.
32. The regular school program stifles the intellectual curiosity of gifted children.

16
Note: *Reverse Scored. Note. From Opinions about the Gifted and Their Education (F.
Gagné, personal communication, April 30, 2017).
None of the three subscales showed strong correlations. There was a significant
correlation between Acceleration and Student Needs (see Table 4). The low correlations
imply that each subscale measures a distinctly different area relating to attitudes towards
gifted students.
Table 4 Correlation Between the Subscales
* Correlation is significant at the 0.05 level (2-tailed).
Data were compiled and analyzed with consideration of both mean scores and
total scores. Overall, the views of the teachers in this study were mixed with slightly
positive views of the social value of the gifted (i.e., importance of developing talents of
gifted persons to benefit society) and the need for academic accommodations to support
gifted (i.e., funds should be invested in gifted children, need for special services for gifted
students outweighs perceived elitism) but a slightly negative view of acceleration (i.e.,
grade-skipping) as Table 5 delineates.
Subscale Common Good Acceleration Value and Needs
Common Good 1
Acceleration .021 1
Value and Needs -.026 .261* 1

17
Table 5
Means, Minimum/Maximum Scores, and Standard Deviations for Full Sample
Subscale N Minimum Maximum Mean Std. Deviation
Common Good 78 17.00 31.00 23.205 2.907
Acceleration 78 5.00 22.00 14.103 4.054
Values and Needs 77 9.00 25.00 18.468 3.351
High scores on the Common Good factor indicate negative attitudes towards the
gifted – greater importance is given to the perceived needs of the student body at large
than the specific needs of gifted students. The mean on the Common Good scale was
23.205, which, when taken in context of the range scores from 17.00 to 31.00 would
suggest teachers were slightly less concerned about the perceived common good of all
students and slightly more focused on the needs of gifted students. The highest possible
score for this subset was 40, yet the maximum score in this sample was only 31, meaning
the range of responses as a whole shifted towards a lower range of scores. If more
teachers had chosen the neutral response of “undecided” (a score value of 3), a mean
score of 24 would have been expected. Therefore, a mean of 23.205 shows slightly lower
value is placed on the common good versus the needs of individual gifted students,
suggesting a slightly positive mindset towards gifted education and rejection of the view
it is elitist.
The Acceleration subscale had a possible maximum score of 25 and a mean of 14
and displayed the most variance of the three subscales. A high score on this factor
indicates a positive attitude towards the acceleration. An examination of the frequency of
scores showed that a greater number of teachers had a slightly negative view of

18
acceleration (see Figure 1), which was characterized as grade-skipping in this survey. If
the majority of teachers had chosen “undecided” (a score value of 3), the mean would
have been 15. Since it was 14, this group had a slightly more negative score.
Figure 1
Acceleration: Frequency of Scores
Values and Needs had a possible maximum score of 25. A high score on this
factor indicates a positive attitude towards the gifted. The mean for this sample was
18.468 which indicated a slightly higher social value of giftedness and interest in meeting
student needs. A few very strong negative scores pulled the mean down slightly;
however, there was a much greater number of positive scores. These positive scores still
fit the normal curve, although some of the responses did reach the highest possible score.
The mean was higher than expected if most teachers had answered “undecided” (a score
Acceleration
Freq
uenc
y
Acceleration Scores
Mean = 14.10
Std. Dev. = 4.054
N = 78

19
value of 3), indicating respondents felt more positively about the social value of
giftedness and were more in favor of focusing on student needs.
An analysis of variance (ANOVA) was conducted to determine differences by (a)
grade level(s) taught, (b) if teachers lived in the rural districts in which they taught, (c) if
respondents had been personally identified as gifted, and (d) if close friends or family
members had been identified as gifted. The only statistically significant differences were
found when examining data for respondents who did or did not graduate from the rural
district in which they taught and when comparing data from different districts surveyed
for this sample (see Table 6).
Table 6
Analysis of Variance by Graduate/Non-Graduate
Subscale
Sum of Squares
df
Mean Square
F
Sig.
Common Good Between Groups 12.410 1 12.410 1.478 .228
Within Groups 638.308 76 8.399
Total 650.718 77
Acceleration Between Groups 110.006 1 110.006 7.237 .009
*
Within Groups 1155.173 76 15.200
Total 1265.179 77
Values and
Needs
Between Groups 5.989 1 5.989 .530 .469
Within Groups 847.179 75 11.296
Total 853.169 76
* Significant at < 0.05 level.

20
The data were split between teachers who graduated from the same rural district
in which they teach and those who did not. Descriptive statistics are available in Table 7.
Statistically significant differences were found between the two groups on the variable of
acceleration. Those who did not graduate from the district in which they teach showed a
higher, more positive attitude towards acceleration with a mean score of 14.94, compared
to those who did graduate from the same district where they teach, with a mean score of
12.42.
Table 7
Descriptive Statistics Graduates/Not Graduates
Graduate N Minimum Maximum Mean Std. Deviation
No Common Good 52 17.00 31.00 22.923 2.983
Acceleration 52 8.00 21.00 14.942 3.567
Value and Needs 51 9.00 25.00 18.667 3.284
Yes Common Good 26 19.00 29.00 23.769 2.718
Acceleration 26 5.00 22.00 12.423 4.500
Value and Needs 26 9.00 24.00 18.077 3.509
An analysis of variance (ANOVA) was conducted for differences in responses
from teachers from different districts. (see Table 8). When comparing teachers’ responses
from the different districts, a significant difference was noted on the subscale for Values
and Needs. Post-hoc analysis showed the only significant difference was between
Districts 1 and 4 (M=4.2619, p = .034).

21
Table 8
Analysis of Variance of Responses by District
Subscale
Sum of
Squares df Mean Square F Sig.
Common Good Between Groups 12.831 3 4.277 .496 .686
Within Groups 637.887 74 8.620
Total 650.718 77
Acceleration Between Groups 80.589 3 26.863 1.678 .179
Within Groups 1184.590 74 16.008
Total 1265.179 77
Value and Needs Between Groups 89.959 3 29.986 2.868 .042*
Within Groups 763.210 73 10.455
Total 853.169 76
* Significant at <0.05 level.
Discussion
The major purpose of this study was to determine the attitudes of teachers in rural
schools toward giftedness and gifted education. Teachers in this current study reported
slightly positive attitudes toward giftedness when considering educational
accommodations specific to the needs of gifted students and the social value of gifted
individuals but slightly negative attitudes towards acceleration. These mixed results are
similar to views expressed from respondents in previous studies (Allodi & Rydelius,
2008; Lassig, 2009; McCoach & Siegle, 2007; Perković Krijan, Jurčec, & Borić, 2015;
Watts, 2006). Despite research to the contrary, many teachers still ascribe to commonly-

22
held beliefs that acceleration has detrimental social effects for gifted students (Assouline,
Colangelo, VanTassel-Baska, & Lupkowski-Shoplik, 2015; Siegle et al., 2013). Although
the teachers appeared to have fairly neutral attitudes towards gifted education overall,
there was a great deal of variability among teachers. While some teachers harbored
markedly positive attitudes, other teachers harbored very negative attitudes. Therefore, as
stated by McCoach and Siegle (2007), it would be more informative for practitioners in
the field of gifted education to examine the attitudes of individual teachers on a case-by-
case basis versus making broad assumptions about teachers’ attitudes toward gifted
education as a whole based on group averages.
Although all of the surveyed schools within the four districts included in this
study are categorized as either Rural-Fringe and/or Rural-Distant per the NCES locale
codes, demographic variations between the schools and districts exist. Puryear and
Kettler (2017) question the usefulness of NCES locale codes for the purposes of
education research and denote the need to consider effects of proximity to city centers
even within the same locale codes. Other factors besides proximity influence the
socioeconomic and cultural profiles of rural communities. The districts ranged in size
from a total population of 647 students in the smallest district to just under 15,000
students in the largest (see Table 2). District percentages of students from poverty or low-
income households, as determined by eligibility for free or reduced lunch prices, ranged
from 56.8% up to 81.7%. The amount of student diversity varied from district to district
as well, ranging from a relatively nondiverse population: 94% White students and 4.1%
Hispanic in one district to a district with 66.9% White and over 20% Hispanic students in
another (see Table 3). Differences in responses from teachers in District 1 and District 4

23
to questions in the Values and Needs subscale cannot be correlated to any one discrete
factor from data collected in this study.
No differences were found in attitudes towards giftedness and gifted education
between teachers who lived within the rural districts in which they taught and those that
did not. Some commuting teachers would be drawn from surrounding areas that are also
rural, while others would be driving in from nearby small towns or even urban areas.
Thus some, but not all, of the commuting teachers may also be graduates of other rural
districts and/or live in a rural community – but simply not the one in which they currently
teach.
Differences in attitudes towards acceleration were found between teachers who
were graduates of the rural districts in which they teach and those who are not. Although
both groups had slightly negative attitudes towards acceleration, the attitudes of teachers
who were graduates of their districts where significantly more negative than those of
teachers who were not. Mattingly and Schaefer (2015) suggest many rural communities
have a deeply-embedded culture that does not value formal education as a practical
necessity for a successful future. Getting an advanced education requires moving away
from a rural area, causing a ‘brain drain’ that is often looked upon negatively by members
of rural communities. The practice of grade acceleration, commonly referred to as grade-
skipping, advances gifted students towards graduation at an earlier age, thus hastening the
possibility of pursuit of a higher education away from home.
Although not a benchmark research question for this study, research by Bégin and
Gagné (1994) suggested teachers’ self-perception as gifted had a positive effect on their
attitudes towards gifted education. Data from this study indicated self-perception had no

24
significant effect, a result that is in line with other studies on teachers’ attitudes towards
giftedness (McCoach & Siegle, 2007; Troxclair, 2013), one that seems somewhat
counterintuitive. McCoach & Siegle (2007) bring up the interesting conjecture that
perhaps more inclusive definitions of giftedness have inadvertently made the argument
for specialized services for gifted studies less compelling. Possible connections
between teachers’ self-perception of being gifted and their attitudes towards special
programming and services for the gifted merit further research.
Limitations
This study has several limitations which affect the ability to generalize the results.
Although eleven schools in four districts in nonadjacent regions of Kentucky were chosen
as a representative sample of Rural-Fringe and Rural-Distant public schools districts, the
demographic and socioeconomic makeup of populations in rural areas varies greatly
across different geographical regions of the United States, and there may be peculiarities
to the selected school districts in Kentucky that would not generalize more broadly.
Another limitation is the low number of total responses from teachers in the
surveyed districts (n = 78). The attitudes of teachers who responded to the survey may
systematically differ from those of teachers who did not respond. For example, it is
possible that teachers who are more directly involved with gifted students or who have
more training in gifted education may have been more likely to respond to this survey,
since the survey dealt with attitudes towards giftedness and gifted education.
Finally, the instrumentation used in this survey only captured a limited scope of
factors related to attitudes towards gifted education. Just over half of the questions (18
out of 34) from the original survey instrument were included on three subscales that

25
demonstrated high enough reliabilities to be used for analysis. Therefore, the
measurement of attitudes toward giftedness and gifted education included in this study
only encompassed a limited and distinct subsample of attitudinal factors. For example,
questions related to acceleration are limited to the practice of grade-skipping or whole-
grade acceleration, and they do not reference other forms of acceleration such as subject-
area acceleration or early entrance to kindergarten. The use of different attitudinal
measures could produce very different results.
Conclusion
Research to date has not indicated any one overarching factor which can be
credited with shaping teachers’ attitudes towards giftedness and gifted education.
Multiple challenges to providing equitable opportunities for gifted students exist in rural
areas including geographical barriers, financial constraints, issues with recruiting and
retaining high-quality teachers and cultural undercurrents of anti-intellectualism. As a
matter of equity, it is important for future research to consider the effects of rurality on
gifted education and to also take into careful consideration the broad variances in the
demographic and socioeconomic profiles of different rural regions.

26
References Allodi, M. W., & Rydelius, P. A. (2008). The needs of gifted children in context: A study
of Swedish teachers’ knowledge and attitudes. In ECHA conference. Retrieved
from https://www.academia.edu/254805/The_needs_of_gifted_children_in
_context_a_study_of_Swedish_teachers_knowledge_and_attitudes?
Arnold, M. L., Newman, J. H., Gaddy, B. B., & Dean, C. B. (2005). A look at the
condition of rural education research: Setting a direction for future research.
Journal of Research in Rural Education, 20(6), 1-25.
Assouline, S. G., Colangelo, N., VanTassel-Baska, J., & Lupkowski-Shoplik, A. (2015).
A nation empowered: Evidence trumps the excuses holding back America’s
brightest students. Iowa City, IA: The Connie Belin and Jacqueline N. Blank
International Center for Gifted Education and Talent Development.
Azano, A. P., Callahan, C. M., Missett, T. C., & Brunner, M. (2014). Understanding the
experiences of gifted education teachers and fidelity of implementation in rural
schools. Journal of Advanced Academics, 25(2), 88-100.
Baudson, T. G., & Preckel, F. (2013). Teachers' implicit personality theories about the
gifted: An experimental approach. School Psychology Quarterly, 28(1), 37.
Bégin, J., & Gagné, F. (1994). Predictors of attitudes toward gifted education: A review
of the literature and a blueprint for future research. Journal for the Education of
the Gifted, 17(2), 161-179.
Colangelo, N., Assouline, S. G., & New, J. K. (1999). Gifted education in rural schools:
A national assessment. Iowa City, IA: The Connie Belin & Jacqueline N. Blank
International Center for Gifted Education and Talent Development.

27
Retrieved from ERIC database. (ED430766).
Colangelo, N., Assouline, S. G., & New, J. K. (2001). Gifted voices from rural America.
Iowa City, IA: The Connie Belin & Jacqueline N. Blank International Center for
Gifted Education and Talent Development. Retrieved from ERIC database.
(ED463916).
Copenhaver, R. W., & McIntyre, D. J. (1992). Teachers’ perceptions of gifted students.
Roeper Review 14(3), 151-153.
Cramond, B., & Martin, C. E. (1987). In-service and preservice teachers' attitudes toward
the academically brilliant. Gifted Child Quarterly, 31(1), 15-19.
Croft, L. (2015). Rural teachers of the gifted: The importance of professional
development. In T. Stambaugh & S. Wood (Eds.), Serving gifted students in rural
settings (pp. 341-362). Waco, TX: Prufrock Press.
Cross, T. L. (2002). Competing with myths about the social and emotional development
of gifted students. Gifted Child Today, 25(3), 44-45, 65.
Cross, T. L., & Burney, V. H. (2005). High ability, rural, and poor: Lessons from Project
Aspire and implications for school counselors. Journal of Secondary Gifted
Education, 16(4), 148-156.
Cross, J. R., Cross, T., & Frazier, A. D. (2013). Student and teacher attitudes toward
giftedness in a two laboratory school environment: A case for conducting a needs
assessment. NALS journal, 5(1), 1.
Ford, D. Y. (2010). Multicultural issues: Underrepresentation of culturally different
students in gifted education: Reflections about current problems and
recommendations for the future. Gifted Child Today, 33(3), 31-35.

28
Ford, D. Y. (2013). Recruiting and retaining culturally different students in gifted
education. Waco, TX: Prufrock Press.
Fowles, J., Butler, J. S., Cowen, J. M., Streams, M. E., & Toma, E. F. (2014). Public
employee quality in a geographic context: A study of rural teachers. The
American Review of Public Administration, 44(5), 503-521.
https://doi.org/10.1177/0275074012474714 Gagne, F. (1983). Perceptions of programs for gifted children: Agreement on principles,
but disagreement over modalities. BC Journal of Special Education, 7(2), 113-
27.
Gagné, F., & Nadeau, L. (1991). Opinions about the gifted and their education.
Unpublished instrument.
Geake, J. G., & Gross, M. U. (2008). Teachers' negative affect toward academically
gifted students: An evolutionary psychological study. Gifted Child Quarterly,
52(3), 217-231.
Grayson, J. & Hall, J. H. (1992). Public attitudes toward education for the ‘gifted’ in
Ontario. Institute for Social Research, York University. Retrieved from ERIC
database. (ED419341).
Gross, M. (1997). Changing teacher attitudes toward gifted children: An early and
essential step. In J. Chan, J. Li, & J. Spinks (Eds.), Maximizing potential:
Lengthening and strengthening our stride. Proceeding of the 11th World
Conference on Gifted and Talented Children (pp. 3-22). Hong Kong,
China: University of Hong Kong Social Sciences Center.

29
Hamilton, L. C., Hamilton, L. R., Duncan, C. M., & Colocousis, C. R. (2008). Place
matters: Challenges and opportunities in four rural Americas. Durham, NH:
Carsey Institute. Retrieved from https://scholars.unh.edu/cgi/viewcontent
.cgi?article=1040&context=carsey
Howley, C. B., Howley, A., & Pendarvis, E. (1995). Out of our minds: Anti-
intellectualism in American schooling. New York, NY: Teachers College Press.
Howley, A., Rhodes, M., & Beall, J. (2009). Challenges facing rural schools:
Implications for gifted students. Journal for the Education of the Gifted, 32(4),
515-536.
Jimerson, L. (2003). The competitive disadvantage: Teacher compensation in rural
America. Washington, DC: Rural School and Community Trust. Retrieved from
http://www.rociidaho.org/wp-content/uploads/2014/12/ROCI_2014FedEdPolicy
_Final.pdf
Johnson, L. D., Mitchel, A. L., & Rotherham, A. J. (2014). Federal education policy in
rural America. Retrieved from Rural Opportunities Consortium of Idaho website:
http://www.rociidaho.org/federaleducation-policy-in-rural-america
Johnson, J., Showalter, D., Klein, R., & Lester, C. (2014). Why rural matters 2013-2014:
The condition of rural education in the 50 states. Washington, DC: Rural School
and Community Trust. Retrieved from https://files.eric.ed.gov/fulltext/ED556045
Johnson, J., & Strange, M. (2007). Why rural matters 2007: The realities of rural
education growth. Washington, DC: Rural School and Community Trust.
Retrieved from https://files.eric.ed.gov/fulltext/ED498859.pdf

30
Jones, E. D., & Southern, W. T. (1992). Programming, grouping, and acceleration in rural
school districts: A survey of attitudes and practices. Gifted Child Quarterly, 36(2),
112-117.
Justman, J., & Wrightstone, J. W. (1956). The expressed attitudes of teachers toward
special classes for intellectually gifted children. Educational Administration and
Supervision, 42, 141-148.
Kentucky Department of Education. (2018). School Report Card. Retrieved from
https://applications.education.ky.gov/src/Default.aspx
Lassig, C. (2009). Teachers' attitudes towards the gifted: The importance of professional
development and school culture. Australasian Journal of Gifted Education, 18(2),
32.
Lavalley, M. (2018). Out of the loop: Rural schools are largely left out of research and
policy discussions, exacerbating poverty, inequity, and isolation. Alexandria, VA:
The Center for Public Education. Retrieved from http://www
.centerforpubliceducation.org/system/files/Rural%20School%20Full20Report.pdf
Lawrence, B. K. (2009). Rural gifted education: A comprehensive literature review.
Journal for the Education of the Gifted, 32(4), 461-494.
Lewis, J. D. (1999). Country living: Benefits and barriers for gifted learners. In: Rural
Special Education for the New Millennium. Conference Proceedings of the
American Council on Rural Special Education (ACRES). Albuquerque, New
Mexico. Retrieved from ERIC database. (ED429751).
Malhoit, G. C. (2005). Providing rural students with a high quality education: The Rural
perspective on the concept of educational adequacy. Washington, D.C.: Rural

31
School and Community Trust. Retrieved from http://www.ruraledu.org/user
_uploads/file/Providing_Rural_Students.pdf
Mattingly, M. J. & Schaefer, A. (2015). Education in rural America: Challenges and
opportunities. In T. Stambaugh & S. Wood (Eds.), Serving gifted students in rural
settings (pp. 53-70). Waco, TX: Prufrock Press.
McBee, M. T. (2006). A descriptive analysis of referral sources for gifted identification
screening by race and socioeconomic status. Journal of Secondary Gifted
Education, 17(2), 103-111.
McCoach, D. B., & Siegle, D. (2007). What predicts teachers' attitudes toward the gifted?
Gifted Child Quarterly, 51(3), 246-254.
Megay-Nespoli, K. (2001). Beliefs and attitudes of novice teachers regarding instruction
of academically talented learners. Roeper Review, 23(3), 178-182.
Moon, T. R., Callahan, C. M., Oh, S., & Hailey, E. P. (2012, November). Current status
of K-12 gifted programs: A national survey. In annual convention of the National
Association for Gifted Children, Denver, CO.
Morris, S. K. (1987). Student teachers' attitudes toward gifted students. Creative Child &
Adult Quarterly (12), 112-114.
National Center for Education Statistics. (2006). Definitions: School locale definitions.
Retrieved from https://nces.ed.gov/surveys/ruraled/definitions.asp
Peachman, M. C. (1942). Attitudes: their significance in education for the gifted. Journal
of Educational Psychology, 33(3), 183.
Perković Krijan, I., Jurčec, L., & Borić, E. (2015). Primary School Teachers' Attitudes
toward Gifted Students. Croatian Journal of Education: Hrvatski časopis za

32
odgoj i obrazovanje, 17(3), 681-724. Retrieved from https://doi.org/10.15516
/cje.v17i3/1199
Player, D. (2015, March). The supply and demand for rural teachers. Boise, ID: Rural
Opportunities Consortium of Idaho. Retrieved from http://www.rociidaho.org
/wpcontent/uploads/2015/03/ROCI_2015_RuralTeachers_FINAL.pdf
Plucker, J. A. (2013). Students from rural environments. In C. Callahan & H. Hertberg-
Davis (Eds.), Fundamentals of gifted education: Considering multiple perspectives
(2nd ed.) (pp. 301-314). New York, NY: Routledge.
Plunkett, M., & Kronborg, L. (2011). Learning to be a teacher of the gifted: The
importance of examining opinions and challenging misconceptions. Gifted and
Talented International, 26(1-2), 31-46.
Puryear, J. S., & Kettler, T. (2017). Rural gifted education and the effect of proximity.
Gifted Child Quarterly, 61(2), 143-152.
Rambo, K. E., & McCoach, D. B. (2012). Teacher attitudes toward subject-specific
acceleration: Instrument development and validation. Journal for the Education of
the Gifted, 35(2), 129-152.
Ramos, E. (2010). Let us in: Latino underrepresentation in gifted and talented programs.
Journal of Cultural Diversity, 17(4), 151.
Reininger, M. (2012). Hometown disadvantage? It depends on where you’re from:
Teachers’ location preferences and the implications for staffing schools.
Educational Evaluation and Policy Analysis, 34(2), 127-145.

33
Richards, Z. & Stambaugh, T. (2015). National context of rural schools. In T.
Stambaugh & S. Wood (Eds.), Serving gifted students in rural settings (pp. 341-
362). Waco, TX: Prufrock Press.
Rubenzer, R. L., & Twaite, J. A. (1979). Attitudes of 1,200 educators toward the
education of the gifted and talented: Implications for teacher preparation. Talents
and Gifts, 2(4), 202-213.
Showalter, D., Johnson, J., Klein, R., & Hartman, S. L. (2017). Why rural matters 2015
2016: Understanding the changing landscape. Washington, DC: Rural School
and Community Trust. Retrieved from http://www.ruraledu.org/user_uploads
/file/WRM-2015-16.pdf
Siegle, D., Wilson, H. E., & Little, C. A. (2013). A sample of gifted and talented
educators’ attitudes about academic acceleration. Journal of Advanced
Academics, 24(1), 27-51.
Spicker, H. H., Southern, W. T., & Davis, B. I. (1991). The rural gifted child. In R.
Jenkins-Friedman, E. S. Richert, & J. F. Feldhusen (Eds.) Special populations of
gifted learners: A book of readings (pp. 92-98). New York: Royal Fireworks
Press.
Stambaugh, T. (2015). Celebrating talent: Identification of rural gifted students. In T.
Stambaugh & S. Wood (Eds.), Serving gifted students in rural settings (pp. 97-
110). Waco, TX: Prufrock Press.
Szymanski, T., & Shaff, T. (2013). Teacher perspectives regarding gifted diverse
students. Gifted Children, 6(1), 1.

34
Tannenbaum, A. J. (1962). Adolescent attitudes toward academic brilliance. New York,
NY: Bureau of Publications, Teachers College, Columbia University.
Troxclair, D. A. (2013). Preservice teacher attitudes toward giftedness. Roeper Review,
35(1), 58-64.
U.S. Department of Education, National Center for Education Statistics. (2014). Common
core of data: Public elementary/secondary school universe survey 2013-14
(version 1a). Retrieved from https://nces.ed.gov/surveys/ruraled/tables/A.1.a
.3_2.asp?refer=
Watts, G. (2006). Teacher attitudes to the acceleration of the gifted: a case study from
New Zealand. Gifted & Talented, 10(1), 11-19.

35
Appendix: Survey Instrument
Please review the following implied consent form and choose "Yes" or "No"
o Yes, I wish to continue to the survey.
o No, I would like to quit and exit the survey.
Q1 Thank you for participating in this survey. We are requesting the district in which you
teach in order to categorize data by locality code only; no identifying information about
you will be shared. This survey should take approximately 10-15 minutes to complete.
Q2 School district in which you teach:
Q3 Number of years teaching:
Q4 Does your school have a gifted program?
o Yes
o No
Q5 Does your school have a gifted and talented coordinator?
o Yes
o No
Q6 Grade level(s) you teach: (check all that apply)
o Elementary Grades (K-5)
o Middle Grades (6-8)
o High School (9th-12th)
Q7 Do you work with gifted learners on a regular basis?
o Yes
o No

36
Q8 Have you ever been identified for participation in gifted programming?
o Yes
o No
Q9 Have any of your family members of close friends ever been identified for
participation in gifted programming?
o Yes
o No
Q10 Do you live within the community in which you teach?
o Yes
o No, I commute from another district
Q11 If you commute from another district, how far is your commute?
o 1-10 miles
o 11-25 miles
o 26-50 miles
o more than 50 miles
Q12 Are you a graduate of the school district in which you currently teach?
o Yes
o No
Directions:
The following statements concern gifted children and their education; they were taken
from newspaper articles, books, and other sources. We would like to know the extent of
your agreement or disagreement with each of them. There are no correct or incorrect
answers. Please feel free to express your personal opinion.

37
1. Use the scale below to give your opinion.
2. Choose the statement which best represents your opinion.
3. Answer as spontaneously as possible.
4. Please answer all questions.
5. Please use "Undecided" as an answer as little as possible.
Q13 Our schools should offer special educational services for the gifted.
o Totally disagree
o Partially disagree
o Undecided
o Partially agree
o Totally agree
Q14 The best way to meet the needs of the gifted is to put them in special classes.
o Totally disagree
o Partially disagree
o Undecided
o Partially agree
o Totally agree
Q15 Children with difficulties have the most need of special education services.
o Totally disagree
o Partially disagree
o Undecided
o Partially agree
o Totally agree

38
Q16 Special programs for gifted children have the drawback of creating elitism.
o Totally disagree
o Partially disagree
o Undecided
o Partially agree
o Totally agree
Q17 Special educational services for the gifted are a mark of privilege.
o Totally disagree
o Partially disagree
o Undecided
o Partially agree
o Totally agree
Q18 When the gifted are put in special classes, the other children feel devalued.
o Totally disagree
o Partially disagree
o Undecided
o Partially agree
o Totally agree
Q19 Most gifted children who skip a grade level have difficulties in their social
adjustment to a group of older students.
o Totally disagree
o Partially disagree
o Undecided

39
o Partially agree
o Totally agree
Q20 It is more damaging for a gifted child to waste time in class than to adapt to skipping
a grade.
o Totally disagree
o Partially disagree
o Undecided
o Partially agree
o Totally agree
Q21 Gifted children are often bored in school.
o Totally disagree
o Partially disagree
o Undecided
o Partially agree
o Totally agree
Q22 Children who skip a grade are usually pressured to do so by their parents.
o Totally disagree
o Partially disagree
o Undecided
o Partially agree
o Totally agree
Q23 The gifted waste their time in regular classes.
o Totally disagree

40
o Partially disagree
o Undecided
o Partially agree
o Totally agree
Q24 We have a greater moral responsibility to give special help to children with
difficulties than to gifted children.
o Totally disagree
o Partially disagree
o Undecided
o Partially agree
o Totally agree
Q25 Gifted persons are a valuable resource for our society.
o Totally disagree
o Partially disagree
o Undecided
o Partially agree
o Totally agree
Q26 The specific educational needs of the gifted are too often ignored in our schools.
o Totally disagree
o Partially disagree
o Undecided
o Partially agree
o Totally agree

41
Q27 The gifted need special attention in order to fully develop their talents.
o Totally disagree
o Partially disagree
o Undecided
o Partially agree
o Totally agree
Q28 Our schools are already adequate in meeting the needs of the gifted.
o Totally disagree
o Partially disagree
o Undecided
o Partially agree
o Totally agree
Q29 I would very much like to be considered a gifted person.
o Totally disagree
o Partially disagree
o Undecided
o Partially agree
o Totally agree
Q30 It is parents who have the major responsibility for helping gifted children develop
their talents.
o Totally disagree
o Partially disagree
o Undecided

42
o Partially agree
o Totally agree
Q31 A child who has been identified as gifted has more difficulty in making friends.
o Totally disagree
o Partially disagree
o Undecided
o Partially agree
o Totally agree
Q32 Gifted children should be left in regular classes, since they serve as an intellectual
stimulant for the other children.
o Totally disagree
o Partially disagree
o Undecided
o Partially agree
o Totally agree
Q33 By separating students into gifted and other groups, we increase the labeling of
children as strong-weak, good-less good, etc.
o Totally disagree
o Partially disagree
o Undecided
o Partially agree
o Totally agree
Q34 Some teachers feel their authority threatened by gifted children.

43
o Totally disagree
o Partially disagree
o Undecided
o Partially agree
o Totally agree
Q35 The gifted are already favored in our schools.
o Totally disagree
o Partially disagree
o Undecided
o Partially agree
o Totally agree
Q36 In order to progress, a society must develop the talents of gifted individuals to a
maximum.
o Totally disagree
o Partially disagree
o Undecided
o Partially agree
o Totally agree
Q37 By offering special educational services to the gifted we prepare the future members
of a dominant class.
o Totally disagree
o Partially disagree
o Undecided

44
o Partially agree
o Totally agree
Q38 Taxpayers should not have to pay for special education for the minority of children
who are gifted.
o Totally disagree
o Partially disagree
o Undecided
o Partially agree
o Totally agree
Q39 Average children are the major resource of our society; so, they should be the focus
of our attention.
o Totally disagree
o Partially disagree
o Undecided
o Partially agree
o Totally agree
Q40 Gifted children might become vain or egotistical if they are given special attention.
o Totally disagree
o Partially disagree
o Undecided
o Partially agree
o Totally agree

45
Q41 When skipping a grade, gifted students miss important ideas (they have "holes" in
their knowledge).
o Totally disagree
o Partially disagree
o Undecided
o Partially agree
o Totally agree
Q42 Since we invest supplementary funds for children with difficulties, we should do the
same for the gifted.
o Totally disagree
o Partially disagree
o Undecided
o Partially agree
o Totally agree
Q43 Often, gifted children are rejected because people are envious of them.
o Totally disagree
o Partially disagree
o Undecided
o Partially agree
o Totally agree
Q44 The regular school program stifles the intellectual curiosity of gifted children.
o Totally disagree
o Partially disagree

46
o Undecided
o Partially agree
o Totally agree
Q45 The leaders of tomorrow's society will come mostly from the gifted of today.
o Totally disagree
o Partially disagree
o Undecided
o Partially agree
o Totally agree
Q46 A greater number of gifted children should be allowed to skip a grade.
o Strongly agree
o Somewhat agree
o Neither agree nor disagree
o Somewhat disagree
o Strongly disagree
Note: From Gagné & Nadeau “Opinions About the Gifted and Their Education” (F.
Gagné, personal correspondence, April 30, 2017).