teacher effects and the achievement gap: do teacher and ... tcr.pdf · teacher effects and the...
TRANSCRIPT
Teacher Effects and the AchievementGap: Do Teacher and Teaching QualityInfluence the Achievement Gap BetweenBlack and White and High- and Low-SESStudents in the Early Grades?
LAURA M. DESIMONE
University of Pennsylvania
DANIEL LONG
Wesleyan University
Background/Context: Although there is relative agreement on the pattern of the achievementgap, attributing changes in the gap to schooling is less clear. Our study contributes to under-standing potential teacher and teaching effects on achievement and inequality.Purpose/Objective/Research Question/Focus of Study: We intend our work to contribute tounderstanding the school’s role in addressing the achievement gap. We investigate the extentto which specific aspects of teacher quality (degree in math, experience, certification, mathcourses, and professional development) and teaching quality (time spent on math instruc-tion and conceptual, basic procedural, and advanced procedural instruction) influencemathematics achievement growth and the achievement gap between White and Black stu-dents and low- and high-SES students in kindergarten and first grade.Research Design, Data Collection and Analysis: In this secondary analysis, we examine thefirst four waves of data from the National Center for Education Statistics’ Early ChildhoodLongitudinal Study (2000), a nationally representative longitudinal sample of studentswho were kindergartners in 1998. We use multilevel growth models to estimate relationships.Findings/Results: We found evidence that lower achieving students are initially assigned to
Teachers College Record Volume 112, Number 12, December 2010, pp. 3024–3073Copyright © by Teachers College, Columbia University0161-4681
Teaching Quality and the Achievement Gap 3025
teachers who emphasize basic instruction, and higher achieving students are assigned teach-ers who emphasize more advanced instruction. The use of advanced procedural instructionand time spent on math were related to achievement growth for traditionally disadvantagedpopulations—Black students and low-SES students. Other types of instruction and teacherquality variables were not related to achievement growth.Conclusions/Recommendations: We found weak or no effects for teacher quality and type ofinstruction, which suggests that these aspects of teacher and teaching quality may operate assorting variables. This may explain a part of the findings of past cross-sectional and gainstudies that would likely interpret correlations between teachers and teaching as part of theeffect of instruction. We found that low achievers tend to get teachers who spend less time oninstruction, a variable we found significant in influencing achievement growth. If, as ourstudy found, time on instruction matters, and disadvantaged students are more likely to getthe weakest teachers who spend less time on instruction, we can identify an area in whichschooling exacerbates the achievement gap but has the potential to ameliorate it.
Inequality in education outcomes has been the target of research andpolicy at least since the War on Poverty in 1965. A central question hasbeen whether schools mitigate or exacerbate the achievement gapbetween students of different racial/ethnic backgrounds and familyincome levels. Some argue that schools reproduce inequalities (Bourdieu& Passeron, 1977; Bowles & Gintis, 1976) through systematic differenceswithin schools (e.g., tracking; Gamoran & Mare, 1989; Oakes, 1985) orbetween schools (e.g., teacher quality; Condron & Roscigno, 2003).Others believe that the schools act to decrease inequality (Cremin, 1951)by providing disadvantaged students with educational experiences theyotherwise would not be exposed to at home.
Our study contributes to understanding the school’s role in inequalityby investigating the extent to which specific aspects of teacher and teach-ing quality influence student mathematics achievement growth and theachievement gap between White and Black students and low- and high-SES students in kindergarten and first grade, using a nationally represen-tative sample of students, the Early Childhood Longitudinal Study(ECLS).
NATIONAL DATA AND TRENDS IN THE ACHIEVEMENT GAP
Recent analyses of national and other large-scale data have found clearpatterns in the achievement gap among races/ethnicities. Reviews of theNational Assessment of Education Progress (NAEP; Braswell et al., 2001)and other national data show that before formal schooling begins, Blackchildren perform about half of a standard deviation lower than Whitechildren in mathematics, reading, and vocabulary. Furthermore, this gap
3026 Teachers College Record
remains constant in reading and widens by an additional two-tenths of astandard deviation in mathematics and vocabulary by 12th grade(Phillips Crouse, & Ralph, 1998).
For mathematics, which we focus on in this study, Tate (1997) exam-ined three national data sets—the NAEP, the National EducationLongitudinal Study (NELS), and Scholastic Achievement Test (SAT)scores—and found that from 1973 to 1992, both White and Black stu-dents experienced positive growth in mathematics proficiency. However,there was still a large achievement gap in mathematics between the twogroups, and White students outperformed Black students at each gradelevel. Hedges and Nowell (1998) found similar results by examining sixlarge nationally representative surveys conducted between 1965 and1992.
Studies examining the extent to which SES explains the race achieve-ment gap are mixed. Lubienski (2002) analyzed NAEP data from 1990 to2000 and found that Black–White gaps on math performance were signif-icant at both the lowest and highest SES levels and that the lowest SESWhite students consistently scored equal to or higher than the highestSES Black students across three grades (fourth, eighth, and twelfth) in1990 and 1996. In contrast, Fryer and Levitt (2004) analyzed the ECLSand modeled the gap such that SES variables explained much of theBlack–White achievement gap in kindergarten and first grade.
LACK OF CLEAR EVIDENCE ABOUT THE SCHOOL’S ROLE IN THEACHIEVEMENT GAP
Although there is relative agreement on the pattern of the achievementgap, attributing changes in the gap to schooling is less clear. One compli-cation is that the gap between advantaged and disadvantaged studentshas been shown to increase during the summer recess (Alexander,Entwisle, & Olson, 2001; Cooper, Nye, Charlton, Lindsay & Greathouse,1996; Heyns, 1978, 1987), which confounds the interpretation of theschool’s role when summer is not accounted for separately. Further, thesesame studies found that the pattern of gaps and growth across readingand mathematics can be quite different, as can results depending on howthe gap is defined—for example, between White and Black and high- andlow-SES students (Alexander et al., 2001). Further, out-of-school timevaries substantially in the quality of educational experiences for the child(Hart & Risley, 1995), a variable that is difficult to include in models ofthe gap. Still another confounding factor is that regression toward themean might explain the increasing of the gap—for example, Black stu-dents regress toward the Black student population mean, which is lower
Teaching Quality and the Achievement Gap 3027
than the student population mean for Whites (Porter, 2005).The complexities of regression toward the mean, summer effects, dif-
ferent findings across subjects and for race and SES, and the quality andvariation in out-of-school time make it difficult to determine the school’srole in maintaining or improving the achievement gap (Phillips et al.,1998). The most recent empirical work that attempts directly to addressthe question of whether schools improve or magnify the achievement gapfound that schools improve the achievement gap. In a careful analysis,Downey, von Hippel, and Broh (2004) used ECLS-K data, which is anationally representative longitudinal sample of children who werekindergartners in 1998. They separated summer and school effects andshowed that the Black–White achievement gap decreased during theschool year. Additionally, Fryer and Levitt (2004) analyzed the kinder-garten wave of the ECLS-K and concluded that a substantial part of theBlack–White achievement gap might be due to Black students attending“worse” schools than White students.
Our study builds on this work by going inside the “black box” of school-ing to examine the extent to which teachers and teaching influence theachievement gap in mathematics. The ECLS is ideal for bridging achieve-ment gap trends and linking it with classroom instruction. In our studywe link work on reform-oriented mathematics teaching (e.g., Carpenter,Fennema, Peterson, Chiang, & Loef, 1989; Cohen & Hill, 2001; Newman& Associates, 1996; Spillane & Zeuli, 1999) with larger scale work on theachievement gap (Downey et al., 2004; Fryer & Levitt, 2004; Phillips et al.,1998).
A focus on mathematics is justified given that U.S. students are achiev-ing at alarmingly low levels in math compared to other countries (Porter,2005; Schmidt et al., 2001; U.S. Department of Education, 2003), andteacher quality is a major contributor to the problem (Schmidt,McKnight, & Raizen, 1997). Focusing on a single subject, a commonpractice in studying teaching (e.g., Xue & Meisels, 2004), allows usgreater control over the potentially confounding effects of a subject givenconsistent differences in the reading and mathematics achievement gapsacross grades (Phillips et al., 1998). Further, teaching technologies andrequired competencies are different for different subjects, as are theissues involved in teacher quality, such as content knowledge and certifi-cation requirements.
DOES TEACHER OR TEACHING QUALITY MATTER?
In trying to improve overall achievement and decrease the achievementgap, a major focus of education reform efforts has been teacher and
3028 Teachers College Record
teaching quality, an especially promising reform option (Porter, 2005).Several studies using value-added approaches to link teachers to studentoutcomes in elementary school suggest that the effects of teachers maybe quite substantial (Rowan, Correnti, & Miller, 2002; Wright, Horn, &Sanders, 1997).
The ECLS provides us with an opportunity to examine the extent towhich teacher characteristics and instruction are related to overallachievement and the achievement gap. The four main teacher and teach-ing quality features discussed in the literature, and which we focus ourstudy on, are content knowledge, experience, certification and reform-oriented instruction. Below we highlight the major findings in theseareas, as they pertain to links to student achievement.
TEACHER QUALITY AND STUDENT ACHIEVEMENT
Most of the research on teacher credentials published since the debut ofthe Coleman Report (Coleman et al., 1966) has focused on the linkbetween teacher characteristics and student achievement. These studiesfound positive associations between student achievement and teacherknowledge, measured as their Scholastic Aptitude (or, more recently,Assessment) Test (SAT) or National Teacher Examination (NTE) score(Ballou, 1996; Ehrenberg & Brewer, 1994, 1995; Ferguson, 1991;Ferguson & Ladd, 1996; Mosteller & Moynihan, 1972; Strauss & Sawyer,1986; Wright et al., 1997). Other studies found connections between stu-dent achievement and teacher knowledge proxies such as college major,number of courses, or amount of professional development taken in asubject area (Cohen & Hill, 2000; Darling-Hammond, 2000; Goldhaber& Brewer, 1997, 2000; Monk, 1994; Monk & King, 1994; Wenglinsky,2000, 2002; Wiley & Yoon, 1995). Greenwald, Hedges, and Laine (1996)found, based on a meta-analysis, that teachers who attend better collegesand/or score higher on standardized tests produce greater gains in stu-dent achievement but are less likely to teach low-SES, Black, or Hispanicstudents. Teaching experience has been associated with achievementgains in high school mathematics (Fetler, 1999) and elementary mathe-matics (Murnane & Phillips, 1981; Rowan et al., 2002).
Studies of the relationship between teacher certification and studentperformance are more mixed (e.g., Darling-Hammond, Berry, &Thorenson, 2001; Goldhaber & Brewer, 2000). For example, Hawk,Coble, and Swanson (1985) found a positive relationship between math-ematics achievement and teacher certification in secondary school,whereas Fetler (1999) found a negative correlation between mathematicsand emergency credentials. Goldhaber and Brewer (2000) found no dif-
Teaching Quality and the Achievement Gap 3029
ference in mathematics achievement according to emergency or regularteacher certification for high school, and Rowan et al. (2002) found asimilar lack of relationship at the elementary school level. These varyingfindings are likely in part because certification is operationalized quitedifferently across states.
INSTRUCTION AND STUDENT ACHIEVEMENT
Student opportunity to learn, defined as time spent on instruction in theclassroom, has for several decades been shown to matter for studentachievement (e.g., Carroll, 1963; Gamoran, Porter, Smithson, & White,1997; Guarino, Hamilton, Lockwood, Rathbun, & Hausken, 2006). It isespecially salient for disadvantaged students, who often do not receivehigh-quality education experiences outside of school (Alexander et al.,2001).
In addition to the amount of time spent on academic content, inrecent years, there has been a focus on the importance of the type ofinstruction that teachers use in mathematics (Cohen, McLaughlin, &Talbert, 1993; Elmore, Peterson, & McCarthy, 1996; Lampert, 1990;Milesi & Gamoran, 2005). Our choice about how to measure mathemat-ics instruction is grounded in this literature and reflects current reformefforts in mathematics. The characteristics of effective teaching andteachers are varied and complex, and there is no firm consensus on what“good” teaching looks like (see Loveless, 2001). Thus, we developed ourmeasures of teaching from current work in the teaching and learning ofmathematics that seeks to increase the emphasis on conceptual learninggoals (e.g., reasoning, estimation, conjecture; Cohen & Ball, 1990;National Commission on Teaching and America’s Future, 1996; NationalCouncil of Teachers of Mathematics, 1989; Spillane & Zeuli, 1999) anddecrease the emphasis on procedural learning goals (e.g., memorization,computation, routine problem-solving), which predominates instructionacross American classrooms (Schmidt et al., 1997).
Debates persist about the appropriate balance between conceptual andprocedural instruction in mathematics; it has not yet been determinedwhich mix of content with which students has what effect over what dura-tion of time under what circumstances (see Gamoran, Secada, & Marrett,2000; Loveless, 2001; Shouse, 2001). However, many studies have docu-mented achievement benefits from increased use of conceptual tech-niques in mathematics, from using different definitions of conceptualinstruction, to studying different grade levels (e.g., Carpenter et al., 1989;Cobb et al., 1991; Cohen & Hill, 2000; Gamoran et al., 1997; Hamilton etal., 2003; Hiebert et al., 1996, 1997; Lee, Smith, & Croninger, 1997; Silver
3030 Teachers College Record
& Lane, 1995). Research also shows that conceptual techniques might beespecially beneficial to disadvantaged students (e.g., Knapp, Shields, &Turnbull, 1992; Smith, Lee, & Newmann, 2001), but that compared withtheir high- and midachieving counterparts, low-achieving studentsreceive less conceptual and more procedural instruction on average(Knapp & Shields, 1990; Kozma & Croninger 1992; Levine, 1988; Smithet al., 2005). Some studies, though, offer evidence in support of anemphasis on direct, procedural instruction (e.g., Geary, 2001; Slavin,Madden, Karweit, Livermon, & Dolan, 1990), especially in the earlygrades (D’Agostino, 2000).
A few studies have attempted to examine the effects of different typesof instruction on the achievement gap. One study examined the differen-tial impact of reform (inquiry-based) and traditional (teacher-centered)types of instruction on Black and Hispanic students’ math performanceby using a subsample of 190 Black and 174 Hispanic students from NELS:88 (Manswell Butty, 2001). Results showed no significant differencesbetween the two types of instruction on 10th-grade students’ mathachievement; however, for 12th-grade students, reform-oriented instruc-tion was significantly more effective than traditional teaching. Anotherstudy examined the impact of reform-based instruction on closingfourth-grade students’ achievement gap in mathematics by using the2000 NAEP (Wenglinsky, 2004). In this study, Wenglinsky distinguishedtwo types of achievement gaps: a within-school gap and a between-schoolgap. The results showed that when instructional practices were taken intoaccount, the within-school gaps disappeared, but the between-schoolgaps remained unchanged. In addition, the study indicated that someinstructional practices were beneficial to all students, irrespective of race.For example, increasing class time spent on math, emphasizing routineproblems, and emphasizing geometry were found to be beneficial to allstudents. Some practices were found to have negative impacts on all stu-dent achievement. Those practices included frequent testing, working onprojects, and emphasizing facts. The practices particularly beneficial toAfrican American students differed somewhat from those beneficial tothe whole student body. For Black students, the most beneficial practicewas the emphasis on topics of measurement, and the most detrimentalpractice was taking tests.
CONTRIBUTIONS OF OUR STUDY
Our focus on teacher quality is based on the belief that certain teacherbackground characteristics are related to better teaching. The focus onteaching quality is based on the belief that better instruction leads to
Teaching Quality and the Achievement Gap 3031
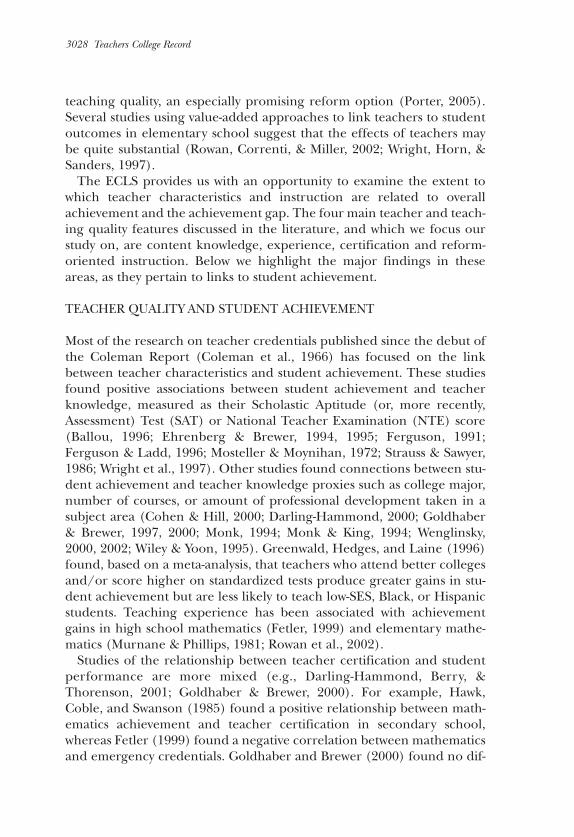
improved student achievement. Drawing on achievement gap andteacher quality research, we focus our inquiry on contrasting proceduraland conceptual approaches to teaching and several key teacher qualityindicators—specifically, certification, whether the teacher is inexperi-enced (less than two years of teaching experience), content knowledge asproxied by degree in mathematics, mathematics courses, and profes-sional development taken in mathematics. Figure 1 reflects our concep-tual framework for the study.
Figure 1. Conceptual Framework for the Study
The ECLS provides an opportunity to build on previous work by exam-ining the same students over time in order to identify the processthrough which teachers might affect achievement and the achievementgap. Our study has several strengths that build on and extend previouswork: (1) we use nationally representative longitudinal data that allowgrowth modeling, (2) we use a hierarchical framework to account for thefact that students are nested within teachers, and time points are nestedwithin students, (3) we take into account summer learning curves tomake a stronger separation between school and out-of-school effects,much like Downey et al. (2004), and (4) we examine the initial teacherand teaching quality distribution as well as change over time to separateinitial correlations due to teacher assignment from effects of teachersand teaching on growth. This last modification allows us to account forresearch that has shown that students from low-income homes are morelikely to be taught by inexperienced teachers who are not certified anddo not have a degree in the content area in which they are teaching (e.g.,Goldhaber & Brewer, 2000; Ingersoll, 2002). Research also suggests thathigh-poverty students are more likely to have teachers who rely predom-inantly on basic/procedural rather than conceptual/higher orderinstruction (Barr, Wiratchai, & Dreeben, 1983; Desimone, Smith, &Frisvold, 2007; Gamoran, 1986; Smith, Desimone, & Ueno, 2005),
3032 Teachers College Record
though high-poverty students do not necessarily have lower conceptualthan procedural achievement (Desimone, Smith, Hayes, & Frisvold,2005). We examine initial teacher assignments to see if they correspondto this pattern, and then look at whether those characteristics affect stu-dent cognitive growth. Finally, (5) we categorize mathematics instructionboth as opportunity to learn (full-day kindergarten and time spent onmathematics) and into a three-part typology of types of instruction,which reflects current debates in the mathematics community about theefficacy of a relative emphasis on conceptual versus proceduralapproaches to teaching math. This allows us to test on a national samplewhether particular types of instruction are more or less effective foradvantaged and disadvantaged students’ achievement growth.
Our study builds on a recent NCES gains analysis of ECLS data thatlinked teacher quality and student achievement in kindergarten(Guarino et al., 2006). We extend this work by measuring growth ratherthan just one-year gains, including first grade and accounting for sum-mer effects, and using more comprehensive measures of teachers’ learn-ing experiences (including professional development) and credentials(differentiating among alternative, emergency, and high and low). Wealso focus on mathematics content rather than pedagogy, which has beenshown to be more weakly related to achievement (Pellegrino, Baxter, &Glaser, 1999; Porter, Kirst, Osthoff, Smithson, & Schneider, 1993).Further, we look at effects of teacher quality and instruction on overallachievement as well as the achievement gap. Previous studies have used amultitude of race/ethnicity and income categories when examining theachievement gap. Here we focus on the most common racial gap,between Black and White students, and the most commonly examinedincome gap, between high- and low-SES students.
RESEARCH QUESTIONS
Our inquiry focuses on looking inside schooling to examine whetherteacher and teaching quality matters for overall achievement and narrow-ing the achievement gap between White and Black and low- and high-SESstudents in kindergarten and first grade. We focus on three main ques-tions. First we ask, What is the distribution of teacher and teaching quality dur-ing the first year of kindergarten? Here we hypothesize, based on previousresearch, that low-achieving students are more likely to be assigned toteachers with less experience, lower credentials, and less content knowl-edge and that teachers spend less time on instruction and are more likelyto use procedural rather than conceptual approaches to instruction. Oursecond question asks, To what extent do teacher quality, time spent on instruc-
Teaching Quality and the Achievement Gap 3033
tion, and type of instruction predict growth in student achievement in kinder-garten and first grade? Our third question analyzes the answer to the sec-ond question in the context of inequality, asking, To what extent do teacherand teaching quality narrow the Black–White and low-/high-SES achievementgap?
DATA AND SAMPLE
We examine the first four waves of data from the National Center forEducation Statistics’ (NCES, 2000) Early Childhood Longitudinal Study-Kindergarten Cohort (ECLS-K), a nationally representative longitudinalsample of students who were kindergartners in 1998. The kindergartensample is based on a national sample of schools with kFindergarten pro-grams. Because the ECLS followed students, teachers and schools weresampled in the first grade only if they included one or more ECLS-K chil-dren in their classrooms (NCES, 2002b). This study examines kinder-garten and first-grade teachers within schools using teacher and principalsurveys and student achievement scores from the “restricted use” versionof the ECLS. These data allow the linking of students to teachers andschools. The ECLS provides data on a national multistage probabilitysample of approximately 19,000 kindergartners and first graders in 3,000classrooms in 1,000 schools. The Department of Education used a dual-frame multistage sampling design in which 100 primary sampling units ofcounties or groups of counties were selected. Private and public schoolswere sampled separately within each of the chosen primary samplingunits, and about 23 kindergartners were selected from each of the sam-pled schools. Students were followed from fall of kindergarten until fifthgrade, with a refresher sample in first grade. Specifically, the first wave ofthe ECLS consisted of fall and spring kindergartner achievement tests,teacher surveys (93% response rate), principal surveys (69%), and par-ent interviews (85%). In fall 1999, a subsample of first graders was givenachievement tests. All students were tested again in spring 1999, 2001(third grade), and 2003 (fifth grade). Teacher, administrator, and parentdata collections were also administered again in these years. Privateschool kindergartners and Asian students were oversampled. This sam-pling design allows comparisons among students by race and ethnicityand by socioeconomic status (Tourangeau, Nord, Lê, Pollack, & Atkins-Burnett, 2006).
We analyze students who have taken at least one wave of the mathemat-ics assessment test. This reduced our sample size from 21,399 to 19,730.To conduct a growth curve analysis, we needed the date of entry intokindergarten and the date of each of the four achievement tests. When
3034 Teachers College Record
there was an assessment score without a date, we imputed the missingdate from the median date of assessment for the student’s school. If allthe students in a given school were missing the dates of an assessment, wedropped observations at the assessment level. We dropped cases that hadmissing data on all four assessments. We only included cases in which wewere able to match students to their teachers. These additional require-ments further reduced our sample to 10,980 students in 2,164 schools.See Appendix A for how missing data affects our sample.
In this study, we used data from the kindergarten and first-grade wavesand analyzed the full sample of students (N=10,980) as well as four sub-samples: White students (n = 6,652); Black students (n = 1,447); low-SESstudents (n = 2,797), defined as students who are in the lowest SES quar-tile; and high-SES students (n = 2,736), defined as students who are in thehighest SES quartile.
VARIABLES
We calculated teacher-level variables from teacher questionnaires andclassroom averages of student characteristics, and we calculated school-level characteristics from administrator surveys and school averages ofstudent characteristics.
ACHIEVEMENT SCORES
Our growth curve model is based on an analysis of student and classroomcharacteristics at three levels: multiple student assessment scores, nestedwithin students, nested within schools. At the student assessment level, weexamined the dependent variable of math achievement scaled using itemresponse theory (IRT) so that it could be compared across all four tests(in the fall and spring of kindergarten and the fall and spring of firstgrade). Each test counts as a separate observation, such that a studentwho took all four assessment tests would have four different observationsat level 1.
As we mentioned earlier, children’s reading and math skills were testedon four occasions: spring and fall of kindergarten (1998–1999), and falland spring of first grade (1999–2000). The first, second, and fourth testswere given to all available students; the third test in the fall of first grade
Teaching Quality and the Achievement Gap 3035
was given in a 30% random subsample of schools. Tests followed a two-stage format designed to reduce ceiling and floor effects. In the firststage, children took a brief “routing test” comprising items of a widerange of difficulty. In the second stage, children took a test containingquestions of appropriate difficulty given the results of routing test(NCES, 2000). IRT was used to map children’s answers onto a common64-point scale for math. Few scores were clustered near the top or bottomof IRT scales, suggesting that ceiling and floor effects were minimized. Inaddition, the IRT scales improved validity and reliability by down-weight-ing questions with poor discrimination or high guessability (Rock &Pollack, 2002).
We paid careful attention to the dates on which tests were given, simi-lar to Downey et al.’s (2004) study. We included variables for the numberof days between the beginning of kindergarten and each test administra-tion. So, the kindergarten (K), summer (S), and first grade (F) variablesreflect how long the child was in each in grade (or the length of summer)before taking the assessment.
STUDENT VARIABLES
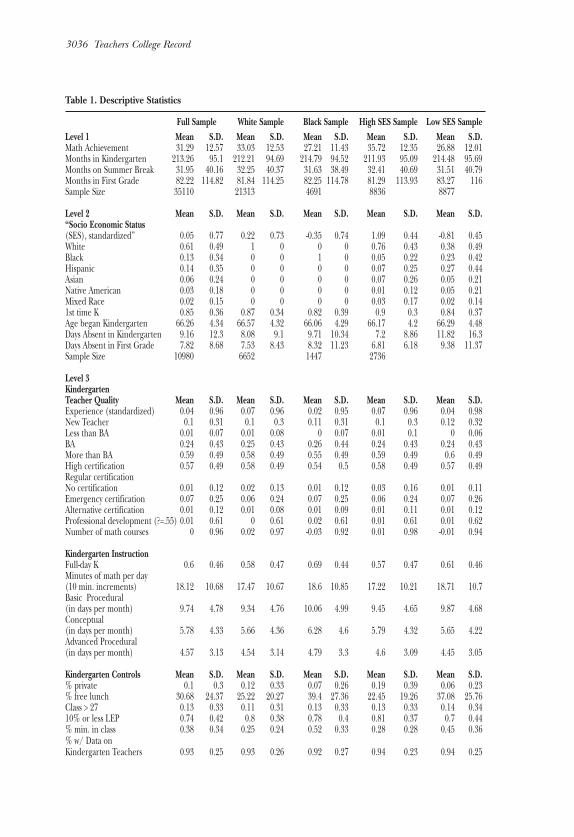
We included a series of control variables to measure SES and race at thestudent level. To measure SES, we used a measure calculated by NCESthat consists of a weighted average of parent’s education and income.This variable is standardized with a mean of 0 and a standard deviationof 1. We measured race with dummy variables for White, Black, Asian,Hispanic, Native American, and mixed race.1 We also included controlsfor other factors that might be associated with achievement, such as theage of the student (in months) at the beginning of kindergarten andwhether the student was in kindergarten for the first time in the1998–1999 school year. Last, at the student level, we included days absentfrom kindergarten and first grade. The days-absent variable can also beviewed as a measure of opportunity to learn, given that absence fromclasses leads to less exposure to teaching and less of a chance to learn.See Table 1 for the descriptive statistics for all the level 1and level 2covariates for the full sample and each of our subsamples (i.e., White,Black, and low and high SES).
3036 Teachers College Record
Table 1. Descriptive Statistics
Full Sample White Sample Black Sample High SES Sample Low SES SampleLevel 1 Mean S.D. Mean S.D. Mean S.D. Mean S.D. Mean S.D.Math Achievement 31.29 12.57 33.03 12.53 27.21 11.43 35.72 12.35 26.88 12.01Months in Kindergarten 213.26 95.1 212.21 94.69 214.79 94.52 211.93 95.09 214.48 95.69Months on Summer Break 31.95 40.16 32.25 40.37 31.63 38.49 32.41 40.69 31.51 40.79Months in First Grade 82.22 114.82 81.84 114.25 82.25 114.78 81.29 113.93 83.27 116Sample Size 35110 21313 4691 8836 8877
Level 2 Mean S.D. Mean S.D. Mean S.D. Mean S.D. Mean S.D.“Socio Economic Status (SES), standardized” 0.05 0.77 0.22 0.73 -0.35 0.74 1.09 0.44 -0.81 0.45White 0.61 0.49 1 0 0 0 0.76 0.43 0.38 0.49Black 0.13 0.34 0 0 1 0 0.05 0.22 0.23 0.42Hispanic 0.14 0.35 0 0 0 0 0.07 0.25 0.27 0.44Asian 0.06 0.24 0 0 0 0 0.07 0.26 0.05 0.21Native American 0.03 0.18 0 0 0 0 0.01 0.12 0.05 0.21Mixed Race 0.02 0.15 0 0 0 0 0.03 0.17 0.02 0.141st time K 0.85 0.36 0.87 0.34 0.82 0.39 0.9 0.3 0.84 0.37Age began Kindergarten 66.26 4.34 66.57 4.32 66.06 4.29 66.17 4.2 66.29 4.48Days Absent in Kindergarten 9.16 12.3 8.08 9.1 9.71 10.34 7.2 8.86 11.82 16.3Days Absent in First Grade 7.82 8.68 7.53 8.43 8.32 11.23 6.81 6.18 9.38 11.37Sample Size 10980 6652 1447 2736
Level 3Kindergarten Teacher Quality Mean S.D. Mean S.D. Mean S.D. Mean S.D. Mean S.D.Experience (standardized) 0.04 0.96 0.07 0.96 0.02 0.95 0.07 0.96 0.04 0.98New Teacher 0.1 0.31 0.1 0.3 0.11 0.31 0.1 0.3 0.12 0.32Less than BA 0.01 0.07 0.01 0.08 0 0.07 0.01 0.1 0 0.06BA 0.24 0.43 0.25 0.43 0.26 0.44 0.24 0.43 0.24 0.43More than BA 0.59 0.49 0.58 0.49 0.55 0.49 0.59 0.49 0.6 0.49High certification 0.57 0.49 0.58 0.49 0.54 0.5 0.58 0.49 0.57 0.49Regular certificationNo certification 0.01 0.12 0.02 0.13 0.01 0.12 0.03 0.16 0.01 0.11Emergency certification 0.07 0.25 0.06 0.24 0.07 0.25 0.06 0.24 0.07 0.26Alternative certification 0.01 0.12 0.01 0.08 0.01 0.09 0.01 0.11 0.01 0.12Professional development (?=.55) 0.01 0.61 0 0.61 0.02 0.61 0.01 0.61 0.01 0.62Number of math courses 0 0.96 0.02 0.97 -0.03 0.92 0.01 0.98 -0.01 0.94
Kindergarten InstructionFull-day K 0.6 0.46 0.58 0.47 0.69 0.44 0.57 0.47 0.61 0.46Minutes of math per day (10 min. increments) 18.12 10.68 17.47 10.67 18.6 10.85 17.22 10.21 18.71 10.7Basic Procedural (in days per month) 9.74 4.78 9.34 4.76 10.06 4.99 9.45 4.65 9.87 4.68Conceptual (in days per month) 5.78 4.33 5.66 4.36 6.28 4.6 5.79 4.32 5.65 4.22Advanced Procedural (in days per month) 4.57 3.13 4.54 3.14 4.79 3.3 4.6 3.09 4.45 3.05
Kindergarten Controls Mean S.D. Mean S.D. Mean S.D. Mean S.D. Mean S.D.% private 0.1 0.3 0.12 0.33 0.07 0.26 0.19 0.39 0.06 0.23% free lunch 30.68 24.37 25.22 20.27 39.4 27.36 22.45 19.26 37.08 25.76Class > 27 0.13 0.33 0.11 0.31 0.13 0.33 0.13 0.33 0.14 0.3410% or less LEP 0.74 0.42 0.8 0.38 0.78 0.4 0.81 0.37 0.7 0.44% min. in class 0.38 0.34 0.25 0.24 0.52 0.33 0.28 0.28 0.45 0.36% w/ Data on Kindergarten Teachers 0.93 0.25 0.93 0.26 0.92 0.27 0.94 0.23 0.94 0.25
Teaching Quality and the Achievement Gap 3037
TEACHER AND INSTRUCTION VARIABLES
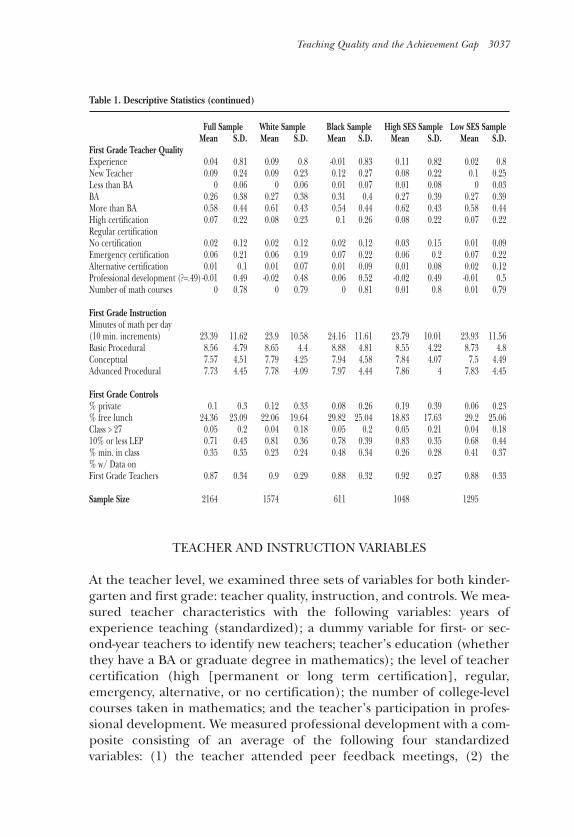
At the teacher level, we examined three sets of variables for both kinder-garten and first grade: teacher quality, instruction, and controls. We mea-sured teacher characteristics with the following variables: years ofexperience teaching (standardized); a dummy variable for first- or sec-ond-year teachers to identify new teachers; teacher’s education (whetherthey have a BA or graduate degree in mathematics); the level of teachercertification (high [permanent or long term certification], regular,emergency, alternative, or no certification); the number of college-levelcourses taken in mathematics; and the teacher’s participation in profes-sional development. We measured professional development with a com-posite consisting of an average of the following four standardizedvariables: (1) the teacher attended peer feedback meetings, (2) the
Table 1. Descriptive Statistics (continued)
Full Sample White Sample Black Sample High SES Sample Low SES SampleMean S.D. Mean S.D. Mean S.D. Mean S.D. Mean S.D.
First Grade Teacher QualityExperience 0.04 0.81 0.09 0.8 -0.01 0.83 0.11 0.82 0.02 0.8New Teacher 0.09 0.24 0.09 0.23 0.12 0.27 0.08 0.22 0.1 0.25Less than BA 0 0.06 0 0.06 0.01 0.07 0.01 0.08 0 0.03BA 0.26 0.38 0.27 0.38 0.31 0.4 0.27 0.39 0.27 0.39More than BA 0.58 0.44 0.61 0.43 0.54 0.44 0.62 0.43 0.58 0.44High certification 0.07 0.22 0.08 0.23 0.1 0.26 0.08 0.22 0.07 0.22Regular certificationNo certification 0.02 0.12 0.02 0.12 0.02 0.12 0.03 0.15 0.01 0.09Emergency certification 0.06 0.21 0.06 0.19 0.07 0.22 0.06 0.2 0.07 0.22Alternative certification 0.01 0.1 0.01 0.07 0.01 0.09 0.01 0.08 0.02 0.12Professional development (?=.49)-0.01 0.49 -0.02 0.48 0.06 0.52 -0.02 0.49 -0.01 0.5Number of math courses 0 0.78 0 0.79 0 0.81 0.01 0.8 0.01 0.79
First Grade InstructionMinutes of math per day (10 min. increments) 23.39 11.62 23.9 10.58 24.16 11.61 23.79 10.01 23.93 11.56Basic Procedural 8.56 4.79 8.65 4.4 8.88 4.81 8.55 4.22 8.73 4.8Conceptual 7.57 4.51 7.79 4.25 7.94 4.58 7.84 4.07 7.5 4.49Advanced Procedural 7.73 4.45 7.78 4.09 7.97 4.44 7.86 4 7.83 4.45
First Grade Controls% private 0.1 0.3 0.12 0.33 0.08 0.26 0.19 0.39 0.06 0.23% free lunch 24.36 23.09 22.06 19.64 29.82 25.04 18.83 17.63 29.2 25.06Class > 27 0.05 0.2 0.04 0.18 0.05 0.2 0.05 0.21 0.04 0.1810% or less LEP 0.71 0.43 0.81 0.36 0.78 0.39 0.83 0.35 0.68 0.44% min. in class 0.35 0.35 0.23 0.24 0.48 0.34 0.26 0.28 0.41 0.37% w/ Data on First Grade Teachers 0.87 0.34 0.9 0.29 0.88 0.32 0.92 0.27 0.88 0.33
Sample Size 2164 1574 611 1048 1295
3038 Teachers College Record
teacher attended or observed other schools, (3) the teacher attendedclasses and meetings to learn new skills, and (4) the teacher attendedprofessional development workshops during the current academic year.The Cronbach’s alpha for this professional development construct was.55 for kindergarten and .49 for first grade.
We measured exposure to instruction in several ways. For kindergart-ners, we used a dummy variable indicating full-day versus half-day kinder-garten. For both kindergarten and first grade, we used a measure of thenumber of minutes the teacher spent on math instruction per day (in 10-minute increments) and three measures of the days per month theteacher spent on basic procedural teaching, conceptual teaching, andadvanced procedural teaching.
To develop the three types of instruction, we used previous research (asreviewed earlier) to sort the ECLS items into categories of instruction.We then tested our conceptions using factor analysis and tested the finalcomposites using Cronbach’s alpha.
The basic procedural teaching measure consisted of the average of howmany days per month the students were taught the following math skills:telling time, adding single-digit numbers, subtracting single-digit num-bers, writing all numbers from 1 to 10, recognizing and naming geomet-ric shapes, and making, copying, or extending patterns. We also includeda question about the following math activity: How many days per monthdid the children in your class count out loud? The Cronbach’s alpha forthese variables was .74 for kindergarten teachers and .69 for first-gradeteachers.Conceptual teaching consisted of the average of the number of days per
month that students were taught the following skills: estimating quanti-ties, estimating probabilities, and writing math equations to solve wordproblems. We also included in this measure the following question aboutmath activities: How many days per month did the children in your classwork on math problems that reflect real life situations? The Cronbach’salpha for conceptual teaching was .65 for both kindergarten and firstgrade.
The advanced procedural teaching composite measured the extent towhich the teacher taught the following skills: place value, reading two-digit numbers, mixed operations, recognizing fractions, recognizing thevalue of coins and currency, counting by 2s, 5s, and 10s, counting beyond100, writing all the numbers between 1 and 100, reading three-digit num-bers, adding two-digit numbers, carrying numbers in addition, and sub-tracting two-digit numbers. The Cronbach’s alpha for the advancedprocedural teaching construct was .75 for kindergarten and .82 for firstgrade.
Teaching Quality and the Achievement Gap 3039
SCHOOL- AND CLASS VARIABLES
Last, we included controls indicating whether a student was in privateschool, the percent of students in the school who qualified for free lunch,the percentage of minorities in the classroom, a dummy variable forclasses with more than 27 students, a dummy variable for classes with lessthan 10% limited-English-proficiency (LEP)2 students, and a dummy vari-able for whether we had data for the kindergarten or first-grade teacher.(See Table 1 for the descriptive statistics for all the school and classroomvariables.) Variables describing conditions at the class level were assignedto the corresponding teachers and thus were categorized as teacher-levelvariables in our models.
We tested for collinearity at the teacher level and found that there wereno notable correlations between the teacher-level covariates for eitherfirst grade or kindergarten (see Appendix B).
METHODS
We estimated knowledge and learning rates using a multilevel growthmodel (Raudenbush & Bryk, 2002; Singer & Willett, 2003). In this model,we viewed tests (level 1) as nested within children, and children (level 2)as nested within schools (level 3).
This model allowed us to examine the distribution of teacher and teachingquality during the first year of kindergarten and to estimate the effects ofteacher quality, time spent on instruction, and type of instruction on the growth instudent achievement in kindergarten and first grade.
GROWTH MODEL
To estimate the growth curve, we used a three-level multilevel model inhierarchical linear modeling (HLM; see equations below). Level 1 con-sists of the IRT math score as the dependent variable. We modeled thegrowth in math achievement with three covariates of the days since thebeginning of kindergarten, designed to separate academic-year growthfrom summer gains or losses. The kindergarten slope (K) consists of thedays since the beginning of kindergarten for assessments between thebeginning and end of kindergarten and 9 months later. The summerslope (S) consists of assessment dates between 9 months and 12 monthssince the beginning of kindergarten. The first-grade (F) slope consists ofassessment dates 12 months after the beginning of kindergarten.
Our model extrapolates the scores that would have been obtained onthe last day of kindergarten and the first day of first grade. There might
3040 Teachers College Record
be a slight bias if learning speeds up or slows down at the beginning andend of the school year, though Downey et al. (2004) found that learningrates are approximately constant for much of the school year. Our modelmakes these extrapolations by using information about the date of eachtest relative to the first and last days of school.
Level 2 consists of student family background (SES), student race(RACE), student family background (SES), whether this was the first timethat a student entered kindergarten (First Time in K.) and student agefor the intercept. The slope for kindergarten includes race, family back-ground, whether the student was in a full-day kindergarten (Full day K.),and the number of days absent in kindergarten. The summer slope con-sists of race and family background. The slope for first grade includesrace, family background , and days absent in first grade.
Level 3 consists of a series of teacher quality, instruction, and controlvariables for both kindergarten and first grade. The kindergarten covari-ates at level 3 influence both the level 1 intercept and the growth ofkindergarten achievement. The first-grade covariates are modeled on thefirst-grade slope.
Level 1: Y= πo + π1 (K) + π2 (S) + π3 (F) + e Level 2: π0 = B00 + B01 (SES) + B02 (RACE) + B03 (First Time in K.)
+ B04 (AGE) + r0π1 = B10 + B11 (SES) + B12 (RACE)+ B13 (Days Absent in K.)+ B14 (Full day K.)π2 = B20 + B21 (SES) + B22 (RACE) π3 = B30 + B31 (SES) + B32 (RACE) + B33 (Days Absent inFirst Grade)
Level 3: B00 = �001 + �002(K. Teacher Quality)+ �003(K. Instruction) +�004(K. Controls)+ u00B01 = �01B02 = �02
B03 = �03B04 = �04B0 = �00 + �00 (K. Teacher Quality)+ �00 (K. Instruction) + �00(K. Controls)B10 = �11B12 = �12
B13 = �13B20 = �00B21 = �21B22 = �21
Teaching Quality and the Achievement Gap 3041
B30 = �00 �00 (F. Teacher Quality)+ �00 (F. Instruction) + �00(F. Controls) B31 = �10B32 = �20
B33 = �30
The equations above jointly model the sorting of students, teachers,and classroom achievement on initial achievement and the influences onthree learning rates: kindergarten, summer, and first grade. We esti-mated the equations using HLM for the full model and for the White,Black, high-SES, and low-SES subsamples (see Tables 2 and 3).
The intercept in this growth model (π0 and B00) can be interpreted asthe initial sorting of students of different abilities into schools and class-rooms. In other words, the covariates �001, �002, and �003 measured theselection effects of unmeasured characteristics that matched studentachievement with different types of kindergarten teaching and differenttypes of kindergarten teachers. For example, the positive and significanteffect of the private school covariate on the intercept could be inter-preted to indicate that more higher achieving students begin kinder-garten in private schools than in public schools. In contrast, the slopesfor kindergarten (π1 and B10) and first grade (π3 and B30) gave esti-mates of the effects of teaching and teacher characteristics on achieve-ment growth. For example, the private school covariate for the slope iseither negative or zero, meaning that private schools are not associatedwith an increase in achievement growth above the initial sorting of high-ability students into private schools.
This growth curve model has several advantages over ordinary regres-sions. In ordinary regressions, the estimated correlation between initialstatus and subsequent change is attenuated and negatively biasedbecause measurement error is confounded with true variation in initialstatus and change (Blomqvist, 1977; Thomson, 1924). Our multilevelgrowth model avoids this bias by separating school and student-level vari-ation from variation due to test-level measurement error.
MISSING VALUES
ECLS-K has a fair number of missing values. We assumed that values weremissing at random (Allison, 2001; Little & Rubin, 2002). We droppedcases with missing data on the date of assessment and where we were notable to impute an assessment date from other students in the sameschool. However, randomly missing test scores are not problematicbecause our longitudinal models did not require that all children be
3042 Teachers College Record
tested on all occasions (Raudenbush & Bryk, 2002; Singer & Willett,2003). As a result, we were able to keep cases that had at least one out ofthe four assessments. For the covariates at levels 2 and 3, we used meansubstitution for missing data and added a dummy variable (see AppendixA for the descriptive statistics for all the missing data dummies).3
Randomly missing predictors can produce bias and inefficiency. Weaddressed this potential problem by creating dummy variables for miss-ing data and doing mean substitution for missing values. This producedunbiased estimates but slightly inefficient standard errors. We could haveused a multiple imputation strategy (Allison, 2001; Rubin, 1987), whichin nonnested data has the advantage of producing unbiased and efficientestimates. However, we tested a series of smaller multilevel models ofachievement with the ECLS data and found almost identical coefficientsand standard errors with both mean imputation and multiple imputa-tion. Although multiple imputation has advantages for nonnested data,there is a great deal of uncertainty about how best to conduct multipleimputations with nested data. It is possible that imputation strategies canchange the covariance matrices between the different levels of imputeddata. The direction and magnitude of this bias is unknown. Because ofthis uncertainty, we used mean imputation instead.
Our analysis of the longitudinal data from the ECLS has several advan-tages over existing cross-sectional studies. First, our multiple measures ofachievement at the beginning and end of kindergarten allow us to esti-mate both the initial distribution of achievement and achievementgrowth in order to distinguish between the effects of initial student char-acteristics and the effects of schooling on achievement growth. In con-trast, cross-sectional studies suffer from an inability to distinguish theeffects of initial student traits and schooling effects. Second, the multiplemeasures of achievement allow us to parse out the confounding summerlearning effects. Third, the extensive covariates at both the kindergartenand first-grade levels allow us to account for the changing school andteacher traits that influence student achievement.
RESULTS
DIFFERENCES IN TEACHER QUALITY AND INSTRUCTION BY RACEAND SES (TABLE 1)
The descriptive statistics for the White versus Black sample and thehigh- versus low-SES sample show similarities in both teacher and teach-ing quality. The percentage of new teachers for all four subsamples isclose to 10% in kindergarten and first grade. The number of teachers
Teaching Quality and the Achievement Gap 3043
with emergency credentials is near 6%, and the number with alternativecredentials is near 1% for all four subgroups in kindergarten and firstgrade. The percentage of teachers with high (or advanced) certificationis nearly identical for all subgroups in both kindergarten and first grade.In addition, levels of professional development for all subgroups arealmost identical to the grand mean for professional development. Therealso are no statistically significant differences among the number of mathcourses, teacher education, and levels of teacher experience across sub-groups. Contrary to findings from other studies, it appears that forkindergartners and first graders in the ECLS, Black, White, well-off, andpoor students all have teachers with similar levels of experience, educa-tion, certification, professional development, and math coursework.
Though average levels of time spent on mathematics and emphasis onthe three different types of instruction differed by subgroup, none ofthese differences was statistically significant. Black students’ teachersreported spending slightly more time on math and on each of the threetypes of instruction compared with teachers of White students in bothkindergarten and first grade. Low-SES students have slightly higher levelsof minutes of instruction and days of basic instruction than high-SES stu-dents. In contrast, high-SES students have slightly higher levels of con-ceptual and algorithmic instruction. However, as we mentioned, none ofthese differences was statistically significant.
The large differences in subgroups are related to gaps in socioeco-nomic status between Black and White students and differential racialcomposition between high- and low-SES groups. In addition, the contex-tual controls of private schools, percent free lunch, and percent minorityin the class are statistically different for all groups. There are also statisti-cally significant differences in absenteeism for the subgroups.
Although there might not be much difference in the mean levels ofinstruction and teaching characteristics by subgroups, it is possible thatthere are notable differences in the effects of these characteristics in boththeir initial distribution across differential ability levels and on thegrowth in achievement. Next, we discuss the results concerning these twoissues.
INITIAL STUDENT ASSIGNMENT (TABLES 2 AND 3)
The main findings we want to highlight in Tables 2 and 3 are that beingnew to the teaching profession and all three of our teaching measureswere associated with the initial distribution of students across classrooms.Lower achieving kindergartners are more likely to have new teachers (b= -.64*), but none of the other teacher quality variables (certification, BA
3044 Teachers College Record
or higher in mathematics, professional development participation) is sig-nificantly related to initial achievement levels, except that teachers whohave taken more coursework in mathematics have students with lowerachievement (b = -.17*). We suspect that taking coursework is a proxy forlack of prior content knowledge, so this negative relationship is consis-tent with the idea that weaker teachers get assigned to weaker students.
Teachers who more often use advanced procedural instruction (algo-rithms) (b = .08**) and conceptual approaches to mathematics (b =.08**) are more likely to have higher achieving kindergartners in theirfall class. Teachers who favor more basic procedural approaches are morelikely to have lower achieving kindergartners (b = -.06*). The subgroupanalyses of Black, White, and high- and low-SES students show that theinitial allocation of students to teachers generally followed the same pat-terns (e.g., conceptual and advanced procedural instruction were associ-ated with higher initial achievement, and basic procedural instructionwas associated with initially lower achieving students), but for the mostpart, coefficients were not significant, probably due in part to sample sizelimitations. One exception was that for high-SES students (Table 3,Model 4), having a teacher who spent more time on math instruction wasassociated with initially higher levels of achievement (b = 1.19**).
ACHIEVEMENT GROWTH AND SUMMER EFFECTS (TABLES 2 AND 3)
Moving to our growth models, we ask how teacher and teaching qualityaffects kindergarten and first-grade achievement growth. We separatesummer growth from academic year growth to better isolate cognitivegrowth that occurs while the student is in school. Tables 2 and 3 show theextent to which teacher quality and instruction are related to studentachievement growth in both kindergarten and first grade.
TEACHER QUALITY
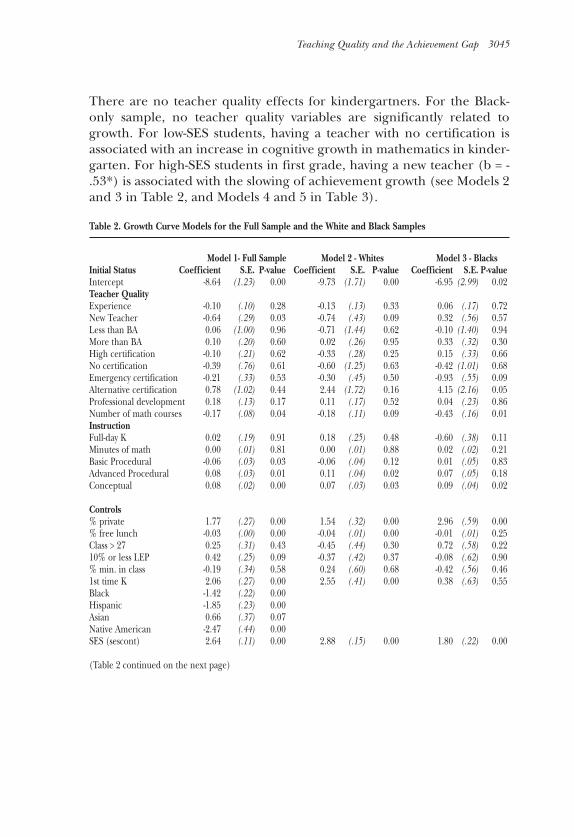
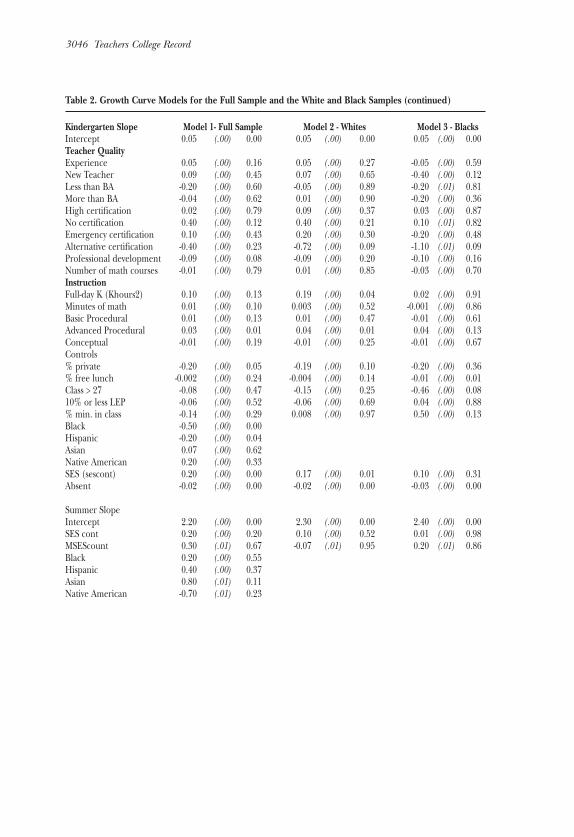
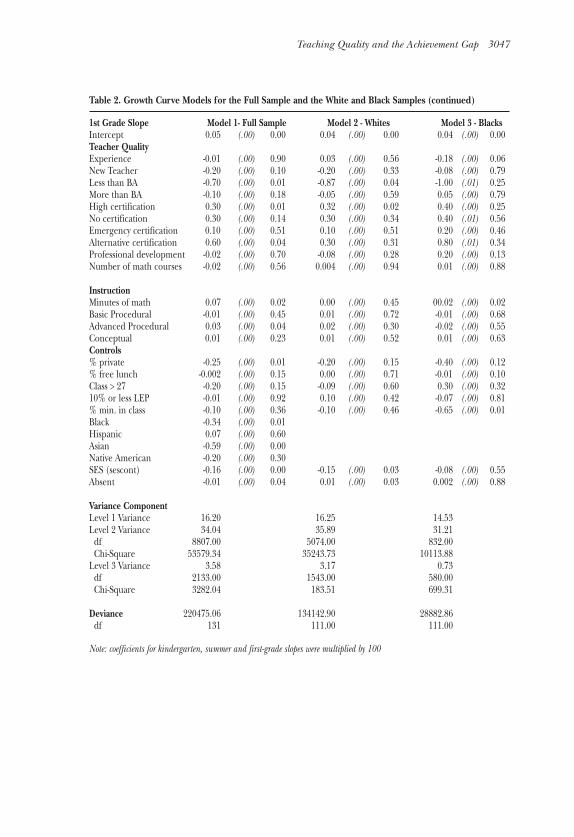
In the full sample, reported in Table 2, several teacher quality variablesare related to first-grade achievement growth, but none is associated withkindergarten growth. Specifically, first-grade achievement growth occursat a slower rate if students have a teacher with less than a bachelor’sdegree (b = -.70**) and at a faster rate if the teacher has high certification(b = .30**) or alternative certification (b = .60*).
Subgroup analyses reveal similar but not identical patterns.4 TheWhites-only sample is similar to the full sample—for first graders, havinga teacher with less than a BA in mathematics slows growth (b = -.87*), andhaving a teacher with high certification accelerates growth (b = .32*).
Teaching Quality and the Achievement Gap 3045
There are no teacher quality effects for kindergartners. For the Black-only sample, no teacher quality variables are significantly related togrowth. For low-SES students, having a teacher with no certification isassociated with an increase in cognitive growth in mathematics in kinder-garten. For high-SES students in first grade, having a new teacher (b = -.53*) is associated with the slowing of achievement growth (see Models 2and 3 in Table 2, and Models 4 and 5 in Table 3).
Table 2. Growth Curve Models for the Full Sample and the White and Black Samples
Model 1- Full Sample Model 2 - Whites Model 3 - BlacksInitial Status Coefficient S.E. P-value Coefficient S.E. P-value Coefficient S.E. P-valueIntercept -8.64 (1.23) 0.00 -9.73 (1.71) 0.00 -6.95 (2.99) 0.02Teacher QualityExperience -0.10 (.10) 0.28 -0.13 (.13) 0.33 0.06 (.17) 0.72New Teacher -0.64 (.29) 0.03 -0.74 (.43) 0.09 0.32 (.56) 0.57Less than BA 0.06 (1.00) 0.96 -0.71 (1.44) 0.62 -0.10 (1.40) 0.94More than BA 0.10 (.20) 0.60 0.02 (.26) 0.95 0.33 (.32) 0.30High certification -0.10 (.21) 0.62 -0.33 (.28) 0.25 0.15 (.33) 0.66No certification -0.39 (.76) 0.61 -0.60 (1.25) 0.63 -0.42 (1.01) 0.68Emergency certification -0.21 (.33) 0.53 -0.30 (.45) 0.50 -0.93 (.55) 0.09Alternative certification 0.78 (1.02) 0.44 2.44 (1.72) 0.16 4.15 (2.16) 0.05Professional development 0.18 (.13) 0.17 0.11 (.17) 0.52 0.04 (.23) 0.86Number of math courses -0.17 (.08) 0.04 -0.18 (.11) 0.09 -0.43 (.16) 0.01InstructionFull-day K 0.02 (.19) 0.91 0.18 (.25) 0.48 -0.60 (.38) 0.11Minutes of math 0.00 (.01) 0.81 0.00 (.01) 0.88 0.02 (.02) 0.21Basic Procedural -0.06 (.03) 0.03 -0.06 (.04) 0.12 0.01 (.05) 0.83Advanced Procedural 0.08 (.03) 0.01 0.11 (.04) 0.02 0.07 (.05) 0.18Conceptual 0.08 (.02) 0.00 0.07 (.03) 0.03 0.09 (.04) 0.02
Controls% private 1.77 (.27) 0.00 1.54 (.32) 0.00 2.96 (.59) 0.00% free lunch -0.03 (.00) 0.00 -0.04 (.01) 0.00 -0.01 (.01) 0.25Class > 27 0.25 (.31) 0.43 -0.45 (.44) 0.30 0.72 (.58) 0.2210% or less LEP 0.42 (.25) 0.09 -0.37 (.42) 0.37 -0.08 (.62) 0.90% min. in class -0.19 (.34) 0.58 0.24 (.60) 0.68 -0.42 (.56) 0.461st time K 2.06 (.27) 0.00 2.55 (.41) 0.00 0.38 (.63) 0.55Black -1.42 (.22) 0.00Hispanic -1.85 (.23) 0.00Asian 0.66 (.37) 0.07Native American -2.47 (.44) 0.00SES (sescont) 2.64 (.11) 0.00 2.88 (.15) 0.00 1.80 (.22) 0.00
(Table 2 continued on the next page)
3046 Teachers College Record
Table 2. Growth Curve Models for the Full Sample and the White and Black Samples (continued)
Kindergarten Slope Model 1- Full Sample Model 2 - Whites Model 3 - BlacksIntercept 0.05 (.00) 0.00 0.05 (.00) 0.00 0.05 (.00) 0.00Teacher QualityExperience 0.05 (.00) 0.16 0.05 (.00) 0.27 -0.05 (.00) 0.59New Teacher 0.09 (.00) 0.45 0.07 (.00) 0.65 -0.40 (.00) 0.12Less than BA -0.20 (.00) 0.60 -0.05 (.00) 0.89 -0.20 (.01) 0.81More than BA -0.04 (.00) 0.62 0.01 (.00) 0.90 -0.20 (.00) 0.36High certification 0.02 (.00) 0.79 0.09 (.00) 0.37 0.03 (.00) 0.87No certification 0.40 (.00) 0.12 0.40 (.00) 0.21 0.10 (.01) 0.82Emergency certification 0.10 (.00) 0.43 0.20 (.00) 0.30 -0.20 (.00) 0.48Alternative certification -0.40 (.00) 0.23 -0.72 (.00) 0.09 -1.10 (.01) 0.09Professional development -0.09 (.00) 0.08 -0.09 (.00) 0.20 -0.10 (.00) 0.16Number of math courses -0.01 (.00) 0.79 0.01 (.00) 0.85 -0.03 (.00) 0.70InstructionFull-day K (Khours2) 0.10 (.00) 0.13 0.19 (.00) 0.04 0.02 (.00) 0.91Minutes of math 0.01 (.00) 0.10 0.003 (.00) 0.52 -0.001 (.00) 0.86Basic Procedural 0.01 (.00) 0.13 0.01 (.00) 0.47 -0.01 (.00) 0.61Advanced Procedural 0.03 (.00) 0.01 0.04 (.00) 0.01 0.04 (.00) 0.13Conceptual -0.01 (.00) 0.19 -0.01 (.00) 0.25 -0.01 (.00) 0.67Controls% private -0.20 (.00) 0.05 -0.19 (.00) 0.10 -0.20 (.00) 0.36% free lunch -0.002 (.00) 0.24 -0.004 (.00) 0.14 -0.01 (.00) 0.01Class > 27 -0.08 (.00) 0.47 -0.15 (.00) 0.25 -0.46 (.00) 0.0810% or less LEP -0.06 (.00) 0.52 -0.06 (.00) 0.69 0.04 (.00) 0.88% min. in class -0.14 (.00) 0.29 0.008 (.00) 0.97 0.50 (.00) 0.13Black -0.50 (.00) 0.00Hispanic -0.20 (.00) 0.04Asian 0.07 (.00) 0.62Native American 0.20 (.00) 0.33SES (sescont) 0.20 (.00) 0.00 0.17 (.00) 0.01 0.10 (.00) 0.31Absent -0.02 (.00) 0.00 -0.02 (.00) 0.00 -0.03 (.00) 0.00
Summer SlopeIntercept 2.20 (.00) 0.00 2.30 (.00) 0.00 2.40 (.00) 0.00SES cont 0.20 (.00) 0.20 0.10 (.00) 0.52 0.01 (.00) 0.98MSEScount 0.30 (.01) 0.67 -0.07 (.01) 0.95 0.20 (.01) 0.86Black 0.20 (.00) 0.55Hispanic 0.40 (.00) 0.37Asian 0.80 (.01) 0.11Native American -0.70 (.01) 0.23
Teaching Quality and the Achievement Gap 3047
Note: coefficients for kindergarten, summer and first-grade slopes were multiplied by 100
Table 2. Growth Curve Models for the Full Sample and the White and Black Samples (continued)
1st Grade Slope Model 1- Full Sample Model 2 - Whites Model 3 - BlacksIntercept 0.05 (.00) 0.00 0.04 (.00) 0.00 0.04 (.00) 0.00Teacher QualityExperience -0.01 (.00) 0.90 0.03 (.00) 0.56 -0.18 (.00) 0.06New Teacher -0.20 (.00) 0.10 -0.20 (.00) 0.33 -0.08 (.00) 0.79Less than BA -0.70 (.00) 0.01 -0.87 (.00) 0.04 -1.00 (.01) 0.25More than BA -0.10 (.00) 0.18 -0.05 (.00) 0.59 0.05 (.00) 0.79High certification 0.30 (.00) 0.01 0.32 (.00) 0.02 0.40 (.00) 0.25No certification 0.30 (.00) 0.14 0.30 (.00) 0.34 0.40 (.01) 0.56Emergency certification 0.10 (.00) 0.51 0.10 (.00) 0.51 0.20 (.00) 0.46Alternative certification 0.60 (.00) 0.04 0.30 (.00) 0.31 0.80 (.01) 0.34Professional development -0.02 (.00) 0.70 -0.08 (.00) 0.28 0.20 (.00) 0.13Number of math courses -0.02 (.00) 0.56 0.004 (.00) 0.94 0.01 (.00) 0.88
InstructionMinutes of math 0.07 (.00) 0.02 0.00 (.00) 0.45 00.02 (.00) 0.02Basic Procedural -0.01 (.00) 0.45 0.01 (.00) 0.72 -0.01 (.00) 0.68Advanced Procedural 0.03 (.00) 0.04 0.02 (.00) 0.30 -0.02 (.00) 0.55Conceptual 0.01 (.00) 0.23 0.01 (.00) 0.52 0.01 (.00) 0.63Controls% private -0.25 (.00) 0.01 -0.20 (.00) 0.15 -0.40 (.00) 0.12% free lunch -0.002 (.00) 0.15 0.00 (.00) 0.71 -0.01 (.00) 0.10Class > 27 -0.20 (.00) 0.15 -0.09 (.00) 0.60 0.30 (.00) 0.3210% or less LEP -0.01 (.00) 0.92 0.10 (.00) 0.42 -0.07 (.00) 0.81% min. in class -0.10 (.00) 0.36 -0.10 (.00) 0.46 -0.65 (.00) 0.01Black -0.34 (.00) 0.01Hispanic 0.07 (.00) 0.60Asian -0.59 (.00) 0.00Native American -0.20 (.00) 0.30SES (sescont) -0.16 (.00) 0.00 -0.15 (.00) 0.03 -0.08 (.00) 0.55Absent -0.01 (.00) 0.04 0.01 (.00) 0.03 0.002 (.00) 0.88
Variance ComponentLevel 1 Variance 16.20 16.25 14.53Level 2 Variance 34.04 35.89 31.21df 8807.00 5074.00 832.00Chi-Square 53579.34 35243.73 10113.88
Level 3 Variance 3.58 3.17 0.73df 2133.00 1543.00 580.00Chi-Square 3282.04 183.51 699.31
Deviance 220475.06 134142.90 28882.86df 131 111.00 111.00
3048 Teachers College Record
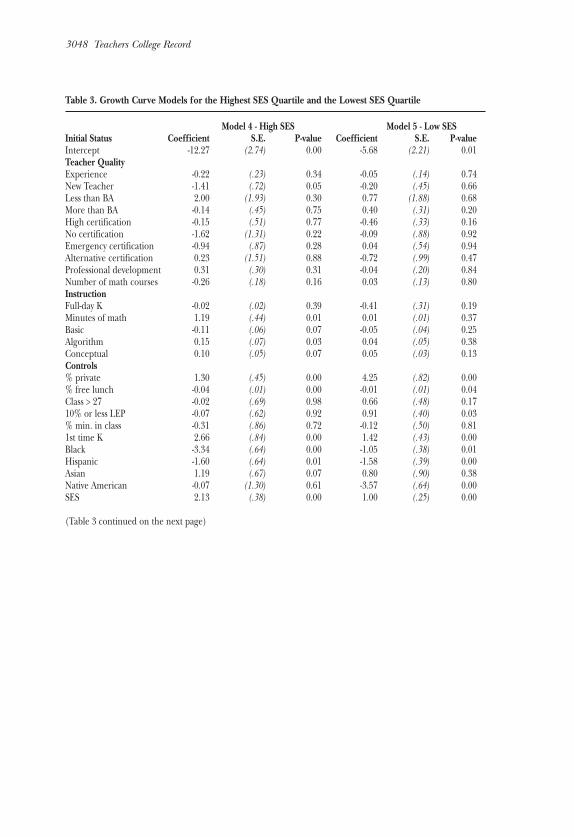
Table 3. Growth Curve Models for the Highest SES Quartile and the Lowest SES Quartile
Model 4 - High SES Model 5 - Low SESInitial Status Coefficient S.E. P-value Coefficient S.E. P-valueIntercept -12.27 (2.74) 0.00 -5.68 (2.21) 0.01Teacher QualityExperience -0.22 (.23) 0.34 -0.05 (.14) 0.74New Teacher -1.41 (.72) 0.05 -0.20 (.45) 0.66Less than BA 2.00 (1.93) 0.30 0.77 (1.88) 0.68More than BA -0.14 (.45) 0.75 0.40 (.31) 0.20High certification -0.15 (.51) 0.77 -0.46 (.33) 0.16No certification -1.62 (1.31) 0.22 -0.09 (.88) 0.92Emergency certification -0.94 (.87) 0.28 0.04 (.54) 0.94Alternative certification 0.23 (1.51) 0.88 -0.72 (.99) 0.47Professional development 0.31 (.30) 0.31 -0.04 (.20) 0.84Number of math courses -0.26 (.18) 0.16 0.03 (.13) 0.80InstructionFull-day K -0.02 (.02) 0.39 -0.41 (.31) 0.19Minutes of math 1.19 (.44) 0.01 0.01 (.01) 0.37Basic -0.11 (.06) 0.07 -0.05 (.04) 0.25Algorithm 0.15 (.07) 0.03 0.04 (.05) 0.38Conceptual 0.10 (.05) 0.07 0.05 (.03) 0.13Controls% private 1.30 (.45) 0.00 4.25 (.82) 0.00% free lunch -0.04 (.01) 0.00 -0.01 (.01) 0.04Class > 27 -0.02 (.69) 0.98 0.66 (.48) 0.1710% or less LEP -0.07 (.62) 0.92 0.91 (.40) 0.03% min. in class -0.31 (.86) 0.72 -0.12 (.50) 0.811st time K 2.66 (.84) 0.00 1.42 (.43) 0.00Black -3.34 (.64) 0.00 -1.05 (.38) 0.01Hispanic -1.60 (.64) 0.01 -1.58 (.39) 0.00Asian 1.19 (.67) 0.07 0.80 (.90) 0.38Native American -0.07 (1.30) 0.61 -3.57 (.64) 0.00SES 2.13 (.38) 0.00 1.00 (.25) 0.00
(Table 3 continued on the next page)
Teaching Quality and the Achievement Gap 3049
Table 3. Growth Curve Models for the Highest SES Quartile and the Lowest SES Quartile (continued)
Kindergarten Slope Model 4 - High SES Model 5 - Low SESCoefficient S.E. P-value Coefficient S.E. P-value
Intercept 0.05 (.01) 0.00 0.05 (.00) 0.00Teacher QualityExperience 0.10 (.00) 0.17 0.09 (.00) 0.10New Teacher 0.41 (.00) 0.06 0.06 (.00) 0.76Less than BA -0.30 (.00) 0.34 0.09 (.01) 0.93More than BA 0.03 (.00) 0.83 -0.10 (.00) 0.35High certification -0.02 (.00) 0.89 -0.03 (.00) 0.84No certification 0.61 (.00) 0.06 1.10 (.00) 0.01Emergency certification 0.06 (.00) 0.83 0.04 (.00) 0.87Alternative certification -0.72 (.00) 0.04 0.40 (.01) 0.44Professional development -0.10 (.00) 0.11 0.04 (.00) 0.65Number of math courses -0.01 (.00) 0.93 -0.02 (.00) 0.79InstructionFull-day K -0.10 (.00) 0.38 0.20 (.00) 0.13Minutes of math 0.01 (.00) 0.30 0.01 (.00) 0.30Basic Procedural 0.04 (.00) 0.03 0.02 (.00) 0.34Advanced Procedural 0.01 (.00) 0.49 0.04 (.00) 0.08Conceptual -0.04 (.00) 0.05 -0.01 (.00) 0.37Controls% private -0.30 (.00) 0.03 -0.62 (.00) 0.01% free lunch 0.003 (.00) 0.36 0.00 (.00) 0.05Class > 27 -0.30 (.00) 0.12 -0.10 (.00) 0.5010% or less LEP 0.30 (.00) 0.14 -0.55 (.00) 0.00% min. in class 0.20 (.00) 0.52 -0.38 (.00) 0.10Black -0.65 (.00) 0.02 -0.52 (.00) 0.00Hispanic -0.48 (.00) 0.08 -0.47 (.00) 0.01Asian 0.04 (.00) 0.87 0.30 (.00) 0.42Native American -0.60 (.01) 0.16 0.40 (.00) 0.19SES (sescont) 0.08 (.00) 0.60 0.02 (.00) 0.89Absent -0.002 (.00) 0.64 -0.02 (.00) 0.00
Summer SlopeIntercept 1.20 (.01) 0.12 2.00 (.01) 0.00SES cont 0.80 (.01) 0.17 0.40 (.01) 0.36MSEScountBlack 1.00 (.01) 0.27 0.40 (.01) 0.52Hispanic 1.80 (.01) 0.10 0.20 (.01) 0.68Asian -0.09 (.01) 0.92 0.70 (.01) 0.61Native American 0.20 (.02) 0.92 -0.60 (.01) 0.50
3050 Teachers College Record
Table 3. Growth Curve Models for the Highest SES Quartile and the Lowest SES Quartile (continued)
1st Grade Slope Model 4 - High SES Model 5 - Low SESCoefficient S.E. P-value Coefficient S.E. P-value
Intercept 0.05 (.00) 0.00 0.04 (.00) 0.00Teacher QualityExperience -0.10 (.00) 0.11 0.10 (.00) 0.13New Teacher -0.53 (.00) 0.02 -0.10 (.00) 0.68Less than BA 0.05 (.00) 0.90 1.60 (.01) 0.06More than BA -0.003 (.00) 0.99 -0.10 (.00) 0.47High certification 0.78 (.00) 0.00 0.20 (.00) 0.59No certification 0.30 (.00) 0.32 -0.20 (.01) 0.79Emergency certification 0.30 (.00) 0.21 -0.03 (.00) 0.89Alternative certification 0.30 (.00) 0.50 0.86 (.01) 0.06Professional development -0.03 (.00) 0.77 -0.09 (.00) 0.42Number of math courses -0.04 (.00) 0.52 -0.06 (.00) 0.38InstructionMinutes of math 0.003 (.00) 0.65 0.02 (.00) 0.01Basic Procedural -0.004 (.00) 0.84 -0.01 (.00) 0.63Advanced Procedural 0.0006 (.00) 0.98 0.02 (.00) 0.49Conceptual 0.02 (.00) 0.20 0.01 (.00) 0.45Controls% private -0.20 (.00) 0.22 -0.30 (.00) 0.26% free lunch 0.001 (.00) 0.77 0.00 (.00) 0.10Class > 27 -0.20 (.00) 0.19 -0.30 (.00) 0.2910% or less LEP -0.62 (.00) 0.00 0.20 (.00) 0.38% min. in class -0.40 (.00) 0.13 0.20 (.00) 0.43Black -0.40 (.00) 0.14 -0.41 (.00) 0.07Hispanic -0.20 (.00) 0.62 0.30 (.00) 0.14Asian -0.40 (.00) 0.13 -0.40 (.00) 0.34Native American -0.40 (.01) 0.45 -0.50 (.00) 0.13SES (sescont) -0.42 (.00) 0.02 -0.20 (.00) 0.17Absent -0.01 (.00) 0.14 -0.01 (.00) 0.23
Variance ComponentLevel 1 Variance 16.68 16.80Level 2 Variance 36.62 32.52df 1680.00 1494.00Chi-Square 14622.66 12968.97
Level 3 Variance 3.17 3.49df 1017.00 1264.00Chi-Square 1244.18 1631.78
Deviance 55808.75 55926.40df 127.00 127.00
Note: coefficients for kindergarten, summer and first-grade slopes were multiplied by 100
Teaching Quality and the Achievement Gap 3051
TEACHING QUALITY
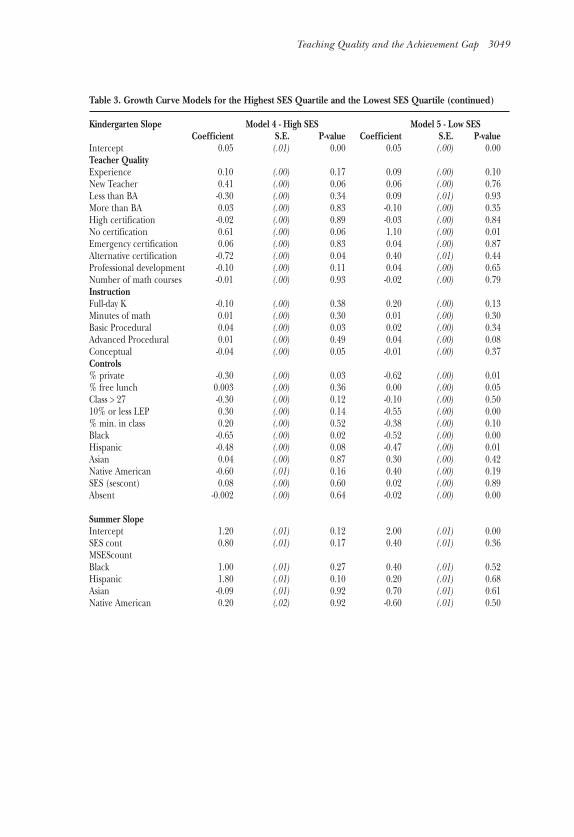
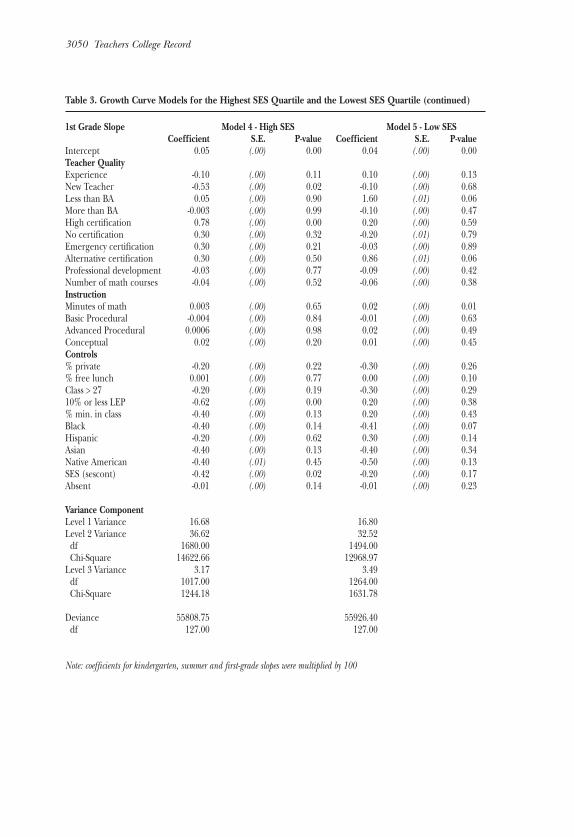
As we explained earlier, we used two categories of instruction: (1) timespent on instruction, proxied by whether a student attended full-daykindergarten and minutes spent on mathematics instruction, and (2)type of instruction, measured by a typology reflecting the research onalternative approaches to mathematics—basic or lower level procedural,advanced procedural, and conceptual. Time spent on instruction. Full-day kindergarten was not associated with
achievement growth in any of the models. Minutes spent on mathemat-ics instruction was associated with achievement growth for first graders inthe full sample (b = .07*), the Black-only sample (b = .02*), and the low-SES sample (b=.02**).Type of instruction. Advanced procedural instruction was associated with
achievement growth in kindergarten in the full sample (b = .03**) andthe White-only sample (b = .04**) (it was marginally significant at the p< .10 level for the low-SES sample, b =.04+). For first graders, advancedprocedural instruction was associated with mathematics achievementgrowth for the full sample (b = .03*) only. Basic procedural and concep-tual instruction were only significantly related to achievement growth forkindergartners in the high-SES sample. Here, basic instruction was asso-ciated with an acceleration of achievement growth (b = .04*), whereasconceptual instruction was associated with a decrease in achievementgrowth (b = -0.04*). Still, the overall trend of high-SES students havingfaster achievement growth still holds.
MAGNITUDE OF EFFECTS
Does teacher or teaching quality help close the achievement gap? Howmuch would it take to make a substantial contribution to narrowing thegap in the early grades? Here we translate one of our key findings—thattime spent on instruction is significantly related to achievement growthfor Black students and students from low-SES families—into the contextof the achievement gap.
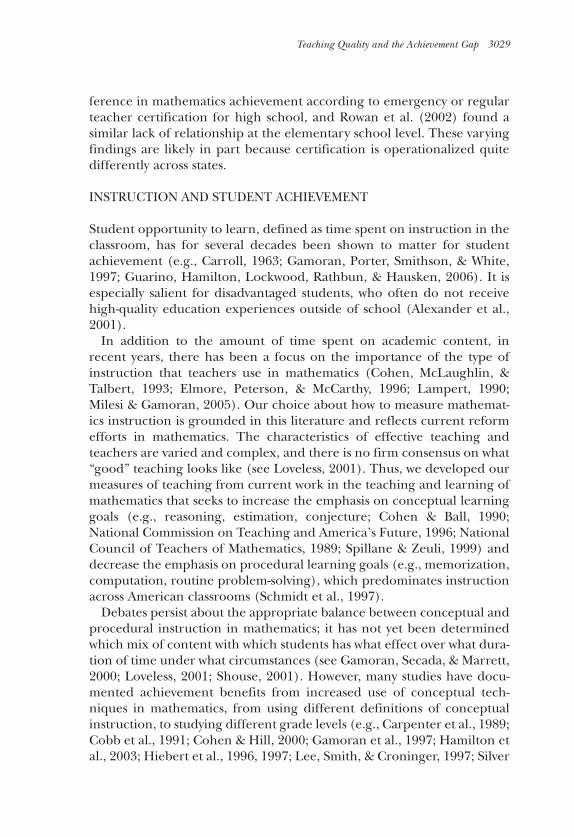
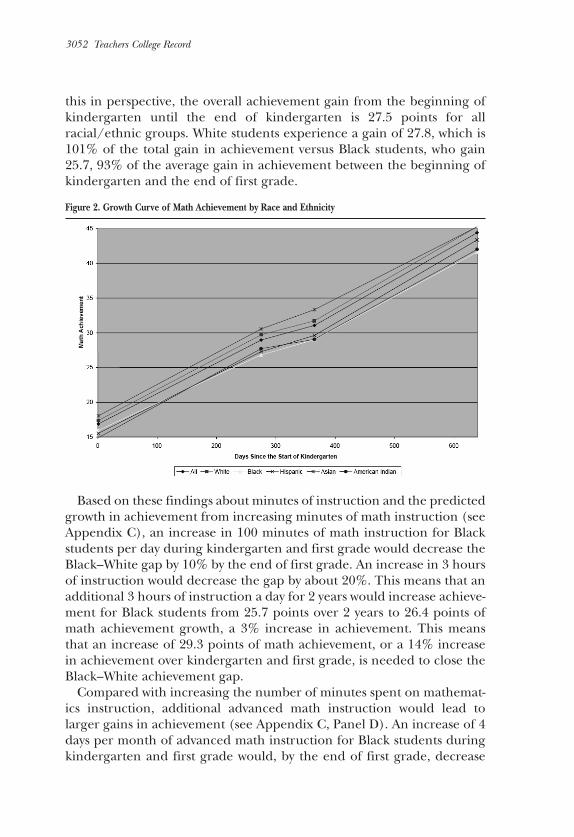
Figure 2 shows the achievement gap at five key time points measuredon the ECLS: the start of kindergarten, spring of kindergarten, the sum-mer before first grade, fall of first grade, and spring of first grade. TheBlack–White math achievement gap, controlling for teacher characteris-tics, instruction, and classroom differences, is 1.42 points at the begin-ning of kindergarten and increases by 104% to 2.9 at the end ofkindergarten. The gap at the beginning of first grade is 2.7 points, andby the end of first grade, the gap increases by 35%, to 3.64 points. To put
3052 Teachers College Record
this in perspective, the overall achievement gain from the beginning ofkindergarten until the end of kindergarten is 27.5 points for allracial/ethnic groups. White students experience a gain of 27.8, which is101% of the total gain in achievement versus Black students, who gain25.7, 93% of the average gain in achievement between the beginning ofkindergarten and the end of first grade.
Based on these findings about minutes of instruction and the predictedgrowth in achievement from increasing minutes of math instruction (seeAppendix C), an increase in 100 minutes of math instruction for Blackstudents per day during kindergarten and first grade would decrease theBlack–White gap by 10% by the end of first grade. An increase in 3 hoursof instruction would decrease the gap by about 20%. This means that anadditional 3 hours of instruction a day for 2 years would increase achieve-ment for Black students from 25.7 points over 2 years to 26.4 points ofmath achievement growth, a 3% increase in achievement. This meansthat an increase of 29.3 points of math achievement, or a 14% increasein achievement over kindergarten and first grade, is needed to close theBlack–White achievement gap.
Compared with increasing the number of minutes spent on mathemat-ics instruction, additional advanced math instruction would lead tolarger gains in achievement (see Appendix C, Panel D). An increase of 4days per month of advanced math instruction for Black students duringkindergarten and first grade would, by the end of first grade, decrease
Figure 2. Growth Curve of Math Achievement by Race and Ethnicity
Teaching Quality and the Achievement Gap 3053
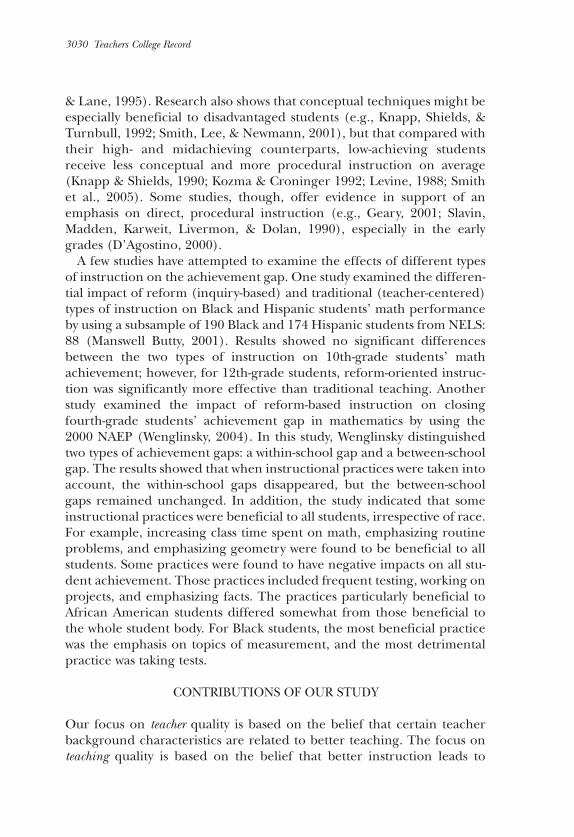
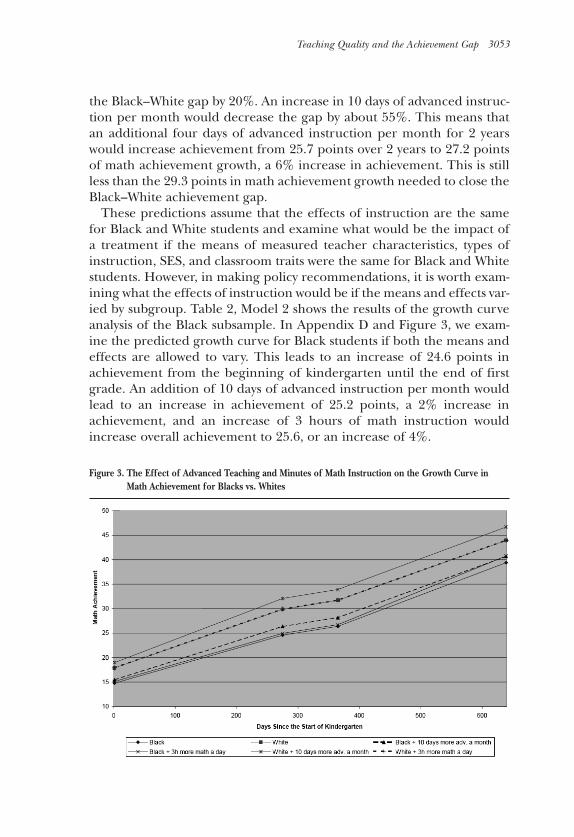
the Black–White gap by 20%. An increase in 10 days of advanced instruc-tion per month would decrease the gap by about 55%. This means thatan additional four days of advanced instruction per month for 2 yearswould increase achievement from 25.7 points over 2 years to 27.2 pointsof math achievement growth, a 6% increase in achievement. This is stillless than the 29.3 points in math achievement growth needed to close theBlack–White achievement gap.
These predictions assume that the effects of instruction are the samefor Black and White students and examine what would be the impact ofa treatment if the means of measured teacher characteristics, types ofinstruction, SES, and classroom traits were the same for Black and Whitestudents. However, in making policy recommendations, it is worth exam-ining what the effects of instruction would be if the means and effects var-ied by subgroup. Table 2, Model 2 shows the results of the growth curveanalysis of the Black subsample. In Appendix D and Figure 3, we exam-ine the predicted growth curve for Black students if both the means andeffects are allowed to vary. This leads to an increase of 24.6 points inachievement from the beginning of kindergarten until the end of firstgrade. An addition of 10 days of advanced instruction per month wouldlead to an increase in achievement of 25.2 points, a 2% increase inachievement, and an increase of 3 hours of math instruction wouldincrease overall achievement to 25.6, or an increase of 4%.
Figure 3. The Effect of Advanced Teaching and Minutes of Math Instruction on the Growth Curve inMath Achievement for Blacks vs. Whites
3054 Teachers College Record
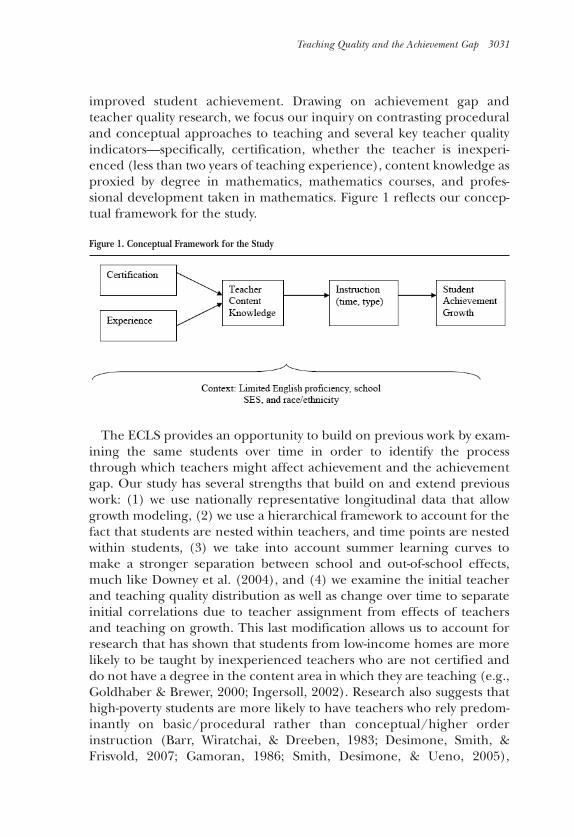
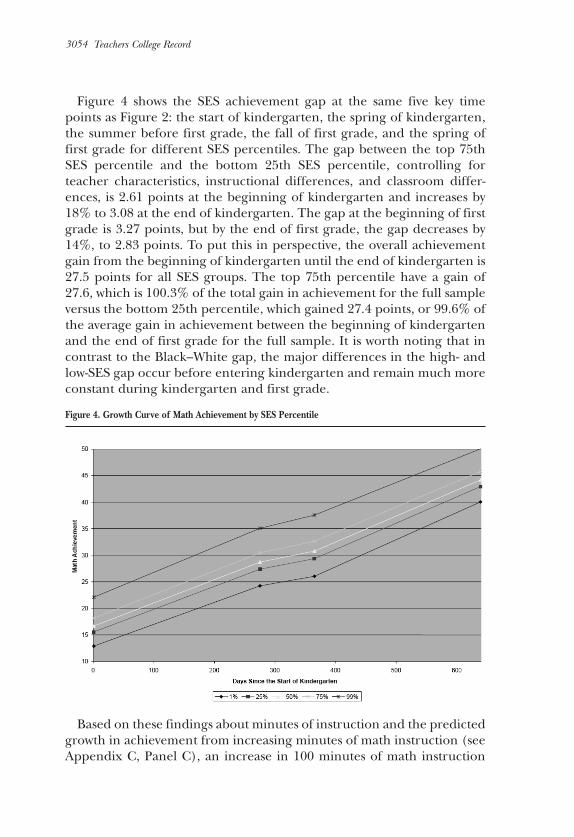
Figure 4 shows the SES achievement gap at the same five key timepoints as Figure 2: the start of kindergarten, the spring of kindergarten,the summer before first grade, the fall of first grade, and the spring offirst grade for different SES percentiles. The gap between the top 75thSES percentile and the bottom 25th SES percentile, controlling forteacher characteristics, instructional differences, and classroom differ-ences, is 2.61 points at the beginning of kindergarten and increases by18% to 3.08 at the end of kindergarten. The gap at the beginning of firstgrade is 3.27 points, but by the end of first grade, the gap decreases by14%, to 2.83 points. To put this in perspective, the overall achievementgain from the beginning of kindergarten until the end of kindergarten is27.5 points for all SES groups. The top 75th percentile have a gain of27.6, which is 100.3% of the total gain in achievement for the full sampleversus the bottom 25th percentile, which gained 27.4 points, or 99.6% ofthe average gain in achievement between the beginning of kindergartenand the end of first grade for the full sample. It is worth noting that incontrast to the Black–White gap, the major differences in the high- andlow-SES gap occur before entering kindergarten and remain much moreconstant during kindergarten and first grade.
Based on these findings about minutes of instruction and the predictedgrowth in achievement from increasing minutes of math instruction (seeAppendix C, Panel C), an increase in 100 minutes of math instruction
Figure 4. Growth Curve of Math Achievement by SES Percentile

Teaching Quality and the Achievement Gap 3055
per day for students in the 25th percentile during kindergarten and firstgrade would, by the end of first grade, decrease the 25th/75th percentileSES gap by 13%. An increase in 3 hours of instruction would decrease thegap by about 23%. This means that an additional 3 hours of instructiona day for 2 years would increase achievement from 27.4 points over 2years to 28.1 points of math achievement growth, a 2% increase inachievement.
Based on these findings, additional advanced math instruction wouldlead to larger gains in achievement than an increase in minutes of mathinstruction per day (see Appendix C, Panel D). An increase of 4 days ofadvanced math instruction per month for students in the 25th percentileduring kindergarten and first grade would, by the end of first grade,decrease the SES gap by 22%. An increase in 10 days of advanced instruc-tion per month would decrease the SES gap by about 55%. This meansthat an additional 10 days of advanced instruction per month for 2 yearswould increase achievement from 27.4 points over 2 years to 28.2 pointsof math achievement growth, a 3% increase in achievement.
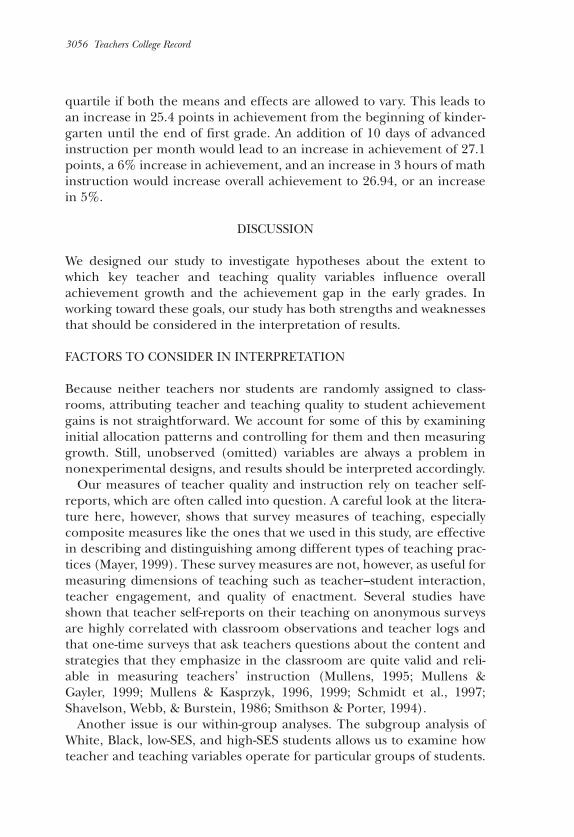
These predictions assume that the effects of instruction are the samefor high- and low-SES groups, and they examine treatment impact if themeans of teacher characteristics, types of instruction, SES, and classroomtraits are the same for all SES groups. Table 3, Model 5 shows the resultsof the growth curve analysis of the lowest SES quartile. In Appendix Dand Figure 5, we examine the predicted growth curve for the lowest SES
Figure 5. The Effect of Advanced Teaching and Minutes of Math Instruction on the Growth Curve inMath Achievement for the Highest and Lowest SES quartiles
3056 Teachers College Record
quartile if both the means and effects are allowed to vary. This leads toan increase in 25.4 points in achievement from the beginning of kinder-garten until the end of first grade. An addition of 10 days of advancedinstruction per month would lead to an increase in achievement of 27.1points, a 6% increase in achievement, and an increase in 3 hours of mathinstruction would increase overall achievement to 26.94, or an increasein 5%.
DISCUSSION
We designed our study to investigate hypotheses about the extent towhich key teacher and teaching quality variables influence overallachievement growth and the achievement gap in the early grades. Inworking toward these goals, our study has both strengths and weaknessesthat should be considered in the interpretation of results.
FACTORS TO CONSIDER IN INTERPRETATION
Because neither teachers nor students are randomly assigned to class-rooms, attributing teacher and teaching quality to student achievementgains is not straightforward. We account for some of this by examininginitial allocation patterns and controlling for them and then measuringgrowth. Still, unobserved (omitted) variables are always a problem innonexperimental designs, and results should be interpreted accordingly.
Our measures of teacher quality and instruction rely on teacher self-reports, which are often called into question. A careful look at the litera-ture here, however, shows that survey measures of teaching, especiallycomposite measures like the ones that we used in this study, are effectivein describing and distinguishing among different types of teaching prac-tices (Mayer, 1999). These survey measures are not, however, as useful formeasuring dimensions of teaching such as teacher–student interaction,teacher engagement, and quality of enactment. Several studies haveshown that teacher self-reports on their teaching on anonymous surveysare highly correlated with classroom observations and teacher logs andthat one-time surveys that ask teachers questions about the content andstrategies that they emphasize in the classroom are quite valid and reli-able in measuring teachers’ instruction (Mullens, 1995; Mullens &Gayler, 1999; Mullens & Kasprzyk, 1996, 1999; Schmidt et al., 1997;Shavelson, Webb, & Burstein, 1986; Smithson & Porter, 1994).
Another issue is our within-group analyses. The subgroup analysis ofWhite, Black, low-SES, and high-SES students allows us to examine howteacher and teaching variables operate for particular groups of students.
Teaching Quality and the Achievement Gap 3057
We are careful not to compare across groups, though, which wouldrequire mean tests of betas for each set of models. Our focus is address-ing the achievement gap, so within-group comparisons are useful.However, these analyses should not be used to compare findings acrossdifferent racial/ethnic or income groups.
The strengths of our study include our separation of summer growth tofocus on academic-year growth, which arguably has the most potential tobe influenced by teacher and teaching quality variables, though laggedeffects are, of course, possible. In addition, we focus on both teacher andteaching quality in a national longitudinal sample that allows measure-ment of growth, not just cross-sectional correlations or gains, as is morecommon.
RESEARCH QUESTION 1: WHAT IS THE DISTRIBUTION OF TEACHERAND TEACHING QUALITY DURING THE FIRST YEAR OFKINDERGARTEN?
We found evidence that lower achieving students are initially assigned tonew teachers and to teachers who use more basic procedural approachesto instruction; in contrast, higher achieving students are initially assignedto teachers who tend to use more advanced procedural (multistep algo-rithms, especially advanced for kindergartners) and conceptualapproaches to mathematics.
These findings occur in the context of a growth modeling analysis thatfound no effects on student growth of being a new teacher. The only con-sistent finding for type of instruction was that advanced proceduralapproaches were related to achievement growth. This suggests that theseaspects of teacher and teaching quality may operate as sorting variables,which may explain a part of the findings of past cross-sectional and gainstudies that would likely interpret correlations between teachers andteaching as part of the effect of instruction.
RESEARCH QUESTION 2: TO WHAT EXTENT DO TEACHER QUALITY,TIME SPENT ON INSTRUCTION, AND TYPE OF INSTRUCTIONPREDICT GROWTH IN STUDENT ACHIEVEMENT IN KINDERGARTENAND FIRST GRADE?
Teacher Quality. We did not find consistent or strong relationshipsbetween teacher quality and achievement growth in either kindergartenor first grade. These findings are generally consistent with Guarino etal.’s (2006) kindergarten ECLS study. Our mixed findings for certifica-tion are consistent with earlier studies (Darling-Hammond et al., 2001;
3058 Teachers College Record
Goldhaber & Brewer, 2000; Smith et al., 2005). Alternative certificationoverall had a positive effect on achievement growth but a negative effectfor high-SES students, and having a teacher with no certification was pos-itively related to growth for students with low SES. Keeping post-hocexplanations to a minimum, these findings might be due to the fact thatrequirements for certification and paths for alternative certification varyacross states and districts. For example, alternative certification in a high-need district might be a proxy for teachers with higher mathematics con-tent knowledge than the regular workforce, whereas in a wealthysuburban district, which on average has qualified, certified mathematicsteachers, alternative certification is more likely to be a proxy for havingless content knowledge than the average teacher. That is, alternative cer-tification may be bringing teachers with content-area expertise into high-need schools, which serves as an advantage for what we know is generallyan underqualified population of teachers, especially in mathematics(Ingersoll, 1999). We did find that high certification, where it was signif-icant, was always positive. High certification is measured here by the fol-lowing question: “What type of teaching certification do you have: Thehighest certification available (permanent or long term)?” This, too,might vary across states in its meaning.
Having a teacher without a bachelor’s degree in mathematics slowedgrowth in first grade mathematics but not in kindergarten. We expectedthat proxies for content knowledge, such as having a BA in mathematics,would affect achievement growth, and the results supported this hypoth-esis. It is unusual for teachers of the early grades to have a strong back-ground in mathematics (NCES, 2002a). Further, teachers of the earlygrades sometimes argue that basic knowledge of mathematics is enoughand question why deeper knowledge of mathematics is useful whenteaching basic addition and subtraction (Berger, Desimone, Herman,Garet, & Margolin, 2002; Miller, Herman, Garet, Desimone, & Zhang,2002). Previous research explains the dynamics of how a deeper under-standing of elementary math and how students learn mathematics can bea powerful mechanism to enable a teacher to better diagnose andrespond to student mistakes and shape activities that are productive for arange of learners (Ball, 1990; Ma, 1999). Here our findings show supportfor the idea that such content knowledge (at least our crude proxy) sup-ports growth over time in first graders. Previous work in kindergartenmay suggest why type of teaching would not be as influential; several stud-ies have shown that other areas are more crucial to early cognitive devel-opment, such as parent involvement in learning (Barnett & Escobar,1987; Booth & Dunn, 1996).
Other teacher quality measures in our analysis—professional develop-

Teaching Quality and the Achievement Gap 3059
ment in mathematics, courses taken in mathematics, and teacher’s yearsof experience—were, for the most part, not related to achievementgrowth. Absent a direct measure of teachers’ content and pedagogicalcontent knowledge (Hill, Schilling, & Ball, 2004), these can all be consid-ered proxies for teacher knowledge and skill. The extent to which anyone of them is related to achievement growth might be considered anindication of how close they are to measuring the knowledge and skillsrelated to effective teaching. We found that teacher certification and hav-ing a BA in mathematics were significant predictors, whereas the othermeasures were not. It should be noted that the more local measures,dependent on district context and offerings, such as experience and pro-fessional development, did not factor into growth, whereas more cali-brated measures, such as certification and having a degree, did so. Inaddition, the two measures of teacher quality that were significant repre-sent a combination or series of educational experiences (e.g., a BA inmathematics represents passing several courses in mathematics), whereasthe other measures represent piecemeal incremental experiences (e.g.,one math course, a certain number of hours in professional develop-ment). A different configuration of the incremental variables—for exam-ple, a measure of over 40 hours of professional development, or severalmathematics courses—may have made a difference. Previous researchsuggests that there is a threshold above which teacher learning experi-ences must go before they are effective in changing practice (Desimone,Porter, Garet, Yoon, & Birman, 2002; Garet, Porter, Desimone, Birman,& Yoon, 2001). Further, we had no measure of the quality of the profes-sional development that teachers experienced, which obviously limits itspredictive ability.Time spent teaching and type of instruction. There are opposing views con-
cerning the benefits to students of teachers’ relative emphasis on proce-dural and conceptual mathematics instruction (Loveless, 2001). Severalsmall-scale cross-sectional and longitudinal studies have shown positiveresults for conceptual approaches to mathematics (e.g., Carpenter et al.,1989; Newman & Associates, 1996). Based on these findings, we expectedstudents exposed to conceptual instruction to grow at a faster rate thanstudents exposed predominantly to basic procedural or advanced proce-dural instruction. We found that of the three types of instruction, theonly consistent finding across groups was that kindergarten and firstgrade students whose teachers emphasized advanced procedural instruc-tion, here measured by a focus on multistep addition and subtraction,grew at a more accelerated pace than their peers. Teachers were notasked how they taught multistep algorithms (e.g., what cognitive demandsthey used in their teaching, such as memorize or estimate), so this
3060 Teachers College Record
finding might be interpreted to mean that focusing on particular top-ics—here double-digit addition, subtraction, and division—fostered stu-dent achievement growth in mathematics. In the early grades, topiccoverage is especially important because many students are dependenton only one or two teachers to give them exposure to particular content.
More powerful than distinguishing between types of teaching, wefound that the number of minutes spent on mathematics instruction infirst grade was associated with achievement for traditionally disadvan-taged populations—Black and low-SES students. This is consistent withthe idea that disadvantaged students do not have the exposure to learn-ing opportunities at home, especially in mathematics, and so are moredependent on the school to provide these mathematics experiences.
Other studies have found stronger effects for different types of instruc-tion (e.g., Carpenter et al., 1989; see Loveless, 2001). Usually, however,these are smaller scale longitudinal studies that use curriculum-basedtests. It is not uncommon to find no effects on a standardized measure ofachievement, so it is noteworthy that we did find effects on sorting andfor advanced procedural and time spent on mathematics.
RESEARCH QUESTION 3: TO WHAT EXTENT DO TEACHER QUALITY,TIME SPENT ON INSTRUCTION, AND TYPE OF INSTRUCTIONNARROW THE ACHIEVEMENT GAP FOR BLACK STUDENTS ANDSTUDENTS FROM LOW-INCOME FAMILIES?
Our calculations show that it would take 100 minutes of increased mathinstruction per day to close the Black–White achievement gap by 10%,and 100 minutes to narrow the SES achievement gap between the 25thand the 75th percentiles by 13%. These findings are reminiscent of theopportunity-to-learn literature of several decades ago, which emphasizedthe importance of increasing exposure to academic content, not neces-sarily details about how the content was covered. These findings are sim-ilar to Guarino et al.’s (2006) ECLS kindergarten study, which found thatfull-day kindergarten and minutes spent on mathematics instructionmade more of a difference for student gains than did types of instruction.We did not find effects for full-day kindergarten, but this might bebecause the way we created our minutes spent on mathematics measurecaptures most of the “full day” variation.
CONCLUSION
Students spend considerably more time out of school than in school(Hofferth & Sandberg, 2001), and the achievement gaps exists before
Teaching Quality and the Achievement Gap 3061
children start school, so it is unlikely that it could be fully closed by theschools. However, school is often revered as the “great equalizer,” or atleast a social institution with the potential for an equalizing function, sotime and effort spent exploring how schools might address inequalitycontinues to be compelling. Here we examine particular aspects ofschooling that might explain the recent finding that schools do narrowthe achievement gap (Downey et al., 2004).
The findings here do not provide overwhelming support for a particu-lar type of mathematics instruction, but rather for what has been coined“opportunity to learn”—the time spent on mathematics content. Wefound weak or no effects for teacher quality and type of instruction,which lends support to the hypothesis that initial allocation of studentsto teachers explains at least some of the correlation between teacher andteaching quality found in cross-sectional and gains studies. With anational sample and a standardized test, though, we would not expectour analyses to be especially sensitive to distinctions in types of teaching.Our most powerful finding was that for low-income students and Blackstudents, minutes spent on instruction made a difference for achieve-ment growth in kindergarten and first grade, though these effects aresmall.
Here we are encouraged that something happening in the classroomcan make a difference for the achievement gap. Our intercept analysisshowed that low achievers tend to get worse teachers. This is an old prob-lem of the most disadvantaged students getting the weakest teachers. Iftime on instruction matters, and disadvantaged students are more likelyto get the weakest teachers who spend less time on instruction, then wecan identify an area where schooling may be exacerbating the achieve-ment gap but has the potential to ameliorate it.
Notes
1. The Asian, Hispanic, Native American, and mixed race subgroups were not largeenough to allow separate subgroup analysis.
2. To create the class-size dummy, we regressed dummies for class size from 15 to 35on achievement and found that a cutoff of 27 explained the most variance. Similarly, to cre-ate the LEP dummy variable, we regressed dummy variables for each decile of LEP, such as0%, 10%, and 20%– 100%, and found that the 10% cutoff explained the most variance.
3. In separate sets of analyses, we used multiple imputation and found that resultswere very close to mean imputation. For ease of interpretation, we present results for meanimputation here.
4. As explained in our Discussion section, though we use subgroup analyses, we do notcompare directly across models, which would require mean tests of betas for each set ofmodels.

3062 Teachers College Record
References
Alexander, K. L., Entwisle, D. R., & Olson, L. S. (2001). Schools, achievement, and inequal-ity: A seasonal perspective. Educational Evaluation and Policy Analysis, 25, 171–191.
Allison, P. D. (2001). Missing data. Thousand Oaks, CA: Sage.Ball, D. L. (1990). The mathematical understandings that prospective teachers bring to
teacher education. Elementary School Journal, 90, 449–466.Ballou, D. (1996). Do public schools hire the best applicants? Quarterly Journal of Economics,
111, 97–133.Barnett, W. S., & Escobar, C. M. (1987). The economics of early intervention: A review.
Review of Educational Research, 57, 387–414.Barr, R., Wiratchai, N., & Dreeben, R. (1983). How schools work. Chicago: University of
Chicago Press.Berger, A., Desimone, L., Herman, R., Garet, M., & Margolin, J. (2002). Content of state stan-
dards and the alignment of state assessments with state standards. Washington, DC: U.S.Department of Education.
Blomqvist, N. (1977). On the relation between change and initial value. Journal of theAmerican Statistical Association, 72, 746–749.
Booth, A., & Dunn, J. F. (Eds.). (1996). Family-school links: How do they affect educational out-comes? Mahwah, NJ: Erlbaum.
Bourdieu, P., & Passeron, J. (1977). Reproduction in education, society, and culture. BeverlyHills, CA: Sage.
Bowles, S., & Gintis, H. (1976). Schooling in capitalist America: Educational reform and contra-dictions of economic life. New York: Basic Books.
Braswell, J. S., Lutkus, A. D., Grigg, W. S., Santapau, S. L. Tay-Lim, B.S.-H., & Johnson, M.S. (2001). The nation’s report card: Mathematics 2000 (NCES 2001–517). Washington, DC:U.S. Department of Education, National Center for Education Statistics.
Carpenter, T. P., Fennema, E., Peterson, P. L., Chiang, C., & Loef, M. (1989). Using knowl-edge of children’s mathematics thinking in classroom teaching: An experimental study.American Educational Research Journal, 26, 499–531.
Carroll, J. (1963). A model of school learning. Teachers College Record, 64, 722–733.Cobb, P., Wood, T., Yackel, E., Nicholls, J., Grayson, W., Trigatti, B., et al.. (1991).
Assessment of a problem-centered second-grade mathematics project. Journal forResearch in Mathematics Education, 22, 3–29.
Cohen, D., & Ball, D. (1990). Policy and practice: An overview. Educational Evaluation andPolicy Analysis, 12, 347–353.
Cohen, D., & Hill, H. (2000). Learning policy: When state education reform works. New Haven,CT: Yale University Press.
Cohen, D. K., & Hill, H. C. (2001). Learning policy: When state education reform works. NewHaven, CT: Yale University Press.
Cohen, D., McLaughlin, M., & Talbert, J. (Eds.). (1993). Teaching for understanding:Challenges for policy and practice. San Francisco: Jossey-Bass.
Coleman, J. S., Campbell, E. Q., Hobson, C. F., McPartland, J. M., Mood, A. M., Weinfeld,F. D., et al. (1966). Equality of educational opportunity. Washington, DC: U.S. Office ofEducation, U.S. Government Printing Office.
Condron, D. J., & Roscigno, V. J. (2003). Disparities within: Unequal spending and achieve-ment in an urban school district. Sociology of Education, 76, 18–36.
Cooper, H., Nye, B., Charlton, K., Lindsay, J., & Greathouse, S. (1996). The effects of sum-mer vacation on achievement test scores: A narrative and meta-analytic review. Review ofEducational Research, 66, 227–268.
Teaching Quality and the Achievement Gap 3063
Cremin, L. A. (1951). The American common school: An historical conception. New York: Bureauof Publications, Teachers College, Columbia University.
D’Agostino, J. V. (2000). School effects on students’ longitudinal reading and math achieve-ments. School Effectiveness and School Improvement, 11, 197–235.
Darling-Hammond, L. (2000). Teacher quality and student achievement: A review of statepolicy evidence. Education Policy Analysis Archives, 8(1). Retrieved fromhttp://olam.ed.asu.edu/epaa/v8n1/
Darling-Hammond, L., Berry, B., & Thorenson, A. (2001). Does teacher certification mat-ter? Evaluating the evidence. Educational Evaluation and Policy Analysis, 23, 57–77.
Desimone, L., Porter, A. C., Garet, M., Yoon, K., & Birman, B. (2002). Effects of professionaldevelopment on teachers’ instruction: Results from a three-year study. EducationalEvaluation and Policy Analysis, 24, 81–112.
Desimone, L., Smith, T., & Frisvold, D. (2007). Is NCLB increasing teacher quality for stu-dents in poverty? In A. Gamoran (Ed.), Will standards-based reform in education help closethe poverty gap? (pp. 89–119). Washington, DC: Brookings Institution Press.
Desimone, L. M., Smith, T. S., Hayes, S., & Frisvold, D. (2005). Beyond accountability andaverage math scores: Relating multiple state education policy attributes to changes instudent achievement in procedural knowledge, conceptual understanding and problemsolving in mathematics. Educational Measurement: Issues and Practice, 24(4), 5–18.
Downey, D., von Hippel, P., & Broh, B. (2004). Are schools the great equalizer? Cognitiveinequality during the summer months and the school year. American Sociological Review,69, 613–635.
Ehrenberg, R. G., & Brewer, D. J. (1994). Do school and teacher characteristics matter?Evidence from High School and Beyond. Economics of Education Review, 13(1), 1–17.
Ehrenberg, R. G., & Brewer, D. J. (1995). Did teachers’ verbal ability and race matter in the1960s? Coleman revisited. Economics of Education Review, 14, 1–21.
Elmore, R. F., Peterson, P. L., & McCarthy, S. J. (1996). Restructuring in the classroom:Teaching, learning, and school organization. San Francisco: Jossey-Bass.
Ferguson, R. F. (1991). Paying for public education: New evidence on how and why moneymatters. Harvard Journal on Legislation, 28, 465–499.
Ferguson, R. F., & Ladd, H. F. (1996). How and why money matters: An analysis of Alabamaschools. In H. F. Ladd (Ed.), Holding schools accountable: Performance-based reform in educa-tion (pp. 265–298). Washington, DC: Brookings Institution.
Fetler, M. (1999, March). High school staff characteristics and mathematics test results.Education Policy Analysis Archives, 7(9). Retrieved from http://epaa.asu.edu/epaa/v7n9.html
Fryer, R. G., Jr., & Levitt, S. D. (2004). Understanding the Black–White test score gap in thefirst two years of school. Review of Economics and Statistics, 86, 447–464.
Gamoran, A. (1986). Instructional and institutional effects of ability groups. Sociology ofEducation, 59, 185–198.
Gamoran, A., & Mare, R. (1989). Secondary school tracking and educational inequality:Compensation, reinforcement or neutrality? American Journal of Sociology, 94, 1146–1183.
Gamoran, A., Porter, A. C., Smithson, J., & White, P. A. (1997). Upgrading high schoolmathematics instruction: Improving learning opportunities for low-achieving, low-income youth. Educational Evaluation and Policy Analysis, 19, 325–338.
Gamoran, A., Secada, W. G., & Marrett, C. B. (2000). The organizational context of teach-ing and learning: Changing theoretical perspectives. In M. T. Hallinan (Ed.), Handbookof the sociology of education (pp. 37–63). New York: Kluwer Academic.
Garet, M., Porter, A., Desimone, L., Birman, B., & Yoon, K. (2001). What makes professionaldevelopment effective? Analysis of a national sample of teachers. American EducationResearch Journal, 38, 915–945.
3064 Teachers College Record
Geary, D. C. (2001). A Darwinian perspective on mathematics and instruction. In T.Loveless (Ed.), The great curriculum debate: How should we teach reading and math? (pp.85–107). Washington, DC: Brookings Institution Press.
Greenwald, R., Hedges, L., & Laine, R. (1996). The effect of school resources on studentachievement. Review of Educational Research, 66, 361–396.
Goldhaber, D. D., & Brewer, D. J. (1997). Evaluating the effect of teacher degree level oneducational performance. In W. Fowler (Ed.), Developments in school finance 1996 (pp.197–210). NCES 97-535. U.S. Department of Education, National Center for EducationStatistics. Washington, DC: U.S. Government Printing Office.
Goldhaber, D. D., & Brewer, D. J. (2000). Does teacher certification matter? High schoolteacher certification status and student achievement. Educational Evaluation and PolicyAnalysis, 22, 129–145.
Guarino, C. M., Hamilton, L. S., Lockwood, J. R., Rathbun, A. H., & Hausken, E. G. (2006.)Teacher qualification, instructional practices, and reading and mathematics gains of kindergart-ners (Research and Development Report, NCES 2006-031). Washington, DC: U.S.Department of Education.
Hamilton, L. S., McCaffrey, D., Klein, S. P., Stecher, B. M., Robyn, A., & Bugliari, D. (2003).Teaching practices and student achievement: Studying classroom-based educationreforms. Educational Evaluation and Policy Analysis, 25, 1–29.
Hart, B. H., & Risley, T. R. (1995). Meaningful differences in the everyday experience of youngAmerican children. Baltimore: Paul H. Brookes.
Hawk, P. P., Coble, C. R., & Swanson, M. (1985). Certification: It does matter. Journal ofTeacher Education, 36, 13–15.
Hedges, L. V., & Nowell, A. (1998). Black-White test score convergence since 1965. In C.Jencks & M. Phillips (Eds.), The Black–White test score gap (pp. 149–181). Washington, DC:Brookings Institution Press.
Heyns, B. (1978). Summer learning and the effects of schooling. New York: Academic Press.Heyns, B. (1987). Schooling and cognitive development: Is there a season for learning?
Child Development, 58, 1151–1160.Hiebert, J., Carpenter, T. P., Fennema, E., Fuson, K., Human, P., Murray, H., et al. (1996).
Problem solving as a basis for reform in curriculum and instruction: The case of math-ematics. Educational Researcher, 25(4), 12–21.
Hiebert, J., Carpenter, T. P., Fennema, E., Fuson, K., Wearne, D., Murray, H., et al. (1997).Making sense: Teaching and learning mathematics with understanding. Portsmouth, NH:Heinemann.
Hill, H. C., Schilling, S. G., & Ball, D. L. (2004). Developing measures of teachers’ mathe-matics knowledge for teaching. Elementary School Journal, 105, 11–30.
Hofferth, S. L., & Sandberg, J. F. (2001). How American children use their time. Journal ofMarriage and Family, 62, 295–308.
Ingersoll, R. M. (1999). Teacher turnover, teacher shortages and the organization of schools. Seattle:University of Washington, Center for the Study of Teaching and Policy.
Ingersoll, R. (2002, January). Out of field teaching, educational inequality, and the organizationof schools: An exploratory analysis. Seattle: University of Washington, Center for Study ofTeaching and Policy.
Knapp, M. S., & Shields, P. M. (Eds.). (1990). Better schooling for children of poverty: Alternativesto conventional wisdom (Vol. 2). Washington DC: U.S. Department of Education, Office ofPlanning, Budget, and Evaluation.
Knapp, M. S., Shields, P. M., & Turnbull, B. J. (1992). Academic challenge for the children ofpoverty. Summary report. Washington, DC: U.S. Department of Education.
Teaching Quality and the Achievement Gap 3065
Kozma, R., & Croninger, R. (1992). Technology and the fate of at-risk students. Education and Urban Society, 24, 440–453.
Lampert, M. (1990). When the problem is not the question and the solution is not theanswer: Mathematical knowing and teaching. American Educational Research Journal, 27,29–63.
Lee, V. E., Smith, J. B., & Croninger, R. G. (1997). How high school organization influencesthe equitable distribution of learning in mathematics and science. Sociology of Education,70, 128–150.
Levine, M. (Ed.). (1988). Professional practice schools: Building a model (ED 313344).Washington, DC: American Federation of Teachers.
Little, R., & Rubin, D. (2002). Statistical analysis with missing data (2nd ed.). New York: Wiley.Loveless, T. (Ed.). (2001). The great curriculum debate: How should we teach reading and math?
Washington, DC: Brookings Institution Press.Lubienski, S. (2002). A closer look at Black–White mathematics gaps: Intersections of race
and SES in NAEP achievement and instructional practices data. Journal of NegroEducation, 71, 269–287.
Ma, L. (1999). Knowing and teaching elementary mathematics: Teachers’ understanding of funda-mental mathematics in China and the United States. Mahwah, NJ: Erlbaum.
Manswell Butty, J. (2001). Teacher instruction, student attitudes, and mathematics perfor-mance among 10th and 12th grade Black and Hispanic students. Journal of NegroEducation, 70(1/2), 19–37.
Mayer, D. P. (1999). Measuring instructional practice: Can policymakers trust survey data?Educational Evaluation and Policy Analysis, 21(1), 29–45.
Milesi, C., & Gamoran, A. (2005, April). Effect of class size and instruction on kindergartenachievement. Paper presented at the annual meeting of the American EducationalResearch Association, Montreal, Quebec, Canada.
Miller, L., Herman, R., Garet, M., Desimone, L., & Zhang, Y. (2002). State mathematics stan-dards: Policies, instructional supports, aligned instruction, and student achievement.Washington, DC: U.S. Department of Education.
Monk, D. H. (1994). Subject area preparation of secondary mathematics and science teach-ers and student achievement. Economics of Education Review, 13, 125–145.
Monk, D. H., & King, J. R. (1994). Multi-level teacher resource effects on pupil perfor-mance in secondary mathematics and science: The role of teacher subject matter prepa-ration. In R. Ehrenberg (Ed.), Contemporary policy issues: Choices and consequences ineducation (pp. 29–58). Ithaca, NY: ILR Press.
Mosteller, F., & Moynihan, D. P. (Eds.). (1972). On equality of educational opportunity. NewYork: Vintage Books.
Mullens, J. (1995). Classroom instructional processes: A review of existing measurement approachesand their applicability for the teacher follow-up survey (NCES 95-15). Washington, DC:National Center for Education Statistics.
Mullens, J. E., & Gayler, K. (1999). Measuring classroom instructional processes: Using survey andcase study field test results to improve item construction (NCES 1999-08). Washington, DC:National Center for Education Statistics.
Mullens, J., & Kasprzyk, D. (1996). Using qualitative methods to validate quantitative surveyinstruments. In 1996 Proceedings of the Section on Survey Research Methods (pp. 638–643).Alexandria, VA: American Statistical Association.
Mullens, J., & Kasprzyk, D. (1999). Validating item responses on self-report teacher surveys.Washington, DC: U.S. Department of Education.
Murnane, R. J., & Phillips, B. R. (1981). Learning by doing, vintage, and selection: Threepieces of the puzzle relating teaching experience and teaching performance. Economicsof Education Review, 1, 453–465.
3066 Teachers College Record
National Center for Education Statistics. (2000). Early Childhood Longitudinal Study—Kindergarten base year: Data files and electronic codebook. Washington DC: Author.
National Center for Education Statistics. (2002a). Schools and staffing survey: 1999–2000.Overview of the data for public, private, public charter, and Bureau of Indian Affairs elementaryand secondary schools (NCES 2002-213).Washington, DC: Author.
National Center for Education Statistics. (2002b). User’s manual for the ECLS-K LongitudinalKindergarten-First Grade Public-Use Data Files and Electronic Codebook. Washington, DC:Author.
National Commission on Teaching and America’s Future. (1996, September). What mattersmost: Teaching for America’s future. New York: Author.
National Council of Teachers of Mathematics. (1989). Curriculum and evaluation standardsfor school mathematics. Reston, VA: Author.
Newman, F., & Associates. (1996). Authentic achievement: Restructuring schools for intellectualquality. San Francisco: Jossey-Bass.
Oakes, J. (1985). Keeping track: How schools structure inequality. New Haven, CT: YaleUniversity Press.
Pellegrino, J. W., Baxter, G. P., & Glaser, R. (1999). Addressing the “two disciplines” prob-lem: Linking theories of cognition and learning with assessment and instructional prac-tice. Review of Research in Education, 24, 307–353.
Phillips, M., Crouse, J., & Ralph, J. (1998). Does the Black-White test score gap widen afterchildren enter school? In C. Jencks & M. Phillips (Eds.), The Black-White test score gap (pp.229–272). Washington, DC: Brookings Institution Press.
Porter, A. C. (2005). Prospects for school reform and closing the achievement gap. In C. A.Dwyer (Ed.), Measurement and research in the accountability era (pp. 59–95). Mahwah, NJ:Erlbaum.
Porter, A. C., Kirst, M. W., Osthoff, E. J., Smithson, J. L., & Schneider, S. A. (1993). Reformup close: An analysis of high school mathematics and science classrooms. Madison: University ofWisconsin–Madison.
Raudenbush, S. W., & Bryk, A. S. (2002). Hierarchical linear models (2nd ed.). ThousandOaks, CA: Sage.
Rock, D., & Pollack, J. (2002). Early childhood longitudinal study—kindergarten class of 1988–99(ECLS-K), psychometric report for kindergarten through 1st grade (NCES 2002-005). U.S.Department of Education, NCES. Washington, DC: U.S. Government Printing Office.
Rowan, B., Correnti, R., & Miller, R. (2002). What large-scale survey research tells us about teachereffects on student achievement: Insights from the Prospects study of elementary schools.Philadelphia: Consortium for Policy Research in Education.
Rubin, D. B. (1987). Multiple imputation for nonresponse in surveys. New York: Wiley.Schmidt, W. H., McKnight, C. C., Houang, R. T., Wang, H. C., Wiley, D. E., Cogan, L. S., et
al. (2001). Why schools matter: A cross-national comparison of curriculum and learning. SanFrancisco: Jossey-Bass.
Schmidt, W. H., McKnight, C. C., & Raizen, S. A. (1997). A splintered vision: An investigationof U.S. science and mathematics. Executive summary. Lansing: U.S. National Research Centerfor the Third International Mathematics and Science Study, Michigan State University.Retrieved from http://ustimss.msu.edu/splintrd.pdf
Shavelson, R. J., Webb, N. M., & Burstein, L. (1986). Measurement of teaching. In M.Wittrock (Ed.), Handbook of research on teaching (3rd ed., pp. 1–36). Washington, DC:American Educational Research Association.
Shouse, R. (2001). The impact of traditional and reform-style practices on student mathe-matics achievement. In T. Loveless (Ed.), The great curriculum debate: How should we teachreading and math? (pp. 108–133). Washington, DC: Brookings Institution Press.
Teaching Quality and the Achievement Gap 3067
Silver, E., & Lane, S., (1995). Can instructional reform in urban middle schools help stu-dents narrow the mathematics performance gap? Some evidence from the QUASARproject. Research in Middle Level Education Quarterly, 18(2), 49–70.
Singer, J. D., & Willet, J. B. (2003). Applied longitudinal data analysis: Modeling change and eventoccurrence. New York: Oxford University Press.
Slavin, R., Madden, N., Karweit, N., Livermon, B., & Dolan, L. (1990). Success for All: First-year outcomes of a comprehensive plan for reforming urban education. AmericanEducational Research Journal, 27, 255–278.
Smith, T., Desimone, L., & Ueno, K. (2005). “Highly qualified” to do what? The relation-ship between NCLB teacher quality mandates and the use of reform-oriented instruc-tion in middle school math. Educational Evaluation and Policy Analysis, 27, 75–109.
Smith, J., Lee, V., & Newmann, F. (2001). Instruction and achievement in Chicago elementaryschools. Improving Chicago’s Schools. Chicago: Consortium on Chicago School Research.
Smithson, J. L., & Porter, A. C. (1994). Measuring classroom practice: Lessons learned fromefforts to describe the enacted curriculum—the Reform Up Close study (CPREResearch Report Series No. 31). Madison: University of Wisconsin, Consortium forPolicy Research in Education.
Spillane, J., & Zeuli, J. (1999, Spring). Reform and teaching: Exploring patterns of practicein the context of national and state mathematics reforms. Educational Evaluation andPolicy Analysis, 21(1), 1–27.
Strauss, R., & Sawyer, E. (1986). Some new evidence on teacher and student competencies.Economics of Education Review, 5(1), 41–48.
Tate, W. (1997). Race-ethnicity, SES, gender, and language proficiency trends in mathemat-ics achievement: An update. Journal for Research in Mathematics Education, 28, 652–680.
Thomson, G. H. (1924). A formula to correct for the effect of errors of measurement onthe correlation of initial values with gains. Journal of Experimental Psychology, 7, 321–324.
Tourangeau, K., Nord, C., Lê, T., Pollack, J. M., & Atkins-Burnett, S. (2006). ECLS-K:Combined user’s manual for the ECLS-K fifth-grade data files and electronic codebooks.Washington, DC: U.S. Department of Education.
U.S. Department of Education. (2003). Digest of education statistics, 2002. Washington, DC:National Center for Education Statistics.
Wenglinsky, H. (2000). How teaching matters: Brining the classroom back into discussions of teacherquality. Princeton NJ: Educational Testing Service.
Wenglinsky, H. (2002). How schools matter: The link between teacher classroom practicesand student academic performance. Education Policy Analysis Archives, 10(12), 1–31.Retrieved from http://epaa.asu.edu/epaa/v10n12
Wenglinsky, H. (2004). Closing the racial achievement gap: The role of reforming instruc-tional practices. Education Policy Analysis Archives, 12(64). Retrieved fromhttp://epaa.asu.edu/epaa/v12n64/
Wiley, D., & Yoon, B. (1995). Teacher reports on opportunity to learn: Analyses of the 1993California Learning Assessment System. Educational Evaluation and Policy Analysis, 17,355–370.
Wright, S., Horn, S., & Sanders, W. (1997) Teachers and classroom context effects on stu-dent achievement: Implications for teacher evaluation. Journal of Personnel Evaluation inEducation, 11(1), 57–67.
Xue, Y., & Meisels, S. J. (2004). Early literacy instruction and learning in kindergarten:Evidence from the Early Childhood Longitudinal Study—kindergarten class of 1998–99.American Educational Research Journal, 41, 191–229.
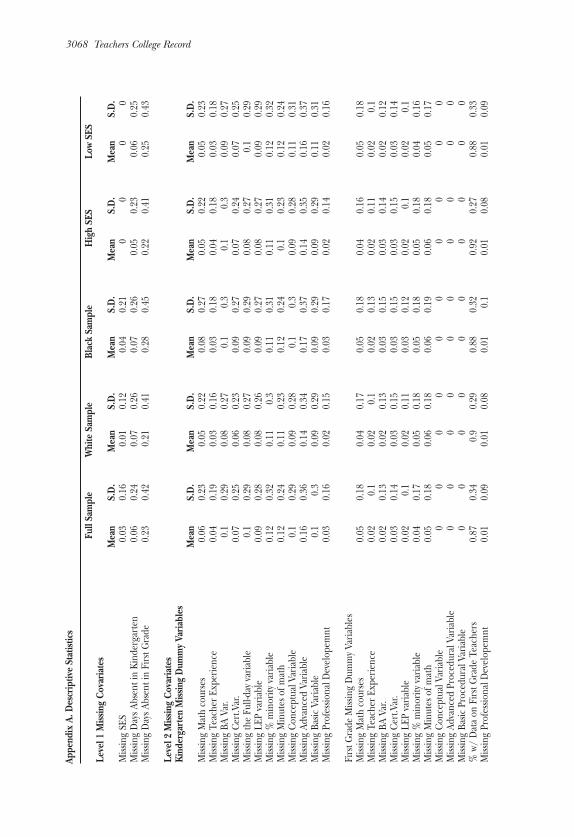
3068 Teachers College Record
Appe
ndix A. D
escriptiv
e Statistics
Full Sample
White Sam
ple
Black Sample
High SE
SLo
w SE
SLe
vel 1
Miss
ing Covariates
Mean
S.D.
Mean
S.D.
Mean
S.D.
Mean
S.D.
Mean
S.D.
Miss
ing SE
S0.03
0.16
0.01
0.12
0.04
0.21
00
00
Miss
ing Day
s Abs
ent i
n Ki
nder
garten
0.06
0.24
0.07
0.26
0.07
0.26
0.05
0.23
0.06
0.25
Miss
ing Day
s Abs
ent i
n First G
rade
0.23
0.42
0.21
0.41
0.28
0.45
0.22
0.41
0.25
0.43
Level 2
Miss
ing Covariates
Kind
ergarten
Miss
ing Dum
my Va
riables
Mean
S.D.
Mean
S.D.
Mean
S.D.
Mean
S.D.
Mean
S.D.
Miss
ing Math
cour
ses
0.06
0.23
0.05
0.22
0.08
0.27
0.05
0.22
0.05
0.23
Miss
ing Te
ache
r Exp
erienc
e0.04
0.19
0.03
0.16
0.03
0.18
0.04
0.18
0.03
0.18
Miss
ing BA
Var.
0.1
0.29
0.08
0.27
0.1
0.3
0.1
0.3
0.09
0.27
Miss
ing Ce
rt.Var.
0.07
0.25
0.06
0.23
0.09
0.27
0.07
0.24
0.07
0.25
Miss
ing th
e Fu
ll-da
y variable
0.1
0.29
0.08
0.27
0.09
0.29
0.08
0.27
0.1
0.29
Miss
ing LE
P va
riable
0.09
0.28
0.08
0.26
0.09
0.27
0.08
0.27
0.09
0.29
Miss
ing %
minor
ity va
riable
0.12
0.32
0.11
0.3
0.11
0.31
0.11
0.31
0.12
0.32
Miss
ing Minut
es of m
ath
0.12
0.24
0.11
0.23
0.12
0.24
0.1
0.23
0.12
0.24
Miss
ing Co
ncep
tual Variable
0.1
0.29
0.09
0.28
0.1
0.3
0.09
0.28
0.11
0.31
Miss
ing Ad
vanc
ed Variable
0.16
0.36
0.14
0.34
0.17
0.37
0.14
0.35
0.16
0.37
Miss
ing Ba
sic Variable
0.1
0.3
0.09
0.29
0.09
0.29
0.09
0.29
0.11
0.31
Miss
ing Pr
ofessio
nal D
evelop
emnt
0.03
0.16
0.02
0.15
0.03
0.17
0.02
0.14
0.02
0.16
First G
rade
Miss
ing Dum
my V
ariables
Miss
ing Math
cour
ses
0.05
0.18
0.04
0.17
0.05
0.18
0.04
0.16
0.05
0.18
Miss
ing Te
ache
r Exp
erienc
e0.02
0.1
0.02
0.1
0.02
0.13
0.02
0.11
0.02
0.1
Miss
ing BA
Var.
0.02
0.13
0.02
0.13
0.03
0.15
0.03
0.14
0.02
0.12
Miss
ing Ce
rt.Var.
0.03
0.14
0.03
0.15
0.03
0.15
0.03
0.15
0.03
0.14
Miss
ing LE
P va
riable
0.02
0.1
0.02
0.11
0.03
0.12
0.02
0.1
0.02
0.1
Miss
ing %
minor
ity va
riable
0.04
0.17
0.05
0.18
0.05
0.18
0.05
0.18
0.04
0.16
Miss
ing Minut
es of m
ath
0.05
0.18
0.06
0.18
0.06
0.19
0.06
0.18
0.05
0.17
Miss
ing Co
ncep
tual Variable
00
00
00
00
00
Miss
ing Ad
vanc
ed Pro
cedu
ral V
ariable
00
00
00
00
00
Miss
ing Ba
sic Pro
cedu
ral V
ariable
00
00
00
00
00
% w
/ Data on
Firs
t Grade
Tea
cher
s0.87
0.34
0.9
0.29
0.88
0.32
0.92
0.27
0.88
0.33
Miss
ing Pr
ofessio
nal D
evelop
emnt
0.01
0.09
0.01
0.08
0.01
0.1
0.01
0.08
0.01
0.09
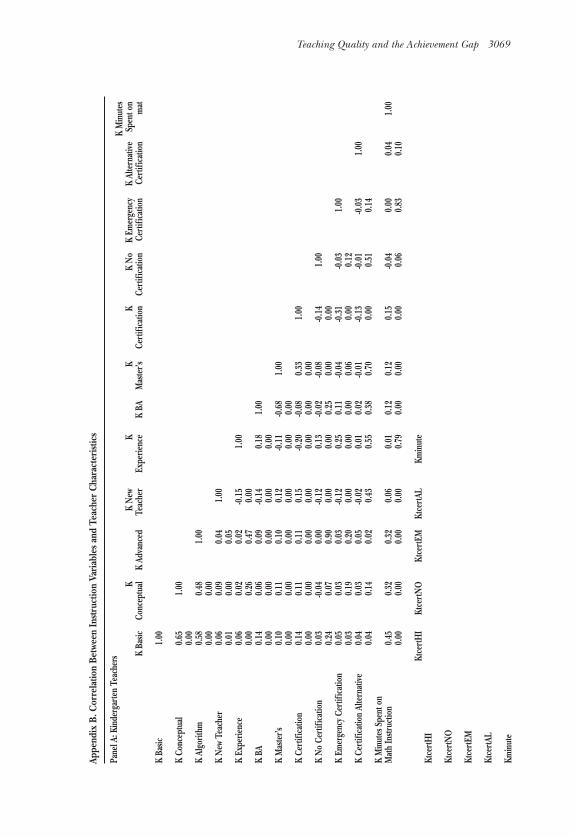
Teaching Quality and the Achievement Gap 3069
Appe
ndix B. C
orrelatio
n Be
tween Instruction Va
riables and
Teacher Characteristics
Pane
l A: K
inde
rgarten Te
ache
rsK Minutes
KK Ne
wK
KK
K No
K Em
ergency
K Alternative
Spen
t on
K Ba
sicCo
ncep
tual
K Ad
vanced
Teache
rEx
perie
nce
K BA
Master’s
Certific
ation
Certific
ation
Certific
ation
Certific
ation
mat
K Ba
sic1.00
K Co
ncep
tual
0.65
1.00
0.00
K Algo
rithm
0.58
0.48
1.00
0.00
0.00
K Ne
w Te
ache
r0.06
0.09
0.04
1.00
0.01
0.00
0.05
K Ex
perie
nce
0.06
0.02
0.02
-0.15
1.00
0.00
0.26
0.47
0.00
K BA
0.14
0.06
0.09
-0.14
0.18
1.00
0.00
0.00
0.00
0.00
0.00
K Master’s
0.10
0.11
0.10
0.12
-0.11
-0.68
1.00
0.00
0.00
0.00
0.00
0.00
0.00
K Ce
rtific
ation
0.14
0.11
0.11
0.15
-0.20
-0.08
0.33
1.00
0.00
0.00
0.00
0.00
0.00
0.00
0.00
K No
Certifica
tion
0.03
-0.04
0.00
-0.12
0.13
-0.02
-0.08
-0.14
1.00
0.24
0.07
0.90
0.00
0.00
0.25
0.00
0.00
K Em
ergency C
ertifica
tion
0.05
0.03
0.03
-0.12
0.25
0.11
-0.04
-0.31
-0.03
1.00
0.03
0.19
0.20
0.00
0.00
0.00
0.06
0.00
0.12
K Ce
rtific
ation Alternative
0.04
0.03
0.05
-0.02
0.01
0.02
-0.01
-0.13
-0.01
-0.03
1.00
0.04
0.14
0.02
0.43
0.55
0.38
0.70
0.00
0.51
0.14
K Minutes Spe
nt on
Math Instr
uctio
n0.45
0.32
0.32
0.06
0.01
0.12
0.12
0.15
-0.04
0.00
0.04
1.00
0.00
0.00
0.00
0.00
0.79
0.00
0.00
0.00
0.06
0.83
0.10
KtcertH
IKtcertN
OKtcertE
MKtcertA
LKm
inute
KtcertH
I
KtcertN
O
KtcertE
M
KtcertA
L
Kminute
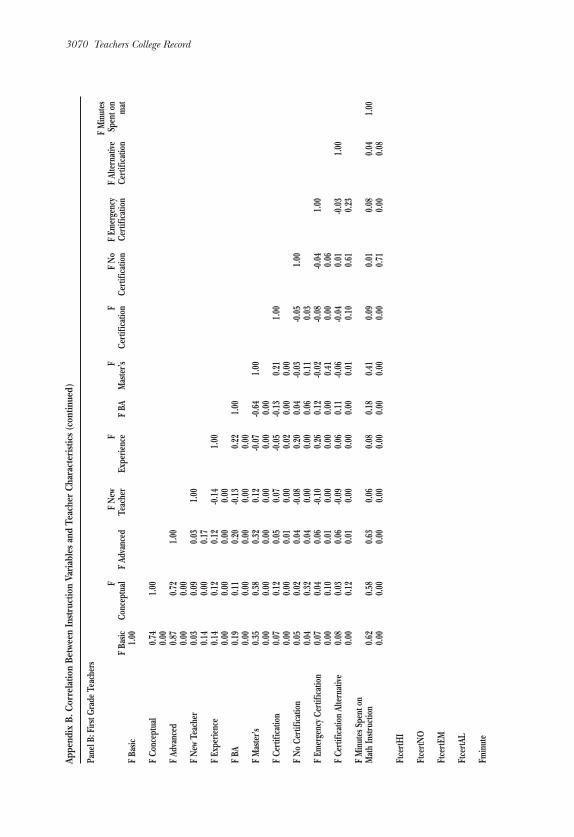
3070 Teachers College Record
Appe
ndix B. C
orrelatio
n Be
tween Instruction Va
riables and
Teacher Characteristics (
continue
d)
Pane
l B: F
irst G
rade
Teachers
F Minutes
FF Ne
wF
FF
F No
F Em
ergency
F Alternative
Spen
t on
F Ba
sicCo
ncep
tual
F Ad
vanced
Teache
rEx
perie
nce
F BA
Master’s
Certific
ation
Certific
ation
Certific
ation
Certific
ation
mat
F Ba
sic1.00
F Co
ncep
tual
0.74
1.00
0.00
F Ad
vanced
0.87
0.72
1.00
0.00
0.00
F Ne
w Te
ache
r0.03
0.09
0.03
1.00
0.14
0.00
0.17
F Ex
perie
nce
0.14
0.12
0.12
-0.14
1.00
0.00
0.00
0.00
0.00
F BA
0.19
0.11
0.20
-0.13
0.22
1.00
0.00
0.00
0.00
0.00
0.00
F Master’s
0.35
0.38
0.32
0.12
-0.07
-0.64
1.00
0.00
0.00
0.00
0.00
0.00
0.00
F Ce
rtific
ation
0.07
0.12
0.05
0.07
-0.05
-0.13
0.21
1.00
0.00
0.00
0.01
0.00
0.02
0.00
0.00
F No
Certifica
tion
0.05
0.02
0.04
-0.08
0.20
0.04
-0.03
-0.05
1.00
0.04
0.32
0.04
0.00
0.00
0.06
0.11
0.03
F Em
ergency C
ertifica
tion
0.07
0.04
0.06
-0.10
0.26
0.12
-0.02
-0.08
-0.04
1.00
0.00
0.10
0.01
0.00
0.00
0.00
0.41
0.00
0.06
F Ce
rtific
ation Alternative
0.08
0.03
0.06
-0.09
0.06
0.11
-0.06
-0.04
0.01
-0.03
1.00
0.00
0.12
0.01
0.00
0.00
0.00
0.01
0.10
0.61
0.23
F Minutes Spe
nt on
Math Instr
uctio
n0.62
0.58
0.63
0.06
0.08
0.18
0.41
0.09
0.01
0.08
0.04
1.00
0.00
0.00
0.00
0.00
0.00
0.00
0.00
0.00
0.71
0.00
0.08
FtcertH
I
FtcertN
O
FtcertE
M
FtcertA
L
Fminute
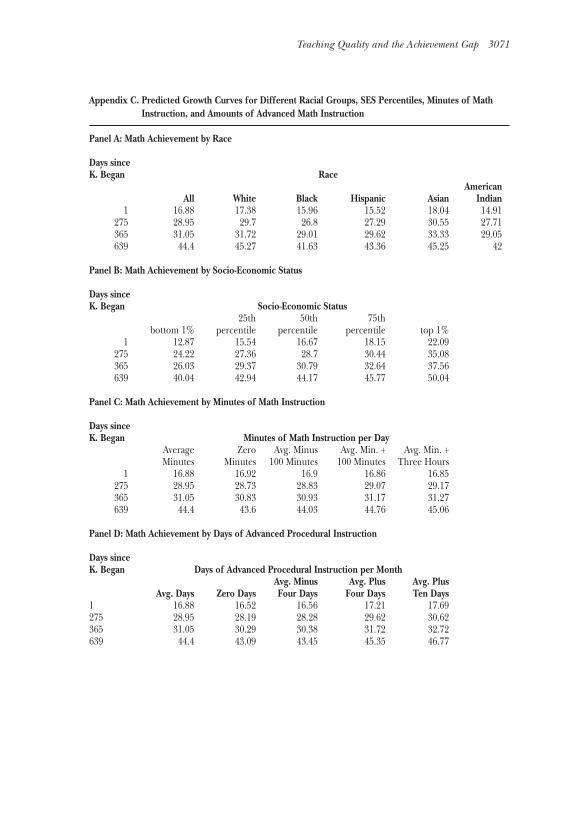
Teaching Quality and the Achievement Gap 3071
Appendix C. Predicted Growth Curves for Different Racial Groups, SES Percentiles, Minutes of MathInstruction, and Amounts of Advanced Math Instruction
Panel A: Math Achievement by Race
Days sinceK. Began Race
AmericanAll White Black Hispanic Asian Indian
1 16.88 17.38 15.96 15.52 18.04 14.91275 28.95 29.7 26.8 27.29 30.55 27.71365 31.05 31.72 29.01 29.62 33.33 29.05639 44.4 45.27 41.63 43.36 45.25 42
Panel B: Math Achievement by Socio-Economic Status
Days sinceK. Began Socio-Economic Status
25th 50th 75thbottom 1% percentile percentile percentile top 1%
1 12.87 15.54 16.67 18.15 22.09275 24.22 27.36 28.7 30.44 35.08365 26.03 29.37 30.79 32.64 37.56639 40.04 42.94 44.17 45.77 50.04
Panel C: Math Achievement by Minutes of Math Instruction
Days sinceK. Began Minutes of Math Instruction per Day
Average Zero Avg. Minus Avg. Min. + Avg. Min. +Minutes Minutes 100 Minutes 100 Minutes Three Hours
1 16.88 16.92 16.9 16.86 16.85275 28.95 28.73 28.83 29.07 29.17365 31.05 30.83 30.93 31.17 31.27639 44.4 43.6 44.03 44.76 45.06
Panel D: Math Achievement by Days of Advanced Procedural Instruction
Days sinceK. Began Days of Advanced Procedural Instruction per Month
Avg. Minus Avg. Plus Avg. PlusAvg. Days Zero Days Four Days Four Days Ten Days
1 16.88 16.52 16.56 17.21 17.69275 28.95 28.19 28.28 29.62 30.62365 31.05 30.29 30.38 31.72 32.72639 44.4 43.09 43.45 45.35 46.77
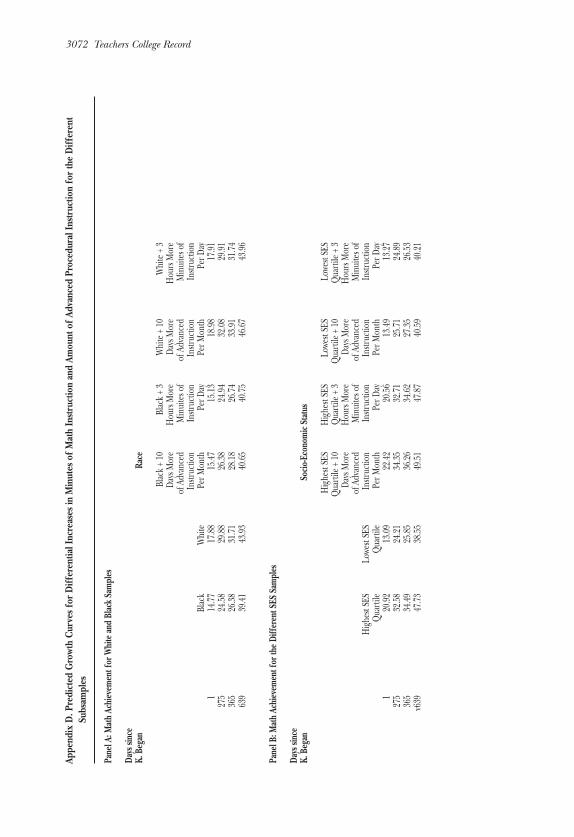
3072 Teachers College Record
Appe
ndix D. P
redicted
Growth Curves f
or Diff
eren
tial Increases in
Minutes of M
ath Instruction and Am
ount of A
dvanced Proced
ural In
struction for the
Diff
eren
tSu
bsam
ples
Pane
l A: M
ath Ac
hievem
ent for W
hite an
d Black Samples
Days since
K. Began
Race
Blac
k + 10
Blac
k + 3
White + 10
White + 3
Days
Mor
eHou
rs Mor
eDa
ys Mor
eHou
rs Mor
eof A
dvan
ced
Minuites o
f of A
dvan
ced
Minuites o
f In
struc
tion
Instr
uctio
n In
struc
tion
Instr
uctio
n Bl
ack
White
Per M
onth
Per D
ayPe
r Mon
thPe
r Day
114
.7717
.8815
.4715
.1318
.9817
.9127
524
.5829
.8826
.3824
.9432
.0829
.9136
526
.3831
.7128
.1826
.7433
.9131
.7463
939
.4143
.9340
.6540
.7546
.6743
.96
Pane
l B: M
ath Ac
hievem
ent for th
e Diffe
rent SES
Sam
ples
Days since
K. Began
Socio
-Econo
mic Status
High
est S
ESHigh
est S
ESLo
west
SES
Lowe
st SE
SQu
artile +
10
Quar
tile +
3Qu
artile +
10
Quar
tile +
3Da
ys Mor
eHou
rs Mor
eDa
ys Mor
eHou
rs Mor
eof A
dvan
ced
Minuites o
f of A
dvan
ced
Minuites o
f High
est S
ESLo
west
SES
Instr
uctio
n In
struc
tion
Instr
uctio
n In
struc
tion
Quar
tile
Quar
tile
Per M
onth
Per D
ayPe
r Mon
thPe
r Day
120
.9213
.0922
.4220
.5613
.4913
.2727
532
.5824
.2134
.3532
.7125
.7124
.8936
534
.4925
.8536
.2634
.6227
.3526
.53v6
3947
.7338
.5549
.5147
.8740
.5940
.21
Teaching Quality and the Achievement Gap 3073
LAURA M. DESIMONE is associate professor, Graduate School ofEducation, University of Pennsylvania. Her research focuses on theeffects of policies on teaching and learning, policy implementation, andimproving surveys for use in policy research. She studies teacher’s profes-sional development, induction and mentoring, accountability, andteacher quality issues. Recent publications include: Desimone, L., Smith,T., & Frisvold, D. (in press). How similar are student and teacher reportsof classroom instruction? Educational Policy; and Desimone, L. (in press).How can we best measure teacher’s professional development and itseffects on teachers and students? Educational Researcher.
DANIEL LONG is assistant professor of sociology at Wesleyan University.His research focuses on sociology of education and social stratification.He has researched trends in educational attainment among differentracial ethnic/groups in the United States; researched how school andteacher characteristics influence the growth of student achievement inelementary school; and examined international achievement tests to esti-mate the effects of private schools and school resources. His recent pub-lications include “Equality of Educational Opportunity: A 40-YearRetrospective” with Adam Gamoran; and “Whither the Virtuous Cycle:Past and Future Trends in Black–White Inequality in EducationalAttainment” with Adam Gamoran and Sean Kelly.