teacher guide: is there life outside of...
TRANSCRIPT

!
Overview
Teacher Guide: Is there life outside of Earth? There are individual teacher guides for each of the three activities in the first draft of the space investigation. Each teacher guide has student learning goals, suggestions for classroom discussion questions, model highlights, and answers to embedded assessments. Revision 3; July 29, 2011
!
Is there life outside of Earth? Activity 1: The Vastness of Space
Overview This first activity sets the stage for the rest of the investigation. Students are introduced to the unanswered question about the possibility of life outside of Earth. Students will watch a video from NOVA scienceNOW (“The Hunt for Alien Earths”) that introduces the two basic methods of planet hunting that students will explore further in the second and third activities. Students are asked to reflect on the immense scale of the universe and the basic requirements for life. Finally, they are asked to speculate on the likelihood of finding planets or moons that can support life. Learning Objectives Students will be able to
• engage with the “unknown question” guiding the unit. • make claims about the data and determine their own level of certainty with regard
to their claims. • explain how scientists use light from distant stars to find planets. • describe the factors that scientists look for to determine if life could be possible
on distant planets. Lesson Plan
1. Estimated Time This activity should take approximately 45 minutes.
2. Introduce the Activity In this activity, your students will explore the question “Is there life outside of Earth?” The video clip from NOVA scienceNOW introduces the complexity and the methods for finding planets in a vast universe. You might want to project this video (it runs approximately 10 minutes) to the whole class and then engage in a discussion.
3. Discuss the Activity
Possible discussion questions:
Search for life in a vast universe
• What is the probability of finding a habitable planet or moon? • What makes for a habitable planet? • What are the requirements for life? • What are the different ways scientists are searching for planets? • Why do scientists have to use indirect measurements to find planets?
Why can’t they detect planets directly? • How does the “walking a dog” analogy from the video apply to finding
planets?
4. Answers to Questions !Section 1: A lot of stars… Page 1: Are We Alone? Q. How do planet hunters use light from distant stars to find planets? Give two examples from the video. A. Planet hunters use the light from distant stars in two different ways: 1) they can look at the movement of the light towards and away from Earth to find a wobble in the star’s orbit and 2) they can look for dimming of the light from the star. Q. Why is finding other planets difficult? A. It is impossible to see the planets directly because they don’t give off light, so scientists have to rely on indirect evidence to find planets. Q. Scientists are looking for Earth-like planets. Not every planet is friendly to life as we know it. According to the video, what makes a planet suitable for life? A. The planet needs to have liquid water, so the planet needs to be close enough to its star to be warmed (not an ice-ball), but not too close so as to have its water evaporated off. It needs to be a “Goldilocks” planet. Page 2: The Vastness of Space Q. Do you think that it is probable that scientists will find a habitable planet in your lifetime? A. Student answers will vary.
Q. Explain your choice. A. Student answers will vary. Answers should include a full explanation of the “yes” or “no” in the previous question. Q. Are you certain of your answer about the probability of finding a habitable planet outside of Earth? A. Student answers will vary. Q. Explain what influenced your certainty rating in the last question. A. Student answers will vary. Answers should explain the areas of certainty and uncertainty. Page 3: Evidence of Life Q. What is the first thing that scientists need to look for to find life outside of Earth? A. Scientists should look for water. Living things need liquid water to survive. This means that scientists should be looking for planets that fall into the habitable range—not too close to their stars and not too far away from their stars for liquid water to exist. Students may give other answers, such it must be a rocky planet, or that it needs to have an energy source. These are reasonable, if their reasoning supports their answers. Q. Explain your reasoning. A. Student answers will vary. Students should include evidence from the video and from the text.

!
Is there life outside of Earth? Activity 2: Moving Stars and Their Planets
Overview In this activity, students are introduced to the wobble-method (officially known as the radial velocity method) of detecting planets. The activity starts with an introduction to Newton’s Third Law of Motion. Students use a model to explore the effects of a planet’s mass on the star’s motion. Students then explore how the wavelength of light that a star emits is apparently changed as the star moves towards and away from a telescope. Students use a model to discover the influence of orbiting angle on the ability to detect a planet with the wobble method. Students then use an integrated model to explore the effects of planetary mass and orbiting angle concurrently. Finally, students learn about telescope precision and noise in the data. Learning Objectives Students will be able to
• describe how an orbiting planet can cause a star to wobble. • explore the effect of planetary mass on a star’s wobble. • explain how wavelength can describe the motion of a star. • demonstrate how a planet’s angle of orbit determines whether or not the planet
might be found. • explain how planets are found using the wobble method. • make claims about the data and determine their own level of certainty with regard
to their claims. Lesson Plan
1. Estimated Time This activity should take approximately 45 minutes.
2. Introduce the Activity In this activity, your students will explore several models of motion.

Page 1: The effect of mass on a star’s wobble In this model, students will change the mass of planet using the “planet-diameter” slider and the “Rocky-planet” switch. A rocky planet is denser than a gaseous planet, so the mass of the rocky planet will be higher than a gaseous planet of the same size. The mass of the student-created planet is given in the upper right-hand corner of the model in multiples of Earth’s mass. Encourage your students to test different combinations of rocky planet and planet diameter to understand rocky planets and gaseous planets of the same size can have different effects on the wobble of the star. Page 2: A star’s movement can change its apparent wavelength In this model, students will move the star towards and away from a telescope to see how the apparent emitted wavelength changes. It is important that students understand that the overall color of the light emitted by the star it not dramatically changed as the star moves; the wavelength detected by the telescope changes because the star is either moving closer (compressing the waves) or moving farther away (decompressing the waves). Also be sure to discuss with your students the idea that the graph shows the light hitting the telescope. This means the graph changes only when the wavelength hitting the lens changes--not when the star motion is changed. Page 3: The importance of orbiting angle on being able to detect a star’s wobble In this model, students change the angle of orbit of the planet by tilting the plane (by clicking and holding the mouse button down in the simulation window, then dragging the cursor). The telescopes that are used to detect a star’s wobble detect movement towards and away from the telescope. Your students’ eyes are now the telescope, so to detect a star’s wobble, they will need to detect movement of the star into and out of the screen. If the planet does not orbit the star in a way that makes the star move into and out of the screen (towards and away from the detection instrument), the planet will not be detected. Students should try out many different angles of orbit to determine what angles of orbit lead to planet detection with the wobble method. This model introduces another slider: the “graph-time-window” slider. This control allows students to increase or decrease the amount of data they see in the velocity graph window. Be sure to have students explore and get comfortable with this slider as it comes up when exploring future models in this investigation.
Page 4: Combinations of mass and angle that lead to planet detection with the wobble method In this model, students will make different combinations of mass and angle that result in the same velocity graph. Additionally, students can now explore with a list of preset planets in the “Preset-Planets” pull-down menu. They can also create their own custom planets. To do this, turn on the “custom-planet” switch when the model is running. Then set the “Rocky-planet” switch to choose a rocky planet or a gaseous planet and set the planet’s diameter with the “planet-diameter” slider. To set the planet’s velocity, move the arrow (vector) of the planet. To change the location of the planet drag the planet around. To start the simulation, turn off the “custom-planet” switch. It is easy to get an elliptical orbit this way; it is also easy to select a starting velocity that doesn’t result in an orbit at all. If a circular orbit is desired, click on the “make circular orbit” button. The “Distance-to-star” button zooms the view in and out. It does not change the distance of the planet from its star, just your viewpoint. Hopefully, students will explore lots of variations, but be sure to get students to focus on solving the problem. With the entire class, discuss the different solutions students found and/or what difficulties students had with solving the problem. Students are challenged to match the graph. It is important to tell them that “close enough” is fine; the curriculum focuses on getting students to see how different variables affect how the data can be interpreted. Page 5: Limitations of Noise This page introduces students to the idea of noise and that the graphed data they have been viewing is too “perfect” to match real data. One way students interpret graphs with lots of noise is that there are lots of changes going on. In reality the noise is an artifact of either the environment through which the light passed (gases and other materials in space), as well as physical limitations of the sensors on the instrument. Most advances in science are a result of some advance in engineering. New more sensitive light sensors, or complex telescopic arrays launched into space, make possible less and less noisy signals.

Page 6: Impact of Noise on Angle of Orbit In this model, students will experience the data in a way more similar to how scientists get data about a star’s wobble. Students will set up the model so that the planet is detectible with a perfect telescope, and then they will decrease the precision using the “telescope-precision” slider until they can no longer detect the planet. There is a new control in this model; students can now magnify the y-axis with the slider. This will allow them to see data that is very small or very large. It is important that students look at the values on the y-axis to determine the magnitude of the velocity change. Discuss with your students the importance of scale--similar-looking graphs with different y-axis scales are not equivalent. On this page students are asked to focus on how it can be difficult to spot a small signal inside noisy data, and to explore this through changing the angle of orbit for a planet. Regardless of the mass of the planet, when the tilt of the orbit is close to 90 degrees there will be little movement of the star toward and away from the observer. This produces a weak signal that can get lost in noise. It is important to talk about experimenter’s bias at this point. Since they know that they have a planet in the model, some students may “detect” a planet in the noisy data that is undetectable. It is important to discuss that the noise in the data may obscure planets that are there or make scientists think that there may be planets present where there are not. Remind your students that scientists repeat their experiments many times and ask their colleagues to independently analyze the data so that the experimenter’s bias is minimized. It is also important to focus on scientists’ certainty about their conclusions and what scientists can do to increase their certainty. Page 7: Impact of Noise via Planet Discovery via Star Motion This page is very similar to the previous one, except this time students are asked to explore how low mass planets, even when on the ideal orbital plane, may become undetectable if the data is noisy enough. This page ends with a challenge for students to determine if a particularly noisy graph indicates the presence of a planet.
3. Discuss the Activity
Possible discussion questions:
Using light to find planets !
• How do scientists use light from distant stars to measure movement? • What do scientists know about the motion of a star from the size of its
wavelength? How is a star moving if its wavelength is shifted towards the red end of the spectrum (longer wavelengths)? How is a star moving if its wavelength is shifted towards the blue end of the spectrum (shorter wavelengths?
!“Wobbling” stars
!• What is meant by the term “star wobble?” Is Earth’s star (the Sun)
wobbling? • The graphs represent the velocity of the star, not the velocity of the planet.
Why do scientists focus on a star’s motion (and not the planet’s motion)? • How does the model help to explain star wobble? • How does a planet’s angle of orbit affect the ability of scientists to detect
it? • What would the velocity graph look like if there were multiple planets
orbiting the star? !
Finding planets with indirect evidence
• The graphs represent the velocity of the star, not the velocity of the planet. Why do scientists focus on a star’s motion?
• How can scientists be sure that they have found a new planet? • How do technological innovations influence the process of science?
4. Answers to Questions !Section 1: Finding Planets Using Star Motion Page 1: Gravity and Orbits Q. The motion of a star caused by an orbiting planet is referred to as a “wobble.” What does this “wobble” motion look like? A. The “wobble” motion looks like the star moving in a circle around the center of the graph. The planet is pulling on the star and the star is pulling on the planet. The planet tugs the star outward and the star tugs inward on the planet.
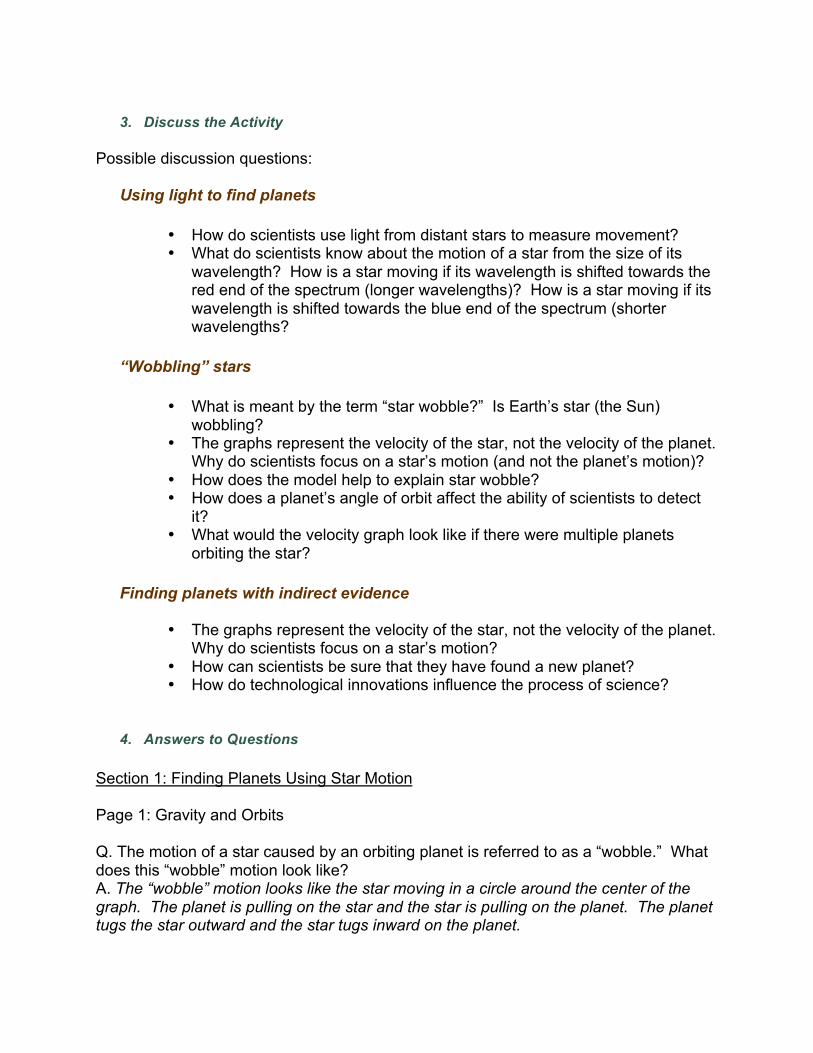
Q. What happens to the motion of the star when the planet has a very low mass? A. (A) The star moves around, but not enough for use to see it in the model. Q. Explain your choice in the previous question. A. Students should support their choice with evidence from the model. For example, when the planet’s mass was very low, the star appeared to stop moving, but I know that it did not actually stop moving because every object has an effect on every other object. It must be too small for me to be able to see it in this model. Q. Based on your observations, what is the relationship between movement of the star and the mass of the planet? A. When the planet is more massive, the star moves more. When the planet is less massive, the star moves less. This is because a more massive planet exerts a stronger gravitational force. Page 2: The Doppler Effect Q. Place a snapshot of the model below that shows both short and long wavelengths in the same picture. Be sure to add text notes to the image that indicate which ones are short and which are long. A.
Q. Imagine you are observing the star through the telescope pictured above. What happens to the wavelength of the star’s light as it moves away from you? A. (B) It gets longer. Q. Imagine you are observing the star through the telescope pictured above. What happens to the wavelength of the star’s light as it moves towards you? A. (A) It gets shorter.
Q. You observe light from a star that seems to be shifted toward the red end of the spectrum. What does that say about the motion of the star? Explain your reasoning. A. That means that the star is moving away from the telescope. The wavelengths will be spread out further if the star is moving away, making its light appear to be red. Page 3: The Importance of Angle Q. What orbital angle prevents you from seeing the motion of a star that does have an orbiting planet? A. (C) 90 degrees Q. Explain your choice in the previous question. A. When the telescope can’t see the wobble, it can’t record any movement. When the planet’s orbiting angle is at 90 degrees relative to the telescope, the telescope can’t see the star’s wobble at all. It’s at a right angle to the planet rather than a shallower (more detectable) angle. Q. A scientist looks for planets by studying the light from a newly discovered star. The GRAPH of the star's motion (based on shifting wavelengths) indicates no motion of the star toward or away from Earth. The scientist decides that the star doesn't have any planets. Do you agree with the scientist? A. Student answers will vary, but most should choose “no.” Q. Explain your choice in the previous question. A. The scientist may be right or may be wrong. It depends on the angle that any planets orbit the star and what their masses are. If the planets are very small or orbit at an angle close to 90°, then they will not be detectable. Or there may not be any planets at all. What the scientist should say is that no planets were detected with those methods. Page 4: The Importance of Both Mass and Angle Q. Place a snapshot here of the first solution to the challenge above. A. Student answers will vary. The graph should look similar to the challenge graph. Q. Place a snapshot here of your solution to the challenge above. A. Student answers will vary. The graph should look similar to the challenge graph. Q. How do different combinations of planetary mass and orbiting angle create the same velocity graph? Explain. A. Both mass and orbiting angle affect how well a planet can be detected with the wobble method. If the planet is very massive, then it isn’t necessary to have an optimal orbiting angle to be detected, but if the planet is not as massive, then it needs to orbit its star at an optimal viewing angle (from Earth) if it is going to be detected at all.

Q. To the right is a velocity graph that was recorded by pointing a telescope at a nearby star. What are the approximate mass and orbital angle of the planet orbiting the star? A. Student answers will vary. Answers should include a combination of mass and orbital angle. Q. Are you certain about your description of the mass and orbital angle of the planet that made the graph above? A. Student answers will vary. Q. Explain what influenced your certainty rating in the last question. A. Student answers will vary. Answers should include reference to the possibility of many combinations that result in the same graph. Page 5: Limitations of Noise Q. Does this graph show a planet orbiting a star? What is your prediction? A. There is a planet there, but it is hard to see, so any one could be correct. This question has a “self check” on it, so students can see the “real” answer and compare to their prediction. Page 6: Impact of Noise on Angle of Orbit Q. Most of the planets that have been discovered have an orbit that is tilted closer to zero degrees than to 90 degrees. Why? A. When the planet is orbiting closer to 0 degrees the effect of its pull is more prominent, so it is more detectable. If the orbital plane is closer to 90 degrees, then the signal will be weak and could be lost in the noise. Q. Why might noise cause a scientist to be unsure about having discovered a planet? A. Because noise caused the data on the graph to jump up and down, hiding what could be a faint signal in the data. Page 7: Impact of Noise on Planet Discovery via Star Motion Q. Most of the planets that have been found so far have been very massive. Why? A. Since the telescopes are not very precise, they are unable to detect small planets. The bigger planets cause bigger shifts in their stars, resulting in changes in the velocity graphs that can be seen even with all of the noise. !Q. Based on the data to the right and considering both mass and angle, could there be a planet orbiting this star? A. Student answers will vary, but the graph does seem to indicate a wobble.
Q. Explain your answer in the previous question. A. Student answers will vary. Explanations should include an analysis of any perceived wobble. Q. Are you certain of your response? A. Student answers will vary. Q. Explain what influenced your certainty rating in the last question. A. Student answers will vary. Answers should include reference to the level of noise in the graph as well as instrument precision.
!
Is there life outside of Earth? Activity 3: Finding Planets Using the Transit Method
Overview In this activity, students are introduced to the transit method of finding planets. The transit method is based on the observation of a small drop in brightness in the light coming from a star that occurs when the star’s planets pass--“transit”--in front of it. Students experiment with a moveable planet to see the dimming effect--as shown in a “light intensity graph”-- a transiting planet has on its star. Students experiment with planet diameter to discover the effect of a planet’s size on star dimming. Then students use another model to investigate the effect of a planet’s orbiting angle on its ability to be detected. Students again explore the role of telescope precision and noise on data interpretation. Finally, students engage each other in a challenge to find custom-made planets. Learning Objectives Students will be able to
• explain how planets can be detected using the transit method. • describe the effect of a planet’s diameter on its ability to be detected using the
transit method. • describe the effect of orbiting angle on a planet’s ability to be detected using the
transit method. • explain how technological advances can result in new scientific discoveries. • make claims about the data and determine their own level of certainty with regard
to their claims. Lesson Plan !
1. Estimated Time This activity should take approximately 45 minutes.
2. Introduce the Activity In this activity, your students will explore several models of motion and light intensity.
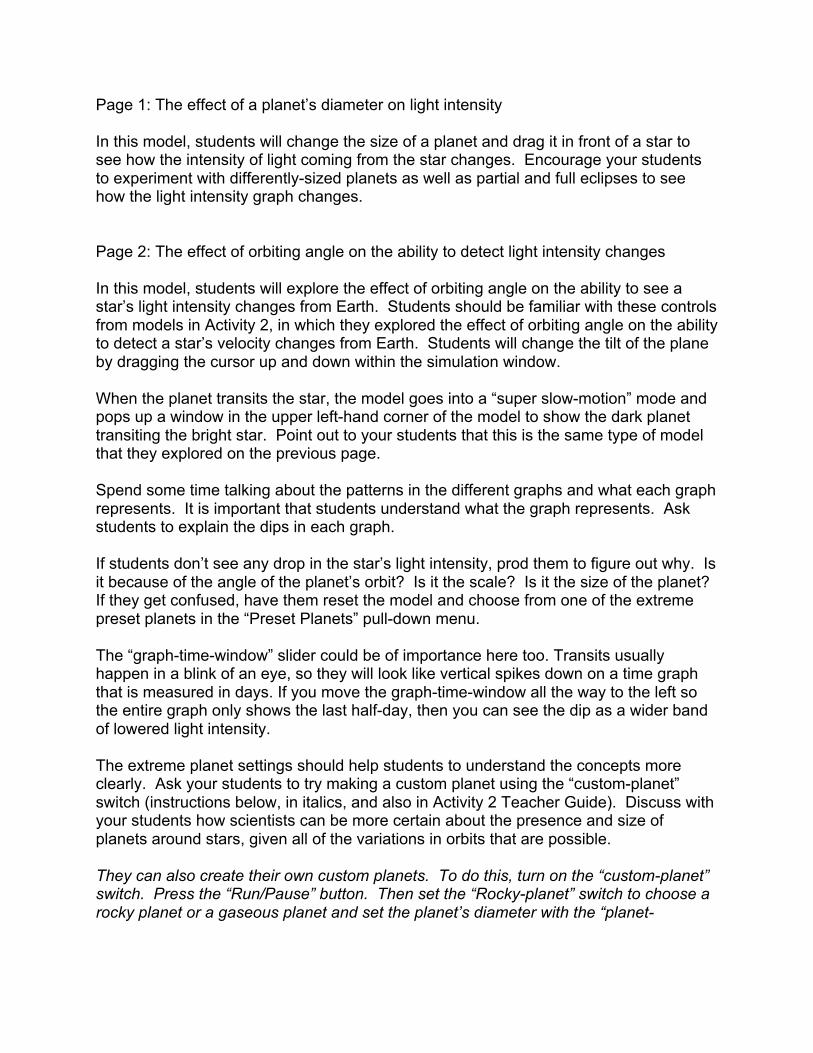
Page 1: The effect of a planet’s diameter on light intensity In this model, students will change the size of a planet and drag it in front of a star to see how the intensity of light coming from the star changes. Encourage your students to experiment with differently-sized planets as well as partial and full eclipses to see how the light intensity graph changes. Page 2: The effect of orbiting angle on the ability to detect light intensity changes In this model, students will explore the effect of orbiting angle on the ability to see a star’s light intensity changes from Earth. Students should be familiar with these controls from models in Activity 2, in which they explored the effect of orbiting angle on the ability to detect a star’s velocity changes from Earth. Students will change the tilt of the plane by dragging the cursor up and down within the simulation window. When the planet transits the star, the model goes into a “super slow-motion” mode and pops up a window in the upper left-hand corner of the model to show the dark planet transiting the bright star. Point out to your students that this is the same type of model that they explored on the previous page. Spend some time talking about the patterns in the different graphs and what each graph represents. It is important that students understand what the graph represents. Ask students to explain the dips in each graph. If students don’t see any drop in the star’s light intensity, prod them to figure out why. Is it because of the angle of the planet’s orbit? Is it the scale? Is it the size of the planet? If they get confused, have them reset the model and choose from one of the extreme preset planets in the “Preset Planets” pull-down menu. The “graph-time-window” slider could be of importance here too. Transits usually happen in a blink of an eye, so they will look like vertical spikes down on a time graph that is measured in days. If you move the graph-time-window all the way to the left so the entire graph only shows the last half-day, then you can see the dip as a wider band of lowered light intensity. The extreme planet settings should help students to understand the concepts more clearly. Ask your students to try making a custom planet using the “custom-planet” switch (instructions below, in italics, and also in Activity 2 Teacher Guide). Discuss with your students how scientists can be more certain about the presence and size of planets around stars, given all of the variations in orbits that are possible. They can also create their own custom planets. To do this, turn on the “custom-planet” switch. Press the “Run/Pause” button. Then set the “Rocky-planet” switch to choose a rocky planet or a gaseous planet and set the planet’s diameter with the “planet-

diameter” slider. To set the planet’s velocity, move the arrow (vector) of the planet. To start the simulation, turn off the “custom-planet” switch. It is easy to get an elliptical orbit this way; it is also easy to select a starting velocity that doesn’t result in an orbit at all. If a circular orbit is desired, click on the “make circular orbit” button. The “Distance-to-star” button zooms the view in and out. Page 3: Instrument Precision In this model, students will experience the data in a way more similar to how scientists get data about a star’s light intensity. Students will set up the model so that the planet is detectible with a perfect telescope, and then they will decrease the precision using the “telescope-precision” slider until they can no longer detect the planet. It is important to talk about experimenter’s bias at this point. Since they know that they have a planet in the model, some students may “detect” a planet in the noisy data that is undetectable. It is important to discuss that the noise in the data may obscure planets that are there or make scientists think that there may be planets present where there are not. Remind your students that scientists repeat their experiments many times and ask their colleagues to independently analyze the data so that the experimenter’s bias is minimized. It is also important to focus on scientists’ certainty about their conclusions and what scientists can do to increase their certainty. Page 4: Planet-hunting In this model, students will make their own star systems to see if they can create planets that are detectable by their classmates. In the first portion of this challenge, half of your students will create planet setups for the other half to solve. The other students should work on an activity away from the computer so that they don’t see how the star systems have been set up. Students may choose from a list of preset planets in the “Preset-Planets” pull-down menu. They can also create their own custom planets. To do this, turn on the “custom-planet” switch. Press the “Run/Pause” button. Then set the “Rocky-planet” switch to choose a rocky planet or a gaseous planet and set the planet’s diameter with the “planet-diameter” slider. To set the planet’s velocity, move the arrow (vector) of the planet. To start the simulation, turn off the “custom-planet” switch.
It is easy to get an elliptical orbit this way; it is also easy to select a starting velocity that doesn’t result in an orbit at all. If a circular orbit is desired, click on the “make circular orbit” button. Once the first group of star system designers has finished their setup, have them drag the HAS window to the bottom right-hand corner of the screen so that only the velocity and light intensity graphs are displayed. The students who have been waiting will come to the computer to look at the graphs and make a conclusion about whether a planet is orbiting the star. As the students will be unable to record their observations and rationale in the activity at this point (because all but the graphs are hidden from view), you should have your students keep notes on paper. Once the planet-hunting students have drawn conclusions, they may look at the setup to see if they were right. It is important to remind your students that scientists are not able to find out if they were right; scientists have only the data from which to draw their conclusions. When the first group has finished planet-hunting, the students switch roles. The students who previously designed star systems should work on an activity away from the computer to allow the others to set up their systems in secrecy. Once the new star systems have been set up, the second group of planet-hunters will look at the velocity and light intensity graphs to decide if a planet is orbiting that star. Page 5: Finding planets in a star field In this model, students will look at the velocity and light intensity graphs for a random star in the star field. The star is selected by the computer, not by the student. Your students will have to draw conclusions based only on the data in the graphs; the model does not show a planet orbiting a star. Additionally, the students are not able to select the precision of the telescope. Discuss with your students how they will know if a planet might be present and how they will discern the star’s wobble and/or light intensity changes in the noisy data.
3. Discuss the Activity Possible discussion questions: !
Using light intensity to find planets
• Why do stars appear to dim when a planet transits? • What factors affect the ability of scientists to detect a planet with the
transit method? !

Finding planets with indirect evidence
• How can scientists be sure that they have found a new planet? • How do technological innovations influence the process of science?
!Discussion after finding planets in the star field ! "#$!%&'()*+,&'!$-&.%,$#!/0!#(&'#!&12!2&(&!3)(4!(4$!$1()'$!*,&##5!
• What data that you looked at made you feel confident that there was a
planet orbiting the star? • When you were unable to detect a planet, were you able to conclude that
the star did not have a planet? Why? • Now that you’ve had practice in finding planets around stars, what would
you do to determine if it is conducive to life?
!4. Answers to Questions
!Section 1: Finding Planets Using the Transit Method Page 1: Light Intensity Q. How did you reduce the light intensity of the star? A. I moved the planet in front of the star, blocking some of the light from the telescope. Therefore, it appears that the star got dimmer. Q. Which planet would be more easily detected with the light intensity method of planet hunting? A. (C) (the largest diameter planet)
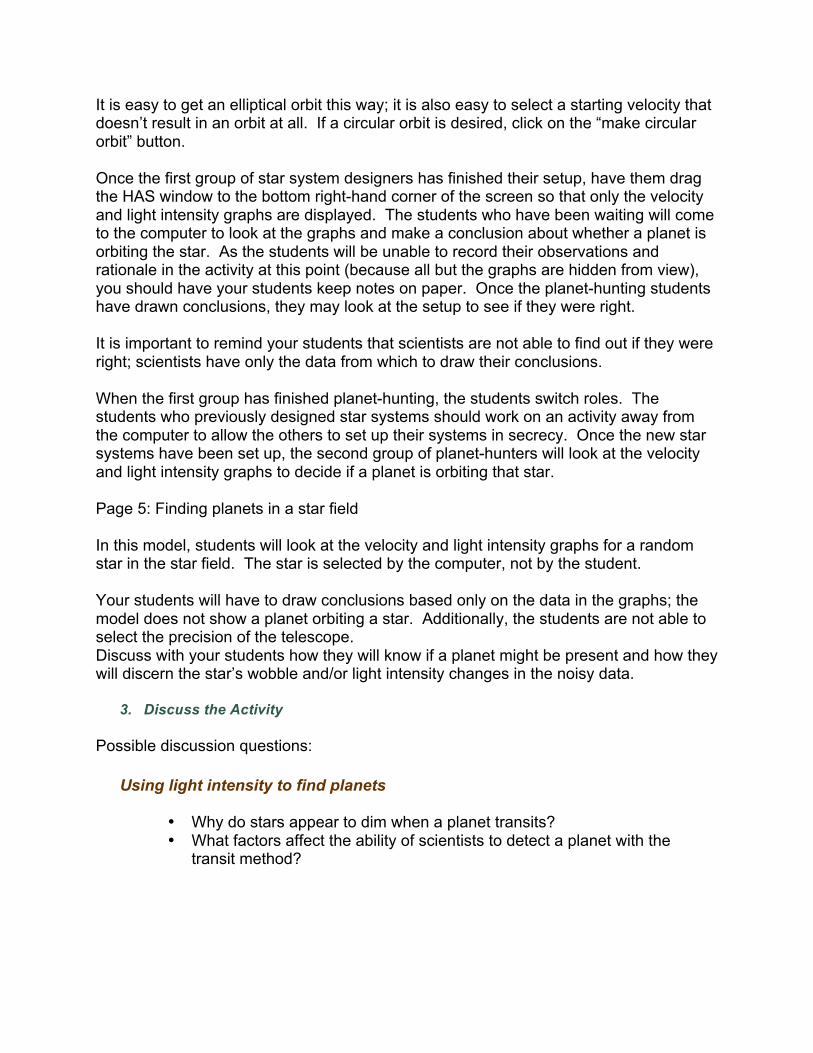
Page 2: The Importance of Angle Q. Place a snapshot of your solution to Challenge A (large planet that has no dimming effect on its star) here. A.
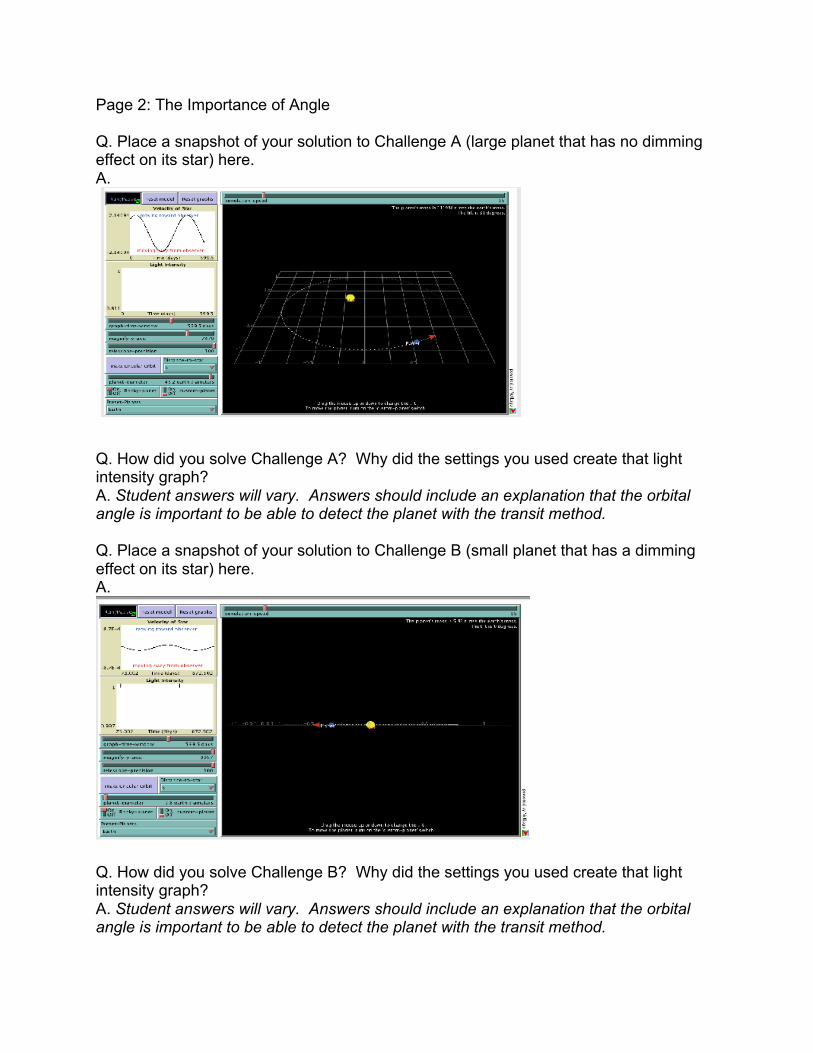
Q. How did you solve Challenge A? Why did the settings you used create that light intensity graph? A. Student answers will vary. Answers should include an explanation that the orbital angle is important to be able to detect the planet with the transit method. Q. Place a snapshot of your solution to Challenge B (small planet that has a dimming effect on its star) here. A.
Q. How did you solve Challenge B? Why did the settings you used create that light intensity graph? A. Student answers will vary. Answers should include an explanation that the orbital angle is important to be able to detect the planet with the transit method.
Q. What orbital angle is necessary to see any drop in star brightness caused by an orbiting planet? A. (A) close to 0 degrees Q. Explain your choice in the previous question. A. The telescope needs to be able to see the dimming. If it cannot see the dimming because the planet does not orbit in the same plane as the telescope, then it cannot be detected. Being in the same plane as the telescope means having the orbiting angle of the planet at close to 0 degrees. Page 3: Instrument Precision Q. Given the noise that is always present in real instruments, explain why most planets discovered using the transit method have had large diameters. A. Since telescopes are not perfect, the only changes in light intensity that can be reliably measured are large ones. Large changes in light intensity come from large planets transiting the stars. Q. A star was picked at random and light intensity was measured over a long period of time, giving a graph shown on the right. Could there be a planet orbiting this star? A. Student answers will vary; most will probably select “no,” but “yes” is a reasonable answer given that the angle may not be just right to see the star. Q. Explain your answer in the previous question. A. Student answers will vary. Answers should include an assessment of the graph data. Q. Are you certain of your response? A. Student answers will vary. Q. Explain what influenced your certainty rating in the last question. A. Student answers will vary. Answers should include reference to planet size and orbiting angle. Page 4: Planet Hunting in Your Classroom Q. Describe an example in which you were very certain from the graphs how the star system was set up, and why you were certain. A. Student answers will vary. Answers should include descriptions and analyses. Q. Describe an example in which you were uncertain from the graphs how the star system was set up, and why you were uncertain. A. Student answers will vary. Answers should include descriptions and analyses.

Q. How successful were you at detecting others’ planet setups? What made it difficult? A. Student answers will vary. Page 5: Individual Planet Hunt Challenge Q. Insert a snapshot of your model here. A. Student answers will vary (see possibilities below). The snapshot should show the selected star and associated velocity and light intensity graphs. Q. Do you think that there is a planet orbiting your star? A. Student answers will vary. Q. What evidence do you see in the graphs above to support your conclusions about the existence of a planet around your star? A. Student answers will vary. Answers should include an analysis of the noisy data in the graphs. Q. How certain are you of your answer? A. Student answers will vary. Q. Explain what influenced your level of certainty in the previous question. A. Student answers will vary. Answers should include an analysis of the noise in the data as well as the y-axis scales and magnitude of change on the velocity and light intensity graphs. The following are the settings for each of the mystery stars on this page. HAS873
- telescope-precision 99 - planet-diameter 3.4 - rocky-planet true - tilt 1 - Smallest planet, but rocky so has some mass, still low though. It is slightly out of light of sight. Signal is very slight and only visible in the velocity graph under heavy magnification. Because it is not directly in line of sight, there is no signal on the light graph.

HAS954 - telescope-precision 21 - planet-diameter 16.8 - rocky-planet true - tilt 0 - Very noisy data, but massive planet in the light of sight orbital plane. Because of the noise it can still be hard to see the light graph indictor, even with magnification. Otherwise this one is easy to spot on the velocity graph.
HAS329
- telescope-precision 35 - planet-diameter 16.8 - rocky-planet true - tilt 73 - Diameter if relatively large for rocky planet, so high mass, but orbit is far out of line of sight. With magnification signal is still very visible in the velocity graph, but non-existant in the light graph. Even the velocity one is faint for such a large planet, but that is because of the out of plane orbit. However, the student will not know if this is a high mass planet out of the orbital plane or a low mass planet close to the orbital plane that is on a line of sight path.
HAS612
- telescope-precision 94 - planet-diameter 7.6 - rocky-planet false - tilt 0 - Smallish gaseous planet, so pretty low mass, but directly in line of sight. Variations are still almost, but not quite hidden in the noise, especially if you magnify the signal. A planet can be detected, but only barely.
HAS781
- telescope-precision 5 - planet-diameter 50 - rocky-planet false - tilt 0 - This is a large gaseous planet directly in line of sight, pretty close to the star. The telescope precision is bad, but the signal is so strong that they should be able to easily tell there is a planet based on both light and velocity graphs.