teacher pay reform and productivityfaculty.smu.edu/millimet/classes/eco7321/papers/sojourner et...
TRANSCRIPT

Teacher Pay Reform and ProductivityPanel Data Evidence from Adoptions of Q- Comp in Minnesota
Aaron J. SojournerElton MykereziKristine L. West Sojourner, Mykerezi, and West
abstract
This paper studies the impacts of teacher pay- for- performance (P4P) reforms adopted with complementary human resource management (HRM) practices on student achievement and workforce fl ows. Since 2005, dozens of Minnesota school districts in cooperation with teachers’ unions implemented P4P as part of the state’s Quality Compensation program. Exploiting district variation in participation status and timing, we fi nd evidence that P4P- centered HRM reform raises students’ achievement by 0.03 standard deviations. Falsifi cation tests suggest that gains are causal. They appear to be driven especially by productivity increases among less- experienced teachers.
I. Introduction
The potential to improve U.S. education through human resource man-agement (HRM) reforms centered on pay- for- performance (P4P) remains an open, active question for economists and policymakers. After decades of paying teachers
Aaron J. Sojourner ([email protected]) is an assistant professor at the Carlson School of Management at the University of Minnesota. Elton Mykerezi ([email protected]) is an associate professor of Applied Economics at the University of Minnesota. Kristine L. West ([email protected]) is an assistant professor of Economics at St. Catherine University. Thanks to Avner Ben- Ner, Jen Brown, John Budd, Brian Cadena, Caroline Hoxby, Paul Glewwe, Karthik Muralidharan, Michael Lovenheim, Morris Kleiner, Collen Manachester, Jason Shaw, Chris Taber, and Joel Waldfogel; to participants at the NBER Spring 2011 Eco-nomics of Education meeting for comments; and to Qihui Chen, Paul Kristapovich, Qianyun Xie, Yingchun Wang, and Robert Vellella for able research assistance. Thanks to George Henley and Kristie Anderson of the Minnesota Department of Education and the Kingsbury Center for help with restricted- data acquisition and to the Human Capital Research Collaborative and the University of Minnesota Center for Urban and Regional Affairs for funding support. All errors are the authors’. Data on district Q- Comp participation can be obtained from the authors May 2015 through April 2018. Student achievement data and workforce fl ows must be requested from the Minnesota Department of Education.[Submitted June 2013; accepted September 2013]ISSN 0022-166X E- ISSN 1548-8004 © 2014 by the Board of Regents of the University of Wisconsin System
T H E J O U R N A L O F H U M A N R E S O U R C E S • 49 • 4

The Journal of Human Resources946
almost solely on their education and experience, hundreds of U.S. school districts have begun measuring teacher performance in various ways and incorporating these measures into pay determination. State governments including Colorado, Florida, Minnesota, South Carolina, and Texas now encourage or require local school districts to shift their teacher management systems to include performance evaluation and pay. The federal government also encourages districts to shift toward performance- based HRM systems through its $1.6 billion Teacher Incentive Fund and $4.4 billion Race to the Top program. These reform efforts are driven by theories that P4P- centered HRM reform will raise teacher productivity and student learning.
Despite strong evidence of P4P effects in production environments where output is relatively easy to measure (Lazear 2000; Bandiera, Barankay, and Rasul 2007), evidence of P4P and broader HRM reforms’ impact in more complex environments is limited. According to Bloom and Van Reenen (2011), in organizations in general, “There is certainly a robust positive cross sectional association between bundles of ‘modern’ HRM practices and productivity, but with some exceptions (for example, Ichniowski, Shaw, and Prennushi 1997) these are not robust in the time- series dimen-sion.” In education, evidence of the effects of P4P in U.S. schools is mixed (Podgursky and Springer 2007; Prentice, Burgess, and Propper 2007; Neal 2011). P4P field ex-periments generated null or even negative effects (Springer et al. 2010; Fryer 2011).1 Aside from P4P, evidence is emerging that another kind of HRM reform, performance measurement and feedback, can generate positive effects through improvement of in-cumbent teachers’ practice (Taylor and Tyler 2012) and increasing low performers’ separation rates (Rockoff et al. 2012).
This paper reports new evidence on how teacher HRM reforms centering on P4P contracts affect student achievement and workforce flows using panel data from Min-nesota. A shock to local school districts’ HRM practices was induced by the state’s introduction of its Quality Compensation program (Q- Comp) in 2005. The state began offering local districts additional funding in return for districts’ use of P4P contracts along with complementary HRM practices. Different districts applied for and joined Q- Comp each year. Dozens of districts have since implemented reform and hundreds of thousands of student- years have been taught in participating districts. As one of the nation’s largest and longest- standing programs encouraging P4P- centered HRM reform, Q- Comp attracts significant policy and political attention, yet little is known about the effects of the reforms it spurred. This is the first study to use the Q- Comp program to study effects of reform on student achievement.2
This study estimates the effects of P4P- centered HRM reform on achievement for students in Grades 3 to 8 and the mechanisms by which the effects operate by inte-grating data from multiple sources. We use student- level panels from two different standardized achievement tests (one state- mandated and the other optional but widely used), the population of teachers linked to their district each year, Q- Comp program
1. Strong evidence of positive P4P effects has emerged in other countries (Muralidharan and Sundararaman 2011; Lavy 2002, 2009; Glewwe, Ilias, and Kremer 2010).2. A legislative auditor’s report (Nobels 2009) and state commissioned external reports (Hezel Associates 2009; Wahlstrom, Sheldon and Peterson 2006) provide evidence about Q- comp’s implementation but little about resulting student achievement. Neither dealt with selection or covariates. Nadler and Wiswall (2011) studies Q- Comp participation but not impacts. Schwartz (2012) provides qualitative description based on interviews with numerous stakeholders.

Sojourner, Mykerezi, and West 947
data coded from archives of offi cial documents, the U.S. Schools and Staffi ng Survey, as well as data on district characteristics and finance from the Minnesota Department of Education (MDE). This enables the study to make five main contributions.
First, this statewide field study based on one of the nation’s largest teacher pay programs is uniquely informative about longer- run, general- equilibrium effects. Pre-vious efforts in this direction have relied on cross- national variation (Hanushek and Woessmann 2011). Theory suggests that P4P will work by some mixture of (1) in-creasing incumbent employees’ productivity and (2) attracting more able employees to the organization (Lazear 2000). In order to operate fully, both mechanisms require belief that the reform is here to stay. Incumbent teachers may require a few years of trial and error to increase their own productivity in response to P4P incentives. They will make these investments only if they believe the reform will endure. Regarding sorting, people will not alter their choice of employer based on a pay system they expect to disappear. Only a permanent policy change gives teachers, administrators, and families incentives and time to adjust to reform.
Second, despite the nonexperimental context, the study has several properties that make identification credible. Student achievement is measured in individual panels covering the academic years starting 2003 to 2009, and different districts applied for and adopted Q- Comp in different years. A generalized difference- in- difference framework identifies the effect of reform on districts’ productivity net of time effects and fixed differences between individual students. Further, we conduct a series of falsification tests to rule out various alternative explanations. One placebo test uses multiple years of pre- adoption data to estimate Q- Comp “effects” prior to adoption, which tests for the presence of differential trends in unobservables among adopting districts. A second placebo test estimates failed- application “effects” to assess whether districts’ desire to reform is suffi cient to generate effects, absent actual reform. Q- Comp’s teacher- pay reforms produced an average 3 percent of a standard deviation increase in reading achievement, with some evidence of a similar effect on math achievement in the full sample. Evidence from the appliers- only sample is weaker.
Third, we assess whether achievement effects reflect real skill gains or simply teaching- to- the- test by assessing Q- Comp’s impact using two distinct standardized tests. Gaming is a central concern in the P4P literature generally (Holmstrom and Milgrom 1991) and in the educational P4P literature particularly. According to Neal (2011), “Clean evidence on the generalizability of assessment gains is rare, and the existing literature does not speak with one voice.” The Minnesota Comprehensive Achievement test (MCA) is state mandated and administered in all districts. Some districts also voluntarily contract with the Northwest Evaluation Association (NWEA) to use its Measures of Academic Progress achievement test.3 We use all existing data on Minnesota students in Grades 3 to 8 from the MCA and NWEA in both reading and math. In each subject, we assess the estimates’ robustness across the tests. Further, we check whether students make larger gains on the higher stakes test than on the other test. We do this in a unique way. Commonly, higher stakes are attached to one test for all students and a second test is lower stakes for everyone, meaning that stakes are confounded with test. In this study, many students also take two tests but, in contrast,
3. Though the panels cover many of the same students in the same years, we cannot link a student across tests or to a particular teacher.

The Journal of Human Resources948
which test is higher stakes with respect to school- wide performance bonuses differs by district and sometimes even by school grade within district. Test and stakes are not confounded.
Fourth, we use data on the universe of Minnesota teachers tied to their employ-ing district each year to examine if changes to districts’ teacher HRM policies affect teacher movements and the extent to which this accounts for achievement gains. Al-though we cannot link particular teachers to particular students, we develop measures of district- year teacher workforce flows through various channels (novice teachers entering interdistrict transfers in and out, retention, and retirements out) and school- year teacher experience profiles (share with ≤ 5, 6–15, and ≥ 16 years experience). We study how these relate to changes in student achievement. There is no evidence of significant effects of HRM reform on teacher workforce flows or experience profiles, and observed changes in flows and profiles do not explain coincident changes in stu-dent achievement. Similarly, we test and reject the possibilities that changes in dis-tricts’ student populations or total expenditures drive achievement gains. In contrast, we find evidence that the effect of reform interacts significantly with school- level measures of teacher experience; the effect is strongest among schools with more in-experienced teachers.
Finally, Q- Comp provides an opportunity to examine the effects of a “grantor- grantee” structure for program design that mirrors recent U.S. Department of Educa-tion efforts such as Race to the Top and the Teacher Incentive Fund. In these programs, the funder sets out guidelines and asks local entities to propose tailored plans within them. The grantor delegates some design decisions in order to harness local knowl-edge about what will work and what is politically feasible. However, this comes with risk that local grantees do not deliver improvements. Q- Comp is an opportunity to examine if decentralized design with centralized approval generated gains or produced mostly rent- seeking behavior.
These features of the study enable contributions to the education, personnel, and la-bor economics literatures. Having long- term outcomes coupled with a real policy shift permits study of how impacts unfold over a multiyear horizon, which is unusual and valuable. Further, having P4P- centered HRM reform sweeping across a large fraction of an industry while observing output and worker flows for all firms in the industry, gives an unprecedented view into the mechanisms of change. This paper reports some of the strongest evidence available that teacher HRM reform can increase teacher productivity and student learning in the United States. Though the magnitudes of the achievement impacts are not large, a rough estimate suggests the social benefits of the gains exceed the costs of producing them.
II. Background and Process
A. Description of Q- Comp Program
Q- Comp was designed to encourage Minnesota school dis tricts to adopt specific forms of P4P. It also aimed to ensure that districts had complementary HRM practices in place. Minnesota’s leading newspaper described Q- Comp at launch this way: “[The enabling legislation] puts $86 million into a teacher merit pay plan called ‘Q- comp,’

Sojourner, Mykerezi, and West 949
which allows teachers to get raises based on merit, additional duties and student achievement, not only for years on the job and college credits” (deFiebre, Lopez, and Hopfensperger 2005). More recently, former Governor Tim Pawlenty described it: “Q Comp is the nation’s most comprehen sive performance pay for teachers pro-gram” (Victory New Hampshire 2012). The MDE defines the range of district HRM practices—types of P4P contracts, classroom observation protocols, individual pro-fessional development plans, etc.—acceptable under Q- Comp and invites districts to propose a specific set of HRM practices within this range. If the proposal is approved and adopted, the district becomes eligible for up to $260 in additional annual funding per pupil added to the district’s general budget.
The MDE encouraged districts to design their P4P so that all teachers could con-ceivably collect the full bonus amount rather than using optimal tournaments (Bar-levy and Neal 2012) and to use multiple performance measures including a mix of objective and subjective measurements and individual- and team- based goals. In their applications, districts specify the P4P bonuses each teacher is eligible to earn for the following three types of criteria: (a) the formal classroom- observation process; (b) school- wide or district- wide goals for student achievement usually on standardized tests; and (c) quantifiable goals negotiated within the school (between administration and teachers) for student achievement defined at the teacher, team, or grade level but not usually based on standardized tests. Across Q- Comp districts, the average bonus available to teachers tied to each of these criteria was $1,107, $243, and $850 per year, respectively.4 Classroom observations had the most stakes tied to them. School- wide goals based on standardized achievement tests had the least.
P4P goals were set and measured in the context of a complementary management practice, which the MDE refers to as “job embedded professional development” and which shares many features with high- performance work practices (Ichniowski, Shaw, and Prennushi 1997; Cappelli and Neumark 2001). Specifically, with the support of their administration, teachers form Professional Learning Communities (PLCs). Here, they help select performance targets—which form the basis for Q- Comp’s individual or small- group—and P4P bonuses and help each other achieve those targets. They meet regularly to analyze classroom practice, to learn new instructional strategies and tactics, to field test them in the classroom, and to report the results to each other (Hord and Hirsch 2008; Darling- Hammond et al. 2009). For classroom observations, the state encouraged districts to use the Danielson evaluation framework (Danielson and McGreal 2000), the most widely used evaluation rubric nationally, and to conduct at least three observations per year using a trained evaluator and with pre- and post- observation conferences. Teachers are rated on measures of planning and prepara-tion, classroom environment, professional responsibility, and instructional practice. Depending on the district, the evaluator is the principal or other administrator, a peer, or a hired consultant.
Our research design is premised on district’s participation in Q- Comp triggering change in HRM practice. To probe this premise, we look to survey data on Minnesota districts’ pay practices. To see whether Q- Comp districts actually were more likely to use P4P, we conducted an independent phone survey of Minnesota school district
4. These averages are computed by weighting each district’s bonuses by its number of students tested in MCA reading after reform.

The Journal of Human Resources950
human resource professionals about district pay practices without making any mention of Q- Comp.5 Q- Comp districts report starkly different ways of compensating teachers than other districts. Among Q- Comp participants, 86 percent report paying for student performance and 90 percent report paying for subjective evaluations. In contrast, none of the nonparticipating districts report paying on either of these dimensions. P4P in Q- Comp districts is a supplement to, rather than a replacement of, traditional com-pensation criteria. Basing pay on years of experience and educational credentials is reported by 95 percent of participating and 100 percent of nonparticipating districts. Though this evidence of cross- sectional difference is strong, our design requires pay- system changes.
Q- Comp adoption did change how districts compensate teachers according to Schools and Staffi ng Survey (SASS) data on whether districts use any pay incentives to “reward excellence in teaching.” Q- Comp participation is significantly associated with switches from “No” before Q- Comp adoption to “Yes” after adoption. Fifty- five Minnesota districts were sampled in both the 2003–2004 and 2007–2008 SASS waves. Among districts not participating in Q- Comp during the second wave, 96 percent re-port no pay for excellence both before and after Q- Comp started. Among districts participating in Q- Comp in 2007–2008, none reported paying for excellence before Q- Comp and 58 percent report paying for excellence in the post- adoption wave. Q- Comp adoption triggered a large rise in the likelihood of reporting pay- for- excellence.6
While P4P was certainly new, it likely came with changes in other HRM practices. MDE required districts to have or put complementary HRM practices in place. The U.S. Department of Education’s Race to the Top and Teacher Incentive Funds work similarly. Because we do not observe districts’ professional development or classroom observation schedules prior to Q- Comp adoption, we cannot measure how much of a change in these complementary HRM practices Q- Comp represents. With respect to classroom- observation based evaluations, prior to Q- Comp, untenured teachers were commonly observed once or twice a year and tenured teachers were rarely observed. Pay was not tied to these. Some PLCs existed prior to Q- Comp but they were not as widespread and were not used to set P4P criteria.
Given this, the current paper aims to identify the effect of adopting a locally de-signed P4P reform in the context of complementary HRM practices. As in any firm, P4P’s impact on labor productivity will depend on employee screening, production, and monitoring technologies (Milgrom and Roberts 1990; Ichniowski, Shaw, and Prennushi 1997; Prendergast 2002; Bloom and Van Reenen 2011). Therefore, school districts and other firms may have incentives to adopt P4P along with bundles of complementary organizational practices in any kind of observational or experimental context. For instance, performance measurement systems must be operating. The or-ganization may also reorganize production and redesign jobs to allow teams to operate effectively and offer new opportunities for workers to improve their skills. Coincident management reforms—more classroom observations (Taylor and Tyler 2012), sup-port for teachers meeting regularly in professional learning communities (Jackson and
5. This was part of a national survey of districts’ policies (West 2012). The Minnesota subsample consists of 92 districts (38 percent response), 21 of which we know participate in Q- Comp from administrative sources.6. What about the 43 percent of Q- Comp districts that told SASS the district does not pay for excellence? West (2012) discusses how vagueness in SASS’s pay- for- excellence question induces more measurement error than survey questions that ask whether pay is tied to more specifi c criteria, such as student performance.

Sojourner, Mykerezi, and West 951
Bruegmann 2009), job- embedded professional development, improved information systems—are potentially important complements to P4P incentives.
In many studies, including this one, these bundles of practice will tend to vary together and the effect of each element is diffi cult to separate. We are confident that Q- Comp adoption implies that, for the first time, teachers in adopting districts could earn extra money based on performance; Q- Comp adoption indicates new adoption of P4P. However, districts changed other organizational practices too. For this reason, we characterize the “treatment” as P4P- centered HRM reform.
B. Description of Adoption Process
Each year, nonparticipating districts decide whether to apply for Q- Comp and what specific proposal to make. MDE decides whether to accept each proposal. The local teachers union organizes a district- wide vote on whether to accept any new contract terms required by the proposal. Districts that clear all these hurdles adopt Q- Comp, implement their proposals, and start getting additional funds. A few participating dis-tricts subsequently drop out of Q- Comp. Therefore, in each year, each district has either not applied, been rejected, has adopted, or has dropped Q- Comp.
Our sample includes all regular Minnesota public school districts with any students in Grades 3–8.7 We code whether or not each district applied, adopted, or dropped in each year based on archives of districts’ applications, letters from the state granting approval, and district progress reports provided by the MDE.8 The number of districts in our sample by Q- Comp participation status and year and the number of unique districts ever in each category are presented in Table 1’s top- left panel.
There was some very limited use of P4P in Minnesota districts prior to Q- Comp, which we measure but which necessitates some judgment in coding the timing of P4P- centered HRM reform adoption. In a precursor to Q- Comp in 2002, the State of Minnesota passed its first version of this grantor- grantee reform structure, inviting districts to apply to serve as P4P - pilot adopters. Five districts applied and, in 2003, they started participating in the pilot, which offered $150 per student- year in fund-ing, guaranteed to last through 2009. The funds were offered in return for adopting some elements of what would eventually become Q- Comp. Additionally, in 2004, all schools in the Waseca district and three Minneapolis schools started participating in the Milken Foundation’s Teacher Advancement Program (TAP) (Springer, Ballou, and Peng 2008; Glazerman and Seifullah 2010). When Q- Comp, which combined elements of the 2002 pilot program and TAP, became law in 2005, the MDE approved all TAP schools for participation in Q- Comp without requiring any changes to their programs. So, we code the TAP schools as adopting Q- Comp in 2004. In contrast, the five pilot districts’ existing P4P policies did not automatically qualify them for Q- Comp. The MDE offered them the option to either modify their policies to fit within the range of proposals acceptable under Q- Comp (qualifying them for full Q- Comp funding) or to continue operating under the pilot program until the promised funding
7. Appendix B (note: all appendixes can be found online at http://jhr.uwpress.org/) describes the design and rationale for the sample in detail.8. Two districts fi rst made an initial, failed application and a subsequent, successful one. For these districts, the initial failed application is ignored.

The Journal of Human Resources952
Tabl
e 1
Dis
tric
t and
Stu
dent
Q- C
omp
Par
tici
pati
on in
Ful
l Sam
ple
and
in N
WE
A S
ubsa
mpl
e by
Yea
r
Num
ber
of D
istr
icts
Q- C
omp
Stat
usN
umbe
r of
Tes
ted
Stud
ents
in G
rade
s 3–
8Q
- Com
p St
atus
Aca
dem
ic Y
ear
Star
ting
N
ot
App
lied
R
ejec
ted
A
dopt
ed
Exi
ted
To
tal
N
ot
App
lied
R
ejec
ted
A
dopt
ed
Exi
ted
To
tal
Sam
ple:
All
Dis
tric
ts20
03
364
00
036
417
8,50
60
00
178,
506
2004
35
90
40
363
173,
119
01,
053
017
4,17
220
05
351
013
036
431
9,19
40
13,7
480
332,
942
2006
31
09
422
361
260,
976
5,46
977
,613
1,22
134
5,27
920
07
298
1053
336
123
6,09
25,
845
97,1
372,
917
341,
991
2008
29
113
575
361
219,
919
11,7
0310
4,37
53,
610
339,
607
2009
28
120
578
357
204,
507
26,1
3498
,327
10,8
7233
9,84
0U
nit-
year
s 2,
254
5222
518
2,53
11,
592,
313
49,1
5139
2,25
318
,620
2,05
2,33
7U
niqu
e un
its
369
2065
836
954
5,99
818
,475
125,
375
7,12
269
6,97
0
Subs
ampl
e: D
istr
ict-
Yea
rs w
ith N
WE
A T
est
2003
74
00
074
63,5
290
00
63,5
2920
04
151
00
015
110
2,07
20
00
102,
072
2005
18
60
60
192
110,
746
05,
288
011
6,03
420
06
187
426
121
810
0,87
977
526
,601
402
128,
657
2007
19
28
342
236
69,4
7792
830
,258
1,70
810
2,37
120
08
192
841
224
353
,670
1,14
924
,762
1,34
880
,929
2009
18
515
507
257
37,2
912,
401
15,8
462,
761
58,2
99U
nit-
year
s 1,
167
3515
712
1,37
153
7,66
45,
253
102,
755
6,21
965
1,89
1U
niqu
e un
its
27
3
8
57
7
273
20
6,31
1
1,78
9
36,6
86
2,24
0
247,
026
Not
es: T
houg
h ou
tcom
es f
or 2
010
are
not
avai
labl
e, w
e ob
serv
e an
othe
r 14
dis
tric
ts a
dopt
Q- C
omp
in 2
010
and
one
appl
ier
that
did
not
ado
pt. A
tot
al o
f 22
sch
ools
in
the
Min
neap
olis
and
Ros
evill
e sc
hool
dis
tric
ts a
dopt
ed Q
- Com
p at
the
scho
ol le
vel;
thes
e ar
e co
nsid
ered
sep
arat
e di
stri
cts
for
this
ana
lysi
s.

Sojourner, Mykerezi, and West 953
expired in 2009. Two pilot districts transitioned into Q- Comp in 2005; they are coded as adopting Q- Comp then despite the fact that the change in their HRM practices is relatively small. The other three pilot districts are coded as never applying to Q- Comp, putting these districts with some elements of P4P in the control group. We use this conservative approach in most analysis and later assess robustness by estimating models excluding the five pilot districts from the sample.
In 2003, none of the state’s 364 districts had applied to Q- Comp, as the program did not exist. In 2004, TAP schools adopt. In 2005, another nine districts applied; all adopted. In 2006, 38 more districts applied, of which 29 adopted and nine failed to adopt. Of all 361 districts in 2006, 42 were participating in Q- Comp, nine were rejected, and 310 had not applied. This second year of the offi cial program had the largest application and adoption cohorts. By 2009, the final year of our achievement data, 56 districts (16 percent) were participating, 20 (5 percent) had previously applied but were not participating, and 281 (79 percent) had never applied.
Table 1’s top- right panel describes the analogous number of students in the analytic sample, those who took the state- mandated MCA exam in Grades 3 to 8 between 2003 and 2009, from each type of district in each year. For instance, in 2009, participating districts included 98,411 tested students (29 percent), rejected districts had 26,136 (8 percent), and not- applied districts had 215,596 (63 percent). Applying districts are larger on average than districts that did not apply, which is not surprising given that applying for and adopting Q- Comp involved fixed costs but the state subsidy varied linearly per student. The following section studies selection into Q- Comp more care-fully and estimates effects of the reforms it spurred.
III. Effects of P4P- Centered HRM Reform
A. Identifi cation
Recent national efforts to spur education reform follow a similar general approach as Q- Comp in that they set guidelines and accept proposals from districts. How did this flexible approach perform? What was the average effect of the reforms after six years and over $200 million in state funds allocated? To understand the effect of HRM reform on student achievement, we analyze panels of individual student achievement in reading and math on two different kinds of achievement tests: the MCA and the NWEA. In each panel, we observe an individual student’s school grade each year though we cannot link to teachers or to any individual student’s MCA and NWEA scores across panels.
The MCA, the primary state- mandated achievement test, is used for No Child Left Behind, state- published school report cards, and other accountability programs. Prior to the academic year starting in 2005, Minnesota required all public school students in Grades 3, 5, and 7 to take the MCA tests in spring. Starting in the 2005 academic year, the mandate expanded to include Grades 4, 6, and 8. We convert individual MCA scores to z- scores by standardizing against the statewide mean and standard deviation by grade- year- subject. This puts all outcomes in standard deviation units and facili-tates pooling across grades.
We use a difference- in- difference framework to explain variation in achievement

The Journal of Human Resources954
within- student over time. In year t, student i attends grade g in school s in district d. We assume student achievement (yit) is produced according to the following function:
(1) yit = βQdt + αwsgt + γi + τt + εit
Observable influences are measures of the district’s Q- Comp program in that year (Qdt) and measures of average demographic characteristics of students in the same school- grade- year as student i (wsgt). Unobservables are partitioned into three additive components: a student fixed effect captures stable influences on i’s achievement over time (γi), a year fixed effect (τt) allowing differences across years in average perfor-mance, and idiosyncratic influences (εit). Standard errors allow heteroskedasticity and correlation of εit within district.
To allow β to capture the effect of Q- Comp participation on average, we define Q as a simple postadoption indicator: 1(postadoption)dt. We use two alternative comparison time periods. In Specification A, the reference category is all years prior to adoption. Specifi cation B adds an indicator for academic years two or more years prior to adop-tion, 1(2+ pre- adoption)dt, making the reference category the single year immediately prior to adop tion (Lovenheim 2009). Additionally, an indicator for district- years where the district once participated in Q- Comp but since dropped out is always included. In a dynamic specifi cation similar to B, we use a full set of leads and lags capturing each year relative to the pre- adoption year separately. Because Q- Comp participation is not randomly assigned, systematic unobserved differences between districts that influence both Q- Comp adoption and outcomes could bias estimates of program effects.
The generalized difference- in- difference analysis relies on differences in the timing of reform across districts and, consequently, students to separate time effects from treatment effects. Student- level achievement panels permit identification of effects by studying changes in achievement within student, over time. We compare how, on average, a student’s achievement changed after her district adopted reforms from its average pre- adoption level relative to the average achievement change experienced by students whose districts did not adopt over the same period. In the context of personnel economics, this can be interpreted as a study of how adoption of P4P and associated HRM reforms changes a district’s teachers’ average productivity—that is, their ability to produce student learning as proxied by student achievement scores. Year indicators identify counterfactual year effects (τt).
Because peers may influence achievement and because variation in peers over time may correlate with changes in district P4P policy, we condition on a vector of school- grade- year average student demographic characteristics (wsgt), including student shares eligible for free lunch, eligible for reduced- price lunch, in special education, male, African American, Hispanic, Asian American, and Native American. w also includes total enrollment measured in thousands of students. w does not vary across subject although its effects (α) can. Table 2.9
The model is identified by assuming that the timing of the participation decision (Qdt) is conditionally uncorrelated with unobserved influences (εit):
9. Peer context variables’ means approximately equal student- level means for the underlying variables.
Sojourner, Mykerezi, and West 955
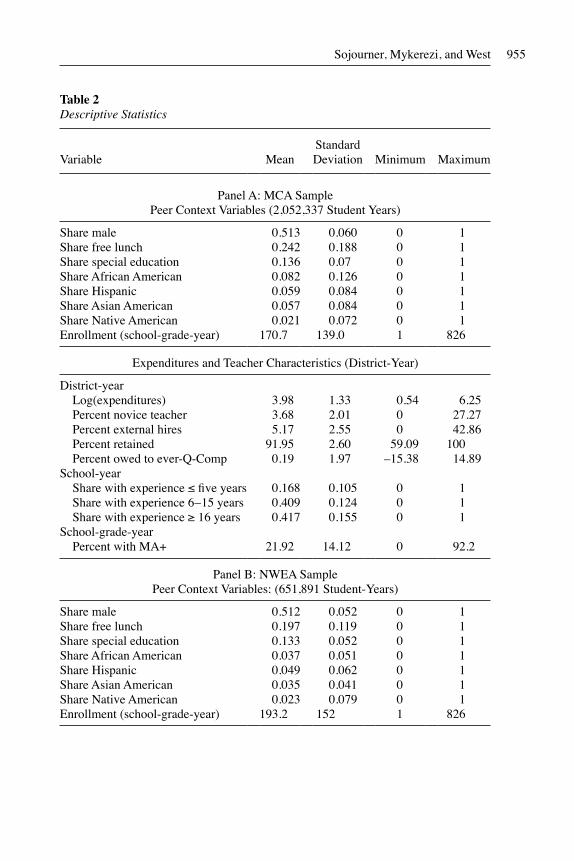
Table 2Descriptive Statistics
Variable Mean Standard Deviation Minimum Maximum
Panel A: MCA SamplePeer Context Variables (2,052,337 Student Years)
Share male 0.513 0.060 0 1Share free lunch 0.242 0.188 0 1Share special education 0.136 0.07 0 1Share African American 0.082 0.126 0 1Share Hispanic 0.059 0.084 0 1Share Asian American 0.057 0.084 0 1Share Native American 0.021 0.072 0 1Enrollment (school- grade- year) 170.7 139.0 1 826
Expenditures and Teacher Characteristics (District- Year)
District- yearLog(expenditures) 3.98 1.33 0.54 6.25Percent novice teacher 3.68 2.01 0 27.27Percent external hires 5.17 2.55 0 42.86Percent retained 91.95 2.60 59.09 100Percent owed to ever- Q- Comp 0.19 1.97 –15.38 14.89
School- yearShare with experience ≤ fi ve years 0.168 0.105 0 1Share with experience 6–15 years 0.409 0.124 0 1Share with experience ≥ 16 years 0.417 0.155 0 1
School- grade- yearPercent with MA+ 21.92 14.12 0 92.2
Panel B: NWEA SamplePeer Context Variables: (651,891 Student- Years)
Share male 0.512 0.052 0 1Share free lunch 0.197 0.119 0 1Share special education 0.133 0.052 0 1Share African American 0.037 0.051 0 1Share Hispanic 0.049 0.062 0 1Share Asian American 0.035 0.041 0 1Share Native American 0.023 0.079 0 1Enrollment (school- grade- year) 193.2 152 1 826

The Journal of Human Resources956
(2) Cov[Qdt, εit | wsgt, 1i, 1t] ≡ 0
Within the restrictions of functional form, this model yields unbiased estimates of reform effects if selection into Q- Comp is based on stable differences in students’ achievement levels. If, for instance, districts with higher student achievement lev-els are more likely to adopt or to adopt earlier than districts with lower levels, this is not a problem. The crucial condition is that within- student, time- varying, unob-served influences on scores are not systematically related to whether or when a district adopted Q- Comp.
As a preliminary test of this condition, we estimate a hazard model of Q- Comp adoption. The model predicts whether any district adopts Q- Comp in each year t = 2005, 2006 . . . 2010. Districts apply in t − 1 to adopt in t. Changes in each district’s average math and reading achievement leading into t − 1—that is, the difference be-tween average achievement in t − 2 and t − 1—are the main predictors of interest. Additional predictors are districts’ t − 1 levels of average math and reading achieve-ment, student demographics, teacher characteristics, and indicators of the districts’ fixed MDE region. Neither achievement changes nor levels significantly predict adop-tion (Table A1; note: all appendixes can be found online at http://jhr.uwpress.org/), evidence consistent with the identifying condition.
B. Average Effects on Student Achievement
The HRM reforms spurred by Q- Comp adoption are estimated to raise average reading achievement by about 3 percent of a standard deviation on the state- mandated MCA test. Table 3 presents estimates of Equation 1. As reported in Column 1 under Specification A, this analysis estimates �̂ (SE) of 0.031 (0.015), implying a 3.1 percent of σ increase in students’ MCA reading achievement in years after Q- Comp adoption compared to years before, adjusting for the changes that occurred in districts that did not adopt across the same time span. The effect’s 95 percent confidence interval ranges from 0.002 to 0.060 σ. Coeffi cients on all peer covariates are as expected, except the positive coeffi cient on the share of students eligible for free lunch.10
However, estimates of β would be biased if districts select into participation based on fluctuations in student achievement levels. For example, if a district is more likely to adopt in a year when its students’ scores would rise for other reasons than in a year when they would fall, this would violate the identifying condition and bias estimated effects upward.
Exploiting the fact that pre- adoption data are available, we perform a falsification test by testing directly for the presence of differential trends among nonadopters and future adopters prior to adoption. In Specification B, the coeffi cient on 1(2+ pre- adoption)dt tests for unexplained pre- adoption differences in outcomes between adopt-ers and nonadopters and, thereby, provides a falsification test of the parallel trends condition necessary for identification. If the coeffi cient on the pre- adoption indicator differs from zero, it would appear that Q- Comp has an effect on achievement before it is implemented. As this is not possible, it would suggest that adopters were experienc-
10. Net of peers’ race/ethnicity, more low- income peers appears to increase achievement, perhaps because some school funding increases with low- income share. The effect of share eligible for free lunch changes to negative if racial/ethnic shares are excluded from the regression.

Sojourner, Mykerezi, and West 957
Tabl
e 3
Eff
ect o
f P4P
- Cen
tere
d H
RM
Ref
orm
on
Stud
ent A
chie
vem
ent z
- Sco
re b
y Su
bjec
t and
Tes
t
Out
com
e Su
bjec
t
Rea
ding
Mat
h
Out
com
e Te
stM
CA
NW
EA
MC
AN
WE
A
Spec
ifi ca
tion
A
B
A
B
A
B
A
B
1(po
st- a
dopt
ion)
0.03
1**
0.02
8**
0.03
2**
0.03
2**
0.00
4–0
.004
0.03
80.
035*
(0.0
15)
(0.0
12)
(0.0
16)
(0.0
12)
(0.0
21)
(0.0
17)
(0.0
26)
(0.0
20)
1(2+
yea
rs p
re- Q
- Com
p)–0
.010
0.
001
–0.0
26–0
.009
(0.0
18)
(0.0
17)
(0.0
19)
(0.0
29)
Shar
e m
ale
–0.0
83**
*–0
.083
***
–0.0
57–0
.057
–0.1
34**
*–0
.134
***
–0.1
21**
–0.1
21**
(0.0
29)
(0.0
29)
(0.0
52)
(0.0
52)
(0.0
38)
(0.0
38)
(0.0
61)
(0.0
61)
Shar
e fr
ee lu
nch
0.10
4***
0.10
3***
0.02
90.
029
0.10
4***
0.10
0***
0.04
50.
044
(0.0
36)
(0.0
36)
(0.0
47)
(0.0
47)
(0.0
34)
(0.0
33)
(0.0
66)
(0.0
65)
Shar
e sp
ecia
l edu
catio
n –0
.046
–0.0
460.
132*
0.13
3**
–0.2
09**
*–0
.211
***
0.09
70.
095
(0.0
40)
(0.0
40)
(0.0
67)
(0.0
67)
(0.0
71)
(0.0
72)
(0.0
80)
(0.0
80)
Shar
e A
fric
an A
mer
ican
–0
.143
***
–0.1
42**
*–0
.001
–0.0
01–0
.095
***
–0.0
92**
*–0
.154
–0.1
51(0
.030
) (0
.030
)(0
.088
)(0
.088
)(0
.030
)(0
.030
)(0
.113
)(0
.111
)Sh
are
His
pani
c –0
.075
*–0
.076
*–0
.102
–0.1
02–0
.007
–0.0
08–0
.084
–0.0
87(0
.043
) (0
.043
)(0
.108
)(0
.108
)(0
.045
)(0
.046
)(0
.109
)(0
.111
)
(con
tinu
ed)

The Journal of Human Resources958
Tabl
e 3
(con
tinu
ed)
Out
com
e Su
bjec
t
Rea
ding
Mat
h
Out
com
e Te
stM
CA
NW
EA
MC
AN
WE
A
Spec
ifi ca
tion
A
B
A
B
A
B
A
B
Shar
e A
sian
Am
eric
an
0.02
10.
021
0.08
60.
086
0.06
80.
068
0.00
90.
010
(0.0
46)
(0.0
45)
(0.1
49)
(0.1
49)
(0.0
43)
(0.0
42)
(0.1
71)
(0.1
72)
Shar
e N
ativ
e A
mer
ican
–0
.131
***
–0.1
31**
*0.
028
0.02
9–0
.050
–0
.052
0.01
60.
016
(0.0
50)
(0.0
50)
(0.0
63)
(0.0
64)
(0.0
52)
(0.0
53)
(0.0
93)
(0.0
94)
Enr
ollm
ent
–0.0
04–0
.005
0.00
50.
005
–0.0
11–0
.012
–0.0
10–0
.010
(0.0
06)
(0.0
06)
(0.0
08)
(0.0
08)
(0.0
08)
(0.0
08)
(0.0
09)
(0.0
09)
Dis
tric
ts
369
369
273
273
369
369
273
273
Stud
ents
69
6,97
069
6,97
024
7,02
624
7,02
668
6,48
368
6,48
324
7,76
724
7,76
7St
uden
t- ye
ars
2,05
2,33
72,
052,
337
651,
891
651,
891
2,00
7,02
92,
007,
029
655,
341
655,
341
Adj
uste
d R
2
0.77
4
0.77
4
0.79
3
0.79
3
0.79
3
0.79
3
0.83
8
0.83
8
Not
es: C
oeffi
cie
nt (w
ithin
- dis
tric
t SE
). S
ignifi c
ance
: *: 1
0 pe
rcen
t **:
5 p
erce
nt *
**: 1
per
cent
. All
spec
ifi ca
tions
incl
ude
year
indi
cato
rs, s
tude
nt fi
xed
effe
cts,
and
an
indi
cato
r fo
r ha
ving
dro
pped
Q- C
omp.
Cov
aria
tes
are
mea
sure
d in
stu
dent
’s s
choo
l- gr
ade-
year
.
Sojourner, Mykerezi, and West 959
ing systematically different trends than nonadopters. The estimated coeffi cient –0.010 (0.018) is evidence that there were no systematic differences in reading achievement trends in adopting districts in the years leading up to adoption, supporting the validity of the identifying condition.
We next estimate the same models using NWEA, rather than MCA, scores as out-comes. The MCA and NWEA both have many strengths. Both are student panels cov-ering hundreds of thousands of Minnesota students in math and reading. Both cover multiple years prior to and subsequent to program adoption and both cover many districts that adopted Q- Comp, many that applied but failed to adopt, and many that never applied for Q- Comp, allowing falsification tests. They complement each other well. Where one is weak, the other is strong. While the MCA was revised from Ver-sion I to Version II in 2005, the NWEA was stable throughout.11 While the NWEA covers only students whose districts chose to test them, the MCA covers all students. Table 1’s Panel B reports by year how many districts used the NWEA and how many students took it.12
Comparison of estimated effects and pre- adoption trends between the MCA and NWEA is useful for two main reasons. First, NWEA provides a second falsification test for the identifying condition that adoption is exogeneous to achievement trends and one that is not subject to the possibility of a spurious null due to the 2005 MCA- revision. Second, comparison of effects in the MCA and NWEA offers evidence on the extent to which any apparent effect reflects real gains to reading skill rather than simply efforts to “teach to the test.” The comparison yields evidence on the generaliz-ability of learning (Neal 2011). To make the NWEA analysis as parallel as possible to the MCA analysis, we use NWEA spring achievement scores for Grades 3–8 for academic years starting 2003–2009 standardized within grade- subject using national student norms (Hauser and Kingsbury 2008).13
Q- Comp participation is estimated to raise NWEA reading achievement by 0.032 (0.016) σ (Table 3, Column 3). The falsification test in Specification B shows that the timing of Q- Comp adoption is uncorrelated with pre- adoption NWEA reading trends
11. We use three strategies to deal with the MCA revision in the year of Q- Comp’s start. First, converting to z- scores within grade- year- subject helps ensure the test’s units are comparable across versions. Second, we explore whether year- to- year correlation in MCA achievement within student is different across the version- transition year than across other years. If the correlation between Versions I and II were much weaker than the year- to- year correlation within version, this could weaken our ability to test for differential trends in unobservable influences on achievement between adopters and non- adopters. We find that the within- student, year- to- year correlation between the MCA- I and MCA- II is substantially equivalent to the correlation across two years of MCA- II, suggesting the revision is not an issue in testing for differential pre- adoption trends. To test for differential year- to- year correlation, we regress each student MCA score on its lag, an indicator that the lag score is MCA- I (rather than MCA- II), and the interaction of the lag score and the MCA- I indicator. For reading, the estimated coeffi cients are 0.787 (0.001) on the lag score and –0.006 (0.002) on the interaction term. The MCA- I to MCA- II correlation is not meaningfully different than the MCA- II to MCA- II correla-tion, though the estimate is very precise and so statistically significant. For math, the corresponding estimates are 0.819 (0.001) and –0.023 (0.002), also evidence of very high correlation across versions. Third, we bring in evidence from the NWEA, a single version of which spans the period. 12. Table 2 allows comparison of the NWEA sample’s (school- grade- year peer) demographics to those for the statewide MCA sample. They are broadly similar, with the NWEA sample slightly higher- income and more white. Our models include student fi xed effects and these measures of peer characteristics.13. NWEA test dates are not state- mandated and vary somewhat across districts. We include elapsed days between NWEA spring and fall tests in all NWEA models.

The Journal of Human Resources960
(Column 4). Though the NWEA sample contains only about 32 percent of student- years from the MCA sample and is a nonrandom subsample selected by the districts, results on reading achievement are remarkably consistent across the MCA and NWEA.
Analogous results for math achievement are presented in the right side of Table 3. The estimated effect of Q- Comp participation on MCA math achievement is 0.004 (0.021) σ and NWEA math is 0.038 (0.026) σ. The 95 percent confidence interval for the MCA ranges between –0.04 and 0.04 σ and, for the NWEA, between –0.013 and 0.088 σ. These estimates are consistent with a null effect or a true effect similar to that estimated for reading. Importantly for the credibility of the design, the falsification tests for math come back clean using both the MCA and NWEA.
In sum, the estimates in Table 3 suggest three main points. First, the fact and tim-ing of adoption appear uncorrelated with pre- adoption achievement trends. Second, reform is estimated to raise achievement by about 3 percent of a standard deviation in reading, with 95 percent confidence intervals from just above zero up to just above 6 percent of a standard deviation. Third, the estimated effect on math achievement is more ambiguous and less precise.
C. Dynamics of Effects
Next, we estimate models that allow the effect of Q- Comp partici pation to differ depending on the number of years elapsed relative to Q- Comp adoption. The post-adoption indicator is replaced with a set of indicators for the first year postadoption, the second year postadoption, etc. By replacing the single indicator for any year two or more pre- adoption with indicators for each pre- adoption lead, more refined falsification testing is also possible. As in Specification B, the year immediately prior to adoption is omitted.
Table 4 shows the effect of Q- Comp participation on student achievement by years elapsed relative to Q- Comp adoption. The four columns of results correspond to ef-fects on reading as measured by the MCA and NWEA and math on the same two tests. Point estimates and 95 percent confidence intervals are graphed in the four panels of Figure 1.14 The postadoption effect estimates suggest that, in reading, the effect started small and grew. Districts that were in their first year of Q- Comp adoption saw their MCA reading scores increase by an average of 0.023 (0.011) σ above the prior year more than never- adopting districts did over the same two years. By the fourth year after adoption, the estimated effect is 0.076 (0.025) σ. Results are similar for NWEA reading achievement where the first- year effect estimate is 0.020 (0.010) σ and the fourth- year effect estimate is 0.062 (0.027) σ. Effect estimates for math are mixed across tests as before. Regarding falsification, soon- to- adopt districts are not experi-encing systematically different achievement trends compared to districts that are not adopting over the same interval, as all coeffi cients for leads are small and insignificant (Table 4, Figure 1).
14. In the Table 4 results, the effect of the fi nal lag is identifi ed off of a single cohort so that lag is confounded with a cohort. As coeffi cients are similar across the fi nal two lags, the fi gure presents estimates where the fi nal two postadoption years are pooled, which avoids confounding and improves precision.

Sojourner, Mykerezi, and West 961
Table 4 Effect of P4P- Centered HRM Reform on Achievement by Years Elapsed from Adoption
Outcome Subject
Reading Math
Outcome Test MCA NWEA MCA NWEA
7th year prior –0.013 0.012 –0.040 0.111**(0.077) (0.058) (0.093) (0.055)
6th year prior –0.053 –0.013 –0.040 0.038(0.049) (0.045) (0.065) (0.045)
5th year prior –0.024 –0.004 –0.050 0.032(0.052) (0.033) (0.046) (0.033)
4th year prior –0.021 –0.017 –0.005 –0.010(0.036) (0.028) (0.051) (0.036)
3rd year prior –0.019 –0.003 –0.039 –0.025(0.023) (0.025) (0.030) (0.046)
2nd year prior –0.007 0.001 –0.022* –0.009(0.016) (0.015) (0.013) (0.021)
1st year prior omitted1st year postadoption 0.023** 0.020** –0.002 0.027
(0.011) (0.010) (0.014) (0.018)2nd year postadoption 0.021 0.042*** –0.006 0.043*
(0.015) (0.015) (0.021) (0.024)3rd year postadoption 0.041** 0.063** –0.009 0.031
(0.020) (0.027) (0.027) (0.036)4th year postadoption 0.076*** 0.069** 0.002 0.038
(0.025) (0.034) (0.030) (0.052)5th year postadoption 0.079** 0.023
(0.035) (0.056)
Districts 369 273 369 273Students 696,970 247,026 686,483 247,767Student- years 2,052,337 651,891 2,007,029 655,341Adjusted R2 0.774 0.793 0.793 0.838
Notes: Coeffi cient (within- district SE). Signifi cance: *: 10 percent **: 5 percent ***: 1 percent. Specifi cation includes year indicators, student fi xed effects, peer covariates, and indicator for having dropped Q- Comp as in Table 3. Outcomes are in standard deviation units. There is no fi fth- year postadoption effect for NWEA achievement because none of the 2004 TAP adoption cohort opted into NWEA testing.

The Journal of Human Resources962
Figure 1Effects of P4P-centered HRM reform on reading and math achievement as measured by the MCA and NWEA tests by years elapsed to adoption. These are point estimates and 95% confi dence intervals from estimates in Table 4. All outcomes are in standard deviation units.
D. Teaching- to- the- Test or Generalizable Skills?
Within the range of state- permitted policies and in agreement with the teachers’ local union, Q- Comp districts have flexibility to choose the performance standards that trig-ger payment of Q- Comp bonuses to teachers. The apparent congruence of Q- Comp’s reading effects across the MCA and NWEA could result from teaching to different high- stakes tests in different districts rather than real increases in students’ reading skill.15
15. Consider this extreme example. Suppose half of Q- Comp districts tie stakes to the MCA reading test and the other half tie to the NWEA reading test. Each district produces 0.06 σ gains on the high- stakes test purely by teaching to that test while producing no skill gain and, consequently, no effect on the other test. This would show up as a 0.03 σ effect on both tests, as in Table 3, but without any real learning. Neal (2011) explains the idea this way: “ ‘Suppose that in every period, the fifth grade students in this district had also taken a
Sojourner, Mykerezi, and West 963
To assess this possibility, we use a pair of indicators for whether the MCA and/or NWEA is named as a high- stakes test in determining award of school- wide student achieve ment bonuses, the only kind of performance bonus consistently tied to student standardized achievement tests. These are also intended as proxies for the relative emphasis each test re ceives within the school. Whether these bonuses are tied to MCA and/or NWEA outcomes varies across districts and, in some districts, varies across schools and grades. In contrast, previous literature on the generalizability of achieve-ment gains produced by P4P- centered HRM reform use variation in outcomes and stakes at the state- year level (Koretz et al. 1996; Vigdor 2009). Here, within state- year, we can hold the achievement test fixed and use variation in stakes across district- grades.16
There is no evidence that larger gains appear on the higher- stakes test (Table A2). For reference, Column 1 reproduces the Specification A result reported earlier (Table 3, Column 1). The second column adds an indicator of the MCA being a high- stakes test for schoolwide bonuses in a student’s school- grade- year. The estimated coeffi cient on this indicator for reading is –0.004 (0.02) σ and including it leaves the estimated Q- Comp effect, now referring to the Q- Comp effect among districts that do not tie schoolwide bonuses to the MCA, basically unchanged. The NWEA results are very similar (Table A2, Column 4). The effect of Q- Comp participation on NWEA reading achievement among school grades that do not tie schoolwide bonuses to the NWEA is 0.031 (0.021) σ and no different among school grades that tie to the NWEA. Taken together, this provides further evidence that the estimated effect represents generalized gains in reading skill.17
The bottom panel presents analogous results for math. Again, there are no significant differences in achievement changes between students in Q- Comp school grades tak-ing tests with school- wide bonuses attached compared to students in Q- Comp school grades taking tests without school- wide bonuses attached. The difference in estimated math effects between the MCA and NWEA does not appear to be driven by teaching to a specific test. The fact that most teacher bonuses are tied to classroom observations or individually negotiated performance standards, rather than to standardized test scores, may explain this null result and does give assurance that any achievement effects are not driven by teaching- to- the- test.
E. Robustness and Additional Falsification
Most Minnesota districts never adopted or applied to Q- Comp. The previous analysis included students in never- adopting districts to help identify the counterfactual time trends and peer effects. This generated evidence that estimated reform “effects” prior
second math assessment, B, and teachers were not rewarded or punished as a result of student outcomes on assessment B. Would one have observed gains on assessment B following the introduction of incentive pay that were comparable to the gains observed on assessment A?’ In sum, do gains measured on the assessments used to determine incentive payments reflect increases in skill that create general improvements in math assessment results or only improvements specific to one assessment format or a particular set of questions?” 16. Among districts ever adopting Q- Comp, 54 (23) percent of the post- adoption MCA sample comes from school- grades where school- wide bonuses are tied to MCA (NWEA) performance. Some tie to both or nei-ther.17. This is evidence against teaching to a specifi c test within subject. It does not rule out the possibility that the curriculum narrowed to focus on tested skills to the detriment of nontested skills and subjects.
The Journal of Human Resources964
to adoption were zero, meaning that adopting and nonadopting districts were not ex-periencing differential achievement trends leading up to adoption. This section reports additional robustness tests.
We first restrict the sample to observations only in districts that adopt and then to those only in districts that apply. We estimate the reform effects and the pre- adoption placebo “effects” in both the adopters- only and the appliers- only subsamples using the same Specification B as in Table 3. The MCA sample includes students from the 81 adopting and the 102 applying districts (Table 5, Columns 1 and 2). The estimates of Q- Comp adoption effects on MCA reading are 0.012 (0.015) σ among adopters- only and 0.018 (0.013) σ among appliers- only, which are both smaller in magnitude and less precise than the 0.028 (0.012) σ estimate obtained from the corresponding full- sample analysis (Table 3). These estimates are not statistically distinguishable either from zero or from the full- sample estimate. The estimates for NWEA reading are 0.019 (0.015) σ among adopters- only and 0.023 (0.014) σ among appliers- only. Evidence of a reading effect is weaker in the adopters- only and appliers- only samples than in the full sample.
In addition, we estimate placebo failed- application “effects” along with effect of adoption in the full sample. This is similar to dropping never- appliers from the sample but is superior in that it exploits information on the timing of failed applications. If the crucial selection process creating bias divides never- appliers from appliers and what produces gains was district management’s desire for reform (proxied by application) rather than policy reform itself, then we would see a positive failed- application “ef-fect” similar to the effect of adoption. On both reading tests, failed applications appear to have no effect (Table 5, Columns 3 and 6), evidence that the effects are not driven solely by district motivation but that reform itself matters. Also, there is evidence that failed appliers experience no differential pre- application trends compared to never- appliers.
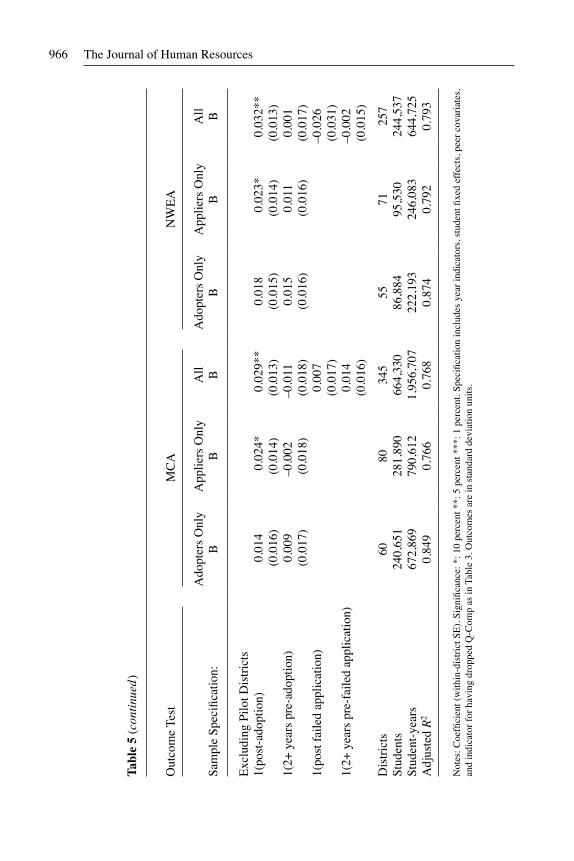
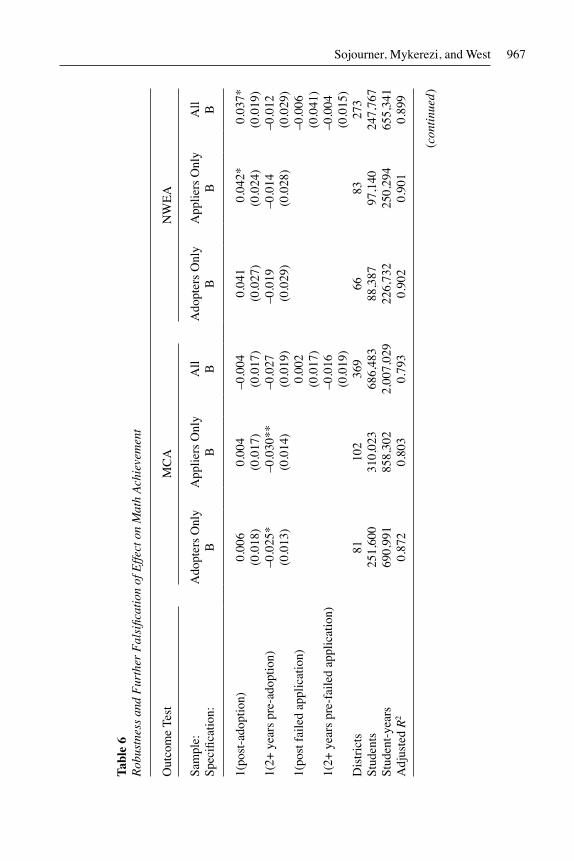
Another source of potential bias is the pilot districts. We have used a conservative coding rule in the primary analysis.18 Because there is room for judgment in how to treat these districts, we repeat the robustness and falsification tests excluding pilot dis-tricts from the sample (Table 5, bottom panel). Excluding pilots, the positive effect of Q- Comp on MCA reading scores in the appliers- only sample moves from insignificant to marginally significant. We repeat the robustness analysis for math achievement and find the results very stable. For math, estimated effects in the adopters- only and applier- only samples (Table 6, Columns 1, 2, 4, 5) look similar to those from the full sample (Table 3). Coeffi cients on the pre- adoption indicator in MCA math in the adopters- only and appliers- only samples are similar in magnitude to the full- sample results but become marginally significant, giving some weak evidence that adopting districts were more likely to adopt when their MCA math scores were improving. In math, as in reading, there is no evidence of a placebo “failed- application” effect (Table 6, Columns 3 and 6). Also, excluding pilots does not change results (bottom panel).
18. As discussed in Section II, the five pilot districts had elements of P4P- centered HRM policies in place throughout the entire 2003–2009 study period. Three of them applied and qualified for Q- Comp in 2005. We code them as adopting that year, though this represents a smaller change in policy than nonpilot adopters experienced. The other districts stuck with the pilot program and ran a light version of Q- Comp throughout. We code them as never appliers though they adopted some P4P- centered HRM reform in 2003.

Sojourner, Mykerezi, and West 965
Tabl
e 5
Rob
ustn
ess
and
Fur
ther
Fal
sifi c
atio
n of
Eff
ect o
n R
eadi
ng A
chie
vem
ent
Out
com
e Te
stM
CA
NW
EA
Sam
ple
Spec
ifi ca
tion:
A
dopt
ers
Onl
yB
A
pplie
rs O
nly
B
All B
A
dopt
ers
Onl
yB
A
pplie
rs O
nly
B
All B
1(po
st- a
dopt
ion)
0.
012
0.01
90.
028*
*0.
019
0.02
4*0.
032*
**(0
.015
)(0
.013
)(0
.012
)(0
.015
)(0
.013
)(0
.012
)1(
2+ y
ears
pre
- ado
ptio
n)
0.00
90.
006
–0.0
110.
015
0.01
20.
001
(0.0
17)
(0.0
19)
(0.0
18)
(0.0
16)
(0.0
16)
(0.0
18)
1(po
st f
aile
d ap
plic
atio
n)
0.00
7–0
.032
(0.0
14)
(0.0
33)
1(2+
yea
rs p
re- f
aile
d ap
plic
atio
n)
–0.0
25–0
.001
(0.0
28)
(0.0
15)
Dis
tric
ts
8110
236
966
8327
3St
uden
ts
257,
039
316,
250
696,
970
88,0
1696
,790
247,
026
Stud
ent-
year
s 70
7,95
888
0,41
22,
052,
337
225,
397
249,
446
651,
891
Adj
uste
d R
2 0.
857
0.78
10.
774
0.87
40.
792
0.79
3
(con
tinu
ed)
The Journal of Human Resources966
Tabl
e 5
(con
tinu
ed)
Out
com
e Te
stM
CA
NW
EA
Sam
ple
Spec
ifi ca
tion:
A
dopt
ers
Onl
yB
A
pplie
rs O
nly
B
All B
A
dopt
ers
Onl
yB
A
pplie
rs O
nly
B
All B
Exc
ludi
ng P
ilot D
istr
icts
1(po
st- a
dopt
ion)
0.
014
0.02
4*0.
029*
*0.
018
0.02
3*0.
032*
*(0
.016
)(0
.014
)(0
.013
)(0
.015
)(0
.014
)(0
.013
)1(
2+ y
ears
pre
- ado
ptio
n)
0.00
9–0
.002
–0.0
110.
015
0.01
10.
001
(0.0
17)
(0.0
18)
(0.0
18)
(0.0
16)
(0.0
16)
(0.0
17)
1(po
st f
aile
d ap
plic
atio
n)0.
007
–0.0
26(0
.017
)(0
.031
)1(
2+ y
ears
pre
- fai
led
appl
icat
ion)
0.
014
–0.0
02(0
.016
)(0
.015
)
Dis
tric
ts
6080
345
5571
257
Stud
ents
24
0,65
128
1,89
066
4,33
086
,884
95,5
3024
4,53
7St
uden
t- ye
ars
672,
869
790,
612
1,95
6,70
722
2,19
324
6,08
364
4,72
5A
djus
ted
R2
0.
849
0.
766
0.
768
0.
874
0.
792
0.
793
Not
es: C
oeffi
cie
nt (
with
in- d
istr
ict S
E).
Sig
nifi c
ance
: *: 1
0 pe
rcen
t **:
5 p
erce
nt *
**: 1
per
cent
. Spe
cifi c
atio
n in
clud
es y
ear
indi
cato
rs, s
tude
nt fi
xed
effe
cts,
pee
r co
vari
ates
, an
d in
dica
tor
for
havi
ng d
ropp
ed Q
- Com
p as
in T
able
3. O
utco
mes
are
in s
tand
ard
devi
atio
n un
its.
Sojourner, Mykerezi, and West 967
Tabl
e 6
Rob
ustn
ess
and
Fur
ther
Fal
sifi c
atio
n of
Eff
ect o
n M
ath
Ach
ieve
men
t
Out
com
e Te
st
MC
AN
WE
A
Sam
ple:
Sp
ecifi
catio
n:A
dopt
ers
Onl
yB
A
pplie
rs O
nly
B
All B
A
dopt
ers
Onl
yB
A
pplie
rs O
nly
B
All B
1(po
st- a
dopt
ion)
0.
006
0.00
4–0
.004
0.04
10.
042*
0.03
7*(0
.018
) (0
.017
)(0
.017
)(0
.027
)(0
.024
)(0
.019
)1(
2+ y
ears
pre
- ado
ptio
n)
–0.0
25*
–0.0
30**
–0.0
27–0
.019
–0.0
14–0
.012
(0.0
13)
(0.0
14)
(0.0
19)
(0.0
29)
(0.0
28)
(0.0
29)
1(po
st f
aile
d ap
plic
atio
n)
0.00
2 –0
.006
(0.0
17)
(0.0
41)
1(2+
yea
rs p
re- f
aile
d ap
plic
atio
n)
–0.0
16
–0.0
04(0
.019
) (0
.015
)D
istr
icts
81
102
369
6683
273
Stud
ents
25
1,60
0 31
0,02
368
6,48
388
,387
97,1
4024
7,76
7St
uden
t- ye
ars
690,
991
858,
302
2,00
7,02
922
6,73
225
0,29
465
5,34
1A
djus
ted
R2
0.87
2 0.
803
0.79
30.
902
0.90
10.
899
(con
tinu
ed)

The Journal of Human Resources968
Tabl
e 6
(con
tinu
ed)
Out
com
e Te
st
MC
AN
WE
A
Sam
ple:
Sp
ecifi
catio
n:A
dopt
ers
Onl
yB
A
pplie
rs O
nly
B
All B
A
dopt
ers
Onl
yB
A
pplie
rs O
nly
B
All B
Exc
ludi
ng P
ilot D
istr
icts
1(po
stad
optio
n)
0.00
7 0.
007
0.00
080.
041
0.04
*0.
035*
(0.0
19)
(0.0
19)
(0.0
18)
(0.0
27)
(0.0
24)
(0.0
20)
1(2+
yea
rs p
re- a
dopt
ion)
–0
.024
* –0
.027
*–0
.025
–0.0
17–0
.011
–0.0
06(0
.014
) (0
.015
)(0
.019
)(0
.029
)(0
.027
)(0
.029
)1(
post
fai
led
appl
icat
ion)
0.
003
0.01
6(0
.019
) (0
.031
)1(
2+ y
ears
pre
- fai
led
appl
icat
ion)
–0
.024
–0.0
06(0
.033
)(0
.017
)
Dis
tric
ts
6080
345
5571
257
Stud
ents
23
6,39
9 27
7,19
965
5,21
187
,254
95,8
6424
5,27
0St
uden
t- ye
ars
659,
824
775,
176
1,91
8,19
222
3,53
324
6,91
864
8,18
7A
djus
ted
R2
0.
867
0.
793
0.
789
0.
902
0.
839
0.
838
Not
es: C
oeffi
cie
nt (
with
in- d
istr
ict S
E).
Sig
nifi c
ance
: *: 1
0 pe
rcen
t **:
5 p
erce
nt *
**: 1
per
cent
. Spe
cifi c
atio
n in
clud
es y
ear
indi
cato
rs, s
tude
nt fi
xed
effe
cts,
pee
r co
vari
ates
, an
d in
dica
tor
for
havi
ng d
ropp
ed Q
- Com
p as
in T
able
3. O
utco
mes
are
in s
tand
ard
devi
atio
n un
its.

Sojourner, Mykerezi, and West 969
IV. Mechanisms: Students, Money, Teachers, or Efforts
Lazear (2000) posits that P4P adoption might have a positive effect through either changing the composition of the workforce toward higher ability indi-viduals or increasing effort of the incumbent workforce. In education, a third possibil-ity is that parents and students sort themselves differently across districts once P4P is introduced. Here, a fourth possibility is simply that the additional $6,500 per 25 student class in annual funding allowed productive increases in district expenditures, quite apart from teacher pay reform. This section develops evidence on the extent to which changes in districts’ students, teachers, or expenditures matter. Otherwise, ef-fects would appear attributable to changes in the internal operations of the district and efforts from incumbent teachers.
A. New Students
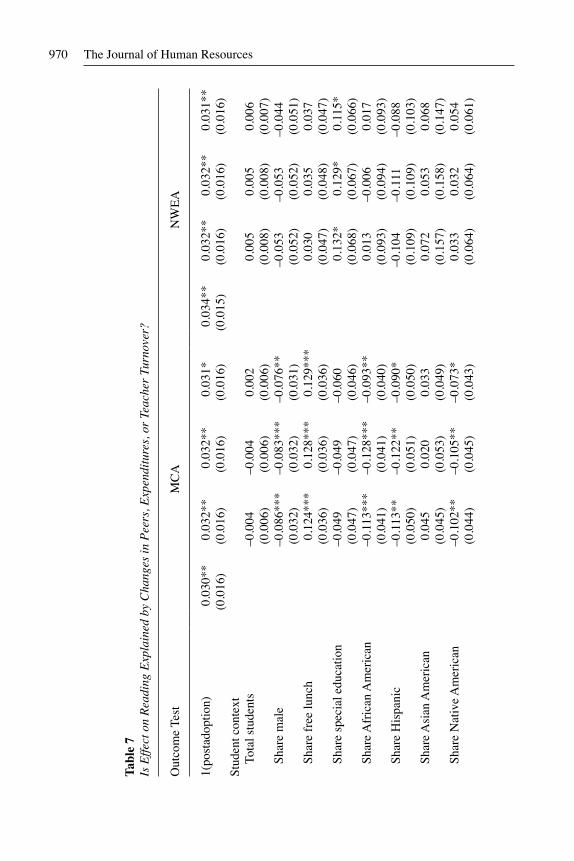
Given mounting evidence that peers matter for student achievement (Hoxby 2000; Whitmore 2005; Graham 2008; Sojourner 2013), it is important to ask whether reform had its effect by triggering changes in student sorting across districts. If so, then effects may be zero- sum, with losses in non- Q- Comp districts offsetting gains in Q- Comp districts. To assess this possibility, we remove peer observables from the conditioning set. As can be seen by comparing the first and second columns of Table 7, this barely changes the estimated effect of Q- Comp participation on MCA reading. Similarly, this change to the conditioning set barely affects the estimated Q- Comp effect on NWEA reading or on either test of math achievement (Table 8). This suggests that changes in student sorting (on observables) across districts are not responsible for the observed effect.
B. New Money
The gains simply could be due to the increased funding that districts receive through Q- Comp participation, rather than to the HRM reforms themselves. Achievement gains may come simply because Q- Comp participation brings additional funding to the district and so the district increases expenditures in a variety of useful ways. Dis-tricts’ budgets increase, not their productivity. If this were true, then effects should be interpreted primarily as the effect of an increase in expenditures rather than of P4P- centered HRM reform. To assess this, we include the log of district- year expenditures as a covariate and see how much of the effect on student achievement this accounts for. Although the effect of additional expenditures appears positive, this does not ac-count for the effect on MCA reading (Table 7). The coeffi cient on 1(postadoption) remains unchanged. Similar results are obtained for NWEA reading (Column 7) and MCA and NWEA math (Table 8).
C. New Teachers or New Efforts?
This leaves the two standard mechanisms by which P4P might raise productivity: shifting the composition of the workforce (sorting) or increasing the productivity of the incumbent workforce (incentives/effort). Any change in district- level productivity,
The Journal of Human Resources970
Tabl
e 7
Is E
ffec
t on
Rea
ding
Exp
lain
ed b
y C
hang
es in
Pee
rs, E
xpen
ditu
res,
or
Teac
her
Turn
over
?
Out
com
e Te
st
MC
A
NW
EA
1(po
stad
optio
n)0.
030*
*0.
032*
*0.
032*
*0.
031*
0.03
4**
0.03
2**
0.03
2**
0.03
1**
(0.0
16)
(0.0
16)
(0.0
16)
(0.0
16)
(0.0
15)
(0.0
16)
(0.0
16)
(0.0
16)
Stud
ent c
onte
xtTo
tal s
tude
nts
–0.0
04–0
.004
0.00
20.
005
0.00
50.
006
(0.0
06)
(0.0
06)
(0.0
06)
(0.0
08)
(0.0
08)
(0.0
07)
Shar
e m
ale
–0.0
86**
*–0
.083
***
–0.0
76**
–0.0
53–0
.053
–0.0
44(0
.032
) (0
.032
)(0
.031
)(0
.052
)(0
.052
)(0
.051
)Sh
are
free
lunc
h 0.
124*
**0.
128*
**0.
129*
**0.
030
0.03
50.
037
(0.0
36)
(0.0
36)
(0.0
36)
(0.0
47)
(0.0
48)
(0.0
47)
Shar
e sp
ecia
l edu
catio
n –0
.049
–0.0
49–0
.060
0.13
2*0.
129*
0.11
5*(0
.047
) (0
.047
)(0
.046
)(0
.068
)(0
.067
)(0
.066
)Sh
are
Afr
ican
Am
eric
an
–0.1
13**
*–0
.128
***
–0.0
93**
0.01
3–0
.006
0.01
7(0
.041
) (0
.041
)(0
.040
)(0
.093
)(0
.094
)(0
.093
)Sh
are
His
pani
c –0
.113
**–0
.122
**–0
.090
*–0
.104
–0.1
11–0
.088
(0.0
50)
(0.0
51)
(0.0
50)
(0.1
09)
(0.1
09)
(0.1
03)
Shar
e A
sian
Am
eric
an
0.04
50.
020
0.03
30.
072
0.05
30.
068
(0.0
45)
(0.0
53)
(0.0
49)
(0.1
57)
(0.1
58)
(0.1
47)
Shar
e N
ativ
e A
mer
ican
–0
.102
**–0
.105
**–0
.073
*0.
033
0.03
20.
054
(0.0
44)
(0.0
45)
(0.0
43)
(0.0
64)
(0.0
64)
(0.0
61)

Sojourner, Mykerezi, and West 971
Fina
nce
Log
(exp
endi
ture
s)
0.01
0*0.
008
0.01
00.
008
(0.0
06)
(0.0
05)
(0.0
06)
(0.0
07)
Teac
hers
Perc
ent n
ovic
es
–0.0
01–0
.000
8(0
.001
) (0
.001
)Pe
rcen
t new
hir
es
–0.0
03**
*–0
.001
(0.0
009)
(0
.001
)Pe
rcen
t to
ever
- Q-
Com
p –0
.001
0.00
1(0
.002
) (0
.002
)Pe
rcen
t ret
aine
d 0.
0006
0.00
06(0
.000
8)
(0.0
01)
Shar
e ≤ fi v
e ye
ars
expe
rien
ce
–0.0
43–0
.057
(0.0
37)
(0.0
49)
Shar
e ≥
16 y
ears
exp
erie
nce
0.12
3***
0.06
1(0
.024
) (0
.038
)Pe
rcen
t with
MA
+
–0.0
007
–0.0
0003
(0.0
009)
(0
.001
)A
djus
ted
R2
0.
768
0.
768
0.
768
0.
768
0.
793
0.
793
0.
793
0.
793
Not
e: C
oeffi
cie
nt (
with
in- d
istr
ict
SE).
Sig
nifi
canc
e: *
: 10
per
cent
**:
5 p
erce
nt *
**:
1 pe
rcen
t. T
hese
are
var
iatio
ns o
n Sp
ecifi
catio
n A
. All
incl
ude
year
ind
icat
ors,
stu
dent
fi x
ed e
ffec
ts, a
nd in
dica
tor
for
havi
ng d
ropp
ed Q
- Com
p. O
utco
mes
are
in s
tand
ard
devi
atio
n un
its. T
he s
ampl
es f
or e
ach
MC
A (
NW
EA
) m
odel
incl
udes
1,9
50,1
63 (
650,
300)
st
uden
t- ye
ars
from
662
,549
(24
6,04
5) s
tude
nts
in 3
45 (
255)
dis
tric
ts.

The Journal of Human Resources972
Tabl
e 8
Is E
ffec
t on
Mat
h E
xpla
ined
by
Cha
nges
in P
eers
, Exp
endi
ture
s, o
r Te
ache
r Tu
rnov
er?
Out
com
e Te
st
MC
A
NW
EA
1(po
stad
optio
n)0.
002
0.00
70.
006
0.00
50.
035
0.03
80.
038
0.03
7(0
.023
) (0
.023
)(0
.023
)(0
.024
)(0
.026
)(0
.027
)(0
.026
)(0
.026
)St
uden
t con
text
Tot
al s
tude
nts
–0.0
11
–0.0
12–0
.004
–0.0
10–0
.010
–0.0
11(0
.008
) (0
.008
)(0
.008
)(0
.009
)(0
.010
)(0
.011
) S
hare
mal
e –0
.131
***
–0.1
28**
*–0
.121
***
–0.1
21**
–0.1
21**
–0.1
14*
(0.0
42)
(0.0
42)
(0.0
41)
(0.0
61)
(0.0
61)
(0.0
61)
Sha
re f
ree
lunc
h 0.
114*
**0.
120*
**0.
118*
**0.
047
0.05
10.
057
(0.0
39)
(0.0
38)
(0.0
38)
(0.0
66)
(0.0
67)
(0.0
67)
Sha
re s
peci
al e
duca
tion
–0.1
84**
–0
.184
***
–0.1
94**
*0.
100
0.09
70.
089
(0.0
72)
(0.0
71)
(0.0
71)
(0.0
81)
(0.0
81)
(0.0
81)
Sha
re A
fric
an A
mer
ican
–0
.084
*–0
.105
**–0
.076
*–0
.149
–0.1
63–0
.163
(0.0
43)
(0.0
44)
(0.0
41)
(0.1
21)
(0.1
22)
(0.1
23)
Sha
re H
ispa
nic
–0.0
67
–0.0
80–0
.051
–0.0
85–0
.091
–0.0
88(0
.061
)(0
.061
)(0
.060
)(0
.110
)(0
.109
)(0
.105
) S
hare
Asi
an A
mer
ican
0.
122*
*0.
088
0.10
1*0.
013
–0.0
020.
0002
(0.0
52)
(0.0
60)
(0.0
56)
(0.1
79)
(0.1
81)
(0.1
73)
Sha
re N
ativ
e A
mer
ican
–0
.044
–0
.047
–0.0
200.
021
0.02
00.
034
(0.0
55)
(0.0
55)
(0.0
55)
(0.0
94)
(0.0
94)
(0.0
92)

Sojourner, Mykerezi, and West 973
Fina
nce
Log
(exp
endi
ture
s)
0.01
3**
0.01
4*0.
008
0.00
6(0
.007
) (0
.007
)(0
.007
)(0
.008
)Te
ache
rs P
erce
nt n
ovic
es
–0.0
02–0
.002
(0.0
02)
(0.0
02)
Per
cent
new
hir
es
–0.0
009
–0.0
02(0
.001
) (0
.001
) P
erce
nt to
eve
r- Q
- Com
p –0
.000
90.
0006
(0.0
02)
(0.0
03)
Per
cent
ret
aine
d –0
.000
30.
001
(0.0
01)
(0.0
01)
Shar
e ≤ fi v
e ye
ars
expe
rien
ce
–0.0
300.
041
(0.0
48)
(0.0
71)
Shar
e ≥
16 y
ears
exp
erie
nce
0.11
0***
0.06
8(0
.031
) (0
.049
)Pe
rcen
t with
MA
+
–0.0
010.
0002
(0.0
01)
(0.0
01)
Adj
uste
d R
2
0.78
8
0.78
8
0.78
8
0.78
8
0.83
8
0.83
8
0.83
8
0.83
8
Not
es: C
oeffi
cie
nt (
with
in- d
istr
ict S
E).
Sig
nifi c
ance
: *: 1
0 pe
rcen
t **:
5 p
erce
nt *
**: 1
per
cent
. The
se a
re v
aria
tions
on
Spec
ifi ca
tion
A. A
ll in
clud
e ye
ar in
dica
tors
, stu
dent
fi x
ed e
ffec
ts, a
nd in
dica
tor
for
havi
ng d
ropp
ed Q
- Com
p. O
utco
mes
are
in s
tand
ard
devi
atio
n un
its. T
he s
ampl
es f
or e
ach
MC
A (
NW
EA
) m
odel
incl
udes
1,9
12,0
21 (
653,
730)
st
uden
t- ye
ars
from
653
,475
(24
6,76
9) s
tude
nts
in 3
45 (
255)
dis
tric
ts.
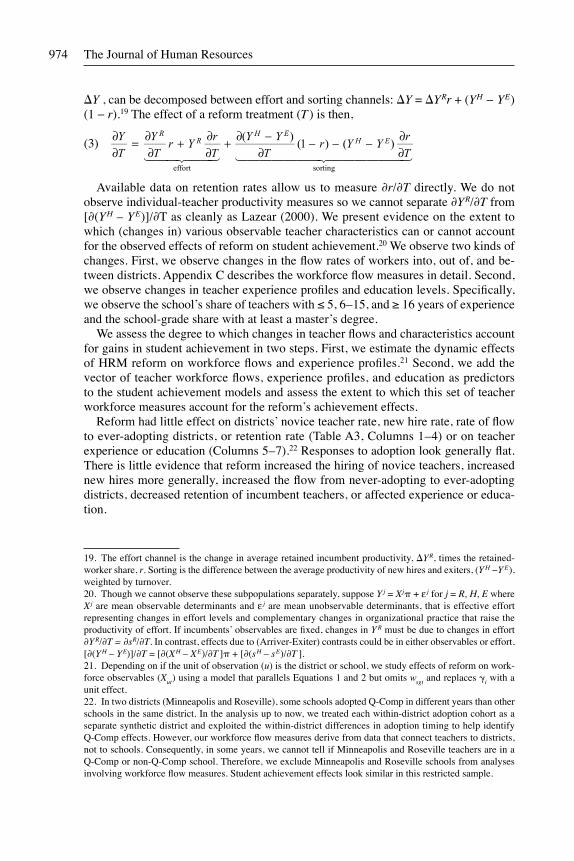
The Journal of Human Resources974
∆Y , can be decomposed between effort and sorting channels: ∆Y = ∆YRr + (YH − YE )(1 − r).19 The effect of a reform treatment (T ) is then,
(3)
∂Y∂T
= ∂Y R
∂Tr + Y R ∂r
∂Teffort
+ ∂(Y H − Y E)∂T
(1 − r) − (Y H − Y E) ∂r∂T
sorting
Available data on retention rates allow us to measure ∂r/∂T directly. We do not observe individual- teacher productivity measures so we cannot separate ∂YR/∂T from [∂(YH – YE)]/∂T as cleanly as Lazear (2000). We present evidence on the extent to which (changes in) various observable teacher characteristics can or cannot account for the observed effects of reform on student achievement.20 We observe two kinds of changes. First, we observe changes in the flow rates of workers into, out of, and be-tween districts. Appendix C describes the workforce flow measures in detail. Second, we observe changes in teacher experience profiles and education levels. Specifically, we observe the school’s share of teachers with ≤ 5, 6–15, and ≥ 16 years of experience and the school- grade share with at least a master’s degree.
We assess the degree to which changes in teacher flows and characteristics account for gains in student achievement in two steps. First, we estimate the dynamic effects of HRM reform on workforce flows and experience profiles.21 Second, we add the vector of teacher workforce flows, experience profiles, and education as predictors to the student achievement models and assess the extent to which this set of teacher workforce measures account for the reform’s achievement effects.
Reform had little effect on districts’ novice teacher rate, new hire rate, rate of flow to ever- adopting districts, or retention rate (Table A3, Columns 1–4) or on teacher experience or education (Columns 5–7).22 Responses to adoption look generally flat. There is little evidence that reform increased the hiring of novice teachers, increased new hires more generally, increased the flow from never- adopting to ever- adopting districts, decreased retention of incumbent teachers, or affected experience or educa-tion.
19. The effort channel is the change in average retained incumbent productivity, ∆YR, times the retained- worker share, r. Sorting is the difference between the average productivity of new hires and exiters, (Y H −Y E), weighted by turnover.20. Though we cannot observe these subpopulations separately, suppose Y j = Xjπ + ε j for j = R, H, E where Xj are mean observable determinants and ε j are mean unobservable determinants, that is effective effort representing changes in effort levels and complementary changes in organizational practice that raise the productivity of effort. If incumbents’ observables are fi xed, changes in Y R must be due to changes in effort ∂Y R/∂T = ∂sR/∂T. In contrast, effects due to (Arriver- Exiter) contrasts could be in either observables or effort, [∂(YH – YE)]/∂T = [∂(XH – XE)/∂T ]π + [∂(sH – sE)/∂T ].21. Depending on if the unit of observation (u) is the district or school, we study effects of reform on work-force observables (Xut) using a model that parallels Equations 1 and 2 but omits wsgt and replaces γi with a unit effect.22. In two districts (Minneapolis and Roseville), some schools adopted Q- Comp in different years than other schools in the same district. In the analysis up to now, we treated each within- district adoption cohort as a separate synthetic district and exploited the within- district differences in adoption timing to help identify Q- Comp effects. However, our workforce fl ow measures derive from data that connect teachers to districts, not to schools. Consequently, in some years, we cannot tell if Minneapolis and Roseville teachers are in a Q- Comp or non- Q- Comp school. Therefore, we exclude Minneapolis and Roseville schools from analyses involving workforce fl ow measures. Student achievement effects look similar in this restricted sample.

Sojourner, Mykerezi, and West 975
To assess more formally whether these might be driving the positive effect of re-form adoption on student achievement, we add this vector of workforce measures to the achievement model. The estimated effect of adoption on MCA reading does not change (Table 7, Column 4). Similar stability is obtained for NWEA reading (Table 7, Column 8) and both tests of math achievement (Table 8, Columns 4 and 8). Both ∂r/∂T and [∂(XH – XE)]/∂T appear to be approximately zero. Changes in flow rates or shares with a given experience or education level do not appear to generate the effects.
Therefore, changes appear due to the combination of changes in effective effort among incumbents ∂sR/∂T and from improvements in effective effort gains from turn-over [∂(sH – sE)]/∂T. Under plausible conditions, the effect of reform through both channels would be most positive among the least- experienced teachers and present it-self as a positive interaction of reform with share of teachers with low experience.23 To investigate this further, we allow for heterogeneity in the effect of reform depending on the share of a school’s teachers in each experience category while also condition-ing on experience- share levels. Estimates are presented in Table 9. For MCA reading (Column 1), the effect of reform is estimated at 0.116 (0.054) for teachers with less than or equal to fi ve years of experience, 0.058 (0.032) for teachers with 5–16 years of experience, and –0.043 (0.027) for teachers with 16+ years of experience. It is also worth noting that, outside of Q- Comp, achievement increases with the share of very experienced teachers, as implied by the significant 0.129 (0.025) effect of share of teachers with 16+ years of experience compared to share with 6–15 years experience. For NWEA reading and both math tests (Columns 2–4), reform effects are not statisti-cally significantly different across experience levels but a similar qualitative pattern appears. This evidence seems to corrobo rate the theoretical prediction of larger posi-tive effects among less- experienced teachers but cannot separate the sorting and effort channels among less- experienced teachers.
Taken together, results suggest that reform produced achievement gains primarily through changes in district policies and effects among less- experienced teachers rather than through changes to student demographics, additional expenditures, workforce flow rates, experience profiles, or increased effort among the most senior teachers.
V. Conclusion
This study exploits large shifts in dozens of Minnesota school districts’ HRM policies towards P4P that occurred since the 2005 introduction of the state’s Q- Comp program. We find that, on average, P4P- centered HRM reform is associated with a 3 percent of a standard deviation increase in student achievement. This shows up on two different reading assessments and on one of two math assessments. Gains were not driven by districts that put higher stakes on a particular subject- test nor are they simply the effect of being motivated enough to apply.
This is some of the strongest evidence yet that teacher pay reform can raise U.S.
23. If P4P- centered HRM reform attracts new hires with higher productivity than exiters and if less- experienced teachers are more likely to churn, this sorting story would show up as a positive interaction of reform with a share of teachers with low experience. P4P- centered reform inspires increased effort and oper-ates most strongly among less- experienced teachers who are less secure in their jobs, less set in their ways, and for whom potential bonuses are a bigger share of compensation.

The Journal of Human Resources976
Table 9 Do Effects Differ by Teacher Experience Levels?
Outcome Subject
Reading Math
Outcome Test MCA NWEA MCA NWEA
1(postadoption)x(Share teachers 1–5 years experience)
0.058 0.004 0.099 0.029
(0.068) (0.087) (0.098) (0.130)1(postadoption) 0.058* 0.057 –0.005 0.041
(0.032) (0.039) (0.046) (0.053)1(postadoption)x(Share teachers
16+ years experience)–0.101** –0.069 –0.028 –0.025
(0.048) (0.051) (0.080) (0.080)Share teachers 1–5 years experience –0.039 –0.061 –0.052 0.026
(0.033) (0.048) (0.044) (0.069)Share school’s teachers with 6–15
years experience omitted
Share teachers with 16+ years experience
0.129*** 0.071* 0.108*** 0.073
(0.025) (0.039) (0.032) (0.050)Districts 369 273 369 273Students 696,843 247,015 686,336 247,756Student- years 2,051,570 651,878 2,006,113 655,326Adjusted R2 0.851 0.872 0.863 0.899
Implied Estimate of 1(Postadoption)Effect for
Teachers with 1–5 years experience 0.116** 0.060 0.094 0.070(0.054) (0.061) (0.071) (0.100)
Teachers with 6–15 years experi-ence
0.058* 0.057 –0.005 0.041
(0.032) (0.039) (0.046) (0.053)Teachers with 16+ years experience –0.043 –0.012 –0.033 0.016 (0.027) (0.029) (0.054) (0.052)
Notes: Coeffi cient (within- district SE). Signifi cance: *: 10 percent **: 5 percent ***: 1 percent. These are variations on Specifi cation A in Table 3. All include year indicators, student fi xed effects, peer covariates, and an indicator for having dropped Q- Comp. Outcomes are in standard deviation units.
Sojourner, Mykerezi, and West 977
teacher productivity and student learning. Prior U.S. field studies that found any positive effects of P4P on achievement used cross- sectional comparisons (Figlio and Kenny 2007), prepost designs (Vigdor 2009), focus on a single district (Ladd 1999), or found that gains appeared only on the high- stakes test and not on a low- stakes one (Koretz 2002). The two largest P4P experiments, each conducted within a single dis-trict over three years or less, found null or negative effects on high- stakes achievement tests (Springer et al. 2010; Fryer 2011).
Because the effect of a given P4P incentive may vary depending on its context, unmeasured heterogeneity in pre- and postadoption contexts might also explain some discrepant results in the literature. Like the present study, most P4P studies in edu-cation really measure the effects of P4P- centered HRM reform as proxied by P4P. Complementary HRM practices are correlated with P4P but not well measured. The fact that Q- Comp changed professional development and evaluation procedures as well as compensation criteria may help explain why it was effective, in contrast to reforms focused exclusively on compensation reform (Springer et al. 2010; Fryer 2011). Despite a limited ability to unbundle which pieces of the reform matter, this study contributes new evidence that adoption of HRM reforms centered on P4P can raise productivity. Alternatively, the difference in results compared to Springer et al. (2010) and Fryer (2011) may be attributable to Q- Comp’s relative permanence and the consequent larger impact on workers’ expectations and willingness to adjust as well as a longer time horizon for outcome measurement. Our results are similar to Lavy (2009), where the introduction of a P4P tournament among Israeli teachers raised stu-dent achievement by changing practice among incumbent teachers without evidence of gaming.
Although the magnitudes of the reforms’ achievement impacts are not large, they appear to be socially productive given their modest costs. The social value of a 20 percent of a standard deviation achievement gain for a kindergarten class has been estimated conservatively at $200,000 in net present value (Krueger 2003; Hanushek 2011; Chetty et al. 2011).24 This implies that the point- estimated 3 percent of a stan-dard deviation achievement gain induced by Q- Comp pay reforms would be worth approximately $30,000 in present value though, given the statistical uncertainty of the estimate, benefits are possibly much lower or higher. In terms of costs, Q- Comp adoption involved an increase in funding of only about $6,500 per year per 25 student class, suggesting a fi ve to one benefit to cost ratio. The true costs of the pay reforms may be greater if districts additionally allocate their own funds to finance bonuses or associated reforms, such as time for teachers to meet in professional learning commu-nities, creation of data and assessment teams, or cadres of trained classroom observ-ers. However, the $4,000 per classroom gap between the new $6,500 in funding and the $2,500 average maximum total bonus leaves Q- Comp districts with significant cushion to cover the cost of complementary administrative reforms without adding additional resources. This suggests that the set of P4P programs funded by Q- Comp are yielding positive social returns.
By studying a long- standing education reform in the field, valuable new insights are gained. First, the reforms studied here have proven politically and operationally fea-
24. Updating Krueger’s most pessimistic estimate of a $5,718 per child benefi t to 2012 dollars and multiply-ing times 25 children per teacher yields an estimate of just over $200,000.

The Journal of Human Resources978
sible. This is not a fragile model program. This is happening at scale, long- term, and with the support of teachers and their unions through a process of labor- management cooperation.25 Second, we provide unique new evidence on workforce flows suggest-ing that unmeasured changes among incumbent teachers and administration drove the achievement gains, rather than teacher turnover. At least with respect to changes to the pay schedule of this magnitude and this time span, P4P did not induce important changes in the observable composition of the teacher workforce. But the fact that effects appeared larger among less- experienced teachers suggests that unobserved productivity changed in this group. As teachers cannot transfer tenure across districts, the lack of mobility across districts may not be surprising. Reforms that facilitate interdistrict mobility of teachers and ease entry into the teacher workforce could be useful complements.
Within the bounds of what the state allowed, we can see what kinds of programs districts chose to adopt and which they did not. Despite theoretical reasons for pre-ferring tournaments where teachers compete for a limited pool of money and where higher- performing teachers are guaranteed to earn more than others (Barlevy and Neal 2012), as well as evidence that tournaments have worked in some settings in Israel (Lavy 2009), no district adopted a tournament. A teacher’s bonus is usually not tied directly to the standardized test scores of his or her own students. The bonuses tied to standardized achievement targets tend to be small, tied to school- wide performance, and paid according to generally very simple schedules.26 We do not observe any dis-tricts that link rewards to “value- added” measures of teacher effectiveness. Thus we cannot comment on the debate over the use of these measures in personnel decisions, except to say that they have not been popular in Minnesota thus far.
Although bonuses are largely tied to local goals and subjective evaluations that appear corruptible, some theories and evidence support this approach. By tying stakes to criteria other than standardized tests, coaching, gaming, and other waste through unproductive hid den action may be avoided. Our findings also echo Marsden and Belfield (2007) and Marsden (2010), which argue from U.K. evidence that P4P can succeed in education when it promotes a process of locally negotiated goal setting. This process of setting goals, when taken seriously by all sides, may harness teach-ers’ local information about the most productive strategies for success better than a centrally defined standard. Also, evidence is emerging from other states that at-taching stakes to a process with regular feedback from classroom observers can pro-duce achievement gains (Taylor and Tyler 2012). Subjective evaluations have been proposed as a potentially important component of P4P for teachers. This is largely based on studies such as Jacob and Lefgren (2008), Rockoff et al. (2011), and Tyler et al. (2010), which show that evaluations are correlated with value added measures of teacher quality. Q- Comp districts also devote resources and attach incentives to teachers meeting regularly in profes sional learning communities and to meeting goals
25. Dillon (2007) wrote, “A major reason [Q Comp] is prospering, Governor Tim Pawlenty said . . . is that union leaders helped develop and sell it to teachers. ‘As a Republican governor, I could say, Thou shalt do this, and the unions would say, Thou shalt go jump in the lake,’ Mr. Pawlenty said. ‘But here they partnered with us. . . . This is a complex process of changing a culture, and it will fail if teachers don’t support it.’ ” 26. Herweg, Müller, and Weinschenk (2010) shows that simple payment schedules may be optimal for loss- averse teachers.

Sojourner, Mykerezi, and West 979
negotiated within those groups, which may constructively harness peer effects among teachers (Jackson and Bruegmann 2009).
Finally, the paper increases understanding of locally designed education reform. Here, the grantor- grantee relationship between education authorities and districts al-lowed use of local information and experimentation in finding appropriate, feasible P4P designs and complementary HRM practices. Grantees may have captured some information or agency rents, but this evidence suggests that the process can generate meaningful social returns.
References
Bandiera, Oriana, Iwan Barankay, and Imran Rasul. 2007. “Incentives for Managers and Inequality Among Workers.” Quarterly Journal of Economics 122(2):729–73.
Barlevy, Gadi, and Derek Neal. 2012. “Pay for Percentile.” American Economic Review 102(5):1805–31.
Bloom, Nicholas, and John Van Reenen. 2011. “Human Resource Management and Productiv-ity.” In Handbook of Labor Economics Volume 4B ed. Orley Ashenfelter and David Card, 1697–763. Amsterdam: North Holland.
Cappelli, Peter, and David Neumark. 2001. “Do “High- Performance” Work Practices Improve Establishment- Level Outcomes?” Industrial and Labor Relations Review 54(4):737–882.
Chetty, Raj, John N. Friedman, Nate Hilger, Emmanuel Saez, Diane Whitmore Schanzenbach, and Danny Yagan. 2011. “How Does Your Kindergarten Classroom Affect Your Earnings?” Quarterly Journal of Economics 126(4):1593–660.
Danielson, Charlotte, and Thomas L. McGreal. 2000. “Teacher Evaluation to Enhance Profes-sional Practice.” Technical Report for the Association for Supervision and Curriculum Development.
Darling- Hammond, Linda, Ruth Chung Wei, Alethea Andree, Nikole Richardson, and Stelios Orphanos. 2009. “Professional Learning in the Learning Profession: A Status Report on Teacher Development in the United States and Abroad.” Technical Report for the National Staff Development Council of Stanford University.
deFiebre, Conrad, Patricia Lopez, and Jean Hopfensperger. 2005. “Legislature 2005 Wrapping Up.” Star Tribune, July 14.
Dillon, Sam. 2007. “Long Reviled, Merit Pay Gains Among Teachers.” The New York Times, June 18.
Figlio, David N., and Lawrence W. Kenny. 2007. “Individual Teacher Incentives and Student Performance.” Journal of Public Economics 91(5):901–14.
Fryer, Roland G. 2011. “Financial Incentives and Student Achievement: Evidence from Ran-domized Trials.” Quarterly Journal of Economics 126(4):1755–98.
Glazerman, Steven, and Allison Seifullah. 2010. “An Evaluation of the Teacher Advancement Program (TAP) in Chicago: Year Two Impact Report.” Washington, D.C.: Mathematica Policy Research, Inc.
Glewwe, Paul, Nauman Ilias, and Michael Kremer. 2010. “Teacher Incentives.” American Economic Journal: Applied Economics 2(3):205–27.
Graham, Bryan S. 2008. “Identifying Social Interactions Through Conditional Variance Restrictions.” Econometrica 76(3):643–60.
Hanushek, Eric A. 2011. “The Economic Value of Higher Teacher Quality.” Economics of Education Review 30(3):466–79.
Hanushek, Eric A., and Ludger Wöessmann. 2011. “Overview of the Symposium on Perfor-mance Pay for Teachers.” Economics of Education Review 30(3):391–93.
The Journal of Human Resources980
Hauser, Carl, and G. Gage Kingsbury. 2008. “RIT Scale Norms: For Use with Measures of Academic Progress.” Technical Report to the Northwest Evaluation Association.
Herweg, Fabian, Daniel Müller, and Philipp Weinschenk. 2010. “Binary Payment Schemes.” American Economic Review 100(5):2451–77.
Hezel Associates. 2009. “Quality Compensation for Teachers Summative Evaluation.” Techni-cal Report prepared for the Minnesota Department of Education.
Holmstrom, Bengt, and Paul Milgrom. 1991. “Multitask Principal–Agent Analyses: Incentive Contracts, Asset Ownership and Job Design.” Journal of Law, Economics, & Organization 7(Special Issue):24–52.
Hord, Shirley M., and Stephanie A. Hirsch. 2008. “Making the Promise a Reality.” In Sustain-ing Professional Learning Communities, ed. Alan M. Blankenstein, Paul D. Houston, and Robert W. Cole, 23–40. Thousand Oaks: Corwin Press.
Hoxby, Caroline M. 2000. “Peer Effects in the Classroom.” NBER Working Paper 7867. Cambridge: National Bureau of Economic Research, Inc.
Ichniowski, Casey, Kathryn Shaw, and Giovanna Prennushi. 1997. “The Effects of Human Resource Management Practices on Productivity: A Study of Steel Finishing Lines.” The American Economic Review 87(3):291–313.
Jackson, C. Kirabo, and Elias Bruegmann. 2009. “Teaching Students and Teaching Each Other: The Importance of Peer Learning for Teachers.” American Economic Journal: Applied Economics 1(4):85–108.
Jacob, Brian A., and Lars Lefgren. 2008. “Can Principals Identify Effective Teachers? Evi-dence on Subjective Performance Evaluation in Education.” Journal of Labor Economics 26(1):101.
Koretz, Daniel M. 2002. “Limitations in the Use of Achievement Tests as Measures of Educa-tors’ Productivity.” Journal of Human Resources 37(4):752–77.
Koretz, Daniel M., Sheila Barron, Karen J. Mitchell, and Brian M. Stecher. 1996. The Perceived Effects of the Kentucky Instructional Results Information System (KIRIS). Santa Monica: RAND Corporation.
Krueger, Alan B. 2003. “Economic Considerations and Class Size.” Economic Journal 113(485):F34–F63.
Ladd, Helen F. 1999. “The Dallas School Accountability and Incentive Program: An Evalua-tion of Its Impacts on Student Outcomes.” Economics of Education Review 18(1):1–16.
Lavy, Victor. 2002. “Evaluating the Effect of Teachers’ Performance Incentives on Pupils’ Achievements.” Journal of Political Economy 110(6):1286–317.
———. 2009. “Performance Pay and Teachers’ Effort, Productivity, and Grading Ethics,” American Economic Review 99(5):1979–2011.
Lazear, Edward P. 2000. “Performance Pay and Productivity.” American Economic Review 90(5):1346–61.
Lovenheim, Michael F. 2009. “The Effect of Teachers’ Unions on Education Production: Evidence from Union Election Certifi cation in Three Midwestern States.” Journal of Labor Economics 27(4)525–87.
Marsden, David. 2010. “The Paradox of Performance- Related Pay Systems.” In Paradoxes of Modernization: Unintended Consequences of Public Policy Reform, ed. Helen Margetts and Christopher Hood, 185–203. Oxford: Oxford University Press.
Marsden, David, and Richard Belfield. 2007. “Pay for Performance Where Output Is Hard to Measure: The Case of Performance Pay for School Teachers.” Advances in Industrial and Labor Relations 15:1–34.
Milgrom, Paul, and John Roberts. 1990. “The Economics of Modern Manufacturing.” Ameri-can Economic Review 80(3):511–28.
Muralidharan, Karthik, and Venkatesh Sundararaman. 2011. “Teacher Performance Pay: Experimental Evidence from India,” Journal of Political Economy 119(1):39–77.

Sojourner, Mykerezi, and West 981
Nadler, Carl, and Matthew Wiswall. 2011. “Risk Aversion and Support for Merit Pay: Theory and Evidence from Minnesota’s Q Comp Program.” Education Finance & Policy 6(1):1–31.
Neal, Derek. 2011. “The Design of Performance Pay in Education,” NBER Working Paper 16710.
Nobels, James. 2009. “Evaluation Report: Q Comp Quality Compensation.” Technical Report for the Minnesota Offi ce of the Legislative Auditor.
Podgursky, Michael J., and Matthew G. Springer. 2007. “Teacher Performance Pay: A Re-view.” Journal of Policy Analysis & Management 26(4):909–50.
Prendergast, Canice. 2002. “The Tenuous Trade- off Between Risk and Incentives.” Journal of Political Economy 110(5):1071–102.
Prentice, Graham, Simon Burgess, and Carol Propper. 2007. “Performance Pay in the Public Sector.” Technical Report, Offi ce of Manpower Economics. Coventry: University of Warwick.
Rockoff, Jonah E., Brian A. Jacob, Thomas J. Kane, and Douglas O. Staiger. 2011. “Can You Recognize an Effective Teacher When You Recruit One?” Education Finance & Policy 6(1):43–74.
Rockoff, Jonah E., Douglas O. Staiger, Thomas J. Kane, and Eric S. Taylor. 2012. “Infor-mation and Employee Evaluation: Evidence from a Randomized Intervention in Public Schools.” American Economic Review 102 (7):3184–213.
Schwartz, Nathaniel. 2012. “Aligning Teacher Improvement Strategies: A Mixed Method Study of Teaching Reform in Minnesota.” PhD dissertation. University of Michigan. http://deepblue.lib.umich.edu/bitstream/2027.42/96100/1/nschwart_1.pdf.
Sojourner, Aaron J. 2013. “Identification of Peer Effects with Missing Data.” Economic Journal 123(569):574–605.
Springer, Matthew G., Dale Ballou, and Art (Xiao) Peng. 2008. “Impact of the Teacher Ad-vancement Program on Student Test Score Gains: Findings from an Independent Appraisal.” Technical Report, National Center on Performance Incentives. Nashville: Vanderbilt University.
Springer, Matthew G., Laura Hamilton, Daniel F. McCaffrey, Dale Ballou, Vi- Nhuan Le, Mat-thew Pepper, J.R. Lockwood, and Brian M. Stecher. 2010. “Teacher Pay for Performance: Experimental Evidence from the Project on Incentives in Teaching.” Technical Report, National Center on Performance Incentives. Nashville: Vanderbilt University.
Taylor, Eric S., and John H. Tyler. 2012. “The Effect of Evaluation on Teacher Performance.” American Economic Review 102(7):3628–51.
Tyler, John H., Eric S. Taylor, Thomas J. Kane, and Amy L. Wooten. 2010. “Using Student Performance Data to Identify Effective Classroom Practices.” American Economic Review 100(2):256–60.
Victory New Hampshire. 2012. “The 60 Second Update with Governor Tim Pawlenty.” http:// 60secondupdates.com/pawlenty/pawlenty–2.
Vigdor, Jacob L. 2009. “Teacher Salary Bonuses in North Carolina.” In Performance Incen-tives: Their Growing Impact on American K–12 Education, ed. Matthew G. Springer, 227–50. Harrisonburg: The Brookings Institution.
Wahlstrom, Kyla, Tim Sheldon, and Kristin Peterson. 2006. “Implementation of the Quality Compensation Program (Q Comp): A Formative Evaluation.” Technical Report, University of Minnesota’s Center for Applied Research and Educational Improvement. Minneapolis: University of Minnesota.
West, Kristine L. 2012. “Teachers Unions, Compensation, and Tenure.” University of Min-nesota Technical Report.
Whitmore, Diane. 2005. “Resource and Peer Impacts on Girls’ Academic Achievement: Evi-dence from a Randomized Experiment.” American Economic Review 95(2):199–203.

Copyright of Journal of Human Resources is the property of University of Wisconsin Pressand its content may not be copied or emailed to multiple sites or posted to a listserv withoutthe copyright holder's express written permission. However, users may print, download, oremail articles for individual use.