teacher resource booklet - welcome to primezone ... resource booklet 3 table of contents 4 welcome 5...
TRANSCRIPT

Engaging students in STEM using AgricultureTeacher Resource Booklet
Produced by the University of Tasmania School of Land and Food
2 Engaging students in STEM using Agriculture
Corresponding Author Dr Joanna JonesSenior Lecturer and Student Outreach CoordinatorSchool of Land and Food, University of TasmaniaPrivate Bag 98, Hobart, TAS 7000+61 3 6226 2557 | [email protected] The following individuals and organisations assisted with the production of this booklet:TIA Communications TeamGrace ConstableDr Steve QuarrellDr Lyndal MellefontAssoc Prof Tom RossSLAF Technical staffAssociate Professor Alistair Gracie
This booklet has been created with the generous support of our industry partners: DairyTasWine AustraliaFruit Growers Tasmania
For further information on our events and activities throughout the year connect with us on www.facebook.com/SLAF.UniversityofTasmania/www.facebook.com/TasInAg/
Further resources and information can be found at www.utas.edu.au/land-foodwww.utas.edu.au/tia
DISCLAIMERWhile the University of Tasmania takes reasonable steps to ensure that the information in this publication is cor-rect, it provides no warranty or guarantee that information is accurate, complete or up-to-date. The University of Tasmania will not be liable for any loss, damage, cost or expense incurred or arising by reason of any person us-ing or relying on the information contained in this publication. No person should act on the basis of the contents of this publication without first obtaining specific, independent, professional advice. The University of Tasmania and contributors to this publication may identify products by proprietary or trade names to help readers identify particular types of products. We do not endorse or recommend the products of any manufacturer referred to. Other products may perform as well or better than the products of the manufacturer referred to. Published by the University of Tasmania, 2017.
Teacher Resource Booklet 3
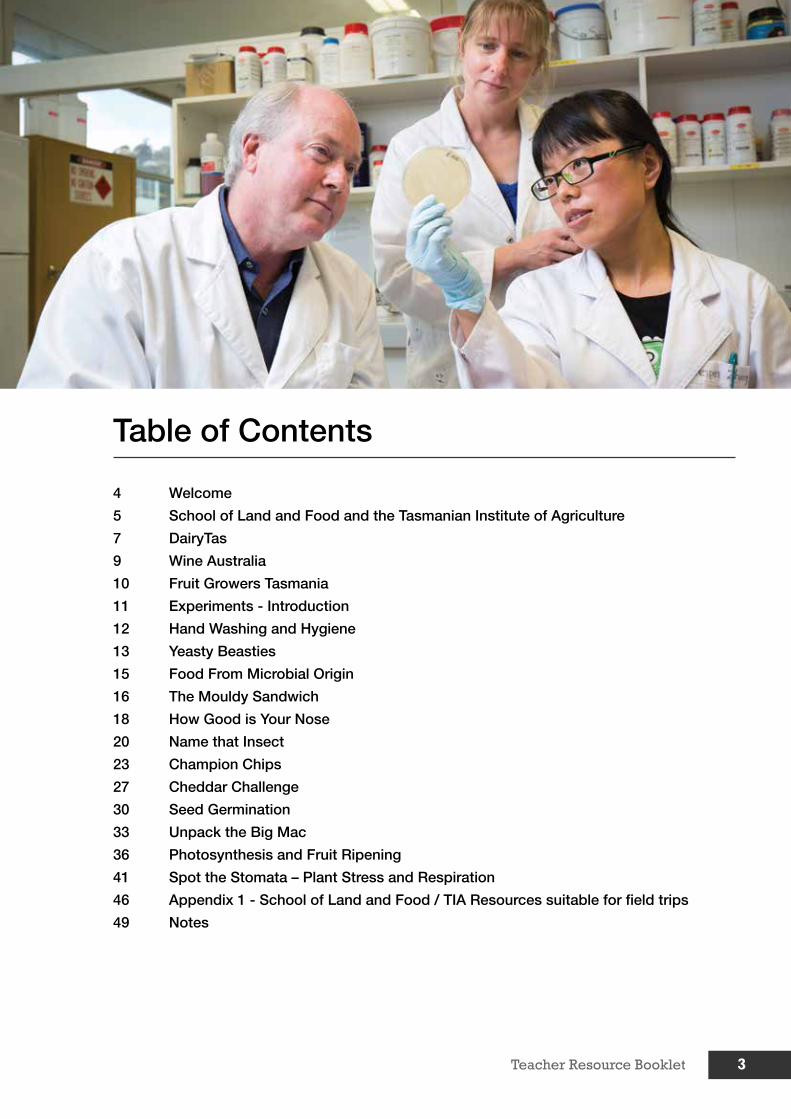
Table of Contents
4 Welcome
5 School of Land and Food and the Tasmanian Institute of Agriculture
7 DairyTas
9 Wine Australia
10 Fruit Growers Tasmania
11 Experiments - Introduction
12 Hand Washing and Hygiene
13 Yeasty Beasties
15 Food From Microbial Origin
16 The Mouldy Sandwich
18 How Good is Your Nose
20 Name that Insect
23 Champion Chips
27 Cheddar Challenge
30 Seed Germination
33 Unpack the Big Mac
36 Photosynthesis and Fruit Ripening
41 Spot the Stomata – Plant Stress and Respiration
46 Appendix 1 - School of Land and Food / TIA Resources suitable for field trips
49 Notes

4 Engaging students in STEM using Agriculture
Welcome
Agriculture is a key strength in Tasmania’s economy and the Tasmanian Government has recognised the potential of agriculture in Tasmania and has set the ambitious target to increase the value of agriculture by tenfold to $10 billion per year by 2050. With the increasing demand for fresh, safe and high quality food, Tasmania has a remarkable opportunity to leverage off our competitive strengths in agriculture to significantly expand our agricultural industries and food manufacturing capacity.
The University of Tasmania and Tasmanian Government are partnering together through the Tasmanian Institute of Agriculture to foster innovation, improve farm productivity and capture new opportunities in agriculture through research and development. For Tasmania to take best advantage of its opportunities in agriculture, we also need well-educated and well-trained agricultural scientists who can work in industry and with primary producers to transform this research into outcomes. It is the knowledge and skills that agricultural science offer that can support and help innovators in industry trial new crops, develop new products and create new markets.
We want to see even more Tasmanians receive education and training in agriculture so that they can support Tasmanian industry. Tasmanians have a unique opportunity to access one of the best agriculture education providers in, not only Australia, but the world. In December 2015 the University of Tasmania was rated as Australia's number one institution for agriculture research as assessed by a national review of Australian universities, the Excellence in Research for Australia (ERA) 2015 National Report. We were the only Australian university to be rated a top-score of 5 in areas of agriculture, land and farm management and horticultural production. The University is also ranked in the top 100 in the World for Agriculture by the 2016 QS World University Rankings by Subject and US News Rankings Best Global Universities 2015.
The environment that we provide at the University of Tasmania is also unique as we are a state with one of the most diverse farming systems in the world and we have access to commercial agriculture enterprises as well as our own research farms to provide that essential embedded learning. As a result of being able to study in a vibrant dynamic research environment under some of the world’s leading agriculture researchers and educators, our students graduate with high-level skills and cutting-edge knowledge and consequently they have excellent job prospects both nationally and internationally.
We look forward to working with Tasmanian STEM teachers to achieve the goal of producing skilled agricultural professionals. We hope that together we can illustrate the diversity of careers in the agricultural sector, and the importance of sound scientific principles in agricultural education.
Professor Holger MeinkeHead of SchoolDirector, Tasmanian Institute of AgricultureSchool of Land and FoodUniversity of Tasmania

Teacher Resource Booklet 5
The School of Land and Food and the Tasmanian Institute of Agriculture
The School of Land and Food at the University of Tasmania brings together the interconnected, cutting-edge disciplines of agriculture, food systems, geography, environment and spatial sciences.
As a vibrant centre of world-class teaching and research, the School is setting a global trend in how agriculture, food systems, landscape science and education can create real societal benefits for farmers, industry, consumers and for our environments.
The School is committed to effectively mentoring the next generation of entrepreneurs, producers, researchers, policy makers and practitioners, equipping them with the essential skills and attributes to engage with the world. Our success is built on networks via strong local, national and international partnerships.
At the School of Land and Food students gain more than a degree – they develop a global perspective, a social responsibility, and the opportunity to join an influential and dedicated community of professional problem solvers. Our teaching is closely aligned with our research.
The School of Land and Food has a modern teaching environment, world-class research facilities and unique field experiences. We pride ourselves on offering practice based learning in the ‘living laboratory’ that is the state of Tasmania.
TASMANIANINSTITUTE OFAGRICULTURE

6 Engaging students in STEM using Agriculture
Research Farms and Facilities• The Dairy Research Facility is a fully operational 320-head dairy farm and is home to
structured experiments based on a wide range of key industry issues.
• Forthside Vegetable Research Facility in the North of Tasmania has modern infrastructure and equipment.
• The University Farm is only 30 minutes from Hobart and comprises 340 hectares of mixed enterprise farming.
• Cressy Research Farm hosts field trials, a dedicated grazing evaluation facility, and a variable rate lateral move irrigator.
The Tasmanian Institute of Agriculture (TIA) sits within the School and is a Joint Venture between the Tasmanian Government and the University of Tasmania. This partnership and TIA’s mandate in research, development, education and extension is unique in Australia.
With a dynamic team of 130 scientists, educators and technical experts, TIA conducts high-quality research, development, extension, education and training to meet the needs of the agricultural and food sectors. TIA has world-class facilities and equipment and has a strong infrastructure investment program.
TIA’s focus is on developing prosperous, innovative and sustainable rural industries and communities. TIA’s capability covers the entire agriculture and food value chain, from production to consumption.
TIA has five research centres that give it the agility to adapt to industry’s strategic goals: Agricultural Systems, Annual Crops, Pastures and Livestock, Dairy, Food Systems, and Perennial Horticulture.

Teacher Resource Booklet 7
DairyTasDairyTas is the farmer levy funded service provider for the dairy industry across a wide range of farm management areas. We also are actively involved in the schools and education sector to help broaden the understanding of the industry and showcase the range of career, education and training opportunities that are available for students.
The dairy industry employs directly nearly 3,000 people in Tasmania, contributes over $1billion per year to the economy and is the largest agriculture and food sector in the state.
With the support of Dairy Australia, DairyTas offers the Cows Create Careers Farm and Camembert in the Classroom modules in high schools and the Picasso Cow program in primary schools.
DairyTas is also working with the Beacon Foundation through their Business Blackboards project with 8 schools involved in the north and northwest in 2016. DairyTas instigated a Dairy Careers Day in Burnie in 2015 and is looking to run this again in 2017. DairyTas also supports the Science Investigation Awards
Farm Module2016 saw 18 schools participate in the Farm Module (4 in the South, 5 in the North and 9 in the NW) with a presentation day held in each region. This program continues to maintain its popularity with schools, giving students an insight into dairy farming operations plus some of the industries we rely on as dairy farmers. The module involves a dairy project, rearing calves for 3 weeks and an industry advisor. The program is run in term 3.
Meet our Industry Partners

8 Engaging students in STEM using Agriculture
Camembert in the Classroom Module9 Northern/NW schools made in excess of 70 camembert cheeses and took them to be judged at the Presentation Day at East Devonport in 2016. Students also complete short videos about the nutritional benefits of consuming dairy which are also judged on the day. DairyTas supports the program by training teachers to oversee the cheese making process. Training for new teachers will be held in June 2017 and EOIs are required now. The program is run in term 3.
Beacon Foundation - Cows, Cuds and ChemistryThis program has grown in its third year, 8 schools from Yolla through to Newstead College were involved with a total of 17 classroom sessions. This program takes sheep rumens straight from the abattoir chiller room and provides a hands on dissection of the rumen, and scientific and nutritional support information for students in grades 9 and 10 science. The sessions are also an opportunity to discuss dairy farming more broadly. It involves a DairyTas coordinator and industry nutrition expert for support.
Dairy Industry Resources
http://www.dairytas.com.au/projects/
• Stepping Stones. A resource that outlines the career pathway for those looking for a farm career.
• Faces of Tasmanian Dairy. A series of on line videos of dairy employees, managers and owners in the industry.

Teacher Resource Booklet 9
The Australian Grape and Wine Authority (AGWA), which trades as Wine Australia, supports a prosperous Australian grape and wine community by investing in research and development (R&D), building international and domestic markets, disseminating knowledge, encouraging adoption and protecting the reputation of Australian wine.
We are funded by grapegrowers and winemakers through levies and export charges, and the Australian Government, which provides matching funding for R&D investments.
Our long-term goal is for Australia to be recognised as the world’s pre-eminent wine producing country, and our support of the Science and Innovation Awards is one example of our commitment to the development of the next generation of game changers, researchers, experts and leaders who will drive the Australian grape and wine community’s future.
Visit www.research.wineaustralia.com for information about our current RD&E projects and research priorities.

10 Engaging students in STEM using Agriculture
Fruit Growers Tasmania Inc (
Fruit Growers Tasmania (FGT) is the industry Association representing Tasmanian apple, pear and stonefruit growers and most recently Berry Growers.
The FGT was created with the amalgamation of the Tasmanian Stonefruit Association and the Tasmanian Apple and Pear Growers Association in in October 2004.The amalgamation was a milestone in the history of the Tasmanian Fruit Industry. Since European settlement fruit production has been an important part of the Tasmanian economy. Over the past century the Tasmanian Fruit Industry rose to world dominance before declining again due to the influence of international forces beyond its control. Today, thanks to the dedication and commitment of many people over many years, we have a new, dynamic fruit industry.
The Association provides support in a range of areas for the industry, some of which are listed below
• Training Days
• Field Days - technical presentations
• Quarterly industry newsletter & distribution of technical information
• Market access issues
• Annual Stone fruit seminar and other industry workshops and events
• Website
• Research & Development for the Tasmanian industry
• Local promotion and community events
• Administrative support for the Executive and Council members
• Government liaison
• Quarantine - protocol development; local requirements
• Japan Export Program
Teacher Resource Booklet 11
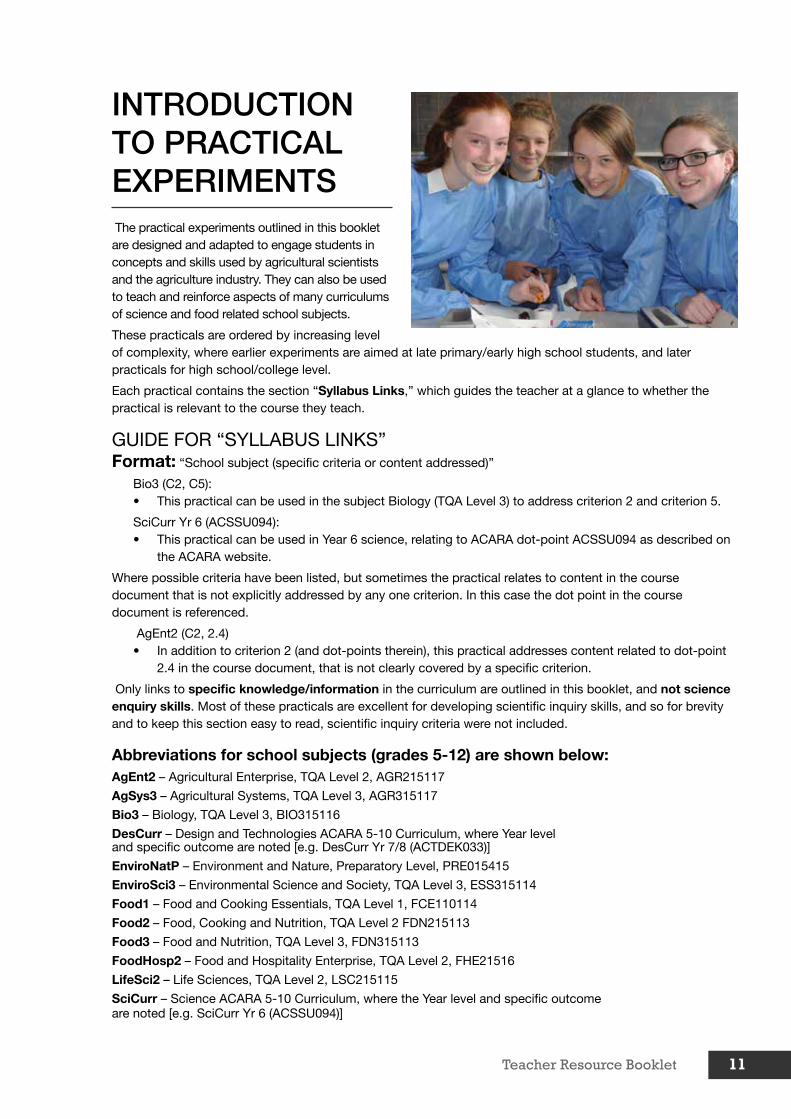
INTRODUCTION TO PRACTICAL EXPERIMENTS The practical experiments outlined in this booklet are designed and adapted to engage students in concepts and skills used by agricultural scientists and the agriculture industry. They can also be used to teach and reinforce aspects of many curriculums of science and food related school subjects.
These practicals are ordered by increasing level of complexity, where earlier experiments are aimed at late primary/early high school students, and later practicals for high school/college level.
Each practical contains the section “Syllabus Links,” which guides the teacher at a glance to whether the practical is relevant to the course they teach.
GUIDE FOR “SYLLABUS LINKS” Format: “School subject (specific criteria or content addressed)”
Bio3 (C2, C5): • This practical can be used in the subject Biology (TQA Level 3) to address criterion 2 and criterion 5.
SciCurr Yr 6 (ACSSU094): • This practical can be used in Year 6 science, relating to ACARA dot-point ACSSU094 as described on
the ACARA website.
Where possible criteria have been listed, but sometimes the practical relates to content in the course document that is not explicitly addressed by any one criterion. In this case the dot point in the course document is referenced.
AgEnt2 (C2, 2.4) • In addition to criterion 2 (and dot-points therein), this practical addresses content related to dot-point
2.4 in the course document, that is not clearly covered by a specific criterion.
Only links to specific knowledge/information in the curriculum are outlined in this booklet, and not science enquiry skills. Most of these practicals are excellent for developing scientific inquiry skills, and so for brevity and to keep this section easy to read, scientific inquiry criteria were not included.
Abbreviations for school subjects (grades 5-12) are shown below: AgEnt2 – Agricultural Enterprise, TQA Level 2, AGR215117
AgSys3 – Agricultural Systems, TQA Level 3, AGR315117
Bio3 – Biology, TQA Level 3, BIO315116
DesCurr – Design and Technologies ACARA 5-10 Curriculum, where Year level and specific outcome are noted [e.g. DesCurr Yr 7/8 (ACTDEK033)]
EnviroNatP – Environment and Nature, Preparatory Level, PRE015415
EnviroSci3 – Environmental Science and Society, TQA Level 3, ESS315114
Food1 – Food and Cooking Essentials, TQA Level 1, FCE110114
Food2 – Food, Cooking and Nutrition, TQA Level 2 FDN215113
Food3 – Food and Nutrition, TQA Level 3, FDN315113
FoodHosp2 – Food and Hospitality Enterprise, TQA Level 2, FHE21516
LifeSci2 – Life Sciences, TQA Level 2, LSC215115
SciCurr – Science ACARA 5-10 Curriculum, where the Year level and specific outcome are noted [e.g. SciCurr Yr 6 (ACSSU094)]

12 Engaging students in STEM using Agriculture
1. HAND WASHING AND HYGEINE
We all know that we should wash our hands before we handle food, but how often do we do it properly? The World Health Organisation has developed a procedure outlining an effective way of washing hands: http://www.who.int/gpsc/clean_hands_protection/en/ .
GlitterBug Potion1 fluoresces under UV light, so that when students apply the cream to their hands and attempt to wash it off, the areas the student has washed poorly glow brightly under a UV lamp.
This short demonstration can highlight to students just how grotty we can be when it comes to hand hygiene.
Syllabus Links: Any science/food tech subject that requires good hand washing technique, Food1 (C3), Food2 (C4), FoodHosp2 (C3).
Materials
1. Glitterbug potion
2. UV lamp
3. Soap and water
4. Paper towel
Hands on exercise
[Time depends on class size, ~40 mins for 20 students]
1. Apply a squirt of Glitterbug cream as if it were moisturiser and observe under a UV lamp.
2. Wash hands, as you normally would.
3. Look at hands under the UV lamp again, observing areas that were cleaned well and those which weren’t (still glow brightly).
4. Wash hands again, this time following the WHO guidelines.2
5. Repeat examination of hands under UV torch.
6. Discuss your findings.
Risk Control Measure
Chemical Exposure: GliterBug Potion is non-hazardous but can cause eye irritation and sometimes skin irritation on very sensitive skin.
• Students warned that if they have sensitive skin they might not wish to take part.
• Wash hands thoroughly before touching eyes.
UV Exposure: excessive exposure can lead to sunburn/increased risk of skin cancer, and damage to eyes.
• Enclose UV lamp in a viewing box or screened area, to avoid shining into eyes. Realistically exposure times are very short in this practical.
1 Potion can be purchased at http://glitterbug.net.au/2 WHO guidelines found at: http://www.who.int/gpsc/clean_hands_protection/en/
Hands before cleaning
Hands after cleaning
Teacher Resource Booklet 13
2. YEASTY BEASTIES
Yeasts are single celled fungi that reproduce by budding (they are eukaryotes- i.e. cells that have a nucleus and contain membrane bound complex structures). They are chemoautotroph’s, meaning they use organic compounds for energy, such as sugar. They convert sugar via fermentation anaerobically. Yeasts are facultative anaerobes meaning they prefer to carry out metabolic processes anaerobically, but can also tolerate oxygen if need be.
The most common yeast that we use is Saccharomyces cerevisiae. It is commonly used in brewing beer, wine/champagne and in bread making. For these processes, it’s the by-products of a yeasts fermentative metabolism that make them so useful. Ethanol is the compound that is targeted for use in alcoholic beverage manufacture. Another by-product of yeast that is of interest to us is carbon dioxide. It’s the gas that causes air pockets in the bread dough, causing it to rise and giving the bread a spongy texture.
In this experiment, it is the carbon dioxide by-product that we are interested in. The amount of carbon dioxide produced by S. cerevisiae under different conditions (also known as treatments) will be measured to determine which of these conditions make our beastie flourish and the conditions that make it an unhappy camper.
Syllabus Links: AgEnt2 (C2), AgSys3 (C2), Bio3 (C5), EnviroSci3 (C5), SciCurr Yr 6 (ACSSU094).
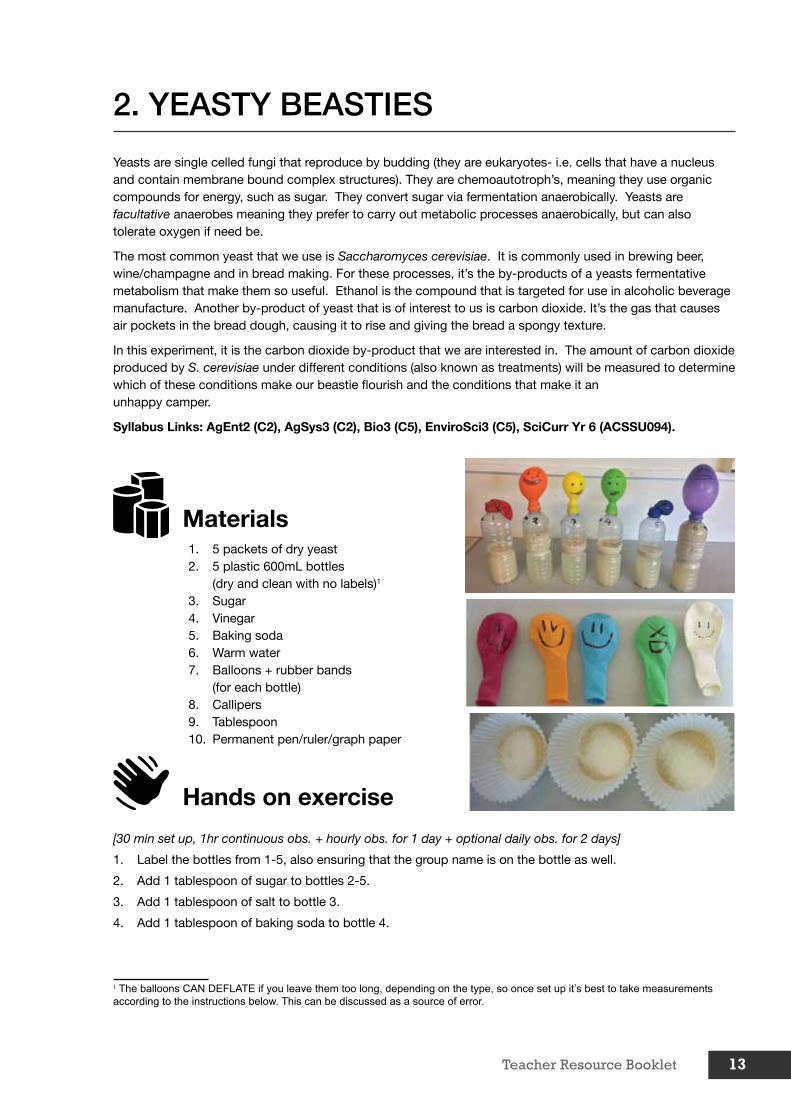
Materials1. 5 packets of dry yeast2. 5 plastic 600mL bottles
(dry and clean with no labels)1
3. Sugar4. Vinegar5. Baking soda6. Warm water7. Balloons + rubber bands
(for each bottle)8. Callipers9. Tablespoon10. Permanent pen/ruler/graph paper
Hands on exercise
[30 min set up, 1hr continuous obs. + hourly obs. for 1 day + optional daily obs. for 2 days]
1. Label the bottles from 1-5, also ensuring that the group name is on the bottle as well.
2. Add 1 tablespoon of sugar to bottles 2-5.
3. Add 1 tablespoon of salt to bottle 3.
4. Add 1 tablespoon of baking soda to bottle 4.
1 The balloons CAN DEFLATE if you leave them too long, depending on the type, so once set up it’s best to take measurements according to the instructions below. This can be discussed as a source of error.
14 Engaging students in STEM using Agriculture
5. Add one tablespoon of vinegar to bottle 5.
6. To each bottle add 300mls of warm water and swirl gently to dissolve ingredients.
7. Add 1 packet of yeast to each bottle, put lid on and shake gently to mix in yeast.
8. Stretch a balloon over the neck of each bottle and secure with a rubber band, and place bottles in a warm area.
9. At various time intervals, measure how much gas each bottle of yeast has produced using callipers to measure the width of the balloon. Because the data collected for each bottle is not necessarily consistent (yeast exhausts its food source and amount of carbon dioxide produced plateaus), the following time intervals are recommended (although not strictly necessary):
• Every 15 minutes over the first hour.
• Hourly intervals over the rest of the day.
• Daily intervals (24 and 48 hours) over the next two days. These may be left out of the graphing task, as balloons do deflate over time, however they are worth simply observing because some treatments inhibit the yeast to an extent that they are still consuming the sugar even after 48 hours!
10. Record your observations of the changes that have taken place for each treatment in the table.
11. Graph results onto a piece of graph paper. Which treatment favours the most amount (or fastest rate) of carbon dioxide production? What does this tell us about the conditions needed for fermentation?
Bottle Condition Balloon Colour Observations
1 No Sugar
2 Sugar
3 Sugar + Salt
4 Sugar + Baking Soda
5 Sugar + Vinegar
The exercise above can be easily expanded to include more variables. For example the effect of temperature can be explored by incubating in incubators (or rooms) at different temperatures. Any of the conditions that slow microbial growth, e.g. salt, can be varied to find out what concentration will prevent growth (and this can be tied into food preservation methods). Perhaps even disinfectants or spices could be investigated for their potential antimicrobial effects.
The experiment can also be set up with combinations of ‘hurdles’ to explore the hurdle concept with respect to microbial growth (i.e. combining multiple hurdles to prevent growth of pathogenic or spoilage microorganisms. The right combination of hurdles may eliminate microorganisms or prevent them from growing). A trial run is definitely needed before students undertake experiment.
Risk Control MeasureChemical Exposure: vinegar and sodium bicarbonate are mild skin and eye irritants.
• PPE (eye protection, gloves)• Flush eyes/skin if contact occurs
Pressure build-up: evolution of gases in bottles • Ensure bottles are stable (e.g. placed in beakers), to avoid spills if balloons pop)

Teacher Resource Booklet 15
3. FOOD FROM MICROBIAL ORIGIN
While food microbiology can often be associated with furry moulds on our strawberries or salmonella poisoning, microorganisms are also responsible for the production and enhancement of foods we consume every day. Yeasts, bacteria and fungi contribute to many positive characteristics of foods, including palatability (flavour, smell and texture), nutritional value, shelf life and safety.
Fermentation is any microbial process involving the biochemical transformation of a substrate into something different. This term is commonly used to describe beneficial change, often (though not exclusively) under anaerobic conditions. In foods, the most common fermentation process involves the transformation of carbohydrates (sugars) into carbon dioxide, organic acids and/or ethanol (among other things).
Fermented foods, such as salami, cheese, bread, or even the Icelandic delecasy ‘Hákarl’ (decomposed shark), did not necessarily come around by design, but have no less been adopted into our menus and are often the strongest tasting and safest types of foods to store.
Syllabus Links: AgEnt2 (3.9, C2), AgSys3 (6.21, 6.22), Food2 (C6), Food3 (extension topic: food preservation)
Hands on exercise Discussing with students the broad range and origin of fermented foods available in our supermarkets can be interesting and interactive. Students may be asked to bring in a food that they believe (or have researched to be) of microbiological origin or processed through microbiological processes (points to the most original!). Perhaps students could give a short presentation on their finds, ideally with reference to the microorganism responsible (lactic acid bacteria, yeast, mould etc.) and the means by which it produces its tasty results.
Some of the possible foods to include in this task are listed below.
Leavened bread Salami Cheese
Sourdough bread Fish sauce/paste Yoghurt
Wine Soy sauce Sour cream
Beer Rice wine Sauerkraut
Vinegar Tempeh Kimchi
Vegemite Olives
16 Engaging students in STEM using Agriculture
4. THE MOULDY SANDWICH
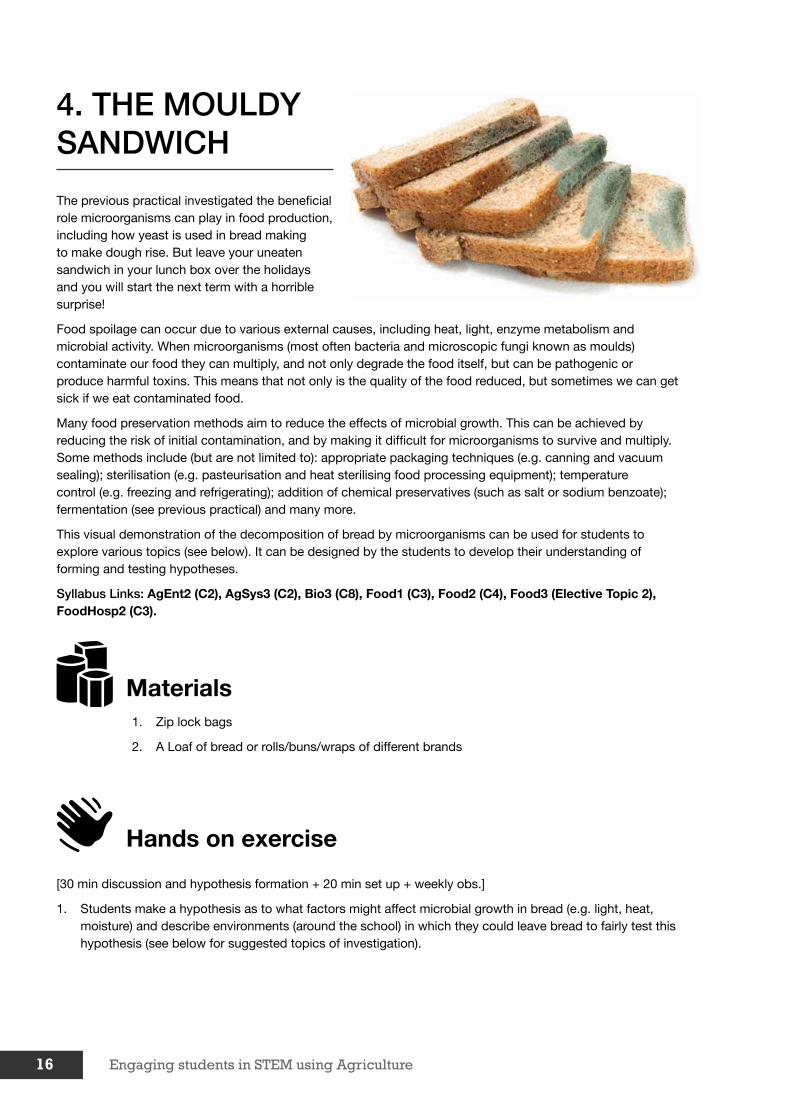
The previous practical investigated the beneficial role microorganisms can play in food production, including how yeast is used in bread making to make dough rise. But leave your uneaten sandwich in your lunch box over the holidays and you will start the next term with a horrible surprise!
Food spoilage can occur due to various external causes, including heat, light, enzyme metabolism and microbial activity. When microorganisms (most often bacteria and microscopic fungi known as moulds) contaminate our food they can multiply, and not only degrade the food itself, but can be pathogenic or produce harmful toxins. This means that not only is the quality of the food reduced, but sometimes we can get sick if we eat contaminated food.
Many food preservation methods aim to reduce the effects of microbial growth. This can be achieved by reducing the risk of initial contamination, and by making it difficult for microorganisms to survive and multiply. Some methods include (but are not limited to): appropriate packaging techniques (e.g. canning and vacuum sealing); sterilisation (e.g. pasteurisation and heat sterilising food processing equipment); temperature control (e.g. freezing and refrigerating); addition of chemical preservatives (such as salt or sodium benzoate); fermentation (see previous practical) and many more.
This visual demonstration of the decomposition of bread by microorganisms can be used for students to explore various topics (see below). It can be designed by the students to develop their understanding of forming and testing hypotheses.
Syllabus Links: AgEnt2 (C2), AgSys3 (C2), Bio3 (C8), Food1 (C3), Food2 (C4), Food3 (Elective Topic 2), FoodHosp2 (C3).
Materials1. Zip lock bags
2. A Loaf of bread or rolls/buns/wraps of different brands
Hands on exercise
[30 min discussion and hypothesis formation + 20 min set up + weekly obs.]
1. Students make a hypothesis as to what factors might affect microbial growth in bread (e.g. light, heat, moisture) and describe environments (around the school) in which they could leave bread to fairly test this hypothesis (see below for suggested topics of investigation).

Teacher Resource Booklet 17
2. Seal pieces of bread/wraps/buns individually in zip lock bags. If the effect of moisture is being investigated, spray water onto bread before putting it in the zip lock bag.
3. Place bags in locations according to the hypothesis students decide to test (e.g. taped onto the window, in a fridge, in a dark cupboard, handled with gloves vs. dirty hands etc.)
4. Make observations every week as to which pieces of bread show signs of microbial growth, and to what extent.
5. Compare these results to the hypothesis.
6. Dispose of bread in the bags WITHOUT opening them. Fungi spores can be very harmful.
Suggested Topics of Investigation:
From a food safety point of view, students could first participate in a discussion about methods of reducing the risk of food spoilage (as outlined in the introduction), and then form a hypothesis on the best ways of handling and storing bread. This could be explored by placing pieces of bread in different environments (some decided by students as ‘safe’ and ‘unsafe’ storage), and over a number of weeks observing which pieces have been overrun by visible microorganism colonies.
From a microbiological perspective students could make a hypothesis regarding the ideal conditions for microbial growth, and similarly place bread pieces in conditions that would test this hypothesis.
This practical could even be used to investigate which bakeries produce bread that will last longer (and therefore discuss how they might achieve the extension of the shelf life of their products). Here, wraps of different brands could be taped to the window for a few weeks, and observations taken as to which degrade quickly and which do not.
Risk Control Measure
Microorganisms can form colonies large enough to be unsafe to handle, and fungi spores are eas-ily transported by air and often hazardous when inhaled.
• Once bread is placed in a zip lock bag it is not to be reopened at any point, and is disposed of still sealed.

18 Engaging students in STEM using Agriculture
5. HOW GOOD IS YOUR NOSE?
Did you know that there are a variety of jobs that involve noting down what your hooter senses and smells?
Some of these jobs are more pleasant than others, but from smelling people’s underarm scents (mmmmmm) to devising smelly concoctions to improve our wellbeing and health via assessing the smell of Sicilian lemons in ice creams and sorbets, your nose could be a major asset in your career.
In the wine industry, being able to detect unpleasant odours is very important, as consumers can be put off a wine label due to an unpleasant experience.
It is essential that people who are called upon to assess the quality of wine are able to accurately recognise the common sensory wine faults and taints that occur in wines. Wine faults are defined as off-aromas or tastes that are related to the fermentation or the winemaking process. Wine taints are defined as an odour, taste or aftertaste that originate from external or foreign sources. Note that people vary in their sensitivity and ability to detect many wine faults and taints. It is important to know your own individual ability to detect many of these compounds when assessing wine.
The following practical gives students the opportunity to assess their own individual ability to detect taints in wine.
Syllabus Links: DesCurr Yr 7/8 (ACTDEK033), Food2 (C6), Food3 (C6).
Materials
1. 15 mL centrifuge tubes (or similar)
2. Dry white cask wine
3. Permanent pen
4. Tube rack
Taints: e.g. geraniol, diacetyl, white wine vinegar, coconut, lemon, strawberry, lavender.

Teacher Resource Booklet 19
Hands on exercise [20 mins prep time, 30 mins class time]
Before the class:
1. Label centrifuge tubes A-G (include one for each taint you have), and label another ‘control.’
2. Fill all tubes to the 10 mL mark with dry white cask wine.
3. Add a different taint to each tube (except the control, which will have none). The amount of taint will be dependent on the type of wine you purchase, and how strong smelling it is. The following is a guide, however try slightly smaller quantities and see if a colleague can pick up on the smell and guess its identity, adding more until they can.
• Geraniol (2 drops)
• Diacetyl (2 drops)
• White wine vinegar (11 drops)
• Coconut (1 drop)
• Lemon (1 drop)
• Strawberry (1 drop)
• Lavender (dilute small aliquot of lavender oil x10; add 1 drop of this to tube)
Control. Add nothing.
4. Store samples in a rack in a fridge before the lesson.
5. You may wish to make multiple sets of these tubes, depending on class size.
In Lesson:
• Students smell the control sample of wine, followed by each of the tainted wines.
• Students record what they think each taint is, discerning it from the other aromas in the wine.
• You may (or may not!) wish to provide them with the names of the taints you have chosen for them to match each sample to.

20 Engaging students in STEM using Agriculture
6. NAME THAT INSECT
A key skill in entomology is to be able to identify insects accurately. In fact, biologists generally must have an understanding of phylogeny and taxonomy. Whether taxonomy is taught explicitly in a curriculum (such as LifeSci2), or more of a focus is placed on evolution and the theory of natural selection (as in Bio3 and high school science), it is always fascinating for students to be able to categorise organisms they are used to seeing around them, and make connections between their similarities (and common ancestors). One method of identifying organisms involves the use of taxonomic keys. Through a series of questions and identification of certain physical features, taxonomic keys allow you to piece together a profile of your specimen, which in the end matches only one classification, eliminating other possibilities as each feature is described.
CSIRO has developed an online guide to Australian insect orders and families, “What bug is that?”, which includes an interactive taxonomic key:
http://anic.ento.csiro.au/insectfamilies/key.aspx?OrderID=0&PageID=group&KeyID=5
This interactive key and identification tool can be used to classify insects by their order (although for simplicity this website calls them ‘groups’ and uses both taxonomic and common names… very helpful!). Students can try to identify an insect they find in the backyard through the interactive key (Image above), or browse the rest of the website which contains easy to navigate information on each of the orders, as well as other methods of identification (matrices and photo comparison). To use the taxonomic key students work through the list of characteristics in the ‘Features Available’ pane (e.g. number of wings), and record traits the insect possesses
Teacher Resource Booklet 21
(e.g. 4 wings). The tool then eliminates possible ‘groups’ (moving them from the Entities Remaining pane into Entities Discarded pane) as you input more data, until you have identified which group your insect comes from!
While this tool is straightforward and easily accessible, the key can take some getting used to and it is recommended that you familiarise yourself with using it (and the terminology involved in identifying different insect features) before the lesson. Note that clicking on an image in the ‘Features Available’ pane allows you to read the full description of the feature, and clicking the page icons in the ‘Entities Remaining’ pane gives detailed descriptions of the ‘groups’/orders.
Consideration must also be given to the task’s level of complexity in order to cater for different students’ abilities. The example exercise shown below includes a scaffolding technique where students are first given a scenario that includes a written description of an insect (in order to familiarise themselves with using the key without the challenge of identifying traits on a specimen), gradually building up to the full identification of a pinned specimen without hints.
Syllabus Links: Bio3 (C8), LifeSci2 (C7), SciCurr Yr 7 (ACSSU111), SciCurr Yr 10 (ACSSU185).
Materials
1. Computers + internet
2. Pinned specimens (or detailed pictures) of insects to be identified
3. Written insect scenarios
4. Magnifying glasses/dissecting microscope
5. Insect identification books (optional, as another resource to check identifications)
Hands on exercise[Time can depend on how many questions students are given]
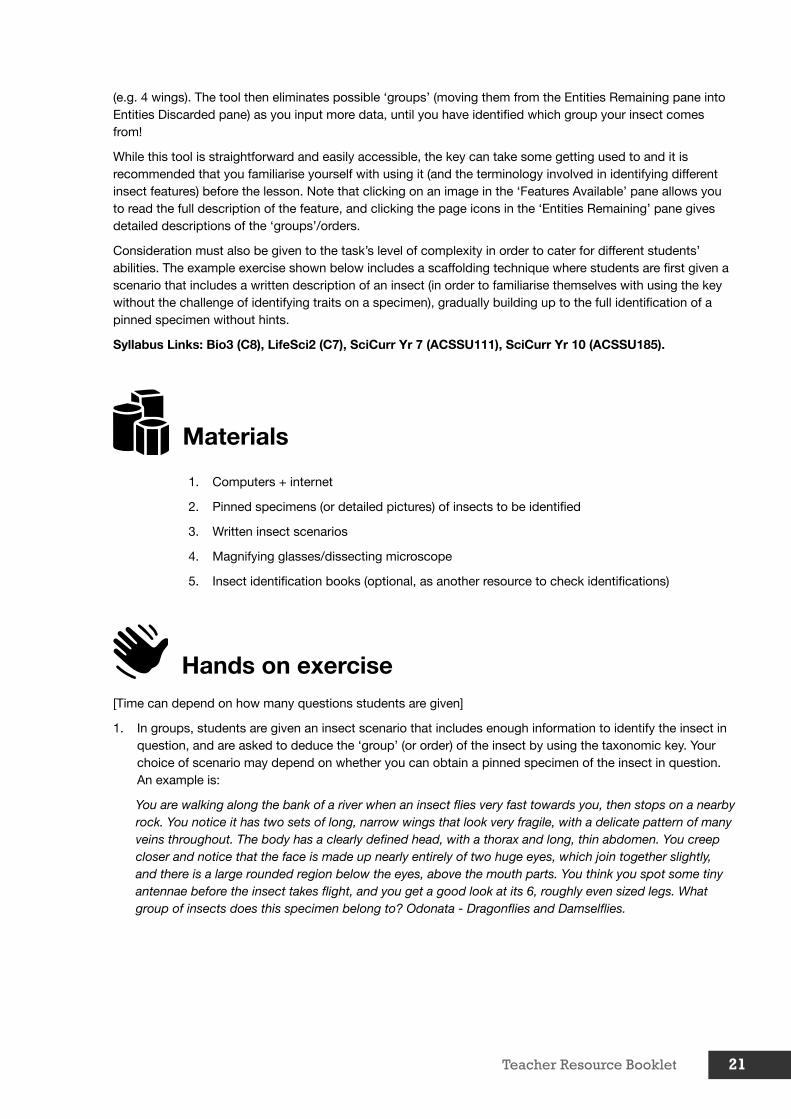
1. In groups, students are given an insect scenario that includes enough information to identify the insect in question, and are asked to deduce the ‘group’ (or order) of the insect by using the taxonomic key. Your choice of scenario may depend on whether you can obtain a pinned specimen of the insect in question. An example is:
You are walking along the bank of a river when an insect flies very fast towards you, then stops on a nearby rock. You notice it has two sets of long, narrow wings that look very fragile, with a delicate pattern of many veins throughout. The body has a clearly defined head, with a thorax and long, thin abdomen. You creep closer and notice that the face is made up nearly entirely of two huge eyes, which join together slightly, and there is a large rounded region below the eyes, above the mouth parts. You think you spot some tiny antennae before the insect takes flight, and you get a good look at its 6, roughly even sized legs. What group of insects does this specimen belong to? Odonata - Dragonflies and Damselflies.

22 Engaging students in STEM using Agriculture
2. Students are given a pinned insect or detailed pictures of an insect to identify (you may wish to provide a scenario to accompany this, with some but not enough information for identification). The first insect might be something the students will recognise.
If they are successful, they are given more challenging insect (without an accompanying scenario) that they are unlikely to recognise the common name for just by looking.
Students are allowed time to explore the websites other functions, and play with the key to become familiar with a wider range of insects and traits that help to identify them.
An extension of this exercise is to give students a group of insects to research and give a short presentation on.
Challenge! Give students a ‘bee mimic’ insect to identify (shown below, family Bombyliidae). This insect looks like a bee, but actually belongs to the order diptera (flies, mosquitos, gnats), not hymenoptera (ants, bees, wasps). If students identify this insect as hymenoptera it can demonstrate to them that perhaps they were biased in their visual assessment and did not follow the key correctly (if they had, the first option ‘number of wings’ would have been ‘2 wings + hind wings reduced to tiny clubs’ for diptera, not 4 wings for hymenoptera!).

Teacher Resource Booklet 23
7. CHAMPION CHIPS
With the plethora of potato varieties farmed in Tasmania, this is a brilliant place to explore the art of potato chip frying. Chip quality is often assessed on the following attributes: overall taste of the chip; the texture (crunchy on the outside, fluffy on the inside, not oily or soggy); and the colour (ideally a uniform, golden-brown colour). In addition, potatoes used for chip making need to be of a roughly uniform, symmetrical shape for automated processing, and are ideally large and ‘blocky’ (as opposed to round) so that long chips can be obtained with minimal wastage of the rounded sides of the potato. Students can brainstorm these and other factors that Simplot must consider when sourcing spuds for Macca’s fries.
In industry, quality is assessed by sampling chips of uniform size, frying them once for 3 minutes at 190oC. This slightly undercooks the chips, but is the industry standard and allows for the more subtle flavours of the potatoes to be identified. By this method chips made from different varieties of potatoes can be compared. But what makes some potato varieties better than others?
The most important factor affecting the cooking utility of potatoes has been identified as the dry matter content – how starchy it is. The dry matter content correlates well with the specific gravity of the potato (a parameter measured in industry), which is its density when compared to water.
‘Floury’ PotatoesHigh dry matter
High starchHigh density
Best for: baking, mashing, roasting, chips (fluffy)e.g. Russet Burbank, Kennebec, King Edward
‘Waxy’ PotatoesLow dry matter (high moisture)
Low starchLow density
Best for: salads, casseroles (holds together)e.g. Dutch Cream, Pink Eye, Kipfler
High dry matter is good for chips! Potatoes with higher starch levels absorb less oil during frying, and therefore are less soggy and limp, and taste less oily. They maintain a crisper exterior and fluffier interior and are often more golden-brown than potatoes with lower dry matter content.
In this practical students will indirectly measure the dry matter content of different potato varieties, ranking them from low to high. They will then make a hypothesis as to which varieties will make the best (and worst) chips, followed by frying up the chips according to industry standard and giving them a taste! They will assess the different varieties on the factors above (colour, taste and texture) and rank chips in their overall quality, comparing this to their hypothesis.
An easy and excellent extension is to assess the effect that treating chips with sucrose (soaking raw chips in sugar water) has on chip quality. This is highly relevant because often chips, especially the frozen variety sold to be baked in the oven at home, are treated this way to increase crispiness and golden colour.
Syllabus Links: AgEnt2 (3.9), AgSys3 (6.2, 6.21, 6.22), DesCurr Yr 7/8 (ACTDEK033), FoodHosp2 (C4)
24 Engaging students in STEM using Agriculture
Materials1. Deep fryer
2. Vegetable oil (~4-6 litres depending on fryer)
3. Peeler
4. Potato chipper or knife (if you take the time to cut uniformly sized chips)
5. 4 large potatoes (for a class size of ~20) for each variety to be tested (3-5 varieties). Attempt to by at least one floury potato (Russet Burbanks/Russet Rangers are commonly used in industry for great chips, or else Brushed Sebagos, Kennebec, King Edward) and one waxy potato (Dutch Cream, Red Rascals, Kipflers). Perhaps also an ‘all-rounder’ such as Nicolas.
6. Buckets or large bowls (2 for each variety + 5)
7. Table sugar (sucrose)
8. Salt
9. Plates/trays (2 for each variety)
10. Paper towel
Hands on exercise
Measuring dry matter content: [20 min prep, 15 min exercise]
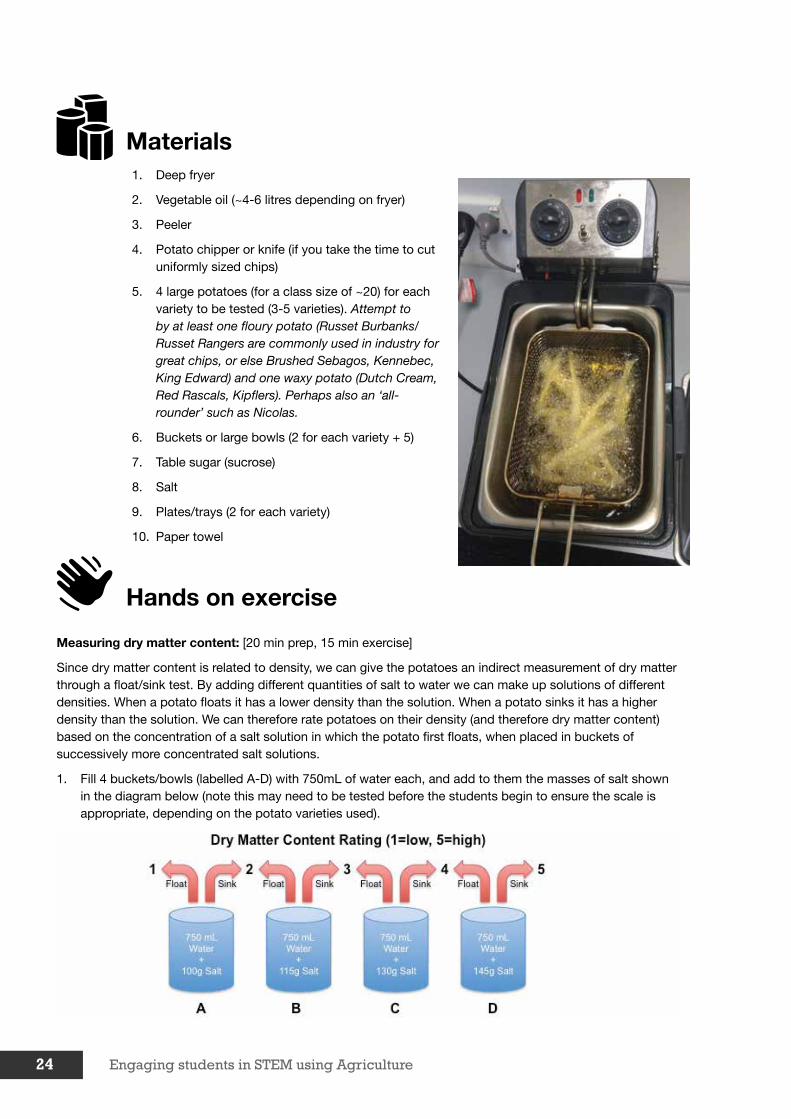
Since dry matter content is related to density, we can give the potatoes an indirect measurement of dry matter through a float/sink test. By adding different quantities of salt to water we can make up solutions of different densities. When a potato floats it has a lower density than the solution. When a potato sinks it has a higher density than the solution. We can therefore rate potatoes on their density (and therefore dry matter content) based on the concentration of a salt solution in which the potato first floats, when placed in buckets of successively more concentrated salt solutions.
1. Fill 4 buckets/bowls (labelled A-D) with 750mL of water each, and add to them the masses of salt shown in the diagram below (note this may need to be tested before the students begin to ensure the scale is appropriate, depending on the potato varieties used).
Teacher Resource Booklet 25
2. Peel one of each variety of potato. One at a time (remembering which is which), place potatoes in bucket A first, then B, then C etc., noting the first bucket in which the potato floats. Assign a ‘Dry Matter Content Rating’ accordingly (see diagram). For example, if a potato sinks in buckets A and B, but floats in C, it has a dry matter content rating of 3.
3. Based on the dry matter content ratings of each potato variety, record an hypothesis as to which variety will make the best chips, and which will make the worst.
Preparation the day before (can be carried out by students or staff): [time very variable]
1. Peel and chip all of the potatoes, using a chipper or cutting chips of uniform size with a knife. Keep varieties separate and select only full sized chips for the next part (keep offcuts in a bowl of water to fry up at the end for the students to nibble on!).
2. Prepare a ~10% sucrose solution by dissolving 200 g table sugar in 2 L of water.
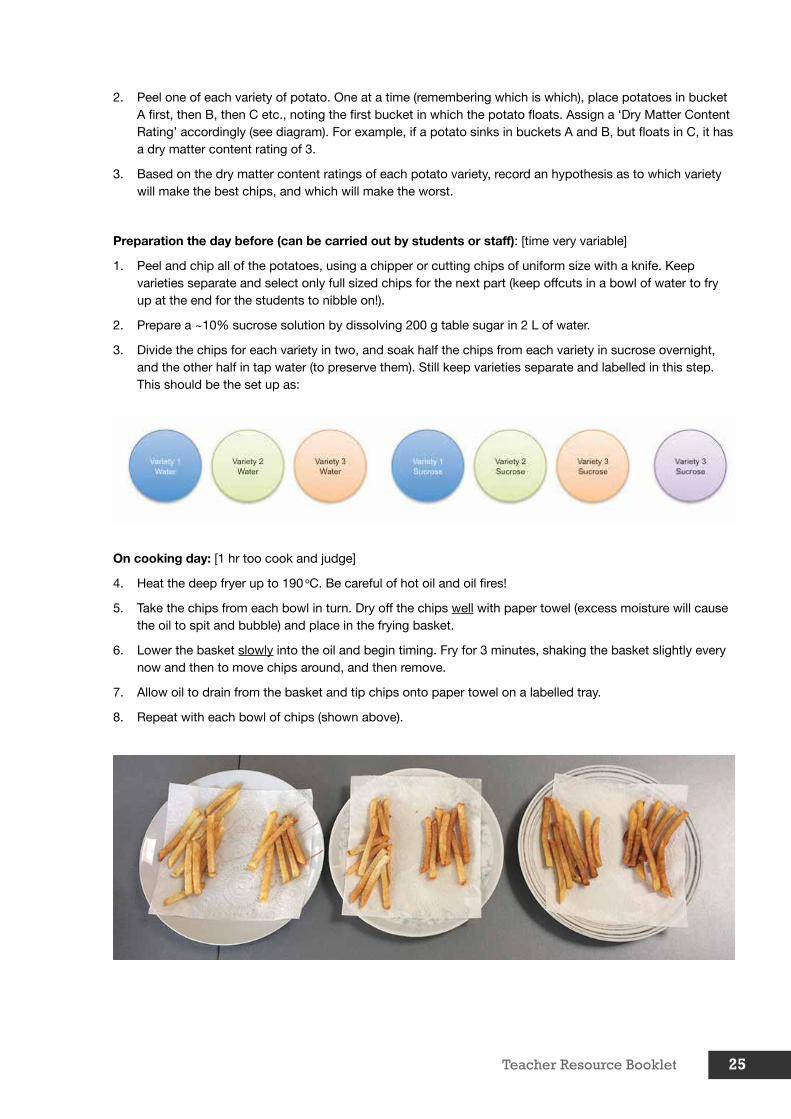
3. Divide the chips for each variety in two, and soak half the chips from each variety in sucrose overnight, and the other half in tap water (to preserve them). Still keep varieties separate and labelled in this step. This should be the set up as:
On cooking day: [1 hr too cook and judge]
4. Heat the deep fryer up to 190 oC. Be careful of hot oil and oil fires!
5. Take the chips from each bowl in turn. Dry off the chips well with paper towel (excess moisture will cause the oil to spit and bubble) and place in the frying basket.
6. Lower the basket slowly into the oil and begin timing. Fry for 3 minutes, shaking the basket slightly every now and then to move chips around, and then remove.
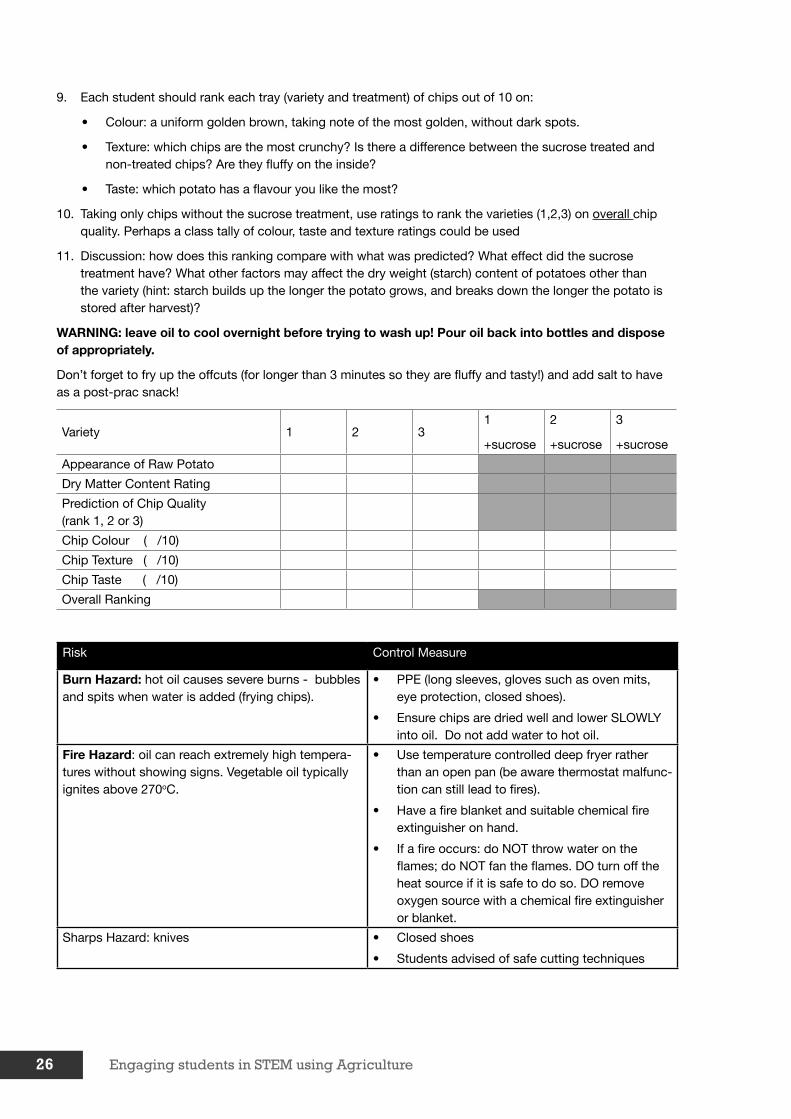
7. Allow oil to drain from the basket and tip chips onto paper towel on a labelled tray.
8. Repeat with each bowl of chips (shown above).
26 Engaging students in STEM using Agriculture
9. Each student should rank each tray (variety and treatment) of chips out of 10 on:
• Colour: a uniform golden brown, taking note of the most golden, without dark spots.
• Texture: which chips are the most crunchy? Is there a difference between the sucrose treated and non-treated chips? Are they fluffy on the inside?
• Taste: which potato has a flavour you like the most?
10. Taking only chips without the sucrose treatment, use ratings to rank the varieties (1,2,3) on overall chip quality. Perhaps a class tally of colour, taste and texture ratings could be used
11. Discussion: how does this ranking compare with what was predicted? What effect did the sucrose treatment have? What other factors may affect the dry weight (starch) content of potatoes other than the variety (hint: starch builds up the longer the potato grows, and breaks down the longer the potato is stored after harvest)?
WARNING: leave oil to cool overnight before trying to wash up! Pour oil back into bottles and dispose of appropriately.
Don’t forget to fry up the offcuts (for longer than 3 minutes so they are fluffy and tasty!) and add salt to have as a post-prac snack!
Variety 1 2 31
+sucrose
2
+sucrose
3
+sucrose
Appearance of Raw Potato
Dry Matter Content Rating
Prediction of Chip Quality (rank 1, 2 or 3)
Chip Colour ( /10)
Chip Texture ( /10)
Chip Taste ( /10)
Overall Ranking
Risk Control Measure
Burn Hazard: hot oil causes severe burns - bubbles and spits when water is added (frying chips).
• PPE (long sleeves, gloves such as oven mits, eye protection, closed shoes).
• Ensure chips are dried well and lower SLOWLY into oil. Do not add water to hot oil.
Fire Hazard: oil can reach extremely high tempera-tures without showing signs. Vegetable oil typically ignites above 270oC.
• Use temperature controlled deep fryer rather than an open pan (be aware thermostat malfunc-tion can still lead to fires).
• Have a fire blanket and suitable chemical fire extinguisher on hand.
• If a fire occurs: do NOT throw water on the flames; do NOT fan the flames. DO turn off the heat source if it is safe to do so. DO remove oxygen source with a chemical fire extinguisher or blanket.
Sharps Hazard: knives • Closed shoes
• Students advised of safe cutting techniques

Teacher Resource Booklet 27
8. The Cheddar Challenge
How good is your cheese palate? This practical is a fun exercise to help support investigations into how different foods are made.
Cheese is a major product for the Australian dairy industry, with sales of around 260,000 tonnes of domestic product within Australia, for an estimated value approaching A$1.85 billion; and export sales of a further 171,000 tonnes, worth A$855 million in 2015/16.
There has been a long-term trend in production away from cheddar cheeses and toward non-cheddar cheese types. The non-cheddar share of total production volumes has steadily increased from 30% three decades ago, to between 45% and 50% in recent years. Cheddar cheese continues to make up 50% of all cheese produced, in 2015/16 171,590 tonnes of cheddar was produced in Australia.
The variety of cheese determines the ingredients, processing, and characteristics of the cheese.
Cheese can be broadly categorized as acid or rennet cheese, and natural or process cheeses. Acid cheeses are made by adding acid to the milk to cause the proteins to coagulate. Fresh cheeses, such as cream cheese, are made by direct acidification. Most types of cheese, such as cheddar or Swiss, use rennet (an enzyme) in addition to the starter cultures to coagulate the milk. The term “natural cheese” is an industry term referring to cheese that is made directly from milk. Process cheese is made using natural cheese plus other ingredients that are cooked together to change the textural and/or melting properties and increase shelf life.
The main ingredient in cheese is milk. Cheese is made using cow, goat, sheep, water buffalo or a blend of these milks.
Cultures for cheese making are called lactic acid bacteria (LAB) because their primary source of energy is the lactose in milk and their primary metabolic product is lactic acid. There is a wide variety of bacterial cultures available that provide distinct flavor and textural characteristics to cheeses. Starter cultures are used early in the cheese making process to assist with coagulation by lowering the pH prior to rennet addition.
The temperatures, times, and target pH for different steps, the sequence of processing steps, the use of salting or brining, block formation, and aging vary considerably between cheese types. The following flow chart provides a very general outline of steps for Cheddar cheese making:
1. Heat Treat Milk
2. Cool Milk
3. Inoculate with Starter & Non-Starter Bacteria and Ripen
4. Add Rennet and Form Curd
5. Cut Curd and Heat
6. Drain Whey
7. Texture Curd
8. Dry Salt or Brine
9. Form Cheese into Blocks
10. Store and Age
11. Package

28 Engaging students in STEM using Agriculture
The following practical illustrates the influence of the aging process.
Syllabus Links: AgEnt2 (C2, 3.9), AgSys3 (C5, 6.22), Food2 (C6).
Materials
1. Cheddar cheeses of different brands/prices/ages. Table 2 below includes a list of cheddars usually found in the supermarket.
2. Tooth picks for students to taste cheeses
Hands on exercise
[20 mins prep, 45 mins for exercise and answer share]
Before the lesson:
1. Purchase cheddar cheeses of different brands/prices/ages (see Table 2)
2. Randomly assign each cheese a letter and create tables similar to the examples below:
• Table 1: look at the labels of the cheeses to determine their age and any description the manufacturer provides. Order by age. This is for the students to fill out.
• Table 2: in this table reveal the unknown identities of each cheese (assigned letter, brand name, price/kg).
1. Cut up cheeses into small pieces, and place them on plates labelled with its assigned letter.
In the lesson:
1. Students try each cheese and attempt to guess the age of the cheese by matching what they taste (and its corresponding letter) with the ages/descriptions in Table 1.
2. Students are then given Table 2, where they can compare their guesses and also see the price/kg.
3. Students discuss how their guesses differed from the answers, and what characteristics seem to develop the longer the cheese is aged, and how.
Table 1: Example of a table given to students
Age of Cheddar Manufacturer’s Description Your Best Guess
????? A family favourite made from fresh local milk
Cheap “Tasty”,Very young!
A ‘homebrand’ cheese that doesn’t waste costly ink on providing a description!!!
9 month Smoked Firm texture. Naturally smoked with Tasmanian hardwood.
15 month “Vintage Light”
Has 25% less fat than regular vintage cheddar yet still retains a sharp flavour.
18 month “Extra Tasty” A mature cheddar aged to be extra strong
20 month “Vintage” Carefully aged to develop a sharp, full bodied flavour and crumbly texture
24 month “Vintage” A rich, aged cheddar cheese with a distinctive sharp bite and crumbly texture.
36 month “Vintage, Special Reserve”
Carefully aged up to 3 years for a distinctive sharp flavour and crumbly texture

Teacher Resource Booklet 29
Table 2: Answer sheet (including examples of cheese you could purchase at the supermarket)
Code Age of Cheddar Manufacturer’s DescriptionRank by Cost
Name and $/kg
B????? A family favourite made from
fresh local milk 6Great Ocean Road Cheddar$ 12.60
ACheap “Tasty”,Very young!
A ‘homebrand’ cheese that doesn’t waste costly ink on providing a description!!!
7Coles ‘Tasty’ Cheddar$ 9.00
G
9 month Smoked Firm texture. Naturally smoked with Tasmanian hardwood.
1
King Island Dairy Stokes Point Smoked Cheddar$ 47.00
H
15 month “Vintage Light” Has 25% less fat than regular vintage cheddar yet still retains a sharp flavour.
Equal 3rd
Cracker Barrel ‘Vintage Light’ 25% less fat$ 16.58
D18 month “Extra Tasty” A mature cheddar aged to be
extra strong5
Coles ‘Extra Tasty’$ 14.98
C20 month “Vintage” Carefully aged to develop a
sharp, full bodied flavour and crumbly texture
Equal 3rd Cracker Barrel Vintage ‘Extra Sharp’$ 16.58
F24 month “Vintage” A rich, aged cheddar cheese
with a distinctive sharp bite and crumbly texture.
Close 4thWarrnambool ‘Vintage’ $ 16.38
E
36 month “Vintage, Spe-cial Reserve”
Carefully aged up to 3 years for a distinctive sharp flavour and crumbly texture
2
Cracker Barrel Vin-tage Cheddar Special Reserve$ 23.96
This exercise could be adapted to demonstrate how different cheeses are produced. That is, milk is pasteurised and homogenised, and inoculated with starter culture. Rennin may be added and acid production leads to the formation of curds. For cottage cheese the process stops here; it is produced when the curd is not separated from the whey. But if the curd and whey are separated, and the curd is drained, cut and allowed to shrink, we can produce brie. Subsequent ripening processes are required to give cheddar and blue cheeses, with longer maturation times giving stronger flavours.
Risk Control Measure
Allergies/lactose intolerance Check student allergy records and ensure relevant students do not taste cheese
30 Engaging students in STEM using Agriculture
9. SEED GERMINATION
In the study of plant anatomy and physiology, the germination of seeds is of great importance, and if we want to grow plants from seed we need to find out what conditions to provide them with to help them on their way. This experiment aims to aid students in familiarisation with aspects of plant anatomy, life cycles, and the processes of germination and early plant growth.
The seeds of a plant can often remain dormant for long periods of time, until conditions that are favourable for plant growth trigger the seed to germinate. These trigger conditions vary between species, but generally these include: the presence of moisture (seeds must rehydrate to come out of dormancy); a certain temperature (some species germinate in spring, some in the hotter summer months); and whether it is light or dark (often dependent on the type of root or shoot that emerges from the seed and whether it immediately needs to photosynthesise).
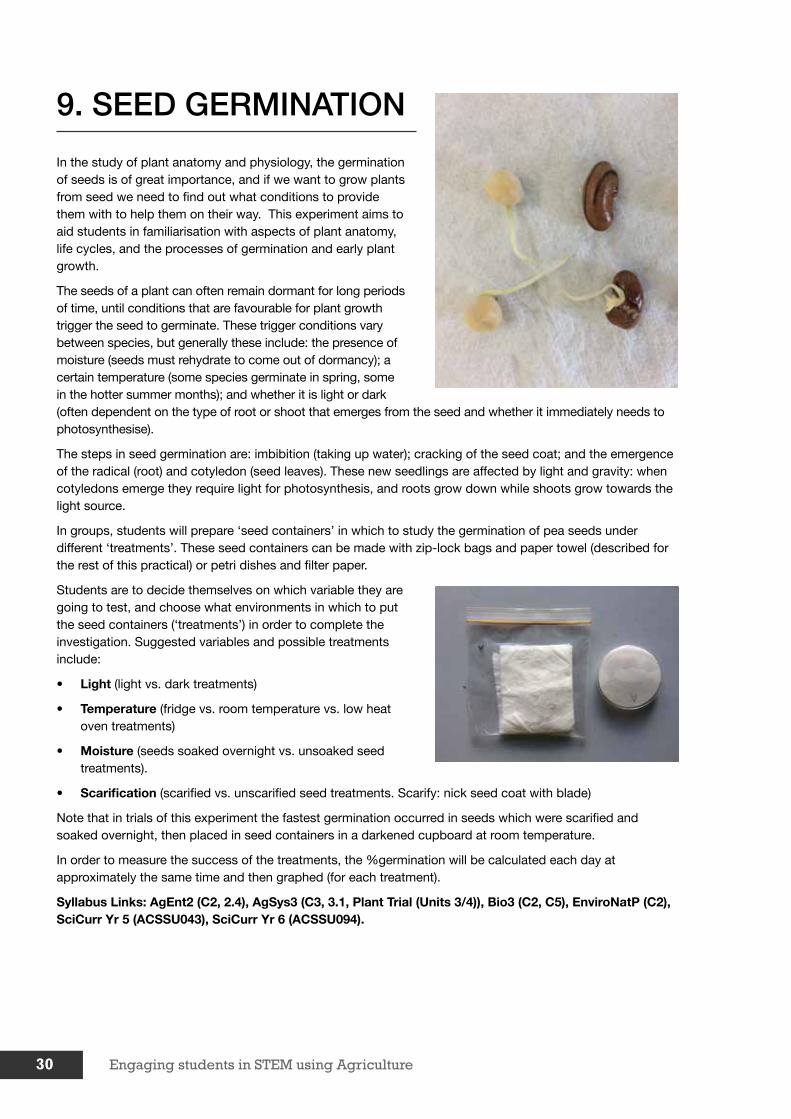
The steps in seed germination are: imbibition (taking up water); cracking of the seed coat; and the emergence of the radical (root) and cotyledon (seed leaves). These new seedlings are affected by light and gravity: when cotyledons emerge they require light for photosynthesis, and roots grow down while shoots grow towards the light source.
In groups, students will prepare ‘seed containers’ in which to study the germination of pea seeds under different ‘treatments’. These seed containers can be made with zip-lock bags and paper towel (described for the rest of this practical) or petri dishes and filter paper.
Students are to decide themselves on which variable they are going to test, and choose what environments in which to put the seed containers (‘treatments’) in order to complete the investigation. Suggested variables and possible treatments include:
• Light (light vs. dark treatments)
• Temperature (fridge vs. room temperature vs. low heat oven treatments)
• Moisture (seeds soaked overnight vs. unsoaked seed treatments).
• Scarification (scarified vs. unscarified seed treatments. Scarify: nick seed coat with blade)
Note that in trials of this experiment the fastest germination occurred in seeds which were scarified and soaked overnight, then placed in seed containers in a darkened cupboard at room temperature.
In order to measure the success of the treatments, the %germination will be calculated each day at approximately the same time and then graphed (for each treatment).
Syllabus Links: AgEnt2 (C2, 2.4), AgSys3 (C3, 3.1, Plant Trial (Units 3/4)), Bio3 (C2, C5), EnviroNatP (C2), SciCurr Yr 5 (ACSSU043), SciCurr Yr 6 (ACSSU094).

Teacher Resource Booklet 31
Materials1. Seeds (pea, runner bean, corn etc.)
2. Petri dishes and filter paper, OR;
3. Zip-lock bags and paper towel
4. Plastic droppers
5. Cups/beakers of water
6. Plastic tweezers/forceps
7. Razer blades
8. Gloves
9. Permanent pen
10. Dark cupboard, window sill, fridge, low heat oven (depends on investigation to be performed)
Hands on exercise
[45 min set up, daily 15 min observations]
1. In groups, students choose which variable they will choose to investigate and the treatments they will subject two seed containers to. They must also identify which variables need to be kept constant (e.g. if temperature effects are to be explored by placing one container in a fridge and one at room temperature, the latter should also be in a darkened cupboard so that light availability is the same).
2. Label two zip-lock bags with the group name and treatment (e.g. one light, one dark).
3. Insert a piece of folded paper towel into each zip-lock bag and use dropper to squirt water onto the towel until it is quite damp, but not past saturation. Ensure roughly equal volumes of water are used (e.g. 3 droppers full).
4. Place 10 seeds in on the paper towel in each bag. Place another piece of paper towel over the seeds that has also been folded and dampened but not soaked.
5. Half seal zip-lock bags (so water doesn’t evaporate quickly but anaerobic conditions are avoided (cover petri dish with lid if using petri dishes).
6. Place containers in environments to subject them to their treatments (e.g. ‘light’ containers on the window sill and ‘dark’ containers in a cupboard).
7. The next day, using gloves, open zip-lock bags and remove upper paper towel with tweezers. Count the number of seeds that have germinated (where germination is defined as the radical (root) emerging from the seed coat).
8. Record how many seeds have germinated in each bag, and calculate the percentage for each treatment (%germination).
9. Repeat steps 7-8 each day for 7-10 days (times can vary).
10. Graph %germination versus number of days for each treatment (separate graphs, or overlay two lines on the same graphs), and compare results. Discuss what effect the variable seems to have had on the seed germination process.
Day 3
Unsoakeddark, room temperature
Soaked overnightdark, room temperature

32 Engaging students in STEM using Agriculture
11. For pea seeds, the radical (root) emerges first, followed by the shoot. Make a labelled sketch of one of the seedlings, and discuss how the ideal conditions for germination may not be ideal for the further growth of this seedling.
Students may wish to take photos of their seeds each day to present as a stop-motion at the end!
Notes: If paper towel becomes dry more water may be added using the dropper, but ensure roughly equal amounts of water are given to each treatment. Beware of fungus growth in the moist environments created for seed germination, using gloves and tweezers to handle paper towels when checking seeds (see risk assessment below).
Extensions: Groups may investigate more than one variable (separate recording sheets should be used, see below), or they may make replicate containers (e.g. 2 zip-lock bags each containing 10 seeds for each treatment) for more challenging data analysis. In this experiment only %germination has been use to measure germination success, but students could measure the roots and shoots for each seedling as it emerges (using non-stretching fishing line), and average these lengths for each treatment each day. Separate graphs for each treatment can be made (average root length versus time) and compared.
Students’ Recording Sheet
Seed type: _________ (e.g. pea)
Factor to be investigated: ____________ (e.g. the effect of light on seed germination)
Treatments to be applied: ____________ (e.g. compare seed containers left in the light vs. dark)
Treatment _______________(e.g. light) ______________(e.g. dark)
No. Germinated % Germinated No. Germinated % Germinated
Day 1
Day 2
…
Day 7
Risk Control Measure
Sharps Hazard: razer blade use • Scarify seeds only on a stable surface, with demonstration of how to keep fingers away from the blade during cutting
• Closed shoes
Inhalation of spores: fungi (moulds) can grow in moist conditions (bags/dishes)
• Wear gloves when checking seeds
• Discard bags/dishes that begin to grow mould
shoot
root

Teacher Resource Booklet 33
10. UNPACK THE BIG MAC®
Fast food is an easy, tasty treat, but often takes the collaboration of many industries to bring the product to the consumer. This discussion, brainstorming and/or research exercise encourages students to think deeply about the food we consume and how it is produced. While this exercise can (and often should) be performed on all foods, the Big Mac Meal is a great example of a little product containing a big variety of components that we can examine.
This practical is written in a very regimented way, but only to give teachers an idea of topics and prompting questions they might like to cover. This much guidance will not be required for college students who have a high level of general knowledge and are actively engaged. For high school students, however, more of these stricter instructions can help to focus the discussion and keep students engaged. The exercise is formatted such that break-out groups of ~5 students discuss tasks/questions posed by the teacher, and the teacher asks groups for their thoughts between each topic. This could also be structured so that there is less teacher guidance, and groups are assigned one of the four topics below, asked to brainstorm and then present to the class. Lastly, groups could go away and research their topic and give a presentation to the class in the next practical.
Syllabus Links: AgEnt2 (1.112, 1.13, 3.9), AgSys3 (6.1, 6.13, 6.21, 6.22, 6.23), DesCurr Yr 9/10 (ACTDEK045), Food3 (Elective topic 2).
Materials
1. 4 Big Mac® meals with drink and fries
2. Plates
3. Butchers paper
4. Marker pens of different colours
5. Paper towel (to clean hands)
6. ‘Paddle-pop sticks or spatulas to separate parts
Hands on exercise[1.5 hours]
1. Each group of ~5 students is given a Big Mac meal in the centre of butchers paper that covers the table.
2. The meal is physically broken down into its ‘commodities’ (pattie, bun, sauce etc.), which are each placed on their own plate and arranged around the big mac at the centre. This begins to form a mind map, and students can draw lines from the Big Mac packaging in the middle, radiating out to each of the commodities.

34 Engaging students in STEM using Agriculture
3. Students are told the 4 topics they are going to explore in the practical (listed below).
The following are example instructions (and prompting questions) the teacher may or may not include, divided into topics. These are suggestions only and the practical may work better if students are able to brainstorm ideas for themselves when given more broad discussion topics.
Topic 1: Raw ingredients and how they’re produced.
4. On the butchers paper next to each commodity (plate), write the raw ingredients you would expect it to contain (leave a lot of room!)
a. Where do these raw ingredients come from originally? (Farms, imported spices...)
b. What types of industries are involved? (Dairy, beef, horticulture, cereal and grain…)
c. How much do you think these industries are worth in Australia? i.e. ‘how big’ are these industries? (See information at the end of this practical for answers).
Topic 2: The value-adding processing of raw ingredients to form commodities.
5. Next to each commodity, write what processes are required to turn the raw ingredients into that commodity. (e.g. pasteurisation of milk then fermentation by bacteria to create cheese).
a. What role can microbiology play in adding value to raw ingredients? (Yeast in bread helps it rise, bacteria turn milk to cheese, bacteria turn cucumbers to pickles)
Topic 3: Transport and supply chains that bring ingredients and commodities together.
6. On a spare space on the paper, identify how all components are likely to be transported, how far they are likely to travel and where they travel to and from. (e.g. trucks, planes or boats; may require refrigeration; interstate/overseas travel likely to be required as the climate is different all over the country and some states are larger suppliers than others of certain ingredients; travel from farms, to factories, to various warehouses, to restaurant outlets).
a. What impact does transport and large scale factory processing have economically (economy of scale), on the environment and on the quality of the product?
b. How much time do you think it takes for a product to be harvested, to when it is served in the burger?
c. Estimate and add up the food miles for the Big Mac!
Topic 4: Measures put in place to preserve food and keep it safe for consumption.
7. Make a list of ways that the food might become unsafe or undesirable to consumers (e.g. heat leads to degradation of food by enzymes and microorganisms, bread going stale).
8. What measures have been taken to ensure that the food is safe for consumption (e.g. refrigeration, addition of salt, chemical preservatives, pickling of cucumbers)
Looking at the big picture
9. Looking over everything that has been written so far, name as many industries as possible that are involved in the production of the Big Mac.
10. Do the same for as many types of sciences that are involved. (Horticulture, entomology for pest control, engineering, chemistry, physics, veterinary science etc.)

Teacher Resource Booklet 35
11. As a class, name as many jobs/roles as you can that have been involved in the production of the Big Mac meal! (e.g. Farm manager, grain traders, animal nutritionists, agronomists, truck drivers, microbiologists, food safety specialists, chemists, restaurant staff, engineers to make processing equipment, computer programmers, accountants etc.)
Some interesting information to help in discussions!Special Sauce Ingredients: Soybean Oil, Water, Pickles, Sugar, High Fructose Corn Syrup, Distilled Vinegar, Corn Syrup, Salt, Xanthan Gum/thickener 415, Spice Extract, Mustard, Salted Egg Yolks, Onion, Spices, Sugar, Salt, Hydrolysed Protein (Corn, Wheat & Soy), Garlic
‘How big’ are different industries in Australia?
Beef – 23.1 million cows, ~2,260 million tonnes beef produced, $8.8 billion exported
Cheese – $4 billion/year, 360,000 tonnes/year
Milk – 9820 ML/year
Lettuce – $187 million/year
Pickles (immature cucumbers) – $4.5 million/year, 1,800 tonnes (sole supplier is Griffith, NSW)
Onions – ~$240 million/year, 315,000 tonnes
Potatoes – $617 million/year, 1.15 million tonnes, Simplot and McCain in Tasmania produce most of Australia’s fries!
Bread (wheat) – $5.57 billion, 710 Mtonnes/year, 221 million Ha of planted wheat.
Sugar – 35 million tonnes/year, 380,000 Ha, 95% of Australian sugar is produced in QLD.
36 Engaging students in STEM using Agriculture
11. PHOTOSYNTHESIS AND FRUIT RIPENING
This practical explores the concept of photosynthesis, and ideally involves a class discussion followed by practical tests that demonstrate the effects of photosynthesis on the ripening of fruit.
To make this a complete lesson, the following discussion points would be addressed before the practical component:
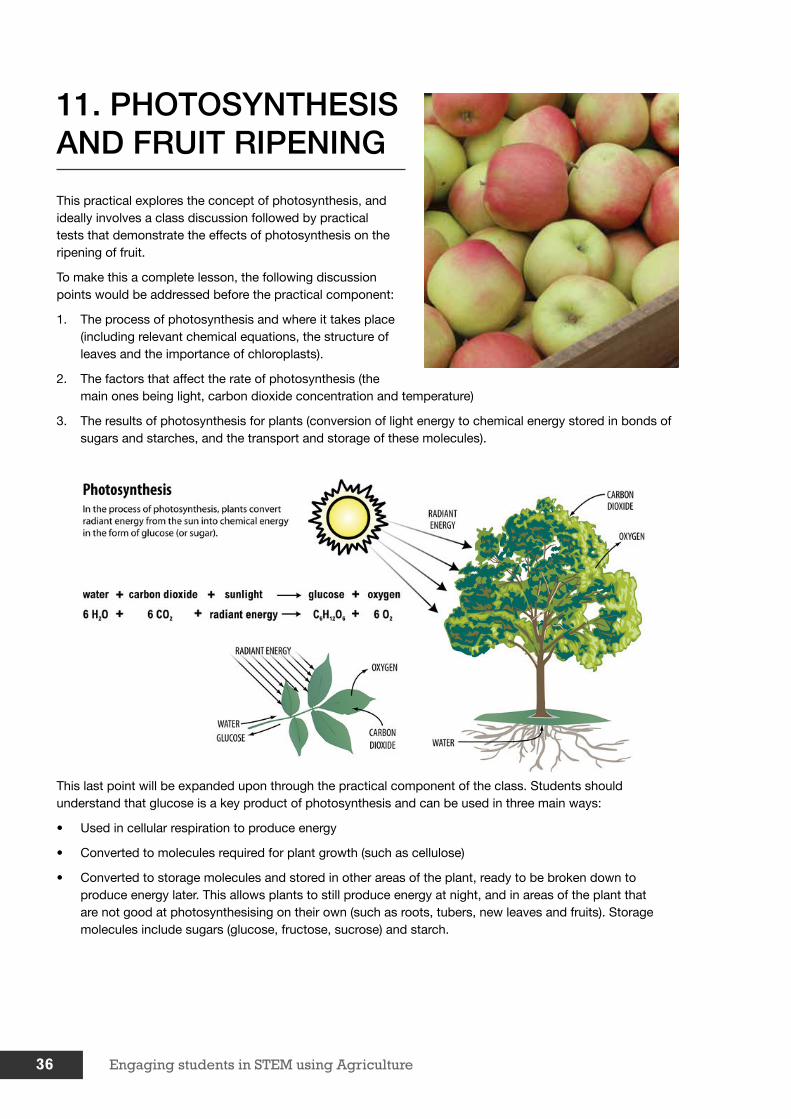
1. The process of photosynthesis and where it takes place (including relevant chemical equations, the structure of leaves and the importance of chloroplasts).
2. The factors that affect the rate of photosynthesis (the main ones being light, carbon dioxide concentration and temperature)
3. The results of photosynthesis for plants (conversion of light energy to chemical energy stored in bonds of sugars and starches, and the transport and storage of these molecules).
This last point will be expanded upon through the practical component of the class. Students should understand that glucose is a key product of photosynthesis and can be used in three main ways:
• Used in cellular respiration to produce energy
• Converted to molecules required for plant growth (such as cellulose)
• Converted to storage molecules and stored in other areas of the plant, ready to be broken down to produce energy later. This allows plants to still produce energy at night, and in areas of the plant that are not good at photosynthesising on their own (such as roots, tubers, new leaves and fruits). Storage molecules include sugars (glucose, fructose, sucrose) and starch.

Teacher Resource Booklet 37
An excellent learning tool for this is an animation created by the University of Iowa:
http://www.indiana.edu/~oso/animations/potato.swf
The chemical composition of the fruit is of particular interest in agriculture, as sweet, tasty fruit is what we want to provide for consumers! As a result of photosynthesis, starch and sugar molecules build up in young fruit, and as the fruit ripens starch is broken back down into sugars. Agricultural scientists can measure these properties (starch and sugar levels) to determine fruit ripeness. Fruit firmness and colour can also be quantitatively measured, however these tests are not included in this practical (although can be observed by students qualitatively).
Materials
1. Fruit at 4 stages of ripeness – cherries, grapes or apples recommended
2. Dropper pipettes
3. Knife, mortar and pestle
4. Small containers/test tubes for collecting juice
5. Digital or hand-held refractometer (~$300, though dependent on type/model)1
6. Tissues
7. Iodine stain (prep: dissolve 1g iodine, and 2g potassium iodide in 300 mL distilled water)
8. Flat-bottomed container/tray (for apple iodine starch test)
9. Test tubes (for fruit juice iodine starch test)
10. Print-outs of apple comparison chart (Cornell starch-iodidne index)
1 Walch Optics in Hobart can order refractometers (http://www.walchoptics.com.au/)
38 Engaging students in STEM using Agriculture
Hands on exercise: Sugar, pH and starch tests
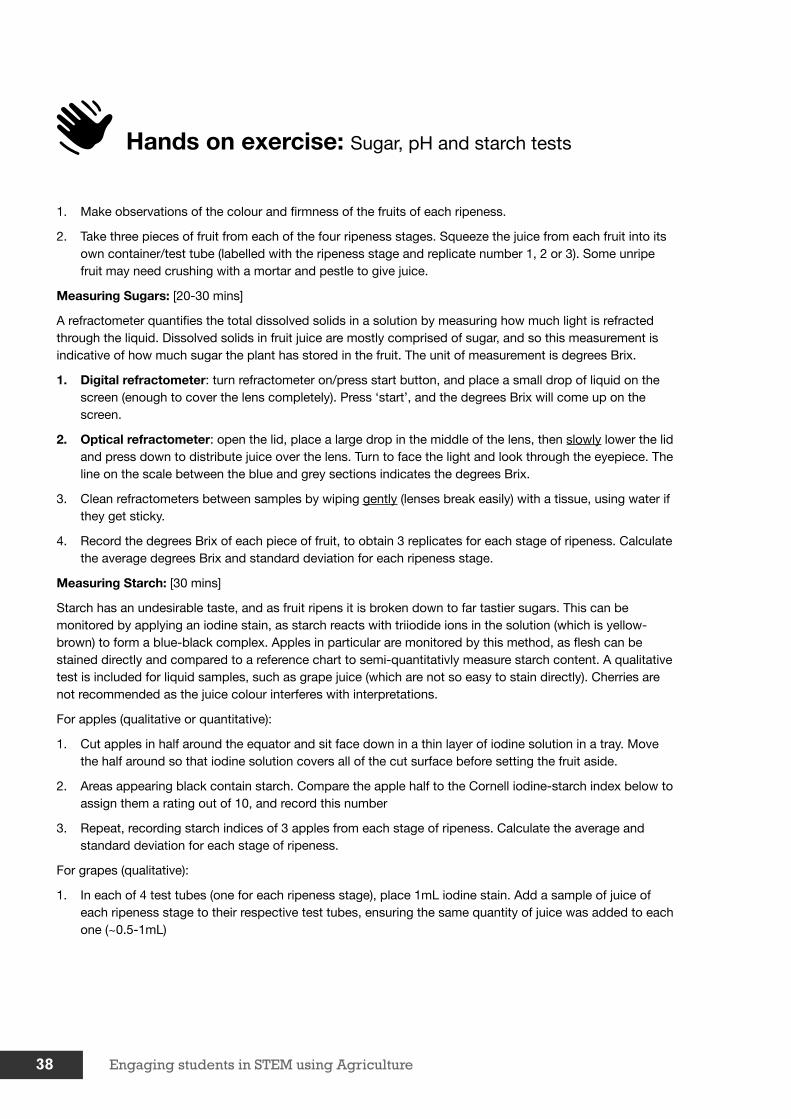
1. Make observations of the colour and firmness of the fruits of each ripeness.
2. Take three pieces of fruit from each of the four ripeness stages. Squeeze the juice from each fruit into its own container/test tube (labelled with the ripeness stage and replicate number 1, 2 or 3). Some unripe fruit may need crushing with a mortar and pestle to give juice.
Measuring Sugars: [20-30 mins]
A refractometer quantifies the total dissolved solids in a solution by measuring how much light is refracted through the liquid. Dissolved solids in fruit juice are mostly comprised of sugar, and so this measurement is indicative of how much sugar the plant has stored in the fruit. The unit of measurement is degrees Brix.
1. Digital refractometer: turn refractometer on/press start button, and place a small drop of liquid on the screen (enough to cover the lens completely). Press ‘start’, and the degrees Brix will come up on the screen.
2. Optical refractometer: open the lid, place a large drop in the middle of the lens, then slowly lower the lid and press down to distribute juice over the lens. Turn to face the light and look through the eyepiece. The line on the scale between the blue and grey sections indicates the degrees Brix.
3. Clean refractometers between samples by wiping gently (lenses break easily) with a tissue, using water if they get sticky.
4. Record the degrees Brix of each piece of fruit, to obtain 3 replicates for each stage of ripeness. Calculate the average degrees Brix and standard deviation for each ripeness stage.
Measuring Starch: [30 mins]
Starch has an undesirable taste, and as fruit ripens it is broken down to far tastier sugars. This can be monitored by applying an iodine stain, as starch reacts with triiodide ions in the solution (which is yellow-brown) to form a blue-black complex. Apples in particular are monitored by this method, as flesh can be stained directly and compared to a reference chart to semi-quantitativly measure starch content. A qualitative test is included for liquid samples, such as grape juice (which are not so easy to stain directly). Cherries are not recommended as the juice colour interferes with interpretations.
For apples (qualitative or quantitative):
1. Cut apples in half around the equator and sit face down in a thin layer of iodine solution in a tray. Move the half around so that iodine solution covers all of the cut surface before setting the fruit aside.
2. Areas appearing black contain starch. Compare the apple half to the Cornell iodine-starch index below to assign them a rating out of 10, and record this number
3. Repeat, recording starch indices of 3 apples from each stage of ripeness. Calculate the average and standard deviation for each stage of ripeness.
For grapes (qualitative):
1. In each of 4 test tubes (one for each ripeness stage), place 1mL iodine stain. Add a sample of juice of each ripeness stage to their respective test tubes, ensuring the same quantity of juice was added to each one (~0.5-1mL)
Teacher Resource Booklet 39
2. Observe whether there is more or less blue-black colour/precipitate, the riper the fruit is.
In agriculture, photosynthesis is vital in ripening fruit, as it is this build up of glucose (and it’s sugar derivatives) that gives fruit its sweet taste, and the build up of acids (lowering of pH) that removes the bitter taste. In order to entice people into eating healthy fresh produce, the produce needs to be tasty! We often manipulate systems in order to maximise the fruit ripening process by taking advantage of photosynthesis. For example, glasshouses are used to grow tomatoes, which are warm and full of sunlight, ideal conditions for photosynthesis. Also, pruning fruit trees into a ‘vase shape’ with less foliage in the centre allows all leaves to be exposed to maximum sunlight, and therefore fruit all over the tree to have the best chances of building up their sugar stores.
Syllabus Links: AgSys3 (C3, C6), Bio3 (C5), EnviroSci (C5), LifeSci2 (C6).
Very Unripe Unripe Ripe Overripe
Colour
Firmness
Degrees Brix
Average: ± Average: ± Average: ± Average: ±
Iodine Stain
Average: ± Average: ± Average: ± Average: ±
Risk Control Measure
Chemical Exposure: iodine is highly hazardous (irritant, corrosive, permeator); potassium iodide is slightly hazardous (irritant).
• Tech staff/teacher to handle iodine by preparing iodine stain before lesson.
• PPE (gloves, labcoats, eye protection)
Sharps Hazard: knives • Closed shoes• Students advised of safe cutting techniques

40 Engaging students in STEM using Agriculture
Cornell Starch-Iodine Index can be found at:
https://content.ces.ncsu.edu/maximizing-your-smartfresh-investment

Teacher Resource Booklet 41
12. SPOT THE STOMATA
Stomata are pores found on the surface of leaves that facilitate the movement of carbon dioxide, oxygen and water into and out of the plant. They can be opened or closed by the plant and play a critical role in photosynthesis, water transport and plant respiration. In this practical students prepare imprints of leaf surfaces to examine stomata and epidermal cells through a microscope.
Stomata are pores in the epidermis of plant leaves comprising of a pair of ‘guard cells,’ which control the opening and closing of the pores. The number, shape and spatial arrangement of stomata depend on the plant, and differ greatly between monocots and dicots. Dicots will be focused on in this practical. In dicot species guard cells are kidney shaped, and generally distributed randomly over the cells epidermis, often easily distinguished from the irregularly shaped epidermal cells.
When a stomate is open, carbon dioxide is able to diffuse into the leaf and is used for photosynthesis. Plants have therefore evolved to open their stomata when they are in the light. Also when stomata are open, water diffuses out of the leaf through transpiration. While this is important for the plant to be able to draw more water up from its roots, and for excess heat to be released, high rates of water loss can lead to dehydration. Plants must therefore strike a balance: they change the number, distribution and opening times of stomata in order to allow enough CO
2 in for efficient photosynthesis, but not too much water out, to avoid dehydration.
By taking imprints of leaf surfaces, under a microscope we can count stomata and examine whether they are open or closed. We can explore how different plants arrange their stomata, and how different ‘treatments’ affect stomata numbers, distributions and apertures. Groups of students are assigned one of the investigations below, and report their findings in a presentation to the class:
Part 1: The distribution of stomata on the upper versus the lower surfaces of dicot leaves.
Part 2: The effect of light on the aperture of stomata (whether they are open/closed in the day).
Part 3: The effect of water logging (a type of plant stress) on the aperture of stomata.
Syllabus Links: AgEnt2 (C2, 2.4), AgSys3 (C3, 3.1, 3.2, 3.9, Plant Trial (Units 3/4)), Bio3 (C2, C5, C7), EnviroSci3 (C5), LifeSci2 (C5, C6), SciCurr Yr 8 (ACSSU150).
Epidermal Cell
Stomata
Guard Cells

42 Engaging students in STEM using Agriculture
Materials
1. Plants to study (see Preparation of Plants, below).
2. Binocular slide microscope, where the area of field of view is known for each magnification
3. Glass microscope slides
4. Permanent pen
5. Sharps disposal container
6. Clear nail polish
7. Sticky tape/scissors
8. Dark cupboard/box
9. Bright light (only if it is not a sunny day)
Hands on exercise: Sugar, pH and starch tests
Preparation of Plants:
Only dicots will be used in this practical (e.g. rose, pea, daisy, clover). These can be recognised by branched vein systems in their leaves, as opposed to straight, parallel veins in the leaves of monocots (e.g. corn, agapanthus). Plants must be at least 4-5 weeks old with at least 5-6 mature leaves on each. Leaves must not be picked until just before imprints are taken (as stomata will close).
Part 1: Students can collect 2 leaves of any dicots from the garden, backyard or bush for part 1.
Part 2: Pot plants are best but not crucial, where half the plants are placed in the sun and half in a darkened room/cupboard/box for 2 hours prior to the practical. If outdoor plants are used, place a box/cover over the plant rather than picking a leaf and placing it in the dark.
Part 3: Pot plants are required (e.g. pea plants) in order to apply water logging treatment. Half the plants should be water logged for 7-10 days before the practical. The aim is to put the plant under stress so that its stomata partially close, but ensure that the waterlogging is not lethal.
Investigations:
Part 1:
Stomata can occur on both sides of the leaf, but are often more prolific on the under side (facing the ground) than the upper (facing the sun) in dicot species. This adaptation may be due to the reduced potential for water loss by transpiration on the shadier side of the leaf. Remember, we want to keep CO2 diffusion rates high, while minimising water loss. Note that leaves without a clear ‘shadier side’ or growing under in partial shade (such as clover, shaded by grasses) may not exhibit this trend.
To investigate this, students take two mature leaves from the same plant and make imprints of the underside of one, and the upper side of the other. They calculate the average stomatal density (process described below) for each, and compare them, proposing a reason for their result.
DicotMonocot
Teacher Resource Booklet 43
Students may wish to repeat this for various species, including some growing in shady versus sunny areas, to compare their stomatal density distribution.
Part 2:
In general, stomata are open during the day, to allow CO2 into the leaf for photosynthesis (which needs sunlight). They then close at night to reduce water loss (note O2 from cellular respiration is released when stomata open in the morning).
To examine whether stomata ‘automatically’ open in the light and close in the dark, imprints are taken of the lower sides of leaves from two different plants of the same species: one which has been in bright sunlight (or under a bright light) for two hours, and one which has been in the dark for two hours. Students make sketches of the epidermal cells and stomata for both, assessing the light dependence of stomata aperture. There is no need to calculate stomatal density in this exercise.
Part 3:
Water logging in the soil around plant roots creates an anaerobic environment, and induces plant stress responses, which include the closure or partial closure of stomata to limit water loss. To examine this response students take lower leaf surface imprints and examine the aperture of stomata (sketching cells as in Part 2) of two plants of the same species (both having been in the light for at least 2 hours): one that has experienced water logging for 7-10 days, and one that has been watered normally. There is no need to calculate stomatal density in this exercise.
Taking an imprint of leaf’s surface and examining stomata: [1 hr for 2 leaf surfaces]
1. Detach a leaf from the plant (or a leaf segment several cm long if the leaf is too big).
2. Apply a small amount of nail polish to ‘paint’ several thin strips onto the portion of the leaf to be examined (i.e. choose the upper or lower side of the leaf according to your investigation).
3. Leave the leaf on a labelled piece of paper, nail polish side up, to dry for ~30 mins.
4. Repeat the procedure for all other species/treatments/surfaces you are studying, according to your investigation (and leave to dry for ~30 minutes).
5. Place a strip of clear sticky tope over the dried nail polish and press down. Slowly peel the tape and leaf away from each other. The nail polish imprint should be stuck to the sticky tape. If this doesn’t work, try again on one of the other strips of polish you made on this leaf.

44 Engaging students in STEM using Agriculture
6. Stick the sticky tape on a glass slide. Label the slide with permanent pen.
7. Using correct microscope technique, view the imprints starting with the lowest magnification and increasing until stomata can be clearly seen, and there are few enough in the field of view (FOV) that they are easy to count (likely to be 400x magnification, 40x objective).
8. For investigation Parts 2 and 3, note the aperture of stomata and sketch the cells you see. You may need to compare slides to be able to judge how open the stomata are.
9. If you are required to calculate stomatal density (Investigation Part 1), continue through steps 10-14.
10. Either given by the teacher, or calculated by the student (instructions not included), record the area of the field of view at the magnification you decided on [A] in mm2.
11. Count the number of stomata visible in your field of view and record this [N].
12. Calculate the stomatal density of this area [SD] in ‘number of stomata per mm2’, where: SD = N/A.
13. Repeat steps 11 and 12 twice more by moving the slide platform and finding a new area of the imprint at random. Record [SD] for each.
14. Average these 3 [SD] measurements and calculate standard deviation.
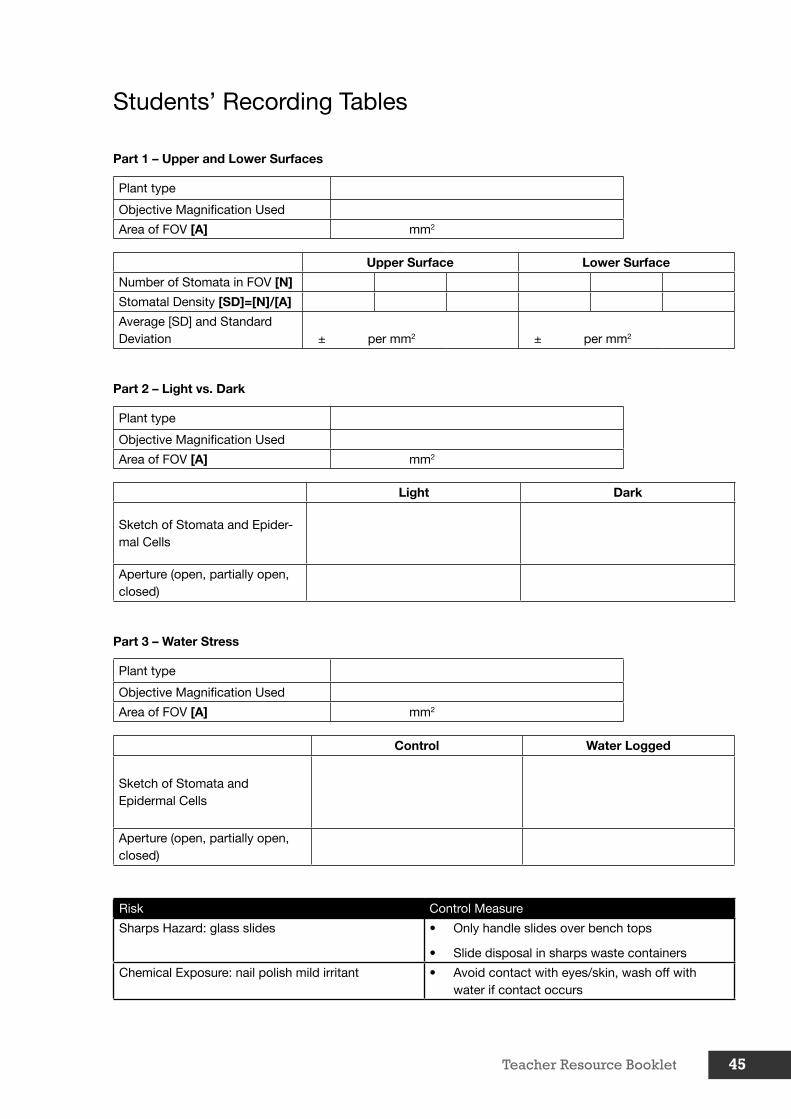
Teacher Resource Booklet 45
Students’ Recording Tables
Part 1 – Upper and Lower Surfaces
Plant type
Objective Magnification Used
Area of FOV [A] mm2
Upper Surface Lower Surface
Number of Stomata in FOV [N]
Stomatal Density [SD]=[N]/[A]
Average [SD] and Standard Deviation ± per mm2 ± per mm2
Part 2 – Light vs. Dark
Plant type
Objective Magnification Used
Area of FOV [A] mm2
Light Dark
Sketch of Stomata and Epider-mal Cells
Aperture (open, partially open, closed)
Part 3 – Water Stress
Plant type
Objective Magnification Used
Area of FOV [A] mm2
Control Water Logged
Sketch of Stomata and Epidermal Cells
Aperture (open, partially open, closed)
Risk Control Measure
Sharps Hazard: glass slides • Only handle slides over bench tops
• Slide disposal in sharps waste containers
Chemical Exposure: nail polish mild irritant • Avoid contact with eyes/skin, wash off with water if contact occurs

46 Engaging students in STEM using Agriculture
School of Land and Food / TIA Resources suitable for field trips
The University Farm, CambridgeThe University Farm is a mixed farming property in Cambridge and is the venue for much learning and teaching of agricultural science and research activity.
The research facility consists of:
• 320 hectares
• Mixed farm operations including sheep, pasture, fodder crops, cereals, stone fruit orchard, vineyard, and various trial plots
• Irrigation infrastructure
• Meeting rooms
• Sheds
To have these facilities available 20 minutes from the University is an extremely valuable resource. A variety of exciting research outcomes have resulted from activity at the farm and have played a crucial role in the growth of major industries in Tasmania. The farm had a critical role in the early development and commercialisation of essential oil crops, such as peppermint and fennel, and the pyrethrum industry.
Effectively a field laboratory, the farm hosts research activity into animals, grains, land management and salinity, pasture production, apricots and wine.
The farm is currently managed by local farmers Ronald and Chris Gunn, who look after the commercial enterprises of the farm as well as interacting with the University to facilitate and support teaching and research.
It is important that the farm operates on a commercial scale to provide a backdrop for teaching and research as well as having the flexibility to provide smaller areas to conduct experiments.
Please contact the School of Land and Food, Jo Jones, [email protected] should you require further information about the University Farm at Cambridge.
APPENDIX 1
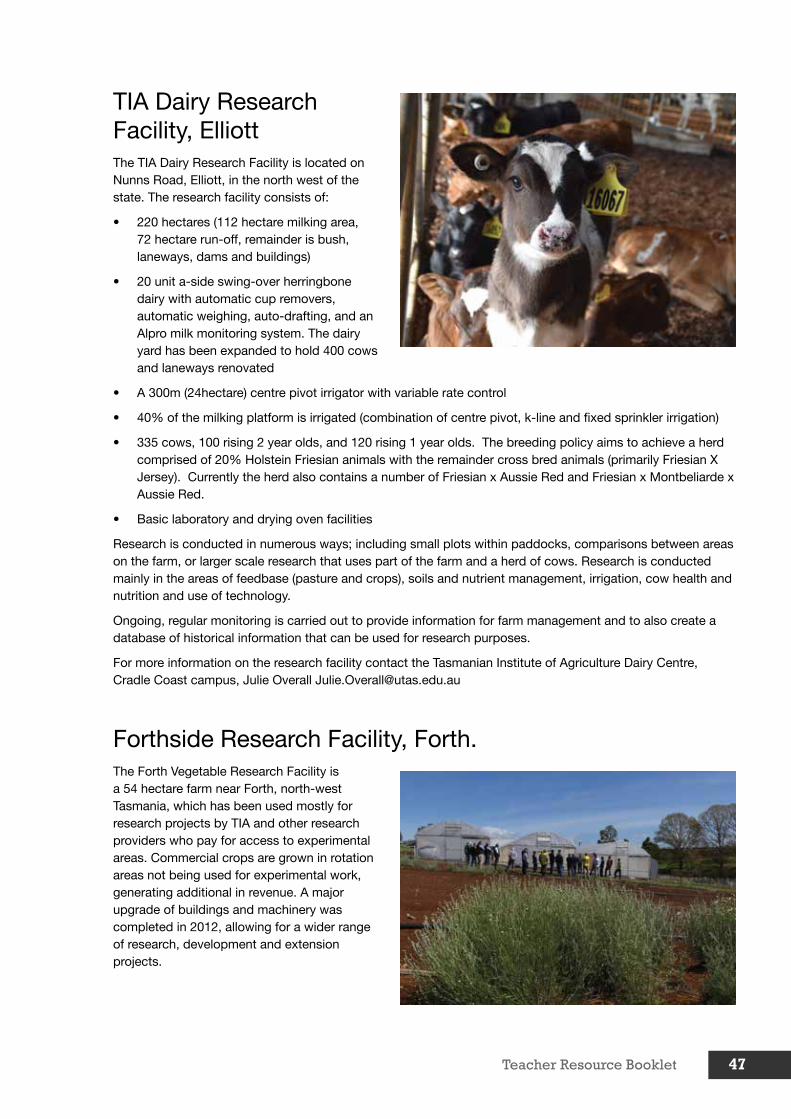
Teacher Resource Booklet 47
TIA Dairy Research Facility, ElliottThe TIA Dairy Research Facility is located on Nunns Road, Elliott, in the north west of the state. The research facility consists of:
• 220 hectares (112 hectare milking area, 72 hectare run-off, remainder is bush, laneways, dams and buildings)
• 20 unit a-side swing-over herringbone dairy with automatic cup removers, automatic weighing, auto-drafting, and an Alpro milk monitoring system. The dairy yard has been expanded to hold 400 cows and laneways renovated
• A 300m (24hectare) centre pivot irrigator with variable rate control
• 40% of the milking platform is irrigated (combination of centre pivot, k-line and fixed sprinkler irrigation)
• 335 cows, 100 rising 2 year olds, and 120 rising 1 year olds. The breeding policy aims to achieve a herd comprised of 20% Holstein Friesian animals with the remainder cross bred animals (primarily Friesian X Jersey). Currently the herd also contains a number of Friesian x Aussie Red and Friesian x Montbeliarde x Aussie Red.
• Basic laboratory and drying oven facilities
Research is conducted in numerous ways; including small plots within paddocks, comparisons between areas on the farm, or larger scale research that uses part of the farm and a herd of cows. Research is conducted mainly in the areas of feedbase (pasture and crops), soils and nutrient management, irrigation, cow health and nutrition and use of technology.
Ongoing, regular monitoring is carried out to provide information for farm management and to also create a database of historical information that can be used for research purposes.
For more information on the research facility contact the Tasmanian Institute of Agriculture Dairy Centre, Cradle Coast campus, Julie Overall [email protected]
Forthside Research Facility, Forth.The Forth Vegetable Research Facility is a 54 hectare farm near Forth, north-west Tasmania, which has been used mostly for research projects by TIA and other research providers who pay for access to experimental areas. Commercial crops are grown in rotation areas not being used for experimental work, generating additional in revenue. A major upgrade of buildings and machinery was completed in 2012, allowing for a wider range of research, development and extension projects.
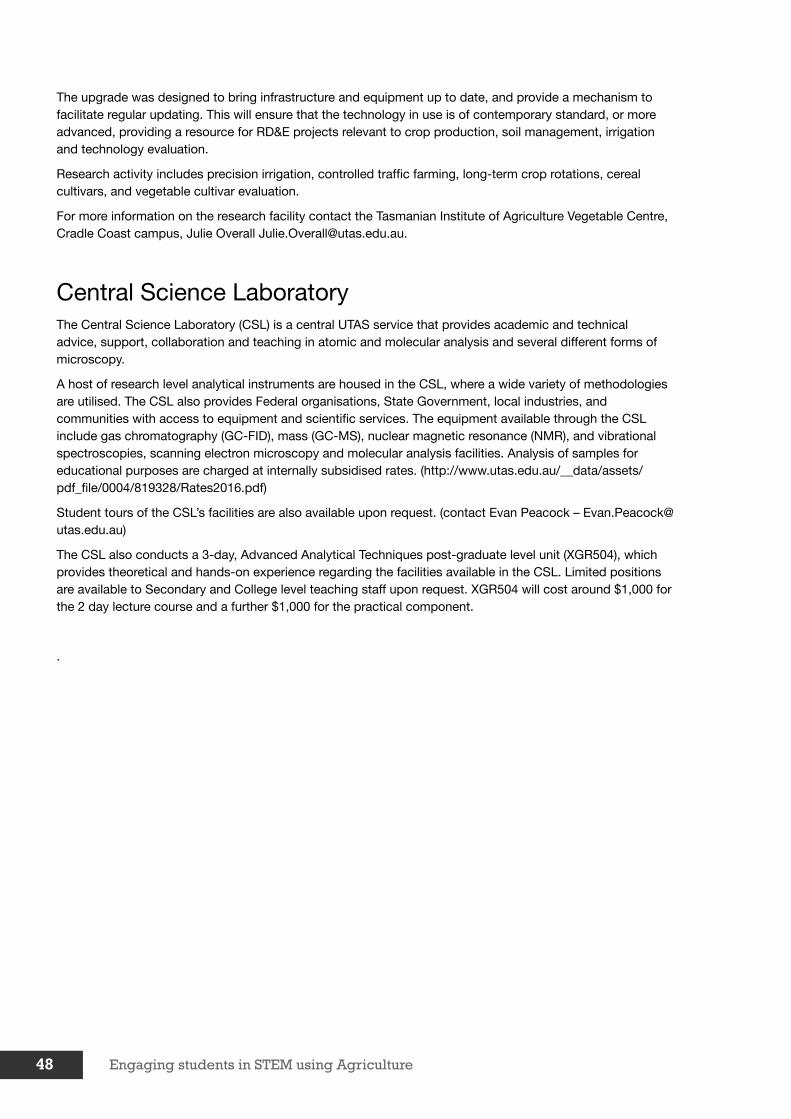
48 Engaging students in STEM using Agriculture
The upgrade was designed to bring infrastructure and equipment up to date, and provide a mechanism to facilitate regular updating. This will ensure that the technology in use is of contemporary standard, or more advanced, providing a resource for RD&E projects relevant to crop production, soil management, irrigation and technology evaluation.
Research activity includes precision irrigation, controlled traffic farming, long-term crop rotations, cereal cultivars, and vegetable cultivar evaluation.
For more information on the research facility contact the Tasmanian Institute of Agriculture Vegetable Centre, Cradle Coast campus, Julie Overall [email protected].
Central Science LaboratoryThe Central Science Laboratory (CSL) is a central UTAS service that provides academic and technical advice, support, collaboration and teaching in atomic and molecular analysis and several different forms of microscopy.
A host of research level analytical instruments are housed in the CSL, where a wide variety of methodologies are utilised. The CSL also provides Federal organisations, State Government, local industries, and communities with access to equipment and scientific services. The equipment available through the CSL include gas chromatography (GC-FID), mass (GC-MS), nuclear magnetic resonance (NMR), and vibrational spectroscopies, scanning electron microscopy and molecular analysis facilities. Analysis of samples for educational purposes are charged at internally subsidised rates. (http://www.utas.edu.au/__data/assets/pdf_file/0004/819328/Rates2016.pdf)
Student tours of the CSL’s facilities are also available upon request. (contact Evan Peacock – [email protected])
The CSL also conducts a 3-day, Advanced Analytical Techniques post-graduate level unit (XGR504), which provides theoretical and hands-on experience regarding the facilities available in the CSL. Limited positions are available to Secondary and College level teaching staff upon request. XGR504 will cost around $1,000 for the 2 day lecture course and a further $1,000 for the practical component.
.

Teacher Resource Booklet 49
NOTES

50 Engaging students in STEM using Agriculture
NOTES

Teacher Resource Booklet 51

TASMANIANINSTITUTE OFAGRICULTURE