teacher turnover report annual report on the reasons
TRANSCRIPT

0
TEACHER TURNOVER REPORT
Annual Report on the Reasons
Teachers Leave
2011-2012
Prepared by:
Public Schools of North Carolina
Department of Public Instruction
Division of Educator Recruitment and Development
September 2012
1
TEACHER TURNOVER REPORT
2011-2012
G. S. 115C-12(22) requires the State Board of Education to monitor and compile an annual report on the decisions
of teachers to leave the teaching profession. To this end, LEAs are asked to complete a survey on an annual basis.
The survey for the 2011-2012 school year asked LEAs to report the total number of teachers employed in the system
between March 2011 and March 2012, the total number of teachers leaving the system, the number of teachers with
tenure who were leaving, and the reason given by teachers for leaving. The results of the surveys are summarized in
the following pages.
Teacher Turnover Reporting Data 2011-2012
LEA level turnover for the 2012 School Report Card is calculated based on the individuals employed in the LEA as
teachers in March 2011, but not employed in the LEA as teachers in March 2012, as reflected in the DPI
Licensure/Salary database. LEA turnover does not include teachers who moved from one school to another school
in the LEA. Personnel administrators were provided a list of individuals employed as teachers in the LEA in March
2011, but not employed in the LEA as teachers in March 2012, and asked to provide summative data on the reasons
these teachers left teaching. The numbers of teachers leaving when totaled should equal the total number of teachers
on the list provided to the LEA personnel administrator. This change brings consistency to the turnover numbers
that are being reported.
Appendix A provides information as to how teacher turnover was determined for 2011-2012. This is the same
procedure used for the State Report Card.
Survey Instruments Used
Copies of the survey used and clarifying examples are contained in Appendix B. As before, LEAs were asked to
identify up to five teaching areas in which they found the greatest difficulty in hiring appropriately licensed teachers.
Their responses have been summarized and are included in this report.
Turnover
The 115 school systems reported that 11,791 teachers of the 97,184 teachers employed during the 2011-2012 school
year left their systems for a system-level turnover rate of 12.13%. This represents a slight increase in the turnover
rate reported for the 2010-2011 school year (11.17%). This figure includes Visiting International Faculty (VIF) who
are required to return to their home countries after three years. VIF teachers accounted for 57 teachers who left;
removal of this category would reflect a system level turnover rate of 12.07%.
Of the 11,791 teachers reported leaving, 5,599 (47.48%) had tenure. During the 2010-11 school year 42.56% of the
teachers who left had tenure; during the 2009-10 school year, 36.52% of the teachers who left teaching had tenure;
and during the 2008-09 school year 35.55% of the teachers who left had tenure.
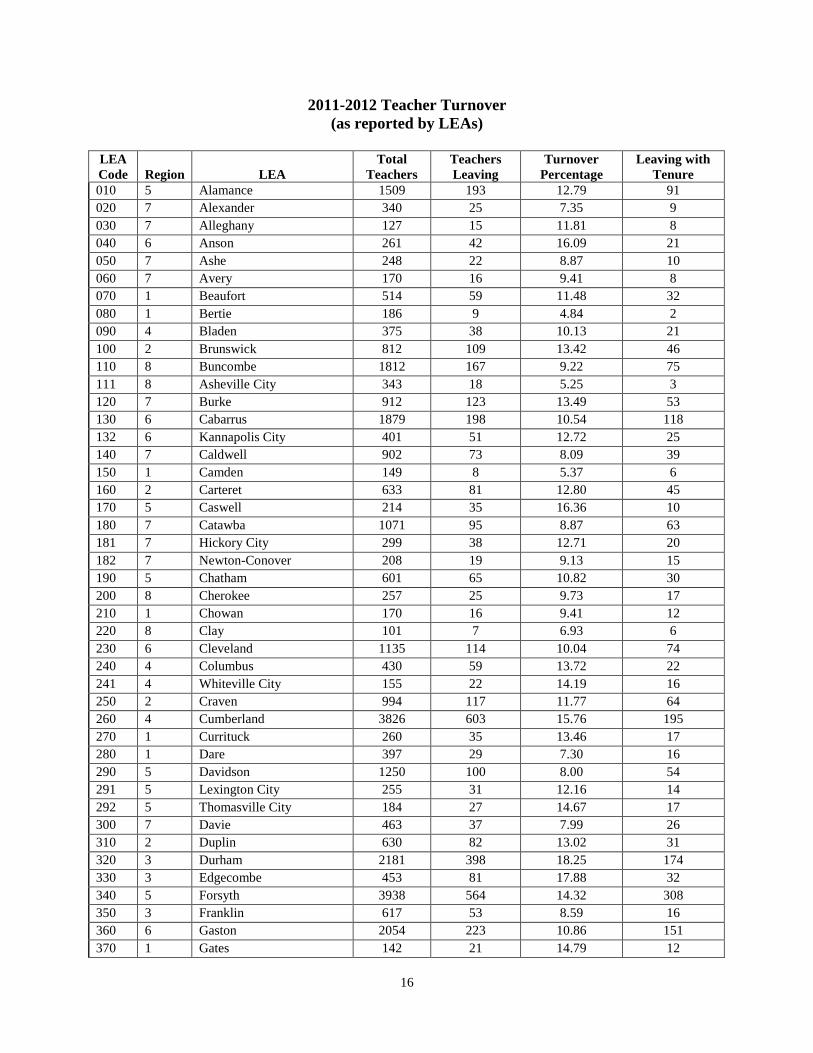
Turnover rates ranged from a high of 28.41% in Weldon City Schools to a low of 2.02% in Elkin City Schools. A
listing of turnover by systems is included in Appendix C. Appendix D contains a listing of turnover reported by
local systems for the last five years.

2
Reasons for Leaving
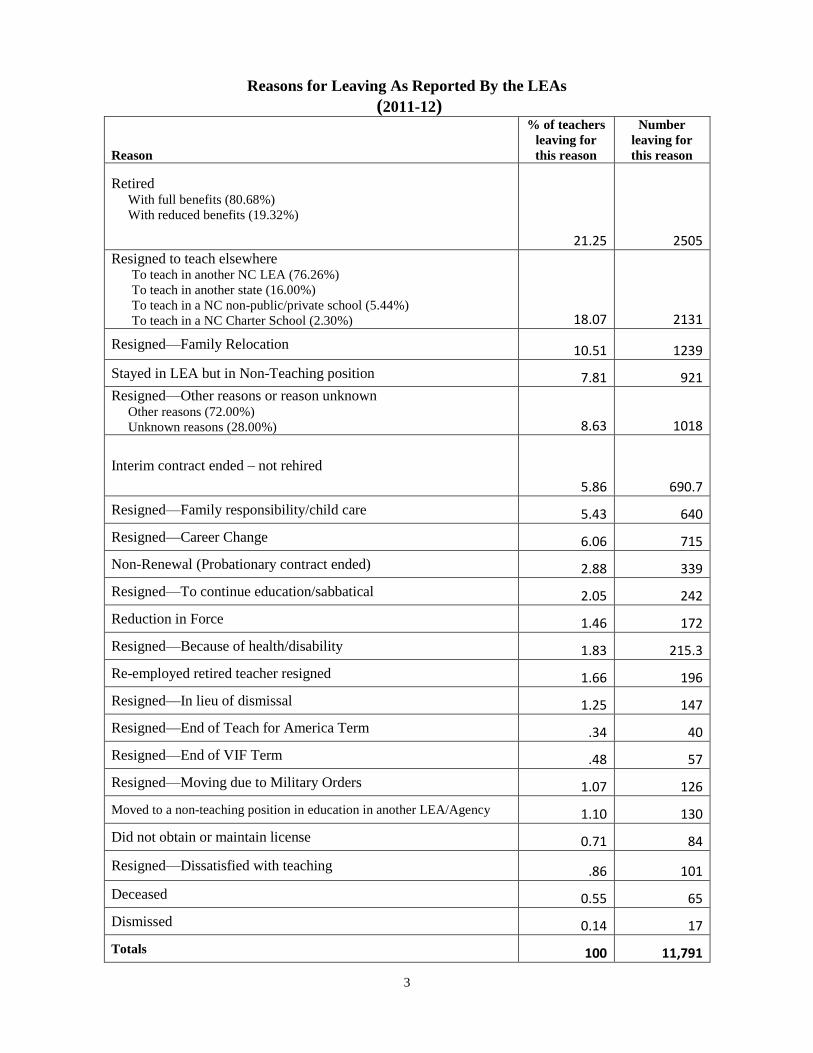
The table that follows details the reasons for teachers leaving as reported by their school systems. They are ranked
in descending order. Appendix E summarizes the reasons given for teachers leaving across the past five years.
Appendix F provides an analysis of turnover using the categories: Remained/Remaining in Education, Turnover
that Might be Reduced, Turnover Initiated by the LEA, and Turnover Beyond Control.
3
Reasons for Leaving As Reported By the LEAs
(2011-12)
Reason
% of teachers
leaving for
this reason
Number
leaving for
this reason
Retired With full benefits (80.68%)
With reduced benefits (19.32%)
21.25 2505
Resigned to teach elsewhere To teach in another NC LEA (76.26%)
To teach in another state (16.00%)
To teach in a NC non-public/private school (5.44%)
To teach in a NC Charter School (2.30%) 18.07 2131
Resigned—Family Relocation 10.51 1239
Stayed in LEA but in Non-Teaching position 7.81 921 Resigned—Other reasons or reason unknown Other reasons (72.00%)
Unknown reasons (28.00%) 8.63 1018
Interim contract ended – not rehired
5.86 690.7
Resigned—Family responsibility/child care 5.43 640
Resigned—Career Change 6.06 715
Non-Renewal (Probationary contract ended) 2.88 339
Resigned—To continue education/sabbatical 2.05 242
Reduction in Force 1.46 172
Resigned—Because of health/disability 1.83 215.3
Re-employed retired teacher resigned 1.66 196
Resigned—In lieu of dismissal 1.25 147
Resigned—End of Teach for America Term .34 40
Resigned—End of VIF Term .48 57
Resigned—Moving due to Military Orders 1.07 126
Moved to a non-teaching position in education in another LEA/Agency 1.10 130
Did not obtain or maintain license 0.71 84
Resigned—Dissatisfied with teaching .86 101
Deceased 0.55 65
Dismissed 0.14 17
Totals 100 11,791

4
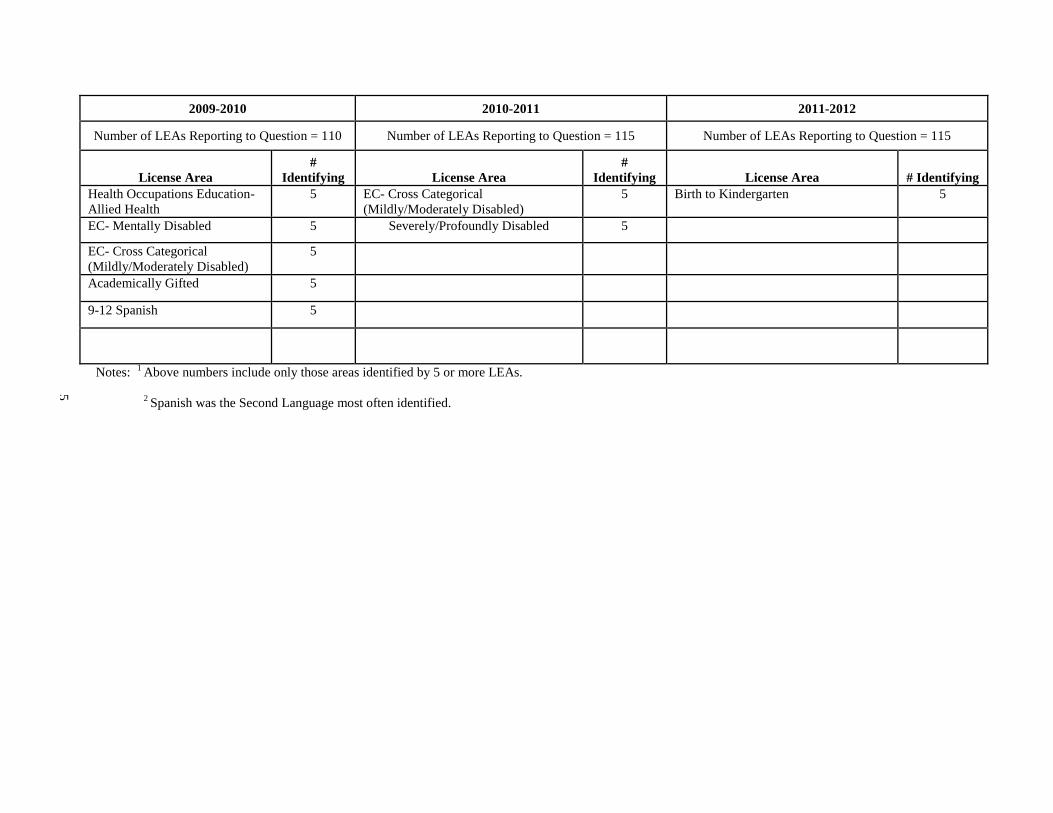
Most Difficult Areas of Licensure
for which to Find Licensed Teachers
2009-2010 2010-2011 2011-2012
Number of LEAs Reporting to Question = 110 Number of LEAs Reporting to Question = 115 Number of LEAs Reporting to Question = 115
License Area
#
Identifying License Area
#
Identifying License Area # Identifying
9-12 Mathematics 70 9-12 Mathematics 88 9-12 Mathematics 93
9-12 Science 55 9-12 Science 69 Sp. Ed.: General Curriculum 78
Sp. Ed.: General Curriculum 51 Sp. Ed.: General Curriculum 62 9-12 Science 74
6-9 Mathematics 46 6-9 Science 45 6-9 Mathematics 54
Sp Ed.: Adapted Curriculum 37 6-9 Mathematics 44 6-9 Science 51
6-9 Science 30 Sp Ed.: Adapted Curriculum 44 Sp. Ed.: Adapted Curriculum 40
EC (separate areas not
indicated)
19 EC (separate areas not indicated) 16 ESL 20
ESL 18 ESL 15 Spanish (Special Subjects K-12) 17
Spanish (Special Subjects K-12) 14 9-12 English 13 9-12 English 16
9-12 English 13 Speech Language Pathologist 12 Family and Consumer Sciences
Education (CTE 6-12)
13
Guidance Counselor 9 Spanish (Special Subjects K-12) 11 6-9 Language Arts 11
6-9 Language Arts 7 9-12 Spanish 10 6-9 Social Studies 9
Speech Language Pathologist 7 6-9 Language Arts 9 Health Occupations Education -
Registered Nurse
9
9-12 English 7 Family/Consumer Sciences 6-12 8 9-12 Spanish 8
Counselor 6 6-9 Social Studies 6 Technology Education (CTE 6-12) 6
Cross Categorical 5 Health Occupations Education-
Registered Nurse
6 Sp. Ed.: Cross Categorical 5
Mental Disabilities 5 Media Coordinator 5 Sp. Ed.: Behaviorally/Emotionally
Disabled
5
5
2009-2010 2010-2011 2011-2012
Number of LEAs Reporting to Question = 110 Number of LEAs Reporting to Question = 115 Number of LEAs Reporting to Question = 115
License Area
#
Identifying License Area
#
Identifying License Area # Identifying
Health Occupations Education-
Allied Health
5 EC- Cross Categorical
(Mildly/Moderately Disabled)
5 Birth to Kindergarten 5
EC- Mentally Disabled 5 Severely/Profoundly Disabled 5
EC- Cross Categorical
(Mildly/Moderately Disabled)
5
Academically Gifted 5
9-12 Spanish 5
Notes: 1 Above numbers include only those areas identified by 5 or more LEAs.
2 Spanish was the Second Language most often identified.

6
Analysis of Turnover
(System Level) The chart that follows depicts teacher turnover relative to teacher retention since the 2002-2012 school year.
This year, 2011-2012, the system level turnover is 12.13% which is slightly up from the 11.17% reported for 2010-2011.
The top five reasons for teachers leaving for 2011-12 are as follows:
1. Retired 2. To teach elsewhere* 3. Family Relocation 4. Moved to non-teaching position in LEA 5. Other/Unknown
Reasons
*While this reason indicates a loss to the local system, it does not represent a loss to the State.
0 20000 40000 60000 80000 100000 120000
2002-2003
2003-2004
2004-2005
2005-2006
2006-2007
2007-2008
2008-2009
2009-2010
2010-2011
2011-2012
State Teacher Turnover vs. Retention (2002-2012)
Total # of Teachers Who Left Total # of Teachers
0
2
4
6
8
10
12
14
16
Turn
ove
r R
ate
(%
)
Turnover Rate 2002-2012

7
Categories of Reasons why Teachers Leave the Profession
Remained/Remaining in Education (includes individuals resigning to teach in another NC LEA or charter school and individuals who moved to
non-teaching positions in education)
Turnover that Might be Reduced (includes individuals retiring with reduced benefits, individuals resigning to teach in a non-public school in
NC, individuals resigning to teach in another state, individuals dissatisfied with teaching, individuals
seeking a career change, and individuals who resigned for unknown and other reasons)
Turnover Initiated by the LEA (Includes individuals who were non-renewed, dismissed, or resigned in lieu of dismissal)
Turnover Beyond Control (Includes individuals who retired with full benefits, individuals who resigned for health reasons, individuals
who resigned due to family responsibilities and/or childcare, and individuals who resigned due to family
relocation)
As reflected in the chart that follows, 25% of those teachers reported as leaving remained in education; 10% of the
reported turnover was initiated by the LEA; 41% of the turnover was for reasons beyond control; and 24% of the
reported turnover might be reduced.
The results of the North Carolina Teacher Working Conditions Survey, conducted by the Office of the Governor in
conjunction with the North Carolina Professional Teaching Standards Commission and the North Carolina
Association of Educators, provide information that can help address Turnover that Might be Reduced. The survey
provides state, district, and school level data on teacher perceptions of empowerment, facilities and resources,
leadership, professional development, and time.
25%
24%
10%
41%
Reasons by Categories (2011-12)
Remained/Remaining in Education
Reasons that Might be Reduced
Reasons Initiated by LEA
Reasons Beyond Control

8
Appendix A
How Teacher Turnover is Determined for the
Teacher Turnover Report and the State Report Card

9
How Teacher Turnover Is Determined for the State Report Card
1. For the 2012 State Report Card (SRC), teacher turnover is based upon employed March 2011 ‘classroom
teachers’ and their employment status in March 2012. Payroll data is used for the determination.
2. ‘Classroom Teachers’ are determined by Purpose Codes beginning with 51, 52, or 53 AND Object Codes 121,
123, 124, or 128. Purpose and Object Codes are part of the payroll budget code.
3. Classroom teachers employed in March 2012 are determined using March 2011 payroll and the criteria in step
#2.
4. Once the roster from step #3 is determined, the SSN’s of the classroom teachers are queried against all certified
employee budget codes in March 2012 payroll data. If the SSN is not found to be employed in the same LEA in
March 2012 as they were in March 2011, they are classified as turnover at the LEA level.
5. A couple of the reasons why the system level turnover rate could be higher than the State average turnover rate:
In the change of tying the LEA turnover report sent from the LEAs to the State Report Card
turnover, more LEAs reviewed the rosters of teacher turnover.
Those on approved leave were excluded from turnover.

10
Appendix B
Survey Instrument

11
LEA:
Individual Submitting Report:_____
Total Number of Teachers Employed in LEA:______
Total Number of Teachers Leaving March 2010 - March
2011:_____
Number of teachers leaving who were tenured in your LEA:_____
Teacher Turnover Percent:____
Give the number of teachers who left teaching or left your LEA from March 2011-March 2012 for each of the reasons below.
(Where more than one reason applies, choose the one which best describes the reason the teacher is leaving.)
Mo
ved
to
a n
on
tea
chin
g p
osi
tio
n i
n t
he
LE
A (
75)
Ret
ired
wit
h f
ull
ben
efit
s (6
6)
Ret
ired
wit
h r
edu
ced
ben
efit
s (6
8)
Re-
emp
loy
ed R
etir
ed T
each
er R
esig
ned
(7
3)
Dis
mis
sed
(5
0)
Did
no
t o
bta
in o
r m
ain
tain
lic
ense
(5
6)
Inte
rim
con
trac
t en
ded
*-N
ot
reh
ired
(5
4)
No
n-r
enew
ed-P
rob
atio
nar
y C
on
trac
t en
ded
(5
3)
Red
uct
ion
in
Fo
rce
(51)
Mo
ved
to
a n
on
-tea
chin
g p
osi
tio
n i
n e
du
cati
on
in a
no
ther
LE
A
or
Ag
ency
(59
)
Res
ign
ed-I
n l
ieu
of
dis
mis
sal
(55
)
Res
ign
ed-T
o t
each
in
an
oth
er N
C p
ub
lic
sch
oo
l sy
stem
(5
8)
Res
ign
ed-T
o t
each
in
a N
C C
har
ter
Sch
oo
l (7
0)
Res
ign
ed-T
o t
each
in
a N
C n
on
-pub
lic/
pri
vat
e sc
ho
ol
(71)
Res
ign
ed-T
o t
each
in
an
oth
er s
tate
(6
2)
Res
ign
ed-E
nd
of
VIF
Ter
m (
74
)
Res
ign
ed-E
nd
of
Tea
ch f
or
Am
eric
a T
erm
(7
7)
Res
ign
ed-D
issa
tisf
ied
wit
h t
each
ing
(6
3)
Res
ign
ed-C
aree
r C
han
ge
(72
)
Res
ign
ed-F
amil
y R
esp
on
sib
ilit
y/C
hil
d c
are
(57)
Res
ign
ed-F
amil
y r
elo
cati
on
(61
)
Res
ign
ed-T
o c
on
tinu
e ed
uca
tio
n/T
ake
a sa
bb
atic
al (
60
)
Res
ign
ed-B
ecau
se o
f h
ealt
h/D
isab
ilit
y (
64
)
Res
ign
ed-M
ov
ing
Du
e to
Mil
itar
y O
rder
s (7
6)
Res
ign
ed-R
easo
n u
nk
no
wn
(69
)
Res
ign
ed-O
ther
Rea
son
s (6
5)
Dec
ease
d (
67
)
To
tal
List up to five teaching areas in which you are having the greatest difficulty hiring appropriately licensed teachers.
(PLEASE INCLUDE THE LICENSURE CODE FOR EACH AREA)

12
ANNUAL REPORT ON THE REASONS TEACHERS LEAVE THE PROFESSION
(CLARIFICATION OF REPORTING CATEGORIES)
Moved to a non teaching position in the LEA
Teachers moved to counselor, media coordinator, or non-teaching duties in current LEA of employment
Teachers moved to administrative positions (school-based) in current LEA of employment
Teachers moved to supervisory, director, or coordinator positions in current LEA of employment
Teachers accepted non-teaching support or administrative positions in current LEA of employment
Retired with full benefits
Teachers age 60 with 25 years of creditable service
Teachers with 30 years of creditable service
Teachers age 65 with at least 5 years of creditable service
Teachers retiring with full/unreduced retirement benefits
Retired with reduced benefits
Teachers retiring after age 50 with reduced benefits
Teachers retiring with less than full benefits
Re-employed Retired Teacher Resigned
Teacher who had retired, was re-employed and subsequently resigns
Dismissed
Teachers demoted or dismissed under GS 115C-325(h)
Probationary teachers dismissed during the school year under GS 115C-325(m)
Teachers dismissed under GS 115C-325 (Below standard ratings)
Teachers reported to the dismissed teacher list
Teachers dismissed and the ruling upheld by case manager
Did not obtain or maintain license
Teachers not renewed due to failure to fulfill lateral entry requirements
Teachers not renewed due to failure to earn 15 renewal credits
Teachers failed to meet Praxis or provisional license requirements
Teachers let license expire
Teachers’ license was revoked
Interim Contract – Not Rehired (Report only for interim contracts of 6 months or more)
Interim teachers not rehired under retirement cap
Teachers not rehired under a term contract with specific employment dates
Teachers not rehired due to return of a permanent teacher from a leave of absence
Non-Renewed – Probationary Contract Ended
Probationary teachers whose contract is not renewed after the end of the year
Reduction in Force
Teachers not rehired due to loss of enrollment, funding, or programming
Teachers covered under local “RIF” policies
Moved to a non-teaching position in education in another LEA or Agency
Teachers moved to counselor, media coordinator, or non-teaching duties in another LEA or Agency
Teachers moved to administrative positions (school-based) in another LEA or Agency
Teachers moved to supervisory, director, or coordinator positions in another LEA or Agency
Teachers accepted non-teaching support or administrative positions in another LEA or Agency

13
Resigned in lieu of dismissal
Teachers resigned to avoid placement on dismissed teacher list
Teachers resigned rather than go through full dismissal hearing
Teachers resigned during an active investigation regarding performance/behavior as a professional educator
Resigned to teach in another NC public school system
Teachers leaving LEA to accept a teaching position in another NC system
Teachers obtaining another teaching job on their own initiative (as opposed to spouse relocation)
Resigned to teach in a NC charter school
Teachers leaving LEA to accept a teaching position in a NC Charter School
Teachers obtaining another teaching job on their own initiative (as opposed to spouse relocation)
Resigned to teach in a NC non-public/private school
Teachers leaving LEA to accept a teaching position in a NC non-public/private school
Teachers obtaining another teaching job on their own initiative (as opposed to spouse relocation)
Resigned – To teach in another state
Teachers leaving NC to teach in a public school in another state
Teachers leaving NC to teach in a private school in another state
Resigned – End of VIF Term
Teachers whose cultural visas have expired and are no longer eligible to be employed in North Carolina
Resigned – End of Teach for America Term
Resigned – Dissatisfied with teaching
Teachers resigning due to dissatisfaction with teaching
Resigned – Career Change
Teachers resigning to pursue another employment opportunity
Teachers resigning to pursue interests outside teaching
Resigned – Family responsibility/Child care
Teachers resigning for maternity/family leave
Teachers resigning to care for ill parents or members of the immediate family
Teachers resigning to care for family business or personal needs
Resigned – Family relocation
Teachers resigning due to spouse’s relocation
Teachers resigning as a result of marriage and relocation
Teachers resigning due to family relocation
Teachers resigning due to military transfer or relocation
Resigned – To continue education/Take a sabbatical
Teachers resigning to return to school
Teachers resigning to pursue an educational leave of absence
Resigned – Because of health/disability
Teachers resigning due to personal disability or health related issues
Resigned – Moving Due to Military Orders
Teachers resigning due to being moved under military orders
Resigned – Reason unknown
Teachers resigning; however, there is no information on why

14
Resigned – Other reason(s)
Teachers resigning or leaving teaching for reasons not listed on the survey
(For example: Job abandonment, arrest, criminal activity, failing a criminal history check, activation of
military reserve, dislocation due to flood, fire, or other disaster, etc.)
Deceased
Teachers who die while in active service in a NC public school

15
Appendix C
2011-2012 System Level Teacher Turnover
16
2011-2012 Teacher Turnover
(as reported by LEAs)
LEA
Code Region LEA
Total
Teachers
Teachers
Leaving
Turnover
Percentage
Leaving with
Tenure
010 5 Alamance 1509 193 12.79 91
020 7 Alexander 340 25 7.35 9
030 7 Alleghany 127 15 11.81 8
040 6 Anson 261 42 16.09 21
050 7 Ashe 248 22 8.87 10
060 7 Avery 170 16 9.41 8
070 1 Beaufort 514 59 11.48 32
080 1 Bertie 186 9 4.84 2
090 4 Bladen 375 38 10.13 21
100 2 Brunswick 812 109 13.42 46
110 8 Buncombe 1812 167 9.22 75
111 8 Asheville City 343 18 5.25 3
120 7 Burke 912 123 13.49 53
130 6 Cabarrus 1879 198 10.54 118
132 6 Kannapolis City 401 51 12.72 25
140 7 Caldwell 902 73 8.09 39
150 1 Camden 149 8 5.37 6
160 2 Carteret 633 81 12.80 45
170 5 Caswell 214 35 16.36 10
180 7 Catawba 1071 95 8.87 63
181 7 Hickory City 299 38 12.71 20
182 7 Newton-Conover 208 19 9.13 15
190 5 Chatham 601 65 10.82 30
200 8 Cherokee 257 25 9.73 17
210 1 Chowan 170 16 9.41 12
220 8 Clay 101 7 6.93 6
230 6 Cleveland 1135 114 10.04 74
240 4 Columbus 430 59 13.72 22
241 4 Whiteville City 155 22 14.19 16
250 2 Craven 994 117 11.77 64
260 4 Cumberland 3826 603 15.76 195
270 1 Currituck 260 35 13.46 17
280 1 Dare 397 29 7.30 16
290 5 Davidson 1250 100 8.00 54
291 5 Lexington City 255 31 12.16 14
292 5 Thomasville City 184 27 14.67 17
300 7 Davie 463 37 7.99 26
310 2 Duplin 630 82 13.02 31
320 3 Durham 2181 398 18.25 174
330 3 Edgecombe 453 81 17.88 32
340 5 Forsyth 3938 564 14.32 308
350 3 Franklin 617 53 8.59 16
360 6 Gaston 2054 223 10.86 151
370 1 Gates 142 21 14.79 12

17
LEA
Code Region LEA
Total
Teachers
Teachers
Leaving
Turnover
Percentage
Leaving with
Tenure
380 8 Graham 90 6 6.67 5
390 3 Granville 561 97 17.29 43
400 2 Greene 207 32 15.46 17
410 5 Guilford 4950 577 11.66 291
420 3 Halifax 317 77 24.29 6
421 3 Roanoke Rapids 191 20 10.47 11
422 3 Weldon City 88 25 28.41 5
430 4 Harnett 1241 179 14.42 62
440 8 Haywood 550 79 14.36 54
450 8 Henderson 926 94 10.15 58
460 1 Hertford 231 30 12.99 15
470 4 Hoke 569 119 20.91 38
480 1 Hyde 75 11 14.67 5
490 7 Iredell 1430 107 7.48 60
491 7 Mooresville City 354 43 12.15 26
500 8 Jackson 255 42 16.47 15
510 3 Johnston 2233 262 11.73 116
520 2 Jones 115 16 13.91 9
530 4 Lee 699 77 11.02 25
540 2 Lenoir 592 69 11.66 29
550 6 Lincoln 857 86 10.04 37
560 8 Macon 338 31 9.17 15
570 8 Madison 196 23 11.73 15
580 1 Martin 303 41 13.53 23
590 8 McDowell 453 28 6.18 17
600 6 Mecklenburg 8199 1177 14.36 483
610 8 Mitchell 165 12 7.27 10
620 4 Montgomery 307 34 11.07 13
630 4 Moore 822 114 13.87 60
640 3 Nash 1105 167 15.11 99
650 2 New Hanover 1585 159 10.03 89
660 3 Northampton 193 43 22.28 19
670 2 Onslow 1481 192 12.96 78
680 5 Orange 594 64 10.77 37
681 5 Chapel Hill-Carrboro 931 119 12.78 51
690 2 Pamlico 118 22 18.64 7
700 1 Pasquotank 469 40 8.53 18
710 2 Pender 470 69 14.68 30
720 1 Perquimans 137 20 14.60 10
730 5 Person 356 79 22.19 39
740 1 Pitt 1675 144 8.60 71
750 8 Polk 193 22 11.40 15
760 5 Randolph 1204 148 12.29 74
761 5 Asheboro City 339 45 13.27 28
770 4 Richmond 504 82 16.27 37
780 4 Robeson 1538 132 8.58 31
790 5 Rockingham 940 108 11.49 80

18
LEA
Code Region LEA
Total
Teachers
Teachers
Leaving
Turnover
Percentage
Leaving with
Tenure
800 7 Rowan 1462 162 11.08 105
810 8 Rutherford 612 54 8.82 41
820 2 Sampson 554 63 11.37 40
821 2 Clinton City 239 28 11.72 11
830 4 Scotland 479 102 21.29 36
840 6 Stanly 671 48 7.15 35
850 5 Stokes 551 54 9.80 24
860 7 Surry 623 42 6.74 31
861 7 Elkin City 99 2 2.02 0
862 7 Mt. Airy City 126 9 7.14 8
870 8 Swain 140 14 10.00 10
880 8 Transylvania 273 28 10.26 16
890 1 Tyrrell 52 6 11.54 2
900 6 Union 2452 270 11.01 114
910 3 Vance 545 91 16.70 14
920 3 Wake 9374 1088 11.61 507
930 3 Warren 200 24 12.00 7
940 1 Washington 125 35 28.00 13
950 7 Watauga 344 41 11.92 21
960 2 Wayne 1221 133 10.89 41
970 7 Wilkes 655 64 9.77 43
980 3 Wilson 780 92 11.79 63
990 7 Yadkin 422 26 6.16 12
995 8 Yancey 181 9 4.97 5
North Carolina’s Regional Education Districts
Region 1 - Northeast Region 5 - Piedmont-Triad/Central
Region 2 - Southeast Region 6 - Southwest
Region 3 - North Central Region 7 – Northwest
Region 4 - Sandhills/South Central Region 8 - Western

19
2011-2012 Teacher Turnover
(in descending order)
Region LEA # LEA Name
Total # of
Teachers
Employed
Total # of
Teachers
Leaving
Total # of
Tenured
Teachers Leaving
Teacher
Turnover
%
3 422 Weldon City 88 25 5 28.41
1 940 Washington 125 35 13 28.00
3 420 Halifax 317 77 6 24.29
3 660 Northampton 193 43 19 22.28
5 730 Person 356 79 39 22.19
4 830 Scotland 479 102 36 21.29
4 470 Hoke 569 119 38 20.91
2 690 Pamlico 118 22 7 18.64
3 320 Durham 2181 398 174 18.25
3 330 Edgecombe 453 81 32 17.88
3 390 Granville 561 97 43 17.29
3 910 Vance 545 91 14 16.70
8 500 Jackson 255 42 15 16.47
5 170 Caswell 214 35 10 16.36
4 770 Richmond 504 82 37 16.27
6 040 Anson 261 42 21 16.09
4 260 Cumberland 3826 603 195 15.76
2 400 Greene 207 32 17 15.46
3 640 Nash 1105 167 99 15.11
1 370 Gates 142 21 12 14.79
2 710 Pender 470 69 30 14.68
5 292 Thomasville City 184 27 17 14.67
1 480 Hyde 75 11 5 14.67
1 720 Perquimans 137 20 10 14.60
4 430 Harnett 1241 179 62 14.42
8 440 Haywood 550 79 54 14.36
6 600 Mecklenburg 8199 1177 483 14.36
5 340 Forsyth 3938 564 308 14.32
4 241 Whiteville City 155 22 16 14.19
2 520 Jones 115 16 9 13.91
4 630 Moore 822 114 60 13.87
4 240 Columbus 430 59 22 13.72
1 580 Martin 303 41 23 13.53
7 120 Burke 912 123 53 13.49
1 270 Currituck 260 35 17 13.46
2 100 Brunswick 812 109 46 13.42

20
Region LEA # LEA Name
Total # of
Teachers
Employed
Total # of
Teachers
Leaving
Total # of
Tenured
Teachers Leaving
Teacher
Turnover
%
5 761 Asheboro City 339 45 28 13.27
2 310 Duplin 630 82 31 13.02
1 460 Hertford 231 30 15 12.99
2 670 Onslow 1481 192 78 12.96
2 160 Carteret 633 81 45 12.80
5 010 Alamance 1509 193 91 12.79
5 681 Chapel Hill-
Carrboro
931 119 51 12.78
6 132 Kannapolis City 401 51 25 12.72
7 181 Hickory City 299 38 20 12.71
5 760 Randolph 1204 148 74 12.29
5 291 Lexington City 255 31 14 12.16
7 491 Mooresville City 354 43 26 12.15
3 930 Warren 200 24 7 12.00
7 950 Watauga 344 41 21 11.92
7 030 Alleghany 127 15 8 11.81
3 980 Wilson 780 92 63 11.79
2 250 Craven 994 117 64 11.77
8 570 Madison 196 23 15 11.73
3 510 Johnston 2233 262 116 11.73
2 821 Clinton City 239 28 11 11.72
5 410 Guilford 4950 577 291 11.66
2 540 Lenoir 592 69 29 11.66
3 920 Wake 9374 1088 507 11.61
1 890 Tyrrell 52 6 2 11.54
5 790 Rockingham 940 108 80 11.49
1 070 Beaufort 514 59 32 11.48
8 750 Polk 193 22 15 11.40
2 820 Sampson 554 63 40 11.37
7 800 Rowan 1462 162 105 11.08
4 620 Montgomery 307 34 13 11.07
4 530 Lee 699 77 25 11.02
6 900 Union 2452 270 114 11.01
2 960 Wayne 1221 133 41 10.89
6 360 Gaston 2054 223 151 10.86
5 190 Chatham 601 65 30 10.82
5 680 Orange 594 64 37 10.77
6 130 Cabarrus 1879 198 118 10.54
3 421 Roanoke Rapids 191 20 11 10.47
8 880 Transylvania 273 28 16 10.26

21
Region LEA # LEA Name
Total # of
Teachers
Employed
Total # of
Teachers
Leaving
Total # of
Tenured
Teachers Leaving
Teacher
Turnover
%
8 450 Henderson 926 94 58 10.15
4 090 Bladen 375 38 21 10.13
6 230 Cleveland 1135 114 74 10.04
6 550 Lincoln 857 86 37 10.04
2 650 New Hanover 1585 159 89 10.03
8 870 Swain 140 14 10 10.00
5 850 Stokes 551 54 24 9.80
7 970 Wilkes 655 64 43 9.77
8 200 Cherokee 257 25 17 9.73
7 060 Avery 170 16 8 9.41
1 210 Chowan 170 16 12 9.41
8 110 Buncombe 1812 167 75 9.22
8 560 Macon 338 31 15 9.17
7 182 Newton-Conover 208 19 15 9.13
7 050 Ashe 248 22 10 8.87
7 180 Catawba 1071 95 63 8.87
8 810 Rutherford 612 54 41 8.82
1 740 Pitt 1675 144 71 8.60
3 350 Franklin 617 53 16 8.59
4 780 Robeson 1538 132 31 8.58
1 700 Pasquotank 469 40 18 8.53
7 140 Caldwell 902 73 39 8.09
5 290 Davidson 1250 100 54 8.00
7 300 Davie 463 37 26 7.99
7 490 Iredell 1430 107 60 7.48
7 020 Alexander 340 25 9 7.35
1 280 Dare 397 29 16 7.30
8 610 Mitchell 165 12 10 7.27
6 840 Stanly 671 48 35 7.15
7 862 Mt. Airy City 126 9 8 7.14
8 220 Clay 101 7 6 6.93
7 860 Surry 623 42 31 6.74
8 380 Graham 90 6 5 6.67
8 590 McDowell 453 28 17 6.18
7 990 Yadkin 422 26 12 6.16
1 150 Camden 149 8 6 5.37
8 111 Asheville City 343 18 3 5.25
8 995 Yancey 181 9 5 4.97
1 080 Bertie 186 9 2 4.84
7 861 Elkin City 99 2 0 2.02
22
Appendix D
Five-Year Average System Level Teacher Turnover

23
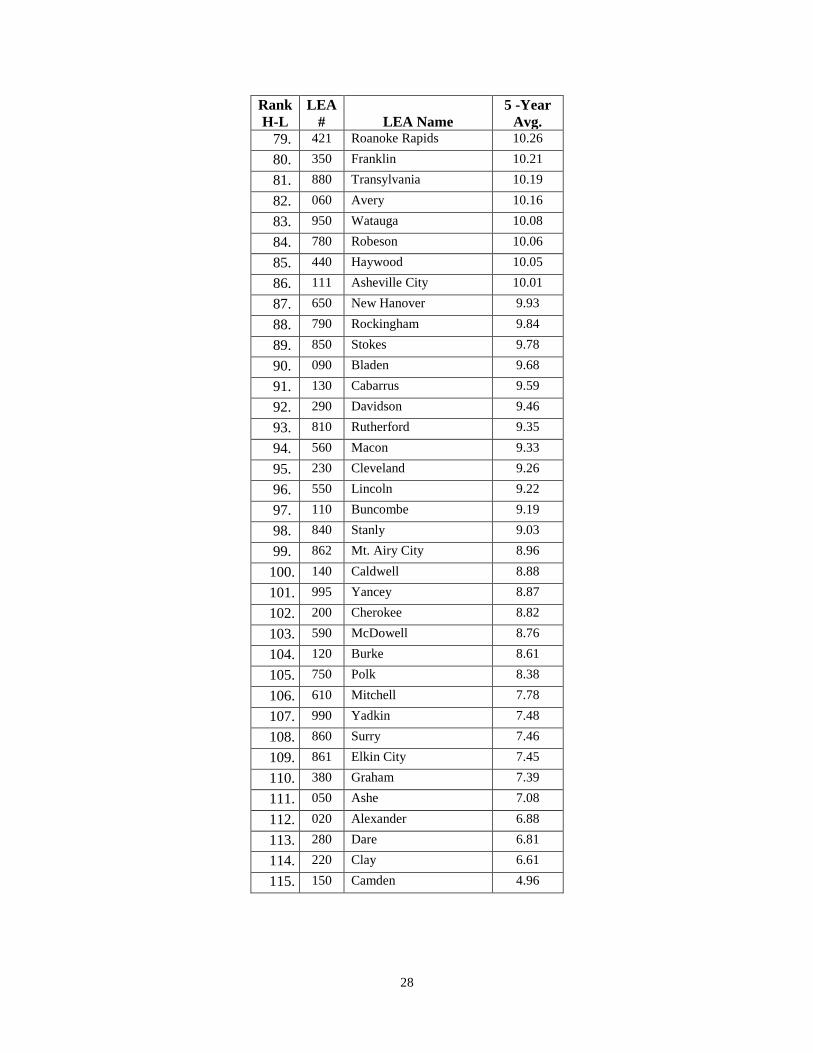
Five-Year Average System Level Teacher Turnover
2007-2008 through 2011-2012
LEA
Code LEA Name
Turnover
2007-08
(%)
Turnover
2008-09
(%)
Turnover
2009-10
(%)
Turnover
2010-11
(%)
Turnover
2011-12
(%)
Five Year
Average
(%)
010 Alamance 15.17 13.80 12.52 11.41 12.79 13.14
020 Alexander 5.71 7.12 8.29 5.93 7.35 6.88
030 Alleghany 14.50 12.12 8.57 6.06 11.81 10.61
040 Anson 20.89 17.06 14.53 15.09 16.09 16.73
050 Ashe 5.12 7.84 4.84 8.73 8.87 7.08
060 Avery 10.31 11.76 9.63 9.69 9.41 10.16
070 Beaufort 15.25 12.76 11.55 11.52 11.48 12.51
080 Bertie 21.86 16.35 22.22 14.95 4.84 16.04
090 Bladen 11.32 11.44 8.27 7.21 10.13 9.68
100 Brunswick 13.36 12.23 10.45 12.17 13.42 12.33
110 Buncombe 11.01 10.29 6.84 8.60 9.22 9.19
111 Asheville City 17.91 11.55 10.03 5.30 5.25 10.01
120 Burke 9.43 9.58 5.27 5.27 13.49 8.61
130 Cabarrus 10.82 9.64 7.62 9.31 10.54 9.59
132 Kannapolis City 13.94 13.95 6.46 9.18 12.72 11.25
140 Caldwell 9.68 11.43 8.77 6.42 8.09 8.88
150 Camden 7.58 0.75 9.59 1.52 5.37 4.96
160 Carteret 11.50 11.36 11.08 8.20 12.80 10.99
170 Caswell 13.42 14.47 16.59 13.76 16.36 14.92
180 Catawba 12.86 10.39 11.27 8.56 8.87 10.39
181 Hickory City 19.68 13.87 10.22 12.54 12.71 13.80
182 Newton-Conover 19.35 13.36 11.47 8.46 9.13 12.35
190 Chatham 10.97 15.24 10.03 10.80 10.82 11.57
200 Cherokee 10.49 9.06 5.99 8.86 9.73 8.82
210 Chowan 13.26 16.40 7.51 9.30 9.41 11.18
220 Clay 7.84 7.55 6.67 4.04 6.93 6.61
230 Cleveland 9.23 9.15 8.65 9.24 10.04 9.26
240 Columbus 12.71 12.85 11.11 13.50 13.72 12.78
241 Whiteville City 9.73 15.82 13.94 9.87 14.19 12.71
250 Craven 16.04 14.03 14.46 12.10 11.77 13.68
260 Cumberland 17.54 15.67 13.22 15.13 15.76 15.46
270 Currituck 12.86 8.15 14.29 12.37 13.46 12.22
280 Dare 6.88 8.10 4.52 7.25 7.30 6.81
290 Davidson 11.08 9.45 8.84 9.90 8.00 9.46
291 Lexington City 20.27 16.95 13.78 15.42 12.16 15.71
292 Thomasville City 23.66 22.51 8.47 13.61 14.67 16.58
300 Davie 13.56 10.22 14.14 10.30 7.99 11.24
310 Duplin 17.41 11.95 3.70 13.67 13.02 11.95
320 Durham 17.38 16.98 17.53 18.10 18.25 17.65
330 Edgecombe 26.35 17.51 16.00 15.63 17.88 18.67

24
LEA
Code LEA Name
Turnover
2007-08
(%)
Turnover
2008-09
(%)
Turnover
2009-10
(%)
Turnover
2010-11
(%)
Turnover
2011-12
(%)
Five Year
Average
(%)
340 Forsyth 12.10 10.73 9.36 11.76 14.32 11.65
350 Franklin 14.78 13.41 7.64 6.64 8.59 10.21
360 Gaston 14.06 12.58 7.61 8.89 10.86 10.80
370 Gates 11.11 10.83 14.94 11.43 14.79 12.62
380 Graham 4.55 12.50 5.43 7.78 6.67 7.39
390 Granville 12.39 12.91 10.17 13.53 17.29 13.26
400 Greene 13.96 10.57 15.02 11.11 15.46 13.22
410 Guilford 15.70 12.87 10.41 10.08 11.66 12.14
420 Halifax 20.18 20.44 31.82 22.61 24.29 23.87
421 Roanoke Rapids 14.87 10.66 11.11 4.19 10.47 10.26
422 Weldon City 41.57 20.78 21.28 14.77 28.41 25.36
430 Harnett 15.65 16.42 12.90 14.24 14.42 14.73
440 Haywood 10.09 7.87 9.95 7.99 14.36 10.05
450 Henderson 12.57 10.59 8.65 9.52 10.15 10.30
460 Hertford 18.03 17.20 14.46 9.09 12.99 14.35
470 Hoke 22.46 21.79 18.08 20.70 20.91 20.79
480 Hyde 12.33 16.44 12.12 10.00 14.67 13.11
490 Iredell 14.90 12.35 9.51 9.81 7.48 10.81
491 Mooresville City 12.08 11.45 11.36 5.37 12.15 10.48
500 Jackson 15.53 17.04 14.23 12.70 16.47 15.19
510 Johnston 14.69 12.42 9.55 8.63 11.73 11.40
520 Jones 19.44 25.69 12.50 14.22 13.91 17.15
530 Lee 13.42 15.21 12.62 14.00 11.02 13.25
540 Lenoir 16.18 18.06 13.13 14.12 11.66 14.63
550 Lincoln 10.34 10.93 7.44 7.34 10.04 9.22
560 Macon 8.89 15.43 5.96 7.20 9.17 9.33
570 Madison 11.76 13.99 9.95 8.63 11.73 11.21
580 Martin 16.18 14.47 12.46 9.67 13.53 13.26
590 McDowell 11.80 9.83 7.68 8.33 6.18 8.76
600 Mecklenburg 14.57 13.27 11.67 14.07 14.36 13.59
610 Mitchell 10.30 7.36 6.08 7.91 7.27 7.78
620 Montgomery 17.46 14.63 12.88 13.41 11.07 13.89
630 Moore 15.77 10.77 10.34 11.50 13.87 12.45
640 Nash 12.98 13.32 16.04 10.30 15.11 13.55
650 New Hanover 12.98 10.11 8.02 8.49 10.03 9.93
660 Northampton 22.88 23.25 25.98 15.38 22.28 21.95
670 Onslow 16.49 15.14 13.45 14.26 12.96 14.46
680 Orange 14.60 15.69 11.99 8.49 10.77 12.31
681 Chapel Hill-Carrboro 14.84 11.86 12.60 10.71 12.78 12.56
690 Pamlico 18.52 19.70 21.88 23.97 18.64 20.54
700 Pasquotank 15.25 14.84 11.13 10.00 8.53 11.95
710 Pender 12.77 13.06 10.18 12.54 14.68 12.65
720 Perquimans 16.94 13.18 13.64 8.61 14.60 13.39

25
LEA
Code LEA Name
Turnover
2007-08
(%)
Turnover
2008-09
(%)
Turnover
2009-10
(%)
Turnover
2010-11
(%)
Turnover
2011-12
(%)
Five Year
Average
(%)
730 Person 17.45 19.46 18.55 15.65 22.19 18.66
740 Pitt 15.55 14.32 10.35 13.79 8.60 12.52
750 Polk 8.59 7.65 5.47 8.81 11.40 8.38
760 Randolph 13.62 10.93 12.76 11.55 12.29 12.23
761 Asheboro City 14.72 18.21 11.49 10.06 13.27 13.55
770 Richmond 11.71 16.99 17.27 14.37 16.27 15.32
780 Robeson 12.36 15.38 8.63 5.36 8.58 10.06
790 Rockingham 11.73 8.92 7.09 9.99 11.49 9.84
800 Rowan 13.52 13.72 10.11 10.16 11.08 11.72
810 Rutherford 9.64 7.56 10.62 10.12 8.82 9.35
820 Sampson 16.18 11.45 10.33 10.02 11.37 11.87
821 Clinton City 15.32 16.82 10.81 11.57 11.72 13.25
830 Scotland 19.82 15.63 15.10 14.20 21.29 17.21
840 Stanly 11.03 11.88 8.76 6.33 7.15 9.03
850 Stokes 13.56 11.98 6.80 6.75 9.80 9.78
860 Surry 10.80 10.88 4.18 4.70 6.74 7.46
861 Elkin City 6.52 9.38 8.33 11.00 2.02 7.45
862 Mt. Airy City 11.76 11.28 2.78 11.82 7.14 8.96
870 Swain 15.89 12.00 12.08 4.96 10.00 10.99
880 Transylvania 13.82 9.89 9.64 7.34 10.26 10.19
890 Tyrrell 21.05 16.67 1.89 19.23 11.54 14.08
900 Union 12.31 13.57 13.78 9.73 11.01 12.08
910 Vance 20.60 19.76 17.58 17.50 16.70 18.43
920 Wake 11.67 11.12 10.74 11.12 11.61 11.25
930 Warren 19.90 18.97 21.54 20.00 12.00 18.48
940 Washington 20.00 9.41 17.86 15.33 28.00 18.12
950 Watauga 11.05 7.44 11.72 8.27 11.92 10.08
960 Wayne 12.42 10.96 15.56 10.80 10.89 12.13
970 Wilkes 13.11 11.63 14.11 11.96 9.77 12.12
980 Wilson 16.65 13.42 14.60 10.13 11.79 13.32
990 Yadkin 8.86 9.09 5.90 7.40 6.16 7.48
995 Yancey 9.44 11.35 9.34 9.27 4.97 8.87

26
Five Year Average System Level Teacher Turnover (2007-2012)
(in descending order by percentage)
Rank
H-L LEA LEA Name
5 -Year
Avg.
1. 422 Weldon City 25.36
2. 420 Halifax 23.87
3. 660 Northampton 21.95
4. 470 Hoke 20.79
5. 690 Pamlico 20.54
6. 330 Edgecombe 18.67
7. 730 Person 18.66
8. 930 Warren 18.48
9. 910 Vance 18.43
10. 940 Washington 18.12
11. 320 Durham 17.65
12. 830 Scotland 17.21
13. 520 Jones 17.15
14. 040 Anson 16.73
15. 292 Thomasville City 16.58
16. 080 Bertie 16.04
17. 291 Lexington City 15.71
18. 260 Cumberland 15.46
19. 770 Richmond 15.32
20. 500 Jackson 15.19
21. 170 Caswell 14.92
22. 430 Harnett 14.73
23. 540 Lenoir 14.63
24. 670 Onslow 14.46
25. 460 Hertford 14.35
26. 890 Tyrrell 14.08
27. 620 Montgomery 13.89
28. 181 Hickory City 13.80
29. 250 Craven 13.68
30. 600 Mecklenburg 13.59
31. 761 Asheboro City 13.55
32. 640 Nash 13.55
33. 720 Perquimans 13.39
34. 980 Wilson 13.32
35. 580 Martin 13.26
36. 390 Granville 13.26
37. 530 Lee 13.25
38. 821 Clinton City 13.25

27
Rank
H-L
LEA
# LEA Name
5 -Year
Avg.
39. 400 Greene 13.22
40. 010 Alamance 13.14
41. 480 Hyde 13.11
42. 240 Columbus 12.78
43. 241 Whiteville City 12.71
44. 710 Pender 12.65
45. 370 Gates 12.62
46. 681 Chapel Hill-Carrboro 12.56
47. 740 Pitt 12.52
48. 070 Beaufort 12.51
49. 630 Moore 12.45
50. 182 Newton-Conover 12.35
51. 100 Brunswick 12.33
52. 680 Orange 12.31
53. 760 Randolph 12.23
54. 270 Currituck 12.22
55. 410 Guilford 12.14
56. 960 Wayne 12.13
57. 970 Wilkes 12.12
58. 900 Union 12.08
59. 700 Pasquotank 11.95
60. 310 Duplin 11.95
61. 820 Sampson 11.87
62. 800 Rowan 11.72
63. 340 Forsyth 11.65
64. 190 Chatham 11.57
65. 510 Johnston 11.40
66. 920 Wake 11.25
67. 132 Kannapolis City 11.25
68. 300 Davie 11.24
69. 570 Madison 11.21
70. 210 Chowan 11.18
71. 160 Carteret 10.99
72. 870 Swain 10.99
73. 490 Iredell 10.81
74. 360 Gaston 10.80
75. 030 Alleghany 10.61
76. 491 Mooresville City 10.48
77. 180 Catawba 10.39
78. 450 Henderson 10.30
28
Rank
H-L
LEA
# LEA Name
5 -Year
Avg.
79. 421 Roanoke Rapids 10.26
80. 350 Franklin 10.21
81. 880 Transylvania 10.19
82. 060 Avery 10.16
83. 950 Watauga 10.08
84. 780 Robeson 10.06
85. 440 Haywood 10.05
86. 111 Asheville City 10.01
87. 650 New Hanover 9.93
88. 790 Rockingham 9.84
89. 850 Stokes 9.78
90. 090 Bladen 9.68
91. 130 Cabarrus 9.59
92. 290 Davidson 9.46
93. 810 Rutherford 9.35
94. 560 Macon 9.33
95. 230 Cleveland 9.26
96. 550 Lincoln 9.22
97. 110 Buncombe 9.19
98. 840 Stanly 9.03
99. 862 Mt. Airy City 8.96
100. 140 Caldwell 8.88
101. 995 Yancey 8.87
102. 200 Cherokee 8.82
103. 590 McDowell 8.76
104. 120 Burke 8.61
105. 750 Polk 8.38
106. 610 Mitchell 7.78
107. 990 Yadkin 7.48
108. 860 Surry 7.46
109. 861 Elkin City 7.45
110. 380 Graham 7.39
111. 050 Ashe 7.08
112. 020 Alexander 6.88
113. 280 Dare 6.81
114. 220 Clay 6.61
115. 150 Camden 4.96

29
Level Turnover by Region
2007-2012
REGION 2007-08 2008-09 2009-10 2010-11 2011-12
Region 1 14.89 13.09 11.45 11.57 10.32
Region 2 14.57 12.97 11.65 11.69 12.14
Region 3 14.38 13.18 12.81 12.08 13.37
Region 4 15.69 15.39 12.56 12.99 14.26
Region 5 14.02 12.39 10.57 10.84 12.40
Region 6 13.28 12.54 10.58 11.44 12.33
Region 7 12.10 11.15 9.21 8.51 9.35
Region 8 11.44 10.36 8.42 8.53 9.57
0.00
2.00
4.00
6.00
8.00
10.00
12.00
14.00
16.00
18.00
1 2 3 4 5 6 7 8
Turnover by Region Over 5 Years (by %)
2007-08 2008-09 2009-10 2010-11 2011-2012

30
0.00
5.00
10.00
15.00
20.00
25.00
30.00
Turn
ove
r P
erce
nta
ge
System Level Turnover (2007-2012) Region 1
2007-08 2008-09 2009-10 2010-11 2011-12 5 Yr Avg
0.00
5.00
10.00
15.00
20.00
25.00
30.00
Turn
ove
r P
erce
nta
ge
System-Level Turnover (2007-2012) Region 2
2007-08 2008-09 2009-10 2010-11 2011-12 5 Yr Avg

31
0.00
5.00
10.00
15.00
20.00
25.00
30.00
35.00
40.00
45.00
Turn
ove
r P
erce
nta
ge
System-Level Turnover (2007-2012) Region 3
2007-08 2008-09 2009-10 2010-11 2011-12 5 Yr Avg
0.00
5.00
10.00
15.00
20.00
25.00
Turn
ove
r P
erce
nta
ge
System-Level Turnover (2007-2012) Region 4
2007-08 2008-09 2009-10 2010-11 2011-12 5 Yr Avg

32
0.00
5.00
10.00
15.00
20.00
25.00
Turn
ove
r P
erce
nta
ge
System-Level Turnover (2007-2012) Region 5
2007-08 2008-09 2009-10 2010-11 2011-12 5 Yr Avg
0.00
5.00
10.00
15.00
20.00
25.00
Turn
ove
r P
erce
nta
ge
System-LevelTurnover (2007-2012) Region 6
2007-08 2008-09 2009-10 2010-11 2011-12 5 Yr Avg

33
0.00
5.00
10.00
15.00
20.00
25.00
Turn
ove
r P
erce
nta
ge
System-Level Turnover (2007-2012) Region 7
2007-08 2008-09 2009-10 2010-11 2011-12 5 Yr Avg
0.00
2.00
4.00
6.00
8.00
10.00
12.00
14.00
16.00
18.00
20.00
Turn
ove
r P
erce
nta
ge
System-Level Turnover (2007-2012) Region 8
2007-08 2008-09 2009-10 2010-11 2011-12 5 Yr Avg

34
Appendix E
Reasons for Turnover

35
Reasons for Teacher Turnover
2007-2012
(in descending rank order)
RANK 2007-08 2008-09 2009-10 2010-11 2011-12
1 To teach elsewhere To teach elsewhere To teach elsewhere Retired w/full benefits Retired w/full benefits
2 Retired Retired Retired Resigned to teach in another
NC public school system
Resigned to teach in another
NC public school system
3 Family Relocation Family Relocation Family Relocation Family Relocation Family Relocation
4 Other/Unknown Reasons Other/Unknown Reasons Interim contract ended-not
rehired
Moved to a non-teaching
position in the LEA
Moved to a non-teaching
position in the LEA
5 Family
responsibilities/childcare
Stayed in LEA in a non-
teaching position
Other/Unknown Reasons Resigned - other reasons Resigned - other reasons
6 Stayed in LEA in a non-
teaching position
Family
responsibilities/childcare
Re-employed retired teacher
resigned
Interim contract ended - not
rehired
Resigned - career change
7 Interim contract ended-not
rehired
Interim contract ended-not
rehired
Moved to a Non-Teaching
Position
Family
responsibilities/childcare
Interim contract ended - not
rehired
8 Re-employed retired teacher
resigned
Re-employed retired teacher
resigned
Family responsibilities/
childcare
Resigned - career change Resigned - Family
responsibility/Child care
9 Career Change Career Change Reduction In Force Retired w/reduced benefits Retired w/reduced benefits
10 To continue
education/sabbatical
To continue
education/sabbatical
Non-Renewal (Probationary
Contract ended)
Resigned - to teach in another
state
Resigned to teach in another
state
11 End of VIF term Health/Disability Career Change Resigned - reason unknown Non-renewed - Probationary
Contract ended
12 Dissatisfied with teaching End of VIF term To continue
education/sabbatical
Not renewed - Probationary
contract ended
Resigned - reason unknown
13 Resigned in lieu of
dismissal
Didn’t obtain/maintain
license
End of VIF term Resigned - to continue
education/take a sabbatical
Resigned - to continue
education/take a sabbatical
14 Didn’t obtain/maintain
license
Resigned in lieu of
dismissal
Dissatisfied with teaching Reduction in force Resigned - because of
health/Disability
15 Non-Renewal (Probationary
Contract ended)
Dissatisfied with teaching Health/Disability Resigned - because of
health/disability
Re-employed Retired teacher
resigned

36
Appendix F
Analysis of Turnover

37
Analysis of Turnover
2007-2012
Reasons for Leaving
2007-
2002
2008-
2009
2009-
2010
2010-
2011
2011-
2012
% of
11-12
REMAINED/REMAINING IN
EDUCATION 3636 3464 2092.5 2667 2967 25.16
Resigned to teach in another NC LEA 2313 2073 892.5 1364 1625 54.77
Resigned to teach in a NC Charter
School 67 72 53 44 49 1.65
Moved to a non-teaching position in
education 929 994 888 1020 1051 35.42
Resigned to continue
education/sabbatical 327 325 259 239 242 8.16
REASONS THAT MIGHT BE
REDUCED 3243 3020 2151.5 2464 2859 24.25
Retired with reduced benefits 242 228 276 385 484 16.93
Resigned to teach in a NC non-public/
private school 111 109 90 114 116 4.06
Resigned to teach in another state 467 493 352 312 341 11.93
Dissatisfied with teaching or career
change 666 541 366 640 816 28.54
Did not obtain or maintain license 162 188 143 88 84 2.94
Resigned for other reasons 1164 1118 663.5 669 733 25.64
Resigned for unknown reasons 431 343 261 256 285 9.97
REASONS INITIATED BY LEA 1013 1004 1604 1085.5 1193.7 10.12
Non-renewal (probationary contract
ended) 142 153 375 255 339 28.40
Interim contract ended--not rehired 666 665 1019 637.5 690.7 57.86
Resigned in lieu of dismissal 181 169 158 165 147 12.31
Dismissed 24 17 52 28 17 1.42
REASONS BEYOND CONTROL 5540 5107 5164 4576 4771.3 40.47
Reduction in Force 37 40 498 227 172 3.60
Retired with full benefits 1942 1791 1621 1808 2021 42.36
Re-employed retired teacher resigned 459 457 868 203 196 4.11
Resigned due to family responsibilities/
childcare 802 694 535 569 640 13.41
Resigned due to family relocation 1633 1478 1051 1183 1239 25.97
Resigned due to health/disability 196 210 157 204 215.3 4.51

38
REASONS BEYOND CONTROL
(continued) 5540 5107 5164 4576 4771.3 40.47
Resigned due movement required by
Military Orders 60 86 109 91 126 2.64
Deceased 68 61 56 55 65 1.36
End of VIF Term 279 209 185 108 57 1.19
End of TFA Term 64 81 84 128 40 0.84

39
25%
24%
10%
41%
Reasons by Categories (2011-12)
Remained/Remaining in Education
Reasons that Might be Reduced
Reasons Initiated by LEA
Reasons Beyond Control

40
Longitudinal Breakdown of Turnover by Category
Remained/Remaining in
Education 07-08 08-09 09-10 10-11 11-12
Resigned to teach in another NC LEA 2313 2073 892.5 1364 1625
Resigned to teach in a NC Charter School 67 72 53 44 49
Moved to a non-teaching position in
education 929 994 888 1020 1051
Resigned to continue education/sabbatical 327 325 259 239 242
Reasons that Might be
Reduced 07-08 08-09 09-10 10-11 11-12
Retired with reduced benefits 242 228 276 385 484
Resigned to teach in a NC non-public/
private school 111 109 90 114 116
Resigned to teach in another state 467 493 352 312 341
Dissatisfied with teaching or career change 666 541 366 640 816
Did not obtain or maintain license 162 188 143 88 84
Resigned for other reasons 1164 1118 663.5 669 733
Resigned for unknown reasons 431 343 261 256 285
Reasons Initiated by LEA 07-08 08-09 09-10 10-11 11-12
Non-renewal (probationary contract ended) 142 153 375 255 339
Interim contract ended--not rehired 666 665 1019 637.5 690.7
Resigned in lieu of dismissal 181 169 158 165 147
Dismissed 24 17 52 28 17

40
Reasons Beyond Control 07-08 08-09 09-10 10-11 11-12
Reduction in Force 37 40 498 227 172
Retired with full benefits 1942 1791 1621 1808 2021
Re-employed retired teacher resigned 459 457 868 203 196
Resigned due to family responsibilities/
childcare 802 694 535 569 640
Resigned due to family relocation 1633 1478 1051 1183 1239
Resigned due to health/disability 196 210 157 204 215.3
Resigned due movement required by
Military Orders 60 86 109 91 126
Deceased 68 61 56 55 65
End of VIF Term 279 209 185 108 57
End of TFA Term 64 81 84 128 40

41
07-08 08-09 09-10 10-11 11-12
Remained/Remaining in Education 3636 3464 2092.5 2667 2967
Reasons that Might be Reduced 3243 3020 2151.5 2464 2859
Reasons Initiated by LEA 1013 1004 1604 1085.5 1193.7
Reasons Beyond Control 5540 5107 5164 4576 4771.3
0
1000
2000
3000
4000
5000
6000
Categories of Reasons Why Teachers Leave the Profession (2007-2012)

43
Numbers of Teachers Leaving
Category Analysis (2011-12)
LEA
Code LEA
Total
Teachers
Teachers
Leaving
Remained
Remaining in
Education %
Reasons
beyond
control %
Reasons that
might be
reduced %
Reasons
Initiated
by the
LEA %
010 Alamance 1509 193 70 36.27% 61 31.61% 46 23.83% 16 8.29%
020 Alexander 340 25 5 20.00% 10 40.00% 7 28.00% 3 12.00%
030 Alleghany 127 15 1 6.67% 8 53.33% 3 20.00% 3 20.00%
040 Anson 261 42 17 40.48% 15 35.71% 8 19.05% 2 4.76%
050 Ashe 248 22 6 27.27% 9 40.91% 2 9.09% 5 22.73%
060 Avery 170 16 1 6.25% 9 56.25% 1 6.25% 5 31.25%
070 Beaufort 514 59 20 33.90% 32 54.24% 4 6.78% 3 5.08%
080 Bertie 186 9 2 22.22% 3 33.33% 4 44.44% 0 0.00%
090 Bladen 375 38 8 21.05% 20 52.63% 10 26.32% 0 0.00%
100 Brunswick 812 109 22 20.18% 34 31.19% 24 22.02% 29 26.61%
110 Buncombe 1812 167 36 21.56% 80 47.90% 37 22.16% 14 8.38%
111 Asheville City 343 18 4 22.22% 3 16.67% 9 50.00% 2 11.11%
120 Burke 912 123 18 14.63% 84 68.29% 18 14.63% 3 2.44%
130 Cabarrus 1879 198 29 14.65% 77 38.89% 69 34.85% 23 11.62%
132 Kannapolis City 401 51 13 25.49% 25 49.02% 9 17.65% 4 7.84%
140 Caldwell 902 73 22 30.14% 43 58.90% 5 6.85% 3 4.11%
150 Camden 149 8 2 25.00% 4 50.00% 0 0.00% 2 25.00%
160 Carteret 633 81 9 11.11% 47 58.02% 18 22.22% 7 8.64%
170 Caswell 214 35 10 28.57% 12 34.29% 11 31.43% 2 5.71%
180 Catawba 1071 95 22 23.16% 52 54.74% 9 9.47% 12 12.63%
181 Hickory City 299 38 10 26.32% 23 60.53% 2 5.26% 3 7.89%
182 Newton-Conover 208 19 6 31.58% 6 31.58% 6 31.58% 1 5.26%
190 Chatham 601 65 17 26.15% 27 41.54% 16 24.62% 5 7.69%
200 Cherokee 257 25 1 4.00% 16 64.00% 3 12.00% 5 20.00%
210 Chowan 170 16 5 31.25% 9 56.25% 2 12.50% 0 0.00%

44
LEA
Code LEA
Total
Teachers
Teachers
Leaving
Remained
Remaining in
Education %
Reasons
beyond
control %
Reasons that
might be
reduced %
Reasons
Initiated
by the
LEA %
220 Clay 101 7 0 0.00% 6 85.71% 0 0.00% 1 14.29%
230 Cleveland 1135 114 32 28.07% 45 39.47% 33 28.95% 4 3.51%
240 Columbus 430 59 18 30.51% 23 38.98% 13 22.03% 5 8.47%
241 Whiteville City 155 22 4 18.18% 13 59.09% 2 9.09% 3 13.64%
250 Craven 994 117 36 30.77% 58 49.57% 22 18.80% 1 0.85%
260 Cumberland 3826 603 110 18.24% 265 43.95% 157 26.04% 71 11.77%
270 Currituck 260 35 11 31.43% 8 22.86% 8 22.86% 8 22.86%
280 Dare 397 29 5 17.24% 15 51.72% 5 17.24% 4 13.79%
290 Davidson 1250 100 28 28.00% 43 43.00% 19 19.00% 10 10.00%
291 Lexington City 255 31 14 45.16% 6 19.35% 9 29.03% 2 6.45%
292 Thomasville City 184 27 15 55.56% 10 37.04% 2 7.41% 0 0.00%
300 Davie 463 37 3 8.11% 20 54.05% 13 35.14% 1 2.70%
310 Duplin 630 82 27 32.93% 42 51.22% 7 8.54% 6 7.32%
320 Durham 2181 398 133 33.42% 122 30.65% 124 31.16% 19 4.77%
330 Edgecombe 453 81 23 28.40% 35 43.21% 12 14.81% 11 13.58%
340 Forsyth 3938 564 171 30.32% 243.3 43.14% 106 18.79% 43.7 7.75%
350 Franklin 617 53 15 28.30% 25 47.17% 12 22.64% 1 1.89%
360 Gaston 2054 223 47 21.08% 101 45.29% 54 24.22% 21 9.42%
370 Gates 142 21 3 14.29% 13 61.90% 4 19.05% 1 4.76%
380 Graham 90 6 2 33.33% 1 16.67% 2 33.33% 1 16.67%
390 Granville 561 97 39 40.21% 36 37.11% 19 19.59% 3 3.09%
400 Greene 207 32 11 34.38% 14 43.75% 7 21.88% 0 0.00%
410 Guilford 4950 577 169 29.29% 188 32.58% 175 30.33% 45 7.80%
420 Halifax 317 77 22 28.57% 20 25.97% 29 37.66% 6 7.79%
421 Roanoke Rapids 191 20 5 25.00% 9 45.00% 4 20.00% 2 10.00%
422 Weldon City 88 25 4 16.00% 11 44.00% 10 40.00% 0 0.00%
430 Harnett 1241 179 34 18.99% 62 34.64% 73 40.78% 10 5.59%
440 Haywood 550 79 26 32.91% 31 39.24% 12 15.19% 10 12.66%
450 Henderson 926 94 29 30.85% 28 29.79% 32 34.04% 5 5.32%
460 Hertford 231 30 6 20.00% 11 36.67% 9 30.00% 4 13.33%
470 Hoke 569 119 27 22.69% 37 31.09% 54 45.38% 1 0.84%

45
LEA
Code LEA
Total
Teachers
Teachers
Leaving
Remained
Remaining in
Education %
Reasons
beyond
control %
Reasons that
might be
reduced %
Reasons
Initiated
by the
LEA %
480 Hyde 75 11 2 18.18% 5 45.45% 3 27.27% 1 9.09%
490 Iredell 1430 107 34 31.78% 56 52.34% 11 10.28% 6 5.61%
491 Mooresville City 354 43 10 23.26% 18 41.86% 12 27.91% 3 6.98%
500 Jackson 255 42 18 42.86% 14 33.33% 9 21.43% 1 2.38%
510 Johnston 2233 262 81 30.92% 94 35.88% 60 22.90% 27 10.31%
520 Jones 115 16 2 12.50% 12 75.00% 2 12.50% 0 0.00%
530 Lee 699 77 20 25.97% 22 28.57% 22 28.57% 13 16.88%
540 Lenoir 592 69 25 36.23% 32 46.38% 8 11.59% 4 5.80%
550 Lincoln 857 86 11 12.79% 48 55.81% 18 20.93% 9 10.47%
560 Macon 338 31 10 32.26% 10 32.26% 6 19.35% 5 16.13%
570 Madison 196 23 7 30.43% 10 43.48% 4 17.39% 2 8.70%
580 Martin 303 41 14 34.15% 19 46.34% 8 19.51% 0 0.00%
590 McDowell 453 28 8 28.57% 15 53.57% 3 10.71% 2 7.14%
600 Mecklenburg 8199 1177 220 18.69% 450 38.23% 334 28.38% 173 14.70%
610 Mitchell 165 12 5 41.67% 5 41.67% 1 8.33% 1 8.33%
620 Montgomery 307 34 17 50.00% 11 32.35% 6 17.65% 0 0.00%
630 Moore 822 114 16 14.04% 59 51.75% 30 26.32% 9 7.89%
640 Nash 1105 167 41 24.55% 68 40.72% 29 17.37% 29 17.37%
650 New Hanover 1585 159 26 16.35% 51 32.08% 45 28.30% 37 23.27%
660 Northampton 193 43 13 30.23% 10 23.26% 17 39.53% 3 6.98%
670 Onslow 1481 192 24 12.50% 116 60.42% 45 23.44% 7 3.65%
680 Orange 594 64 19 29.69% 31 48.44% 10 15.63% 4 6.25%
681 Chapel Hill-Carrboro 931 119 18 15.13% 42 35.29% 40 33.61% 19 15.97%
690 Pamlico 118 22 9 40.91% 5 22.73% 5 22.73% 3 13.64%
700 Pasquotank 469 40 5 12.50% 15 37.50% 18 45.00% 2 5.00%
710 Pender 470 69 24 34.78% 21 30.43% 6 8.70% 18 26.09%
720 Perquimans 137 20 11 55.00% 6 30.00% 3 15.00% 0 0.00%
730 Person 356 79 27 34.18% 29 36.71% 9 11.39% 14 17.72%
740 Pitt 1675 144 39 27.08% 43 29.86% 38 26.39% 24 16.67%
750 Polk 193 22 5 22.73% 11 50.00% 6 27.27% 0 0.00%

46
LEA
Code LEA
Total
Teachers
Teachers
Leaving
Remained
Remaining in
Education %
Reasons
beyond
control %
Reasons that
might be
reduced %
Reasons
Initiated
by the
LEA %
760 Randolph 1204 148 46 31.08% 64 43.24% 31 20.95% 7 4.73%
761 Asheboro City 339 45 14 31.11% 25 55.56% 1 2.22% 5 11.11%
770 Richmond 504 82 6 7.32% 28 34.15% 26 31.71% 22 26.83%
780 Robeson 1538 132 16 12.12% 77 58.33% 35 26.52% 4 3.03%
790 Rockingham 940 108 25 23.15% 64 59.26% 15 13.89% 4 3.70%
800 Rowan 1462 162 57 35.19% 62 38.27% 36 22.22% 7 4.32%
810 Rutherford 612 54 3 5.56% 3 5.56% 44 81.48% 4 7.41%
820 Sampson 554 63 24 38.10% 27 42.86% 10 15.87% 2 3.17%
821 Clinton City 239 28 17 60.71% 7 25.00% 3 10.71% 1 3.57%
830 Scotland 479 102 50 49.02% 31 30.39% 20 19.61% 1 0.98%
840 Stanly 671 48 21 43.75% 16 33.33% 10 20.83% 1 2.08%
850 Stokes 551 54 16 29.63% 27 50.00% 9 16.67% 2 3.70%
860 Surry 623 42 20 47.62% 14 33.33% 6 14.29% 2 4.76%
861 Elkin City 99 2 0 0.00% 0 0.00% 1 50.00% 1 50.00%
862 Mt. Airy City 126 9 2 22.22% 6 66.67% 1 11.11% 0 0.00%
870 Swain 140 14 3 21.43% 6 42.86% 5 35.71% 0 0.00%
880 Transylvania 273 28 5 17.86% 12 42.86% 6 21.43% 5 17.86%
890 Tyrrell 52 6 2 33.33% 3 50.00% 1 16.67% 0 0.00%
900 Union 2452 270 39 14.44% 104 38.52% 72 26.67% 55 20.37%
910 Vance 545 91 39 42.86% 26 28.57% 22 24.18% 4 4.40%
920 Wake 9374 1088 264 24.26% 385 35.39% 267 24.54% 172 15.81%
930 Warren 200 24 4 16.67% 15 62.50% 4 16.67% 1 4.17%
940 Washington 125 35 5 14.29% 17 48.57% 8 22.86% 5 14.29%
950 Watauga 344 41 3 7.32% 23 56.10% 10 24.39% 5 12.20%
960 Wayne 1221 133 41 30.83% 61 45.86% 31 23.31% 0 0.00%
970 Wilkes 655 64 21 32.81% 30 46.88% 8 12.50% 5 7.81%
980 Wilson 780 92 26 28.26% 51 55.43% 11 11.96% 4 4.35%
990 Yadkin 422 26 10 38.46% 7 26.92% 5 19.23% 4 15.38%
995 Yancey 181 9 2 22.22% 2 22.22% 2 22.22% 3 33.33%
TOTALS 97184 11791 2967 25.16% 4771.3 40.47% 2859 24.25% 1193.7 10.12%

47