teacher's guide grade 5 water matters! - southwest … solar energy, evaporation, condensation...
TRANSCRIPT

WaterMatters!Saving Your Water through Science
Grade 5Teacher's Guide
com/kh 7-2016
Introduction
Welcome to the Water Matters! curriculum developed by the Southwest Florida Water Management District (SWFWMD). The SWFWMD manages the water resources for west-central Florida as directed by state law. It was established in 1961 as a flood protection agency. Since then, its responsibilities have grown to include managing the water supply, protecting water quality and preserving natural systems that serve important water-related functions.
As a teacher, you have a very important role in preparing students to take on the responsibility of being stewards of the land and our water resources. By educating your students about the protection of Florida’s water, you teach them to be responsible citizens actively involved in maintaining a clean and healthy environment.
This Teacher’s Guide accompanies the fifth-grade module of the Water Matters! curriculum, which is correlated to the Next Generation Sunshine State Standards. The Student Publication contains vocabulary words (italicized and bolded) with vocabulary activities and review questions after each section. The Teacher’s Guide includes answers to student questions and additional content, activities and websites to explore.
We encourage teachers to use this guide electronically as there are hyperlinks available for easy access to other resources. In preparation for using the Water Matters! curriculum with your students, it will be helpful to read the entire Student Publication and Teacher’s Guide and test or bookmark the hyperlinks in the Teacher’s Guide. While using the curriculum:
• Read and discuss the material presented in the Student Publication with your students.
• Direct students to complete the vocabulary activities and questions at the end of each section in the Student Publication and then discuss the results with students.
• Implement the extension activities you select from the Teacher’s Guide.
Please note: Suggested extension activities with an asterisk after the name reference Project WET activities. Project WET, which stands for Water Education for Teachers, is a series of hands-on, investigative and easy-to-use activities for teaching students about water resources. To receive a Project WET guide, teachers must attend a six-hour training. If you don’t have a Project WET guide, check with your colleagues or order a free sample of the guide by emailing [email protected]. To learn more about Project WET, visit ProjectWET.org.
A variety of other publications and electronic resources are available from the SWFWMD. Visit WaterMatters.org/Education to learn more. For questions or comments, [email protected].
1

2
Section One:The Water Cycle
Key Ideas:
• All the water on Earth is part of nature’s never-ending system called the water cycle, which is powered by energy from the sun.
• Water can be a gas, a liquid or a solid and can go back and forth from one state to another.
• Holding 97 percent of the water on Earth, the oceans play an important part in the water cycle through evaporation and precipitation.
Standards SC.5.E.7.1Create a model to explain the parts of the water cycle. Water can be a gas, a liquid, or a solid and can go back and forth from one state to another.SC.5.E.7.2Recognize that the ocean is an integral part of the water cycle and is connected to all of Earth's water reservoirs via evaporation and precipitation processes.
Objectives
• The student will explain how water on Earth is recycled in a never-ending process called the water cycle or hydrologic cycle.
• The student will explain the role of oceans in the global water cycle.
• The student will recognize and evaluate various water cycle models.
• The student will create a water cycle model.
Vocabulary
Condensation Precipitation Water vapor
Evaporation Transpiration
Percolation Water cycle
Bellringer Water Cycle Phase Identification PowerPointTo assess students’ prior knowledge of the water cycle, write these terms on the board: condensation, evaporation, percolation, precipitation and transpiration.

3
Have students each number a piece of paper 1–5. Project these selected PowerPoint slides from Etc.Usf.Edu/Clippix/Pictures/Water-Cycle-Photographs/. Ask students to write down which phase or phases of the water cycle are occurring in each photo.
1. Clouds and Intracoastal Waterway — condensation (clouds) and evaporation (from water)2. Downpour onto small pond with fountain — precipitation, percolation (on ground) and condensation
(mist in background)3. Hillsborough River at mid-morning — transpiration and evaporation4. Looking east across Lake June-in-Winter — transpiration and evaporation5. Raindrops on window — precipitation
Engage Water Cycle Podcast Show this video to your class. It’s less than five minutes and is easily found at WaterMatters.org/Podcasts. An accompanying teacher’s guide for grades 4 and 5 also is available online.
The Incredible Journey* Project WET Curriculum and Activity Guide 2009 version page 161 or 2.0 version page 155; or the 2.0 Sampler, page 19. Also available on ProjectWET.org. With the roll of a cube, students simulate the movement of water within the water cycle. This activity helps reinforce that the oceans are tied to the global water cycle.
Explore Students should read Section One of the Water Matters! Grade 5 Student Publication and complete the vocabulary review and questions.
For additional vocabulary review, provide each student or partners with a copy of the "Hydrologic Cycle Fill-in-the-Blanks" found at WaterMatters.org/Activities.
Review Water Cycle Phases
• For review of the states of water, see Water Matters! Grade 3 Student Publication, Section One.
• For review of evaporation, condensation or precipitation, go to Water Matters! Grade 3 Teacher’s Guide, Section One for “It’s Raining in the Coffee Pot” and several other demonstrations and investigations.
• For transpiration review, go to Water Matters! Grade 3 Teacher’s Guide, Section Three for “Baggie on a Branch.”
Here are additional options for expanding student knowledge about the water cycle and water cycle models:
Comparing Water Cycle ModelsIn preparation for this lesson, after reviewing the student text, discuss the term cycle, using examples like bicycle wheels and the life cycles of a butterfly and a plant. Discuss models. Explain that models can be two-dimensional, a computer model, three-dimensional, or an explanation in your mind. Discuss limitations of models in representing the real water cycle.
Please Note: Although students will likely suggest including transpiration, infiltration and percolation as part of the model, please note CPALMS clarification on content limits for testing associated with SC.5.E.7.2, which says "Items will not address or assess transpiration, infiltration or percolation as processes of the water cycle." So when discussing what a model must do, be sure students are prepared for models that address only the following: solar energy, evaporation, condensation and precipitation.

4
Two-dimensional Models:
• Tell your students that the water cycle illustration on page 3 of the Student Publication is an example of a two-dimensional model.
• Order the Hydrologic Cycle poster from WaterMatters.org/Publications or download the poster to display for students.
• Discuss how the poster: shows the water cycle concepts, is different from the illustration in the Student Publication, is different from the real water cycle, and helps them understand the real water cycle.
• Ask students to create or draw a two-dimensional water cycle model showing only solar energy, evaporation, condensation and precipitation.
Computer Models:
• Have students view EPA’s animated water cycle. This interactive site allows students to use the mouse to select phases of the water cycle.
• Have students view this online animated water cycle at Pmm.Nasa.Gov/Education/Videos/Water-Cycle-Animation.
• Discuss how these models: show the water cycle concepts, are different from the real water cycle, are different from the two-dimensional models, are different from each other, and help students understand the real water cycle.
Three-dimensional Models:
• So that students are prepared to recognize three-dimensional models showing only solar energy, evaporation, condensation and precipitation CPALMS clarification on content limits for SC.5.E.7.2), project the illustrations found at this link Education.Com/Science-Fair/Article/Earth-Science_Making-Clouds/ or replicate them as a class demonstration.
• Demonstrate or have students make a three-dimensional model of the water cycle by completing the Water Cycle in a Baggie activity using instructions found at WaterMatters.org/Education/Activities/.
• Discuss how the three-dimensional model: shows the water cycle concepts, is different from the real water cycle, is different from the two-dimensional and computer models, and helps them understand the real water cycle.
Oceans and the Water Cycle — Solar Still VideoEven though most of the water evaporated into the water cycle is salt water from oceans, rainwater is fresh water. This video from PBS Zoom shows a demonstration that will help students see that process in action. This could be used as a demonstration or team investigation.
Explain By completing the questions after Section One, students will explain what they read and comprehended.
Partners Pick the Best Water Cycle ModelAfter completing "Comparing Water Cycle Models", have partners decide which of the models helped them understand the water cycle the best. Have partners share their decisions and reasons with the class.
Write About The Incredible JourneyAfter completing "The Incredible Journey", ask students to write a paragraph describing the journey of a raindrop that includes the following terms: condensation, evaporation, percolation, precipitation, transpiration and sun’s energy. Be sure students include an explanation of how the ocean is an important part of the water cycle.

5
Elaborate Create Your Own Water Cycle ModelAfter completing "Comparing Water Cycle Models" and "Partners Pick the Best Water Cycle Model", divide the class into teams and have each team research and create a different water cycle model. When complete, have teams demonstrate their models to the class.
Graphing Results After completing "The Incredible Journey", compile the data from student tally sheets and construct a graph of the results.
EvaluateChoose the Best Water Cycle ModelAfter teams have presented their own water cycle models to the class, have each student write a paragraph, stating:
• Theessentialelementsasuccessfulmodelofthewatercyclemustinclude.• Whichoftheteams’modelsbestillustratedthewatercycle?• Reasonsforselectingthebestmodel.
Water Cycle Phase Identification PowerPointRepeat the Bellringer activity for a post-assessment.
Additional Free ResourcesUSGS’s Water Cycle for Kids can be printed or viewed online at Water.Usgs.Gov/Edu/WaterCycle-Kids-Beg.html.
For additional activities, order or download WaterDrops, Water Cycle booklet and Teacher’s Guide from WaterMatters.org/Publications.
Pmm.Nasa.Gov/Education/Videos/Water-Cycle-Animation
Section Two:Precipitation
Key Ideas: • Precipitationcanberain,snow,sleetorhail.• Theformprecipitationtakesisdeterminedbytheweatherinaparticularplaceandtime.• Bothfloodsanddroughtsaredirectlyrelatedtoprecipitation.
Standards SC.5.E.7.3Recognize how air temperature, barometric pressure, humidity, wind speed and direction, and precipitation determine the weather in a particular place and time.SC.5.E.7.4Distinguish among the various forms of precipitation (rain, snow, sleet, and hail), making connections to the weather in a particular place and time.
Objectives • Thestudentwilldistinguishamongthevariousformsofprecipitation.• Thestudentwillrecognizehowvariousweatherfactorsdeterminethetypeofprecipitation.• Thestudentwillexplainthedifferencebetweenfloodsanddroughts.
Vocabulary
Drought Rain
Flood Sleet
Hail Snow
Bellringer Ask students to list two good things about rain and two bad things. Share responses.
Engage The Water Cycle — AnimationThis NASA animation shows the entire process of the water cycle throughout the course of a day. It helps transition from water cycle to precipitation and is found at Pmm.Nasa.Gov/Education/Videos/Water-Cycle-Animation.
PrecipitationThis one-minute PBS video shows rain, snow and hail with sound but not narration: PbsLearningMedia.Org/Resource/ess05.Sci.ess.watcyc.Precipitation/Observe-Precipitation/.
The Thunderstorm* Project WET Curriculum and Activity Guide 2009 version page 196 or 2.0 version page 209. Students simulate the sounds of a thunderstorm through physical activity and generate precipitation maps through a mock monitoring network.
6

7
ExploreStudents should read Section Two of the Water Matters! Student Publication and complete the vocabulary review and questions.
Here are additional options for expanding student knowledge about precipitation, floods and droughts:
Make Your Own Rain Gauge If time and weather allow, use the instructions on page 4 of "WaterDrops, Weather" found at this link to have students or teams make their own rain gauges and keep track of daily rainfall. Order a class set from WaterMatters.org/Publications.
What’s in the Rain?This experiment lets students see that there are particles of dust, dirt, etc. in the air brought to Earth by rainfall: WeatherWizKids.Com/Experiments-Rain.htm.
Yours, Mine and OursThis activity helps students think further about what might happen if severe, long-term drought created water shortages. Find the activity in Water Matters! Grade Four Teacher’s Guide, Section Three, page 9.
Snowflakes Under a Microscope Students can see how snowflakes differ from one another with these slides of snowflakes under a microscope. This page also illustrates how sleet forms: Weather.Com/Storms/Winter/News/Sleet-Freezing-Rain-Difference-20121123.
Explain By completing the questions after Section Two, students will explain what they read and comprehended.
DroughtHave students write a few paragraphs explaining how drought can affect the environment and the importance of water users understanding and practicing water conservation during a drought. Have them research “water restrictions” online to see examples of rules put in place during serious droughts and share what they learn with the class. Find restrictions that were in place during a 2013 drought in the Tampa Bay area at WaterMatters.org/Conservation/Restrictions/TBPhase3.php.
Elaborate Researching RainfallStudents can search historical weather information by ZIP code on Weather Underground. Have students plot monthly precipitation averages to make a line graph of last year’s rainfall. You also could have students or groups complete line graphs for cities from different climates to compare rainfall amounts.
How Do You Measure Up?Using butcher paper, have students create a full-size bar graph to compare the height of the tallest student in the class with the annual rainfall average in the Southwest Florida Water Management District (53 inches) and with those of the cities with the highest and lowest averages found on this site: CurrentResults.Com/Weather/US/Average-Annual-Precipitation-By-City.Php.

8
Evaluate Which Am I?Instruct students to make a set of question and answer cards using Student Page15. Working in pairs, have partners rotate asking questions and giving answers.
Venn Diagram — Floods and DroughtsUsing Student Page 14, have students fill in the venn diagram with characteristics of floods and droughts.
My JourneyHave students write a story from the perspective of two water drops telling each other their experiences. One day, one drop fell to the ground as rain, evaporated and then fell as snow. The other drop fell as sleet, melted, evaporated and fell as hail the next day. Students should demonstrate an understanding of the water cycle as well as of evaporation and the types of precipitation form.
Additional Resources Order or download WaterDrops, Weather student booklet and the accompanying teacher’s guide from WaterMatters.org/Publications.
See WeatherWizKids.com/Weather-Rain.htm for information on rain, floods and clouds.

9
Section Three: Weather — Mild to Wild
Key Ideas: • Airtemperature,barometricpressure,humidity,windspeedanddirection,andprecipitationdetermine
the weather in a particular place and time.• Floridahasextremeweatherevents—lightning,thunderstorms,tornadoesandhurricanes—and
families need to be prepared.
Standards
SC.5.E.7.3Recognize how air temperature, barometric pressure, humidity, wind speed and direction, and precipitation determine the weather in a particular place and time.
SC.5.E.7.7Design a family preparedness plan for natural disasters and identify the reasons for having such a plan.
Objectives • Thestudentwillrecognizehowvariousfactorsdetermineweather.• Thestudentwillexplainwhatmeteorologistsdoandwhattoolstheyuse.• Thestudentwillinterpretweatherforecasts.• Thestudentwilltrackahurricane.• Thestudentwilldesignahurricanepreparednesskitfortheirfamily.
Vocabulary
Air pressure Lightning Tornado
Air temperature Meteorologist Weather
Front Storm surge Wind speed
Humidity Thunderstorm Wind direction
Hurricane Tropical storm
Bellringer Ask students to think about any scary or dangerous weather they have experienced and how it made them feel. Share responses.
Engage Slideshow of Hurricane ImagesShow this slideshow of dramatic images of the destruction caused by Hurricane Sandy in New Jersey, 2012.
10
Surviving Hurricane CarlaRead aloud the brief story of a woman remembering when she experienced Hurricane Carla in 1961 as a 10-year-old girl in Houston, Texas. The story is found at this link: Scied.Ucar.Edu/WebWeather/Hurricanes/Surviving-hurricane-Carla.
Discuss the images on the slideshow and the story with students. Help students imagine what it would have been like to experience one of these hurricanes and how they think their lives would have been impacted.
ExploreStudents should read Section Three of the Water Matters! Student Publication and complete the vocabulary review and questions.
Here are additional options for expanding student knowledge about weather forecasting and extreme weather:
Air: A Weighty SubjectUse this simple demonstration from NOAA using two balloons balanced on a yardstick if students need help understanding that air has weight prior to completing "Engineering a Barometer". Simple demonstration.
Engineering a BarometerTo have students create their own barometer to measure air pressure, see the "Engineering a Barometer" activity at WaterMatters.org/Education/Activities.
Understanding Weather MapsThis two-class activity is designed to help students become familiar with different types of weather maps and conditions. Divide the class into six groups. Each group will be assigned to study and create a poster showing a different type of map: satellite, precipitation, radar, temperature, wind speed and front. The unit, which can be completed without the suggested accompanying video, is found at this link:DiscoveryEducation.Com/Teachers/Free-Lesson-Plans/Weather-Maps.cfm.
Explain By completing the questions after Section Three, students will explain what they read and comprehended.
What if I Lived Through a Hurricane?Remind students about the pictures of Hurricane Sandy and the Surviving Hurricane Carla story covered during the Engage portion of this lesson. Have them imagine living through a hurricane themselves. Ask them to write one or more paragraphs describing what they saw, what they heard and how they felt. Have them read their paragraphs to partners. Select one to be read aloud to the whole class. This makes a good introduction for hurricane preparedness.
Hurricane PreparednessGo through the information on FEMA’s website, Ready.Gov/Kids, under the "Make A Plan, Build A Kit" and "Know the Facts" sections to prepare students to make their own hurricane preparedness kit in the Evaluate section.
Reading the Weather Map Project a weather forecast map from the newspaper or Internet and discuss with students the information the map provides.
11
Elaborate Tracking a Hurricane – Latitude and LongitudeMaps are often used to provide tracking information about tropical storms and hurricanes. The Atlantic hurricane season (June 1–November 30) typically experiences 10 tropical storms and six hurricanes. In this activity, students will use clues to determine the path of a tropical storm that develops into a hurricane. As preparation, explain latitude and longitude lines and how to plot them on the map. Distribute the Hurricane Tracking Chart on Student Page 17, and then inform students of the directions and storm path clues below in any format that works well in your classroom. When they finish the activity, have students compare their maps with those of others. Storm tracking paths should dissipate in the Atlantic Ocean, southeast of Cape Hatteras.
Materials: "Hurricane Tracking Chart" on Student Page 18, highlighter, pencil
Student Directions:
1. Using the "Hurricane Tracking Chart" provided, add a compass to indicate north, south, east and west.
2. Read the clues provided to describe the current location of the storm. Locate each position on your map and label it with the correct letter.
3. Connect the dots by using a highlighter to shade the path of the storm. Then compare your map with the maps of others to find out if your tracking ended in the same place.
Storm Path Clues:
A. A tropical storm forms north of Puerto Rico at 20°N and 67°W.
B. The storm moves directly west five degrees.
C. The storm increases speed and moves seven degrees west and two degrees north.
D. The 100-mph winds cause the storm to become a Category 2 hurricane as it moves north to 79°W and 25°N.
E. The hurricane’s 120-mph winds increase its status to a Category 3 as it threatens the coastal area near 26°N and 80°W.
F. Instead of moving inland, however, the hurricane weakens, turns and moves in a northeast direction away from the coast, passing over 75°W and 29°N.
G. After weakening to a tropical depression, it gets absorbed by a cold front at 70°W and 34°N.
EvaluateBuild a KitHave students work with their families to complete a hurricane preparedness kit. Include the Checklist for Kids, Checklist for Parents and Parents Communication Form at Ready.Gov/Kids. Also have students play the "Build a Kit" game to evaluate their understanding of what is needed in a kit.
Read the Weather MapProject or provide copies of a weather map similar to the one you used in "Reading the Weather Map". Have students answer several questions to allow them to demonstrate map reading skills. Sample questions could include:Whatisthehightemperatureforecastfortoday?Israinforecastedtoday?Whatdoesthe“H”onthemapmean?Arethunderstormsforecastforanywhereonthemaptoday?Whichplacewillhavethecoldesttemperature?

12
Additional Resources
Pick up free hurricane tracking maps, preparedness brochures and information on flood zones and emergency shelters from local grocery or home supply stores, news stations or government offices. Share on Students.org contact your county’s Emergency Management Department for further information or to request a guest speaker.
Tornado in a Bottle
Howdoesatornadoform?LearnhowwhilemakingaTornadoinaBottle— SteveSpanglerScience.com/Lab/Experiments/Tornado-in-a-Bottle1.
Order or download "WaterWeb, Extreme Weather" booklet from WaterMatters.org/Publications. The accompanying teacher’s guide also is available.
Treehouse Weather Kids
This website, designed for grades 5–8, explains a variety of topics associated with weather, extreme weather and weather forecasting: Extension.Illinois.edu/Treehouse/AirPressure.cfm?Slide=1.
Weather Forecasting
This website provides background on a variety of weather forecasting terms: WeatherWizKids.com/Weather-Forecasting.htm.
NOAA
Coloring Book: "Thunderstorms and Safety" can be downloaded and printed from: Nssl.Noaa.gov/Education/Students/bm/bm02.pdf.
13
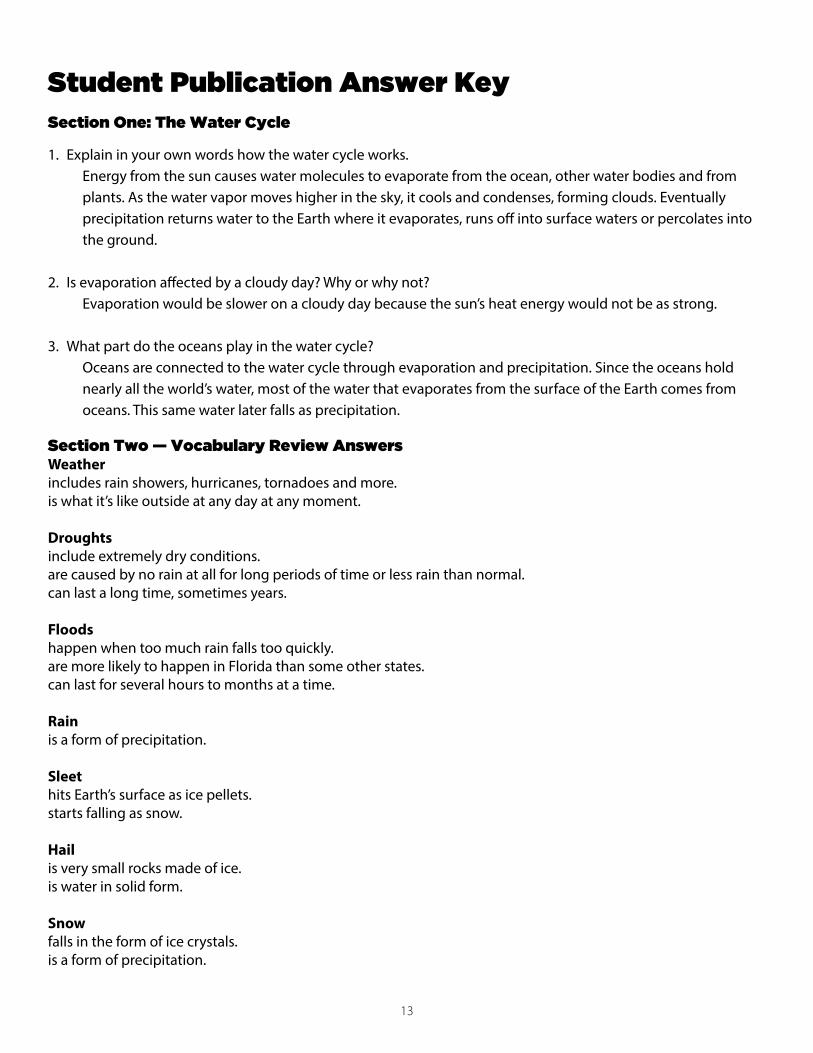
Student Publication Answer KeySection One: The Water Cycle
1. Explain in your own words how the water cycle works. Energy from the sun causes water molecules to evaporate from the ocean, other water bodies and from plants. As the water vapor moves higher in the sky, it cools and condenses, forming clouds. Eventually precipitation returns water to the Earth where it evaporates, runs off into surface waters or percolates into the ground.
2. Isevaporationaffectedbyacloudyday?Whyorwhynot? Evaporation would be slower on a cloudy day because the sun’s heat energy would not be as strong.
3. Whatpartdotheoceansplayinthewatercycle? Oceans are connected to the water cycle through evaporation and precipitation. Since the oceans hold nearly all the world’s water, most of the water that evaporates from the surface of the Earth comes from oceans. This same water later falls as precipitation.
Section Two — Vocabulary Review AnswersWeatherincludes rain showers, hurricanes, tornadoes and more.is what it’s like outside at any day at any moment.
Droughtsinclude extremely dry conditions. are caused by no rain at all for long periods of time or less rain than normal. can last a long time, sometimes years.
Floodshappen when too much rain falls too quickly. are more likely to happen in Florida than some other states. can last for several hours to months at a time.
Rainis a form of precipitation.
Sleethits Earth’s surface as ice pellets. starts falling as snow.
Hailis very small rocks made of ice.is water in solid form.
Snowfalls in the form of ice crystals. is a form of precipitation.

14
Section Two — Precipitation1. Howaresleet,hailandsnowalike?Howaretheydifferent? The three forms of precipitation are alike in that they are all forms of water that require freezing temperatures to form. They are different because the three form differently. Sleet starts falling as snow, melts as it goes through a warm layer of air, then refreezes into ice pellets before it hits the ground. Hail is made up of small pieces of ice created when waterdrops freeze in the clouds. Snow starts with ice crystals being formed individually in clouds then sticking together to form snowflakes as they fall.
2. WhyisrainthemostcommonformofprecipitationinFlorida? Rain is the most common form of precipitation in Florida because hail, sleet and snow all need freezing temperatures, which are rare in Florida.
3. Explainwhatadroughtis?WhatarethreewaysdroughtscancauseproblemsforFlorida’sresidents? A drought is extremely dry weather that lasts longer than usual. During droughts, plants, crops and wildlife can die. Forest fires can start easily and spread quickly. You may not be able to go fishing or boating if rivers and lakes dry up. There might not be enough groundwater for peoples needs.
4. WhyisFloridamorelikelytohavefloodsthansomeotherstates? Florida is likely to have floods because it has so many water bodies and gets so much of its rain in a short period of time. Once the ground becomes saturated and water bodies are full, rain has nowhere to go. That’s when floodwaters cover streets and yards, and damage homes.
Section Three: Weather — Mild to Wild1. Whatfactorsdometeorologistsstudytopredicttheweather? • Airtemperature • Airpressure • Humidity • Windspeed • Winddirection
2. Whyaremeteorologistsimportanttopeople?Listtworeasonsbasedonwhatyoulearnedaboutweatherin Florida. Meteorologists help us plan for daily weather so we will know to wear warm enough clothing or to carry an umbrella. They also give us enough warning so we can leave or have supplies ready for a bad storm.
3. Howaretornadoesandhurricanesalikeanddifferent? Alike: Tornadoes and hurricanes are both violent and dangerous storms that can destroy trees, buildings, habitats and even entire towns.
Different: Tornadoes form when warm, moist air meets cool, dry air. Hurricanes form and get stronger over warm ocean water but lose power over land. Hurricanes are shaped like pinwheels but tornadoes form funnels. Hurricanes usually last a week while tornadoes last only a few minutes.
4. Howcanyoutellhowcloseathunderstormistoyou?Whatshouldyoudoifathunderstormisnear? You can figure out how far away a storm is by counting the seconds between seeing the flash of lightning and hearing the thunder. For every five seconds counted, a storm is one mile away. If a storm is nearby, head for cover. If you are outside, get inside a building or into a car.

15
Section Two: Floods and Droughts Venn DiagramUse the information about floods and droughts from Section Two to complete the Venn diagram. Write the features that are unique to floods and droughts on the correct portion. Then list the features in the overlapping area that are common to both.
Student Page
Floods
Droughts
16
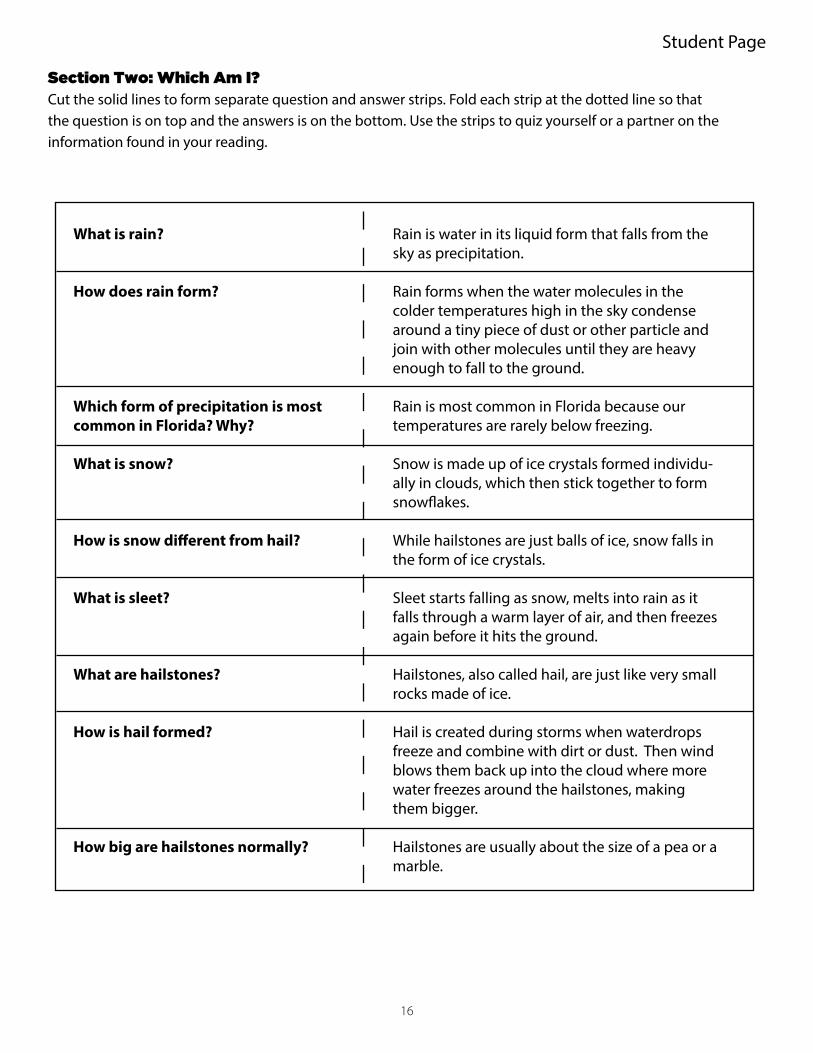
Section Two: Which Am I?Cut the solid lines to form separate question and answer strips. Fold each strip at the dotted line so that the question is on top and the answers is on the bottom. Use the strips to quiz yourself or a partner on the information found in your reading.
Student Page
What is rain?
How does rain form?
Which form of precipitation is mostcommon in Florida? Why?
What is snow?
How is snow di�erent from hail?
What is sleet?
What are hailstones?
How is hail formed?
How big are hailstones normally?
Rain is water in its liquid form that falls from the sky as precipitation.
Rain forms when the water molecules in the colder temperatures high in the sky condense around a tiny piece of dust or other particle and join with other molecules until they are heavy enough to fall to the ground.
Rain is most common in Florida because our temperatures are rarely below freezing.
Snow is made up of ice crystals formed individu-ally in clouds, which then stick together to form snow�akes.
While hailstones are just balls of ice, snow falls in the form of ice crystals.
Sleet starts falling as snow, melts into rain as it falls through a warm layer of air, and then freezes again before it hits the ground.
Hailstones, also called hail, are just like very small rocks made of ice.
Hail is created during storms when waterdrops freeze and combine with dirt or dust. Then wind blows them back up into the cloud where more water freezes around the hailstones, making them bigger.
Hailstones are usually about the size of a pea or a marble.

17
Student Page
Section Three: Hurricane Tracking Chart
