teaching entrepreneurship: impact of business training … · teaching entrepreneurship: impact of...
TRANSCRIPT
YALE UNIVERSITYP.O. Box 208629
New Haven, CT 06520-8269http://www.econ.yale.edu/~egcenter/
CENTER DISCUSSION PAPER NO. 941
Teaching Entrepreneurship:Impact of Business Training on Microfinance
Clients and Institutions
Dean S. KarlanYale University
Innovations for Poverty Action
Martin ValdiviaGrupo de Análisis para el Dessarrollo
Lima, Peru
July 2006
Notes: Center Discussion Papers are preliminary materials circulated to stimulate discussions and criticalcomments.
Authors acknowledge financial support by the Henry E. Niles Foundation, the Ford Foundation,the PEP Research Network, the United States Department of Labor, BASIS/USAID (CRSP) andthe National Science Foundation (CAREER SES-0547898). The views expressed herein arethose of the authors and do not necessarily reflect the views of any of the donors. We thank AnaDammert, Juan José Díaz, Chris Dunford, Eric Edmonds, Bobbi Gray, Chris Udry, andparticipants of seminars at USDOL and at the 2006 PEP Network Meeting. We thank theFINCA-Peru team, including La Morena, Aquiles Lanao, Iris Lanao, Yoliruth Núñez, and all thecredit officers in Ayacucho and Lima, and the institutions that participated in the design of thetraining materials and training of the FINCA staff: Kathleen Stack from Freedom from Hunger,and Mario Lanao from Atinchik. The authors thank Adriana Barel, Jonathan Bauchet, VeronicaFrisancho, Marcos Gonzales, Lauren Smith and Paola Vargas for excellent research assistance. Any remaining errors or omissions are our own. Contact information: [email protected] [email protected].
This paper can be downloaded without charge from the Social Science Research Network electroniclibrary at: http://ssrn.com/abstract=920487
An index to papers in the Economic Growth Center Discussion Paper Series is located at:http://www.econ.yale.edu/~egcenter/research.htm

Teaching Entrepreneurship:
Impact of Business Training on Microfinance Clients and Institutions
Dean Karlan and Martin Valdivia
Abstract
Can one teach entrepreneurship, or is it a fixed personal characteristic? Most academic and policydiscussion on microentrepreneurs in developing countries focuses on their access to credit, andassumes their human capital to be fixed. However, a growing number of microfinance organizationsare attempting to build the human capital of micro-entrepreneurs in order to improve the livelihoodof their clients and help further their mission of poverty alleviation. Using a randomized controltrial, we measure the marginal impact of adding business training to a Peruvian village bankingprogram for female microentrepreneurs. Treatment groups received thirty to sixty minuteentrepreneurship training sessions during their normal weekly or monthly banking meeting over aperiod of one to two years. Control groups remained as they were before, meeting at the samefrequency but solely for making loan and savings payments. We find that the treatment led toimproved business knowledge, practices and revenues. The microfinance institution also had directbenefits through higher repayment and client retention rates. Larger effects found for those thatexpressed less interest in training in a baseline survey have important implications for implementingsimilar market-basedinterventions with a goal of recovering costs.
Keywords: entrepreneurship, microfinance, business training, business skills, adult education
JEL Codes: C93, D12, D13, D21, I21, J24, O12

1
I. Introduction
Can one teach entrepreneurship? Both macro growth models as well as micro market
models often include human capital as a critical component. However, many of our models of
entrepreneurial activity in developing countries treat human capital as fixed, and focus instead
on financial constraints and information asymmetries in credit and equity markets (Banerjee and
Newman 1993; Paulson and Townsend 2004). Similarly, much of the microfinance industry
focuses on the infusion of financial capital into micro-enterprises, not human capital, as if the
entrepreneurs either already have the necessary human capital. Some development
practitioners, however, actively pursue strategies to teach adults (typically women)
entrepreneurial skills. These programs are strikingly heterogeneous, and little is known about
their impact on economic outcomes for the poor.
In this paper, we evaluate the marginal impact of adding entrepreneurship training to a
microfinance program in Peru. Much tension exists in the development finance community
regarding whether lenders should specialize on financial services only, or should integrate non-
financial services into their programs (MkNelly, Watetip, Lassen and Dunford 1996).1 The idea
that specialization is good is certainly not new, but in this setting it is unknown whether the
economies of scope outweigh the risks of having credit officers simultaneously become
“teachers.” The issue is starker in other “education” components such as health and nutrition
training. Such other modules are often part of the “credit with education” approach, but this
study focuses strictly on the business training modules. Aside from losing focus on the lending
1 In a third alternative, the “parallel” approach, non-financial services are provided to the same individuals by another organization (or other employees of the same organization) in coordination with the financial service provider.

2
and savings activities, providing detailed business advice may lead to higher default if the
borrower then perceives the lender as partially responsible for any business changes that do not
succeed.
Similar entrepreneurship training has been used around the world by Freedom from
Hunger (FFH), a US-based non-profit organization, as well as other organizations. FFH is
considered the leader in the “credit with education” integrated model of microfinance and is
directly responsible for work in 18 countries and over 30 financial institutions. Its influence in
credit-linked training programs is evident from the adoption of its approach by other
organizations without direct intervention from FFH and its prominent role at industry events
such as the Microcredit Summit (Dunford 2002). However, little is known about the marginal
impact of these non-financial services.2 This study addresses this gap by implementing a
randomized control trial to assess the marginal impact of incorporating such training into a
microcredit program. The study was conducted with the Foundation for International
Community Assistance (FINCA) in Peru, a “village banking” organization for poor, female
microentrepreneurs in Lima and Ayacucho. We randomly assigned pre-existing lending groups
to either treatment or control. Treatment groups received the training as part of their mandatory
weekly meetings. Control groups remained as they were before, a credit and savings only
group. We conducted a baseline survey before the intervention and a follow-up survey between
one and two years later.
2 One notable exception is an analysis of the non-credit services offered by the microfinance institutions in Bangladesh. This study used a structural approach to estimate the impact of credit services and assumed the residual impact to be due to the non-credit aspect of the program (McKernan 2002). Prior evaluations of Freedom from Hunger have measured the impact of the entire package of credit with education versus no services, not the marginal value of the education to the credit program. A comparison has been done on Project HOPE’s credit program with health education versus the credit program alone (Smith 2002). This study did not focus on specifically entrepreneurial training and was not a randomized control trial.

3
We find strong benefits for both the client and the microfinance institution. The client
shows improved business processes and knowledge and increased sales. The microfinance
institution benefits from increased retention and repayment. Section II presents the nature of the
intervention and basic hypothesis. Section III explains the experimental design and Section IV
details the data collected and empirical strategy. Section V presents the results, and Section VI
concludes.
II. The intervention and its expected effects
The goal of the business training intervention is two-fold: to improve business outcomes
and overall welfare for clients and to improve institutional outcomes for the microfinance
institution. Stronger business may demand more services, and clients may be less likely to
default if they are satisfied (either due to higher cash flow or a stronger feeling of reciprocity).
But the two goals do not need to reinforce each other. If business increases enough that clients
“graduate” to larger formal sector banks, providing the business training could lead to lower
client retention for this organization.
The Intervention
FINCA is a small, non-profit, but financially sustainable, microfinance institution (MFI)
that has been operating in Peru since 1993, and is associated with FINCA International, a large
US-based, non-profit organization responsible for creating and replicating the village banking
methodology around the world. FINCA-Peru’s mission is to improve the socio-economic
situation of the poor and empower women through the promotion of the village-banking
methodology. By providing them with working capital to increase inventory and invest in their
businesses, FINCA expects to increase the earned income of its clients, primarily poor women
4
with no collateral. In addition to providing credit, FINCA teaches its clients to save by
requiring weekly or monthly savings deposits that correspond to the size of the loan the client
has taken out and by encouraging additional voluntary savings for which they receive market
interest rates. FINCA further aims to empower clients by giving them the opportunity to run
their banks through their rotating participation on the village-bank board.
FINCA has operations in three particularly poor districts of Lima, and in two Andean
provinces, Ayacucho and Huancavelica. As of June 2003, FINCA sponsored 273 village banks
with a total of 6,429 clients, 96 percent of which were women. FINCA members, particularly
those in Ayacucho, are relatively young and have little formal education. FINCA clients each
hold, on average, $233 in savings whereas the average loan is $203, with a recovery rate of 99
percent. FINCA charges sufficient interest to be self-sustainable. Its sustainability indicator
(Total income / Total expenses) was 99 percent in 1998; 105.5 percent in 1999; and 132.2
percent in August, 2000.
The business training materials were developed through a collaborative effort between
FINCA, Atinchik,3 and Freedom from Hunger (FFH), and had been used in the past in other
projects.4 The program included general business skills and strategy training, not client-specific
problem-solving. Although the pedagogy did include discussion with the clients (not just
lecture) and various short exercises, there was no part of the program that worked directly with
3 Atinchik, a nine-year old firm, specializes in the generation of training materials in business management for micro-entrepreneurs. Atinchik had used similar training previously in a project for the World Bank. 4 Since 1995, FFH has provided technical assistance to eighteen MFIs in Asia, Africa and Latin America, with its program Credit with Education, a combination of microcredit and educational services. Working with independent local partners, FFH provides training in microfinance products, MFI capacity building, and adult education in health and business development. Its business education curriculum was developed through market assessments using individual surveys, focus groups with key informants, pilot-testing, and the feedback of clients and staff.

5
an individual client on their individual business problems. Although the content of the training
was similar in both locations, they were organized and presented differently to cater to the
differences in educational levels and learning processes.5 In Lima, clients received handouts
and did homework, whereas in Ayacucho, teaching relied more heavily on visual aids and was
sometimes in Quechua. The training materials in Lima were organized in two modules. The
first module introduced attendees to what a business is, how a business works, and the
marketplace. Clients were taught to identify their customers, competitors, and the position of
the business in the marketplace and then learned about product, promotional strategies and
commercial planning. The second module explained how to separate business and home
finances by establishing the differences between income, costs, and profit, teaching how to
calculate production costs, and product pricing. See Appendix A for more details on the content
of the business training.
Training began in October, 2002 in Lima and in March, 2003 in Ayacucho and was
planned to last 22 weekly sessions in total. Each bank timed the beginning of the training with
the beginning of new loan cycles, so not all banks began training at the same time. Ayacucho’s
meetings are weekly, whereas in Lima some groups meet weekly and others meet bi-weekly.
The Intended Effects
The goal of the program is to teach entrepreneurial skills. However, if the entrepreneurial
“spirit” is a fixed characteristic, teaching an individual to engage in activities similar to a
successful entrepreneur may not actually lead to improved business outcomes. The training
aims to improve basic business practices such as how to treat clients, how to use profits, where 5 Among FINCA’s Lima clients, the literacy rate is 98 percent, the majority has a secondary education and 40 percent have some post-secondary schooling as well. On the other hand, in the Ayacucho region, almost 70 percent of the FINCA clients did not finish secondary school and approximately 15 percent are illiterate.

6
to sell, the use of special discounts, credit sales, and the goods and services produced. These
improvements should lead to more sales, more workers, and could eventually provide incentives
to join the formal sector.
We also examine the impact on two sets of household outcomes: household decision-
making and child labor. The link to household decision-making is straightforward and one of
the oft-cited motivations of such training: improved business success could empower female
microentrepreneurs with respect to their husbands/partners in business and family decisions by
giving them more control of their finances. Measuring child labor effects is also important,
since children in these households are often actively involved in the family enterprise. Any
change to the household enterprise may have important effects on child labor and education,
although the expected impact is ambiguous. The training may increase or decrease the marginal
product of labor, hence could increase or decrease child labor through a substitution effect. If
the training increases business income, then this would lead to an expected decrease in child
labor and increase in schooling as wealth increases.6 Furthermore, an indirect effect may occur
in which the education (if valued by the mother) motivates the mother to invest more in
schooling of her children.
In addition to impact on the client´s business and her household, the training could
impact important outcomes for the institution. If clients’ businesses improve, they are more able
to repay their loans. The training also may engender goodwill and sentiments of reciprocity,
also leading to higher repayment rates. Loan sizes and savings volumes are more ambiguous: if
clients learn how to manage their cash flows better, they perhaps will need less debt. On the
6 The connection between increased income and the reduction of child labor and the increments in schooling can be reviewed in Basu and Van (1998), Baland and Robinson (2000), and Edmonds (2005; 2006), among others.
7
other hand, the business training may lead them to expand their business, and thus also demand
more financial capital.
Although much of the academic literature focuses on repayment rates for microfinance,
many institutions (who typically have near perfect repayment) are more concerned with client
retention (Copestake 2002). The expected effects here are ambiguous. If clients like the
training, they may be more likely to remain in the program in order to receive the training,
whereas obviously if they do not like the training (perhaps due to the additional 30-60 minutes
per week required for the village bank meetings), they may be more likely to leave. The net
effect is critical for the microfinance institution, since maintaining a stable client base is
important for the sustainability of the organization.
III. The experimental design and the monitoring of the intervention
We evaluate the effectiveness of integrating business training with microfinance services
using a randomized-control trial in which pre-existing lending groups were assigned randomly
to control and treatment groups. In Ayacucho, of the 140 village banks (3,265 clients), 55 were
assigned to a mandatory treatment group (clients had to stay through the training at their weekly
bank meeting7), 34 were assigned to a voluntary treatment group (clients were allowed to leave
after their loan payment was made, before the training began), and 51 were assigned to a control
group which received no additional services beyond the credit and savings program. In Lima, of
99 FINCA-sponsored banks (1,326 clients), 49 were assigned to mandatory treatment and 50
were assigned to control (there was no “voluntary’ treatment group in Lima). The
7 Fines were applied for absence or tardiness, and could result in expulsion from the bank.

8
randomization was stratified by credit officer; hence each credit officer has the same proportion
of treatment and control groups.
We monitored the attendance at the weekly meetings and the training sessions. On
average, training sessions in mandatory training banks had an 88% attendance rate while
attendance in voluntary banks was 76%.8 The training did not occur at each meeting (nor does it
typically under most implementations of “credit with education”). First, some treatment banks
put the trainings on hold if they were having problems such as high default and drop out rates.
In these cases, they would often enter a restructuring phase that involved reinforcement of the
traditional FINCA training about good repayment practices and discipline. The training session
was also skipped at the first and last meeting of each cycle, and when the meeting included a
group activity such as the celebration of a birthday or regional and religious holidays. In these
cases, the session would be postponed until the following meeting. There were other cases in
which the clients and credit officers decided that they needed more time to grasp fully the
information offered in one session. In some cases, it became a normal practice for banks to
agree to spend an extra meeting reviewing the material of the previous training session.9
These practices not only delayed the completion of the training materials, but also caused
heterogeneity in treatment intensity across groups. In Lima, for example, the average bank
advanced 3.5 sessions per loan cycle over the 12-meeting cycles. However, it was common for
banks to complete five training sessions in the first loan cycle, and slow to an average of 2.6
training sessions per cycle over time. As a result, after at least 24 months since the launch of the
8 Attendance in voluntary banks gradually slowed from an average of 80% at the beginning to 70% in the last two cycles observed. 9 In the case of Lima, such revisions often implied using the sessions to work in groups, with the support from the credit officer, on the assigned homework.

9
training, only half the banks had reached the 17th session out of a total of 22 programmed
sessions. The empirical analysis will compare the village banks assigned to treatment to those
assigned to control, irrespective of how well they adhered to the training program, and
irrespective of how well clients attended the training. This is important not only to avoid a
selection bias, but also because the delays experienced here are normal for credit with education
interventions.10 Had the training been adhered to more strictly, we would be estimating the
impact of a treatment that is stronger than is normally implemented.
IV. Data and estimation methods
This evaluation uses three key data sources: FINCA financial-transaction data, a baseline
survey before the randomization results were announced, and a follow-up survey up to two
years later.
Financial-transaction data are from FINCA’s database, which contains the reports of all
the transactions made by each bank client at every scheduled meeting since 1999. It includes
information on the loan cycles, broken down by loan payment, interest, mandatory and
voluntary savings, fines for tardiness, and contributions to cover default of other members. The
database also includes some socio-economic characteristics of the clients, such as age,
education, and business main economic activity, registered when the client first joined a
FINCA-sponsored village bank.
The baseline and follow-up surveys included a variety of questions on the socio-
demographic characteristics and other general information about the client’s household and
business. Outcomes can be divided into four categories: (1) institutional outcomes, (2) business
10 This stylized fact reported to us by Freedom from Hunger staff.

10
processes, knowledge and savings practices (i.e., testing whether the specific practices taught in
the training were adopted), (3) business outcomes, (4) household outcomes, including
empowerment in decision-making and child labor (the Lima follow-up survey included
questions related to the time children between six and fifteen years old dedicate to domestic
work and school activities). The full list of outcome variables and their definitions are included
in Appendix Table 1.
In treatment banks, the baseline survey was given within a few weeks prior to the bank
beginning the training. Figure 1 above shows the timeline of these components of the study for
Ayacucho and Lima. Most baseline surveys were completed at the FINCA office at the time of
their weekly meeting, although due to time constraints some of them had to be completed at
their home or place of business. In Ayacucho, we completed baseline 3265 surveys, while in
Lima, we completed 1326 baseline surveys.
Figure 1: Timeline of the intervention and data collection
Oct02 Dec02 Apr03Feb03 Jun03 Aug03Oct03 Dec03Feb04 Apr04 Jun04 Aug04 Oct04 Dec04Feb05 Apr05 Jun05
BDS training Lima
BDS training Ayacucho
Baseline Follow up
Beginning of training
Follow upBaseline
Beginning of training
Aug05Oct05 Dec05
Seventy-six percent of the clients in the baseline survey were reached and surveyed for the
follow-up survey. For the 62% of the clients interviewed in the baseline who were no longer
members of a FINCA-sponsored village bank when the follow-up surveys began, we located

11
them using addresses collected in the baseline survey or, in some cases, asking neighbors or
FINCA members. However, some clients had moved far away, were impossible to locate, or
refused to be interviewed. In total, we interviewed 83% of the clients who were still borrowing
from FINCA, and about 72% of those who had dropped from the program. As Appendix Table
2 shows, there was not a survey response bias in Ayacucho but in Lima control group
individuals were slightly more likely to complete the survey. This may be due to the training
taking itself a long time, so individuals were less willing to spend the extra time to complete the
survey. Also, among those who dropped out, the response rate is higher for the control group
than the treatment group.
Appendix Table 2 shows some key demographic characteristics and financial-transaction
history of the members of control and treatment groups before BDS training began. These
results verify that the random assignment produced observably similar treatment and control
groups. At the time of the randomization, data were available on prior repayment rates, the
average loan size and the average savings size. The remaining variables were unobserved at the
time of the randomization, but also are similar across treatment and control groups, as expected.
To estimate the impact of the business training program, we use the first-difference (FD)
or the double-difference (DD) estimators, depending on whether we observe the outcome of
interest only in the follow-up, or in both the baseline and follow-up survey. The FD estimator is
obtained by comparing the levels of the outcomes variables between the treatment and control
groups. In turn, the DD estimator is obtained from comparing changes over time in a particular
outcome variable between treatment and control groups. As long as the control and treatment
groups were similar ex-ante, which was assured through the randomization, we can argue that

12
both estimators can provide an unbiased estimate of the impact of the intention to treat with
business training program on a particular outcome variable.
Econometrically, the FD estimator is obtained by estimating the following linear
regression:
ijTjij DY εβα ++= (1)
where ijY denotes an outcome variable for client i in bank j after the treatment, TjD is a dummy
variable that takes the value one if the client belonged to a treatment bank, and ijε denotes the
error term which is assumed to be independent across banks but not necessarily within them.
Thus, β measures the difference between the treatment and control groups in the outcome
Y after the treatment, and is an unbiased estimate of the average impact of being assigned to a
treatment group on the outcome variable Y . In the tables of results section, we also report
estimates of β that result from a regression that adds to eq. (1) a set of covariates such as the
clients’ age and education, the number of loans received from FINCA, business type and size,
and branch location.11
We also test whether the training generates heterogeneous treatment effects along
characteristics such as prior interest in training, schooling, marital status, and business size as
measured by total revenues, the following model is then used:
ijiTj
Tjiij XDDXY εββδα ++++= 0210 , (2)
11 Since treatment was assigned randomly, we would expect the insertion of these covariates to unbiasedly reduce the variance of the estimated effect.

13
where 0X is a binary variable that denotes the characteristic of interest prior to the intervention.
In this case, 1β is the FD estimator for those individuals that have characteristic 0=X and
( 21 ββ + ) measures the impact for those individuals that have characteristic 1=X .
If the outcome variable is a dummy variable, then we estimate a probit model and report
the marginal effect of CiD for the impact of business training on outcome Y . In the model with
interactions, the marginal effect for those with 0=X is obtained by estimating
( ) ( )[ ]0,0/1rP̂0,1/1rP̂ ===−=== XDYXDY . For those clients for whom 1=X , the
marginal effect of treatment on those clients with 1=X is obtained with the following
expression: ( ) ( )[ ]1,0/1rP̂1,1/1rP̂ ===−=== XDYXDY .
The double difference estimator comes from the following expression:
ijtTjt
Tjttijt DPostDPostY εβββα ++++= 321 (3)
where tPost is a binary variable equal to one if the observation corresponds to the post-
treatment time period. Then, 3β is the double difference estimator of the program’s impact on
outcome Y . As before, to measure whether treatment is heterogeneous across various
characteristics, the following model is estimated:
ijtiTjt
Tjtijjijjiijt XDPostDPostXDDXDDXY εββγβγβδα ++++++++= 0430220110 (4)
where oX is a binary variable that denotes the characteristic of interest at the time of the
baseline. In this case, 3β is the double difference estimator for those individuals that do not
have characteristic X and ( 43 ββ + ) measures the impact for those individuals that do have it.
14
V. Results
We divide the analysis into four categories of outcome variables: (1) institutional
outcomes, (2) business processes and knowledge, (3) business outcomes, and (4) household
outcomes including empowerment in decision-making and child labor.
Institutional results
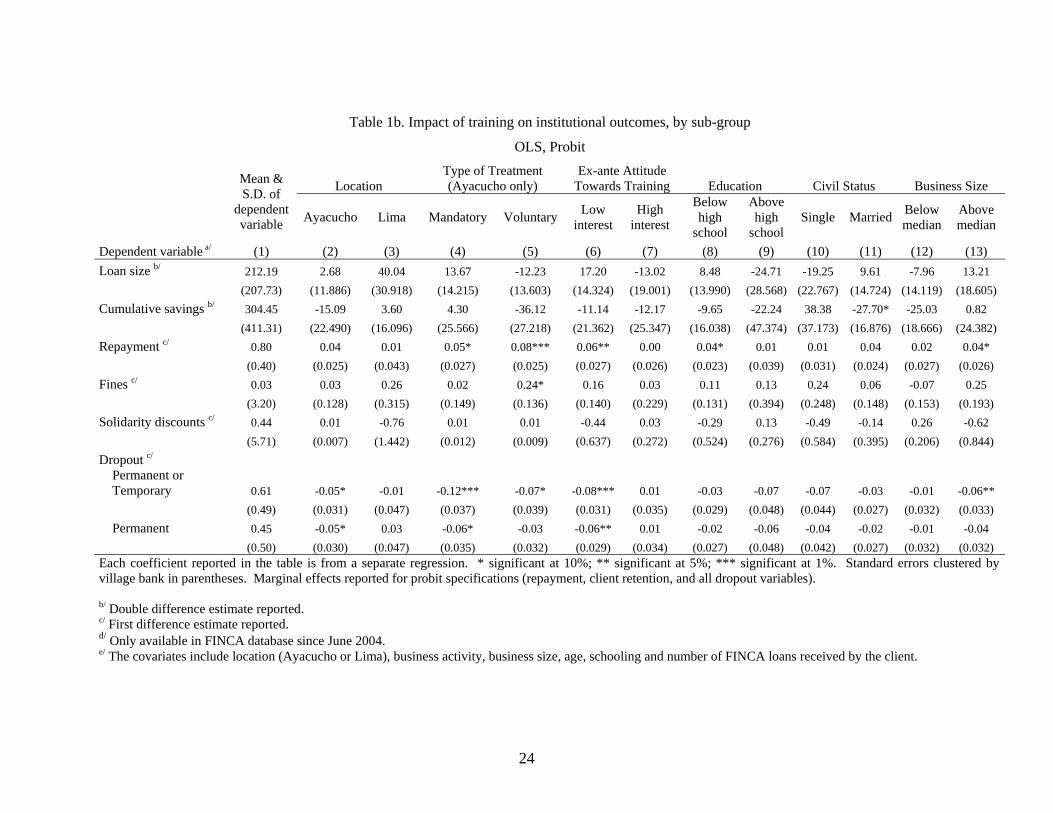
We found important effects of training on important institutional outcomes such as
repayment and client retention. Repayment among treatment groups is three percentage points
higher than among control groups (Table 1). That is, clients among treatment groups were more
likely to maintain a clean repayment record in the cycles between the baseline and follow-up
surveys.12 We also found that treatment group clients were four to five percentage points less
likely to dropout. However, when not counting returnees as dropouts, this effect is slightly
smaller and no longer statistically significant. We infer from this that clients place high value
on the training they receive, causing them to avoid at a minimum temporary exits, and perhaps
permanent ones as well. Still, treatment clients are more likely to cite the length of weekly
meetings as a factor in dropping out of the program (Appendix Table 4). So while in net the
business training is good for client retention, the program can expect to lose some clients due to
lengthier meetings. Making the training voluntary would reduce in principle this tension, but we
find the improvement in dropout rates is slightly higher for the mandatory treatment than the
voluntary treatment groups (Table 1b).
Another explanation for the increase in client retention for treatment groups is the
improvement of clients’ business outcomes, leading to higher repayment capability. The
12 A client is said to have had a clean repayment record if their payments over the cycle plus their savings were always enough to cover the amount borrowed plus interest.

15
increase in client retention could be driven by the reduction in default rather than client
satisfaction if the training causes some clients who might have defaulted to increase their ability
to make loan payments, thus avoiding the need to drop out of the program for default. This
would require an increase in business income to provide the funds to make extra payments, and
as we shall see below, such impacts were indeed detected. We examine whether the treatment
led to more dropout with default as well as dropout without default, and although the treatment
effect is larger in reducing dropout without default, when disaggregated neither is significant
statistically.
We also find that the improvement in repayment rates and client retention are strongest for
clients with larger businesses (as measured by sales) and for those who expressed the least
interest in business training in the baseline survey.13 The latter has strong implications for the
appropriate method for introducing business training to a program or market, since the impact is
highest on those who indicate the lowest demand for the service (i.e., charging a fee for the
business training initially may yield the exact wrong set of clients in order to maximize impact).
We find no change in loan size or cumulative savings. The improved default and client
retention rates have strong implications for the profitability of the institution, as discussed in
more detail in the conclusion.
Business skills and practices
In the follow-up survey we asked clients questions about key elements of the training,
such as business knowledge, marketing strategies, use of profits, and record-keeping (see
Appendix Table 1 for the full list of survey questions and variable definitions). Table 2 shows
13 Moreover, when looking at those less interested in training, we also find a significant effect of business training on permanent dropouts.

16
the results on these outcome measures. Training participants demonstrated greater business
knowledge, answering more questions correctly (10 percentage points, which is 0.07 standard
deviations). The greater knowledge translated into better business practices, though only in
limited areas. The training increased the likelihood that individuals reinvested profits in their
business by four percentage points (0.08 standard deviations), maintained sales records for their
business by between three percentage points (0.07 standard deviations), and maintained
withdrawal records from their business by seven percentage points (0.17 standard deviations).
Lastly, individuals were asked to name changes or innovations they have made to their
businesses over the prior year, and those in the treatment group were five percentage points
more likely to report having done so.14
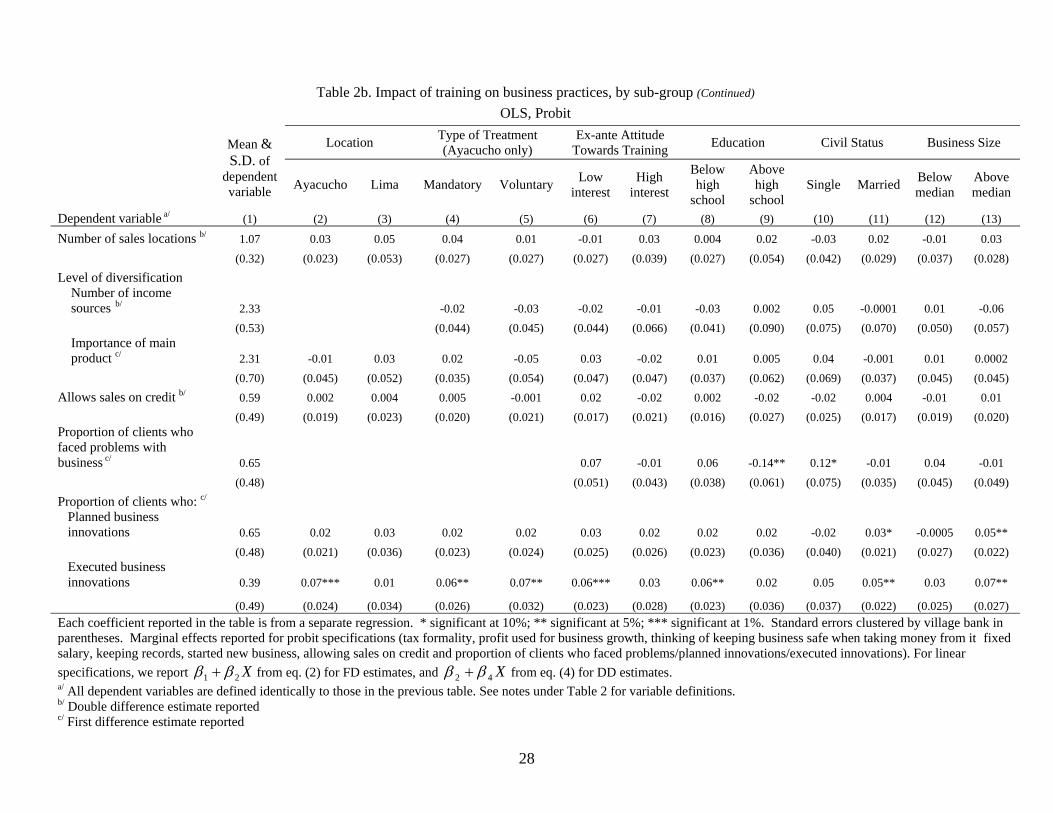
Table 2b shows that impacts on business formality and on the execution of changes for the
business were observed mostly on the clients who expressed low interest in training in the
baseline survey. This result is consistent with those in Table 1b, reinforcing the notion that the
benefits of the program concentrated in those that did not foresee them at the start.15 However,
several other results (reinvesting profits in their business, improvements in business knowledge,
and maintaining sales records) show stronger impacts on those with higher expressions of
interest. Hence we consider the results mixed at best with regard to heterogeneous treatment
effects for those with differing levels of prior interest in training.
14 Microentrepreneurs in the Ayacucho treatment groups reported higher execution rates in overall treatment of the client, the use of special discounts and seasonal adjustments in the products offered to their clientele. 15 For the execution of changes in business practices, effects are stronger in Ayacucho, where FINCA clients are poorer, have less formal education and expressed less interest in the training in the baseline survey.
17
Business results
Table 3 presents the results on business outcomes such as sales and employment. Sales in
the month prior to the surveys were 16% higher. When looking at the variation in sales, we find
the largest effect for sales in a bad month, which is 28% higher among treatment groups
compared to control groups. We infer from this latter result that the training has helped clients
identify strategies to reduce the fluctuations in their sales. For instance, they could have
diversified the goods and services they offer or have identified clients with a different
seasonality in their purchases.
For retail business, no change in profit margin was observed on the most common product
sold. Due to the limited time available for the survey we only asked about profit margin for the
main product. However, unless the profit margin shrunk on other products despite not
decreasing on the main product, the increased overall revenue implies an increase in profits. For
service businesses, since no change in labor was observed, the increased revenue should
translate more or less directly to increased profits.
Household outcomes
Table 4 reports the results on household outcomes. We divide the household outcomes
into two categories, empowerment in decision-making and child labor. We detect no impact on
household decision-making such as how to use the FINCA loan and savings, whether to take
money or products from the business, or family size decisions. Participants are also no more
likely to keep track of household bills or separate their money from that of their husband or
partner. One explanation for the lack of empowerment effects may be that we are working with
women that already run a business, keep savings and manage loans so that they are already
18
empowered enough for the business training to have an effect on the indicators analyzed here.
Also, as indicated in section II, FINCA clients routinely receive empowering messages during
their bank meetings.
On child labor, although the overall effect is not significant for both male and female
children, we do find a positive treatment effect on the number of hours female children dedicate
on average to school and schoolwork. We do not see a corresponding shift downward in hours
spent working in the enterprise or housework, which indicates that the female children spent less
time in leisure. This also implies that the training had its effect not through changing the
marginal product of labor in the enterprise, nor through an income effect, but instead perhaps
through increasing the mother’s preference for education for their daughters. We also find, in
Table 4c, that for more educated mothers, the training reduces the number of hours the children
spend working in the enterprise. However, the corresponding increase in education is positive
but not statistically significant.
VI. Conclusion
We raised a fundamental question, can successful entrepreneurship be taught? In our
setting, the answer is yes, we can teach individuals to engage in certain good business practices,
which lead to increased sales. Clients report engaging in some of the exact activities being
taught in the program: separate money between business and household, reinvest profits in the
business, maintain records of sales and expenses, and think proactively about new markets and
opportunities for profits. The implementation of these strategies seemed to have helped clients
increased business income, mainly by smoothing fluctuations between good and bad periods.
We also find positive impacts on repayment rates and client retention for FINCA, the lender.

19
From the institutional perspective, the intervention also succeeded. Freedom from Hunger
has found that the marginal cost to organizations is 6%-9% of total costs (vor der Bruegge,
Dickey and Dunford 1999). The marginal revenue will come from the increased client retention
and repayment rates (no change in loan sizes was observed). The fixed cost of managing a
village bank is high, but the variable cost of each individual client is quite low. The improved
client retention rate (sixteen percent improvement in client retention) generates more increased
revenue than the marginal cost of providing the training. The improved client repayment is
more difficult to estimate, since the true benefit to FINCA comes through lower enforcement
costs (the eventual default is virtually nonexistent). Thus, this is a profitable undertaking for
FINCA.
Another important result is that we find the stronger effects for those clients who
expressed less interest in the training in the baseline survey. Not only are they the ones more
likely to improve retention and repayment but also they were more likely to report having
implemented changes to improve their businesses. This result implies that demand-driven
“market” solutions may in fact not be as easy as charging for the services. It is possible that
after a free trial, clients with low-prior demand would appreciate the value and demand the
services. The experimental setup and outcomes measured here do not allow us to examine this.
One conclusion is clear, merely charging for the service would not lead to the strongest impact.
Although this paper has broader implications to models of growth that incorporate the
ability to increase human capital and to models of financial and small enterprise markets for the
poor, this is at one level an exercise in program evaluation. We suggest, however, that it is a
necessary exercise. Given the plethora of these projects, and given the importance of human
capital to our thinking about growth and development, it is imperative that we know whether
20
these efforts are having a positive effect on the poor. Having found an encouraging positive
answer in our setting, further experimentation is now needed to verify the replicability in
different contexts. It also would be important to evaluate the ongoing sustainability of the
improvements for the client and the lending institution. Lastly, an open debate exists regarding
alternative delivery processes, such as whether credit officers rather than training specialists
should be delivering the education.
21
References Baland, J.-M. and J. A. Robinson (2000). "Is Child Labor Inefficient?" Journal of Political
Economy 108(4): 663-679. Banerjee, A. and A. Newman (1993). "Occupational Choice and the Process of Development."
Journal of Political Economy 101: 274-298. Basu, K. and P. H. V. Van (1998). "The Economics of Child Labor." American Economic
Review 88(3): 412-427. Copestake, J. (2002). "Unfinished Business: The Need for More Effective Microfinance Exit
Monitering." Journal of Microfinance 4(2): 1-30. Dunford, C. (2002). Building Better Lives: Sustainable Integration of Microfinance with
Education in Child Survival, Reproductive Health, and HIV/AIDS Prevention for the Poorest Entrepreneurs. Pathways Out of Poverty: Innovations in Microfinance for the Poorest Families. Fairfield, CT, Kumarian Press.
Edmonds, E. (2005). "Does Child Labor Decline with Improving Economic Status?" The Journal of Human Resources 40(1): 77-99.
Edmonds, E. (2006). "Child Labor and Schooling Responses to Anticipated Income in South Africa." Journal of Development Economics forthcoming.
McKernan, S.-M. (2002). "The Impact of Micro Credit Programs on Self-Employment Profits: Do Non-Credit Program Aspects Matter." Review of Economics and Statistics 84(1): 93-115.
MkNelly, B., C. Watetip, C. A. Lassen and C. Dunford (1996). "Preliminary Evidence that Integrated Financial and Educational Services can be Effective against Hunger and Malnutrition." Freedom from Hunger Research Paper Series 2.
Paulson, A. L. and R. Townsend (2004). "Entrepreneurship and financial constraints in Thailand " 10 Journal of Corporate Finance(2): 229-262.
vor der Bruegge, E., J. Dickey and C. Dunford (1999). "Cost of Education in the Freedom from Hunger version of Credit with Education Implementation." Freedom from Hunger Research Paper Series 6.
22
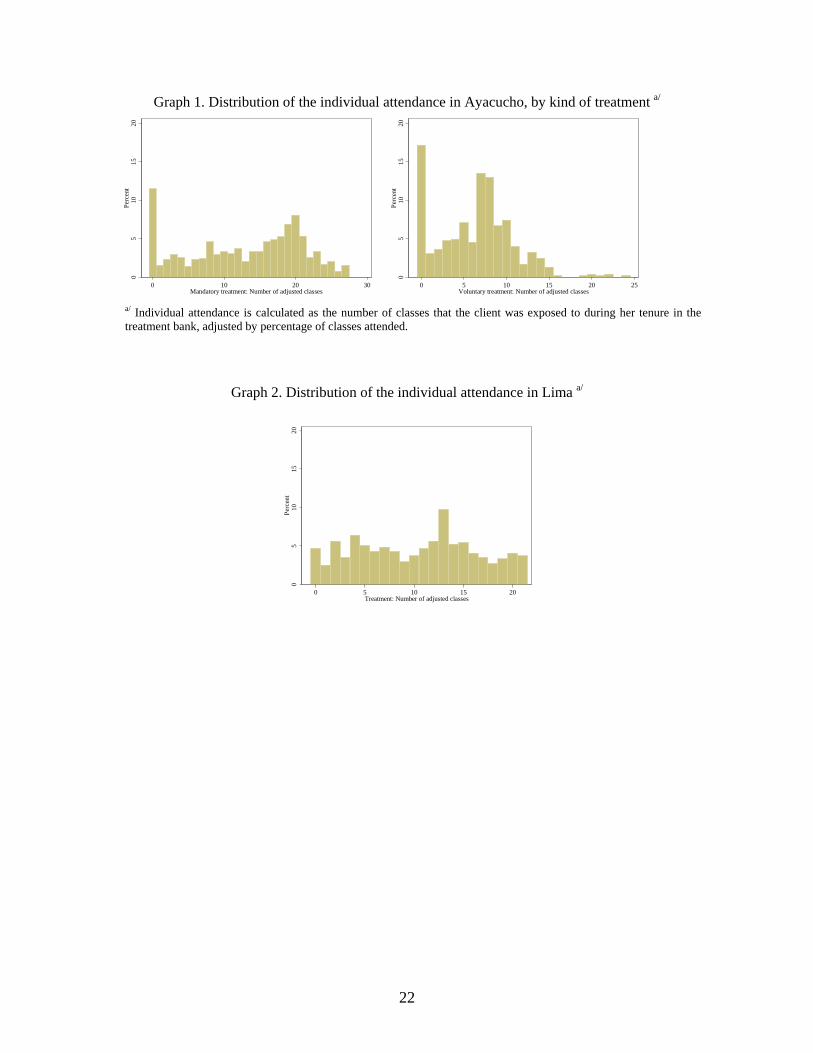
Graph 1. Distribution of the individual attendance in Ayacucho, by kind of treatment a/
05
1015
20Pe
rcen
t
0 10 20 30Mandatory treatment: Number of adjusted classes
05
1015
20Pe
rcen
t
0 5 10 15 20 25Voluntary treatment: Number of adjusted classes
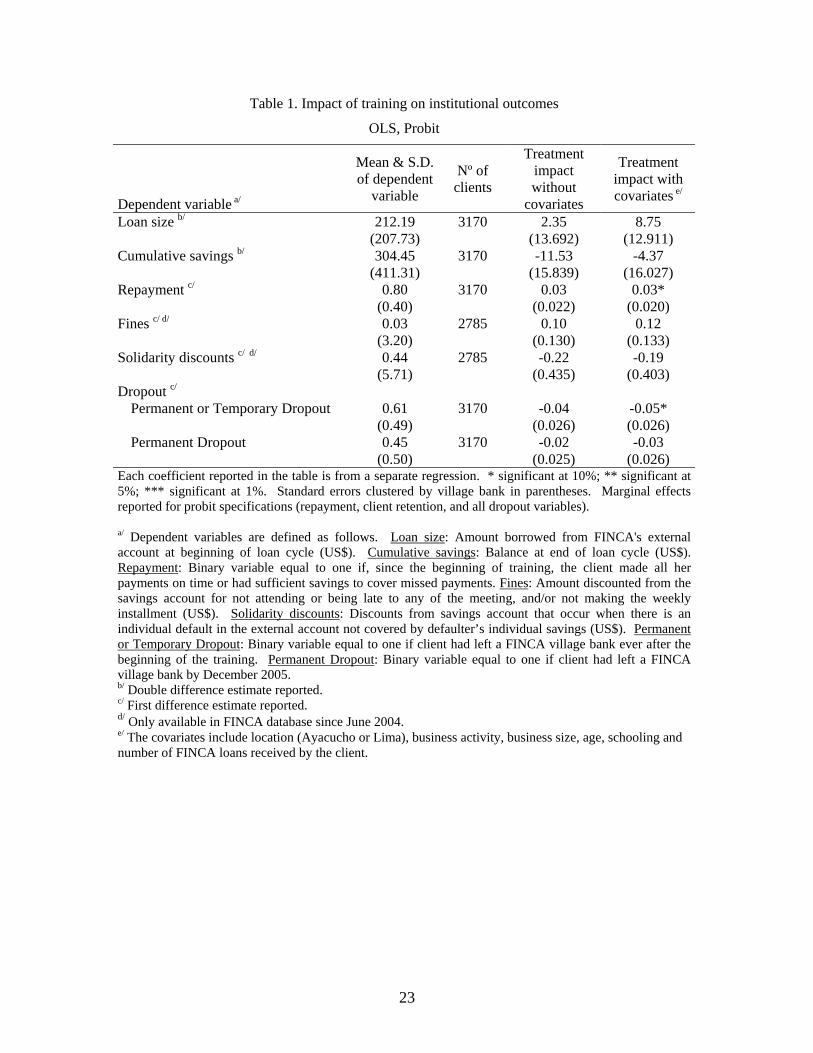
a/ Individual attendance is calculated as the number of classes that the client was exposed to during her tenure in the treatment bank, adjusted by percentage of classes attended.
Graph 2. Distribution of the individual attendance in Lima a/
05
1015
20Pe
rcen
t
0 5 10 15 20Treatment: Number of adjusted classes
23
Table 1. Impact of training on institutional outcomes
OLS, Probit
Dependent variable a/
Mean & S.D. of dependent
variable
Nº of clients
Treatment impact without
covariates
Treatment impact with covariates e/
Loan size b/ 212.19 3170 2.35 8.75 (207.73) (13.692) (12.911) Cumulative savings b/ 304.45 3170 -11.53 -4.37 (411.31) (15.839) (16.027) Repayment c/ 0.80 3170 0.03 0.03* (0.40) (0.022) (0.020) Fines c/ d/ 0.03 2785 0.10 0.12 (3.20) (0.130) (0.133) Solidarity discounts c/ d/ 0.44 2785 -0.22 -0.19 (5.71) (0.435) (0.403) Dropout c/
Permanent or Temporary Dropout 0.61 3170 -0.04 -0.05* (0.49) (0.026) (0.026) Permanent Dropout 0.45 3170 -0.02 -0.03
(0.50) (0.025) (0.026) Each coefficient reported in the table is from a separate regression. * significant at 10%; ** significant at 5%; *** significant at 1%. Standard errors clustered by village bank in parentheses. Marginal effects reported for probit specifications (repayment, client retention, and all dropout variables). a/ Dependent variables are defined as follows. Loan size: Amount borrowed from FINCA's external account at beginning of loan cycle (US$). Cumulative savings: Balance at end of loan cycle (US$). Repayment: Binary variable equal to one if, since the beginning of training, the client made all her payments on time or had sufficient savings to cover missed payments. Fines: Amount discounted from the savings account for not attending or being late to any of the meeting, and/or not making the weekly installment (US$). Solidarity discounts: Discounts from savings account that occur when there is an individual default in the external account not covered by defaulter’s individual savings (US$). Permanent or Temporary Dropout: Binary variable equal to one if client had left a FINCA village bank ever after the beginning of the training. Permanent Dropout: Binary variable equal to one if client had left a FINCA village bank by December 2005. b/ Double difference estimate reported. c/ First difference estimate reported. d/ Only available in FINCA database since June 2004. e/ The covariates include location (Ayacucho or Lima), business activity, business size, age, schooling and number of FINCA loans received by the client.
24
Table 1b. Impact of training on institutional outcomes, by sub-group
OLS, Probit
Location Type of Treatment (Ayacucho only)
Ex-ante Attitude Towards Training Education Civil Status Business Size
Mean & S.D. of
dependent variable Ayacucho Lima Mandatory Voluntary Low
interest High
interest
Below high
school
Above high
school Single Married Below
medianAbove median
Dependent variable a/ (1) (2) (3) (4) (5) (6) (7) (8) (9) (10) (11) (12) (13) Loan size b/ 212.19 2.68 40.04 13.67 -12.23 17.20 -13.02 8.48 -24.71 -19.25 9.61 -7.96 13.21 (207.73) (11.886) (30.918) (14.215) (13.603) (14.324) (19.001) (13.990) (28.568) (22.767) (14.724) (14.119) (18.605) Cumulative savings b/ 304.45 -15.09 3.60 4.30 -36.12 -11.14 -12.17 -9.65 -22.24 38.38 -27.70* -25.03 0.82 (411.31) (22.490) (16.096) (25.566) (27.218) (21.362) (25.347) (16.038) (47.374) (37.173) (16.876) (18.666) (24.382) Repayment c/ 0.80 0.04 0.01 0.05* 0.08*** 0.06** 0.00 0.04* 0.01 0.01 0.04 0.02 0.04* (0.40) (0.025) (0.043) (0.027) (0.025) (0.027) (0.026) (0.023) (0.039) (0.031) (0.024) (0.027) (0.026) Fines c/ 0.03 0.03 0.26 0.02 0.24* 0.16 0.03 0.11 0.13 0.24 0.06 -0.07 0.25 (3.20) (0.128) (0.315) (0.149) (0.136) (0.140) (0.229) (0.131) (0.394) (0.248) (0.148) (0.153) (0.193) Solidarity discounts c/ 0.44 0.01 -0.76 0.01 0.01 -0.44 0.03 -0.29 0.13 -0.49 -0.14 0.26 -0.62 (5.71) (0.007) (1.442) (0.012) (0.009) (0.637) (0.272) (0.524) (0.276) (0.584) (0.395) (0.206) (0.844) Dropout c/
Permanent or Temporary 0.61 -0.05* -0.01 -0.12*** -0.07* -0.08*** 0.01 -0.03 -0.07 -0.07 -0.03 -0.01 -0.06** (0.49) (0.031) (0.047) (0.037) (0.039) (0.031) (0.035) (0.029) (0.048) (0.044) (0.027) (0.032) (0.033) Permanent 0.45 -0.05* 0.03 -0.06* -0.03 -0.06** 0.01 -0.02 -0.06 -0.04 -0.02 -0.01 -0.04
(0.50) (0.030) (0.047) (0.035) (0.032) (0.029) (0.034) (0.027) (0.048) (0.042) (0.027) (0.032) (0.032) Each coefficient reported in the table is from a separate regression. * significant at 10%; ** significant at 5%; *** significant at 1%. Standard errors clustered by village bank in parentheses. Marginal effects reported for probit specifications (repayment, client retention, and all dropout variables). b/ Double difference estimate reported. c/ First difference estimate reported. d/ Only available in FINCA database since June 2004. e/ The covariates include location (Ayacucho or Lima), business activity, business size, age, schooling and number of FINCA loans received by the client.

25
Table 2. Impact of training on business practices OLS, Probit
Dependent variable a/
Mean & S.D. of dependent
variable
Nº of clients
Treatment impact without
covariates
Treatment impact with covariates h/
Tax formality b/ 0.14 3398 0.01 0.01 (0.35) (0.012) (0.011) Profit used for business growth c/ 0.67 3427 0.04** 0.04** (0.47) (0.020) (0.019) Thinking of keeping business safe when taking money from it c/ 0.26 3427 -0.002 -0.0002 (0.44) (0.016) (0.015) Fixed salary b/ 0.04 3424 -0.02 -0.02 (0.20) (0.017) (0.017) Keeping records of:
Sales b/ 0.29 3388 0.03* 0.04* (0.45) (0.020) (0.021)
Withdrawals b/ d/ 0.11 969 0.07* 0.07* (0.31) (0.042) (0.043)
Payments to workers c/ 0.23 2992 0.005 0.004 (0.57) (0.015) (0.013) Business knowledge index c/ 3.32 3427 0.10* 0.08 (1.40) (0.060) (0.055) Started new business c/ 0.14 3427 -0.02 -0.02 (0.35) (0.012) (0.012) Number of sales locations b/ 1.07 3424 0.01 0.01 (0.32) (0.026) (0.026) Level of diversification
Number of income sources b/ e/ 2.33 2394 -0.02 -0.02 (0.53) (0.038) (0.038)
Importance of main product c/ f/ 2.31 2221 0.01 0.01 (0.70) (0.034) (0.035) Allows sales on credit b/ 0.59 3424 -0.002 -0.002 (0.49) (0.015) (0.015) Proportion of clients who faced problems with business c/ g/ 0.65 1033 0.02 0.02 (0.48) (0.034) (0.034) Proportion of clients who: c/
Planned innovations in their businesses 0.65 3427 0.02 0.03 (0.48) (0.019) (0.018)
Executed innovations in their businesses 0.39 3427 0.05** 0.05** (0.49) (0.020) (0.019) Each coefficient reported in the table is from a separate regression. * significant at 10%; ** significant at 5%; *** significant at 1%. Standard errors clustered by village bank in parentheses. Marginal effects reported for probit specifications (tax formality, profit used for business growth, thinking of keeping business safe when taking money from it fixed salary, keeping records, started new business, allowing sales on credit and proportion of clients who faced problems/planned innovations/executed innovations).

26
a/ Dependent variables are defined as follows. Tax Formality: Binary variable equal to one if client has a tax ID number. Profit used for business growth: Binary variable equal to one if client reported re-investing profits for the growth or continuity of the business. Thinking of keeping business safe when taking money from it: Binary variable equal to one if client considers the needs of the business when taking money from the business for family use. Fixed salary: Binary variable equal to one if client pays herself a fixed salary. Keeping records: Binary variable equal to one if client records sales/withdrawals/payments to workers in a registry or notebook. Business knowledge index: Number of right answers given by the client when asked about what should be done to increase business sales and to plan for a new business. Started new business: Binary variable equal to one if client reports that she began a new business in the last year (Ayacucho) or the last two years (Lima). Number of sales locations: Number of locations where the client sells her main business’s products. Number of income sources: Number of income sources the client reports (personal/family businesses, other jobs or working activities, etc). Importance of the main product: Discrete variable indicating if the sales of the most profitable product represent 1) all; 2) more than half; or 3) less than half of business sales. Allows sales on credit: Binary variable equal to one if client makes sales on credit. Proportion of clients who faced problems with business: Binary variable equal to one if client reports that her business faced a specific problem in the last year (Ayacucho) or the last two years (Lima). Proportion of clients who planned/ executed innovations in their businesses: Binary variable equal to one if client had an idea for /implemented a change or innovation to improve the business (Ayacucho) or to solve the problems faced (Lima). b/ Double difference estimate reported. c/ First difference estimate reported. d/ Only for Lima e/ Only for Ayacucho. f/ Scale from 1 to 3. The higher, the more diversified. g/ Only in Lima. This outcome can be divided between business and family/health related problems. h/ The covariates include location (Ayacucho or Lima), business activity, business size, age, schooling and number of FINCA loans received by the client.

27
Table 2b. Impact of training on business practices, by sub-group OLS, Probit
Location Type of Treatment
(Ayacucho only) Ex-ante Attitude
Towards Training Education Civil Status Business Size
Mean & S.D. of
dependent variable Ayacucho Lima Mandatory Voluntary Low
interest High
interest
Below high
school
Above high
school Single Married Below
median Above median
Dependent variable a/ (1) (2) (3) (4) (5) (6) (7) (8) (9) (10) (11) (12) (13)
Tax formality b/ 0.14 0.02 -0.02 0.01 0.03* 0.03** -0.01 0.01 0.02 0.01 0.01 0.01 0.01 (0.35) (0.014) (0.021) (0.015) (0.019) (0.018) (0.017) (0.012) (0.032) (0.026) (0.013) (0.013) (0.021) Profit used for business growth c/ 0.67 0.04 0.03 0.03 0.06* 0.02 0.06*** 0.04* 0.02 0.06 0.03* 0.03 0.06** (0.47) (0.026) (0.026) (0.028) (0.030) (0.027) (0.024) (0.022) (0.035) (0.040) (0.021) (0.027) (0.025) Thinking of keeping business safe when taking money from it c/ 0.26 -0.01 0.01 -0.02 -0.0004 -0.02 0.02 0.001 -0.003 -0.01 0.002 -0.003 -0.0002 (0.44) (0.017) (0.031) (0.019) (0.021) (0.023) (0.022) (0.017) (0.032) (0.032) (0.017) (0.020) (0.022) Fixed salary b/ 0.04 0.01 0.002 0.01 0.002 -0.02 -0.02 -0.02 -0.03 * -0.01 -0.02 -0.01 -0.03 (0.20) (0.022) (0.021) (0.018) (0.019) (0.018) (0.024) (0.022) (0.015) (0.034) (0.018) (0.022) (0.019) Keeping records of:
Sales b/ 0.29 0.04 0.04 0.03 0.05 0.01 0.06** 0.04* 0.05 0.08 0.02 0.04 0.03 (0.45) (0.024) (0.039) (0.026) (0.034) (0.024) (0.031) (0.022) (0.050) (0.048) (0.021) (0.027) (0.033)
Withdrawals b/ 0.11 0.04 0.09 0.06 0.13 0.16 0.05 0.15** 0.01
(0.31) (0.066) (0.056) (0.048) (0.120) (0.125) (0.046) (0.072) (0.045) Payments to workers c/ 0.23 0.004 0.005 0.01 -0.02 0.02 -0.01 0.01 -0.02 -0.01 0.01 -0.001 0.01
(0.57) (0.018) (0.030) (0.020) (0.021) (0.019) (0.022) (0.014) (0.039) (0.029) (0.018) (0.016) (0.024) Business knowledge index c/ 3.32 0.08 0.16 0.10 0.11 0.02 0.20*** 0.11* -0.002 0.09 0.11* 0.02 0.20***
(1.40) (0.076) (0.094) (0.065) (0.091) (0.071) (0.074) (0.061) (0.110) (0.117) (0.063) (0.074) (0.076)
Started new business c/ 0.14 -0.01 -0.02 -0.02 -0.01 -0.02 -0.02 -0.02* 0.01 -0.02 -0.01 -0.03* 0.001
(0.35) (0.012) (0.030) (0.013) (0.014) (0.016) (0.018) (0.013) (0.028) (0.026) (0.014) (0.016) (0.018)
28
Table 2b. Impact of training on business practices, by sub-group (Continued)
OLS, Probit
Location Type of Treatment (Ayacucho only)
Ex-ante Attitude Towards Training Education Civil Status Business Size
Mean & S.D. of
dependent variable Ayacucho Lima Mandatory Voluntary Low
interest High
interest
Below high
school
Above high
school Single Married Below
median Above median
Dependent variable a/ (1) (2) (3) (4) (5) (6) (7) (8) (9) (10) (11) (12) (13)
Number of sales locations b/ 1.07 0.03 0.05 0.04 0.01 -0.01 0.03 0.004 0.02 -0.03 0.02 -0.01 0.03 (0.32) (0.023) (0.053) (0.027) (0.027) (0.027) (0.039) (0.027) (0.054) (0.042) (0.029) (0.037) (0.028) Level of diversification
Number of income sources b/ 2.33 -0.02 -0.03 -0.02 -0.01 -0.03 0.002 0.05 -0.0001 0.01 -0.06
(0.53) (0.044) (0.045) (0.044) (0.066) (0.041) (0.090) (0.075) (0.070) (0.050) (0.057) Importance of main product c/ 2.31 -0.01 0.03 0.02 -0.05 0.03 -0.02 0.01 0.005 0.04 -0.001 0.01 0.0002
(0.70) (0.045) (0.052) (0.035) (0.054) (0.047) (0.047) (0.037) (0.062) (0.069) (0.037) (0.045) (0.045) Allows sales on credit b/ 0.59 0.002 0.004 0.005 -0.001 0.02 -0.02 0.002 -0.02 -0.02 0.004 -0.01 0.01 (0.49) (0.019) (0.023) (0.020) (0.021) (0.017) (0.021) (0.016) (0.027) (0.025) (0.017) (0.019) (0.020) Proportion of clients who faced problems with business c/ 0.65 0.07 -0.01 0.06 -0.14** 0.12* -0.01 0.04 -0.01 (0.48) (0.051) (0.043) (0.038) (0.061) (0.075) (0.035) (0.045) (0.049) Proportion of clients who: c/ Planned business innovations 0.65 0.02 0.03 0.02 0.02 0.03 0.02 0.02 0.02 -0.02 0.03* -0.0005 0.05** (0.48) (0.021) (0.036) (0.023) (0.024) (0.025) (0.026) (0.023) (0.036) (0.040) (0.021) (0.027) (0.022) Executed business innovations 0.39 0.07*** 0.01 0.06** 0.07** 0.06*** 0.03 0.06** 0.02 0.05 0.05** 0.03 0.07**
(0.49) (0.024) (0.034) (0.026) (0.032) (0.023) (0.028) (0.023) (0.036) (0.037) (0.022) (0.025) (0.027) Each coefficient reported in the table is from a separate regression. * significant at 10%; ** significant at 5%; *** significant at 1%. Standard errors clustered by village bank in parentheses. Marginal effects reported for probit specifications (tax formality, profit used for business growth, thinking of keeping business safe when taking money from it fixed salary, keeping records, started new business, allowing sales on credit and proportion of clients who faced problems/planned innovations/executed innovations). For linear specifications, we report X21 ββ + from eq. (2) for FD estimates, and X42 ββ + from eq. (4) for DD estimates. a/ All dependent variables are defined identically to those in the previous table. See notes under Table 2 for variable definitions. b/ Double difference estimate reported c/ First difference estimate reported

29
Table 3. Impact of training on business results
OLS
Dependent variable a/
Mean & S.D. of dependent variable
Nº of clients
Treatment impact without covariates
Treatment impact with covariates d/
Sales b/ Last month (log) 6.56 3421 0.16 * 0.16 *
(1.63) (0.082) (0.082) Good month 7.91 3389 -0.01 0.00
(1.26) (0.051) (0.051) Normal month 7.15 3388 0.10 ** 0.11 **
(1.20) (0.052) (0.052) Bad month 5.91 3381 0.28 *** 0.28 ***
(2.24) (0.100) (0.100) Difference good-bad month 2.00 3380 -0.28 *** -0.28 ***
(2.02) (0.103) (0.103) Weekly surplus from most profitable product c/ 11.87 1759 1.84 1.71 (46.34) (2.275) (2.139) Number of workers b/
Total 1.96 3398 -0.01 -0.01 (1.46) (0.063) (0.063)
Paid workers, not family members 0.25 3396 -0.05 -0.06 (1.05) (0.044) (0.043) Each coefficient reported in the table is from a separate regression. * significant at 10%; ** significant at 5%; *** significant at 1%. Standard errors clustered by village bank in parentheses. a/ Dependent variables are defined as follows. Last week sales: Logarithm of main business’s sales in the month preceding each survey. Good/ Normal/ Bad sales: Logarithm of main business’s sales in a good/normal/bad month. Difference good-bad week: Difference in monthly sales between good and bad month. Weekly surplus from most profitable product: Difference between the weekly revenue and cost of the most profitable product in the main business (soles). Number of total workers: Number of workers in the main business. Number of paid workers: Number of workers in the main business that are not household members. b/ Double difference estimate reported. c/ First difference estimate reported. d/ The covariates include location (Ayacucho or Lima), business activity, business size, age, schooling and number of FINCA loans received by the client.
30
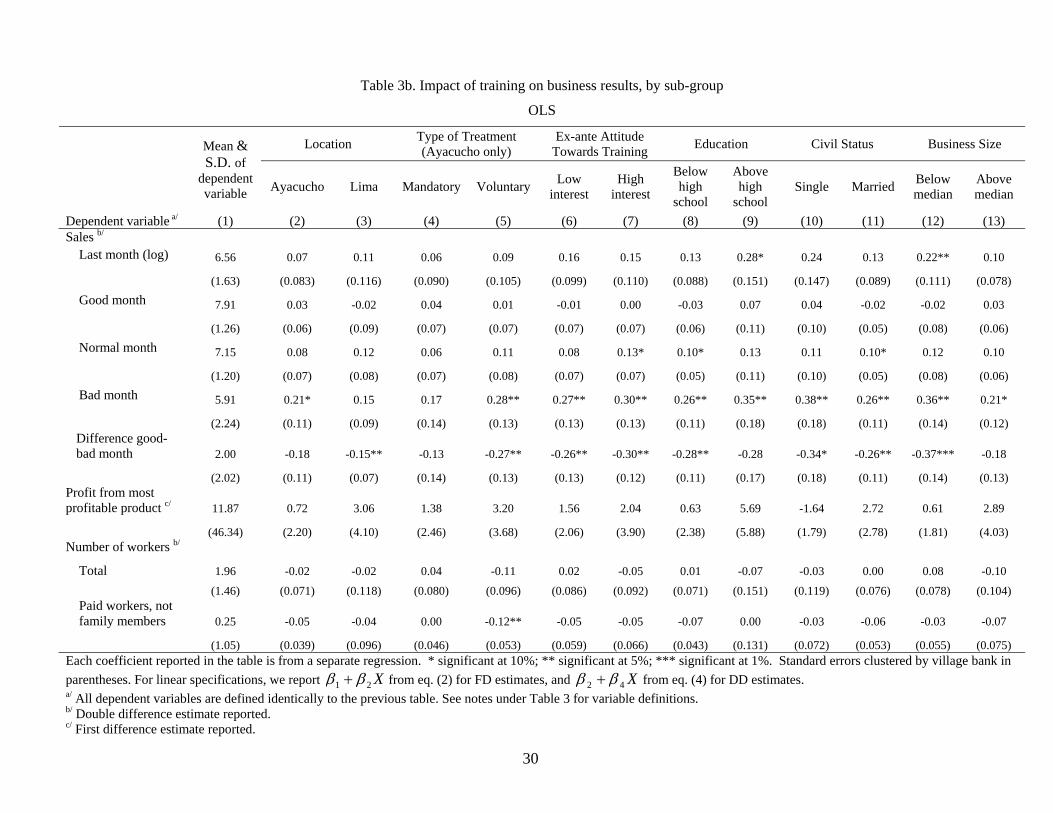
Table 3b. Impact of training on business results, by sub-group
OLS
Location Type of Treatment
(Ayacucho only) Ex-ante Attitude
Towards Training Education Civil Status Business Size
Mean & S.D. of
dependent variable Ayacucho Lima Mandatory Voluntary Low
interest High
interest
Below high
school
Above high
school Single Married Below
median Above median
Dependent variable a/ (1) (2) (3) (4) (5) (6) (7) (8) (9) (10) (11) (12) (13) Sales b/
Last month (log) 6.56 0.07 0.11 0.06 0.09 0.16 0.15 0.13 0.28* 0.24 0.13 0.22** 0.10
(1.63) (0.083) (0.116) (0.090) (0.105) (0.099) (0.110) (0.088) (0.151) (0.147) (0.089) (0.111) (0.078) Good month 7.91 0.03 -0.02 0.04 0.01 -0.01 0.00 -0.03 0.07 0.04 -0.02 -0.02 0.03
(1.26) (0.06) (0.09) (0.07) (0.07) (0.07) (0.07) (0.06) (0.11) (0.10) (0.05) (0.08) (0.06) Normal month 7.15 0.08 0.12 0.06 0.11 0.08 0.13* 0.10* 0.13 0.11 0.10* 0.12 0.10
(1.20) (0.07) (0.08) (0.07) (0.08) (0.07) (0.07) (0.05) (0.11) (0.10) (0.05) (0.08) (0.06) Bad month 5.91 0.21* 0.15 0.17 0.28** 0.27** 0.30** 0.26** 0.35** 0.38** 0.26** 0.36** 0.21*
(2.24) (0.11) (0.09) (0.14) (0.13) (0.13) (0.13) (0.11) (0.18) (0.18) (0.11) (0.14) (0.12) Difference good-bad month 2.00 -0.18 -0.15** -0.13 -0.27** -0.26** -0.30** -0.28** -0.28 -0.34* -0.26** -0.37*** -0.18
(2.02) (0.11) (0.07) (0.14) (0.13) (0.13) (0.12) (0.11) (0.17) (0.18) (0.11) (0.14) (0.13) Profit from most profitable product c/ 11.87 0.72 3.06 1.38 3.20 1.56 2.04 0.63 5.69 -1.64 2.72 0.61 2.89
(46.34) (2.20) (4.10) (2.46) (3.68) (2.06) (3.90) (2.38) (5.88) (1.79) (2.78) (1.81) (4.03) Number of workers b/
Total 1.96 -0.02 -0.02 0.04 -0.11 0.02 -0.05 0.01 -0.07 -0.03 0.00 0.08 -0.10 (1.46) (0.071) (0.118) (0.080) (0.096) (0.086) (0.092) (0.071) (0.151) (0.119) (0.076) (0.078) (0.104)
Paid workers, not family members 0.25 -0.05 -0.04 0.00 -0.12** -0.05 -0.05 -0.07 0.00 -0.03 -0.06 -0.03 -0.07 (1.05) (0.039) (0.096) (0.046) (0.053) (0.059) (0.066) (0.043) (0.131) (0.072) (0.053) (0.055) (0.075)
Each coefficient reported in the table is from a separate regression. * significant at 10%; ** significant at 5%; *** significant at 1%. Standard errors clustered by village bank in parentheses. For linear specifications, we report X21 ββ + from eq. (2) for FD estimates, and X42 ββ + from eq. (4) for DD estimates. a/ All dependent variables are defined identically to the previous table. See notes under Table 3 for variable definitions. b/ Double difference estimate reported. c/ First difference estimate reported.

31
Table 4. Impact of training on household outcomes
OLS, Probit
Dependent variable a/
Mean & S.D. of dependent
variable
Nº of clients
Treatment impact without
covariates
Treatment impact with covariates e/
Client’s decision power on b/ Loans/savings from FINCA for hh/business (index) 0.01 3422 -0.07 -0.08
(1.24) (0.064) (0.062) Number of children 4.04 2782 0.02 0.02
(0.81) (0.047) (0.046) Taking money/products from business 4.76 3356 0.0004 0.003
(0.72) (0.037) (0.036) Keeping track of household bills b/ 3.50 3416 -0.02 -0.03 (1.60) (0.076) (0.075) No need to separate money c/ 0.62 3413 -0.01 -0.01 (0.49) (0.019) (0.019) Child Labor d/ Working children 0.31 1043 -0.02 -0.01 (0.46) (0.035) (0.035) Daily hours dedicated to House work 1.02 1043 0.01 0.004 (0.85) (0.059) (0.059) Child labor 0.59 1043 -0.05 -0.05 (1.10) (0.079) (0.080) Schooling 7.35 1040 0.10 0.09 (1.48) (0.108) (0.108) Children with perfect attendance 0.97 1025 0.01 0.01 (0.18) (0.013) (0.012) Each coefficient reported in the table is from a separate regression. * significant at 10%; ** significant at 5%; *** significant at 1%. Standard errors clustered by village bank in parentheses. Marginal effects reported for probit specifications (no need to separate money, working children and children with perfect attendance). a/ Dependent variables are defined as follows. Client’s decision power: Index aggregating the responses to questions on who makes key decisions on household and business finance, the number of children to have, and the amount of money/products taken from the business; a higher number is associated with greater decision making power for the client. Keeping track of household bills: A categorical variable indicating who is in charge of paying household bills; a higher number is associated with more responsibility for the client. No need to separate money: Binary variable equal to one if client thinks that is not necessary to separate her money from that of her husband/partner or other adult in the household to control expenses and savings. Working children: Binary variable equal to one if the child works. Daily hours dedicated: Number of hours the child dedicated to each activity in the week before the survey; schooling includes the time the child spent at school, as well as the time he/she dedicates to do homework or study at the household. Children with perfect attendance: Binary variable equal to one if the child attended school all the days that he/she could have. b/ Double difference estimate reported. c/ First differences. d/ Sample for the analysis on child labor includes school-aged children (between 6 and 15 years of age) of clients in Lima. e/ The covariates include location (Ayacucho or Lima), business activity, business size, age, schooling and number of FINCA loans received by the client.
32
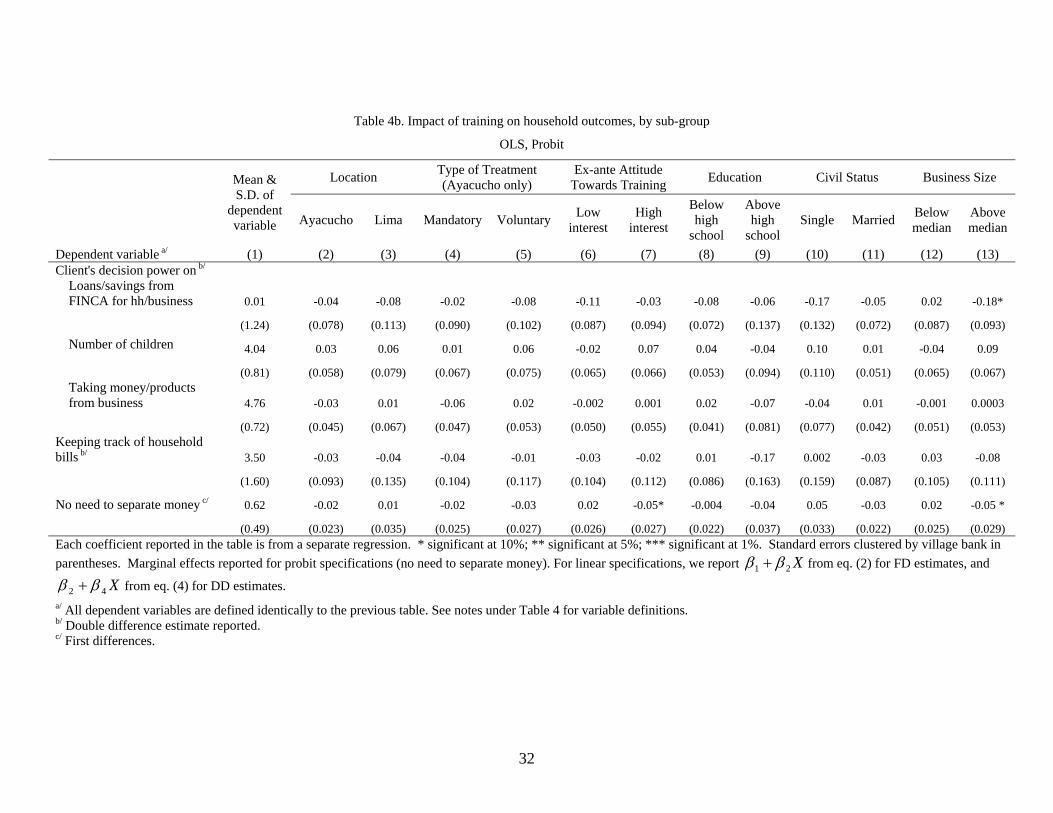
Table 4b. Impact of training on household outcomes, by sub-group
OLS, Probit
Location Type of Treatment
(Ayacucho only) Ex-ante Attitude
Towards Training Education Civil Status Business Size
Mean & S.D. of
dependent variable Ayacucho Lima Mandatory Voluntary Low
interest High
interest
Below high
school
Above high
school Single Married Below
median Above median
Dependent variable a/ (1) (2) (3) (4) (5) (6) (7) (8) (9) (10) (11) (12) (13) Client's decision power on b/
Loans/savings from FINCA for hh/business 0.01 -0.04 -0.08 -0.02 -0.08 -0.11 -0.03 -0.08 -0.06 -0.17 -0.05 0.02 -0.18*
(1.24) (0.078) (0.113) (0.090) (0.102) (0.087) (0.094) (0.072) (0.137) (0.132) (0.072) (0.087) (0.093) Number of children 4.04 0.03 0.06 0.01 0.06 -0.02 0.07 0.04 -0.04 0.10 0.01 -0.04 0.09
(0.81) (0.058) (0.079) (0.067) (0.075) (0.065) (0.066) (0.053) (0.094) (0.110) (0.051) (0.065) (0.067) Taking money/products from business 4.76 -0.03 0.01 -0.06 0.02 -0.002 0.001 0.02 -0.07 -0.04 0.01 -0.001 0.0003
(0.72) (0.045) (0.067) (0.047) (0.053) (0.050) (0.055) (0.041) (0.081) (0.077) (0.042) (0.051) (0.053) Keeping track of household bills b/ 3.50 -0.03 -0.04 -0.04 -0.01 -0.03 -0.02 0.01 -0.17 0.002 -0.03 0.03 -0.08
(1.60) (0.093) (0.135) (0.104) (0.117) (0.104) (0.112) (0.086) (0.163) (0.159) (0.087) (0.105) (0.111)
No need to separate money c/ 0.62 -0.02 0.01 -0.02 -0.03 0.02 -0.05* -0.004 -0.04 0.05 -0.03 0.02 -0.05 *
(0.49) (0.023) (0.035) (0.025) (0.027) (0.026) (0.027) (0.022) (0.037) (0.033) (0.022) (0.025) (0.029) Each coefficient reported in the table is from a separate regression. * significant at 10%; ** significant at 5%; *** significant at 1%. Standard errors clustered by village bank in parentheses. Marginal effects reported for probit specifications (no need to separate money). For linear specifications, we report X21 ββ + from eq. (2) for FD estimates, and
X42 ββ + from eq. (4) for DD estimates. a/ All dependent variables are defined identically to the previous table. See notes under Table 4 for variable definitions. b/ Double difference estimate reported. c/ First differences.

33
Table 4c. Impact of training on child labor, by sub-group
OLS, Probit
Child’s gender Mother’s Ex-ante Attitude
Towards Training Mother’s Education Mother’s Civil Status
Mean & S.D. of
dependent variable Female Male
Low interest
High interest
Below high
school
Above high
school Single Married Dependent variable a//b/ (1) (2) (3) (4) (5) (6) (7) (8) (9) Working children 0.31 -0.07 0.03 -0.01 -0.02 0.01 -0.09 -0.13 0.01
(0.46) (0.047) (0.044) (0.057) (0.044) (0.041) (0.068) (0.087) (0.038)
Daily hours dedicated to
House work 1.02 -0.09 0.08 0.08 -0.03 0.01 -0.02 -0.13 0.03
(0.85) (0.091) (0.071) (0.096) (0.075) (0.069) (0.119) (0.152) (0.065)
Child labor 0.59 -0.15 0.03 0.11 -0.14 0.04 -0.32** -0.24 -0.02
(1.10) (0.111) (0.101) (0.131) (0.099) (0.093) (0.156) (0.224) (0.085)
Schooling 7.35 0.25 * -0.04 -0.06 0.18 0.08 0.12 0.12 0.10
(1.48) (0.146) (0.135) (0.171) (0.138) (0.125) (0.214) (0.236) (0.120)
Children with perfect attendance 0.97 -0.01 0.03 -0.01 0.02 0.01 0.02 -0.05 0.02
(0.18) (0.012) (0.020) (0.016) (0.018) (0.014) (0.033) (0.030) (0.014) Each coefficient reported in the table is from a separate regression. * significant at 10%; ** significant at 5%; *** significant at 1%. Standard errors clustered by village bank in parentheses. Marginal effects reported for probit specifications (working children and children with perfect attendance). For linear specifications, we report X21 ββ + from eq. (2) for FD estimates, and X42 ββ + from eq. (4) for DD estimates. a/ All dependent variables are defined identically to the variables in Table 4. See notes under Table 4 for variable definitions. b/ Sample for the analysis on child labor includes school-aged children (between 6 and 15 years of age) of clients in Lima.
34
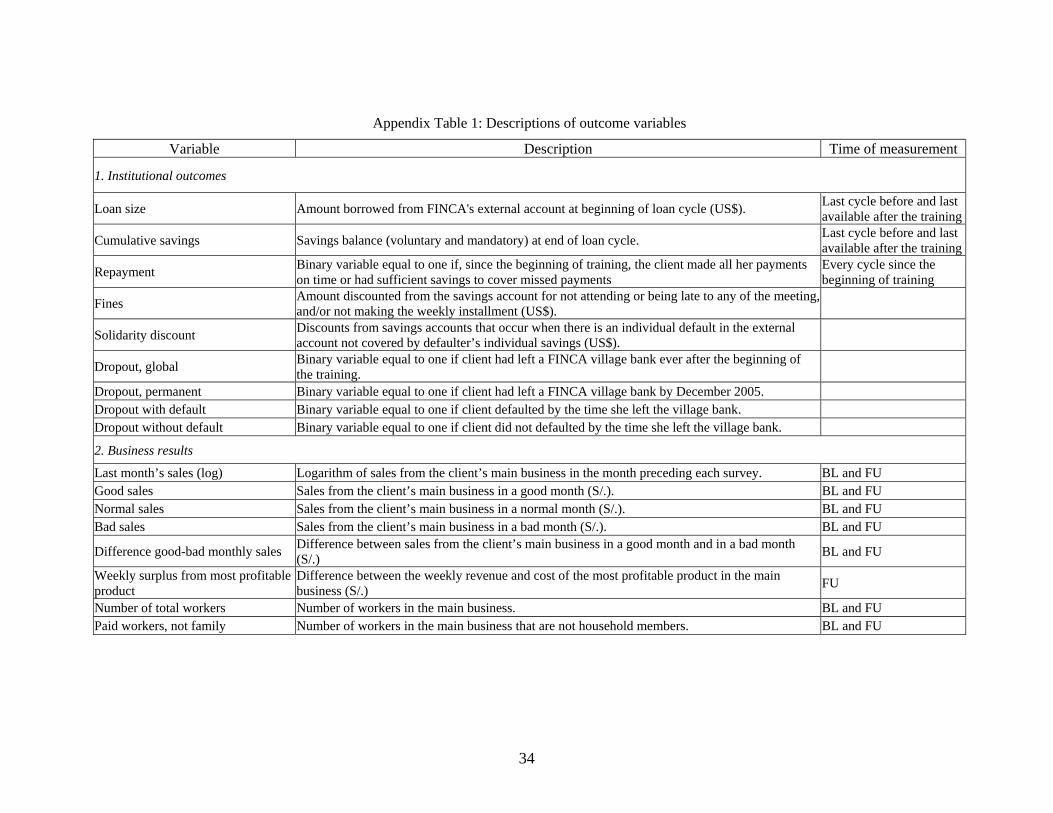
Appendix Table 1: Descriptions of outcome variables
Variable Description Time of measurement
1. Institutional outcomes
Loan size Amount borrowed from FINCA's external account at beginning of loan cycle (US$). Last cycle before and last available after the training
Cumulative savings Savings balance (voluntary and mandatory) at end of loan cycle. Last cycle before and last available after the training
Repayment Binary variable equal to one if, since the beginning of training, the client made all her payments on time or had sufficient savings to cover missed payments
Every cycle since the beginning of training
Fines Amount discounted from the savings account for not attending or being late to any of the meeting, and/or not making the weekly installment (US$).
Solidarity discount Discounts from savings accounts that occur when there is an individual default in the external account not covered by defaulter’s individual savings (US$).
Dropout, global Binary variable equal to one if client had left a FINCA village bank ever after the beginning of the training.
Dropout, permanent Binary variable equal to one if client had left a FINCA village bank by December 2005. Dropout with default Binary variable equal to one if client defaulted by the time she left the village bank. Dropout without default Binary variable equal to one if client did not defaulted by the time she left the village bank.
2. Business results
Last month’s sales (log) Logarithm of sales from the client’s main business in the month preceding each survey. BL and FU Good sales Sales from the client’s main business in a good month (S/.). BL and FU Normal sales Sales from the client’s main business in a normal month (S/.). BL and FU Bad sales Sales from the client’s main business in a bad month (S/.). BL and FU
Difference good-bad monthly sales Difference between sales from the client’s main business in a good month and in a bad month (S/.) BL and FU
Weekly surplus from most profitable product
Difference between the weekly revenue and cost of the most profitable product in the main business (S/.) FU
Number of total workers Number of workers in the main business. BL and FU Paid workers, not family Number of workers in the main business that are not household members. BL and FU

35
3. Business practices
Tax formality Binary variable equal to one if the client has a tax ID number. BL and FU
Profits used for business growth Binary variable equal to one if the client reported re-investing profits for the growth or continuity of the business. FU
Thinking of keeping business safe when taking money from it
Binary variable equal to one if client considers the needs of the business when taking money from the business for family use. FU
Fixed salary for herself Binary variable equal to one if the client pays herself a fixed salary. BL and FU
Records sales Binary variable equal to one if the client records her sales in a registry or notebook. BL and FU
Records withdrawals Binary variable equal to one if the client records her cash and in-kind withdrawals in a registry or notebook. BL and FU
Records wages Binary variable equal to one if the client records in a registry or notebook the wage payments she makes to workers that are not household members. FU
Business knowledge Number of right answers given by the client when asked about what should be done to increase business sales and to plan for a new business. FU
Starting a new business Binary variable equal to one if the client reports having begun a new business in the last year (Ayacucho) or the last two years (Lima). FU
Number of sales locations Number of locations where the client sells the products of her main business. BL and FU
Number of income sources Number of income sources the client reports. Includes all her personal/family businesses as well as other jobs or working activities (only available for Ayacucho). BL and FU
Importance of main product Discrete variable that indicates if the sales of the most profitable product represent 1) all business sales; 2) more than half of business sales; or 3) less than half of business sales. The higher the number, the more diversified the business is.
FU
Allows credit sales Binary variable equal to one if the client makes sales on credit. FU, but recalling situation 12 months before survey
Faced problems with business Binary variable equal to one if the client reported that her business faced a specific problem in the last year (Ayacucho) or the last two years (Lima). FU
Planned change/innovation Binary variable equal to one if the client had an idea for a change/innovation to improve the business (Ayacucho) or to solve the problems faced (Lima). FU
Implemented change/innovation Binary variable equal to one if the client implemented a change/innovation to improve the business (Ayacucho) or to solve the problems faced (Lima). FU
36
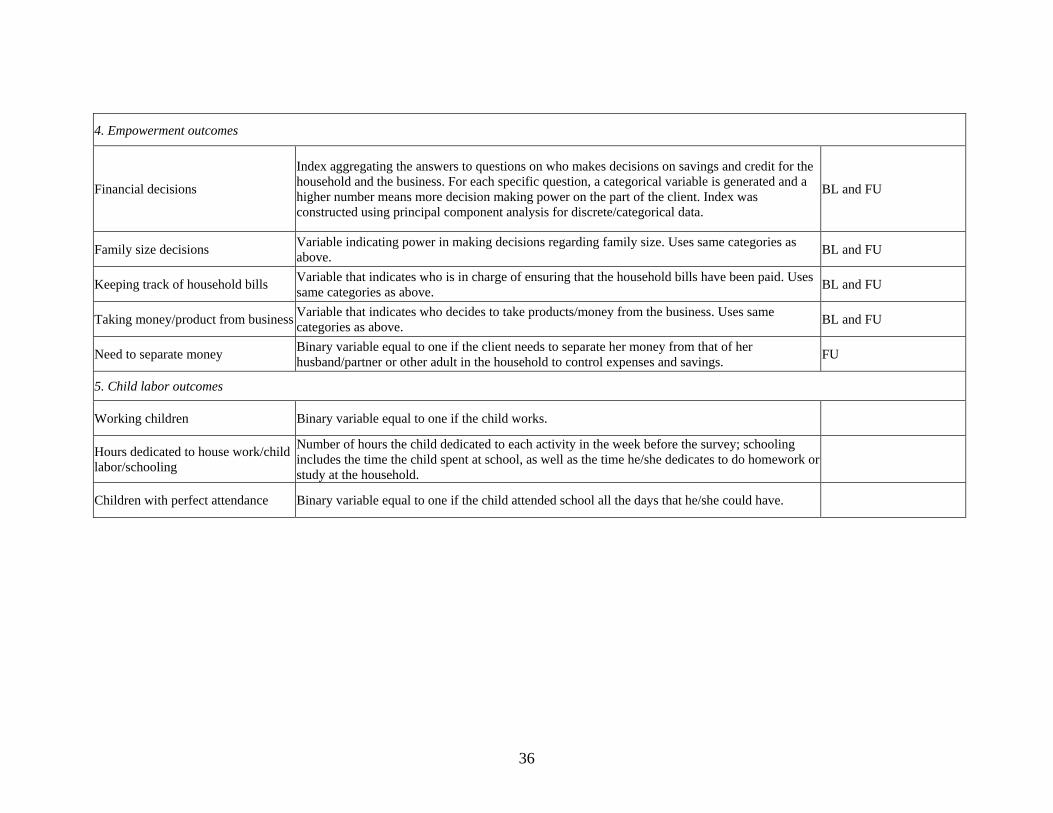
4. Empowerment outcomes
Financial decisions
Index aggregating the answers to questions on who makes decisions on savings and credit for the household and the business. For each specific question, a categorical variable is generated and a higher number means more decision making power on the part of the client. Index was constructed using principal component analysis for discrete/categorical data.
BL and FU
Family size decisions Variable indicating power in making decisions regarding family size. Uses same categories as above. BL and FU
Keeping track of household bills Variable that indicates who is in charge of ensuring that the household bills have been paid. Uses same categories as above. BL and FU
Taking money/product from business Variable that indicates who decides to take products/money from the business. Uses same categories as above. BL and FU
Need to separate money Binary variable equal to one if the client needs to separate her money from that of her husband/partner or other adult in the household to control expenses and savings. FU
5. Child labor outcomes
Working children Binary variable equal to one if the child works.
Hours dedicated to house work/child labor/schooling
Number of hours the child dedicated to each activity in the week before the survey; schooling includes the time the child spent at school, as well as the time he/she dedicates to do homework or study at the household.
Children with perfect attendance Binary variable equal to one if the child attended school all the days that he/she could have.

37
Appendix Table 2: Descriptive statistics of outcome variables
Variable Obs Mean Std. Dev. Min Max Institutional results Loan size 6340 253.22 264.59 50.00 4,500.00 Cumulative savings 6340 299.56 405.41 -1,742.62 5,492.73 Repayment 6340 0.80 0.40 0.00 1.00 Fines 2721 0.02 3.23 -62.00 32.00 Solidarity discounts 2721 0.34 4.07 0.00 142.43 Dropout global 6340 0.61 0.49 0.00 1.00 Dropout permanent 6340 0.45 0.50 0.00 1.00 Global dropout with default 6340 0.16 0.37 0.00 1.00 Global dropout without default 6340 0.42 0.49 0.00 1.00 Permanent dropout with default 6340 0.14 0.35 0.00 1.00 Permanent dropout without default 6340 0.30 0.46 0.00 1.00 Business practices Tax formality 6471 0.15 0.35 0.00 1.00 Profit used for business growth 3473 0.67 0.47 0.00 1.00 Thinking of keeping business safe when taking money from it 3473 0.26 0.44 0.00 1.00 Fixed salary 6331 0.09 0.28 0.00 1.00 Keeping records of sales 6381 0.34 0.47 0.00 1.00 Keeping records of withdrawals 5393 0.20 0.54 0.00 3.00 Keeping records of payments to workers 1704 0.21 0.40 0.00 1.00 Business knowledge index 6946 3.32 1.40 0.00 13.00 Started new business 6946 0.07 0.26 0.00 1.00 Number of sales locations 6946 1.05 0.46 0.00 4.00 Number of income sources 4820 1.89 0.79 0.00 5.00 Importance of main product 2255 2.31 0.70 1.00 3.00 Allows sales on credit 6946 0.58 0.49 0.00 1.00 Proportion of clients who faced problems with business 2126 0.32 0.47 0.00 1.00 Proportion of clients who planned innovations in their businesses 6946 0.32 0.47 0.00 1.00 Proportion of clients who executed innovations in their businesses 6946 0.20 0.40 0.00 1.00

38
Appendix Table 2: Descriptive statistics of outcome variables (Continued)
Business results Last month sales (log) 6451 6.77 1.66 0.00 14.47 Good month sales 6353 7.95 1.29 3.04 14.69 Normal month sales 6341 7.19 1.21 2.40 14.47 Bad month sales 6303 6.10 2.04 0.00 13.77 Difference good-bad month sales 6297 1.85 1.76 -1.67 12.95 Weekly surplus from most profitable product 1799 -550.45 13,753.86 -336,994.60 1,000.00 Total number of workers 6453 1.18 3.98 0.00 198.00 Number of paid workers, not family members 6456 0.48 4.55 0.00 99.00 Household outcomes Client’s decision power on:
Loans/savings from FINCA for hh/business (index) 6731 -0.04 1.27 -4.66 1.33 Number of children 4588 4.06 0.77 1.00 5.00 Taking money/products from business 6186 4.74 0.71 1.00 5.00
Keeping track of household bills 6865 3.45 1.54 1.00 5.00 No need to separate money 3459 0.62 0.49 0.00 1.00 Child labor Working children 1043 0.31 0.46 0.00 1.00 Daily hours dedicated to:
House work 1043 1.02 0.85 0.00 5.00 Child labor 1043 0.59 1.10 0.00 8.00 Schooling 1040 7.35 1.48 0.00 13.00
Children with perfect attendance 1025 0.97 0.18 0.00 1.00

39
Appendix Table 3: Ex-ante differences between clients by location and permanence in FINCA
Treatment Control Difference T-stat Response rate (follow-up survey) 75.2 77.9 -2.7 2.060 **
By Location Lima 77.2 83.5 -6.2 2.845 ***Ayacucho 74.5 74.8 -0.3 0.170
By Permanence in FINCA Clients 83.2 83.9 -0.6 0.339 Ex-clients 69.9 74.2 -4.3 2.436 ***
Tenure in FINCA (Cycles) Lima 5.2 5.2 0.0 0.030 Ayacucho 6.0 5.8 -0.2 -1.220
Years of Education Lima 9.9 9.7 0.2 0.946 Ayacucho 8.1 8.1 0.0 0.009
Age Lima 42.6 42.3 0.3 0.529 Ayacucho 36.3 36.5 -0.2 -0.510
Loan Size (external account)a/ b/ Lima 293 308 15 1.09 Ayacucho 173 167 -6 -0.85
Accumulated Savings a/ b/ Lima 174.9 185.2 -10.3 -0.703 Ayacucho 360.4 348.6 11.7 0.577
Default Rate b/ Lima 0.03 0.03 0.00 0.109 Ayacucho 0.02 0.01 0.00 0.369
Drop out Rate b/ Lima 22.5 23.3 -0.8 -0.37 Ayacucho 22.8 23.4 -0.6 -0.47
Last week sales (log) Lima 7.4 7.4 0.0 -0.071 Ayacucho 6.3 6.3 0.0 -0.086
Number of total workers Lima 1.2 1.2 0.0 -0.202 Ayacucho 0.8 0.8 0.0 0.793
Number of paid workers Lima 0.4 0.3 0.1 0.894 Ayacucho 0.2 0.2 0.0 0.442
Ex-ante high interest in training Lima 0.6 0.6 0.0 0.446 Ayacucho 0.4 0.4 0.0 0.797
Source: FINCA-Peru historical database and baseline client survey. Averages were calculated for the cycle before the BDS training program was started. a/ In US $. b/ In the last cycle before the beginning of training.

40
Appendix Table 4: Post intervention differences for dropout reasons, Ayacucho & Lima
Total Treatment Control # obs % # obs % # obs % Difference T-stat Number of clients 3457 2093 60.54 1364 39.46 5-I. Reasons related with the policies and procedures of the FINCA program Dissatisfied with FINCA's loan terms 227 6.57 131 6.26 94 6.89 -0.633 -0.737 Dissatisfied with FINCA's saving terms 51 1.48 28 1.34 23 1.69 -0.348 -0.830 Dissatisfied with the solidarity discounts (only Lima) a/ 47 4.42 20 3.68 27 5.19 -1.509 -1.196 The meetings were too long or too far (interference with business' schedule and/or personal activities) 404 11.69 256 12.23 145 10.63 1.601 1.437 *
Unequal / bad treatment to bank members 142 4.11 82 3.92 59 4.33 -0.408 -0.592 Because of the training 0 0.00 0 0.00 0 0.00 0.000 - FINCA discovered loans from other institutions (only Ayacucho) b/ 13 0.54 7 0.45 6 0.71 -0.259 -0.825 Found an institution with better loan terms 18 0.52 11 0.53 7 0.51 0.012 0.049 5-II. Reasons related with the group loans The village bank “graduated” (or was dissolved) 30 0.87 14 0.67 13 0.95 -0.284 -0.928 Personal conflicts in the bank (with other bank members or with the bank's president ) 170 4.92 106 5.06 63 4.62 0.446 0.594
5-III. Reasons related to the client’s business No credit needs because of the good situation of the business (sufficient capital in the business or the business operates seasonally) 29 0.84 18 0.86 11 0.81 0.054 0.169
No credit needs/could not pay the loan because of the bad situation of the business or other reasons 304 8.79 187 8.93 116 8.50 0.430 0.437
Closed the business / new activity or job 69 2.00 38 1.82 30 2.20 -0.384 -0.794 5-IV. Personal Reasons Expenses resulting from a family crisis (i.e. illness) or family event (i.e. wedding) 312 9.03 193 9.22 118 8.65 0.570 0.573
Other personal problems 124 3.59 74 3.54 50 3.67 -0.130 -0.201 Left the region/went on a long trip 215 6.22 140 6.69 75 5.50 1.190 1.417 * A relative influenced the client 37 1.07 23 1.10 14 1.03 0.073 0.202 5-V. Reasons due to Environmental Factors Environmental / macroeconomic factors 57 1.65 31 1.48 26 1.91 -0.425 -0.959 5-VI. Other Reasons Other / Did not respond 221 6.39 134 6.40 85 6.23 0.171 0.201 a/ There are 1063 observations: (543 received treatment) b/ There are 2394 observations: (1550 received treatment)

41
Appendix A: Business Training Materials
In Lima, the training was administered as a two-part program.1 Module 1, “Training
for Success,” consists of 15 sessions that introduce the topics of business administration
and marketing. Classes begin by introducing attendees to what a business is, how a
business works, and the marketplace. Women are taught to identify their customers,
business competitors, and the position of the business in the marketplace. Later in the
module, sessions cover topics on product, price, and promotional strategies and a
commercial plan. The module also includes review sessions and a business game that
participants play in several sessions.
The second module, “Business and Family: Costs and Finances,” consists of 10
sessions that explain how to separate business and home finances. The classes cover the
differences between income, costs, and profit, how to calculate production costs, and
product pricing. Other sessions cover maintaining records of business’ operations, business
growth, loan repayment, and taxes.
Every session of these two modules included worksheets on the topics taught for the
clients to practice and review at the meetings or at home.
In Ayacucho, the training program was grouped into 3 modules with topics less
advanced than those taught in Lima.2 Sessions were presented in 30 minute classes and did
not used worksheets as in Lima. Module 1, “Manage Your Business Money,” begins by
defining the differences between money for personal expenses and for the business.
Women are taught how to calculate profits and about the use of profits for the household
and business. Sessions cover how to handle selling to customers on credit, how to record 1 Table A1 provides a list of lessons presented in modules 1 and 2 in Lima. 2 Table A2 provides a list of lessons presented in modules 1 -3 in Ayacucho.

42
business expenses, how to prevent losses, and the importance of investing in the business.
The module also includes a review session.
Module 2, “Increase Your Sales” begins by providing an overview of five key
elements in sales: 1) customers, 2) business product or service, 3) product placement, 4)
pricing, and 5) marketing. Many of the following sessions are dedicated to provide women
with practical means of applying these concepts. The topics covered include the key
elements of good customer relations, how to target sales to different types of customers,
and approaches for varying the types and timing of the products that are sold in order to
increase sales. Participants are also taught about how to identify locations, price goods, and
conduct activities that increase sales and profits.
The third module, “Plan for a Better Business,” teaches members how to incorporate
planning into their business. Sessions begin by presenting why planning is beneficial and
what traits characterize a successful business. Attendees are instructed on how to solve
business problems and how to introduce new products or changes. Later sessions teach the
tools needed to prepare a sales plan, calculate business and loan costs, search for new
resources, and handle unexpected problems and opportunities.

43
Appendix A, Table 1. Business Training Sessions Presented in Lima
Module 1: Training for Success Module 2: The Business and the Family: Costs and Finances
Session Title Session Title 1 Training for Success 1 The Business and the Family
2 What is a business? 2 Income, Costs, and Profit
3 How does a business work? 3 My Costs of Production and Operating
Resources 4 The Market 4 How Do I Calculate the Cost of
Production of My Product? 5 Who are my customers? 5 Prices and Price Equilibrium 6 Who are my competitors? 6 How to Make a Good Price Decision 7 Review Session 1 7 The Registers and Controls in My
Business 8 Business game: Module 1 8 The Growth of My Business 9 My business’ position in the market 9 Will I Be Able to Pay My Loan?
10 Product and Price Commercial Strategy
10 Taxes
11 Marketplace and Promotion Commercial Strategy
12 My Commercial Plan 13 Review Session 2 14 Business Game: Module 2 15 Business Game: Module 3

44
Appendix A, Table 2: Business Training Sessions Presented in Lima
Module 1: Manage Your Business Money Module 2: Increase Your Sales Session Title Session Title
1 Separate Business and Personal Money
1 Know Your Customers
2 Use Business Loans for Your Business
2 Treat Your Customers Well
3 Calculating Profits 3 Sell to Different Kinds of Customers 4 Track, Plan and Invest Your
Business Money 4 Improve Your Products and Services
5 Decide How to Use the Profits of the Business to Satisfy the Needs of the Business and Your Personal Needs
5 Sell New and Complementary Products and Services
6 Prevent Business Losses 6 Seize Opportunities to Sell 7 Manage Credit Sales 7 Sell Where Customers Buy the Most 8 Review of the Learning Sessions of
“Manage Your Business Money” 8 Set the Right Price
9 Promote Your Business With Good Selling Practices
10 Plan for Increased Sales
Module 3: Plan for a Better Business Session Title
1 Use Planning Steps to Grow Your Business 2 Examine How Your Business Is Doing 3 Decide How You Can Improve Your Business 4 Develop and Test New Business Ideas 5 Plan How Much to Make and Sell 6 Plan Business Costs 7 Plan for More Profit 8 Find Resources for Your Business 9 Prepare for Unexpected Events