teaching functions with ti-nspire - buckner 2011.pdf
TRANSCRIPT

THE IMPACT OF USING TECHNOLOGY ON STUDENT ACHIEVEMENT:
TEACHING FUNCTIONS WITH THE TI-NSPIRE TO 9TH
GRADE ALGEBRA
STUDENTS
By
Barbara Renee Buckner
B.S., Lee University, 1994
M.S., Tusculum College, 1996
A Dissertation
Submitted to the Faculty of the
Graduate School of the University of Louisville
in Partial Fulfillment of the Requirements
for the Degree of
Doctor of Philosophy
Department of Teaching and Learning
University of Louisville
Louisville, Kentucky
May 2011

Copyright 2011 by Barbara Renee Buckner
All rights reserved


ii
THE IMPACT OF USING TECHNOLOGY ON STUDENT ACHIEVEMENT:
TEACHING FUNCTIONS WITH THE TI-NSPIRE TO 9TH
GRADE ALGEBRA
STUDENTS
By
Barbara Renee Buckner
B.S., Lee University, 1994
M.S., Tusculum College, 1996
A Dissertation Approved on
April 4, 2011
by the following Dissertation Committee:
Dr. Robert Ronau
Dissertation Director
Dr. Bill Bush
Dr. Carl Lee
Dr. Namok Choi
Dr. Sue Peters

iii
DEDICATION
This dissertation is dedicated:
To my Great-grandmother, Barbara Bradshaw, who always said I would
be a teacher.
To my Papaw, Frank Bradshaw, who provided my earliest memories of
mathematics trying to add up on paper what he calculated faster in his
head.
To my Mamaw, Elizabeth Bradshaw, you were my best friend and I still
miss you so.
To my Parents, James and Rita Buckner, for moving back to Virginia to
give me my rural roots and the experience of a tight-knit family.
To my Great Aunt Carol, for continual support and encouragement. I
know your prayers made a difference.
To my high school mathematics teacher, Mr. James Sink, you allowed me
to advance through high school mathematics in a unique way that set me
up for excellent educational opportunities.
To my college professor, mentor, and friend, Dr. Cliff Schimmels, your
influence on my life lives on in my classroom.

iv
ACKNOWLEDGEMENTS
While it may take a village to raise a child, there is no way I could have
completed this dissertation without the help, support, and guidance of my family, friends,
colleagues, cohort members, and committee. I am extremely grateful for the ACCLAIM
Program, specifically Dr. Bill Bush and Dr. Vena Long, for the creation and support of
this unique doctoral program. Special thanks to my cohort members who are more like
family. I treasure the memories from the summers spent at the University of Tennessee,
the University of Kentucky, and the University of Louisville. I would especially like to
thank my committee chair, Dr. Robert Ronau for his assistance, guidance, and support
throughout this entire process. I would also like to thank Dr. Bill Bush, Dr. Carl Lee, Dr.
Sue Peters, and Dr. Namok Choi for serving on my committee and providing valuable
feedback and support.
Special thanks for my colleagues at Bradley Central and Lee University. Thank
you for grading papers, covering classes, and encouraging me. This process has taught
me to be more understanding with assignments and to be more grateful for the
opportunity to gain an education. Mr. Tom Losh, Mr. Johnny McDaniel, Mr. Bob
Taylor, and Mr. Todd Shoemaker, as administrators, you have allowed me to pursue this
degree. I am grateful for your trust and encouragement along the way. I pray that I can
continue to make a difference in the lives of the students I teach and help them to see the
complete potential within themselves.

v
My deepest gratitude is to my family. To my mom and dad, thank you for raising
me in a loving Christian home, always challenging me to do my best, and encouraging
me to be and do all that God wants of me. Thank you for the many times you drove to
Cleveland, cooked meals, folded clothes, took out the trash, and countless other ways you
assisted me. To my sisters, Hope and Jenny, gone is my need to take the easy way out on
family events and to arrange the calendar around my graduate school schedule. I am so
ready for more family time. To my niece and nephew, Faith and Sam, you have both
grown up into such wonderful young adults as I have completed this degree. Your
encouragement, text messages, and emails have always brought a smile to my face. You
are both so bright and intelligent; I look forward to being there to celebrate the many
accomplishments that lie ahead for you both. Special thanks to Mrs. Mary Schimmels for
being my personal editor. Your unending support and encouragement have been
invaluable. You are such a gift from God.
I am often amazed at how God has ordered my steps and brought such leaders
into my life. At a student council retreat, Ken Brummett gave me a plaque with the
following quote that has been a constant encouragement: “I have a dream that soars on
eagle‟s wings, a dream of your accomplishments and other wondrous things. I know not
when, or where you will challenge fate, I only know you will be great.” Then on a
mission trip traveling across Europe, Dr. Randall Parris challenged me with the statement
that “Preparation always has a way of Crossing the path of Opportunity.” These two
quotes served as constant reminders of the unique voice that would fill my classroom
when Doc would come back to check in on me and inquire about my going to start a
doctoral program. The many conversations we had about students, teaching,

vi
strawberries, and life were a small part in how Dr. Cliff Schimmels communicated the
future opportunities that he saw for me, more potential than I ever even saw in myself.
My life is forever changed because of Dr. Cliff Schimmels. Hope I made you proud,
Doc!

vii
ABSTRACT
THE IMPACT OF USING TECHNOLOGY ON STUDENT ACHIEVEMENT:
TEACHING FUNCTIONS WITH THE TI-NSPIRE TO 9TH
GRADE ALGEBRA
STUDENTS
Barbara Renee Buckner
April 4, 2011
The purpose of this study was to determine the effect of TI-Nspire graphing
calculator use on student achievement and on teacher behavior variables of planning,
teaching, and assessing. This study investigated the teaching of functions by teachers
using the TI-Nspire graphing calculator versus teachers using a non-graphing scientific
calculator.
A review of the literature found that the emergence of calculators and computers
has changed the way mathematics is both done and used (Ellington, 2006; Thorpe, 1989;
& Kieran, 1992). Research also showed that students can effectively use a graphing
calculator as an instructional tool to make and understand different types of
representations (Choi-Koh, 2003; Colgan, 1993; and Drijvers & Doorman, 1996). Other
studies have shown how graphing calculator use has engaged students in higher level
thinking skills (Dessart, DeRidder, Charleen, & Ellington, 1999; Ellington, 2006;
Graham & Thomas, 1998; Keller & Hirsch, 1998; Huntley, Rasmussen, Villarubi,
Sangtong, & Fey, 2000; & Ronau et al., 2008). Since it is a relatively new tool, there is a
limited amount of research on the classroom use of the TI-Nspire. The TI-Nspire is

viii
designed to link together multiple-representations within a single problem, so the concept
of functions is an ideal context within which to study the impact of the TI-Nspire.
This was a quasi-experimental study. The researcher gathered and analyzed pre-
test, post-test, and post post-test data on student performance on function concepts. The
study included a 90 minute classroom observation of each class as well as document
analysis of weekly questionnaires, daily lesson plans, and daily assessments. Vignettes
employed classroom observations, document analysis, and thick description to triangulate
the results of the qualitative analysis.
During the summer prior to this study, all teachers attended 12 hours of training
over the course of two days with a National Texas Instruments Instructor in which they
were trained to use the TI-Nspire graphing calculator. Teachers were then given a TI-
Nspire, TI-Nspire emulator and access to online Atomic learning video training (Atomic
Learning, 2011), to continue their exploration of the TI-Nspire. The week prior to the
study, the teachers attended another day of professional development activity taught by a
Texas Instruments Trained Cadre member. This “Function Focused Session” was six
hours long and provided review on the TI-Nspire, specific training about teaching the
function concept with the TI-Nspire, and time to create lesson plans and activities for this
study. During the two weeks of treatment and two weeks of follow up, teachers met once
a week for “Weekly Touchdown Sessions,” a 90 minute meeting held after school to
complete a weekly questionnaire, turn in lesson plans, assessments, and receive further
professional development on the TI-Nspire. Providing a trained Texas Instruments
Instructor on a weekly basis to answer questions, assist in providing direction for the
following week, and meeting weekly with the teachers to complete questionnaires were

ix
vital strategies necessary to support teachers with this new technology tool and to assure
their fidelity in treatment implementation and control maintenance. All professional
development sessions were taught by Texas Instruments trained Instructors.
The results from four teachers, each with one treatment class using the TI-Nspire
and one control class using a non-graphing scientific calculator, were significant on the
pre-test with the control group having a higher mean score than the treatment group and
statistical significance on the post post-test with the treatment group having a higher
mean score than the control group. While there was a statistically significant effect of
Teacher Zeta on the post-post test in comparisons with the other teachers, most of the
teacher effect was controlled for within the design of the study. To control for teacher
effect, all teachers taught both a treatment and a control class. For each teacher, one of
their two algebra classes was randomly assigned to treatment and the other was then
assigned to control. There was not enough power in the data to properly analyze the
effect of socioeconomic status and special education.
This study supports the use of TI-Nspire graphing calculators in Algebra
classrooms while studying the concept of functions. This study shows that, while using
the TI-Nspire graphing calculator, the use of multiple representations and higher Depth of
Knowledge activities can be used to improve student achievement, and impact classroom
teaching, and lesson planning. While this study shows the impact of the TI-Nspire
graphing calculator for the concept of functions, further research is needed to continue
evaluating the impact of the TI-Nspire across additional mathematics topics.

x
TABLE OF CONTENTS
PAGE
Dedication ......................................................................................................................... iii
Acknowledgements ........................................................................................................... iv
Abstract ............................................................................................................................ vii
List of Tables ................................................................................................................... xiv
List of Figures ...................................................................................................................xv
Chapter 1: Introduction .....................................................................................................1
Introduction ............................................................................................................1
Technology within the classroom ......................................................................... .3
Mathematics Learning ...........................................................................................4
Need for the Study .................................................................................................5
Overview of Study .................................................................................................7
Statement of Problem .............................................................................................8
Purpose of Study ....................................................................................................9
Research Questions and Hypotheses .....................................................................9
Research Questions ...................................................................................10
Null Hypotheses ........................................................................................11
Definitions of Terms .............................................................................................11
Significance of the Study ......................................................................................12
Organization of the Dissertation ...........................................................................13
Summary ...............................................................................................................13
Chapter 2: Literature Review ............................................................................................14

xi
Introduction ...........................................................................................................14
Importance of Mathematics ..................................................................................15
Historical Framework: School Mathematics ........................................................21
Historical Framework: Learning ...........................................................................29
Historical Framework: Technology ......................................................................32
Historical Framework: Technology in Learning ...................................................33
Calculators as Learning Tools ..............................................................................38
Chapter 3: Methodology ...................................................................................................45
Introduction ...........................................................................................................45
Research Design....................................................................................................46
Participants ............................................................................................................48
Population and Sampling ..........................................................................48
Demographics ...........................................................................................52
Instruments ............................................................................................................56
Content Validity ........................................................................................57
Internal Reliability ....................................................................................61
Professional Development ....................................................................................63
Treatment ..............................................................................................................65
Data Collection Procedures ...................................................................................73
Data Analysis Procedures .....................................................................................75
Summary ...............................................................................................................75
Chapter 4: Results .............................................................................................................78
Introduction ...........................................................................................................78

xii
Student Outcomes .................................................................................................88
Vignettes ..............................................................................................................102
Teacher Alpha – Control Class ................................................................103
Teacher Alpha – Treatment Class ............................................................110
Across Teacher Alpha‟s Treatment and Control Classes ........................117
Teacher Epsilon – Control Class..............................................................121
Teacher Epsilon – Treatment Class .........................................................128
Across Teacher Epsilon‟s Treatment and Control Classes .....................135
Teacher Gamma – Control Class .............................................................139
Teacher Gamma – Treatment Class .........................................................147
Across Teacher Gamma‟s Treatment and Control Classes .....................154
Teacher Zeta – Control Class ...................................................................158
Teacher Zeta – Treatment Class ..............................................................165
Across Teacher Zeta‟s Treatment and Control Classes ...........................171
Summary of Control Classes ...................................................................174
Summary of Treatment Classes ...............................................................176
Summary of Results .............................................................................................179
Quantitative Summary .............................................................................180
Qualitative Summary ...............................................................................182
Conclusion ......................................................................................................189
Chapter 5: Discussion ......................................................................................................194
Introduction ..........................................................................................................194
Findings................................................................................................................196

xiii
Overall Findings...................................................................................................201
Limitations of the Study.......................................................................................204
Implications..........................................................................................................205
Recommendations ................................................................................................212
Summary ..............................................................................................................214
References ........................................................................................................................216
Appendices .......................................................................................................................238
Curriculum Vitae .............................................................................................................246

xiv
LIST OF TABLES
TABLE PAGE
1. ACT Composite Averages ..........................................................................................54
2. Eagle High School SAT Averages ..............................................................................54
3. Eagle High School Algebra I Gateway .......................................................................55
4. Eagle High School Dropout and Graduation Rates ....................................................55
5. Results of Content Validity Analysis ..........................................................................60
6. Internal Reliabilities for Algebra I Clusters and Complete Assessment .....................62
7. Internal Reliabilities for Geometry Clusters and Complete Assessment ....................62
8. Internal Reliabilities for Algebra II Clusters and Complete Assessment ...................63
9. Teachers Educational Background .............................................................................72
10. Original Missing Data .................................................................................................89
11. Missing Data when Comparing Tests .........................................................................89
12. Teacher and Type .......................................................................................................102
13. Depth of Knowledge Noted During Classroom Observations ...................................186
14. Summation Table .......................................................................................................193

xv
LIST OF FIGURES
FIGURE PAGE
1. Assignment of Treatment Chart ..................................................................................51
2. Final Treatment Assignment .......................................................................................52
3. Treatment Class Questionnaire ...................................................................................70
4. Control Class Questionnaire .......................................................................................70
5. Quasi-experimental design..........................................................................................79
6. Observation Categories ...............................................................................................85
7. Questionnaire Categories ............................................................................................87
8. Original Scores by Type for Each Test .......................................................................91
9. Pooled Imputed Scores by Type for Each Test ...........................................................93
10. Original Scores for Each Teacher by Test ..................................................................94
11. Pooled Imputed Scores for Each Teacher by Test ......................................................95
12. Original Scores for Each Test by Teacher and Type ..................................................97
13. Pooled Imputed Scores for Each Test by Teacher and Type ......................................98
14. Average Way of Representing an Activity During Observation ...............................183
15. Average Way of Representing an Activity Within Lesson Plans ..............................184
16. Average Depth of Knowledge During Observations .................................................185
17. Average Depth of Knowledge from Lesson Plan Analysis .......................................187
18. Average Depth of Knowledge on State Competencies from Lesson Plans ...............188

1
CHAPTER 1
INTRODUCTION
INTRODUCTION
The technological world in which today‟s students are growing up is very
different from the one in which their parents grew up. In the late 1960s, the launch of
Sputnik spurred the United States into a race for space that incorporated, improved, and
advanced mathematics that was used in science, engineering, and new technologies.
After having been to the moon and helping create the International Space Station, the
United States Space Program must again take a renewed look at where we stand in this
key area. While mathematics is important to space and engineering, as a society we must
also be aware of the current status of mathematics within our classrooms. The 1997
Third International Mathematics and Science Study (TIMMS) study (Tarr, Uekawa,
Mittag, & Lennex, 2000) showed that in the United States there was a gap between fourth
grade students‟ performance and fourth graders from various other countries around the
world. The study went on to show that this gap widens when comparing our eighth grade
students‟ performance (Tarr et al., 2000).
The United States Department of Education (2000) documented how the level of
mathematical thinking and problem solving in the workplace is increasing dramatically.
Every aspect of our lives is inundated with technology. From fast food to nano-science,

2
technology is an ever present part of our daily lives. Today‟s students have never known
a time without cell phones, microwaves, or the internet. The National Council of
Teachers of Mathematics (2000) recommends that the availability of technology supports
the need for new ways to teach, while integrating this technology into the classroom.
History shows there have been many types of “tools,” such as the abacus, that
have been used to “do” mathematics computations (Maxfield & Brown, 1997; Rostky,
1997). The slide rule of the 17th
century dominated and was the tool of choice for the
next 300 years (Museum of HP Calculators, 2004). The need for accuracy brought about
the Pascaline in 1643, which was the first mechanical adding device used for practical
purposes (Redin, 2004a). In the late 17th
century, Gottfried Leibniz designed a machine
that would add, subtract, multiply, and divide. William Burroughs is credited with the
first practical calculator that was really an adding machine that included a full keyboard
and had printing capabilities (Rostky, 1997). In 1963, Sumlock Comptometer of England
introduced the first fully electronic calculator called the ANITA, meaning A New
Inspiration to Arithmetic (Redin, 2004b).
With the invention of the transistor, the electronic calculator exploded on the
scene. In 1964, gas-discharged tubes were used to help create the first almost-all-
transistor calculator (Rostky, 1997). Canon and Texas Instruments came on the scene
and introduced the “Pocketronic” in 1970 to Japan and in 1971 to the United States
(Redin, 2004c). In 1972, Hewlett-Packard introduced the HP-35, named 35 for the
number of keys on its keypad, as the first pocket calculator with scientific functions
selling for $395 (Ball, 2004). The four-function calculator started the process of making

3
the slide rule obsolete, but the scientific calculator completed the process. Casio
introduced the first graphing calculator in 1986 (Waits & Demana, 1998).
In 1998, handheld technology took an amazing leap when Texas Instruments
started using flash technology for the purpose of updating a calculators‟ operating
system. In time, this same flash technology has allowed programs to be written within an
individual calculator and to share these applications between calculators, or to be
downloaded from computers (Waits & Demana, 1998). This flash technology created a
time when “portable and affordable computers with pedagogical software designed to
enhance the teaching and learning of mathematics” (Waits & Demana, 1998, p. 2) were
made readily available and practical for the classroom teacher.
TECHNOLOGY WITHIN THE CLASSROOM
What started with a chalkboard and slate has now progressed to computers and
projectors. Along the way, there have been many other devices such as the slide rule,
overhead projector, chalk dust graph grid, protractor, printer, and copier to name a few.
Teachers used such items for instruction and allowed students to use them for
computations. The handheld calculator came into the classroom and progressed from the
basic four function device to scientific, to graphing, and, finally, to computer algebra
systems. The use of such items varies from classroom to classroom, subject area, and
school district.
With technology such as the ditto master, teachers were able to provide
worksheets and handouts. Present day copiers and laser printers have made this process
cleaner, neater, and much faster. Advanced use of websites allows for lectures online.
Web based homework systems are also available for students to gain repeated practice as

4
well as immediate feedback to work. Today a student can take a mathematics class
virtually and never step into the classroom or meet the teacher face to face.
The development of the overhead projector enabled teachers to have pre-made
notes that allowed for easier lectures while teachers faced the students. This allowed
teachers to have problems worked out step by step that they could show simply. A
teacher could present a problem and, as students worked on the problem, circulate the
classroom to check on progress and understanding. Then the instructor could then show
the completed answer, which was prepared in advance, on the overhead for the students
to see the entire process, thus saving time within the classroom. This also allowed for
more teacher interaction among the students as they worked the problems.
As calculators have become increasingly more common, they have made their
way into the classroom, soon followed by computers as well. Advances with calculators
have produced devices that allow students to see the teacher‟s view screen to understand
the process the teacher uses with the calculator. Graphing calculators allow the teacher to
use graphs with extreme accuracy, precision, and repeatability in a short period of time.
There are also projection devices available that show a dual screen. One screen shows
the actual keystrokes that were input on the calculator, while the other shows what the
calculator screen would actually be doing. The dual screen allows for students to easily
follow along and to literally see where they are in the process.
MATHEMATICS LEARNING
Typically mathematics has been taught using the lecture format. The teacher
presents the mathematics idea, provides an example or two, and then assigns the
problems for the students to perform. This method of teaching is often referred to as

5
“drill and kill” or traditional where student complete multiple problems over and over to
help students master the concept (Waits & Demana, 1998, pg 5).
Another theory about learning reform mathematics involves the Theory of
Constructivism. In this approach students are engaged in activities where they actually
construct or discover the mathematical knowledge by building relationships out of the
material presented. This theory allows students to be the processor of knowledge by
creating their own methods of learning and understanding mathematics.
The recent use of computers, projectors, and interactive white boards continue to
make teaching more interactive and user friendly, allowing the teacher more time to
circulate around the classroom and assist students, all the while continuing the lecture
while standing away from the board. This new technology also allows for more student
led discussion and activity within the class. The ability to do many problems in a short
period of time allows topics to be looked at in-depth and students are allowed to
“discover” how manipulating an equation affects a graph.
NEED FOR THE STUDY
As technology advances at lightning speed, mathematics performance and
achievement in schools “shortchanges our students‟ future and endangers our prosperity
and our nation‟s security” (United States Department of Education, 2004a, p. 1). In
Principles and Standards, the National Council of Mathematics Teachers includes
technology as one of “the six principles for school mathematics” (NCTM, 2000, p. 10).
These principles are not specific content or process, but are critical issues within schools.
NCTM espouses, “Technology is essential in teaching and learning mathematics; it
influences the mathematics that is taught and enhances students' learning” (NCTM, 2000,

6
p. 11). The interaction between the six principles and the standards will help to develop
high quality school mathematics programs (NCTM, 2000).
The Principles and Standards state that technology “enhances mathematical
learning” (NCTM, 2000, p. 24), “supports effective mathematics teaching” (NCTM,
2000, p. 25), and “influences what mathematics is taught” (NCTM, 2000, p. 25). The
Principles and Standards (NCTM, 2000) goes on to say that students can make and test
conjectures and work at higher levels of generalization or abstraction within a
technologically-enhanced instructional environment.
A review of the literature on the impact of technology on mathematics teaching
and learning found significant evidence that calculators, both scientific and graphing, are
being used within the mathematics classroom. In particular, several studies focused on
graphing calculators at the elementary level (Fleener, 1995a), middle school level
(Fleener, 1995b; Merriweather & Tharp, 1999), and high school level (Doerr & Zangor,
2000; Farrell, 1996; Fleener, 1995a; Fleener, 1995b; Goos, Galbraith, Renshaw &
Geiger, 2000; Huntly, Rasmussen, Villaruni, Sangtong & Fey, 2000; Kendal & Stacey,
1999; Lauten, Graham, & Ferrini-Mundy, 1994; Lloyd & Wilson, 1998; Slavit; 1996,
Thompson & Senk, 2001). Research exists at the college level regarding the use of
graphing calculators in college classes (Adams, 1997; Hollar & Norwood, 1999; Keller &
Hirsch, 1998; Keller & Russell, 1997; Keller, Russell, & Thompson, 1999; Lauten,
Graham, & Ferrini-Mundy, 1994; Quesada & Maxwell, 1994; Shoaf-Grubbs, 1994;
Slavit, 1998; Zbiek, 1998). This review of the research revealed little, if any, research on
the use of graphing calculators within the first year of algebra in high school. If
technology is to take a leading role in the mathematics classrooms (American

7
Mathematical Society, 1994), then research needs to be done to investigate what level of
technology needs to be used as well as what technology is effective. This evidence-based
research can then be disseminated to have teaching that works within the classroom.
OVERVIEW OF STUDY
In this southern state, all high school students are required to take four years of
high school mathematics. Algebra I is the lowest level of mathematics a student can take
to obtain a credit towards high school graduation. For most students, this is typically
their first course in mathematics in high school.
This study took place at “Eagle High School,” a comprehensive four-year high
school, located in this southern state. Eagle High School has a current enrollment 1673
students and is on the block scheduling format. Block scheduling provides an extended
period for a class and fewer classes each day. Different types of block scheduling allow
for variations in student schedule such the classes attended each day were alternated, the
classes could be completed within one semester, or were a combination or both block
scheduling and traditional scheduling. At Eagle High School, the block scheduling
format provided four classes each day that met for ninety minutes within each class
period. Specifically, the teachers selected taught Algebra I, which is the first year of
algebra for a high school student. Utilizing data and statistics from the southern state‟s
Department of Education, the school was categorized by socio-economic status, racial
demographics, and location within Chapter 3.
This study was a quasi-experimental study. For the quantitative portion the
researcher gathered and analyzed teachers‟ class pre-test averages and compared them
with the teachers‟ class post-test averages and the teachers‟ class post post-test averages.

8
Teachers were selected to teach their classes either with or without the utilization of a TI-
Inspire calculator. The study used the Kentucky High School Diagnostic Mathematics
Assessment Tool for Algebra, which had been created and developed by the University of
Louisville and was being used by the Kentucky Department of Education. There were
three versions of this test. These three different versions were used for the pre-test, post-
test, and post post-test. The test addressed the use of functions within algebra. For the
qualitative portion of this study, the research completed a 90 minute classroom
observation of each class as well as document analysis of a weekly questionnaire, daily
lesson plans, and daily assessments. Document analysis, triangulation, and thick
description were used to analyze the qualitative portion of the study.
STATEMENT OF PROBLEM
There has been a rapid change in technology that has occurred in the past thirty
years. The launch of the calculator has changed the emphasis of mathematics in school
classrooms. Rather than spending the majority of time on rote and procedural learning,
teachers and students can now apply such answers to situations and problems in real life.
A once difficult task of mathematical computation has been simplified to a combination
of punching buttons. With the realization of the dreams of Babbage and Leibniz, the
computing machine is available to the common man in many shapes and formats from
desktop, pocket, watch, and hand held formats (Davis, 2000). With the advances in
technology, there are increased opportunities for their employment within the
mathematics classroom (Privateer, 1999).
As technology influences both the instructional practices and what concepts are
taught (NCTM, 2000), educators need to be informed about which technologies used

9
within the mathematics classroom environment lead to increased student understanding.
Instructional technology used in the classroom needs to be thoughtfully selected,
appropriately used, and pedagogically sound. Sang Sook Choi-Koh says that the
“universal availability of technology is having a profound impact on what should be
taught in mathematics curricula and how mathematics processes should be taught” (Choi-
Koh 2003, p. 1).
The questions for educators today, regarding the TI-Nspire calculator, are the
same questions that faced educators when the four function calculator and the scientific
calculator were made available (Waits & Demana, 1998). Does one allow students to use
the TI-Nspire calculators? If so, when and how much does one allow them to use them?
What effect does the calculator have on how the students learn and what the students
learn? Under what circumstances should students be allowed to use them? What is the
impact on assessment, testing, and on content that is taught?
PURPOSE OF STUDY
The purpose of this study was to determine the effect of the implementation of the
TI-Nspire graphing calculators on student achievement and teacher behavior variables of
teacher planning, teacher teaching, and assessments used. With the many variables that
exist within the classroom, the design of this study sought to control for as many factors
as possible while investigating the treatment of the use of a TI-Nspire graphing calculator
by a trained teacher while teaching the concept of functions with respect to
representations, Depth of Knowledge, and TPACK.
RESEARCH QUESTIONS AND HYPOTHESES
This study utilized the following research questions and null hypothesis.

10
Research Questions
1) Was there a difference in student test scores on function concepts in Algebra I
classrooms that used TI-Nspire graphing calculators versus those who did not
use this device? The independent variable was treatment and the dependent
variables were the pre-test, post-test, and post post-test.
a. Treatment Effect
b. Teacher Effect
c. Interaction of Teacher and Treatment
d. Factors: special education status and socioeconomic status
2) Did the use of TI-Nspire graphing calculators affect the way teachers taught
function concepts in Algebra I classrooms with respect to representations,
Depth of Knowledge, and TPACK? The independent variable was treatment
and the dependent variables how teacher taught.
3) Did the use of TI-Nspire graphing calculators affect the way teachers planned
lessons for function concepts in Algebra I classroom with respect to
representations, Depth of Knowledge, and TPACK? The independent
variable was treatment and the dependent variables how teacher planned.
4) Did the use of TI-Nspire graphing calculators affect the way teachers assessed
students on functions concepts in Algebra I classrooms with respect to
representations, Depth of Knowledge, and TPACK? The independent
variable was treatment and the dependent variables how teacher assessed.

11
Null Hypothesis
The above research questions were the basis for this study and lead to the
following null hypothesis: There was no statistically significant difference in student test
scores on function concepts in Algebra I classrooms that used TI-Nspire graphing
calculators versus Algebra I classrooms that did not use this device. There was no
difference in the way teachers taught function concepts in Algebra I classrooms that used
TI-Nspire graphing calculators versus Algebra I classrooms that did not use this device
with respect to representations, Depth of Knowledge, and TPACK. There was no
difference in the way teachers planned lessons for function concepts in Algebra I
classrooms that used TI-Nspire graphing calculators versus Algebra I classrooms that did
not use this device with respect to representations, Depth of Knowledge, and TPACK.
There was no difference in the way teachers assessed students on functions concepts in
Algebra I classrooms that used TI-Nspire graphing calculators versus Algebra I
classrooms that did not use this device with respect to representations, Depth of
Knowledge, and TPACK.
DEFINITIONS OF TERMS
Algebra I – the first year of algebra taken by a high school student. The following is a
description taken from various southern states‟ Department of Education:
Algebra I is a course that uses problem situations, physical models, and
appropriate technology to extend algebraic thinking and engage student
reasoning. Problem solving situations will provide all students an
environment which promotes communication and fosters connections
within mathematics, to other disciplines and to the real world. Students
will use physical models to represent, explore, and develop abstract
concepts. The use of appropriate technology will help students apply
mathematics in an increasingly technological world. The concepts
emphasized in the course include functions, solving equations, and slope
as rates of change, and proportionality (Tennessee State Department of
Education, 2004)

12
Algebra I is a formal, in-depth study of algebraic concepts and the real
number system. In this course students develop a greater understanding of
and appreciation for algebraic properties and operations. Algebra I
reinforces concepts presented in earlier courses and permits students to
explore new, more challenging content which prepares them for further
study in mathematics. The course focuses on the useful application of
course content and on the development of student understanding of central
concepts. Appropriate use of technology allows students opportunities to
work to improve concept development. As a result, students are
empowered to perform mathematically, both with and without the use of
technological tools (Alabama State Department of Education, 2006).
In Algebra I, students build upon the mathematical understandings that are
addressed in prekindergarten through the eighth grade. Students will
use symbolic reasoning to represent mathematical situations, to express
generalizations, and to study relationships among quantities; use functions
to represent and model problem situations as well as to analyze and
interpret relationships; set up equations in a wide range of situations and
use a variety of methods to solve them; and use problem solving,
representation, reasoning and proof, language and communication, and
connections both within and outside mathematics. In Algebra I, hand-held
graphing calculators are required as part of instruction and assessment.
Students should use a variety of representations (concrete, numerical,
algorithmic, graphical), tools (matrices, data), and technologies to model
mathematical situations to solve meaningful problems. The technologies
include, but are not limited to, powerful and accessible hand-held
calculators as well as computers with graphing capabilities (South
Carolina State Department of Education, 2009).
Ditto master – machine that used carbon paper for the purpose of making mass
production of worksheets.
Mathematical knowledge – the relating and utilization of mathematics that is used to
construct, develop, and relate analogies, illustrations, multiple ways of doing
mathematic problems
SIGNIFICANCE OF THE STUDY
The results of this study could provide guidance for the utilization of TI-Nspire
calculators within the first year of algebra. The results could promote the idea of schools
supporting and providing the integration, training, and access to TI-Nspire calculators

13
within the mathematics classrooms. Significance would also promote more Algebra I
teacher training and professional development with the use of TI-Nspire calculators.
ORGANIZATION OF THE DISSERTATION
This study is organized into five chapters. Chapter 1 is the introduction of the
study and provides the background, history and development of technology. Chapter 2
contains the literature review regarding key research as related to the study. Chapter 3
consists of an explanation of the methodology that was used to test the hypotheses.
Chapter 4 includes and describes the quantitative results of the study. Chapter 5, the final
chapter, consists of conclusions, implications, and suggestions for needed further
research.
SUMMARY
Before hand held calculators, mathematical knowledge and application were held
by engineers, bankers, and tax collectors among others? Many advances in technology
led to the creation of the hand held calculator that is so widely used today. The creation
of the hand held calculator revolutionized the availability of mathematical knowledge,
computation, and understanding that made it easier for the everyday common man to
solve mathematical problems with the punch of a button. This study sought to show that
the utilization of the TI-Nspire calculator within the first year of algebra is an effective
tool to allow students to be successful in mathematics, specifically in the learning of
functions.

14
CHAPTER 2
LITERATURE REVIEW
INTRODUCTION
Long gone are the days of getting the news by only watching the evening news or
reading the newspaper. As the world constantly changes, today‟s news can be accessed
with daily updates sent to one‟s blackberry, watched on CNN around the clock or found
instantly via the internet. Checking out from the local store is less about counting change
and more about processing with a computer. If students are not prepared to be productive
members in this ever changing global and technical society, is education really
succeeding? In a society with ever increasing technology, it seems fitting to incorporate
that technology into the classroom. Since technology has its base within mathematics,
mathematics should be the starting place to the integration of technology into the
classroom (Heid, 1997).
Advancement in technology through research and development is generally first seen
within the business and industry or the government. The National Science Board (2010)
reported in 2008 that $398 billion was spent on research and development. Business and
industry represented 67.4% of this spending. The federal government spent 26.1%, while
colleges and universities were at 3.5% and nonprofit organizations represented only 3%.
With the lack of investment into research and development into education it is easy why
it takes so long for new technology to reach the classroom. The “time-lag” tends to

15
separate the creation and induction of technology into practical education and use within
the classroom (Privateer, 1999). Vogel and Klassen (2001) state that content changes so
much that it can become outdated before a student even graduates.
IMPORTANCE OF MATHEMATICS
Mathematics has always held importance in society for the purpose of trade,
industry, and business. In the early days of the United States, the main textbooks were
imported from England, and mathematics was taught for the understanding of weights,
measurements, navigation, and bookkeeping. However, over time, the importance of
mathematics has greatly increased.
According to Jones and Coxford (1970), in 1726, arithmetic and surveying were
the only mathematics taught at Yale. By 1776, algebra and trigonometry were added to
the course selection available at Yale. By the end of the 18th century, the rise of science
created a new demand for increased need for mathematics which was reflected in new
curricula in the early 19th century at such colleges as Princeton, West Point, and
Virginia. In 1820, Harvard began requiring algebra for admission. This was soon
followed by Yale in 1847 and Princeton in 1848 (Jones & Coxford, 1970).
With the emergence of mathematics into the curriculum came organizations that
helped to shape the role of mathematics. In 1888, the American Mathematical Society
was created to unite mathematics teachers within already established teacher
organizations. In 1892, the National Education Association formed the Committee of
Ten (Osborne & Crosswhite, 1970). In 1920, the National Council of Teachers of
Mathematics was created to address the concern of mathematics in the school curriculum
(Stanic, 1986). These organizations began to have an effect on what and when the

16
mathematics was taught. With academic mathematics, students would complete algebra,
geometry, trigonometry and another year of algebra. This led to the requirements of
algebra, geometry and trigonometry being the basis within high school for college
admission. (Osborne & Crosswhite, 1970).
With the many changes occurring on the collegiate level, things had to change at
the grammar school level as well. Part of this was accommodated with the creation of a
new type of secondary school, which is now called high school, in 1821. The mid-19th
century saw a booming increase in these high schools. As colleges continued to push
down requirements such as arithmetic, algebra, and then geometry, the secondary schools
started doing the same. By the end of the 19th century, the teaching of arithmetic was
pushed down from the secondary school to the elementary school (Jones & Coxford,
1970). “A remarkable notion had emerged around 1900: that schooling could make the
ordinary office clerk, shop-floor worker, and even the farmer more productive” (Goldin,
2003).
With the Great Depression, came an influx of students into the school system.
Data from James and Tyack (1983) show that from 1890 to 1940, the number of students
attending high school had increased nearly twenty fold. While there were more students
attending elementary and high school, there were fewer students going on to college,
which caused an increased focus of vocation and a trend towards general mathematics as
an alternative to algebra. While the beginning of the 20th century showed 59 % of
students taking algebra, by the mid-20th century, that percentage had dropped to 24
(Jones & Coxford, 1970).

17
With the occurrence of the two world wars, there was a realization of the need for
a greater knowledge of mathematics. The wars served to revitalize the need for
mathematics to the public not only in war time, but also demonstrated the everyday
benefits of communications and electronics for peace time. The post-war society was
readily becoming a scientific society. Not only were people concerned with atomic
energy, missiles, and radar, but other educational disciplines, such as psychology and
sociology, were utilizing mathematics for the creation of models and in calculating
statistics (Jones & Coxford, 1970).
With the Cold War and the launch of Sputnik in 1957, public attention was
quickly turned to the educational needs of the United States (United States Department of
Education, 2009). The government realized the need to increase support, in particular,
financially. In 1958, the passing of the National Defense Education Act by President
Eisenhower provided much needed funding for mathematics and science. Parts of this act
provided student loans, funding to strengthen science, mathematics and modern foreign
language instruction, and the identification and encouragement of able students (Flattau,
Bracken, Atta, Bandeh-Ahmadi, de la Cruz, & Sullivan, 2006).
In the 1950s, several programs were created to research and improve mathematics
education. The National Science Foundation, NSF, was created to develop national
polices for the promotion of basic research and education in the sciences. Osborne and
Crosswhite (1970) claimed that the unprecedented amount of money put into both
curriculum development and teacher training allowed for several curriculum projects to
be produced from the late 1950s through the 1970s. One of the largest such projects was
the School Mathematics Study Group, SMSG. Another program created by The Colleges

18
of Education, Engineering, and Liberal Arts and Sciences of the University of Illinois
was the University of Illinois Committee on School Mathematics, UICSM (Golden,
2006).
With the two large-scale projects of SMSG and UICSM came curricula and
materials that expressed a more modern view and role of mathematics. In the mid-1960s,
the Secondary School Mathematics Curriculum Improvement Study (SSMCIS) and the
Comprehensive School Mathematics Program (CSMP) created additional curricula (Fey
& Graeber, 2003). The focus of these curricula was less about computation and more
about conceptual understanding (Garrett & Davis, 2003). Out of UICSM, a four-year
high school curriculum was created that addressed the mathematical content and the
aspect of teaching philosophy. This, in turn, led to an increased focus of the importance
of teaching strategies (Osborne & Crosswhite, 1970).
The 1970s brought many changes including the emphasis on arithmetic and
algebra and increased standardized testing. The new curriculum developed during this
time included Individually Prescribed Instruction, IPI, and Developing Mathematical
Processes, DMP, (Fey & Graeber, 2003). The National Assessment of Educational
Progress, NAEP, was created in 1969, for the purpose of assessing various subject areas
within the educational curriculum across the nation. NAEP tests students in fourth grade,
eighth grade, and twelfth grade. From these assessments came data for the Nation‟s
Report Card as well as individual State‟s Report Cards (United States Department of
Education, 2008).
The National Council of Teachers of Mathematics, with the support of the
National Science Foundation, did a survey, known as Priorities in School Mathematics,

19
PRISM, to collect the beliefs and reactions to potential curriculum (National Council of
Teachers of Mathematics, 1981). The results of the PRISM project, as well as the first
two NAEP results, were the driving forces that created the Agenda for Action:
Recommendations for school mathematics of the 1980s (National Council of Teachers of
Mathematics, 1980). There were eight recommendations from the Agenda for Action:
problem solving as the focus of school mathematics, basic skills to include more than
computation, use of calculators and computers and their full advantage at all grade levels,
standards for teaching mathematics, evaluation of mathematics programs and student
learning to include more than testing, flexible curriculum and more research, high level
of professionalism for mathematics teachers, and public support for mathematics
instruction (National Council of Teachers of Mathematics, 1980).
As newly elected President Ronald Reagan reduced funding for education,
organizations sought out ways to increase educational awareness. In 1983, the National
Science Board, NSB, commissioned a study on the nation‟s educational need. The
National Council for Teachers of Mathematics also released a statement in 1981 stating
that the federal government needed to take a role in teacher preparation and research,
among other things. While these basically went unnoticed by the presidential
administration, Secretary of Education, Terrel Bell, established the National Commission
on Excellence in Education, NCEE, to create a report on the quality of education within
the United States. This report became known as A Nation at Risk. While it received
great media coverage by Reagan in his 1984 presidential campaign, once re-elected,
Reagan continued to reduce the funding of the federal government for education
(McLeod, 2003).

20
While A Nation at Risk did not bring increased federal support, it did stimulate
concern about the quality of education in the United States. McLeod (2003) states that
meetings held because of A Nation at Risk were important to the development of the
NCTM Standards Project. In 1989, NCTM produced the Curriculum and Evaluation
Standards for School Mathematics. The Curriculum and Evaluation Standards was
divided into three grade levels: K-4, 5-8, and 9-12 (NCTM, 1989). It was followed by
the release of Professional Standards for Teaching Mathematics in 1991 and Assessment
Standards for School Mathematics in 1995. The Professional Standards contained
standards for teaching mathematics, evaluating the teaching of mathematics, the
professional development of teachers and mathematics, and the support and development
of mathematics teachers and teaching (NCTM, 1991).
While the 1989 Standards provided a foundation for both teachers and
policymakers regarding mathematics education, NCTM felt the need to keep them viable
through periodic examination and revisions as necessary. After a decade of discussions,
NCTM (2000) released Principles and Standards for School Mathematics, PSSM. PSSM
was built on the foundation of the 1989 Standards, but it also incorporated the classroom
portion of both Professional Standards for Teaching Mathematics and Assessment
Standards for School Mathematics (NCTM, 2000).
While the importance of mathematics has mushroomed over the years, the need
for basic arithmetic is not the end to one‟s education, but merely the beginning of it. The
advancement of technology within society has only demanded that there be an increase of
mathematics within our classrooms. The requirements that were once necessary to obtain
entrance into colleges and universities are now necessary to simply graduate from high

21
school. The day of technology is here, and the need for higher mathematics learning
came with it.
HISTORICAL FRAMEWORK: SCHOOL MATHEMATICS
Three “Rs” of education have long been reading, writing and arithmetic; however,
there have been many changes in arithmetic. While in the early grades, dealing with
arithmetic can be associated with working with numbers. Numbers are all around us.
One of the first tasks children use relating numbers is displaying the number of fingers
that corresponds with their age. Whether looking at a clock to tell time, reciting their
phone number, learning an address or counting the number of chicken nuggets in a happy
meal, children are constantly bombarded with numbers that can easily be formulated into
the arithmetic content (Usiskin, 2002).
Arithmetic is now more commonly called mathematics as it has been expanded
within the curriculum to include more topics. When dealing with fractions, decimals,
percents, addition, and subtraction, people recognize this as the use of mathematics
within their daily lives. Usiskin (2002) states that while arithmetic is more about
numbers, people can see the direct need just by picking up a daily newspaper. Adults use
fractions, decimals, and percents in many areas of life from recipes, bills, taxes or
discounts while shopping. Russell, Geddes, and Grosset (1990) define mathematics as
“the science dealing with quantities, forms, etc. and their relationships by the use of
numbers and symbols” (Russell, Geddes & Grosset, 1990, p. 336).
When the concepts within arithmetic or mathematics are generalized such that
they include the use of unknowns, letters or variables, researchers refer to this as algebra
(Kieran, 1992; MacLane & Birkhoff, 1967; & Usiskin 1988, 1997). Different people

22
divide the algebra curriculum into different sections. Kieran (1989) suggests that algebra
starts with variables, simplifying algebraic expressions, solving equations with one
unknown and eventually solving multiple variable equations. Thorpe (1989) describes the
main topics of algebra as the real number system, relations, functions, graphs, algebraic
manipulations, word problems, quadratic formulas, complex numbers, tables, and
interpolation, and systems of linear equations.
Within mathematics, there are many specific content areas across the curriculum
from K-16. In particular, in elementary schools the curriculum focuses on arithmetic,
while in middle school and high school, the curriculum transitions into the concepts of
algebra, geometry, and some calculus. In the post-secondary setting, algebra, calculus,
and beyond are explored. Recently, efforts have led to a model of algebra that spans
grades K-12 (Carpenter, Franke, & Levi, 2003; Kaput, Carraher, & Blanton, 2007; &
RAND Mathematics Study Panel, 2003).
According to the United States Department of Education, there is a need for
scientifically proven results on the best ways to teach mathematics (United States
Department of Education, 2004b). The NCTM Standards have created a framework for
raising mathematics achievement. According to Burrill (1998), more students, than ever
before, are taking three or four years of mathematics in high school. In recent years, the
focus has been on reading with the incorporation of scientifically proven programs. The
focus is now shifting to mathematics, in particular algebra. Zalman Usiskin (1988)
claims that algebra is the key area of study in secondary school mathematics and that it
will continue to be for a long time to come.

23
The NCTM‟s Agenda for Action (1980) called for problem solving to become an
important activity within the mathematics classroom. Middleton, Dougherty, Heid,
D‟Ambrosio, Reys, de Loach-Johnson, Gutstein and Hala (2004) credit the Agenda for
Action as being the “first step in perhaps the greatest and longest-lasting ferment of
educational research and development ever (certainly since the early post-Sputnik days)”
(p.76). Within the Assessment Standards for School Mathematics, NCTM created five
general goals for all students: (1) that they learn to value mathematics, (2) that they
become confident in their ability to do mathematics, (3) that they become mathematical
problem solvers, (4) that they learn to communicate mathematically, and (5) that they
learn to reason mathematically (NCTM, 1995).
In looking at state mathematics requirements, several states have required that
every high school graduate must pass at least an entry level algebra course in order to
graduate. Recently, Tennessee conducted a high school redesign to implement more
stringent requirements in the field of science, technology, engineering and mathematics,
STEM. This new redesign requires students to successfully take a mathematics class
each of their four years in high school. Tennessee further strengthened their
mathematical requirements by recognizing the first year of algebra as the lowest level of
high school mathematics that will be honored as credit towards a high school diploma
(Tennessee Department of Education, 2009). This is a huge shift from algebra being the
gatekeeper (Hill, Griffiths, Bucy, et al., 1989; Stone, 1996; Atanda, 1999; Rech &
Harrington, 2000; Usiskin, 2004; Seeley, 2005; & Norfolk Public Schools, 2006).
While there is a need to increase mathematics achievement, this study sought to
specifically look at one topic within mathematics, namely functions. In thinking about

24
the need for reaching students with mathematics and the need for raising mathematics
achievement, it is important to take a deeper look at algebra. According to Jones and
Coxford (1970) during colonial times, mathematics, even at the college level, focused
very little on algebra. Osborne and Crosswhite (1970) go on to say that students mainly
studied algebra for the purpose of getting into college. At the college level, in a typical
mathematics textbook of 429 pages, only 8 % or 33 pages were devoted to the study of
algebra (Jones & Coxford, 1970).
In 1981, NCTM released the results of the PRISM project which provided several
insights into the way algebra was taught. “Strong support was given to four goals for
teaching algebra: these concerned applying mathematics, building background for taking
more mathematics, gaining vocational skills and preparing for college” (NCTM, 1981, p.
9). Strong support was also shown for the algebraic topics of signed numbers, evaluating
formulas, linear equations, writing equations to solve word problems, and exponents in
the curriculum for all students (NCTM, 1981). Furthermore, the PRISM project reported
that teachers “totally rejected” the idea of dropping formal work with algebra from the
curriculum (NCTM, 1981, p. 10). PRISM also reported that while the use of calculators
was strongly supported for checking answers within an algebra class, the use of
calculators during an algebra test were quite mixed as to agreement and rejection
(NCTM, 1981).
Ten years later in the Principles & Standards for School Mathematics, NCTM
(2000) explained the need for more emphasis on relationships within algebra. PSSM
described algebra as having its historical roots within the study of solving equations.
PSSM clearly states that algebra should be embedded within the prekindergarten through

25
twelfth grade curriculum in such a way that all students are able to “understand patterns,
relations, and functions; represent and analyze mathematical situations and structures
using algebraic symbols; use mathematical models to represent and understand
quantitative relationships; and analyze change in various contexts” (NCTM, 2000, p. 36).
PSSM goes on to say that within the Algebra Standard, the emphasis should be on the
relationships between quantities, representing relationships, and the analysis of change.
PSSM specifically states that the “functional relationships can be expressed by using
symbolic notation, which allows complex mathematical ideas to be expressed succinctly
and change to be analyzed efficiently” (NCTM, 2000, p. 36).
Russell (1990, p. 28) defines algebra as “the branch of mathematics dealing with
the properties and relations of numbers; the generalization and extension of arithmetic.”
Fey (1989) stated that algebra should be the core of the high school mathematics
curriculum because of its contribution to problem solving, which is used in every
scientific discipline. Kieran (1992) stated that the content of algebra has not changed
significantly; however, “mathematics and its applications have changed dramatically”
(Thorpe, 1989, p. 11). The need for algebra goes beyond the need to gain entrance into
college, although colleges continue to use algebra as a gatekeeper and placement tool
(Atanda, 1999; Usiskin, 2004; & Norfolk Public Schools, 2006).
The National Council of Teachers of Mathematics (1989) states that most of
mathematics is communicated through the language of algebra. NCTM went on to
describe algebra as the vehicle through which the application of abstract concepts can
cultivate generalizations and understanding beyond the original context. Algebra should

26
be seen as a means of representation with an emphasis on conceptual understanding and
problem solving (NCTM, 1989).
Recently, there has been a push to have algebra included across all levels of the
mathematics curriculum. In a position statement from the National Council of Teachers
of Mathematics, algebra was described as
“… a way of thinking and a set of concepts and skills that enable students to
generalize, model, and analyze mathematical situations. Algebra provides a
systematic way to investigate relationships, helping to describe, organize, and
understand the world. Although learning to use algebra makes students
powerful problem solvers, these important concepts and skills take time to
develop. Its development begins early and should be a focus of mathematics
instruction from pre-K through grade 12. Knowing algebra opens doors and
expands opportunities, instilling a broad range of mathematical ideas that are
useful in many professions and careers. All students should have access to
algebra and support for learning it. (NCTM 2008, p.1).
The Algebra Project, Equity 2000, and Algebra for All advocated for the inclusion of
algebra beyond the high school level and into elementary and middle school levels (Silva,
Moses, Rivers, & Johnson, 1990; Choike, 2000; Pugalee, 2001; & NCTM, 2008). The
underlying conviction of The Algebra Project is summed up in their statement that “all
children can learn algebra.” (Silva, Moses, Rivers, & Johnson, 1990, p.375). As algebra
is pushed down to the lower grades, mathematics at the secondary level must continue to
be strengthened as well. Seeley (2005) said that having students take four years of
mathematics while in high school was a good idea and that starting with algebra was part
of our moral and ethical responsibility. Various articles have been published to help
implement algebra for all, including various strategies and activities (Blubaugh &
Emmons, 1999; Cox & Bridges, 1999; Driscoll, Foster, & Moyer, 1999; McConnell &
Bhattcharya, 1999; Philipp & Schappelle, 1999; Leitze & Kitt, 2000; & Lesser, 2000).

27
The inclusion of functions into the mathematics curriculum occurred at the end of
the 19th century. With the addition of graphs to geometry, other aspects of analytical
geometry and calculus into the curriculum, functions were beginning to find their natural
place (Hamley, 1934; Osborne & Crosswhite, 1970). Felix Klein is credited for pushing
the concept of functional thinking as a part of mathematics in Germany. According to
Hamley (1934), D. E. Smith and E. R. Hedrick were the first advocates of the function
concept in the United States. The National Committee on Mathematical Requirements
committed an entire chapter to the concept of functions at the high school level
(American Association for the Advancement of Science, 1922; & Osborne & Crosswhite,
1970). According to Hamley (1934), this chapter was a comprehensive overview
implying that functions were an integral part of formulas, equations, graphs, proportions,
congruence, and similarity. In the 1930s, the concept of function “permeated” the algebra
curriculum (Osborne & Crosswhite, 1970).
The concept of function is both essential and fundamental to the algebra
curriculum and is considered by many to be the most important concept in all of
mathematics (Hamley, 1934; Froelich, Bartkovich, & Foerester, 1991; & O‟Callaghan,
1998). Within algebra, functions are typically represented as equations, tables or graphs
(Fey, 1984). Hamley (1934) compares the concept of function to the concept of the
relation and claims that they are elementary to human thought. He further states that “the
concept of relation is fundamental to human thought” (Hamley, 1934, p.3). Often the
definition of a function is really the definition of a functional relation. Hamley (1934)
believes it would make for clearer understanding if the term functional relation was used
instead of function.

28
The familiarity of relations and functions is common among mathematics teachers
(May & Van Engen, 1959; & Herscovics, 1989). Herscovics (1989) brought light to the
fact that most primary level teachers use the “function machines” with inputs and outputs
(Herscovics, 1989, 7p. 5). When students solve problems such as + 3 = 10 or even x +
7 when x is 2, they may not realize that they are working with a function, but the
underlying concept is still there. Furthermore, function tables, two variable equations,
and graphs also expose students to the intuitive concept of functions (Herscovics, 1989;
& Blanton & Kaput, 2005). Mathematics now uses the concept of sets to define the terms
of function and relation. Various examples of sets used in daily life include the height-
weight and time-temperature. Within the realm of science, there are uses of linear,
quadratic, polynomial, exponential, and other classes of functions. With these
connections, the concept of functions can provide a more efficient and deeper
understanding of the concept (May & Van Engen, 1959).
O‟Callaghan (1998) created a framework for functions that had four conceptual
areas: modeling, interpreting, translating, and reifying. Each conceptual area was
associated with a set of procedural skills as well. The research of function was broken
down into six themes in the Research in Colligate Mathematics Education (Dubinsky,
Schoenfeld, & Kaput, 1994, 23):
1. Concept image and concept definition
2. Function as action, as process, and as object
3. Function as co-variation of quantities and function as correspondence
4. Understanding phenomena and representing phenomena
5. Operations on numbers and operations on functions
6. Emergent Issues
These are just a few of the areas of functions still to be examined by research.

29
With the call for more mathematics in the curriculum, the level of mathematics
continues to be pushed down. While algebra, still a gatekeeper course, is now the
beginning course for many high school students, algebra is also being included in the
elementary mathematics curriculum as well. With an increased focus on algebra, the
fundamental concept of functions can be seen throughout all grade levels, therefore,
serving as an ideal topic to research.
HISTORICAL FRAMEWORK: LEARNING
Three theories addressing how students learn are the Behavior Theory, the
Cognitive Theory, and the Constructivist Theory. For the first half of the 20th century,
the psychological learning theory was behaviorism. “Behaviorists held that the scientific
study of psychology must restrict itself to the study of observable behaviors and the
stimulus conditions that control them” (Bransford, Brown, & Cocking, 2000, p. 6).
Pavlov, Thorndike, and Bloom are three of the noted psychologist that dealt with
behaviorism. Pavlov‟s conditioning, or reflexology, trained a dog to salivate at the
ringing of a bell (Sacknery & Mergel, 2007). Thorndike‟s theory was known as
connectionism, but it is best remembered as the stimulus-response explanation of learning
(Lankford, 1959).
While Pavlov and Thorndike are best known for stimulus-response, Bloom was
more focused on the thought process. Educators often use Bloom‟s Taxonomy for the
purpose of classifying students‟ cognitive ability. There are six levels to Bloom‟s
Taxonomy: Knowledge, Comprehension, Application, Analysis, Synthesis, and
Evaluation (Krathwohl, 2002). With the progression to each level, students must have
successfully completed the previous levels. Bloom‟s Taxonomy is one of the most
30
widely accepted guides used to classifying cognitive ability (Granello, 2000). With an
understanding of the different levels, teachers can design and ask specific questions that
determine the level as well as compel students to achieve new levels. The Taxonomy of
Educational Objectives expands on Bloom‟s Taxonomy in such a way that it can be used
as a “scheme for classifying educational goals, objectives, and most recently, standards”
(Krathwohl, 2002, p. 218).
Behaviorism was unable to explain why a child did not respond as stimulated or
why the child responded when they had not been stimulated. These and other
unanswered questions led to the development of the Cognitive Theory that viewed
learning as involving the “acquisition or reorganization of the cognitive structures
through which humans process and store information" (Good & Brophy, 1990, p. 187).
Tolman, Piaget, Bruner, and Gardner are some of the noted cognitive psychologists.
Cognitive psychology focuses more on the intellectual development of a person, in
particular how they acquire, process, and store information. For example, Tolman
worked with rats and mazes. He discovered that the rats created a mental map of the
maze. When a part of the maze was blocked off, the rats would take a different route that
led to success (Sackney & Mergel, 2007).
Piaget studied the mental development of children. From his study, Piaget
identified “four stages of cognitive development: the sensorimotor, the preoperational,
the concrete operational, and the formal operational” (Stiff, Johnson, & Johnson, 1993, p.
6). Stiff, Johnson, & Johnson (1993) go on to say that Piaget‟s theory centered on the
processes of assimilation and accommodation. Piaget encouraged the discovery and
interaction within the classroom, both with other people and with manipulatives. Piaget

31
and other cognitive development theorists have provided the framework from which we
have gained research on conceptual understanding (Wagner & Parker, 1993).
According to Stiff, Johnson, & Johnson (1993), Bruner created four theorems
about learning mathematics: construction theorem, notation theorem, contrast and
variation theorem, and the connectivity theorem. The first, construction, talks about how
students are to create their own mathematical models. The second, notation, is that good
use of notation can simplify the cognitive process when learning new materials. The
third, contrast and variation, describes the process of going from concrete to abstract as
one that varies based upon one‟s experiences. The fourth and last one, connectivity,
describes how every mathematical concept, principle and skill are related to each other.
These four theorems helped to support the constructivist view of cognition (Stiff,
Johnson, & Johnson, 1993).
Howard Gardner‟s theory of multiple-intelligences provides a different view of
human learning than that of Piaget. Gardner posited that there were seven intelligences:
logical-mathematical, linguistic, musical, spatial, bodily-kinesthetic, interpersonal and
intrapersonal (Gardner & Hatch, 1989). He stated that there are multiple ways to
introduce concepts to students to take advantage of the variety of ways of knowing that
students bring to the classroom (Gardner, 1995).
The writings of Dewey, Piaget, and Bruner helped to lay the ground work for
constructivism (Mergel, 1998). The Constructivist Theory is based on the idea that
students learn new information by scaffolding, which is building new knowledge upon
previous knowledge (Long & Barrett, 2007). Brooks and Brooks (1999) go on to
describe the learning within constructivism as “ever-transforming mental schemes” that

32
are necessary within a student‟s cognitive growth (Brooks & Brooks, 1999, p. 18).
Within the classroom stetting, constructivist approaches to learning would have students
using group work, discussions, and word problems to help create their new knowledge
(Lee, 1999). Long and Barrett (2007) compare a behaviorist approach of teaching
mathematics to a constructivist approach. While there is no one specific approach to
either theory, those who espouse both theories attempt to guide instruction in such ways
as to take advantage of their beliefs of how students learn. Because behaviorists believe
that a student can be conditioned to learn the right answer, classroom instruction includes
positive reinforcement. Since constructivists learning builds on previous knowledge,
classroom instruction occurs through a participatory role where the student learns by
discoveries that challenge previous held beliefs. It is important to note that this is not
discovery learning, but learning where the teacher is constantly monitoring, guiding, and
modifying the students‟ responses to the material (Long & Barrett, 2007).
There are many theories on how students learn and how instruction within the
classroom should occur. Many contributions by behavioral psychologists and cognitive
psychologists have greatly impacted how mathematics is taught in the classroom today.
Teachers strive to teach more than rote memorization and more application. Students are
participatory learners and teachers create environments where they can build on previous
knowledge and higher order thinking skills.
HISTORICAL FRAMEWORK: TECHNOLOGY
Skemp (1976) describes two different ways to teach for understanding,
instrumental and relational. Instrumental understanding deals with the steps to the
process, while relational understanding is more about the why behind the process. When

33
teaching for instrumental understanding, the teacher drills the algorithm until the student
is able to repeat the steps. Relational understanding is more about the application of the
algorithm, which leads to true understanding (Skemp, 1976). Once a student has gained
relational understanding, technology within the classroom can assist in quickly moving
through cumbersome calculations to the deeper applications. The teacher must be aware
of which algorithms to continue teaching and which procedures to explain with an
algorithm, but carry out using technology (Burrill, 1998). National Council of Teachers
of Mathematics (NCTM) has stated that instruments designed to assess students‟
mathematical understanding and application must acknowledge students‟ access to and
use of calculators (National Council of Teachers of Mathematics, 1998).
HISTORICAL FRAMEWORK: TECHNOLOGY IN LEARNING
From the abacus to the calculator, instructional technology in the mathematics
classroom has been around for a long time. One of the first technology tools for
mathematics goes back to the abacus, which was used before the formal acceptance of a
written number system. In the 17th century came the slide rule, the Pascaline, and
Leibniz‟s calculating machine (Davis, 2000). The use of multi-media such as music,
television, and movies created an interactive teaching environment. The development of
the microchip for the computer truly started a revolution of using computers within
education. Computer programs have been developed to effectively do mathematics on
the computer such as Maple, Cabri, and Geometer‟s Sketchpad (Marrades & Gutierrez,
2000; & Mariotti, 2000). The same is true for calculators, in that calculators have
progressed from a basic four function calculator to a graphing calculator with the ability

34
to draw geometric images with Cabri Jr. or solve algebraic equations with CAS
(Computer Algebra Systems) technology.
Sang Sook Choi-Koh says that the “universal availability of technology is having
a profound impact on what should be taught in mathematics curricula and how
mathematics processes should be taught” (Choi-Koh 2003, p. 1). The mathematics
classroom envisioned by the Principles and Standards includes access to technology that
facilitates a student‟s learning (National Council of Teachers of Mathematics, 2000).
NCTM goes on to say that the effective use of technology within the mathematics
classroom depends on the teacher (National Council of Teachers of Mathematics, 2000,
p. 25). Klassen and Vogel suggest that the infusion of technology within the classroom
does not remove the teacher from the educational equation; however, it changes the role
of the teacher. The changes include a more interactive approach to teaching with the use
of a multimedia environment (Klassen & Vogel, 2001). Choi-Koh (2003) went on to say
that the use of technology has assisted in moving students‟ “thinking process from
intuitive to operative, and then on to application” (Choi-Koh, 2003, p. 368).
The use of music, movies, and television allow a teacher to address several
different types of learners. Studies have shown that the use of various resources is
effective in instruction and learning, while at the same time enhances the learning
environment (Imig, 1981; & Stein, 1983). The use of such media allows for deeper and
more meaningful understanding according to Gardner‟s multiple intelligences (Gardner,
1995).
According to Privateer (1999), mathematics learning with technology is a new
way of teaching and learning. Privateer states that “instructional technology can

35
spearhead serious institutional reform because they create real change, especially in the
area of course content and delivery (Privateer, 1999, p. 62).” Galbraith (2002, p. 15)
states that technology may be “regarded as a mathematical tool or as a transforming tool.
It may also be regarded as a cultural tool.” In this, Galbraith describes the mathematical
tool as one that amplifies capacity, the transforming tool as one that reorganizes thinking,
and the cultural tool as one that changes the relationship between people and tasks. The
process of using a calculator for deeper understanding ensures that students achieve
higher levels within Bloom‟s Taxonomy and within the mathematics classroom.
Overall there is a prevailing policy of allowing calculators during classroom
learning activities and testing (Dion, Harvey, Jackson, Klag, Liu, & Wright, 2001).
Although it is evident from Dion, Harvey, Jackson, Klag, Liu, and Wright (2001) that
calculators are used on tests, their study did not determine whether the tests actually had
questions that were designed for calculator usage when answering them. The TIMMS
study indicated that one of the greatest characteristics of the calculator was its use with
problem solving and discovery of mathematical relationships (Tarr, Uekawa, Mittag, &
Lennex, 2000).
Privateer (1999) suggests that learning outcomes be developed by teachers using
technology to teach that would integrate the technology throughout the curriculum. With
all of the available technologies today, one of the biggest challenges to teachers is
determining the difference between what is trending and what is good for instruction
(Podlesni, 1999). Sang Sook Choi-Koh also emphasizes that the type of questions asked
when using technology will need to be adjusted so that students will be able to more
readily see the relationships and not just get a quick answer by pushing a button (Choi-

36
Koh, 2003). Burrill (1998) points out that a student needs to see the mathematical
objective that needs to be learned and not focus on the particular tool that assists them in
arriving at an answer. Burrill goes on to say that test questions should also focus on the
mathematics and not the particular tool that is going to be used (Burrill, 1998).
Sang Sook Choi-Koh (2003, p. 1) states that “there is little research about how
technology affects mathematical thinking processes and even less on the impact of the
graphing calculator in the learning environment.” Hembree and Dessart (1986)
conducted a meta-analysis on the effects of hand-held calculators. Hembree and Dessart
(1992) also produced a meta-analysis on the research on calculators in mathematics
education. Both of these publications show an increase in the amount of research that has
occurred during the decade, but also reinforce the need for additional research to be
completed.
While there is still a need for more research, there are several studies that have
demonstrated the value of calculators within the mathematics classroom. Ellington
(2003) concluded that when calculators were an integral part of instruction, operational
skills and problem solving skills improved. Research shows that students with the
strongest mathematics skills perform best with handheld calculators at solving problems
(Hembree & Dessart, 1986). Research has also shown that students who used graphing
calculators have a more positive attitude towards mathematics (Hennessy, Fung &
Scanlon, 2001; Ellington, 2003; Ellington, 2004, & Ellington, 2006). Hollar and
Norwood completed a mathematical study that focused on the student‟s understanding of
a function. The study showed that while the students using graphing technology
performed as well as those using traditional algebra, the students using the graphing

37
technology improved their performance on visual and graphing tasks (Hollar & Norwood,
1999). Hollar and Norwood went on to say that students with the graphing technology
were allowed a greater ability to “create equations, tables, and graphs quickly and the
facility to move among the representations rapidly” (Hollar & Norwood 1999, p. 224).
Another recent piece of technology being used within the mathematics classroom
is the interactive white board, often called a Smart Board. The interactive white board is
a system that allows the teacher to network with a computer, projector and a white board.
The teacher can use the white board as a standalone, or incorporate it with visual
demonstrations, PowerPoint, etc. Ball (2003, p. 7) stated that the use of interactive
whiteboards can influence teaching and learning of mathematics because:
one shared image encourages discussion
the pace of the lesson is increased
the teacher is encouraged to plan utilizing whole-class activities
the teacher can face the students within the classroom
the teacher can concentrate on student responses
numbers, diagrams, and graphs can be quickly changed
dynamic images are readily available and easily manipulated
ease of switching between different modes of use and programs.
The introduction of Flash-ROM changed the look of hand-held technologies. In
1999, Texas Instruments released the TI-83, which came preloaded with various
applications and upgradeable software. The TI-84 was released in 2004. The TI-84 had
twice the speed and three times the memory of the TI-83. In addition to the speed and
memory, the TI-84 came with a versatile USB plug allowing for easy computer
connection. One of the newest technologies released by Texas Instruments in 2007 was
the TI-Nspire. The TI-Nspire offers a dual keypad, allowing it to bridge the learning
between the TI-84 and the actual TI-Nspire. One of the newest features is the ability to

38
simultaneously link multiple represents of a single problem, while also providing
enhanced interactivity. In particular, the TI-Nspire allows one to take an algebraic
equation written symbolically, to graph it geometrically, to create a table of values
numerically, to show flow charts of it analytically and to take notes verbally. Because
the TI-Nspire has been out since the fall of 2007, there has been very limited research
done using it to see how it compares to the other technologies that are available.
The mathematics classroom has come a long way from drawing in the sand, using
an abacus or even a slide rule. Teachers have many options when wanting to diversify
the tools with which they teach. While the computer and the internet hold many
opportunities, the cost of computers and even the space to place them within a school can
be a challenge. Fortunately for mathematics, advances have been made so that programs
originally designed for computers, such as Cabri and Maple, can now be held in your
hand with similar programs like Cabri, Jr. and Computer Algebra Systems or CAS. Time
will only tell how the impact of new technologies, such as the interactive whiteboard and
the TI-Nspire, will influence the way students learn.
CALCULATORS AS LEARNING TOOLS
According to Reys and Arbaugh, a four dollar calculator has the ability to do
computations in a matter of seconds that in the past would require students to have years
of instruction and practice to learn (Reys & Arbaugh, 2001). Although the calculator can
be very efficient and accurate at computing, it has also raised several questions for both
teachers and parents (Thompson & Sproule, 2000). The calculator cannot think for itself;
it cannot decide on which buttons to push, or what to think of the outcome. The quality
of the output of any calculator is wholly dependent on the input (Reys & Arbaugh. 2001).

39
The Third International Mathematics and Science Study (TIMMS) indicated that
the United States and Portugal tend to have relatively high levels of calculator use, while
Japan has practically no calculator usage (Tarr, Uekawa, Mittag, & Lennex, 2000).
Podlesni (1999) states that he believes that students should use graphing calculators.
According to Dion, Harvey, Jackson, Klag, Liu, and Wright (2001), the use of scientific
calculators in United States schools is greater than the use of graphing calculators within
Algebra I classrooms and geometry classrooms. However, graphing calculators are more
frequently used within Algebra II classrooms and pre-calculus or trigonometry
classrooms.
A study among United States schools by Dion, Harvey, Jackson, Klag, Liu, and
Wright (2001) indicates that as the mathematics class level increases, so does the fact of
the graphing calculator becoming an integral part of the classroom. Their study showed
that graphing calculators were required as a part of eighteen percent of the Algebra I
classrooms, twelve percent of the geometry classrooms, forty-two percent of the Algebra
II classrooms, and seventy percent of pre-calculus/trigonometry classrooms. Graphing
calculators were not allowed in thirteen percent of the Algebra I classrooms, eight percent
of the geometry classrooms, five percent of the Algebra II classrooms, and only one
percent of pre-calculus/trigonometry classrooms (Dion, Harvey, Jackson, Klag, Liu, &
Wright, 2001). Within the TIMMS study, only 10% of United States students said that
they had “never” used a calculator during a mathematics lessons (Tarr, Uekawa, Mittag,
& Lennex, 2000).
The technology that is available should not be used as a replacement but rather as
a tool that complements, deepens, and expands the understanding and exploration of

40
mathematics. The use of technology while teaching concepts that have massive
computations allows the teacher to focus on the concept being taught and further allows
the student to see the big picture of the concept instead of becoming confused with the
computation details (Hudnutt & Panoff, 2002). According to Hudnutt and Panoff, the
teacher should be able to discern in what capacity technology should be used. Choi-Koh
(2003) states that there is a great importance in asking appropriate questions for students
to process through the mathematics with technology. Although the calculator can help
process through lower levels of mathematics with a simple push of a button, the teacher
has the responsibility to ask the higher order of thinking skills questions such as “how”
and “why” to stimulate students to think “mathematically and meaningfully” (Choi-Koh,
2003, p. 367). Teachers have gone from being the sage on the stage to the facilitator of
discovery (Burrill, 1998).
The emergence of calculators and computers has changed the way mathematics is
both done and used (Ellington, 2006; Thorpe, 1989; & Kieran, 1992). Thorpe (1989, p.
11) says that “it is time for algebra instruction in the schools to begin to reflect these
changes.” Research shows that students can effectively use a graphing calculator as an
instructional tool to make and understand the connections between graphical and
algebraic concepts (Drijvers & Doorman, 1996; & Choi-Koh, 2003). Graphing, functions
included, is taken to a new level by technique, instrument and process. Research has
shown that in using computers to graph functions, students are capable of using one
algebraic system to extend and acquire an understanding of another (Colgan, 1993, p.
57). With the use of technology and such handheld devices, students can become
competent problem solvers (Ronau et al., 2008).
41
By allowing students to explore with the calculator, students can also learn new
ways to think about solving mathematics problems. This has been reflected within the
College Board Scholastic Achievement Test (SAT) Program that has allowed students to
use calculators since 1994. The allowance of calculators on the SAT is reflective of what
is occurring within the classroom. Other research has shown how the use of graphing
calculators has led to students using higher level thinking skills (Graham & Thomas,
1998; Keller & Hirsch, 1998; Dessart, DeRidder, Charleen, & Ellington, 1999; Huntley,
Rasmussen, Villarubi, Sangtong, & Fey, 2000; & Ronau et al., 2008), relating
mathematical problems to real life (Drijvers & Doorman, 1996; Zbiek, 1998; Schwarz &
Hershkowitz, 1999; & Forster, 2000), and collaboration on problem solving. (Goos,
Galbraith, Renshaw & Geiger, 2000; & Hennessy, Fung, & Scanlon, 2001).
Research has been gathered regarding the perceptions of graphing calculator use
within the mathematics classroom. The major trends for advantages of using the
graphing calculator were less distraction with computational detail, availability of
immediate feedback and enhancement of visualization (Simonsen & Dick, 1997; &
Hennessy, Fung, & Scanlon, 2001). Disadvantages of using the graphing calculator
include logistical difficulties, lack of access, and problems with security (Simonsen &
Dick, 1997; Hong, Toham, & Kiernan, 2000; & Mitchelmore & Cavanagh, 2000).
Additional disadvantages were the time spent learning the calculator and the fear of
calculator dependency (Quesada & Maxwell, 1994; Simonsen & Dick, 1997; &
Hennessy, Fung, & Scanlon, 2001).
In looking at the classroom dynamics and trends from teacher responses, the
mathematics classroom is less teacher-centered, allowing for more open-ended questions,

42
fostering a discovery approach, and allowing more of a cooperative learning environment
(Rochowicz, 1996; Simmt, 1997; & Simonsen & Dick, 1997). Minor trends also show
increased student discussion of mathematical ideas, increased student involvement, and
increased student enthusiasm (Simonsen & Dick, 1997). In respect to curriculum and
evaluation, there is both increased preparation time and increased mathematical depth
(Simonsen & Dick, 1997). In respect to professional support and development, the major
trends are the need for technology-sensitive materials and handouts, the need for
additional in-service, and the need for teacher networking (Simonsen & Dick, 1997).
Mathematics educators appear to support the use of calculators within the
classroom (Fleener, 1995; Dessart, DeRidder, Charleen, & Ellington, 1999; Merriweather
& Tharp, 1999; & Dion, Harvey, Jackson, Klag, Liu, & Wright, 2001). According to
Tarr, Uekawa, Mittag, and Lennex (2000), teachers can use technology to improve their
mathematics instruction which would, in turn, improve student learning. Some of the
biggest questions still before educators are when to use the calculators, what topics need
to be covered before using calculators, and how much the calculators should be used
within the classroom (Fleener, 1995; & Thompson & Sproule, 2000). The Technological
Pedagogical Content Knowledge (TPACK) model for professional development provides
a five-stage developmental process (from Recognizing to Accepting to Adapting to
Exploring to Advancing) to assist teachers when integrating technology on different
levels (Niess et al., 2009).
There is very little research that has been done on calculators in the past 20 years.
Hembree‟s (1986) meta-analysis showed only 96 studies done on the calculator in
general. Ellington‟s (2003) meta-analysis looked at only 54 studies. Choi-Koh (2003,
43
p. 369) states that “if students use tools early in the learning environment to acquire a
broader picture of the ways in which concepts may be realized, they might progress
cognitively. The experience also helps students to operate mathematical proprieties and
apply them to more complicated problems.” A study by Vendlinski, Morris, & Michels
(2008) compared the order of instruction, conceptual or procedural, within an algebra
class while students used the TI-Nspire. Results showed that teaching conceptually first
had greater benefits (Vendlinski, Morris, & Michels, 2008).
Whether using a four-function calculator to check calculations or a scientific
calculator to find the value of sine for an angle, calculators have become helpful learning
tools (Hembree & Dessart, 1986; & Ellington, 2003). While some research has been
done regarding the graphing calculator, Ellington‟s (2003) meta-analysis had only 22 of
the 54 studies dealing with graphing calculators. Most of the problem solving research
has been dealing with non-graphing calculators (Ellington, 2003). There is very little
research on the TI-Nspire since it was released in the fall of 2007. One study showed the
use of the TI-Nspire with pre-service teachers developed both a favorable attitude
towards the technology and created inquiry based and open-ended lesson plans (Meagher,
Ozgun-Koca, & Edwards, 2008).
While there are many different applications with the TI-Nspire, there is an
extremely limited amount of research on the TI-Nspire. With the ability of the TI-Nspire
to link together multiple-representations within a single problem, it is imperative that
research investigate the effect that this new tool will have within the classroom. With the
wide variety of methodologies, evidence supports the use of quasi-experimental design
(Keller & Hirsch, 1998; Hollar & Norwood, 1999; Harskamp, Suhre, & Van Streun,

44
2000; & Huntley, Rasmussen, Villarubi, Sangtong, & Fey, 2000), treatment/control
groups (Roberts, 1980; Ruthven, 1990a; Quesada & Maxwell, 1994; Shoaf-Grubbs, 1994;
Adams, 1997; Keller & Russell, 1997; Keller & Hirsch, 1998; O‟Callaghan, 1998; Keller,
Russell, & Thompson, 1999; Merriweather & Tharp, 1999; Schwarz & Hershkowitz,
1999; Harskamp, Suhre, & Van Streun, 2000; Huntley, Rasmussen, Villarubi, Sangtong,
& Fey, 2000; Connors & Snook, 2001; & Thompson & Senk, 2001), pre/posttest
(Roberts, 1980; Ruthven, 1990a; Adams, 1997; Slavit, 1997; Tharp, Fitzsimmons, &
Ayers, 1997; Keller & Hirsch, 1998; O‟Callaghan, 1998; Hollar & Norwood, 1999;
Merriweather & Tharp, 1999; Drijvers, 2000; Drijvers & Van Herwaarden, 2000;
Harskamp, Suhre, & Van Streun, 2000; & Thompson & Senk, 2001), and the use of
educational data for comparative analysis (Quesada & Maxwell, 1994; Keller & Russell,
1997; Hollar & Norwood, 1999; Keller, Russell, & Thompson, 1999; Doerr & Zangor
2000; Drijvers & Van Herwaarden, 2000; Huntley, Rasmussen, Villarubi, Sangtong, &
Fey, 2000; Connors & Snook, 2001; Dimock & Sherron, 2005). Since the concept of
functions within algebra can be looked at as equations, ordered pairs, and as graphs,
functions in algebra are an ideal context to explore the new technology. This makes a
logical connection to research how effective the new technology of the TI-Nspire is at
linking ordered pairs within a table, the graph on a coordinate plane, and the symbolical
writing of an equation. The concept of functions within algebra is an ideal context in
which to study hand held instructional technology.

45
CHAPTER 3
METHODOLOGY
INTRODUCTION
The focus of this study was to explore the effect of a teaching strategy using the
TI-Nspire on student achievement measured by a pre-test, a post-test, and a post post-test
using the Kentucky High School Diagnostic Mathematics Assessment. This study also
examined the effect of the teaching strategy on teacher behavior variables including
teacher planning, teacher teaching, and assessments used. The teaching strategy was
employed within the first year of algebra with “trained teachers” using the TI-Nspire
graphing calculator as an instructional tool to teach function concepts. The effect on
student achievement was determined by measuring students‟ understanding of functions
through comparisons of pre-test and post-test results. Student achievement was measured
using a pre-test, a post-test, and a post post-test using Repeated Measures with ANOVA.
The effect of how teachers taught, planned, and assessed students while teaching function
concepts was measured by observations and document analyses. The following research
questions guided the investigation:
1) Was there a difference in student test scores on function concepts in Algebra I
classrooms that used TI-Nspire graphing calculators versus those who did not
use this device? The independent variable was treatment and the dependent
variables were the pre-test, post-test, and post post-test.

46
a. Treatment Effect
b. Teacher Effect
c. Interaction of Teacher and Treatment
d. Factors: special education status and socioeconomic status
2) Did the use of TI-Nspire graphing calculators affect the way teachers taught
function concepts in Algebra I classrooms with respect to representations,
Depth of Knowledge, and TPACK? The independent variable was treatment
and the dependent variables how teacher taught.
3) Did the use of TI-Nspire graphing calculators affect the way teachers planned
lessons for function concepts in Algebra I classroom with respect to
representations, Depth of Knowledge, and TPACK? The independent
variable was treatment and the dependent variables how teacher planned.
4) Did the use of TI-Nspire graphing calculators affect the way teachers assessed
students on functions concepts in Algebra I classrooms with respect to
representations, Depth of Knowledge, and TPACK? The independent
variable was treatment and the dependent variables how teacher assessed.
This chapter is divided into the following sections: (1) research design; (2)
participants; (3) instrumentation; (4) treatment; (5) data collection procedures; (6) data
analysis procedures; and (7) summary.
RESEARCH DESIGN
The researcher used a quasi-experimental pre-test, post-test, post post-test control-
group research design to answer the research questions of the study. Gall, Gall, and Borg
(2003) indicate that, when establishing cause and effect relationships between two or

47
more variables, an experimental study is the most powerful research method. Shadish,
Cook, & Campbell (2002) indicate that experiments are well-suited for studying causal
relationships when three conditions are met:
1. Manipulate the presumed cause and observe an outcome afterward.
2. See whether variation in the cause is related to variation in the effect.
3. Use various methods during the experiment to reduce the plausibility of
other explanations for the effect (Shadish, Cook, & Campbell, 2002, 6).
In this study, first-year algebra teachers were taught to the use of a TI-Nspire
graphing calculator. These “trained teachers” were provided with examples to
supplement their textbooks and training specifically for the use of the TI-Nspire when
teaching the concepts of functions. The independent variable was the use or non-use of a
TI-Nspire graphing calculator by the trained teachers while teaching functions in a first-
year algebra course. For student achievement, the effect of the independent variable on
the dependent variable of student understanding of functions was determined by
differences in test scores on the post post-test, the post-test, and the pre-test. The use of
pre-tests provided baseline comparisons. The post-test was used to examine if there was
a statistically significant difference in these scores from the pre-test scores. The post
post-test strengthened the design by adding another data point, thereby increasing the
stability of the post-treatment measure and showing whether the information had been
retained over a longer period of time.
According to Patton (2002), the researcher was an insider in that she was a
colleague and knew the teachers. The researcher was an outsider in that the she worked
in a different building and in a different department. While both an insider and an

48
outsider, the researcher guarded against both positive and negative bias by giving full
disclosure, using multiple data collection types, and using triangulation to support all
results found.
The effect of the independent variable on the dependent variable was established
through teacher observations and weekly teacher questionnaires. A document review was
used to determine the effect of the teaching strategy of how teachers planned lessons and
assessed students on function concepts. A vignette was completed for each teacher
specifically looking at both the treatment class and the control class and then comparing
them.
PARTICIPANTS
Population and sampling
This research was conducted in the ninth grade of a high school located within a
school district in the southern part of the United States. The high school is referred to as
“Eagle High School,” and the school district is referred to as the “Aerie District.” The
population for this study is defined as any ninth grade first year Algebra class. The
sample for this study was is defined as the 301 ninth graders at Eagle High School and
taking the first year of Algebra.
Eagle High School is a comprehensive high school with both college and
technical/career track programs. The school is accredited by the Southern Association of
Colleges and Schools and is recognized as a National School of Excellence. Eagle High
School has honors, advanced placement, dual enrollment, and independent study courses.
Students may also take any course listed in the catalogs of the nearby postsecondary
institutions. Eagle High School offers 16 mathematics classes ranging from Foundations

49
to Calculus II Honors. The Foundations class is designed for students not ready for
Algebra I. In Foundations, students are prepared for algebra by building content
knowledge in number and operations, algebra, geometry, measurement, data analysis and
probability. Students use the processes of problem solving, reasoning, communication,
connections, and representation. Calculus II Honors is an Advanced Placement class in
which students earn college credit by taking the Calculus AB Advanced Placement test at
the end of the course. Students may also take College Algebra and Statistics on campus
at Eagle High School to earn dual enrollment credit for both high school and college
credit.
All students within this southern state must take a mathematics class each year of
high school in order to graduate. The lowest level mathematics to count toward
graduation is Algebra I. While students may be enrolled in more than one mathematics
class, all students must take Algebra I as their first mathematics credit. To meet the “No
Child Left Behind” requirements, this southern state requires an exit examination for all
Algebra I students.
Because all students are required to take Algebra I in high school, this study
included a representative cross-section of all students at Eagle High School. Students in
the Algebra I classes were required to take a pre-test, a post-test, and a post post-test
focusing on the topic of functions. During the 2008-2009 school year, Eagle High School
started school-wide-testing of English, mathematics, and science content areas, which
produced a database of student test scores in these subjects. Teachers were provided
reports to be used as feedback to identify areas of need for classes as well as for
individual students.

50
In the spring of 2009, students met with their guidance counselors to discuss class
schedules for the fall of 2009. A statewide database program to build school master
schedules to create student schedules also was used to manage attendance, create
transcripts, and more. The guidance department determined the number of classes for
each subject and created the master schedule. Computer generated class schedules and
rosters assigned students to classes. In the fall of 2009, these generated classes were
assigned a specific teacher by the school‟s academic assistant principal. Since this
assignment was not totally random, a table was created and included to show student and
teacher demographics within each classroom to demonstrate the equivalent groups. Since
all teachers within the ninth grade were teaching Algebra I, no teacher input into which
teacher received each class was available.
Once the classes for the fall of 2009 had been established, the classes were
designated randomly as either treatment or control. The state database system assigned
each Algebra I class a number. The random assignment was accomplished by listing the
teachers alphabetically by last name and then using a random number generator to assign
a number to each teacher. The teachers were then sorted by their assigned number from
least to greatest. The teacher with the lowest random number generated was known as
Teacher Alpha, the second was be Teacher Beta, the third was Teacher Gamma, the
fourth was Teacher Delta, the fifth was Teacher Epsilon and the sixth teacher was Zeta.
While an equal number of both male and female teachers were included, all teachers were
identified with the prefix “Teacher” to provide additional anonymity.
Six teachers at Eagle High School taught Algebra I in the ninth grade. Four of the
Eagle High teachers taught two Algebra I classes and two taught only one class, as shown
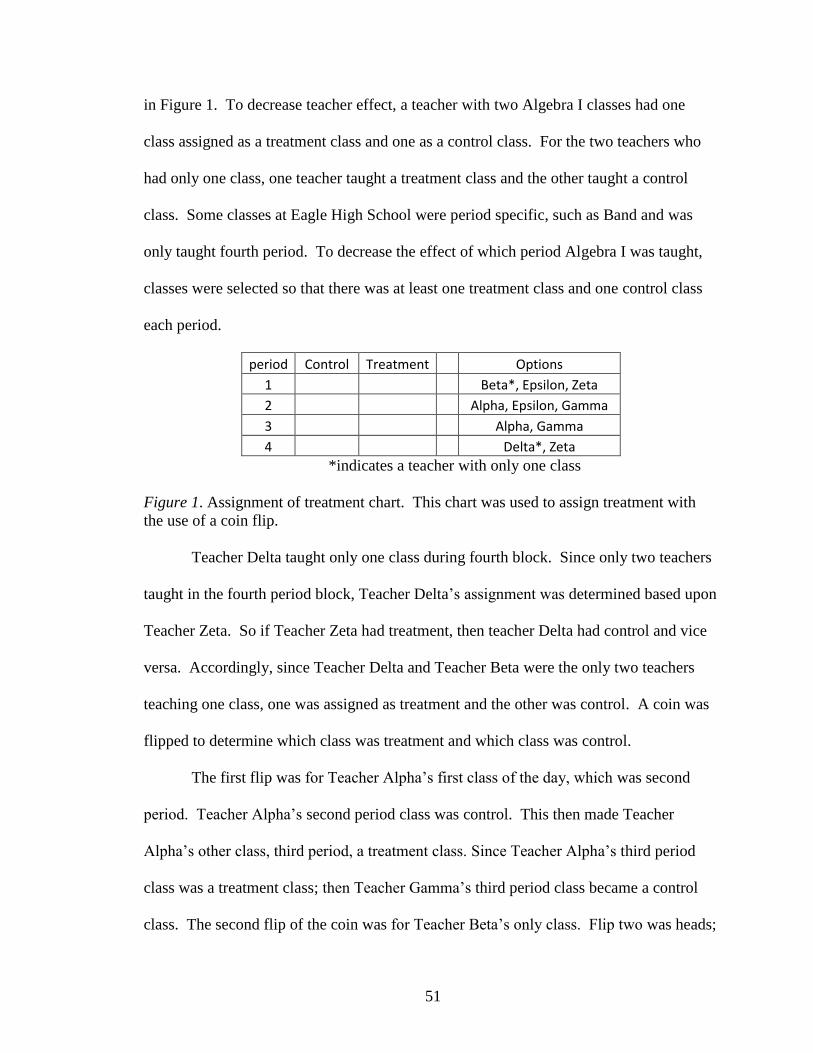
51
in Figure 1. To decrease teacher effect, a teacher with two Algebra I classes had one
class assigned as a treatment class and one as a control class. For the two teachers who
had only one class, one teacher taught a treatment class and the other taught a control
class. Some classes at Eagle High School were period specific, such as Band and was
only taught fourth period. To decrease the effect of which period Algebra I was taught,
classes were selected so that there was at least one treatment class and one control class
each period.
period Control Treatment
Options
1
Beta*, Epsilon, Zeta
2
Alpha, Epsilon, Gamma
3
Alpha, Gamma
4
Delta*, Zeta
*indicates a teacher with only one class
Figure 1. Assignment of treatment chart. This chart was used to assign treatment with
the use of a coin flip.
Teacher Delta taught only one class during fourth block. Since only two teachers
taught in the fourth period block, Teacher Delta‟s assignment was determined based upon
Teacher Zeta. So if Teacher Zeta had treatment, then teacher Delta had control and vice
versa. Accordingly, since Teacher Delta and Teacher Beta were the only two teachers
teaching one class, one was assigned as treatment and the other was control. A coin was
flipped to determine which class was treatment and which class was control.
The first flip was for Teacher Alpha‟s first class of the day, which was second
period. Teacher Alpha‟s second period class was control. This then made Teacher
Alpha‟s other class, third period, a treatment class. Since Teacher Alpha‟s third period
class was a treatment class; then Teacher Gamma‟s third period class became a control
class. The second flip of the coin was for Teacher Beta‟s only class. Flip two was heads;

52
therefore Beta‟s only class was a control class. Since Teacher Beta‟s only class was a
control class, to keep the classes balanced, Teacher Delta‟s only class was a treatment
class. Because Delta‟s class was a treatment class, this forced Teacher Zeta‟s second
class to be a control class and Zeta‟s first class to be a treatment class. The third flip of
the coin was for Teacher Epsilon‟s first period class. Flip three was heads; therefore,
Teacher Epsilon‟s first period class was control. This made Teacher Epsilon‟s second
period class a treatment class. Final assignment of treatment based upon the three coin
flips can be seen within Figure 2.
period Control Treatment
options
1 Epsilon, Beta Zeta
Beta*, Epsilon, Zeta
2 Alpha Epsilon, Gamma
Alpha, Epsilon, Gamma
3 Gamma Alpha
Alpha, Gamma
4 Zeta Delta
Delta*, Zeta
*indicates a teacher with only one class
Figure 2. Final treatment assignment. Displays each teacher by period and their
assignment to either treatment or control.
This design not only established control and treatment classes for each teacher,
but also for each period. This balanced random assignment design provided an equal
number (five) of control classes and treatment classes. This selection also allowed half of
the teachers to teach their treatment class first, while the other half of the teachers taught
their control class first. While Teacher Beta and Teacher Zeta did not have a second
class of Algebra I, their inclusion in this study provided balance to the schedule, class
selection, and treatment/control selection.
Demographics
Eagle High School is located in Eagle County, which has a population of around
90,000 and a mean age in the middle 30s, and is located within a southern state. There

53
are over 10,000 households in Eagle County with children under 18 years of age. The
population of Eagle County is 93% Caucasian, 4% African-American, and 3% other
minorities. Approximately 16% of the population age 25 and over hold a bachelor‟s
degree or higher. The median family income is around $45,000. Approximately 14% of
families in Eagle County are living below poverty level.
Eagle High School serves approximately 1,607 students. There are currently 339
seniors, 409 juniors, 408 sophomores, and 451 freshmen. The school population is 53%
male, 47% female, 95% white, and 5% minority. Approximately 10% of the students
receive special services. Roughly 1% of students are considered English language
learners. Approximately 46% of the students at Eagle High School receive free and
reduced lunch and fee waivers through the Federal Lunch Program and local funds. Most
of the parents/guardians are rural blue collar workers. The current unemployment rate for
Eagle County is approximately 12.7%.
Eagle High School has a staff that includes 126 teachers, 5 secretaries, 18
cafeteria workers, 8 custodians, 10 teacher assistants, 2 bookkeepers, a school nurse, a
school guard, a school resource officer, 1 principal, 3 assistant principals, and 4
counselors. The faculty is approximately 55% female, 45% male; 96% white, 3%
African-American, and 1% Hispanic. Approximately 47% of the faculty members have
attained a master‟s degree or higher. Faculty members at Eagle High School have an
average of nine years of teaching experience.
All students at Eagle High School are required to take the ACT exam. Results are
shown in Table 1. While not all students at Eagle High School are required to take the
SAT exam, those that do still have the scores reported back as shown in Table 2. In

54
2006-2007, Eagle High School implemented a requirement of their 10th graders. All 10th
graders were required to take the PLAN test which was to be given at the school on a set
testing date. The PLAN test is an indicator of the score students may expect to make on
the ACT test. At Eagle High School, 364 out of 408 (or 89%) 10th
graders took the
PLAN test, which resulted in an average composite score of 15.7. The national average
for the composite score is 17.5 on the PLAN test
Table 1
ACT Composite Averages
2003-2004 2004-2005 2005-2006 2006-2007 2007-2008
Eagle High 19.7 18.8 19.9 19.9 20.0
State 20.5 20.5 20.7 20.7 20.7
National 20.9 20.9 21.1 21.2 21.1
Table 2
Eagle High School SAT Averages
2004-2005 2005-2006 2006-2007 2007-2008
Verbal 544 583 560 597
Mathematics 520 571 608 607
Composite 1064 1154 1168 1204
Since the passing of No Child Left Behind (NCLB), each state created statewide
test in mathematics, English and science. Eagle High School has always been at or above

55
target for its mathematics scores. The passing rates for Eagle High School are listed in
Table 3.
Table 3
Eagle High School Algebra I Gateway
Year Passing
2005-2006 83%
2006-2007 92%
2007-2008 86%
Thurlow, Sinclair, and Johnson (2002) defined the event dropout rate as the
number of students who drops out in a single school year without completing high
school. The state goal for the event dropout rate is 5% or less. Thurlow, Sinclair, and
Johnson (2002) defined the cohort dropout rate as the number of students who drops out
from a set group or cohort over a period of time. The state goal for the cohort dropout
rate is 10% or less. The state goal for the graduation rate is 90%. Dropout and
graduation rates for Eagle High School are noted in Table 4.
Table 4
Eagle High School Dropout and Graduation Rates
Year Event Dropout Rate Cohort Dropout Rate Graduation Rate
2005-2006 1.4% 9.7 69.8%
2006-2007 0.36% 6.7 79.2%
2007-2008 .4% 4.6 79.2%

56
INSTRUMENTS
The instruments used to measure instructional effects on student achievement
were the Kentucky High School Diagnostic Mathematics Assessment Tool for Algebra I
and two questions from the textbook‟s standardized test from the specific chapter that
dealt with function concepts Chapter 4. Kentucky developed diagnostic Mathematics
Assessment Tools for Algebra I, Geometry, and Algebra II. The Kentucky High School
Diagnostic Mathematics Assessment for each course is divided into content clusters.
These content clusters represent the key mathematics standards within a given course. In
Algebra I, cluster 3 addressed specifically function concepts and was used for this study.
The Kentucky High School Diagnostic Mathematics Assessments were developed
for students in Algebra I, Geometry, and Algebra II courses. The development of these
assessments began in the fall of 2004 by middle and high school teachers and university
faculty members from both mathematics and mathematics education. The purpose of the
assessments was (1) to inform teachers at important intervals as to whether students were
ready for the next level of mathematics, (2) to inform teachers whether or not they were
preparing students for the next level, and (3) to inform the students of how well they had
learned the mathematics needed for the next level. Overall, the assessments allowed
teachers to determine if high school students had mastered the necessary content within
each course.
The Kentucky High School Diagnostic Mathematics Assessment for each course
is divided into content clusters. These content clusters represent the key mathematics
standards within the particular course. Specifically, the Kentucky High School
Diagnostic Mathematics Assessment Tool for Algebra I is divided into five content

57
clusters: One-Variable Expressions, Equations, and Inequalities; Properties of Lines and
Graphing Lines; Linear Functions; Polynomial Expressions; and Systems of Equations.
Three versions of each cluster are available allowing for a pre-test, post-test and a post
post-test at Eagle High School.
The first cluster focused on a students‟ ability to solve and or graph on a number
line one-variable equations and inequalities. This cluster also assessed absolute value,
ratios, proportions, real number properties and equivalence relations to reason
mathematically and solve real-world and mathematical problems. The second cluster
focused on students‟ ability to graph on a coordinate plane and to use lines to solve real-
world and mathematical problems. The third cluster focused on the students‟ ability to
identify, model and use linear functions and arithmetic sequences to reason
mathematically and to solve real-world problems. The fourth cluster focused on the
students‟ ability to simplify, add, subtract, multiply, and factor polynomial expressions.
This cluster also focused on the law of exponents when used to reason mathematically
and solve real-world mathematical problems. The fifth cluster focused on students‟
ability to solve systems of equations by graphing, substitution or elimination while
solving real-world and mathematical problems (Bush 2006).
Content Validity
Three strategies were used to establish the content validity for the Kentucky High
School Diagnostic Mathematics Assessments. The first strategy involved development
teams that created “power standards” that were aligned with the Kentucky Mathematics
Core Content 4.1 (2006) and with the American Diploma Project Mathematics
Benchmarks (2004). The development teams found or developed assessments that

58
focused on the mathematics standards within the Core Content and Mathematics
Benchmarks. The second strategy was to have teams comprised of classroom teachers,
mathematics educators, and mathematicians review the standards and the items
developed. The teams would gather, create or revise items and assessments, while
members from other teams validated their work through constant internal reviews (Bush
2006).
Finally, during the fall of 2005, 45 postsecondary mathematicians, mathematics
educators, high school teachers, and middle school teachers participated in an all-day
external review session. These 45 reviewers were divided into three equal groups to
work on Algebra I, Geometry, or Algebra II. Each group was provided with large sets of
items for review. For each item, reviewers were asked to determine the (1) mathematics
content area in which the item belonged, (2) depth-of-knowledge level that the item
measured, and (3) appropriateness and clarity of each item (Bush, 2006).
After the morning group had assessed the items and discussed their ratings,
individual reviewers then analyzed the items independently. Items in which 80% of the
reviewers agreed with regard to mathematics content, depth-of-knowledge level, and
appropriateness were preserved for subsequent field testing of the assessments. Items
that did not meet these criteria were either eliminated or revised. Any item that was
revised then went through another review process by smaller groups of educators. Of the
revised items, those that met the 80% criteria were retained (Bush, 2006).
Using power strands, the Kentucky High School Diagnostic Mathematics
Assessment directly aligned with both Core Content and Mathematics Benchmarks.
Utilizing constant review, the standards and items contained within the Kentucky High
59
School Diagnostic Mathematics Assessment have repeatedly been validated. In addition,
individual reviewers were used, allowing for each item to be individually tested in regard
to content, Depth of Knowledge, and appropriateness. Through the rigorous process of
creating and developing the Kentucky High School Diagnostic Mathematics Assessment,
the assessment has been deemed to have both internal and external validity.
To ensure that the Kentucky High School Diagnostic Mathematics Assessment
covered the same material that was covered during the treatment, a content validity
analysis of the test was completed (Bush, 2006). The content validity analysis compared
the items on the Kentucky High School Diagnostic Mathematics Assessment, Cluster 3,
the topics covered in the chapter dealing with function concepts, Chapter 4, in the
Algebra I textbook, and the standardized test produced by the Algebra I textbook
publisher for the chapter dealing with function concepts, Chapter 4. In addition to
comparing concepts, the Depth of Knowledge (Webb, 2006) was also examined. Below
are the results of the content validity analysis.

60
Table 5
Results of Content Validity Analysis
KY Cluster 3 _ Ch 4 in book _ End of
Chapter 4 Exam_
Item # Content DOK Content DOK Content DOK
Ky #
1
Determining which is a
function with mapping, table,
ordered pairs, & graph
2 100% 1, 2, & 3 100% 2 & 3
Ky #
2 Evaluating a function 2 100% 2 & 3 100% 2 & 3
Ky #
3
Domain / range of a function
given a graph 2 100% 1, 2, & 3 0% n/a
Ky #
4
Evaluating a function using a
table 3 100% 2 0% n/a
Ky #
5 Arithmetic sequence 2 100% 1, 2, & 3 100% 2
Ky #
6 Definition of a function 2 100% 1, 2, & 3 100% 1
Ky #
7
Domain / range of a function
using an equation 2-3 100% 1, 2, & 3 50% 1 & 2
Ky #
8
Choosing function of best fit to
a real life problem using a table 3 100% 2 & 3 100% 1 & 2
Ky #
9
Develop a table, write a
function, & solve a real life
problem using functions
3-4 100% 2, 3, & 4 50% 1 & 2
Ky #
10
Apply concept of functions to
solve real life problem using a
table, creating an equation, and
predictions
3-4 100% 2, 3 & 4 30% 1 & 2
n/a Coordinate plane, quadrants &
ordered pair 0 100% 1, 2, & 3 100% 1, 2, & 3
n/a Geometric transformations on
the coordinate plane 0 100% 1, 2 & 3 100% 1, 2, & 3
n/a Graphing linear equations 0 100% 1 & 2 0 n/a

61
The content validity assessment found the items on the Kentucky High School
Diagnostic Mathematics Assessment to be fully covered within Chapter 4, and the
standardized Chapter 4 textbook exam. To adjust for the test items that were covered
within the Algebra 1 textbook addressing function concepts, Chapter 4, but were not on
the Kentucky High School Diagnostic Mathematics Assessment, three items from the
Chapter 4 standardized test were also included on the pre-test, post-test, and the post
post-test. Content validity and reliability (Cronbach Alpha) for the tests, including the
additional three questions was unavailable student by item data were not provided to the
researcher.
Internal Reliability
During the spring of 2006, the Kentucky High School Diagnostic Mathematics
Assessment developed three versions of clusters within Algebra I, Geometry, and
Algebra II that were field-tested in middle and high schools in the five participating
school districts (Bush, 2006). In all, 2,255 students completed two versions of
mathematics clusters in the Algebra I assessments. These field test results were used to
determine the internal reliability of clusters and the assessments overall. Table 6 reports
the internal consistency reliability coefficients for the three versions of each cluster for
the Algebra I assessment, as well as the overall internal reliability of each individual
version of the assessments. The internal consistency reliability coefficient for the
Algebra I assessment ranged from 0.48 to 0.78. For comparison purposes, the reliability
results for the Kentucky High School Diagnostic Mathematics Assessment for Algebra II
are shown in Table 7, and for the Kentucky High School Diagnostic Mathematics
Assessment for Geometry are shown in Table 8. The internal consistency reliability

62
coefficient for the Algebra II assessment ranged from 0.33 to 0.75. The internal
consistency reliability coefficient for the geometry assessment ranged from 0.05 to 0.59
(Bush, 2006).
The internal reliability coefficients for the whole assessments were computed
using the Spearman-Brown formula for determining the overall reliability of assessments
based on the reliabilities of subtests. Specifically, Cluster 3, which dealt with functions
and was used for this study, had an average reliability of 0.51. The reliabilities for the
three complete versions of the Algebra I assessment were quite high, with an average of
0.90 (Bush, 2006).
Table 6
Internal Reliabilities for Algebra I Clusters and Complete Assessment
Version Cluster 1 Cluster 2 Cluster 3 Cluster 4 Cluster 5 Total
1 0.78 0.61 0.48 0.52 0.65 0.89
2 0.73 0.65 0.50 0.60 0.73 0.90
3 0.69 0.70 0.55 0.62 0.64 0.90
Table 7
Internal Reliabilities for Geometry Clusters and Complete Assessment
Version Cluster
1
Cluster
2
Cluster
3
Cluster
4
Cluster
5
Cluster
6
Cluster
7 Total
1 0.65 0.52 0.75 0.50 0.77 0.61 0.44 0.91
2 0.62 0.59 0.63 0.49 0.76 0.64 0.58 0.92
3 0.60 0.52 0.72 0.33 0.58 0.66 0.36 0.89
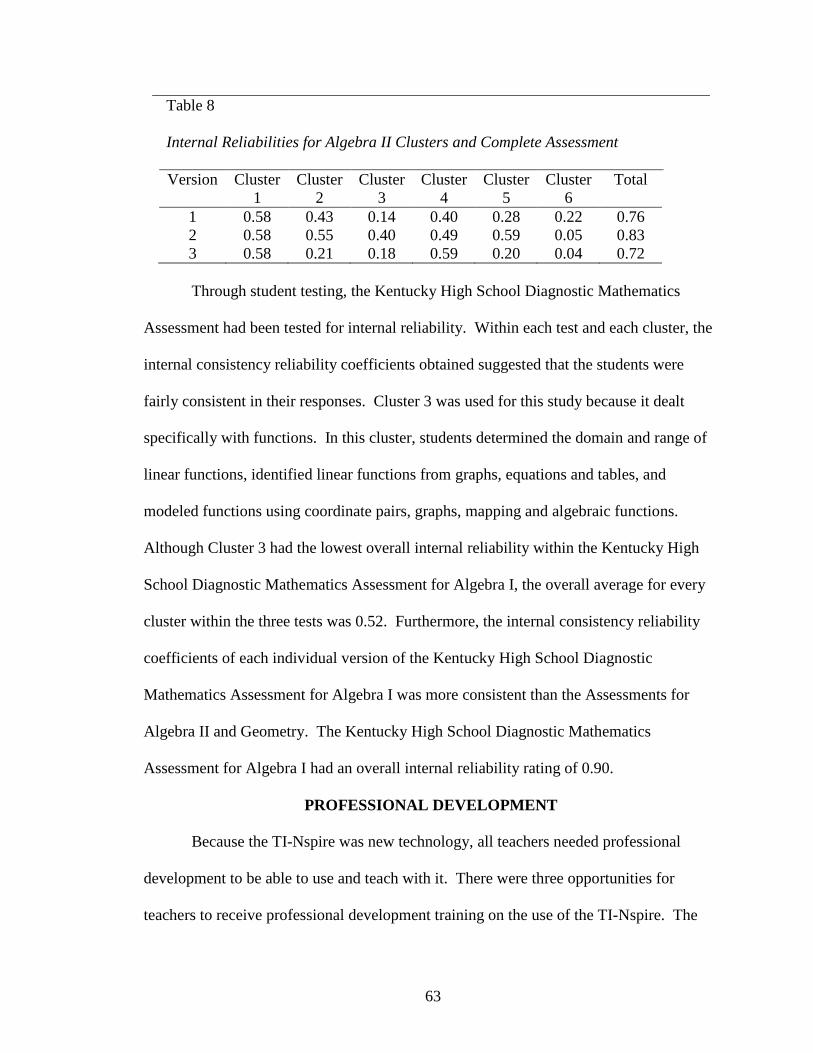
63
Table 8
Internal Reliabilities for Algebra II Clusters and Complete Assessment
Version Cluster
1
Cluster
2
Cluster
3
Cluster
4
Cluster
5
Cluster
6
Total
1 0.58 0.43 0.14 0.40 0.28 0.22 0.76
2 0.58 0.55 0.40 0.49 0.59 0.05 0.83
3 0.58 0.21 0.18 0.59 0.20 0.04 0.72
Through student testing, the Kentucky High School Diagnostic Mathematics
Assessment had been tested for internal reliability. Within each test and each cluster, the
internal consistency reliability coefficients obtained suggested that the students were
fairly consistent in their responses. Cluster 3 was used for this study because it dealt
specifically with functions. In this cluster, students determined the domain and range of
linear functions, identified linear functions from graphs, equations and tables, and
modeled functions using coordinate pairs, graphs, mapping and algebraic functions.
Although Cluster 3 had the lowest overall internal reliability within the Kentucky High
School Diagnostic Mathematics Assessment for Algebra I, the overall average for every
cluster within the three tests was 0.52. Furthermore, the internal consistency reliability
coefficients of each individual version of the Kentucky High School Diagnostic
Mathematics Assessment for Algebra I was more consistent than the Assessments for
Algebra II and Geometry. The Kentucky High School Diagnostic Mathematics
Assessment for Algebra I had an overall internal reliability rating of 0.90.
PROFESSIONAL DEVELOPMENT
Because the TI-Nspire was new technology, all teachers needed professional
development to be able to use and teach with it. There were three opportunities for
teachers to receive professional development training on the use of the TI-Nspire. The
64
first opportunity was a summer session led by a National Texas Instruments (TI)
Instructor who was assisted by six Texas Instruments Trained Cadre members from
around the region. A Texas Instrument Trained Cadre member is an active classroom
mathematics teacher who has received training on the TI-Nspire, has a class set of TI-
Nspire calculators, and regularly provides professional development training to other
mathematics teachers. The other two professional development opportunities were the
“Function Focused Session” and the “Weekly Touchdown Session,” which was led by a
Texas Instruments Trained Cadre member from an adjacent county.
During the summer prior to this study, all teachers attended the 12 hours of
training over the course of two days in which they were trained to use the TI-Nspire
graphing calculator. Teachers were then given a TI-Nspire, TI-Nspire emulator, and
access to online Atomic Learning video training (Atomic Learning, 2011) to continue
their exploration of the TI-Nspire. The week prior to the study, the teachers attended the
Function Focused Session, which was six hours long and provided review on the TI-
Nspire, specific training about teaching the function concept with the TI-Nspire, and time
to create lesson plans and activities for this study. During the two weeks of treatment and
the two weeks of follow up, teachers met once a week for the Weekly Touchdown
Session, a 90 minute meeting after school, to complete a weekly questionnaire, turn in
lesson plans, assessments, and receive further professional development on the TI-Nspire.
Sustained professional development was central to training the teachers on how to
use the TI-Nspire and for providing continual support as teachers implemented the new
technology while teaching function concepts. All professional development sessions
were taught by Texas Instruments Trained Instructors providing fidelity in treatment
65
implementation. At every professional development session, Texas Instruments Trained
Instructors gave instruction and review on the TI-Nspire, answered questions, and
provided direction for the teachers‟ next steps. During the Weekly Touchdown Sessions,
the Texas Instruments Trained Cadre member worked with teacher issues with the TI-
Nspire as well as provided specific function content activities and examples to prepare
teachers for the next week of instruction. This set of professional development
opportunities provided vital strategies necessary for teachers to use this new technology
tool and to assure fidelity implementation of the treatment and to maintain the
consistency of the control group instruction..
TREATMENT
In the fall of 2009, the first-year algebra classes (Algebra I) for ninth grade at
Eagle High School was selected to be either treatment or control. Treatment was defined
as the use of the TI-Nspire graphing calculator by a trained teacher while teaching the
concept of functions with respect to representations, Depth of Knowledge, and TPACK.
Prior to this study at Eagle High School, the only classroom set of calculators that
teachers and students used in Algebra I classrooms were non-graphing scientific
calculators.
Teachers in the treatment group taught the concept of functions using a TI-Nspire
graphing calculator, and those in the control group taught the concept of functions
without using the TI-Nspire at Eagle High School. While students in the control group
were allowed to use any calculator, their teacher did not use the TI-Nspire graphing
calculator as part of instruction. The control teachers taught using non-graphing
scientific calculators. Neither the treatment group of students nor the control group of

66
students were allowed to use a TI-Nspire graphing calculator on the pre-test, the post-test,
or the post post-test. This requirement provided a more accurate picture of the students‟
true understanding of the function concept. All students were allowed to use a non-
graphing scientific calculator on the pre-test, the post-test, or the post post-test as was
normal protocol for typical Eagle High School Algebra I classes.
The topics covered within Algebra I were the same for both the treatment and
control groups. In 2005, the Eagle High School mathematics department completed
curriculum mapping which outlined the state standards to be taught within each of their
classes, including the Algebra I curriculum. To ensure treatment fidelity, the researcher
required teachers to complete a weekly questionnaire showing how often and to what
extent they integrated representations and teaching tools into the classroom. Since all
students in the ninth grade was taking Algebra I, every Algebra I class in the ninth grade
was asked to participate in this study. Teachers assigned to teach Algebra I classes were
contacted and asked to participate in this study.
Participating teachers all received the professional development described above
and were asked to provide documents and scores from their class. The teachers
participated in both the Function Focused Sessions and the Touchdown Sessions as
described above. The class information collected included the current grade averages for
each student, the number of absences of each student, and the pre-test, post-tests and post
post-tests scores for the function cluster of the Kentucky High School Diagnostic
Mathematics Assessment for Algebra I. The documents collected included daily lesson
plans, handouts, quizzes, and tests.
67
During the summer of 2009, mathematics teachers in the Aerie School District
were provided the opportunity to receive professional development from Texas
Instruments staff on the use of the TI-Nspire in the mathematics classroom. Teachers
received this training in the month before school started. While all mathematics teachers
at Eagle High School have had the opportunity to be trained on the use of the TI-Nspire,
teachers in this study were provided also with further professional development and
training about the specific topic of functions.
A “trained teacher” was defined as a mathematics teacher who had attended both
the two-day training offered by Texas Instruments and Eagle High School as well as the
Function Focused Sessions designed specifically for teachers teaching the first course of
algebra to ninth grade students. The Function Focused Sessions took place one school
week prior to the introduction of functions with the first-year of algebra. The sessions
were taught by a Texas Instruments trained presenter.
Three Function Focused Sessions were provided. The first session reinforced the
initial concepts and training learned at the initial two-day professional development
offered in the summer by the high school and Texas Instruments. Teachers also were
reminded also of how to use the five different types of representations (numeric,
geometric, symbolic, writing and analytical) with the TI-Nspire. During this session,
teachers also were able to ask other questions concerning the basic operations of the TI-
Nspire.
The second session of the Function Focused Sessions integrated the TI-Nspire
with the classroom textbook. Teachers were trained on the specific topics within their
current algebra textbook which was already designed for graphing calculator integration.

68
Teachers using the same textbook worked in small groups, which allowed for
collaboration among teachers. Each teacher took a turn directing a technology activity
within the book. While one teacher taught, the other teachers took the role of
student/observer. This strategy provided teachers an experience in answering questions
while teaching an example. Selected examples of topics included the following:
Coordinate plane
Ordered pairs
Defining a function
Domain/range with a table
Domain/range with a graph
Domain/range with a equation
Using tables to evaluate functions
Graphing relation
Graphing linear equations
After the second session, teachers engaged in group discussions which allowed
them to process the information, collaborate about the inclusion of TI-Nspire, and reflect
on teaching functions. Teachers discussed how their classroom would change with the
use of the TI-Nspire. Teachers also collaborated concerning the use of TI-Nspire within
their classrooms.
The third session provided training using extended applications and other
resources. Teachers were given a copy of Getting Started: Calculator Software Apps and
the TI Classroom Activities CD. Teachers then explored specific exercises from these
resources that addressed with functions. Again, teachers collaborated on these activities.

69
Teachers again took turns directing a technology activity. While one teacher was
teaching, the other teachers served as students. This strategy provided teachers with
experience in answering questions while teaching.
The concluding session was to expose teachers to the Texas Instruments website:
http://education.ti.com. Teachers explored within the teacher exchange
(http://education.ti.com/exchange) so that they could access activities, worksheets, and
programs developed by Texas Instruments, as well as activities by other book companies,
researchers, and teachers. This session concluded with instructions on how to sign up for
weekly emails from Texas Instruments that include course relevant activities.
After completing the Function Focused Sessions, teachers had a portfolio of
examples, worksheets, programs and activities specifically when dealing with functions
to integrate within their classrooms. They also could independently continue to tap into
these resources for the purpose of obtaining additional material for other topics. These
materials may be used for many different purposes such as class starters, lectures,
examples, reinforcement, or re-teaching.
In the four-week period (two weeks from pre-test to post-test and then an
additional two weeks until the post post-test) the trained teachers had weekly review
sessions in which they engaged in reflection, refreshing, and reviewing. At the beginning
of each session, the teachers completed a reflection task by answering a questionnaire.
The open-ended questionnaires were different for control and treatment classes. The
treatment class questionnaire (Figure 3) asked questions specific to the TI-Nspire, while
the control class questionnaire (Figure 4) asked about teaching tools in general. Teachers
were provided a daily data (Appendix A) sheet to help them keep track of this weekly

70
questionnaire information. Teachers also were advised that the daily data sheet should be
filled out either during or immediately after class to insure better accuracy.
Treatment Class Questionnaire
1. In what ways have you used representations to teach functions this week?
2. In what ways have you linked those representations while teaching functions this
week?
3. Have you used the TI-Nspire this week to teach functions?
4. How often have you used the TI-Nspire this week?
5. What issues have you had with the TI-Nspire while teaching functions?
6. What goals do you have for students with respect to learning functions with the
TI-Nspire?
7. What are some examples of what you have done teaching functions using the TI-
Nspire this week?
8. What have you been able to teach (better/more easily) using the TI-Nspire than
using other tools?
Figure 3. Treatment Class Questionnaire. A list of open-ended questions given to
treatment class teachers to fill out weekly.
Control Class Questionnaire
1. In what ways have you used representations to teach functions this week?
2. In what ways have you linked those representations while teaching functions this
week?
3. What teaching tools have you used this week to teach functions?
4. How often have you used these tools to teach functions this week?
Name of tool___________________ How often ___________________
Name of tool___________________ How often ___________________
Name of tool___________________ How often ___________________
5. What issues have you had with using these teaching tools while teaching
functions?
6. What goals do you have for students with respect to learning functions?
7. What are some examples of what you have done teaching functions using the
teaching tools described above this week?
8. What have you been able to teach (better/more easily) using the above mentioned
teaching tools than using other tools?
Figure 4. Control Class Questionnaire. A list of open-ended questions given to
control class teachers to fill out weekly.
After the reflections were completed, any questions the teachers had regarding the
TI-Nspire were answered by the TI Cadre Member. The TI Cadre Member then

71
reviewed the TI-Nspire for the topics that were to be covered in the coming week. The
goal of the Touchdown session was to gather data regarding the implementation of the
TI-Nspire within the classroom as well as to provide teachers with additional support.
During the two-week period there was also a classroom observation where the researcher
observed the teacher to provide triangulation and validity to the weekly questionnaires.
Teachers received professional development or in-service credit for attending
both the Function Focused Sessions and the Touchdown Sessions. All teachers at Eagle
High School must participate in at least 12 hours of professional development or in-
service training each year. Permission had been given by Eagle High School
administration to allow this training to count towards this required professional
development and in-service training.
Teachers in control classes at Eagle High School were expected to follow their
normal course of teaching, which included the use of non-graphing scientific calculators,
but not the TI-Nspire graphing calculators. Students within a normal course of Algebra I
at Eagle High School are allowed to use any calculator that they choose; which may
include a TI-Nspire graphing calculator.
Teachers who had the treatment classes at Eagle High School were provided with
additional activities during the professional development activities by the TI Cadre
Members to use in conjunction with the TI-Nspire. These activities were used with
students as homework, reinforcement, or re-teaching. Teachers also used the sections
within the Algebra I textbook that made use of graphing calculators. The current textbook
that is being used at Eagle High school is Algebra I (Holliday et al., 2005). Within this
textbook were examples and lessons that were designed to be used with the TI-Nspire

72
graphing calculator. Glencoe/McGraw-Hill also provided online links for additional
assistance with graphing calculators.
All six teachers who were teaching Algebra I to ninth graders in the fall of 2009
participated in this study. Teacher educational background information is explained
within Table 9. Eagle High School requires that all students in Algebra I take pre-tests,
post-tests, and post post-test throughout the semester. For the purpose of this study, the
scores from all ninth graders taking the pre-test before studying functions, as well as a
post-test two weeks after the pre-test, and a post post-test four weeks after taking the pre-
test were analyzed.
Table 9
Teachers Educational Background
Name Education Certification Years
Teaching
Years at
Eagle
Alpha Bachelor - Mathematics
Masters - Secondary Ed Mathematics 7-12 4 years 4 years
Beta Bachelor - Mathematics Mathematics 7-12 4 years 4 years
Delta Bachelor - Mathematics Ed Mathematics 7-12 1 year 1 year
Gamma Bachelor - Education
Elementary K-8
Mathematics 7-12
Science 5-8
7 years 4 years
Epsilon
Bachelor - Elementary Ed
Bachelor - Mathematics Ed
Masters - Mathematics Ed
Mathematics 7-12 4 years 4 years
Zeta Bachelor - Business Management
Masters - Business Administration
Mathematics 7-12
Business 2 years 1 year

73
DATA COLLECTION PROCEDURES
Following the approval of the IRB Committee at the University of Louisville, the
researcher collected data from the teachers. These teachers taught the first year of
algebra course at the high school level. Each class was assigned a two letter prefix. The
first letter was T for treatment or N for control. Teacher Alpha had a second letter prefix
of A. Teacher Beta had a second letter prefix of B. Teacher Gamma had a second letter
prefix of G. Teacher Delta had a second letter prefix of D. Teacher Epsilon had a
second letter prefix of E. Teacher Zeta had a second letter prefix of O. Each teacher then
arranged the class rosters alphabetically and assigned the students a number. Sample
identifiers included TD05, which stood for the fifth student on the alphabetical roll who
was in Teacher Delta‟s treatment class.
Within this southern state, students take a state mathematics test in the eighth
grade. Within the Aerie District, students in the eighth grade also take the Explore Exam,
which is a precursor to the PLAN test and the ACT. The researcher secured each
student‟s eighth grade state mathematics score and Explorer Exam from the guidance
department at Eagle High School. The student‟s current grade in the Algebra I class also
was obtained from the Algebra I teacher.
Teachers at Eagle High School also used the Kentucky High School Diagnostic
Mathematics Assessment for Algebra I, Algebra II, and Geometry. For the purpose of
this study, the researcher obtained the Algebra I, Cluster 3 exam scores from each class.
Since three versions of each test existed, a different version was used for the pre-test,
post-test, and post post-test and recorded by the teacher. A Microsoft Office Excel
spreadsheet was utilized to track each student by their pre-assigned identifier. The

74
spreadsheet included the identifier, pre-test scores, post-test scores, post post-test scores,
and whether or not they were in the treatment or control group. Included within this
spreadsheet was the information gathered from the guidance department regarding the
eighth-grade state mathematics test, the Explore test, gender, and socioeconomic status,
as well as GPA, and current class averages as gathered from the classroom teacher. This
spreadsheet was on a secure computer and was password protected.
Teachers were asked to keep a manila folder for each class in the study. Inside
each folder, teachers placed copies of daily lesson plans, handouts, starters, worksheets,
quizzes, and tests for each individual class. Teachers with two classes were given two
folders; each folder was labeled with the appropriate class period to ensure that treatment
and control class materials were correctly identified. Each teacher was asked to turn the
folders in at the Weekly Touchdown Sessions with their Weekly Questionnaire.
The researcher also conducted classroom observations of each teacher once
during the two-week treatment period. For teachers who taught both a treatment and a
control class, the researcher observed both classes on the same day, so that the same
lesson could be compared. The researcher used a classroom observation form, Appendix
B, which included teacher name, class type (treatment/control), the class period, date,
observation start time, observation end time, and a place to record activity information.
For each activity, the time, content area, type of representations, Depth of Knowledge,
Technological Pedagogical Content Knowledge (TPACK) level, and how the activity was
completed was all recorded within the classroom observation form.

75
DATA ANALYSIS PROCEDURES
Data collected were analyzed using the Concurrent Mixed Analysis:
Simultaneous Analysis of Qualitative and Quantitative data (Tashakkori & Teddlie,
1998). For the quantitative portion, Repeated Measures with ANOVA was used to
analyze the effect of the independent variable on mathematic achievement based on pre-
test, post-test, and post post-test scores. Additional analyses were done to see if gender,
socioeconomic status, eighth grade Explorer Exam scores, class absences or class
averages made a statistically significant difference on pre-test scores or on post-test
scores. A confidence level of 95% (p<0.05) was used to determine if statistical
significance existed. Gigerenzer (2004) stated that a p-level of p<0.05, p<0.01, or
p<0.001 be used depending on which is the next in reference to the obtained p-level.
While teachers reported through the Weekly Touchdown Questionnaire, the
classroom observation of the teacher served as a way to triangulate the actual
implementation of the representations and teaching tools used while teaching function
concepts. Document analyses of daily lesson plans and handouts of treatment and control
classes were analyzed to determine the effect of the independent variable on the
dependent variable on teacher planning. Document analyses of bell ringers, quizzes, and
tests of treatment and control classes were analyzed to determine the effect of the
independent variable on the dependent variable of student assessment.
SUMMARY
This study sought to examine the effects of student achievement, teacher
planning, teacher teaching and assessments used within the first year of algebra when
trained teachers use a TI-Nspire graphing calculator as an instructional tool to teach

76
function concepts. With the weekly Touchdown Sessions, teachers reported how often
and to what extent they integrated representations and teaching tools into the classroom.
Using the three versions of Kentucky High School Diagnostic Mathematics Assessment
for Algebra I, Cluster 3, the students‟ understanding of and application of functions were
measured by comparing pre-test results with post-test and post post-test results.
In seeking to discover the statistically significant difference in students‟ test
scores in Algebra I classes that integrated TI-Nspire graphing calculators versus those
that did not, teachers were trained on how to use the TI-Nspire graphing calculator, were
shown examples of problems dealing with functions, and were given sample worksheets
and handouts for their classes. To determine the effect of the independent variable on the
dependent variable of how teachers taught, the researcher administered questionnaires
and conducted observations. To determine the effect of the independent variable on the
dependent variable of how teachers planned their lessons, document analysis were used.
Document analysis was also used to determine the effect of the independent variable on
the dependent variable of how teachers assessed students.
Treatment classes were taught specifically with the TI-Inspire graphing
calculators. Control classes were not taught with the TI-Nspire graphing calculator.
Control classes continued with the current school method of instruction using only a non-
graphing scientific calculator to teach Algebra I.
This study specifically looked at the third of five clusters within the Kentucky
High School Diagnostic Mathematics Assessment for Algebra I. The Kentucky High
School Diagnostic Mathematics Assessment for Algebra I came with three versions,
perfect for a pre-test, post-test, post post-test study. A pre-test (version 1) provided a

77
baseline for all students. A post-test (version 2) was given two weeks after the pre-test.
A post post-test (version 3) was given two weeks after the post-test. This study was
completed in four weeks.
The Repeated Measures with AVOVA was used with the pre-test, post-test and
post post-test scores to determine if a statistically significant difference in students‟
understanding of functions in Algebra I classes that integrate the TI-Nspire graphing
calculators versus those that do not integrate the TI-Nspire graphing calculators existed.
Other factors such as attendance, previous state mathematics test scores, and current class
average were used also to determine if they had any statistical significance as well.
This chapter provided a description of the methods that were used to describe the
effect of the independent variable on the dependent variable of student understanding,
teacher planning, teacher teaching, and assessments used within the first year of algebra
when teachers used the TI-Nspire graphing calculator as an instructional tool while
studying functions. The next chapter details the results and describes the major findings
in the study.

78
CHAPTER 4
RESULTS
INTRODUCTION
The purpose of this study was to investigate the effect of the independent variable
(a teaching strategy using the TI-Nspire) on the dependent variable of student
achievement measured by pre-, post- and post post-tests using the Kentucky High School
Diagnostic Mathematics Assessment. This study also examined the effect of the
independent variable on teacher planning, teacher teaching, and assessments that teachers
used.
The independent variable, teaching strategy, was implemented in the first year of
algebra with teachers using the TI-Nspire graphing calculator as an instructional tool to
teach function concepts. The effects on student achievement were determined by
measuring students‟ understanding of functions through comparisons of pre-test and post-
test results as displayed in Figure 5. R is the random assignment of classes, O1 is the pre-
test, X is the treatment, O2 is the post-test and O3 is the post post-test. Student
achievement was measured using a pre-test, post-test, and a post post-test using Repeated
Measures with ANOVA. The effects of how teachers teach, plan, and assess students
while teaching function concepts were measured by document analysis.

79
R O1 X O2 O3
R O1 O2
O3 Figure 5: Quasi-experimental design. Quasi-experimental design using control groups
with a pre-test, post-test, and post post-test.
All algebra teachers at Eagle High school attended a two-day workshop taught by
a T3 National Instructor (Texas Instruments). The T
3 instructor was assisted by five TI
Cadre members providing one-on-one assistance when needed. The workshop taught the
teachers how to use the TI-Nspire. All teachers were provided with a copy of the TI-
Nspire emulator to load onto their computers as well as a TI-Nspire calculator. Teachers
were asked to become familiar with the calculator, emulator and to complete the online
tutorials offered by Atomic Learning for TI-Nspire Handhelds and Atomic Learning for
TI-Nspire Computer Software (Atomic Learning, 2011).
Two weeks prior to the implementation of the study, all teachers attended a six
hour Function Focused Session, which was taught by a Texas Instruments Cadre member
(a Texas Instruments representative). The Function Focused Session began with a review
of how to use the TI-Nspire and allowed for any questions that teachers had regarding the
calculator or the emulator. The Cadre member then provided the teachers with resources,
activities, and instruction on ways to use the TI-Nspire to teach the function concept. For
example, the Cadre member provided the teachers with the “Intro to Functions” Activity
and demonstrated how to use the Texas Instruments website to access additional
materials. “Intro to Functions” is a beginner level activity designed to teach students how
to identify graphs of functions while using equations, tables and graphs. The session
ended with the teachers working on their first week of lesson plans using the TI-Nspire.

80
This four-week data collection period began one week after the Function Focused
Session. During the four-week period of this study (two weeks from pre-test to post-test
and then an additional two weeks until the post post-test), the teachers had weekly review
sessions in which they engaged in reflection, refreshing, and reviewing. These weekly
review sessions began with the teachers completing a questionnaire. While completing
the questionnaire, the same Texas Instruments Cadre member who had led the Function
Focused Session, answered any questions or concerns that the teachers had from that
week of instruction. The Cadre member then provided more resources and activities to
assist the teachers in the next week‟s lesson.
The two algebra classes for each of the four teachers in the study were randomly
assigned to treatment and control groups in a way that every teacher and every school
period had a treatment and control class. This design not only allowed for control and
treatment classes for each teacher, but also for each class period. This balanced random
assignment design provided an equal number of control classes and treatment classes and
this selection process resulted in half of the teachers teaching their treatment class first,
while the other half of the teachers were teaching their control class first.
For the qualitative portion of the study, the researcher was an insider in that the
researcher was a fellow staff member and knew the teachers (Patton, 2002). The
researcher was an outsider in that the researcher worked within a different building and in
a different department. While both an insider and an outsider, the researcher guarded
against both positive and negative bias by giving full disclosure, using multiple data
collection types and triangulation to support all results found.

81
The students in these Algebra classes had not used graphing calculators before
this treatment. All teachers taught Algebra I with a classroom set of Casio non-graphing
scientific calculators. A scientific calculator can be used to perform mathematical
calculators for scientific notation, logarithms, trigonometric functions, exponential
functions. Some scientific calculators also have the capabilities to calculate complex
numbers, fractions, statistics and unit conversions.
While some teachers had taught with a Casio graphing calculator before, none of
the teachers had ever used a TI-Nspire calculator, much less taught with one. While
graphing calculators allow students to use graphs, tables, and equations to represent
functions, the TI-Nspire calculator has the ability to connect the different representations
together within a single document. For example, when a table, equation, and a graph are
connected within the same TI-Nspire document, changing one aspect of the equation
immediately changes the data within the table and on the graph.
During the first two weeks of the treatment, teachers used the TI-Nspire graphing
calculator to teach function concepts in Chapter 4 of the Algebra I textbook (Holliday et
al., 2005). During the final two-weeks of the treatment, teachers continued using the TI-
Nspire graphing calculator in their treatment classes, but the mathematics content was
linear equations. Teachers in their control classes taught the same concepts as they did in
their treatment classes, but did not use the TI-Nspire or any graphing calculator. The
control classes used non-graphing scientific calculators that could perform basic math
functions, trig calculations, and fractions.
The role of the researcher was to facilitate teacher training by Texas Instruments
T3
National Presenter and Cadre Members. The researcher provided copies of all pre-

82
tests, post-tests, post post-tests that were distributed to the students by the teachers, and
the weekly questionnaires filled out by the teachers. The researcher set up the meeting
room for the weekly touchdown meetings making sure that technology was available.
While the teachers met with the Cadre Member for the weekly touchdown meeting, the
researcher attended to some of the teacher‟s after school duties so that all participating
teachers could attend. At the conclusion of the weekly touchdown meeting, the
researcher would then gather questionnaires, lesson plans, assessments, and test scores
provided by the teachers from the meeting room.
In addition to gathering weekly documents, the researcher also observed each
class once during the first two weeks of the study. The role of the researcher was as a
complete observer in that the researcher was not a participant but simply an observer
(Creswell, 2009). She completed one observation session of 90 minutes during the
second week of the study within each class using a classroom observation sheet
(Appendix B) developed by the researcher.
Data were stored in a locked closet. The researcher categorized the data by tool,
by teacher, and by treatment and control, analyzed the documents, and summarized the
findings. The researcher then used different color highlighters to code the data based
upon the key constructs developed from the literature. The researcher then cut out
different highlighted data and placed them together for further analysis. Each construct
was then sorted according to teacher and treatment so that comparisons could be made
between each teacher‟s treatment and control class, among each teacher, among each
type, and among all teachers and types. For example, all lesson plans were collected,
sorted by teacher, and analyzed by key construct. The constructs of standards, objectives,

83
instructional strategies, technology and assessments were each highlighted in a different
color and then separated. The constructs were then analyzed comparing Teacher Alpha‟s
treatment class to Teacher Alpha‟s control class. The constructs were then reorganized
and analyzed comparing all treatment classes to all control classes. These findings were
summarized for each tool according to treatment type within the individual teacher,
among all treatment teachers, among all control teachers, and finally among all treatment
and all control teachers. Each construct that was identified in one set of documents, such
as lesson plans, was verified by analyzing other documents, such as assessments. The
triangulation of constructs across documents contributed to the validity of these findings.
The constructs were further verified by observations in the classrooms.
This study began when the first-year Algebra classes started chapter 4 in their
textbooks which was on the study of functions. Treatment was defined as the use of the
TI-Nspire by a trained teacher while teaching the function concept during a two-week
period. Teachers had access to a classroom set of TI-Nspire calculators, the TI-Nspire
emulator, and the Texas Instruments website. During the four weeks of this study,
teachers kept a daily log about included notes about the use of technology, assessments,
and lesson plans for both their treatment and control classes.
Each student was given a pre-test at the beginning of the treatment, a post-test two
weeks later at the end of the treatment, and a post post-test two weeks after the end of the
treatment. The tests were derived from the three versions of Kentucky High School
Diagnostic Mathematics Assessment for Algebra I, Cluster 3, and three additional
questions from the textbooks standardized test in the chapter on functions. These tests
were used to measure the students‟ understanding and application of functions. Version 1

84
was used as the pre-test, Version 2 was used as the post-test, and Version 3 was used as
the post post-test. The reliability and validity of the tests were described in chapter 3.
All test scores were entered into SPSS as well as students socioeconomic and
special education status. Within SPSS, four different aspects of the first research
question were analyzed to explain differences in student data. Research question 1a
analyzed the mean scores for the pre-test, post-test, and post post-tests with type
(treatment and control) as the categorical factors. Research question 1b, a one-way
ANOVA, was conducted with the mean scores for the pre-test, post-test, and post post-
test as dependent variables and teacher (Teacher = Alpha, Epsilon, Gamma or Zeta) as
the categorical factor. Research question 1c employed MANOVA with the three test
scores as the dependent variables and both teacher and type as fixed factors. Research
question 1d added socioeconomic status and special education as fixed factors.
All classroom observations occurred during the first two weeks of the study. The
researcher observed each teacher teaching their treatment and control classes the same
day. During the classroom observations, the researcher used a classroom observation
sheet (Appendix B) to document class activities. Figure 6 displays the design of the
classroom observation. The categories included within the classroom observation sheet
combined various aspects of the teaching process to triangulate the teachers‟ lesson plans,
weekly teacher questionnaires, and concepts tested. The content category referred to the
topics covered by the teacher as related to the thirteen items on the pre-test, post-test, and
post post-test to verify that the content covered in class was also the content on the test.
The types of representations category in figure 6 captured the various ways function
representations were taught such as numeric, geometric, analytic, symbolic, written or

85
other. The Depth of Knowledge category was used to code the use of higher order
thinking as described by Webb (2006). The Technological Pedagogical Content
Knowledge (TPACK) ranking category was used to describe levels at which each teacher
integrated the technology in their instruction (Niess et al., 2009).
Figure 6: Observation Categories. Categories for analysis of activities observed during
classroom observations.
For each activity, the observer noted the start time and charted the categories:
content area, type(s) of representations, Depth of Knowledge, TPACK level, and how the
activity was completed. The content area listed which items from the pre-test, post-test,
and post post-test were addressed. Item 1 through Item 10 on the tests focused on
functions. Item 11 through Item 13 focused on graphing. Different types of
representations used were categorized as either numeric, geometric, symbolic, analytic,
writing or other. The Depth of Knowledge level was recorded as 1 for recall, 2 for
Classroom Observation
Content
Types of Representations
Depth of Knowledge
TPACK

86
skill/concept, 3 for strategic thinking and 4 for extended thinking (Webb, 2006). TPACK
ranking recorded a 1 for Recognizing, a 2 for Accepting, a 3 for Adapting, a 4 for
Exploring, and a 5 for Advancing (Niess et al., 2009).
The observer coded each activity including class starters, sample exercises,
worksheets, and textbook assignments. Each activity was treated as a different entry into
the classroom observation sheet. Sample exercises were worked by the teacher for the
entire class. Worksheets were handouts given by the teacher that contained additional
exercises from the textbook for students to work independently. Textbook assignments
were specific exercises assigned to students directly from the book. The researcher
recorded the Depth of Knowledge for each activity as well as the number of
representations used within each activity. An activity might have involved a combination
of numeric, geometric, symbolic, analytic, and writing or other representation, each of
these would have been coded as they occurred. Some activities received multiple codes.
Each teacher completed a weekly questionnaire for their treatment and their
control classes. The questionnaire contained eight questions designed to triangulate both
the classroom observations and lesson plans. Since each teacher had both a treatment and
a control class, the questionnaire allowed each teacher the opportunity to examine and
express the similarities and differences between each of the two classes. All questions on
the questionnaire were open response, but teachers were allowed to make additional
comments regarding the experiment.
The questions on the treatment questionnaire (Appendix C) addressed the use of
the TI-Nspire, while the control questionnaire (Appendix D) addressed the use of other
teaching tools. Both questionnaires contained similar components as shown in Figure 7.

87
Items on the questionnaire inquired about representations, teaching tools, goals, issues,
and benefits. When asking about the use of representations, teachers were asked to
specify ways that the representations were used and how they were linked to teaching
functions. When asking about the teaching tools, teachers identified which tools were
used and how often the tools were used. Teachers were asked about specific goals with
respect to how students were learning functions. Issues and benefits provided
information regarding the teaching tools, goals, and treatment in general.
Figure 7: Questionnaire categories. Categories of the weekly teacher questionnaire.
Each teacher submitted all lesson plans and assessments for their control class and
treatment class. The teacher lesson plans for each class included a list of state
competencies, objectives, methods of instruction, materials used, technology used,
learning style, instructional strategies and assessments for a given day. Teachers
submitted copies of all assessments used during treatment and control classes. In
Questionaire Use of
Representations
Use of teaching tools
Issues with teaching tools
Goals
Examples
Teach better or more easily

88
comparing assessments, the researcher looked at starters, classroom work, homework,
worksheets, quizzes, and tests.
STUDENT OUTCOMES
Research question 1 was addressed in this section. Is there a statistically
significant difference in students test scores on function concepts in Algebra I classrooms
that use the TI-Nspire graphing calculators versus those that do not use this device? In
addressing the research question, the following null hypothesis was offered: No
statistically significant difference in student test scores on function concepts in Algebra I
classrooms that used TI-Nspire graphing calculators versus Algebra I classrooms that did
not use this device was evident.
In each class, students were given a pre-test the day before the class began their
study of functions, which was the beginning of Chapter 4 in their textbooks. All students
were given a post-test two weeks after the date of the pre-test, which was approximately
at the end of the first chapter on functions within their textbooks. Finally students were
administered the post post-test two weeks after the post-test or four weeks after the pre-
test.
The results were gathered and put into a password protected Excel spreadsheet
which already contained demographics, socioeconomic status, gender, age, and special
education status. The data were coded, and no personal and identifiable information was
included. The spreadsheet was then entered into SPSS. Data was analyzed and missing
data was discovered as reported in Table 10. Missing data comes from a student who
does not complete all three tests. SPSS uses listwise deletion for missing data; that is if
data is missing in a record that is needed for a specific analysis, that record is deleted.

89
Table 11 shows the amount of missing data that would occur when comparing multiple
tests.
Table 10
Original Missing Data
Teacher
Alpha
Teacher
Epsilon
Teacher
Gamma
Teacher
Zeta
All
Teachers N=
Pre-Test 10.3% 5.4% 7.4% 1.7% 6.2% 212
Post-Test 19.0% 3.6% 3.7% 5.2% 8.0% 208
Post Post-Test 6.9% 3.6% 22.2% 8.6% 10.2% 203
Table 11
Missing Data when Comparing Tests
Total missing Percent missing N=
Pre - Post 30 13.3% 196
Pre - Post Post 34 15.0% 192
Post - Post Post 37 16.4% 189
Pre, Post, Post Post 47 20.8% 179
Four different analyses were conducted using SPSS. The analysis for research
Question 1a was a one-way ANOVA with pre-, post-, and post-post test score means as
the dependent variables and the type (treatment or control) as the categorical factors. The
analysis for research question 1b was a one-way ANOVA with pre-, post-, and post-post
test score means as the dependent variables and the teacher (Teacher = Alpha, Epsilon,
Gamma or Zeta) as the categorical factor. The analysis for research question 1c
employed MANOVA with pre-, post-, and post post-test as the dependent variables and

90
both teacher and type as fixed factors. The analysis for research question 1d added
socioeconomic status and special education as fixed factors.
Horton and Lipsitz (2001) stated that missing data is a common occurrence within
scientific research. To account for missing data noted in Tables 10 and 11, multiple
imputations were used within the SPSS program. The imputations were repeated five
times to decrease the error introduced by imputations (Allison, 2000). The average of
those five complete imputation sets were then pooled and subsequently used to increase
the confidence of the data set.
Analyzing research question 1aa one-way analysis of variance was conducted to
assess if differences between the type of class (treatment and control) on the pre-test,
post-test, and post post-test existed as shown in Figure 8. All four control class scores
were combined to calculate the control mean score. All four treatment class scores were
combined to calculate the treatment mean score. An analysis between the pre-test mean
scores of the control group and the treatment group revealed a statistical significance
(p=.028, Cohen‟s d=0.51) in favor of the control class meaning that the control group
started at a significantly higher level of mathematical achievement over the treatment
group. On the post-test, the slope treatment group and the control group improved on
their mean pre-test scores, but not at a statistically significant level. The level of
significance (p=.754) between the control group‟s mean scores and the treatment group‟s
mean scores revealed no statistical significance indicating that any differences between
the two groups were eliminated during the treatment period (or that the treatment group
was able to catch up with the control group with respect to test scores). The control
group‟s post post-test mean score of 6.31 was a decrease from their post-test mean score,

91
implying the control group did not retain all of the knowledge. The treatment groups post
post-test mean score of 7.45 was an increase from their post-test mean score, implying
the sustained learning of the treatment group continued to improve. The treatment group
scored statistically significantly higher (p=.031, Cohen‟s d=0.66) than the control group
on the post post-test, revealing the effectiveness of the treatment.
Figure 8: Original scores by type for each test. This figure illustrates the mean score
out of a possible 13 point score for control group and treatment group on the pre-test,
post-test and post post-test using the original data.
An additional analysis was conducted to determine if the slope from pre-test to
post-test, pre-test to post post-test, and post-test to post post-test was significant for
treatment and control groups. A regression analysis of post-test when controlled by pre-
4.70
7.20
6.31
4.08
7.34 7.45
0
1
2
3
4
5
6
7
8
Pre-Test Post-Test Post Post-Test
Original Scores by Type
Control
Treatment

92
test for a standardized beta coefficient that was statistically significant for the control
group for original means (p=.000), which was also supported by the pooled imputed
means (p=.000). A regression analysis of post post-test when controlled by pre-test for a
standardized beta coefficient that was statistically significant for the control group for
original means (p=.001), which was also supported by the pooled imputed means
(p=.001). A regression analysis of post post-test when controlled by post-test for a
standardized beta coefficient that was statistically significant for the control group for
original means (p=.001), which was also supported by the pooled imputed means
(p=.001).
A regression analysis of post-test when controlled by pre-test for a standardized
beta coefficient that was statistically significant for the treatment group for original
means (p=.000), which was also supported by the pooled imputed means (p=.000). A
regression analysis of post post-test when controlled by pre-test for a standardized beta
coefficient that was statistically significant for the treatment group for original means
(p=.001), which was also supported by the pooled imputed means (p=.001). A regression
analysis of post post-test when controlled by post-test for a standardized beta coefficient
that was statistically significant for the treatment group for original means (p=.001),
which was also supported by the pooled imputed means (p=.001).
After pooling the imputed values, the level of significance (p=.029) between the
control group‟s mean scores and the treatment group‟s mean scores showed statistical
significance as shown in figure 9. On the post-test, both treatment and control groups
improved on their mean pre-test scores. The level of significance (p=.440) between the
control group‟s mean scores and the treatment group‟s mean scores showed no statistical

93
significance. The treatment group scored statistically significantly higher (p=.044) than
the control group on the post post-test. The information of the imputed pooled data
confirmed the results from the original data.
Figure 9: Pooled imputed scores by type for each test. This figure illustrates the mean
score out of a possible 13 point score for control group and treatment group on the pre-
test, post-test and post post-test after imputing values for missing data.
Research question 1b investigated possible variance due to teacher effect. A
General Line Model using MANOVA was ran with the pre-test, post-test, and post-post
test controlled for while looking at teacher, type and teacher by type. The original scores
for each teacher by test are displayed in Figure 10. Each teacher had both their treatment
and control class scores combined to analyze teacher effect on each test. No effect on the
original pre-test scores or post-test scores was found, meaning there was no teacher effect
on the pre-test or post-test scores. The effect on the original post post-test scores
(p=.000, Cohen‟s d=0.27) was found to be statistically significant, meaning that there
4.68
6.94 6.30
4.08
7.28 7.34
.00
1.00
2.00
3.00
4.00
5.00
6.00
7.00
8.00
Pre-Test Post-Test Post Post-Test
Imputed Scores by Type
Cntrl
Treat

94
was significant teacher effect on the post post-test. The imputed scores each teacher by
test are displayed in Figure 11. The effect on the imputed post post-test scores (p=.001)
was also found to be statistically significant. The information of the imputed pooled data
confirmed the results from the original data.
Figure 10: Original Scores for each teacher by test. This figure illustrates the mean
score out of a possible 13 point score for each teacher on the pre-test, post-test and post
post-test.
4.46 4.32 4.36 4.42
7.66
7.57
7.58
6.36
6.78
8.13
7.52
5.23
0
1
2
3
4
5
6
7
8
9
Alpha Epsilon Gamma Zeta
Original scores by teacher
Pre-Test
Post-Test
Post Post-Test

95
Figure 11: Pooled imputed scores for each teacher by test. This figure illustrates the
mean score out of a possible 13 point score for each teacher on the pre-test, post-test and
post post-test after imputing values for missing data.
A multiple comparison test was run to further investigate the significant
difference within the post post-test among teachers. The statistical significance focused
around Teacher Zeta‟s classes. When comparing Teacher Zeta‟s classes post post-test
scores with Teacher Epsilon‟s classes and Teacher Gamma classes, statistical
significance was found. The original data revealed a difference (higher) between the post
post-test scores for Teacher Epsilon‟s classes 2.903 (p=.000) higher than Teacher Zeta‟s
classes. The original data revealed a difference between the post post-test score for
Teacher Gamma‟s classes 2.297 (p=.013) higher than Teacher Zeta‟s classes. The pooled
imputed mean difference showed Teacher Epsilon‟s classes post post-test 2.783 (p=.001)
higher than Teacher Zeta‟s classes mean score. The pooled imputed mean difference
4.43 4.32 4.32 4.44
7.24
7.53 7.47 6.22
6.58
8.03 7.49
5.25
0
1
2
3
4
5
6
7
8
9
Alpha Epsilon Gamma Zeta
Imputed scores by teacher
Pre-Test
Post-Test
Post Post-Test

96
showed Teacher Gamma‟s classes post post-test 2.245 (p=.012) higher than Teacher
Zeta‟s classes mean score. The information of the imputed pooled data confirmed the
results from the original data
Research question 1c used a multivariate test with the teacher as fixed variable,
the pre-test mean as covariate and centered at the class level. Figure 12 shows a
comparison of the original mean scores for the pre-test, post-test, and post post-test by
teacher for the control class and treatment class. Each of the eight lines represents the
eight individual classes within this study and their mean scores on each test. The original
data for the classes by teacher on the post-test (p=.042, Cohen‟s d=0.07) and the post
post-test (p=.000, Cohen‟s d=0.27) were statistically significant, indicating teacher effect
on the post-test and the post post-test. The original data for the interaction of teacher by
type on the post-test (p=.007, Cohen‟s d=0.52) and the post post-test (p=.036, Cohen‟s
d=0.44) were also statistically significant, indicating an effect of the interaction of teacher
and type on the post-test and the post post-test. Wilks‟ Lambda showed a significant
level for teacher (p=.001), type (p=.027) and the interaction of teacher and type (p=.004)
which indicates that the assumptions of variance for teacher, type and the interaction of
teacher and type were verified. Additional post hoc tests were run for teacher, type, and
teacher by type.

97
Figure 12: Original Scores for each test by teacher and type. This figure illustrates the
mean score out of a possible 13 point score for each teacher on the pre-test, post-test and
post post-test after imputing values for missing data.
Figure 13 shows a comparison of the pooled imputed mean scores for the pre-test,
post-test, and post post-test by teacher for the control class and treatment class. The
pooled imputed class scores by teacher on the post-test (p=.121) revealed no statistical
significance, while the post post-test (p=.001) showed statistically significant. The
pooled imputed data for the interaction of type on the post post-test (p=.057) were not
significant. The pooled imputed data for the interaction of teacher by type on the post-
test (p=.003) and the post post-test (p=.016) were both statistically significant. Wilks‟
Lambda showed a significant level for teacher (p=.010), type (p=.005) and the interaction
3.50
4.50
5.50
6.50
7.50
8.50
9.50
Pre Post Post Post
Original Scores by Teacher and Type
Alpha control
Alpha Treatment
Epsilon control
Epsilon Treatment
Gamma Control
Gamma Treatment
Zeta Control
Zeta Treatment

98
of teacher and type (p=.005). The assumptions of variance for teacher, type and the
interaction of teacher and type on the Wilks‟ Lambda test were verified. Additional post
hoc tests were run for teacher, type, and teacher by type. The results for the pooled
imputed means analysis for teacher on post-test were different from that of the original
means analysis. The results for the pooled imputed means analysis for the interaction of
teacher and type on both the post-test and the post post-test were supported by the
original means analysis.
Figure 13: Pooled imputed scores for each test by teacher and type. This figure
illustrates the mean score out of a possible 13 point score for each teacher on the pre-test,
post-test and post post-test after imputing values for missing data.
A pairwise comparison test was then run for teacher, type, and the interaction
between teacher and type using the original means. For the pairwise comparison by
3.50
4.50
5.50
6.50
7.50
8.50
9.50
Pre Post Post Post
Imputed Scores by Teacher and Type
Alpha control
Alpha Treatment
Epsilon control
Epsilon Treatment
Gamma Control
Gamma Treatment
Zeta Control
Zeta Treatment
99
teacher, statistically significant interactions were found on the post-test and the post post-
test for the results for the classes of Teacher Zeta. On the post-test, the data for Teacher
Zeta‟s classes had an original mean difference of -1.720 (p=.009, Cohen‟s d=1.10) when
compared with the data for Teacher Alpha‟s classes, -1.115 (p=.071, Cohen‟s d=.84)
compared with Teacher Epsilon‟s classes and -1.389 (p=.035, Cohen‟s d=.32) compared
with Teacher Gamma‟s classes. On the post post-test, Teacher Zeta‟s classes original
mean difference of -1.936 (p=.010, Cohen‟s d=1.13) compared with Teacher Alpha‟s
classes -2.839 (p=.000, Cohen‟s d=1.46) compared with Teacher Epsilon‟s classes and -
2.735 (p=.000, Cohen‟s d=1.37) compared with Teacher Gamma‟s classes. This revealed
that a student within Teacher Zeta‟s class, whether treatment or control, would have a
significantly lower post post-test score than a student in another Teacher‟s class. Wilks‟
Lambda was significant for this multivariate test (p=.001) with the original means.
A pairwise comparison test was then run for teacher, type, and the interaction
between teacher and type using the pooled imputed means. For the pairwise comparison
by teacher, statistically significant interactions were found on the post-test and the post
post-test when for Teacher Zeta‟s classes. On the post-test, Teacher Zeta‟s classes
pooled mean scores showed a difference of -.944 (p=.123) compared with Teacher
Alpha‟s classes, a pooled mean difference of -1.217 (p=.040) compared with Teacher
Epsilon‟s classes and a pooled mean difference of -1.209 (p=.043) compared with
Teacher Gamma‟s classes. On the post post-test, Teacher Zeta‟s classes pooled mean
difference scores showed difference of -1.294 (p=.068) compared with Teacher Alpha
classes, of -2.658 (p=.000) compared with Teacher Epsilon classes and a pooled mean
difference of -2.198 (p=.002) compared with Teacher Gamma‟s classes. The results for

100
the pooled imputed means analysis for the interaction of teacher and type on both the
post-test and the post post-test were partially supported by the original means analysis.
Wilks‟ Lambda showed a significant level for this multivariate test (p=.010) with the
pooled imputed means for the interaction of teacher and type on both the post-test and the
post post-test
The analysis for research question 1d investigated the interaction of
socioeconomic status and special education students. A multivariate analysis of variance
was conducted to assess if there were differences between the teacher and socioeconomic
status, special education status, or the interaction of socioeconomic status and special
education status on the post-test, and the post post-test. The pre-test was a dependent
variable so that variance due to the pre-test was controlled. When analyzing with the
original means, the socioeconomic status had a statistically significant impact on the
post-test (p=.003) and on the post post-test (p=.016). When analyzing with the pooled
imputed means, only the socioeconomic status post-test (p=.014) was confirmed to be
statistically significant. When analyzing with the original means, the interaction between
teacher and socioeconomic status, a significant impact on the post post-test (p=.014) was
found, but this same interaction was not confirmed to be significant with the pooled
imputed means (p=.097). When analyzing with the original means, the interaction
between type and socioeconomic status, a significant impact on the pre-test (p=.040) was
found, but this same interaction was not confirmed to be significant with the pooled
imputed means (p=.076). When analyzing with the original means, no statistically
significant results were found with special education; however on the pooled imputed
means, a statistically significant interaction between teacher and special education was

101
found on the post post-test (p=.005). Wilks‟ Lambda showed a statistically significant
level for the original means of the socioeconomic status (p=.017) while the pooled
imputed means was not significant (p=.204). Wilks‟ Lambda did not show a significant
level for the original means for the interaction of teacher and special education (p=.170)
nor did the pooled imputed means (p=.276). An attempt to investigate further was futile
due to the lack of data. There was not enough statistical power to continue with further
analysis.
Analysis of the quantitative data revealed statistically significance. Analyzing for
treatment effect revealed statistical significance on the pre-test and the post post-test for
original and imputed data. Analyzing for teacher effect revealed statistical significance
on the post post-test for original and imputed data. Analyzing for the effect of teacher,
type and the interaction between teacher and type using the pre-test as a control value and
centering by pre-test at the class level revealed statistical significance on the post post-
test for teacher effect with the original and imputed data. The original data also showed a
statistically significant teacher effect on the post-test. Analysis of the interaction of
teacher by type revealed statistical significance on the post-test and the post post-test for
both the original and imputed data. Further pairwise comparison revealed a statistical
significance of Teacher Zeta‟s classes on both the post-test and the post post-test.
Analysis of the interaction of teacher and type with socioeconomic status and special
education students produced conflicting results. It appeared that the lack of data caused
different interactions and further analysis was not possible due to lack of power.

102
VIGNETTES
The ten Algebra I classes in the study included six teachers at Eagle High School
in the fall of 2009. The four teachers, who had two Algebra I classes, taught one
treatment class and one control class. One of the remaining teachers, Teachers Delta
taught a treatment class and Teacher Beta, taught a control class. To control the effect of
the time of day that Algebra I was taught, classes were selected so that at least one
treatment and one control was taught for each school class period.
Teacher Delta did not follow the treatment protocol. In fact, Teacher Delta only
used the calculators in class three times over the entire four week period. Since this was
not consistent with the treatment, the data generated by Teacher Delta‟s classes would
have no construct validity. Therefore, Teacher Delta was removed from the study.
Teacher Beta was the control for Teacher Delta, and therefore not necessary with the
removal of Teacher Delta, therefore Teacher Beta was also removed from the study.
Table 12 below lists the final sample of teachers, the number of students in each class,
and the assignment of either treatment or control.
Table 12
Teacher and type
Period Teacher Type N=
2nd
Alpha Control 30
3rd
Alpha Treatment 30
1st Epsilon Control 29
2nd
Epsilon Treatment 32
2nd
Gamma Treatment 29
3rd
Gamma Control 29
1st Zeta Treatment 30
4th
Zeta Control 29

103
Observations and document analyses were used to identify the predetermined
constructs for analysis across teachers and classes. Analyses of the classroom
observations, questionnaires, lesson plans, and assessments were organized around the
constructs of representations, Depth of Knowledge and TPACK. The researcher coded
each activity within the treatment and control classes. For coding representations, the
activities included starters, example problems, goals, worksheets, textbook assignments,
and homework. The coding for Depth of Knowledge was based upon Webb (2006). In
the observation and document analysis for Depth of Knowledge, all objectives, goals, and
activities were coded with a Level 1 for recall, Level 2 for skill or concept, Level 3 for
strategic thinking and Level 4 for extended thinking. The coding for TPACK was based
upon Niess and others (2009). Within the observation and document analysis for
TPACK, a 1 was assigned to Recognizing, a 2 to Accepting, a 3 to Adapting, a 4 to
Exploring and a 5 to Advancing.
Teacher Alpha – Control Class
Teacher Alpha‟s control class was observed on the sixth day of treatment. During
the observation, the activities within Teacher Alpha‟s control classroom included a
starter, homework review, and lecture with demonstrations, guided practice, and
homework. The lesson began with a class starter. Teacher Alpha had the starter written
on the board. Students turned to page 191 in their books and completed exercises 15-20.
While students worked these exercises by substituting values into an equations and
solving for x, Teacher Alpha called roll and passed back homework papers.
Teacher Alpha reviewed the starter exercises and then had the control class
students take notes that were displayed using a multimedia projector. Teacher Alpha then

104
reviewed mapping, domain, range, and the vertical line test. Teacher Alpha demonstrated
the relationship between mapping and tables. Teacher Alpha then had students work
exercises using the vertical line test on a graph in which they were to determine which set
of mappings were functions. Teacher Alpha then gave students the equation 2x – y = 6
and instructed them to create a table and graph it on their notebook paper. As students
worked through these exercises, Teacher Alpha provided guidance by also working
through them on the classroom dry erase board. Teacher Alpha then lectured about non-
linear functions. At the end of the lecture and guided practice, Teacher Alpha assigned a
set of exercises from the book to be completed for homework. Students then worked on
their homework in the remaining time in class.
The exercises within Teacher Alpha‟s control classes contained an average of
about 2 representations per activity. For example, when Teacher Alpha‟s control class
was instructed to complete the starter exercise, students used symbolic representation and
analytical representations. For taking notes, the only representation used was writing.
When given the equation 2x – y = 6, students were instructed to make a table and then
drawing the corresponding graph. Students completed numeric representations within the
table, geometric representations within the graph and symbolic representations within the
equation. Teacher Alpha‟s homework review used numeric, geometric, and symbolic
representations. The notes, lecture, in class examples, guided work, and homework all
used numeric, geometric, symbolic and writing representations.
Teacher Alpha‟s starter exercise had cognitive complexity of Level 2
(skill/concept). Taking notes off the board and practicing the vertical line test are
examples of Level 1 (recall) activities that the control class completed. When students

105
were instructed to make a table and then draw the corresponding graph to exercises like
2x – y = 6, students were working at a Level 2 (skill/concept). Teacher Alpha‟s control
class experienced an average level of about 2 Depth of Knowledge.
Within Teacher Alpha‟s control class, Teacher Alpha functioned at a TPACK
Accepting level. For example, Teacher Alpha demonstrated an Accepting level with the
technology by using PowerPoint and a projector to teach function concepts. By allowing
students to use the Casio non-graphing scientific calculators to perform calculations
while working on mathematics problems, Teacher Alpha continued to demonstrate an
Accepting level of TPACK. Teacher Alpha also demonstrated the Recognizing level
with the technology by using the projector to have the starter up on screen at the
beginning of class and in using it to refer back electronically to materials within the book.
Over the course of this study, Teacher Alpha reported in the questionnaires for the
control class that tables, graphs, mappings, coordinate plane, order pairs, linear equations,
word problems, and PowerPoint presentations were used as representations to teach
functions. Teacher Alpha provided weekly examples of how the representations had
been linked together while teaching. For example, Teacher Alpha stated that “Tables
were used to get the ordered pairs to graph on graphs. Mappings were used to help show
domain and range.” Teacher Alpha also stated that “The students learned how to use the
slope intercept formula „y = mx + b‟ to graph linear equations.”
Teacher Alpha responded within the questionnaire that Casio non-graphing
scientific calculators were used every day of the study for the control class. Teacher
Alpha also responded that the computer and projector were used most days for instruction

106
within the control class. Teacher Alpha reported no issues with any of the teaching tools
that were used during the study for the control class.
When asked about the goals for the control class with respect to learning
functions, Teacher Alpha responded with goals about graphing points on the Cartesian
plane, determining domain and range, and identifying independent and dependent
variables. Teacher Alpha also stated that another goal was that students would master the
concepts of graphing linear equations. Specifically, Teacher Alpha stated that “The
students were to learn the concepts of linear equations and how to relate the formula to
actual graphing of the equation.”
Within the questionnaire, Teacher Alpha was asked to provide examples of how
the tools were used within the control class to teach functions. Teacher Alpha shared that
PowerPoint introduced and illustrated concepts. Teacher Alpha also said that the
coordinate plane was used as a visual guide, the Casio non-graphing scientific calculators
were used to make computations, and the homework assignments provided practice to
reinforce what was taught with the control class. Teacher Alpha also stated that the
“PowerPoint presentations were used to show examples of functions, mappings, tables,
and functions.”
When asked about what Teacher Alpha was able to teach better or more easily
using the tools with the control class, Teacher Alpha stated that “The PowerPoint
presentations seemed to get their attention a lot better than using examples out of their
textbook.” Teacher Alpha added that the “PowerPoint presentations were helpful
showing examples of transition word problems to data that can be used to graph using
linear equations.”

107
When asked for additional comments concerning the control class, Teacher Alpha
indicated that the students seemed to like taking notes from the PowerPoint instead of out
of the book. Teacher Alpha claimed that the PowerPoint presentations were useful tools
to show the transition from formula to graph for the control classes. Teacher Alpha also
commented that the control class students “had trouble interpreting the data from the
graphs to being able to understand their answers.” Teacher Alpha also pointed out that
the concept of slope had to be repeatedly reviewed for the control class, as well as how to
use the data to get the answer.
In the lesson plan analysis, Teacher Alpha recorded various state competencies,
which are listed in Appendix E, for the control class during the course of this study.
Teacher Alpha also had objectives that were aligned with the competencies. For
example, state competency Checks for Understanding 3102.3.15 stated that students were
to “Determine domain and range of a relation and articulate restrictions imposed either by
the operations or by real life situation that the function represents.” Teacher Alpha stated
that the objective was that the “Student will be able to identify domain and range of
relations.”
The methods of instructions used by Teacher Alpha with the control class varied
each day. The starter activities included note taking, working exercises from the board,
and reviewing textbook assignments. Examples of Teacher Alpha‟s control class starters
included graphing coordinate points listed on the board, doing exercises 1-20 on page 255
in the textbook, and writing formulas down multiple times in their notes. Teacher Alpha
used lecture, PowerPoint, and the dry erase board to teach the control class. Teacher
Alpha used a variety of instructional strategies including cooperative learning, small

108
group activities, large group activities, independent practice, and guided practice.
Independent practice was used every day. Large group activities and guided practices
were used every day except on test or quiz days.
Teacher Alpha stated that within the lesson plans, the technology used for the
control class included multi-media PowerPoint presentations, which were used on most
days, and the Casio non-graphing scientific calculator. Teacher Alpha remarked that
within the control class lesson plans, learning styles included auditory and visual
examples daily. Beyond the use of test and quizzes for assessment, Teacher Alpha noted
that observations were used on a daily basis to assess students within the control class.
Lesson plans were collected on the third, sixth and eleventh days to examine
content, Depth of Knowledge (Webb, 2006) and the types of representations used for the
Teacher Alpha‟s control class. The content covered in these lessons was compared to the
content areas that was on the pre-test, post-test and post post-test as listed in Appendix F.
On the third day, Teacher Alpha‟s control class starter covered functions (item 1, item 3,
and item 4) at a Level 2 (skill/concept) and used numeric, geometric, and analytic
representations. Teacher Alpha listed three state competencies which covered the content
area of functions (item 1, item 2, item 3, item 4, item 6, and item 7). These competencies
had a range of Depth of Knowledge from Level 1 (recall) to Level 3 (strategic thinking).
For example, the state competency Checks for Understanding 3102.1.12 (Create and
work flexibly among representations of relations including verbal, equations, tables,
mappings, graphs)was from the function content area (item 1 and item 4) and had a Level
2 Depth of Knowledge. Three goals were stated for the third day; the content area was
functions (item 1, item 2, item 3, item 4, and item 7) and was at either a Level 1 or Level

109
2 Depth of Knowledge. All goals included numeric representations. Two goals also
included geometric representations, two included symbolic representations, and two
included analytic representations. For example, the goal of identifying the domain and
range focused on functions (item 3 and item 7), was at a Level 1 Depth of Knowledge,
and used numeric, geometric and analytic representations. In looking at the textbook
exercises assigned for homework, the concepts covered were within the content area of
functions (item 1, item 2, and item 4) at a Level 2 Depth of Knowledge and used
numeric, geometric, symbolic, and analytical representations.
On the sixth day, Teacher Alpha‟s control class starter covered content area 2 at a
Level 2 on Webb‟s Depth of Knowledge and used both numeric and analytic
representations. Teacher Alpha listed two state competencies which covered the function
content area (item 1, item 3, item 4, and item 7). These competencies had a range of
Depth of Knowledge at Level 2 and Level 3. Four stated goals of the class for the sixth
day included both functions and graphing (item 1, item 2, item 3, item 4, item 8, item 9,
item 10, item 11, and item 13) and were Level 1 and Level 2. All goals included
geometric representations. One goal included numeric representations, two goals
included symbolic representations, and two included analytic representations. In looking
at the textbook exercises assigned for homework, the concepts covered were in the
graphing content area (item 11 and item 13) at a Level 2 Depth of Knowledge and used
geometric, symbolic, and analytical representations.
On the eleventh day, Teacher Alpha‟s control class starter covered content area
11, was at a Level 1, and used numeric, geometric and analytic representations. Teacher
Alpha listed four state competencies that focused on function and graphing content areas

110
(item 9, item 12, and item 13). These competencies had a range of Depth of Knowledge
from Level 1 to Level 3. Four goals of the class for the eleventh day were identified; the
content areas of both functions and graphing (item 10 and item 13) ranged from a Level 1
to Level 3 Depth of Knowledge. All goals included symbolic representations. One goal
focused on numeric representations, three included geometric representations, and three
included analytic representations. The textbook exercises assigned for homework
included the concepts not listed within the content areas covered on the pre-test, post-test
or post post-test. The homework assignment was at a Level 2 and required both symbolic
and analytical representations.
When analyzing the assessments used within Teacher Alpha‟s control class, the
starter activities focused on note taking, review of homework exercises, or similar review
activities. Teacher Alpha‟s control class was assigned all the homework directly from the
textbook or textbook worksheets. Teacher Alpha‟s control classes had both quizzes and
tests. One quiz was a vocabulary quiz, and the other quizzes and chapter tests were from
the textbook publishers.
Teacher Alpha – Treatment Class
Teacher Alpha‟s treatment class was observed on the sixth day of the treatment,
the same day as the control class. During the observation, the types of activities within
Teacher Alpha‟s treatment classroom were the same for Teacher Alpha‟s control class.
These activities included a starter, homework review, a lecture with demonstrations,
guided practice, and homework. Unlike the control class, Teacher Alpha took time
during the starter activity to pass out the TI-Nspire calculators to the students.

111
Teacher Alpha reviewed the starter exercises and allowed discussions to lead
directly into homework review within the treatment class. The homework included
graphing different sets of equations such as y = -1. Teacher Alpha then gave a lecture
using PowerPoint about the relationships, tables, and graphs. Teacher Alpha
demonstrated how to graph y = 2x by using a table and then drawing the line on a graph
using the dry erase board. Students were then given a set of exercises, including y = 3x.
As students worked through these exercises using the TI-Nspire calculator, Teacher
Alpha provided guidance by also working through them on the dry erase board. At the
end of the lecture and guided practice, Teacher Alpha assigned a set of exercises from the
book to be completed for homework. Students then worked on their homework in the
remaining time in class.
The exercises within Teacher Alpha‟s treatment classes contained an average of
2.86 representations per activity. For example, when Teacher Alpha‟s treatment class
was asked to complete the starter exercise, students used symbolic representation and
analytical representations. For the exercise set including y = 3x, students were instructed
to make a table and then to draw the corresponding graph. Students completed numeric
representations within the table and geometric representations within the graph and
symbolic representations within the equation. Teacher Alpha‟s homework review used
both geometric representation and symbolic representations. The lecture, in-class
examples, guided work, and homework included numeric representations, geometric
representations, and symbolic representations.
Teacher Alpha‟s starter exercise had the same cognitive complexity (Level 2) as
the control class. In graphing such equations as y = -1, students were also working at a

112
Level 2. When students were instructed to make a table and then to draw the
corresponding graph to exercises like y = 2x, students worked at a Level 2. Teacher
Alpha‟s treatment class experienced an average level of 2.14 Depth of Knowledge.
Within Teacher Alpha‟s treatment class, Teacher Alpha functioned at a TPACK
level of Accepting. For example, Teacher Alpha was willing to participate in TI-Nspire
professional development activities and to teach using the TI-Nspire within the treatment
classes. In addition, Teacher Alpha also used both the computer projector and TI-Nspire
emulator within the treatment class while demonstrating how to complete exercises.
Teacher Alpha also demonstrated the Recognizing level with the technology by using the
projector to have the starter on screen at the beginning of class and in also using it to refer
back electronically to materials within the book.
Over the course of this study, Teacher Alpha reported on the questionnaires that
tables, graphs, mappings, order pairs, linear equations, word problems, and PowerPoint
presentations were used as representations to teach functions within the treatment class.
Teacher Alpha provided weekly examples of how the representations had been linked
together while teaching. For example, Teacher Alpha stated that “Tables used to find „y‟
given the „x‟ coordinate graphs were used to show lines and to show if they were linear.
Mappings used to help show range and domain.” Teacher Alpha also stated that “The
students learned how to use the slope intercept formula „y = mx + b‟ to graph linear
equations.”
Teacher Alpha responded within the questionnaire that the TI-Nspire was not
used on the first day of this study within the treatment class. However for every
remaining day, the TI-Nspire was used. Teacher Alpha reported issues within the

113
treatment class regarding the TI-Nspire. Those issues included low batteries, lack of
students understanding on how to use them, and the time spent checking the calculators
out to the students each day. Teacher Alpha remarked that “The students have been so
preoccupied with the N-spire calculators that the material covered in the lesson had to go
at a slower pace. After the students got more familiar with the calculators, both classes
were able to go at the same pace.” By the end of the second week of the study, Teacher
Alpha‟s treatment class was able to catch up to Teacher Alpha‟s control class.
When asked about the goals for the treatment class with respect to learning
functions with the TI-Nspire, Teacher Alpha responded with goals about making
“functions easier and more fun for them.” Teacher Alpha also included goals such as to
graphing points on the Cartesian plane, determining domain and range, identifying
independent and dependent variable using real-life examples and mastering the concept
of graphing linear equations using the TI-Nspire. Teacher Alpha stated another goal “to
show how much time the TI-Nspire can save them making tables and graphing
functions.” Additional goals included relating the formulas within the TI-Nspire to the
graphs and interpreting what those graphs meant.
Teacher Alpha provided examples of how the TI-Nspire was used within the
treatment classroom. For example, Teacher Alpha noted that, in using tables and graphs
for linear equations and plotting points, the program “What‟s the Point” from the Texas
Instruments website was used. Teacher Alpha said that “several examples of word
problems and showing how to use linear equations and functions to solve these
problems” were demonstrated for the students. Teacher Alpha also pointed out that the

114
TI-Nspire was used throughout the study to complete calculations, graph linear equations,
and check answers.
When asked about what Teacher Alpha was able to teach better or more easily
using the TI-Nspire than other tools with the treatment class, Teacher Alpha stated that
using and creating tables was much better with the TI-Nspire. Teacher Alpha also said
that answering student‟s questions with the emulator to demonstrate what was being said
was beneficial. When asked for additional comments, Teacher Alpha stated that “the
(treatment) class has to repeatedly go over formulas and where to plug in numbers from
problems into the formulas.” Teacher Alpha pointed out that there was a 50 percent
failure rate within the treatment class and that several students struggled to pass any math
class in middle school. Teacher Alpha also remarked that there were several behavior
issues within the treatment class.
In the lesson plan analysis, Teacher Alpha recorded the same state competencies
as the treatment class during this study, with the exception that the treatment class also
had Course Level Expectation 3102.1.7. This Course Level Expectation states that
students will “Use technologies appropriately to develop understanding of abstract
mathematical ideas, to facilitate problem solving, and to produce accurate and reliable
models.” Teacher Alpha had the same objectives as the control class except that Teacher
Alpha‟s treatment class included the use and application of the TI-Nspire as an objective.
The methods of instructions used by Teacher Alpha with the treatment class
varied each day. The starter activities for the treatment class mainly involved distributing
calculators. Teacher Alpha used lecture, Texas Instruments website activities, the TI-
Nspire emulator, PowerPoint and the dry erase board to teach the treatment class.

115
Teacher Alpha used the same instructional strategies as the control class. Independent
practice was used everyday just like the control classes. Also, large group activities and
guided practices were used on all non-test or non-quiz days just like the control class.
Teacher Alpha noted on the lesson plans that the technology used for the
treatment class included the TI-Nspire graphing calculator on a daily basis and that most
days a PowerPoint presentation was also used. Teacher Alpha remarked that within the
treatment class lesson plans that the learning styles daily included auditory and visual
examples. Teacher Alpha also noted that when using the Texas Instruments website
activities in the treatment class that kinesthetic activities were used as well. Beyond the
use of tests and quizzes for assessment, Teacher Alpha noted within the lesson plans that
observations were used on a daily basis to assess students within the treatment class,
which was the same as the control class.
A lesson plan analysis was also used on the third, sixth and eleventh day to
examine content, Depth of Knowledge (Webb, 2006), and the types of representations
used for the Teacher Alpha‟s treatment class. On the third day, Teacher Alpha‟s
treatment class starter covered the graphing content area (item 11) which was different
from Teacher Alpha‟s control class. However, the content area and types of
representations used were the same as Teacher Alpha‟s control class. Teacher Alpha
listed the same state competencies and goals for the treatment class as the control class;
therefore the content areas covered, Depth of Knowledge, and types of representations
were all the same. Teacher Alpha‟s treatment class homework was different from
Teacher Alpha‟s control class. Teacher Alpha‟s treatment class completed worksheets

116
over the function content area (item 1, item 3, and item 4) at a Level 2 (skill/concept)
Depth of Knowledge and used numeric, geometric, and analytical representations.
On the sixth day of the study, Teacher Alpha‟s treatment class lesson plan was
totally different from Teacher Alpha‟s control class. The treatment class did not include
a starter. Teacher Alpha listed three state competencies for the treatment class which
covered the function content area (item 2, item 3, item 4, item 6, item 7, item 8, item 9,
and item 10). These competencies had either a Level 2 or Level 3 (strategic thinking)
Depth of Knowledge. There were three stated goals that included the function content
area (item 1, item 2, item 3, item 4, and item 7) and were either a Level 1 or Level 2
Depth of Knowledge. Two goals included numeric, geometric and symbolic
representations and the other goal included numeric and analytical representations. The
homework assigned to Teacher Alpha‟s treatment class was from the textbook. The
concepts covered were function content area (item 1, item 2, and item 4) at a Level 2
Depth of Knowledge and used numeric, geometric, symbolic, and analytical
representations.
On the eleventh day of the student, Teacher Alpha‟s treatment class lesson plan
was exactly the same as Teacher Alpha‟s control class lesson plan. The classes had the
same starter, same state competencies, same goals, and the same homework. This also
made all of the content areas, Depth of Knowledge, and types of representations used the
same as well.
When analyzing the assessments used within Teacher Alpha‟s treatment class, the
starter activities were less about exercises or activities and more about passing out the
calculators. Teacher Alpha‟s treatment class used the Scavenger Hunt, What‟s the Point

117
and Intro to Functions Program activities from the Texas Instruments website. While
these activities took place in the treatment classroom setting, homework assignments
were always textbook assignments or textbook worksheets. Teacher Alpha‟s treatment
classes had the same quizzes and tests as the control class.
Across Teacher Alpha’s Treatment and Control Classes
Teacher Alpha‟s treatment class and Teacher Alpha‟s control class were both
observed on the sixth day of the study. While both classes had the same starter, the
remainder of the lesson was different. Teacher Alpha‟s control class reviewed mapping,
domain, range, and the vertical line test. Teacher Alpha‟s treatment class appeared to be
just starting the function material about relationships, tables, and graphs.
Since the starter activity was the same for treatment and control, both classes used
the same three representations, on the starter exercise during the classroom observation.
Teacher Alpha‟s control class completed an average of 2.18 representations during the
twelve different activities whereas; the treatment class completed an average of 2.86
representations during the seven different activities. The Depth of Knowledge (Webb
2006) was the same, Level 2 (skill/concept), for Alpha‟s treatment and control class on
the starter. Teacher Alpha‟s control class experienced an average Depth of Knowledge
level of 1.81 during the twelve different activities. Teacher Alpha‟s treatment class
experienced an average Depth of Knowledge level of 2.14 during the seven different
activities. Teacher Alpha functioned at the same TPACK levels for both classes.
Teacher Alpha functioned at both Recognizing and Accepting levels of TPACK.
Teacher Alpha reported within the questionnaire that tables, graphs, mappings,
coordinate planes, order pairs, linear equations, word problems and PowerPoint

118
presentations were used as representations to teach functions in both the treatment class
and control class. Teacher Alpha noted that prior to the study; both classes were using
the Casio non-graphing scientific calculator. When this study began, Teacher Alpha‟s
treatment class started using the TI-Nspire. Teacher Alpha noted some difficulties for
both the teacher and the student in learning the new technology tool.
Teacher Alpha reported basically the same goals for both classes. Teacher Alpha
provided some TI-Nspire specific goals for the treatment class. For example, Teacher
Alpha stated that one goal for the treatment class was “to show how much time the TI-
Nspire can save them making tables and graphing functions.” Other goals which were
similar for both classes, but Teacher Alpha added a TI-Nspire component to the goal for
the treatment class. For example, Teacher Alpha‟s control class had a goal that included
relating formulas to the graphs and to be able to interpret what those graphs. Teacher
Alpha‟s treatment class had this same goal except it was stated that students would be
relating the formulas within the TI-Nspire to the graphs and then be able to interpret the
meaning of those graphs.
In comparing the issues and benefits with the TI-Nspire, Teacher Alpha
mentioned some of both for the treatment class. In addition to the learning curve issues
that were previously stated, Teacher Alpha said that the time spent distributing the
calculators and replacing batteries was an issue. Teacher Alpha stated that using and
creating tables were much better with the TI-Nspire. Teacher Alpha said that “The
emulator for the N-spire was a great tool to be able to show the students how to do things
on the calculators.” Teacher Alpha also stated that the emulator was beneficial in
answering student questions and working through questions as a class. Teacher Alpha
119
also pointed out that students within the treatment class were better at interpreting data
from graphs and in understanding their answers than were students in the control class.
Teacher Alpha noted fourteen state competencies for the control class and fifteen
for the treatment class. The treatment class had the same competencies as the control
with the addition of Course Level Expectation 3102.1.7. The objectives for Teacher
Alpha‟s treatment class were the same as Teacher Alpha‟s control class with the addition
of using the TI-Nspire to achieve the objectives.
The method of instruction differed in that the treatment class completed activities
designed specifically for the TI-Nspire. Teacher Alpha noted that activities from the
Texas Instruments website were used for the treatment class. These activities included
the use of the TI-Nspire emulator, programs for the TI-Nspire, as well as, worksheets for
the treatment class.
The same instructional strategies were used for both classes. The same types of
assessments were used for both classes. Teacher Alpha also noted that the Casio
calculator was used within the control class, while the treatment class used the TI-Nspire.
Teacher Alpha noted within the lesson plans that both classes used auditory and visual
learning styles, but only the treatment class used the kinesthetic learning style during this
study.
To get a representative sample from the lesson plans, three days were chosen to
compare lesson plans. The third day was chosen, because it was the first day teachers
were teaching without giving a test or introducing the TI-Nspire, a new technology tool.
The sixth day was chosen because it was halfway through the treatment. The eleventh
day was chosen because it was the first day after the treatment had ended.

120
The specific lesson plans on the third, sixth, and eleventh day were compared
with regard to content, representations, and Depth of Knowledge. When comparing
content on the third day, Teacher Alpha‟s treatment class used a TI-Nspire activity to
cover the same objectives and goals as the control class. No difference in the type of
representation of the Depth of Knowledge for Teacher Alpha‟s treatment class or control
class was noted.
On the sixth day of the study, Teacher Alpha‟s lesson plans were different in
comparing the treatment class to the control class. The state competencies, objectives,
and homework assignments were all different. It was evident that the control class was
further ahead of the treatment class in their study of function concepts. For example the
control class covered section three of chapter 5 in the textbook, while the treatment class
still reviewed chapter 4. Both of Teacher Alpha‟s classes had state competencies that
were Level 2 (skill/concept) or Level 3 (strategic thinking). Both of Teacher Alpha‟s
class had goals that were only Level 1 (recall) or Level 2. Teacher Alpha‟s control class
objectives were more focused on geometric representations, while Teacher Alpha‟s
treatment class objectives were more focused on numeric representations.
By the eleventh day of the study, Teacher Alpha‟s treatment class caught up with
Teacher Alpha‟s control class. Both of Teacher Alpha‟s classes were at the same point
within the textbook and with regard to the concepts covered within the class. The starter,
state competencies, objectives and homework were the same for both classes.
The difference in assessments for Teacher Alpha‟s class focused on the TI-Nspire.
While the control class did not participate in any Texas Instrument activities, the Teacher
Alpha‟s control class used several. To compensate for the additional work for the

121
treatment class, Teacher Alpha did not assign as much book work to the treatment class.
All quizzes and test were the same for both the treatment class and control class. All
quizzes and tests came from the textbook and were at either a Level 1 (recall) or Level 2
(skill/concept) Depth of Knowledge. In looking at the representations used, all quizzes
and test used numeric, geometric, symbolic, analytic and written representations.
Teacher Epsilon – Control Class
Teacher Epsilon‟s control class was observed on the eighth day of treatment.
During the observation, the activities within Teacher Epsilon‟s control classroom
included a starter, review of the starter, a review lecture with demonstrations, guided
practice with worksheet assignments, and homework. Teacher Epsilon began class with a
set of equations on the board, and students were instructed to create input/output tables
for each equation.
Teacher Epsilon completed the review of the starter exercises with a kinesthetic
activity. Teacher Epsilon had the students stand and complete a cheer about slope using
their arms to make an airplane. Students would “tilt their wings” to demonstrate positive,
negative, zero and undefined slope. Teacher Epsilon then instructed students to write
definitions of vocabulary words. Teacher Epsilon then used PowerPoint to review
patterns, functions, and sequences. Students were given a review worksheet from the
textbook. Teacher Epsilon then provided guided instruction as students worked through
the worksheet activities. Toward the end of class, Teacher Epsilon reminded students of
the procedure to use y-intercepts to graph and write equations. At the end of class,
Teacher Epsilon instructed students that the remaining exercises on the worksheet were to
be completed for homework.

122
The activities within Teacher Epsilon‟s control classes contained an average of
1.93 representations per problem. For example, when Teacher Epsilon‟s control class
was instructed to complete the starter exercise, students used both numeric and symbolic
representations. When writing definitions, students were only using writing as a
representation. When working worksheet exercises on patterns and sequences, students
only used symbolic representations. When Teacher Epsilon‟s control class students
worked worksheet exercises that had them create a table of coordinates from a graph to
then form an equation, students used numeric, geometric, and symbolic representations.
In looking at the Depth of Knowledge for Teacher Epsilon‟s control class, the
starter was a Level 2 (skill/concept) activity. The kinetic cheer and writing of definitions
were both Level 1 (recall) activities. The exercise of writing the equation of a graph after
choosing coordinates within a table was a Level 2 activity. Teacher Epsilon‟s control
class experienced an average Depth of Knowledge level of 1.43.
Teacher Epsilon appeared to be at the TPACK Recognizing level and somewhat
into the Accepting level. While Teacher Epsilon had access to an emulator and projector
in the classroom, neither technology tool was used during the observation. Teacher
Epsilon used the non-graphing scientific calculators to instruct the control class students
on completing calculations and to reinforce the concepts taught. Teacher Epsilon‟s
participation in professional development workshops that were about integrating
technology into the mathematics classroom would continue to be at an Accepting level.
By allowing students to use the Casio non-graphing scientific calculators to perform
calculations while working on mathematics problems, Teacher Epsilon continued to
demonstrate an Accepting level of TPACK.

123
Over the course of this study, Teacher Epsilon reported in the questionnaire that
tables, graphs, mappings, coordinate plane, order pairs, function notation, linear
equations, graphic organizers and real world problems were used as representations to
teach functions to the control class. Teacher Epsilon provided weekly examples of how
the representations had been linked together while teaching. For example, Teacher
Epsilon stated that “Students determined whether an equation was linear by examination
of the equation.” Teacher Epsilon noted that “tables, ordered pairs, and the coordinate
plane were used in graphing linear equations,” “various representations were used to
solve contextual problems,” and “scatter plots were used to determine correlations” in the
control class.
Teacher Epsilon responded in the questionnaire that Casio non-graphing scientific
calculators were used every day of the study for the control class. Teacher Epsilon also
reported that the computer and projector were used most days for instruction within the
control class. Teacher Epsilon also used individual-sized dry erase boards on which the
students in the control class students drew graphs. The only issue reported by Teacher
Epsilon within the control class was that students seemed to get off task when working
with the individual dry erase boards.
When asked about the goals for the control class with respect to learning
functions, Teacher Epsilon responded with goals that included mastering vocabulary,
graphing points on the Cartesian plane, determining domain and range, and finding slope
when using the slope formula. Teacher Epsilon also listed the goals of identifying
independent and dependent variables using real-life examples, writing equations from
patterns, and using function notation. Specifically Teacher Epsilon stated that students

124
were to “determine if a relation is a function from its graph, from ordered pairs, from a
mapping, and from a table.”
Within the questionnaire, Teacher Epsilon was asked to provide examples of how
the tools were used within the control class to teach functions. Teacher Epsilon indicated
that a PowerPoint was used to introduce concepts and produce model examples and that
the Casio non-graphing scientific calculators were used to compute and reinforce
concepts. Teacher Epsilon explained that the coordinate plane dry erase board was used
by the teacher to plot points and draw lines while the students used individual dry erase
boards. Teacher Epsilon also indicated that various mappings such as concept maps or
thinking maps, such as the Frayer Model, were used to map selected words, attributes,
and representations.
When asked about what Teacher Epsilon was able to teach better or more easily
using the tools with the control class, Teacher Epsilon remarked that within the control
class, the same tools that were used all year were still used, and, as such, nothing really
was better or easier to teach. Teacher Epsilon stated that individual-sized dry erase
boards helped “create more involvement for some students.” Teacher Epsilon added that
“students had rather watch a PowerPoint than constantly see and listen to the teacher.”
When asked for additional comments concerning the control class within the
questionnaire, Teacher Epsilon stated that “The individual graphing (dry erase) boards
and physically modeling slope helped create interest and involvement in the lessons.”
Teacher Epsilon surmised that within the control class, “Many students are having
difficulty with these (function) concepts and having to complete multiple steps.” Teacher

125
Epsilon added that “determining the desired outcome seems to be a problem” for the
control class students.
In looking at the lesson plans, the methods of instruction used by Teacher Epsilon
with the control classes varied each day. The starter activities included copying notes,
reviewing homework, studying for the upcoming quiz, textbook exercises, and working
exercises written on the dry erase board. Examples of Teacher Epsilon‟s control class
starters included review vocabulary, copying outlines from the dry erase board, reviewing
ordered pairs, and doing exercises 37-42 on page 245. Teacher Epsilon used lecture,
PowerPoint, thinking maps, Frayer model, and the dry erase board. Teacher Epsilon used
a variety of instructional strategies including cooperative learning, small group activities,
large group activities, guided practice and independent practice. The main instructional
strategies used were large group activities, guided practice and independent practice.
Teacher Epsilon noted within the lesson plans that the technology used for the
control class was PowerPoint presentations, which was used on most days, a website with
the computer and projector, and the Casio non-graphing scientific calculator. Teacher
Epsilon remarked that, within the control class lesson plans, the learning styles included
auditory, visual, and kinesthetic examples. Examples of kinesthetic learning involved
Teacher Epsilon‟s control class use of painter‟s tape and index cards to create a
coordinate graph on the classroom floor. Beyond the use of test and quizzes for
assessment, Teacher Epsilon noted in her the lesson plans that observations were used
daily and active votes were used on most days to assess students within the control class.
A lesson plan analyses were done on the third, sixth and eleventh day to examine
content, Depth of Knowledge (Webb, 2006) and the types of representations used for

126
Teacher Epsilon‟s control class. The content covered was compared to the content areas
that were used with the pre-test, post-test and post post-test as listed in Appendix F. On
the third day, Teacher Epsilon‟s control class starter was copying notes from the board
which is a Level 1 (recall) activity using written representations. Teacher Epsilon listed
three state competencies which covered the function content area (item 1, item 2, item 3,
item 4, item 6, item 7, and item 10). These competencies had a range of Depth of
Knowledge from Level 1 to Level 3 (strategic thinking). For example, the state
competency Check for Understanding 3102.3.15 (Determine domain and range of a
relation and articulate restrictions imposed either by the operations or by the real-life
situation that the function represents) was over the function concept (item 3 and item 7)
at a Depth of Knowledge Level 3. Two stated goals of the class for the third day were the
function content area (item 1, item 2, and item 4) and were at either a Level 1 or Level 2
(skill/content) Depth of Knowledge. For example, one stated goal was for students to
find function values. This goal covered the function concept (item 2 and item 4) at a
Level 1 Depth of Knowledge using both numeric and analytic representations. All goals
included numeric representations. One goal included geometric and symbolic
representations, while the other goal included analytic representations only. In looking at
the textbook exercises assigned for homework, the concepts covered were within the
function content area (item 1, item 2, item 4, item 9, and item 10) at Level 1, Level 2 or
Level 3 Depth of Knowledge and used numeric, geometric, symbolic, and analytical
representations.
On the sixth day, Teacher Epsilon‟s control class starter was returning a quiz the
students had taken during the previous class period. For the lesson that day, Teacher

127
Epsilon listed one state competency which covered the function content area (item 1 and
item 8). This competency had a Depth of Knowledge of Level 2. Two stated goals for
the class on the sixth day of the study were in; the graphing content area (item 13) had a
Depth of Knowledge of either Level 1 or Level 2. The first goal included geometric and
analytic representations. The second goal included geometric, symbolic and analytic
representations. In looking at the worksheet assigned for homework, the graphing
concept area (item 13) was covered at a Level 2 Depth of Knowledge and used
geometric, symbolic, and analytical representations.
On the eleventh day, Teacher Epsilon‟s control class starter was returning a test
the students had taken during the previous class period. Teacher Epsilon listed two state
competencies which covered the graphing content (item 12). These competencies had a
Depth of Knowledge of Level 1 and Level 2. Two goals of the class were stated for the
eleventh day; neither goal covered a content area that was represented on the pre-test,
post-test, or post post-test. The stated goals were at either a Level 1 or Level 2 Depth of
Knowledge. One goal included geometric and symbolic representations, while the other
included symbolic and analytic representations. The worksheet assigned for homework,
revealed that the concepts again were not listed within the content areas covered on the
pre-test, post-test or post post-test. The homework assignment was at a Level 2 and used
both symbolic and analytical representations.
When analyzing the assessments used within Teacher Epsilon‟s control class, the
starter activities focused on note taking, review of homework exercises, or similar review
activities. Teacher Epsilon used both real-life examples and technology by using
problems from “USA Today.” Teacher Epsilon also had the students use individual dry

128
erase boards to work examples and exercises. Teacher Epsilon‟s control class had all the
homework assignments directly from the textbook or textbook worksheets. Teacher
Epsilon‟s control classes had both quizzes and tests. While vocabulary was reviewed
during the starters, the assessments do not indicate that there was a quiz on it. The
quizzes were given as starters and represented exercises from the book. The chapter tests
were from the textbook publishers.
Teacher Epsilon – Treatment Class
Teacher Epsilon‟s treatment class was observed on the eighth day of treatment,
the same day as the control class. During the observation, the types of activities within
Teacher Epsilon‟s treatment class included a starter, TI-Nspire emulator use, vocabulary
review, Texas Instrument website activity, guided practice, independent practice, and
textbook work. Teacher Epsilon‟s treatment class starter was different from Teacher
Epsilon‟s control class starter. Treatment class students were instructed to find the
domain and range when given an equation such as y = 2x – 1. As students completed this
activity, Teacher Epsilon passed out the TI-Nspire calculators.
Teachers Epsilon reviewed the starter problems and allowed the discussion to lead
directly into the vocabulary review. Teacher Epsilon then used the TI-Nspire Emulator to
demonstrate how to solve the starter problem step-by-step with the TI-Nspire graphing
calculator. Teacher Epsilon then introduced an activity called “Graphing Linear
Equations” from the Texas Instruments website. Students were given a handout from the
website and instructed to “Use the TI-Nspire calculator spreadsheet tool and graphing
functions to solve problems by making tables of x values, give the function, come up
with the ordered pairs, and graph the function.” As the students worked through the

129
worksheet, Teacher Epsilon provided individual guidance and instruction both on how to
use the TI-Nspire and how to complete the worksheet. Upon completion of the
worksheet, students were instructed by Teacher Epsilon to complete a textbook
assignment.
The exercises within Teacher Epsilon‟s treatment class contained an average of
3.08 representations per activity. Teacher Epsilon‟s treatment class starter included both
numeric and symbolic representations. For the Graphing Linear Equations activity,
students worked with tables, plotted ordered pairs, made graphs, and wrote equations. In
completing this exercise, students used numeric representations within the table,
geometric representations within the graph, symbolic representations within the
equations, and analytical representations in choosing ordered pairs. Teacher Epsilon‟s
textbook assignment was a word problem requiring them to analyze and write with
representations.
Teacher Epsilon‟s treatment class‟s starter exercise had the same cognitive
complexity (Level 2) as the control class. In reviewing vocabulary, Teacher Epsilon‟s
treatment class was doing a Level 1 (recall) activity. When students were completing the
Graphing Linear Equation activity as explained above, the treatment class was working
Level 2 (skill/concept) exercises. Teacher Epsilon‟s treatment class experienced an
average level of 2.00 Depth of Knowledge.
Within Teacher Epsilon‟s treatment class, Teacher Epsilon demonstrated TPACK
level of Accepting. Teacher Epsilon was willing to participate in TI-Nspire professional
development activities and to teach using the TI-Nspire in the treatment classes. Teacher
Epsilon used both the projector and emulator within the treatment classes to illustrate

130
concepts. For example, Teacher Epsilon demonstrated an Accepting level with the
emulator technology by using it as an extension of review for the starter exercise.
Within the treatment class, Teacher Epsilon reported using the same types of
representations as the control class. Teacher Epsilon provided weekly examples of how
the representations had been linked together while teaching. The examples for the
treatment class were the same as the control class with the addition of one example.
Teacher Epsilon indicated that “Graphing was used to investigate how changing the y-
intercept modified the linear equation.”
Teacher Epsilon responded within the treatment class questionnaire that the TI-
Nspire graphing calculator was used 80 percent of the time. Teacher Epsilon shared the
personal difficulties of learning how to load programs onto TI-Nspire emulator and
learning how to use it. Teacher Epsilon also said that it was time consuming to load all
of the programs on the individual calculators, having to daily pass them out, and in
dealing with low batteries. Teacher Epsilon expressed the difficulties of “students having
problems finding the correct commands on the calculator.” Teacher Epsilon felt like the
concepts were not learned because students were “playing or typing notes to each other,
instead of doing their work.”
When asked about the goals for the treatment class with respect to learning
functions with the TI-Nspire, Teacher Epsilon responded that one goal was “to web more
concepts together using the TI-Nspire.” Teacher Epsilon also included goals such as
mastering vocabulary, determining domain and range, identifying a relation as a function,
using function notation, and writing equations symbolically to express a contextual
problem. Teacher Epsilon listed the goal for students to be able to “understand that a

131
linear equation has a constant rate of change called slope” and to be able to “represent
slope in various forms.” Teacher Epsilon added that another goal was for students to be
able to “identify independent and dependent variable using real-life examples and be able
to write tables, equation rules, and graph to represent the problem.”
Teacher Epsilon provided examples of how the TI-Nspire was used within the
treatment classroom. Teacher Epsilon listed programs designed for the TI-Nspire such as
Scavenger Hunt, What‟s the Point, and Introduction to Functions, which were
downloaded from the Texas Instruments website. Teacher Epsilon stated that students
would “graph equations from tables, ordered pairs, and equation rules.” Teacher Epsilon
said that students would move a line up and down the y-axis and then see the effects on
the equation or the student would input multiple equations with different slopes to see the
effect on the graphs.
When asked about what Teacher Epsilon was able to teach better or more easily
using the TI-Nspire than other tools in the treatment class, Teacher Epsilon stated that
“The TI-Nspire allows you to web concepts together such as incorporating dependent and
independent variables while graphing real-life situations and determining if there is a
positive correlation, no correlation or a negative correlation between the variables.”
Teacher Epsilon remarked that the TI-Nspire simplified finding slope using the
control/divide feature. Teacher Epsilon went on to say that “The TI-Nspire allows you to
model different representations of functions using the split screen or easily move between
tables, equations and graphs.” Teacher Epsilon also said, “Using the TI-Nspire allows
students to discover important concepts rather than the teacher having to constantly
lecture and model.”

132
When asked for additional comments, Teacher Epsilon stated that treatment class
was a large class and the students were very social. Teacher Epsilon went on to say that
“The students are still more interested in the TI-Nspire as a new toy than as a learning
tool.” Teacher Epsilon summarized the study by saying, “I like the TI-Nspire, but have
had some difficulty with using it and getting students to follow directions using it.”
Teacher Epsilon also expressed concern about the cost to purchase the TI-Nspire due to
other computer and infrastructure needs within the school.
In the lesson plan analysis, Teacher Epsilon listed seven fewer state competencies
for the treatment class than Teacher Epsilon had listed on the lesson plans for the control
class. While Teacher Epsilon‟s treatment class objectives appeared different from
Teacher Epsilon‟s control class, the objectives were simply worded differently by
including the use of the TI-Nspire or other technology within the objective. Teacher
Epsilon‟s treatment class had different objectives than the control class when using the
Texas Instruments website activities. For example, while Teacher Epsilon‟s control class
included objectives on the use of the dry erase board and coordinate plane, Teacher
Epsilon‟s control class would use the emulator and the TI-Nspire to complete those same
objectives.
The methods of instructions used by Teacher Epsilon‟s treatment class varied
each day. The types of starter activities were the same for both classes. In Teacher
Epsilon‟s treatment class, the same methods of instruction were used as in Teacher
Epsilon‟s control class. The only difference was the use of the emulator and the TI-
Nspire. Teacher Epsilon‟s treatment class had fewer thinking map activities than the
control class, but had additional small group activities. For example, one small group

133
activity in Teacher Epsilon‟s treatment class was an experiment using baggies with
washers and rubber bands. The main instructional strategies were the same for both
classes.
Within the lesson plans, Teacher Epsilon noted that the technology used in the
treatment class was the same as that of the control class with the addition of the emulator
and the TI-Nspire calculator. Teacher Epsilon noted that the treatment class used the TI-
Nspire every day. The learning styles within Teacher Epsilon‟s treatment class were the
same as Teacher Epsilon‟s control class. The types of assessments listed on the lesson
plan by Teacher Epsilon for the treatment class were the same as those for the control
class.
A lesson plan analysis was conducted on the third, sixth and eleventh day to
examine content, Depth of Knowledge (Webb, 2006), and the types of representations
used for the Teacher Epsilon‟s treatment class. On the third day, Teacher Epsilon‟s
treatment class lesson plan was exactly like Teacher Epsilon‟s control class. The only
exception was that the treatment class did not include one state competency (Course
Level Expectation 3102.3.25). While the content area for Teacher Epsilon‟s treatment
class was the same as the control class, the treatment class did not cover item 4 or item
10. Teacher Epsilon listed the same goals and homework for the treatment class as the
control class; therefore the content areas, Depth of Knowledge, and types of
representations were all the same.
On the sixth day of the study, Teacher Epsilon‟s treatment class lesson plan was
totally different from that of the control class. The control class did not include a starter;
however, the treatment class starter covered content area 1 with a Level 2 (skill/concept)

134
Depth of Knowledge while using numeric, geometric and symbolic representations.
Teacher Epsilon listed two different state competencies for the treatment class which
covered the same function content area as the control class. While the control class
covered item 1 and item 8, the treatment class covered item 1, item 2, item 3, item 6, and
item 7. The competencies for the treatment class had either a Level 1 (recall) or Level 3
(strategic thinking) Depth of Knowledge. The two stated goals included the function
content areas (item 1, item 2, and item 4) at a Level 1 and Level 2 Depth of Knowledge.
While one goal included numeric, geometric, and symbolic representations, as the other
goal included numeric, symbolic, and analytical representations. The homework
assigned to Teacher Epsilon‟s treatment class was a textbook worksheet covering the
function concept (item 2 and item 4) at a Level 2 Depth of Knowledge and used numeric,
geometric, symbolic, and analytical representations. The homework for Teacher
Epsilon‟s treatment class was different from the control class.
On the eleventh day of the study, Teacher Epsilon‟s treatment class lesson plan
was exactly the same as Teacher Epsilon‟s control class lesson plan. The classes had the
same starter, same state competencies, same goals, and the same homework. The classes
also covered all of the content areas, Depth of Knowledge, and types of representations
used the same as well.
When analyzing the assessments, Teacher Epsilon‟s treatment class had the same
types of starter activities as Teacher Epsilon‟s control class. When it came to classroom
activities, Teacher Epsilon‟s treatment class did not do the coordinate plane activity with
tape and index cards, but they completed the USA Today website and Texas Instruments
website activities. While both classes used textbook worksheets and textbook

135
assignments, Teacher Epsilon‟s treatment class was only assigned the odd exercises.
Teacher Epsilon‟s treatment class had the same type of homework as the control classes,
most of which were textbook worksheets. Both classes used the same outlines, notes,
quizzes and tests.
Across Teacher Epsilon’s Treatment and Control Classes
Both of Teacher Epsilon‟s classes had the same starter, but the remainder of the
lesson was different. Teacher Epsilon‟s control class reviewed slope and then covered
the concepts of patterns, functions, and sequences. Teacher Epsilon‟s treatment class
completed the Texas Instruments activity called “Graphing Linear Equations.”
Since the starter activity was the same for treatment and control, both classes used
the same number of representations, on the starter exercise during the classroom
observation. Teacher Epsilon‟s control class completed an average of 1.93
representations during the fourteen different activities. Teacher Epsilon‟s treatment class
completed an average of 3.08 representations during the thirteen different activities. The
Depth of Knowledge (Webb 2006) was also the same, Level 2 (skill/concept), for
Teacher Epsilon‟s treatment and control class on the starter. Teacher Epsilon‟s control
class had an average Depth of Knowledge level of 1.43 during the fourteen different
activities. Teacher Epsilon‟s treatment class experienced an average Depth of
Knowledge of 2.00 during the thirteen different activities. Teacher Epsilon functioned at
the Recognizing and Accepting TPACK levels for the control class; however, Teacher
Epsilon was closer to the Accepting TPACK level for the treatment class.
Teacher Epsilon reported within the questionnaire that tables, graphs, mappings,
coordinate planes, order pairs, function notation, linear equations, graphic organizers, and

136
word problems were used as representations to teach functions within both the treatment
class and control class. Teacher Epsilon noted that prior to the study, both classes used
the Casio non-graphing scientific calculator. When this study began, Teacher Epsilon‟s
treatment class started using the TI-Nspire. Teacher Epsilon noted some difficulties for
both the teacher and the student in learning the new technology tool in particular for the
teacher when loading new programs on the emulator and calculators.
Teacher Epsilon reported generally the same goals for both classes. Teacher
Epsilon provided some TI-Nspire specific goals for the treatment class. For example,
Teacher Epsilon stated that one goal for the treatment class was “web more concepts
together using the TI-Nspire.” Most goals were similar for both classes, but Teacher
Epsilon added additional goals for the treatment class. For example, one focused on
slope and represented it in various forms while another specifically indicated that
students would be able to “identify independent and dependent variable using real-life
examples and be able to write tables, equation rules, and graphs to represent the
problem.”
In comparing issues with and benefits of the TI-Nspire, Teacher Epsilon
mentioned the initial process of learning to use the TI-Nspire. In addition to the learning
curve issues that were previously stated, Teacher Epsilon said that the time spent
distributing calculators, replacing batteries, and loading programs on each calculator was
an issue. Teacher Epsilon also expressed issues in learning to use the emulator. Teacher
Epsilon also pointed out issues for the treatment class students in that they would not
follow specific directions in using the calculator and had trouble learning the correct
commands. Teacher Epsilon also shared that the control classes had difficulty

137
assimilating all of the information in order to do all the steps to complete some of the
more difficult problems.
While examining Teacher Epsilon‟s lesson plans, Teacher Epsilon noted eleven
state competencies for the control class and eighteen for the treatment class. The
treatment class had seven more state competencies than the control class. The objectives
for Teacher Epsilon‟s treatment class were the same as Teacher Epsilon‟s control class
with the addition of using the TI-Nspire to achieve the objective.
The method of instruction differed in that the treatment class completed activities
designed specifically for the TI-Nspire. Teacher Epsilon noted that activities from the
Texas Instruments website were used for the treatment class. These activities included
the use of the TI-Nspire emulator, programs for the TI-Nspire, and worksheets for the
treatment class. While Teacher Epsilon‟s treatment class would use TI-Nspire emulator,
Teacher Epsilon‟s control class would use the individual dry erase boards. Teacher
Epsilon also noted that the treatment class also had fewer thinking map activities.
The same instructional strategies and learning styles were used for both of classes.
The same types of assessments were used for both classes. Teacher Epsilon also noted
that the control class used the Casio calculator and the treatment class used the TI-Nspire.
Specific lesson plans on the third, sixth, and eleventh day were compared for
content, representations, and Depth of Knowledge. When comparing content on the third
day, Teacher Epsilon‟s treatment class covered one less state competency as the control
class. However, the goals and homework were the same for both classes. The type of
representation of the Depth of Knowledge for Teacher Epsilon‟s treatment class and
control class was not different.

138
By the sixth day of the study, Teacher Epsilon‟s lesson plans were very different
when comparing the treatment class and control classes. The state competencies,
objectives, and homework assignments were all completely different. The control class
was further ahead of the treatment class in their study the function concepts. For example
the control class covered section five of chapter 4 in the textbook, while the treatment
class covered section three of chapter 4. Teacher Epsilon‟s treatment class stated
competencies were at a Level 1 (recall) and a Level 3 (strategic thinking) Depth of
Knowledge, but the control class had a state competency with a Level 2 (skill/concept)
Depth of Knowledge. The treatment class goals were Level 2, while the control class
goals were Level 1 and Level 2. Teacher Epsilon‟s treatment class objectives were more
focused on numeric and symbolic representations, while Teacher Epsilon‟s control class
objectives were focused more on geometric and analytic representations. The homework
assignments in both were worksheets that covered different content areas, but had the
same Level 2 Depth of Knowledge. Both covered geometric, symbolic, and analytic
representations, however, the treatment class homework worksheet also included numeric
representations.
By the eleventh day of the study, Teacher Epsilon‟s treatment class had caught up
with Teacher Epsilon‟s control class. Both of Teacher Epsilon‟s classes were at the same
point within the textbook and in the concepts covered within the class. The starter, state
competencies, objectives and homework were the same for both classes.
The difference in assessments for Teacher Epsilon‟s class focused on the TI-
Nspire. While the control class did not participate in any Texas Instrument activities, the
Teacher Epsilon‟s control class used several. To compensate for the additional work for

139
the treatment class, Teacher Epsilon did not assign as many worksheets to the treatment
class. All quizzes and tests were the same for both of Teacher Epsilon‟s treatment class
and control class. All quizzes and tests came from the textbook and were at either a
Level 1 (recall) or Level 2 (skill/concept) Depth of Knowledge. In looking at the
representations used, all quizzes and test used numeric, geometric, symbolic, analytic and
written representations.
Teacher Gamma – Control Class
Teacher Gamma‟s control class was observed on the fourth day of treatment. The
activities within Teacher Gamma‟s control classroom included a starter, review of the
starter, a review lecture with demonstrations, guided practice with worksheet
assignments, and homework. Teacher Gamma began class with the equation y = 3x + 1
on the board, and students were instructed to determine whether or not it was a function.
Teacher Gamma completed the review of the starter exercise by graphing the
equation on the starter equation on the board and then reviewing the concepts of
coordinate plane, quadrants, and ordered pairs. Teacher Gamma then reviewed how to
use tables and mappings to explain about domain and range and how to determine which
mappings are functions. Teacher Gamma continued to refer back to the starter equation
to continue building on the exercise. Teacher Gamma then reviewed scatter plots and
correlations. Teacher Gamma then had the control class students stand and do a
relaxation activity. At the completion of the relaxation activity, Teacher Gamma
distributed a quiz, which was a textbook worksheet.
The activities within Teacher Gamma‟s control classes contained an average of
2.08 representations per problem. For example, when Teacher Gamma‟s control class

140
was instructed to complete the starter exercise, students used only symbolic
representations. When Teacher Gamma demonstrated the mapping of points from an
equation, students used numeric and symbolic representations. When completing the
quiz, students used different combinations of numeric, geometric, and symbolic
representations.
In looking at the Depth of Knowledge for Teacher Gamma‟s control class, the
starter was a Level 1 (recall) activity. When finding points from an equation and then
mapping them, students completed a Level 2 (skill/concept) activity. Teacher Gamma‟s
control class completed Level 1 and Level 2 Depth of Knowledge exercises while
working on the quiz. Teacher Gamma‟s control class experienced an average Depth of
Knowledge level of 1.82.
Teacher Gamma appeared to be at the Accepting TPACK level. While teaching
the control class, Teacher Gamma used the overhead projector to teach students the
function concepts. Teacher Gamma also used non-graphing scientific calculators to assist
control class students in completing calculations and reinforcing concepts. Teacher
Gamma also allowed students to use calculators to perform calculations while working on
various mathematics exercises. Teacher Gamma‟s participation in professional
development workshops about technology was at a Accepting TPACK level.
Over the course of this study, Teacher Gamma reported within the questionnaire
that tables, graphs, mappings, coordinate plane, order pairs, function notation, linear
equations, patterns and sequences were used as representations to teach functions to the
control class. Teacher Gamma provided weekly examples of how the representations had
been linked together while teaching. Teacher Gamma stated that the students completed

141
various exercises translating among graphs, mappings, tables, and ordered pairs. For
example, Teacher Gamma also noted that “Tables were used to created equations.
Equations were used to find a y-value for a particular x, and an x-value for a particular
y.”
Teacher Gamma responded in the questionnaire that Casio non-graphing scientific
calculators were used every day of the study for the control class. Teacher Gamma also
responded that the computer and projector were used half of the time for instruction
within the control class. Teacher Gamma also recorded the use of both a classroom dry
erase board and individual sized dry erase boards on which the control class students
drew graphs.
In regard to issues, Teacher Gamma stated on the control class questionnaire that
“Students had trouble with the worksheets until they used the whiteboards to see the
representation of functions.” Teacher Gamma also stated that when teaching linear
equations to the control class, the students were “having difficulty grasping slope as rise
over run.” During the last week of this study, Teacher Gamma said,
“The tasks for this week required the students to put together what they had
learned over a couple of weeks, such as slope, y-intercepts, different forms of
linear equations and what information each form gives, etc., in order to find the
linear equations from various starting points. They (control class students) had a
great deal of difficulty with this. I had to re-teach almost all the building
concepts. They did not even seem to remember how to graph an equation when
given the y-intercept and slope.”

142
When asked about the goals for the control class with respect to learning
functions, Teacher Gamma responded with goals including mastering vocabulary,
graphing points on the Cartesian plane, determining domain and range, and identifying
independent and dependent variables using real-life examples. Teacher Gamma also
listed the goals of writing equations in function notation, mastering the vertical line test,
and graphing equations using the slope-intercept form. Specifically, Teacher Gamma
stated that students were to “determine if a relation is a function from its graph, from
ordered pairs, from a mapping and from a table.”
Within the questionnaire, Teacher Gamma was asked to provide examples of how
the tools were used within the control class to teacher functions. Teacher Gamma shared
that PowerPoint was used to illustrate vocabulary as well as introduce and model all
goals. Teacher Gamma explained that the “students used their whiteboards to practice
graphing a y-intercept and an additional point, finding the slope as rise over run, and
writing the resulting equation.” Teacher Gamma commented further, “students used the
whiteboard to plot an x, y table of values and see how a straight line connected the
values.”
When asked about what Teacher Gamma was able to teach better or more easily
using the tools with the control class, Teacher Gamma remarked that within the control
class, the same tools that were used all year were still used and, as such, there was
nothing really that was better or easier to teach. Teacher Gamma did state that “graphing
on the individual whiteboards seemed to help the students grasp the concept of slope as
rise over run.”

143
When asked for additional comments concerning the control class within the
questionnaire, Teacher Gamma stated that “My students really enjoyed this PowerPoint
presentation. The animation seemed to excite the students. It made the students almost
as interested as the students in the treatment class.” Teacher Gamma also remarked that
the control class students were “easily able to find the linear equation for ordered pairs.
However, their understanding does not appear to be complete. When going from an
equation to a graph, they struggle to know how to start at the y-intercept, how to use the
slope to determine the next point.” Teacher Gamma added that “I felt that they (control
class students) are not comprehending the concepts as well as my treatment class.”
Teacher Gamma also provided some additional comments regarding the entire
study within the final control questionnaire. Teacher Gamma stated that “This study
reinforced for me the necessity for developing interesting, engaging lessons. In addition,
I saw how much better the students comprehend the lesson when various methods are
used in conjunction with each other to reinforce the concepts.” Teacher Gamma added
that while the lessons and tasks were basically identical for both classes, “The control
class typically picks up the concepts better, but they seem to also need more re-teaching
than the Nspire (treatment) class.”
Within the lesson plan analysis, the methods of instructions used by Teacher
Gamma with the control classes varied each day. While Teacher Gamma only had
starters listed on the control class lesson plans for half of the days, those starter activities
included textbook worksheet exercises, textbook “Chalkboard 5-minute checks”,
reviewing homework, textbook exercises, and working exercises written on the dry erase
board. Examples of Teacher Gamma‟s control class starters including having the control

144
class students “compute slope for several sets of ordered pairs using the slope formula.”
Teacher Gamma used lecture, PowerPoint, projector, and the dry erase board to teach the
control class. Teacher Gamma used a variety of instructional strategies including
cooperative learning, small group activities, large group activities, guided practice and
independent practice. The main instructional strategies used were large group activities,
guided practice and independent practice. Independent practice was used every day,
while guided practice was used on all days except test days.
Teacher Gamma noted within the lesson plans that technology used for the control
class included PowerPoint, computer with projector, and the Casio non-graphing
scientific calculator. Teacher Gamma remarked that, within the control class lesson
plans, the learning styles included auditory, visual, and kinesthetic examples. Examples
of the kinesthetic learning involved Teacher Gamma‟s control class using the individual
dry erase boards. Beyond the use of tests and quizzes for assessment, Teacher Gamma
noted within the lesson plans that observations were used daily to assess students within
the control class.
A lesson plan analysis was conducted on the third, sixth and eleventh day to
examine content, Depth of Knowledge (Webb, 2006) and the types of representations
used for the Teacher Gamma‟s control class. The content covered was compared to the
content areas that were used with the pre-test, post-test and post post-test as listed in
Appendix F. On the third day, Teacher Gamma‟s control class starter covered graphing
content (item 11) at a Level 1 (recall) Depth of Knowledge while using geometric
representations. Teacher Gamma listed two state competencies which covered function
content (item 1, item 3, item 4, and item 7). These competencies had a Depth of

145
Knowledge at either Level 2 (skill/concept) or Level 3 (strategic thinking). For example,
the competency State Performance Indicator 3102.3.6 (Interpret various relations in
multiple representations) covered the function concept (item 1 and item 4) at a Level 2
Depth of Knowledge. Four stated goals were included in the class for the third day, the
content included functions and graphing (items 1, item 2, item 3, item 4, item 7, item 9,
item 10, item 11, and item 13) and was at a Level 1, Level 2, or Level 3 Depth of
Knowledge. For example, the goal of having student graph coordinate points using rise
and run covered the graphing concept (item 11 and item 13) at a Level 1 Depth of
Knowledge while using geometric and symbolic representations. All goals included
geometric representations. Two goals also included numeric representations; two
included symbolic representations; and two included analytic representations. No
homework was assigned according to Teacher Gamma‟s control class lesson plan.
On the sixth day, Teacher Gamma‟s control class starter covered the function
content area (item 1, item 2, and item 4) at a Level 2 on Webb‟s Depth of Knowledge,
and used both numeric and geometric representations. Teacher Gamma listed two state
competencies which covered the function content area (item 1, item 3, and item 7).
These competencies had a range of Depth of Knowledge going from Level 2 to Level 3.
Two stated goals of the class for the sixth day covered the function content area (item 1,
item 2, and item 4) at a Level 1 or Level 2 Depth of Knowledge. One goal included
geometric representations, while the other goal included numeric, symbolic, and analytic
representations. The worksheet exercises assigned for homework focused on the
concepts covered within the function content area (item 1, item 3, and item 4) at a Level
2 Depth of Knowledge while using geometric and analytical representations.

146
On the eleventh day, Teacher Gamma‟s control class starter covered graphing
content (item 13) at a Level 2 Depth of Knowledge using geometric, symbolic, and
analytic representations. Teacher Gamma listed three state competencies which covered
function and graphing content (item 9 and item 12). These competencies had a Depth of
Knowledge of Level 1 to Level 3. Three stated goals of the class for the eleventh day
were not listed within the content areas covered on the pre-test, post-test or post post-test.
The goals were at a Level 1, Level 2, or Level 3 Depth of Knowledge. All goals included
both geometric and symbolic representations. One goal also included analytic
representations. No homework assignments were listed within Teacher Gamma‟s lesson
plan for the eleventh day of this study.
When analyzing the assessments used within Teacher Gamma‟s control class, the
starter activities were typical textbook exercises which were presented in the form of
“Chalkboard 5-minute checks,” worksheets and other textbook exercises written on the
board for students to work. Teacher Gamma also had the students use individual dry
erase boards to work examples and exercises. Teacher Gamma did not list any
homework assignments on the control class lesson plans; however, Teacher Gamma
submitted copies of classroom assessments that were used for this study. The
assignments that Teacher Gamma submitted for the control class had both classwork and
homework from the textbook or textbook worksheets. Teacher Gamma‟s control classes
had both quizzes and tests. While vocabulary was reviewed during the starters, the
assessments did not indicate that there was a quiz on it. The quizzes were given as
starters and included exercises from within the book. The chapter tests were from the
textbook publishers.

147
Teacher Gamma – Treatment Class
Teacher Gamma‟s treatment class was observed on the fourth day of treatment,
the same day as the control class. During the observation, the types of activities within
Teacher Gamma‟s treatment class included TI-Nspire emulator use, vocabulary review,
guided practice, independent practice, and a quiz. Teacher Gamma‟s treatment class
started differently from Teacher Gamma‟s control class starter. The treatment class
started with distribution of the TI-Nspire calculators to the students and collection of
homework papers.
Teachers Gamma reviewed coordinate planes, points, domain and range. Teacher
Gamma then used the TI-Nspire Emulator to provide guided review and had students
create a table from the equation y = x + 5. Teacher Gamma then instructed her treatment
class to create a mapping from the same equation. Teacher Gamma then reviewed
inverses and instructed the students to make a table on the TI-Nspire calculator. Students
were then instructed to create graph from y = 2x – 1 by finding points, creating tables,
creating a mapping, and inverses. Teacher Gamma then reviewed that problem and
distributed a worksheet for the control class to complete as a quiz. The quiz was the
same one given to the control class earlier.
The exercises within Teacher Gamma‟s treatment class contained an average of
2.22 representations per activity. Teacher Gamma‟s treatment class activity having
students create a table from the equation y = x + 5 included numeric, symbolic, and
analytic representations. For the inverse activity, students worked with tables, plotting
ordered pairs, making graphs, writing equations, and mapping. In completing this
exercise, students used numeric representations within the table, geometric

148
representations within the graph, symbolic representations within the equations, and
analytical representations to choose the ordered pairs and mapping. Teacher Gamma‟s
quiz required students to use geometric, symbolic and analytical representations.
Teacher Gamma‟s treatment class‟ first exercise had the same Depth of
Knowledge (Level 1) as the control class‟s starter activity. In reviewing vocabulary,
Teacher Gamma‟s treatment class did a Level 1 (recall) activity. When completing the
inverse activity as explained above, the treatment class worked with both Level 2
(skill/concept) and Level 3 (strategic thinking) exercises. Teacher Gamma‟s treatment
class experienced an average level of 1.89 Depth of Knowledge.
Within Teacher Gamma‟s treatment class, Teacher Gamma demonstrated the
same TPACK Accepting level as the within the Teacher Gamma‟s control class. All
teachers were willing to participate in TI-Nspire professional development activities and
to teach using the TI-Nspire within their treatment classes. Teacher Gamma used both
the projector and emulator within the treatment classes to illustrate concepts. For
example, Teacher Gamma demonstrated an Accepting level with the emulator technology
by using it as an extension for reviewing inverse relations.
Within the treatment class, Teacher Gamma reported on the questionnaire using
the same types of representations as the control class. Teacher Gamma provided weekly
examples of how the representations had been linked together during teaching. The
examples for the treatment class were much like the control class with the addition of
examples using the TI-Nspire graphing calculator. Teacher Gamma indicated that
“Students used the list function on the Nspire to enter f(x) and x values to determine
values for f(x).” Teacher Gamma also noted that “Using the Nspire, students practiced

149
finding the rise over the run. They graphed 2 coordinate points, determined rise over run,
identified the y-intercept, and displayed the equation using the menu action/coordinates
and equations options.” Teacher Gamma added “The students also found the slope using
algebraic methods and verified their results n the Nspire.”
Teacher Gamma responded within the treatment class questionnaire that the TI-
Nspire graphing calculator was used daily. Teacher Gamma shared the personal
difficulties during the first week of this study stating that “This week, I have not been
confident in my presentation, and the lesson suffers as a result.” Teacher Gamma
explained another issue with students during the first week of the study within the
treatment class by saying,
The students have been so preoccupied with learning the new calculator that the
material covered in the lesson has not been fully absorbed. I will need to review
next week all the material covered this week. However I expect it to go faster
because the students have more involvement (visual, manipulation) than would
normally be the case.
During the second week of treatment, Teacher Gamma remarked, “This week both the
students and I were more confident in using the Nspire…I have noticed that the majority
of the students are more engaged in the lessons.” By the end of the second week of the
study, Teacher Gamma‟s treatment class caught up to Teacher Gamma‟s control class on
the material being taught.
When asked about the goals for the treatment class with respect to learning
functions, Teacher Gamma responded with the same goals as the control class. In
addition to these goals, Teacher Gamma had one additional goal for the treatment class

150
that students were to “master the concept of the vertical line test for functions using the
Nspire.”
Teacher Gamma provided examples of how the TI-Nspire was used within the
treatment classroom. Teacher Gamma listed programs designed for the TI-Nspire, such
as What‟s the Point and Introduction to Functions, which were taken from the Texas
Instruments website. Teacher Gamma added that “I used the Nspire independently from
downloaded lessons to teach creating a table from a function, graphing it, tracing points
on the line to obtain additional ordered pairs.” Teacher Gamma also said that “students
manipulated the lines created on the Nspire by dragging them and changing the slope and
the y-intercept and observing how that changed the equations.”
Teacher Gamma identified different ways that the TI-Nspire had made teaching to
the treatment class better and more easily. In particular, “The TI-Nspire calculator shows
the steps of putting points, tables, and graphs all together.” Teacher Gamma then
compared that with previous use of the Casio graphing calculator and said “In previously
teaching the Casio graphing calculator would simply show the end result, the process was
missing.”
When asked for additional comments, Teacher Gamma stated that the treatment
class was the lower of the two classes. Teacher Gamma expressed concerned that the
treatment class was going to struggle with learning both the new technology and the
lessons concept. Teacher Gamma stated that the “Treatment students have been so
excited about the capabilities of the TI-Nspire that they are doing their work much more
eagerly than ever before. The involvement of the class has improved more than 100%.”
In reflecting on the entire study, Teacher Gamma said,

151
I perceived that the TI-Nspire engaged more complex thought patterns in the
treatment students, relating different concepts in a cohesive manner. The
treatment students, on the whole, performed better on class work and on tests than
they had all semester. The treatment class was my lower class. Until this study,
their ability to learn and perform well on tests was lower than my control class.
During this study, the treatment students‟ performance in class and on tests
increased significantly.
In the lesson plan analysis, Teacher Gamma recorded the same state competencies
for treatment class as the control class during this study, with the exception that the
treatment class had two additional competencies (Course Level Expectation 3102.1.7 and
State Performance Indicator 3102.3.7). The Course Level Expectation states that students
will “Use technologies appropriately to develop understanding of abstract mathematical
ideas, to facilitate problem solving, and to produce accurate and reliable models.” The
State Performance Indicator states that students will “Determine domain and range of a
relation, determine whether a relation is a function and/or evaluate a function at a
specified rational value.” Teacher Gamma had the same objectives as the control class.
The only difference was that within Teacher Gamma‟s treatment class the objectives also
included the use and application of the TI-Nspire.
The methods of instruction used by Teacher Gamma‟s treatment class varied each
day. The types of starter activities were the same for both classes. In Teacher Gamma‟s
treatment class, the same methods of instruction were used as the control class. The only
difference was the use of the emulator and the TI-Nspire. Teacher Gamma‟s treatment
class engaged in additional small group activities than the control class. For example,

152
one small group activity of Teacher Gamma‟s treatment class was an experiment using
baggies with washers and rubber bands. The main instructional strategies were the same
for both classes.
Within the lesson plans, Teacher Gamma noted that the technology used by the
teacher for the treatment class was the same as the control class with the addition of the
emulator and the TI-Nspire calculator. Teacher Gamma noted that the treatment class
used the TI-Nspire every day. Within Teacher Gamma‟s treatment class lesson plans, the
learning styles daily included auditory and visual examples. Teacher Gamma also noted
that, when using the Texas Instruments website activities in the treatment class,
kinesthetic activities were used as well. Beyond the use of tests and quizzes for
assessment, Teacher Gamma noted within the lesson plans that observations were used
on a daily basis to assess students within the treatment class, which was the same as the
control class. The types of assessments listed on the lesson plan by Teacher Gamma for
the treatment class were the same as the control class.
A lesson plan analysis was conducted on the third, sixth and eleventh day to
examine content, Depth of Knowledge (Webb, 2006), and the types of representations
used for the Teacher Gamma‟s treatment class. On the third day, Teacher Gamma‟s
treatment class starter covered the same graphing content area (item 11) as Teacher
Gamma‟s control class. However, the Depth of Knowledge was at a Level 2
(skill/concept) for the treatment class as opposed to Level 1 (recall) for the control class.
The types of representations used for the treatment class included numeric, geometric,
and analytic, whereas the control class included only geometric representations. Teacher
Gamma listed one of the same state competencies for the treatment class as the control

153
class; however, an additional state competency was listed as well. The content areas
covered and the Depth of Knowledge addressed was the same for the treatment class and
the control class. One goal was the same for both classes. The treatment class goals
covered function content (item 1, item 2, item 3, item 4, and item 7) while using Level 1
and Level 2 (skill/concept) Depth of Knowledge. All goals contained numeric
representations. Two goals also contained geometric representations, two contained
symbolic representations, and two contained analytic representations. Teacher Gamma‟s
treatment class was assigned homework, unlike Teacher Gamma‟s control class. Teacher
Gamma‟s treatment class completed worksheets over functions (item 1, item 3, and item
4) at a Level 2 Depth of Knowledge and used numeric, geometric, and analytical
representations.
On the sixth day of the study, Teacher Gamma‟s treatment class lesson plan was
similar to Teacher Gamma‟s control class lesson plan. The starters and state
competencies were the same, meaning same content, same Depth of Knowledge, and
same representations. The goals Teacher Gamma listed for the treatment class were
different from those listed for the control class. Three stated goals included only the
function content (item 1, item 2, item 3, item 4, and item 7) and were either a Level 1 or
Level 2 Depth of Knowledge. Two goals included numeric, geometric and symbolic
representations. The other goal included numeric and analytical representations. The
homework assigned to Teacher Gamma‟s treatment class was to finish a Texas
Instruments activity worksheet. The homework covered the function concept (item 1,
item 2, and item 4) at a Level 2 Depth of Knowledge and used numeric, geometric,
symbolic, and analytical representations.

154
On the eleventh day of the study, Teacher Gamma‟s treatment class lesson plan
was exactly the same as the control class lesson plan. The classes had the same starter,
state competencies, goals, and homework. Therefore all of the content areas, Depth of
Knowledge, and types of representations used the same as well.
When analyzing the assessments, Teacher Gamma‟s treatment class had the same
types of starter activities as the control class. Teacher Gamma noted that during the
beginning of class, time was taken to pass out the TI-Nspire calculators. During the first
week Teacher Gamma‟s treatment class used the Scavenger Hunt, What‟s the Point, and
Intro to Functions Program activities from the Texas Instruments website unlike Teacher
Gamma‟s control class. Teacher Gamma‟s treatment class had the same type of
homework as the control classes, most of which were textbook assignments and textbook
worksheets. Both classes used the same quizzes and tests.
Across Teacher Gamma’s Treatment and Control Classes
Teacher Gamma‟s treatment class and Teacher Gamma‟s control class were both
observed on the fourth day of the study. Teacher Gamma‟s treatment class did not have a
starter, but papers and calculators were distributed during that time. Teacher Gamma‟s
control class reviewed the concepts of the coordinate plane, quadrants, ordered pairs,
domain, range, mappings, and the vertical line test. Teacher Gamma‟s treatment class
appeared to be just starting the function material on tables, mappings, graphs, and
inverses.
Teacher Gamma‟s control class starter had students graphing an equation to
determine if it was a function using the vertical line test with geometric representations.
Teacher Gamma‟s control class completed an average of 2.08 representations during the

155
twelve different activities. Teacher Gamma‟s treatment class completed an average of
2.22 representations during the ten different activities. The Depth of Knowledge (Webb
2006) used on Teacher Gamma‟s control class starter was a Level 1 (recall). Teacher
Gamma‟s control class experienced an average Depth of Knowledge level of 1.82 during
twelve different activities. Teacher Gamma‟s treatment class experienced an average
Depth of Knowledge level of 1.89 during the ten different activities of the observation.
Teacher Gamma functioned at the same TPACK Accepting level for both classes.
Teacher Gamma reported in the questionnaire that tables, graphs, mappings,
coordinate planes, order pairs, function notation, patterns and sequences were used as
representations to teach functions within both the treatment class and control class.
Teacher Gamma noted that, prior to the study, both classes were using the Casio non-
graphing scientific calculator. When this study began, Teacher Gamma‟s treatment class
started using the TI-Nspire. Teacher Gamma noted beginning difficulties for both the
teacher and the students in learning the new technology tool.
Teacher Gamma stated that one benefit for the treatment class was in “Using TI-
Nspire to click and drag the point, seeing slope, intercepts, and points change, really
helped the concepts to gel in the treatment students‟ minds.” Teacher Gamma also
remarked that the treatment class “seemed to really grasp the concept of the (x, y) ordered
pair in a much deeper way,” and that “They also had a deeper understanding of functional
notation as a replacement for y better than the other class, since the Nspire uses function
notation.” Teacher Gamma also said that “Students seemed to really benefit from the
three ways of doing the same task. They seemed to grasp the relationship of the concepts
when they determined their own examples and performed the tasks.” Teacher Gamma

156
stated that the TI-Nspire “engaged more complex thought patterns in the treatment
students, relating different concepts in a cohesive manner.”
Teacher Gamma reported the same goals for both classes. Teacher Gamma
provided one additional TI-Nspire specific goals for the treatment class. That goal
indicated that students should master the concept of the vertical line test while using the
TI-Nspire. While examining lesson plans, Teacher Gamma noted sixteen state
competencies for the control class and eighteen state competencies for the treatment
class. The treatment class had the two additional competencies Course Level Expectation
3102.1.7 and State Performance Indicator 3102.1.7. The objectives for Teacher
Gamma‟s treatment class were the same as Teacher Gamma‟s control class with the
addition of using the TI-Nspire.
The methods of instruction were the same for both Teacher Gamma‟s treatment
and control class. The only difference was the use of the emulator and the TI-Nspire in
the treatment class. Teacher Gamma used the individual dry erase board for the control
class to perform some of the same exercises that the treatment class completed on the TI-
Nspire.
The instructional strategies were the same for both of Teacher Gamma‟s classes.
Teacher Gamma also noted that the Casio calculator was used within the control class,
while the treatment class used the TI-Nspire. Teacher Gamma noted within the lesson
plans that both classes used the auditory, visual, and kinesthetic learning style during this
study.
The specific lesson plans on the third, sixth, and eleventh day were compared for
content, representations, and Depth of Knowledge (Webb, 2006). On the third day,

157
Teacher Gamma‟s lesson plans were totally different when comparing the treatment class
to the control class. While the starters, state competencies, objectives, and homework
assignments were completely different, no difference in Depth of Knowledge for Teacher
Gamma‟s treatment class or control class were noted when comparing the state
competencies or the goals. Teacher Gamma‟s treatment class had a Level 2
(skill/concept) Depth of Knowledge whereas the control class only completed a Level 1
(recall) activity. A difference was noted in the types of representations. Teacher
Gamma‟s treatment class had a started that used numeric, geometric, and analytic
representations while Teacher Gamma‟s control class only used the geometric
representation. Within the goals, the treatment class was more focused on numeric
representations, while the control class used more geometric representations.
By the sixth day of the study, Teacher Gamma‟s lesson plans were closer for the
treatment class and the control class. The starter and the state competencies were the
same. The goals were different for the Teacher Gamma‟s treatment and control classes.
While the goals for each class included both Level 1 and Level 2 Depth of Knowledge,
the treatment class included twice as many representations as the control class. For the
homework assignment, Teacher Gamma‟s treatment class was asked to finish a Texas
Instruments activity worksheet while Teacher Gamma‟s control class completed a
textbook worksheet. Although both worksheets were a Level 2 Depth of Knowledge, the
TI Activity for the treatment class had twice as many representations when compared to
the textbook worksheet of the control class.
By the eleventh day of the study, Teacher Gamma‟s treatment class had caught up
with Teacher Gamma‟s control class. Both of Teacher Gamma‟s classes were at the

158
same point within the textbook and in the concepts covered within the class. The starter,
state competencies, objectives and homework were the same for both classes.
The difference in assessments for Teacher Gamma‟s class focused on the TI-
Nspire. While the control class did not participate in any Texas Instrument activities, the
Teacher Gamma‟s treatment class engaged in several. All quizzes and tests were the
same for both of Teacher Gamma‟s treatment class and control class. All quizzes and
tests came from the text book and were at either a Level 1 (recall) or Level 2
(skill/concept) Depth of Knowledge. In looking at the representations used, all quizzes
and tests used numeric, geometric, symbolic, analytic and written representations.
Teacher Zeta – Control Class
Teacher Zeta‟s control class was observed on the fourth day of treatment. During
the observation, the activities within Teacher Zeta‟s control classroom included a starter,
guided practice, lecture, worksheet and homework. The control classroom starter
instructed students to state ordered pairs when given a table of data or an ordered pair on
a graph. Teacher Zeta completed a review of the starter via PowerPoint for the control
class to lead the class into the lecture, which was also taught via PowerPoint with
interactive examples. Teacher Zeta then passed out a textbook worksheet for the students
to complete. Teacher Zeta guided the students through the first exercise where they were
instructed to create a graph and a table using substitution for the equation y = 4. Teacher
Zeta then provided guided examples of completing the table via PowerPoint for the
control class. Students then worked independently on the worksheet while Teacher Zeta
walked about the room helping students as needed. Toward the end of class, Teacher
Zeta refocused the class on another equation, y = 4 – x, and had the class students create a

159
graph, complete a table, and use substitution to find ordered pairs. After completing this
exercise with the students, Teacher Zeta instructed the students to work until the bell on
the given worksheet and finish the worksheet for homework.
The exercises within Teacher Zeta‟s control classes contained an average of 3.00
representations per activity. For example, when Teacher Zeta‟s control class was
instructed to complete the starter exercise, students used numeric representations and
geometric representations. For the equation y = 4, when students were instructed to
create a graph and table by using substitution, students completed geometric
representations within the graph, numeric representations in the table, symbolic
representations in the equation, and analytic representations in choosing the points.
Teacher Zeta‟s worksheet review included numeric, geometric, and symbolic
representations. The notes, lecture, in-class examples, guided work, and homework all
included numeric representations, geometric representations, and symbolic
representations.
Teacher Zeta‟s starter exercise had a cognitive complexity of Level 2
(skill/concept) for the students. When the control class students were instructed to use
the equation y = 4 – x to create a graph, complete a table, and use substitution to find
ordered pairs, they worked at a Level 3 (strategic thinking). Teacher Zeta‟s control class
experienced an average level of 2.11 Depth of Knowledge.
Teacher Zeta continually infused the control classroom with technology and
appeared to be at the Accepting TPACK level and, at times, the Adapting TPACK level.
By exploring the many ways to use PowerPoint and creating interactive slides, Teacher
Zeta provided the control class with instruction that modeled what the treatment class

160
received with the TI-Nspire. This allowed Teacher Zeta to become a guide while the
students explored and applied the technology concepts. The graphs, problems, and step-
by-step solutions that Teacher Zeta adapted the technology and explored additional ways
to use the technology while challenging the students to think at higher levels. Teacher
Zeta‟s participation in professional development workshops that integrated technology
into the mathematics classroom would continue to be at an Accepting level. By allowing
students to use the Casio non-graphing scientific calculators to perform calculations
while working on mathematics problems, Teacher Zeta demonstrated an Accepting level
of TPACK.
Teacher Zeta reported in the questionnaires for the control class that tables,
graphs, mappings, order pairs, and PowerPoint presentations were used as representations
to teach functions. Teacher Zeta provided weekly examples of how the representations
had been linked together while teaching. For example, Teacher Zeta stated that “I‟ve
used tables to solve and form ordered pairs. I then used those ordered pairs to graph the
corresponding line onto a graph.” Teacher Zeta also gave the example that “Problems
were first written out and then solved for algebraically by substitution variables, and then
the equation was graphed to visualize the line.”
Teacher Zeta responded on the questionnaire that Casio non-graphing scientific
calculators were used on every day of the study for the control class. Teacher Zeta also
responded that computer and projector were used with PowerPoint most of the days for
instruction within the control class. Teacher Zeta reported no issues with any of the
teaching tools that were used during the study for the control class.

161
When asked about the goals for the control class with respect to learning
functions, Teacher Zeta responded with goals concerning finding ordered pairs, graphing
functions, determining if a relation is a function, calculating slope, and writing an
equation in slope-intercept form. Teacher Zeta also stated that another goal for the
students was “to be able to calculate an equation of a line when given one point.”
Teacher Zeta added that an extension to that goal was for students to be given one point
and a line parallel or perpendicular to that line.
On the questionnaire, Teacher Zeta was asked to provide examples of how the
tools were used within the control class to teach functions. Teacher Zeta indicated that
PowerPoint was used to introduced and illustrated concepts. Teacher Zeta provided an
example of how motion and animation within PowerPoint was used to demonstrate the
vertical line test as well as how to solve problems when given only a point and slope.
Teacher Zeta added that “I showed students how to make a table by substituting x values
into the equation then solving for y.” Teacher Zeta also commented that students used
individual dry erase boards to practice graphing.
When asked about what Teacher Zeta was able to teach better or more easily
using the tools with the control class, Teacher Zeta stated that “The dry erase boards
seem to excite the students more than typical pencil and paper does.” Teacher Zeta added
that “PowerPoint allowed for a great visual demonstration.” When asked for additional
comments concerning the control class, Teacher Zeta did not have a response.
In the lesson plan analysis, Teacher Zeta recorded various state competencies
(listed in Appendix E) for the control class during the course of this study. Teacher Zeta
also identified objectives that accompanied the competencies. For example, state
162
competency Checks for Understanding 3102.3.15 stated that students were to “Determine
domain and range of a relation and articulate restrictions imposed either by the operations
or by real life situation that the function represents” and Teacher Zeta stated that the
student was “to be able to graph a function to real-world situations, and be able to
interpret the results and determine what type of a relationship the two variables have.”
The methods of instructions used by Teacher Zeta with the control class varied
each day. The starter activities included note taking, working exercises from the board,
and textbook assignments. Teacher Zeta‟s control class starters were all real life
applications that emphasized mathematics. For example, Teacher Zeta showed a house,
then used animated lines to form a triangle, and talked about slope as well as the effect of
rain drainage creating the need for gutters. Teacher Zeta also used a graph to plot the
relationship between the percent of blood flow after a concussion to the number of days
since the concussion. Teacher Zeta used lecture, interactive PowerPoint, and the dry
erase board to teach the control class. Teacher Zeta used a variety of instructional
strategies including cooperative learning, small group activities, large group activities,
independent practice and guided practice. Every day independent practice was used.
Large group activities and guided practice were used every day except on test or quiz
days.
Teacher Zeta stated within the lesson plans that the technology used for the
control class was the use of multi-media PowerPoint presentation, which was used on
most days, and the Casio non-graphing scientific calculator. Teacher Zeta added that
within the control class lesson plans that the learning styles daily included auditory and

163
visual examples. Beyond the use of test and quizzes for assessment, Teacher Zeta noted
that observations were used daily to assess students in the control class.
A lesson plan analysis was done on the third, sixth and eleventh day to examine
content, Depth of Knowledge (Webb, 2006) and the types of representations used for the
Teacher Zeta‟s control class. The content was compared to the content areas that were
used with the pre-test, post-test and post post-test as listed in Appendix F. On the third
day, Teacher Zeta‟s control class starter covered the graphing content area (item 11) at a
Level 2 (skill/concept) Depth of Knowledge while using numeric and geometric
representations. Teacher Zeta listed two state competencies, which covered the function
content area (item 1, item 2, item 3, item 6, and item 7) at a Depth of Knowledge at either
Level 1 (recall) or Level 3 (strategic thinking). For example, the state competency
Checks for Understanding 3102.3.16 (Determine if a relation is a function from its graph
or from a set of ordered pairs) covered the function content area at a Level 1 Depth of
Knowledge. Three goals of the class for the third day included the function concept (item
1, item 2, item 4, and item 10) and was at either a Level 2 or Level 3 Depth of
Knowledge. All goals included both geometric and symbolic representations. One goal
also included numeric representations, while the other two included analytic
representations. For example, the goal to create a graph of a function using a real world
situation covered the function content area (item 2) while at a Level 3 Depth of
Knowledge using geometric, symbolic, and analytic representations. The textbook
worksheet assigned for homework revealed that the concepts covered were within the
function content area (item 2 and item 4) at a Level 2 Depth of Knowledge and used
numeric, geometric, symbolic, and analytical representations.

164
On the sixth day, Teacher Zeta‟s control class starter focused on the function
content (item 9), at a Level 2 Depth of Knowledge, and used numeric, geometric, and
analytic representations. Teacher Zeta listed two state competencies that covered the
function content (item 2, item 3, item 4, item 6, item 7, and item 10) with a Depth of
Knowledge of either Level 2 or Level 3. Three stated goals of the class for the sixth day
covered the function content area (item 1, item 2, item 4, and item 10) at a Depth of
Knowledge of Level 1, Level 2, or Level 3. One goal included numeric, geometric and
symbolic representations; one goal included numeric and analytic representations; and
one goal included geometric, symbolic, and analytic representations. The worksheet
assigned for homework covered the function concepts (item 1, item 2 and item 4) at a
Level 2 Depth of Knowledge and used numeric, geometric, symbolic, and analytical
representations.
On the eleventh day, Teacher Zeta‟s control class starter was not listed within the
content areas covered on the pre-test, post-test or post post-test. The Depth of
Knowledge for the starter was Level 2 and used both geometric and analytic
representations. Teacher Zeta listed four state competencies that covered the function
and graphing content areas (item 9, item 12, and item 13). These competencies had a
range of Depth of Knowledge going from Level 2 to Level 3. Four stated goals of the
class for the eleventh day covered the function and graphing content areas (item 10 and
item 13) at either a Level 1 or Level 2. All goals included symbolic representations. One
goal included numeric representations, three included geometric representations, and
three included analytic representations. The worksheet assigned for homework focused
165
on the graphing content area (item 13) at a Level 2 Depth of Knowledge, and used
geometric, symbolic and analytical representations.
When analyzing the assessments used within Teacher Zeta‟s control class, the
starter activities were real-life applications of mathematics. Class activities for Teacher
Zeta‟s control class were typically from the textbook or from textbook worksheets.
However, once during the study, Teacher Zeta gave the control class a worksheet from
the Texas Instruments website. While the control class did not use the TI-Nspire to
complete the worksheet, Teacher Zeta asked the control class to use the individual white
boards to answer the exercises on the worksheet. Teacher Zeta‟s control class had all the
homework assignments directly from the textbook or textbook worksheets. Teacher
Zeta‟s control classes had both textbook quizzes and textbook tests.
Teacher Zeta – Treatment Class
Teacher Zeta‟s treatment class was observed on the fourth day of the treatment,
same day as the control class. During the observation, the activities within Teacher
Zeta‟s treatment classroom were the same for Teacher Zeta‟s control class. These
activities included a starter, homework review, a lecture with demonstrations, guided
practice, and homework. Teacher Zeta‟s control class starter required students to create a
table, graph and find multiple points for a given equation. Unlike the control class,
Teacher Zeta passed out the TI-Nspire calculators to the students during the starter
activity.
Teachers Zeta reviewed the starter exercises by using the Nspire emulator and
allowed the discussion to lead directly into the lesson. Teacher Zeta‟s lesson focused on
graphing lines when given points on a graph. Teacher Zeta gave the lecture using both

166
PowerPoint and the Nspire emulator and included discussion connecting points, tables,
graphs, and lines. For example, Teacher Zeta demonstrated how to take an equation such
as y = 2x + 5, use a table to create a set of order pairs, plot points on a coordinate system,
draw a line on a graph, and determine if the relation is a function. Teacher Zeta used a
combination of PowerPoint, the dry erase board, and the emulator to complete these
tasks. Students were then given a worksheet with similar exercises. As students worked
through these exercises using the TI-Nspire calculator, Teacher Zeta provided guidance
to individual students. Teacher Zeta provided examples throughout the rest of the class
on different exercises in the worksheet. At the end of class students were assigned the
remainder of the worksheet for homework.
The exercises within Teacher Zeta‟s treatment classes contained an average of
2.55 representations per activity. For example, when Teacher Zeta‟s treatment class was
asked to complete the starter exercise, students used numeric, geometric, symbolic, and
analytical representations. When students were asked to simply graph via the TI-Nspire
emulator, students only used geometric representations. When asked to put the equation
3x + 2y = 6 into slope intercept form, students only used symbolic representations. The
lecture, in class examples, guided work, and homework used numeric, geometric,
symbolic, analytic, and writing representations.
Teacher Zeta‟s treatment class starter was at a higher Depth of Knowledge (Level
3) than that of the control class. When students were instructed to create a table, draw the
corresponding graph, and find four points on the graph, they worked at a Level 3
(strategic thinking). When manipulating an equation into slope-intercept form, the
167
treatment class worked at a Level 2 (skill/concept) Depth of Knowledge. Teacher Zeta‟s
treatment class experienced an average level of 2.18 Depth of Knowledge.
Teacher Zeta‟s treatment class functioned at the same TPACK level (Accepting
and Adapting) as the control class. For example, Teacher Zeta worked at an Adapting
level when using combination of the computer projector, PowerPoint, and TI-Nspire
emulator within the treatment class while demonstrating how to complete exercises.
Teacher Zeta also worked at the Adapting level with the technology by using the
interactive features within PowerPoint to provide a visual example of the vertical line
test. Teacher Zeta‟s participation in professional development workshops that were
integrating technology into the mathematics classroom was at the Accepting level. By
allowing students to use the TI-Nspire calculators to perform calculations while working
on mathematics problems, Teacher Zeta continued to demonstrate the Accepting level of
TPACK.
Teacher Zeta reported on the questionnaires that the same representations used to
teach functions to the treatment class were also used with the control class. Teacher Zeta
provided weekly examples of how the representations had been linked together while
teaching. For example, Teacher Zeta stated that “Equations were solved algebraically by
substituting x, y and m and then solving for b. They were then linked graphically using
the N-spire to visualize the equation.”
Teacher Zeta responded on the questionnaire that the TI-Nspire was used for all
but two days of this study. Teacher Zeta reported issues within the treatment class
regarding the TI-Nspire. During the first week, Teacher Zeta indicated that “The lessons
were considerably slower just to allow students time to become familiarized with the

168
calculators.” However, Teacher Zeta had the treatment class cover the same material as
the control class. Teacher Zeta also stated that some pre-installed programs were different
using the calculators. Teacher Zeta went on to say that “The students struggled a little bit
while graphing two points then finding the equations. There seemed to be too many steps
in order to find the equation.” Teacher Zeta also reported that “Students found it a little
difficult switching over to calculator mode, to do a calculation to help with their graph.”
When asked about the goals for the treatment class with respect to learning
functions with the TI-Nspire, Teacher Zeta responded that they were the same as the
control class. Teacher Zeta provided examples of how the TI-Nspire was used within the
treatment classroom. For example, Teacher Zeta noted that in using tables and graphs for
linear equations and plotting points that the program “What‟s the Point” from the Texas
Instruments website was used. Teacher Zeta stated, “I showed students how to use a
table and the formula bar to have the calculator automatically calculate y values to their x
value inputs, then transfer those ordered pairs to a graph.” Teacher Zeta also said, “I
would help students plot both points on a graph, then use the equation button to show the
y = mx + b equation for the line.”
When asked what content was more easily or better taught using the TI-Nspire,
Teacher Zeta stated that it was so much quicker and easier to substitute and solve.
Teacher Zeta also stated, “The Nspire makes a much better visual demonstration for the
vertical line test.” Teacher Zeta remarked about how the TI-Nspire allowed students to
solve slope without using parentheses as well as demonstrate perpendicular slope as the
negative reciprocal.

169
In the lesson plan analysis, Teacher Zeta‟s treatment class lesson plan recorded
the same state competencies as the control class during this study. Teacher Zeta used the
same objectives as the control class. The only difference was that, within Teacher Zeta‟s
treatment class, the objectives also included the use and application of the TI-Nspire.
Teacher Zeta‟s treatment class also was expected to check their work using the TI-Nspire.
The methods of instruction used by Teacher Zeta with the treatment class varied
somewhat each day. The starter activities for the treatment class were the same as the
control class. In addition to the control class activities, Teacher Zeta also used activities
from the Texas Instruments website. These activities included TI Scavenger Hunt,
What‟s the Point, Function Junction, Exploring Linear Equations, and TI-Parallel and
Perpendicular Lines Program. The TI Scavenger Hunt activity teaches students about the
features that are commonly used with the TI-Nspire. The What‟s the Point activity has
students drag a point around on the coordinate plane using the TI-Nspire. The TI-Parallel
and Perpendicular Lines activity has students exploring lines, calculating slope, and
dragging lines to be either parallel or perpendicular while watching the slope of the
equation change. Teacher Zeta used the same instructional strategies as the control class.
Independent practice was used everyday just like in the control classes.
Teacher Zeta noted in the lesson plans that the technology used for the treatment
class included the TI-Nspire graphing calculator on a daily basis and that most days a
multi-media PowerPoint presentation and the TI-Nspire emulator was used. Teacher Zeta
remarked that, within the treatment class lesson plans, the learning styles daily included
auditory and visual examples. Teacher Zeta also noted that, when using the Texas
Instruments website activities in the treatment class, kinesthetic activities were used as

170
well. Beyond the use of test and quizzes for assessment, Teacher Zeta noted that
observations were used on a daily basis to assess students within the treatment class,
which was the same as the control class.
A lesson plan analysis was also done on the third, sixth and eleventh day to
examine content, Depth of Knowledge (Webb, 2006) and the types of representations
used for the Teacher Zeta‟s treatment class. On the third day of the study Teacher Zeta‟s
treatment class lesson plan was exactly the same as that of the control class. The classes
had the same starter, same state competencies, and the same goals. The content areas,
Depth of Knowledge, and types of representations used the same as well. Teacher Zeta‟s
treatment class had the same homework worksheet as the control class with the addition
of a Texas Instruments activity called “Intro to Functions.” This Texas Instruments
activity covered the function content (item 1, item 2, and item 4) at a Level 2
(skill/concept) Depth of Knowledge while using numeric, geometric, symbolic, and
analytical representations.
On the sixth day of the study, Teacher Zeta‟s treatment class lesson plan was
exactly the same as that of the control class. The classes had the same starter, state
competencies, goals, and homework. Therefore all the content areas, Depth of
Knowledge, and types of representations were the same as well.
On the eleventh day of the study, Teacher Zeta‟s treatment class lesson plan was
exactly the same as the control class lesson plan. The classes had the same starter, state
competencies, goals, and homework. Therefore all of the content areas, Depth of
Knowledge, and types of representations were the same as well.

171
When analyzing the assessments used in Teacher Zeta‟s treatment class, the
starter activities were the same as the control class. While Teacher Zeta‟s treatment class
used activities from the Texas Instruments website, the treatment class only used part of
the worksheets and homework that the control classes completed. While these TI
activities took place in the treatment classroom setting, homework assignments were
always textbook assignments or worksheets. Teacher Zeta‟s assessments in the treatment
class focused on finding more points on a line than the treatment class. Also, Teacher
Zeta asked the treatment class to not only graph lines, but also to find both parallel and
perpendicular lines as opposed to finding one or the other with the control class. Teacher
Zeta‟s treatment classes took the same quizzes and tests as the control class.
Across Teacher Zeta’s Treatment and Control Classes
Teacher Zeta‟s treatment class and Teacher Zeta‟s control class were both
observed on the fourth day of the study. During the observation, the types of activities
within these classes were the same. These activities included a starter, homework review,
a lecture with demonstrations, guided practice, and homework. Teacher Zeta‟s control
class starter instructed the students to create a table, graph, and find multiple points for a
given equation.
Since the starter activity was the same for treatment and control, both classes used
the same number of representations (three) on the starter exercise during the classroom
observation. Teacher Zeta‟s control class completed an average of 3.00 representations
during the nine different activities. Teacher Zeta‟s treatment class completed an average
of 2.67 representations during the twelve different activities. The Depth of Knowledge
was also at Level 2 (skill/concept) for Teacher Zeta‟s treatment and control class on the

172
starter. Teacher Zeta‟s control class experienced an average Depth of Knowledge level
of 2.11 for nine activities. Teacher Zeta‟s treatment class experienced an average Depth
of Knowledge level of 2.18 for the twelve activities. Teacher Zeta functioned at the same
Accepting and Adapting TPACK levels in both classes.
Teacher Zeta reported within the questionnaire that tables, graphs, mappings,
order pairs, and PowerPoint presentations were used as representations to teach functions
in both the treatment and control classes. Teacher Zeta noted that prior to the study; both
classes were using the Casio non-graphing scientific calculator. When this study began,
Teacher Zeta‟s treatment class started using the TI-Nspire. Teacher Zeta noted some
difficulties for the student in learning the new technology tool. Teacher Zeta reported the
same goals for both classes. Teacher Zeta added the goal for the treatment class to check
their work using the TI-Nspire.
In comparing issues and benefits with regard to the TI-Nspire, Teacher Zeta
mentioned both for the treatment class. Teacher Zeta indicated that the treatment class
moved at a slower pace while the students were learning with the new TI-Nspire.
Teacher Zeta also said that students struggled with the multiple steps and in switching
between graphing and calculators. When discussing the benefits of the TI-Nspire in the
treatment class, Teacher Zeta stated that it was quicker and easier to “substitute x values
into and equation and solve for y.” Teacher Zeta also stated, “The Nspire showed a
better visual demonstration of graphing a line by connecting two points.” Teacher Zeta
remarked how “using the function button allowed students to solve slope without using
parentheses like other calculators.” Teacher Zeta also remarked, “I have been able to

173
show students visually perpendicular slope and why it is a negative reciprocal to the other
line by grabbing the line and flipping it over using the calculator.”
Teacher Zeta‟s lesson plans revealed the same eleven state competencies for both
the control class and the treatment class. The objectives for Teacher Zeta‟s treatment
class were also the same as the control class, with the addition of having students check
their work using the TI-Nspire. The methods of instruction were the same for both
classes. While Teacher Zeta used activities designed specifically for the TI-Nspire within
the treatment class, Teacher Zeta used some of those same activities without the use of a
calculator. While Teacher Zeta used the TI-Nspire emulator within the treatment class,
Teacher Zeta created interactive PowerPoint presentations to help compensate for the
control class not having the TI-Nspire. The same instructional strategies and assessments
were used for both of Teacher Zeta‟s classes. Teacher Zeta also noted that the Casio
calculator was used within the control class, while the treatment class used the TI-Nspire.
The specific lesson plans on the third, sixth, and eleventh day were compared
with regard to content, representations, and Depth of Knowledge. When comparing
content on the third day, Teacher Zeta‟s treatment class used a TI-Nspire activity to cover
the same objectives and goals as the control class. No difference in the type of
representation of the Depth of Knowledge Teacher Zeta‟s treatment class or control class
was noted.
On the sixth day of the study, Teacher Zeta‟s treatment class and control class
were at the same point in the textbook and focused on the same concepts. The starter,
state competencies, objectives and homework were the same for both classes. The same

174
was still on the eleventh day of the study. Both the treatment class and the control class
seemed to cover the material at the same pace.
The difference in assessments for Teacher Zeta‟s class focused on the TI-Nspire.
While the control class used some of the Texas Instrument activity worksheets, the
treatment class used several. To compensate for the additional work in the treatment
class, Teacher Zeta gave the control class additional textbook worksheets. All quizzes
and tests were the same for both of Teacher Zeta‟s treatment class and control class. All
quizzes and tests came from the textbook and were at either a Level 1 (recall) or Level 2
(skill/concept) Depth of Knowledge. All quizzes and tests used numeric, geometric,
symbolic, analytic and written representations.
Summary of Control Classes
All control classes were observed within the first two weeks of the study. They
all included a starter, guided practice, lecture and homework. All teachers covered the
function content and the graphing content during the control class observation, on the
questionnaire, within their lesson plans, and in the assessments.
All teachers used multiple representations during the control class observation and
included numeric, geometric, symbolic, and analytic representations. Teacher Alpha and
Teacher Gamma also used writing as a representation during the control class
observation. On the questionnaire, all teachers reported using tables, graphs, mappings,
and ordered pairs as a means to represent the function concept to the control class.
Within the lesson plan analysis of the third, sixth, and eleventh day of the study, all
teachers included using some form of numeric, geometric, symbolic, and analytic
representations for their control class goals. Teacher Alpha, Teacher Epsilon, and

175
Teacher Zeta included assessments in their lesson plans, and they used numeric,
geometric, symbolic, and analytic representations. However Teacher Gamma assigned
homework on only one of the three days and, on that day, only geometric and analytic
representations were used. The analysis of the control class assessments revealed that
each teacher used numeric, geometric, symbolic, analytic and writing representations.
Although all control classes had starters, Teacher Gamma‟s starter was at Level 1
(recall), while Teacher‟s Alpha, Epsilon, and Zeta starters were at Level 2 (skill/concept).
All teachers used Level 1 and Level 2 Depth of Knowledge activities. Teacher Epsilon
and Teacher Zeta were the only teachers who used a Level 3 (strategic thinking) activity.
On the lesson plans of the third, sixth and eighth day of the study, all teachers stated state
competencies at a Level 1, Level 2 or Level 3 Depth of Knowledge. Teacher Alpha,
Teacher Gamma, and Teacher Zeta included goals at a Level 1, Level 2 or Level 3 Depth
of Knowledge. Teacher Epsilon only included competencies at Level 1 or Level 2. The
homework for these same lesson plans revealed a Level 2 Depth of Knowledge. When
analyzing the assessments of all teachers, a Level 1 or Level 2 Depth of Knowledge of
was used on quizzes and tests within all control classes.
All teachers demonstrated an Accepting level for TPACK. By allowing their
control classes to use the Casio non-graphing scientific calculator, all teachers
demonstrated the Accepting level for TPACK. All teachers had access to the projector
and PowerPoint within the control classroom. Teacher Epsilon was the only teacher who
did not use them; therefore, the Recognizing level for TPACK would be more
appropriate. Teacher Alpha and Teacher Gamma used technology at an Accepting
TPACK level. Teacher Zeta displayed the most extensive use of PowerPoint within the

176
control classroom at an Adapting TPACK level. Teacher Zeta used the PowerPoint
technology to create graphs and solve problems in a step-by-step manner, and used
animation to demonstrate the vertical line test.
Summary of Treatment Classes
All treatment classes were observed during the first two weeks of the study.
During the observations, Teacher Alpha, Teacher Epsilon, and Teacher Zeta included a
starter to begin their lesson. Teacher Gamma did not included a starter, but used that
class time to distribute the TI-Nspire calculators. All teachers also covered the function
and graphing content during the treatment class observation, on the questionnaire, within
their lesson plans and in the assessments.
All teachers used multiple representations during the observation, and they
included numeric, geometric, symbolic, and analytic representations. On the
questionnaire, all teachers reported using tables, graphs, mappings, and ordered pairs as a
means to represent the functions. During the lesson plan analysis of the third, sixth, and
eleventh day of the study, all teachers included some form of numeric, geometric,
symbolic, and analytic representations. All teachers included assessments on their lesson
plans that used numeric, geometric, symbolic, and analytic representations. All teachers
used numeric, geometric, symbolic, analytic and writing representations.
All teachers reported issues in the treatment class with regard to the TI-Nspire and
the emulator during the course of this study. Because the TI-Nspire was a new tool, both
teachers and students revealed a learning curve, as with any new technology tool. During
the course of this study, the teachers resolved the issue of needing time to distribute the
TI-Nspire calculators by using the starter time at the beginning of each treatment class.

177
Teachers had to learn how to download the programs form the internet and then how to
upload them to the emulator and the calculators. Over the course of this study, the
teachers and students in treatment class became more familiar with the calculator and had
fewer issues in how it worked.
Treatment teachers stated that they enjoyed using the Texas Instruments website
and the readymade programs that they were accessible on the TI website. With the
addition of a new technology tool, Teacher Gamma reported that the students were “more
eager to investigate with the TI-Nspire” and that the students were excited about the
capabilities of the TI-Nspire. Teacher Zeta commented that the TI-Nspire allowed
students to “quickly show how to substitute „x‟ values into an equation and solve for „y‟.”
The teachers felt they were much better at teaching students how to create tables in the
treatment class.
Teachers also mentioned that the ability to connect the multiple aspects (graph,
equation, table, etc.) of a problem on the TI-Nspire allowed them to teach from the big
picture of how concepts relate to each other. While certain aspects of a lesson focused
specifically on equations, graphs, tables, or functions, students did not always see how
they all fit together. Teacher Zeta commented how the multiple representations with the
TI-Nspire allowed the bigger picture to be discussed and then allowed the individual
aspects to be specifically explored.
The teachers stated that the effects of changing constants and coefficients of an
equation were much easier to recognize in the treatment classes as the students moved the
lines up and down the y-axis or by simply changing the slope. Teachers liked the
immediate support from the calculators to reinforce what the students in the treatment

178
classes had graphed on their individual white boards. Teachers remarked how it helped
students verify their work on slope, intercepts, and relating a graph to the value of y = mx
+ b. Teacher Gamma said,
This was the first time in years that my students aren‟t totally lost in the concepts
of slope and equations. In teaching slope, my treatment students are, for the first
time, having to relate multiple concepts to obtain their results. In the past, this had
taken weeks to accomplish. This time, they are moving much faster. I believe it
is the visual representations and their own manipulation of the graphed line on the
calculator.
The teachers also mentioned the benefits of using the emulator, the readymade
programs, and the TI website. The emulator enhanced teachers‟ ability to visually
communicate with students about the operation of their individual calculator and provide
a quick and easy visual demonstration of the specific buttons to be pushed. The teachers
felt that students in the treatment classes learned at a deeper level because of its ability to
show multiple representations webbed together within the TI-Nspire. In particular the
teachers mentioned that topics, such as functional notation, order pairs, slope, intercepts,
and tables, were easier to teach with the TI-Nspire. They also mentioned that they were
more effective in teaching such topics.
During the observations, Teacher Gamma‟s treatment class did not have a starter.
Teacher Alpha, Teacher Epsilon and Teacher Zeta all had starters with a Level 2
(skill/concept) Depth of Knowledge. During the observation, all teachers had Level 2
and Level 3 (strategic thinking) Depth of Knowledge activities. Teacher Gamma and
Teacher Epsilon also had Level 1 (recall) activities during the treatment class. During the

179
lesson plan analysis of the third, sixth and eighth day of the study, all teachers included
state competencies that were at a Level 1, Level 2 or Level 3 Depth of Knowledge.
Teacher Alpha, Teacher Gamma, and Teacher Zeta included goals at a Level 1, Level 2
or Level 3 Depth of Knowledge; however, Teacher Epsilon only included goals at Level
1 or Level 2. The homework for all teachers in treatment class lesson plans revealed a
Level 2 Depth of Knowledge. When analyzing all teachers‟ treatment class assessments,
both Level 1 and Level 2 Depth of Knowledge exercises were used on quizzes and tests
in all control classes. At no point in this study were any Level 4 Depth of Knowledge
activities used.
As previously stated, by participating in the professional development activities,
all teachers demonstrated an Accepting level for TPACK. All treatment teachers also
allowed treatment students to use the TI-Nspire graphing calculator, demonstrating the
Accepting level for TPACK. This Accepting level continued as all treatment teachers
also used the emulator to teach the function concept using the TI-Nspire. Teacher Alpha,
Teacher Epsilon, and Teacher Gamma used technology within the treatment class at an
Accepting TPACK level. Teacher Zeta displayed the most extensive use of PowerPoint
within the treatment classroom especially when applying mathematics to real life
problems. While Teacher Zeta was at the Accepting TPACK level, Teacher Zeta was, at
times, at the Adapting TPACK level for the treatment class.
SUMMARY OF RESULTS
Quantitative and qualitative analyses were conducted to examine the impact of
using technology in teaching functions with the TI-Nspire in first year algebra classes.

180
Quantitative Summary
Statistically significance was found in the quantitative data. Within the analysis
for research question 1a, the control group‟s mean scores were statistically higher on the
pre-test than those of the treatment group. While no statistical difference was evident in
the post-test mean scores, the treatment group‟s mean scores were statistically higher on
the post post-test. For both treatment and control groups, post-test mean scores were
statistically higher than their respective pre-test mean scores. This finding was also true
for both groups on the post post-test. The post post-test mean scores of both groups were
statistically higher than their pre-test mean scores. No statistical difference between
either groups‟ post-test mean scores or post post-test mean scores were found. When
analyzing the slopes from pre-test to post test, pre-test to post post-test, and from post-test
to post post-test a standardized beta coefficient revealed a statistically significant
difference for treatment scores and for control scores.
The analysis for research question 1b investigated the mean scores by teacher. A
statistically significant effect on the post post-test was found between teachers. An
additional post hoc test using multiple comparisons revealed statistically significant
differences in the mean scores on the post post-test between Teacher Epsilon‟s classes
and Teacher Zeta‟s classes and between Teacher Gamma‟s classes and Teacher Zeta‟s
classes.
The analysis for research question 1c used a multivariate test with teachers as
fixed variables, pre-test as a control value, and centered by pre-test at the class level. The
teacher was found to have a statistically significant effect on the post-test and on the post
post-test for the original means. The pooled imputed means found the teacher effect to be

181
statistically significant on the post post-test. The interaction of teacher by type was also
found to have a statistically significant effect on the post-test and the post post-test for
both the original means and the pooled imputed means. Wilks‟ Lambda was statistically
significant on the teacher effect, the type effect, and the interaction of teacher by type for
both the original means and the pooled imputed means.
Further pairwise comparison analyses were made on the interactions among
teachers. For the pairwise comparison by teacher, statistically significant interactions
were revealed on the post-test and the post post-test for Teacher Zeta‟s classes. The
original means revealed a statistically significant difference with Teacher Zeta‟s classes
and Teacher Alpha‟s classes as well as with Teacher Zeta‟s classes and Teacher
Gamma‟s classes on the post-test, while the pooled imputed means, revealed a
statistically significant difference between Teacher Zeta‟s classes and Teacher Epsilon‟s
classes as well as between Teacher Zeta‟s classes and Teacher Gamma‟s classes. The
original means revealed a statistically significant difference between Teacher Zeta‟s
classes and all other teachers‟ classes on the post post-test, while the pooled imputed
means revealed a statistically significant difference between Teacher Zeta‟s classes and
Teacher Epsilon‟s classes and between Teacher Zeta‟s classes and Teacher Gamma‟s
classes.
The analysis for research question 1d used a multivariate analysis to test the
interaction of teacher and type with socioeconomic status and special education students.
The multivariate analysis of variance was conducted to assess if differences between the
teacher and socioeconomic status, special education status, or the interaction of
socioeconomic status and special education status on the post-test and the post post-test

182
existed. To control for the pre-test variance, pre-test was a dependent variable. The
analysis revealed statistical significance with socioeconomic status and the post-test and
the post post-test; however the pooled imputed data found only statistical significance
with the socioeconomic status and the post-test. The original data revealed statistical
significance with the interaction between teacher and the socioeconomic status on the
post post-test; however the pooled imputed data did not reveal statistical significance
with the interaction between teacher and socioeconomic status. The original data
revealed statistical significance with the interaction between type and the socioeconomic
status on the pre-test; however the pooled imputed data did not reveal statistical
significance in the interaction between type and socioeconomic status. While the original
data did not reveal statistical significance with the interaction between teacher and special
education students, the pooled imputed data had statistical significance on the post post-
test. The lack of data caused different interactions and further analysis was not possible
due to lack of power.
Qualitative Summary
Observations and document analysis were used to investigate differences across
the teachers and their classes. An analysis of the classroom observations, questionnaires,
lesson plans, and assessments focused with respect to representations, Depth of
Knowledge and TPACK.
The main representations used within activities across all analysis were numeric,
geometric, symbolic, analytic, and written. Activities might have involved combinations
of numeric, geometric, symbolic, analytic, writing or other representations. Although all
teachers in all classes used all representations, the number of activities covered in each

183
class varied among treatment and control classes. As noted in Figure 14, Teachers
Alpha, Epsilon, and Gamma used more activities in their control classes. On the other
hand, Teacher Zeta taught the treatment class using more activities than the control class.
During the lesson plan analysis, all treatment classes used more representations on
average for each activity as noted in Figure 15.
Figure 14: Average ways of representing an activity during observation. This figure
illustrates the average number of representations for each activity during a classroom
observation.
2.86 3.08
2.22
2.55
2.18
1.93 2.08
3.00
0.00
0.50
1.00
1.50
2.00
2.50
3.00
3.50
Alpha Epsilon Gamma Zeta
Average Number of Representations during Classroom Observation
Treatment Control

184
Figure 15: Average ways of representing an activity within lesson plans. This figure
illustrates the average number of representations for each activity within the lesson plan
analysis.
Four Levels to Webb‟s Depth of Knowledge (2006) were explored. Level 1 is
recall activities, Level 2 is skill and concept activities, Level 3 is Strategic thinking, and
Level 4 is extended thinking. Each activity was labeled according to the complexity as
outlined by Webb. Most activities were at Level 1 (skill) and Level 2 (skill/concept), but
some Level 3 (strategic thinking) activities were noted. No Level 4 (extended thinking
activities) activities were found. As noted in Figure 16, each teacher‟s treatment class
experienced on average a greater Depth of Knowledge than the corresponding control
class.
2.87
2.64
2.79 2.94
2.71
2.36 2.23
2.88
0.00
0.50
1.00
1.50
2.00
2.50
3.00
3.50
Alpha Epsilon Gamma Zeta
Average Number of Representations from Lesson Plan Analysis
Treatment Control

185
Figure 16: Average Depth of Knowledge during observations. This figure illustrates the
average Depth of Knowledge that problems were asked within a classroom observation.
While the average Depth of Knowledge is displayed above, Table 13 reveals the
maximum, minimum, and total number of activities. The control classes had more Level
1 (recall) activities. For example, both of Teacher Gamma‟s classes completed a Level 1
(recall) vocabulary review activity. Teacher Alpha‟s control class also completed a Level
1 (recall) activity where students were writing the definitions to vocabulary words.
2.57 2.46 2.40 2.67
2.41
1.79
2.25 2.33
0.00
0.50
1.00
1.50
2.00
2.50
3.00
Alpha Epsilon Gamma Zeta
Average Depth of Knowledge Level during Classroom Observations
Treatment Control

186
Table 13
Depth of knowledge noted during classroom observations
Teacher and Class Max Min Avg. St Dev n=
Alpha Control 3 1 2.41 0.59 12
Alpha Treatment 3 1 2.57 0.61 7
Epsilon Control 2 1 1.79 0.50 14
Epsilon Treatment 2 1 2.46 0.51 13
Gamma Control 3 1 2.25 0.66 12
Gamma Treatment 3 1 2.40 0.58 10
Zeta Control 3 1 2.33 0.52 9
Zeta Treatment 3 1 2.67 0.50 12
As indicated above, Teacher Epsilon‟s control class completed multiple activities
focusing on different topics, due in part to the fact that Teacher Epsilon reviewed her
control class for an upcoming quiz. For example, Teacher Epsilon‟s control class
engaged in multiple Level 1 (recall) activities as students were asked to identify
quadrants, state the coordinates of a point on a graph, and answer vocabulary questions.
Conversely, Teacher Epsilon‟s treatment class combined several topics into one activity,
requiring students to use a greater Depth of Knowledge to complete the problem. For
example Level 2 (skill/concept) activities had students find the domain and range when
given a table and finding ordered pairs from a graph on the calculator. Examples of
Level 3 (strategic thinking) activities completed by Teacher Epsilon‟s treatment class
included students using a given equation to create a graph and make a table of
coordinates from that graph. In another example, students were shown a graph and asked
to find the equation of the graph and to create a table of coordinates for that graph.
Teacher Zeta‟s treatment class appeared to use tasks with the greatest Depth of
Knowledge. For example, Teacher Zeta began the treatment class with a level 2 activity
by assigning the students a task to make a table, a graph, and find four ordered pairs that

187
would satisfy the equation y = 10x – 2/3. Teacher Zeta‟s use of PowerPoint and the TI-
Nspire Emulator assisted in webbing the problems together and allowing the students to
see the connections.
During the document analysis of the lesson plans, the Depth of Knowledge was
recorded for the starter, goals, class work, and homework. Figure 17 below shows that
Teacher Alpha‟s control class had a higher average Depth of Knowledge for the control
class more so than the treatment class. Teacher Epsilon and Teacher Gamma had slightly
higher average Depth of Knowledge for the treatment class, and Teacher Zeta had the
same level for both treatment and control.
Figure 17: Average Depth of Knowledge Level from Lesson Plan Analysis. This figure
illustrates the average Depth of Knowledge that problems were planned for a classroom
lesson.
1.63
1.64 1.75
2.00
1.76
1.55
1.69
2.00
0.00
0.50
1.00
1.50
2.00
2.50
Alpha Epsilon Gamma Zeta
Average Depth of Knowledge Level from Lesson Plan Analysis
Treatment Control

188
The state competencies for all classes were listed within Appendix E. Figure 18
below provides an average of the Depth of Knowledge for the state competencies that
were listed on the lesson plans by each teacher. Teacher Alpha and Teacher Epsilon used
state competencies during the course of this study that had a higher average Depth of
Knowledge for the treatment class. Teacher Gamma used state competencies during the
course of this study that has a higher average Depth of Knowledge for the control class.
Teacher Zeta had the same average Depth of Knowledge for both class because as the
same state competencies were used for Teacher Zeta‟s treatment and Teacher Zeta‟s
control class.
Figure 18: Average Depth of Knowledge on State Competencies from Lesson Plan
Analysis. This figure illustrates the average Depth of Knowledge of the state
competencies used as teachers planned for a classroom lesson.
2.07
2.22
2.22
2.09
2.00 2.09
2.25
2.09
0.00
0.50
1.00
1.50
2.00
2.50
Alpha Epsilon Gamma Zeta
Average State Competencies Depth of Knowledge within Lesson Plans
Treatment Control
189
During the classroom observation, teachers demonstrated TPACK levels ranging
from Recognizing to Adapting. Teacher Epsilon demonstrated a Recognizing level in the
control class, but an Accepting level in the treatment class. Teacher Alpha and Teacher
Gamma both demonstrated Accepting levels in both their treatment classes and control
classes. Teacher Zeta demonstrated mainly an Accepting level, but at times an Adapting
level, in both treatment and control classes.
The same TPACK levels were supported in the lesson plan analysis. In listing
objectives and goals, teachers included the use of technology, such as the graphing
calculator and PowerPoint within the control class and the TI-Nspire, emulator, and
PowerPoint within the control class. All students were allowed and encouraged to use
their calculators in completing assignments, quizzes, and tests. This practice
demonstrated the Accepting TPACK level. Treatment teachers demonstrated the TPACK
level in their assessments by using the Texas Instrument website activities that were
specifically designed for the TI-Nspire.
CONCLUSION
This study investigated the effects of using the TI-Nspire on student achievement,
using statistical analyses revealed statistically significant interactions. It also investigated
teacher planning, teaching, and assessments using observations and document analysis.
Vignettes were then developed around the framework and key constructs of
representations, Depth of Knowledge, and TPACK.
Statistical significance was found between treatment and control groups on pre-
tests and on post post-tests. For the pre-test, the control group means were significantly
higher than those of the treatment group. For the post post-test, the treatment group

190
means were significantly higher than those of the control group. Post hoc analysis
revealed statistically significant differences in the mean scores of the post post-test of
Teacher Zeta‟s classes, Teacher Epsilon‟s classes and Teacher Gamma‟s classes.
Teacher effect on the post post-test and an interaction effect between teacher and type on
the post-test and the post post-test revealed statistical significance. Further pairwise
comparisons among teachers revealed additional statistical significance between Teacher
Zeta‟s classes and both Teacher Epsilon‟s and Gamma‟s classes on the post-test and the
post post-test.
Using the original means, statistical significance for socioeconomic status was
found on the post-test and on the post post-test; however, when using the pooled imputed
means only the post-test showed statistical significance. The original means revealed a
statistically significant interaction between teacher and socioeconomic status on the post
post-test, but the pooled imputed means revealed no statistical significance. The original
means revealed a statistically significant interaction between type and socioeconomic
status on the pre-test, but the pooled imputed means revealed no statistical significance.
The pooled imputed means revealed a statistical interaction between teacher and special
education on the post post-test, but the original means did not find that interaction to be
statistically significant. The lack of data caused different interactions and further
analyses were not possible due to lack of power.
Qualitative analyses used vignettes of each teacher within the study. The key
constructs included: types of representations, Depth of Knowledge, and TPACK. During
classroom observations, Teacher Alpha, Teacher Epsilon, and Teacher Gamma used, on
average, more representations within the treatment class than the control class. Teacher

191
Zeta used, on average, more representations within the control class than the treatment
class. In the document analysis of the lesson plan, all teachers used, on average, more
representations in the treatment class than in the control class.
All teachers used, on average, higher Depth of Knowledge activities within the
treatment class than the control class. During the analysis of the lesson plan, Teacher
Alpha used higher Depth of Knowledge activities with the control class than with the
treatment class while Teacher Epsilon, Teacher Gamma, and Teacher Zeta used higher
Depth of Knowledge activities with their treatment classes than with their control classes.
During the analysis of state competencies, Teacher Alpha, Teacher Epsilon, and Teacher
Gamma used competences that were on average at a higher Depth of Knowledge for the
treatment class than for the control class. Teacher Zeta used the same state competencies
for both treatment and control classes; therefore, the average Depth of Knowledge was
the same for both classes.
Teacher Epsilon was on the Recognizing TPACK level within the control class
observation and Teacher Zeta was on the Adapting TPACK level. All teachers
exemplified the Accepting TPACK level for the treatment classes during the
observations. All teachers were at the Accepting TPACK level for both the treatment
class and the control class on their lesson plans. When analyzing the assessments, all
teachers were at the Accepting TPACK level in that they allowed and encouraged
students to use calculators on starters, class work, homework, quizzes and tests.
A summation table (table 14) compared the quantitative data and qualitative data
to provide an overall picture of the study. Teacher Alpha planned to have a higher depth
of knowledge activities in the control class than the treatment, but during the observation

192
had higher depth of knowledge activities in the treatment class. Teacher Epsilon was the
only teacher who had considerable more state standards depicted in the lessons for the
treatment class over those for the the control class. Teacher Gamma‟s control class
consistently scored higher than the treatment class meaning there could be some student
effect. Teacher Epsilon‟s treatment class and Teacher Alpha‟s control class were the
counter balance to Teacher Gamma‟s control class in that they were taught during the
same class period. Upon investigation of their scores, Teacher Epsilon‟s treatment
students excelled at the post-test and the post post-test while Teacher Alpha‟s control
class did better on the post-test than the treatment, but not on the post post-test. The
summation table reveals that there were many differences between the types and the
teachers. While these differences could have accounted for some effect, the design of the
study accounted for most of the effect. The random assignment of treatment and control,
multiple measures on the tests, multiple teacher observations, and document analysis to
control for construct validity all helped to strengthen the study and reinforce that the
findings within the data were from the treatment of using a TI-Nspire graphing calculator
to teacher the function concept in a first year Algebra class.

193
Table 14
Summation Table
Number of
Representations Depth of Knowledge
Number
of Original Means
Observe
a Lesson
Plans Observe
a Lesson
Plans
State
Compsb
State
Compsb Pre
c Post
d Post
Poste
Alpha
control
2.18
(0.98)
2.71
(.69)
2.41
(.59)
1.76
(.59)
2.00
(.76) 14 4.82 8.91 7.23
Alpha
Treatment
2.86
(0.38)
2.87
(.64)
2.57
(.61)
1.63
(.61)
2.07
(.76) 15 4.78 7.11 7.28
Epsilon
control
1.93
(0.92)
2.36
(.81)
2.25
(.66)
1.55
(.50)
2.09
(.67) 11 4.62 6.38 6.81
Epsilon
Treatment
3.08
(1.49)
2.64
(.92)
2.40
(.58)
1.64
(.66)
2.22
(.71) 18 4.18 8.43 9.50
Gamma
Control
2.08
(1.17)
2.23
(.73)
1.79
(.50)
1.69
(.66)
2.25
(.75) 16 4.41 8.18 8.65
Gamma
Treatment
2.22
(0.83)
2.79
(.58)
2.46
(.51)
1.75
(.58)
2.22
(.79) 18 4.05 7.18 7.45
Zeta
Control
3.00
(0.50)
2.88
(.72)
2.33
(.52)
2.00
(.52)
2.09
(.79) 11 5.00 5.50 4.19
Zeta
Treatment
2.55
(1.57)
2.94
(.75)
2.67
(.50)
2.00
(.50)
2.09
(.79) 11 3.80 7.08 6.44
a Observation
b Competencies
c Pre-test Mean
d Post-test mean
e Post Post-test

194
CHAPTER 5
DISCUSSION
INTRODUCTION
The purpose of this study was to investigate the effects of the independent
variable, a teaching strategy using the TI-Nspire, on the dependent variable student
achievement, measured by pre- and post-tests using the Kentucky High School
Diagnostic Mathematics Assessments. This study also examined the effects of the
independent variable on teacher planning, teaching, and assessments. The following
questions guided the research of this study:
1) Was there a difference in student test scores on function concepts in Algebra I
classrooms that used TI-Nspire graphing calculators versus those who did not
use this device? The independent variable was treatment and the dependent
variables were the pre-test, post-test, and post post-test.
a. Treatment Effect
b. Teacher Effect
c. Interaction of Teacher and Treatment
d. Factors: special education status and socioeconomic status
2) Did the use of TI-Nspire graphing calculators affect the way teachers taught
function concepts in Algebra I classrooms with respect to representations,

195
Depth of Knowledge, and TPACK? The independent variable was treatment
and the dependent variables how teacher taught.
3) Did the use of TI-Nspire graphing calculators affect the way teachers planned
lessons for function concepts in Algebra I classroom with respect to
representations, Depth of Knowledge, and TPACK? The independent
variable was treatment and the dependent variables how teacher planned.
4) Did the use of TI-Nspire graphing calculators affect the way teachers assessed
students on functions concepts in Algebra I classrooms with respect to
representations, Depth of Knowledge, and TPACK? The independent
variable was treatment and the dependent variables how teacher assessed.
The independent variable, teaching strategy, was implemented in the first year of
algebra with teachers using the TI-Nspire graphing calculator as an instructional tool to
teach function concepts. The effect on student achievement was determined by
measuring students‟ understanding of functions through comparisons of pre-test and post-
test results. Student achievement was measured using a pre-test, post-test, and a post
post-test and analyzed using a Repeated Measures ANOVA. The effect of how teachers
teach, plan and access students while teaching function concepts was determined
qualitatively by observations and document analyses.
The study occurred in the first-year Algebra classes at Eagle High School. In the
summer prior to this study, teachers at Eagle High School received training on the TI-
Nspire, which was a new technology tool to them. Prior to using the TI-Nspire, first-year
Algebra teachers at Eagle High School used the Casio non-graphing scientific calculator.
Understanding the learning curve that existed for teachers, additional training on using

196
the TI-Nspire to teach the function concept was provided for teachers two weeks prior to
the study. During the study, treatment teachers taught with the TI-Nspire graphing
calculator and the TI-Nspire emulator using a projector. Teachers also attended weekly
meetings to discuss any concerns or issues about the TI-Nspire and to receive assistance
in planning activities with the TI-Nspire for the upcoming week. During the weekly
meetings, teachers completed weekly questionnaires and submitted their lesson plans and
assessments. A classroom observation for each class was also completed by the
researcher during the study. Vignettes were then developed around the key constructs of
representations, Depth of Knowledge, and Technological Pedagogical Content
Knowledge (TPACK).
FINDINGS
Some data (21%) were missing in this study. That is, out of a possible 226 cases,
179 had complete data, and 47 had some data missing. To control for the potential bias
of this missing data, a set of five imputations from these data were computed. Each
imputation was analyzed separately, and the results were pooled to provide a comparison
to the results of the original data. Therefore results are reported for both original data and
pooled imputed data. The four components of the first research questions were analyzed
quantitatively. The analysis for question 1a compared total treatment and total control
with the type variable for pre-test, post-test and post post-test results. The analysis for
question 1b compared teachers with the teacher (tchr) variable across type. The analysis
for question 1c compared type by teacher. The analysis for question 1d introduced
socioeconomic status (ses), and special education (sped), as fixed factors.
197
Statistical significance was found between treatment group and the control group
(type) on the pre-test and on the post post-test. However, the differences between
treatment and control groups were not significant for the post-test. The control group
pre-test data were significantly higher than those of the treatment group; however the
treatment group post post-test data were significantly higher than those of the control
group. Post hoc tests found significant difference in the scores of the post post-test of
Teacher Zeta‟s classes and both Teacher Epsilon‟s classes and Teacher Gamma‟s classes.
The interaction between teacher and type on the post post-test were found to be
statistically significant. Furthermore, pairwise comparisons among teachers revealed
significance differences on the post-test and the post post-test between Teacher Zeta‟s
classes and both Teacher Epsilon‟s classes and Teacher Gamma‟s classes.
Using the original data (N=179), the analysis revealed statistical significance for
socioeconomic status on the post-test and on the post post-test; however, when using the
pooled imputed data (N=226) only the post-test revealed statistical significance. The
original data analysis revealed a statistically significant interaction between teacher and
socioeconomic status on the post post-test, however the pooled imputed data revealed no
statistical significance. The original data analysis also revealed a statistically significant
interaction between type and socioeconomic status on the pre-test; however, the pooled
imputed data were not statistically significant. The original data had 21 students
categorized as special education while the imputed data had 27 students indicating a 30%
loss in data. With such a small data set, a lack of power to complete further analysis with
these factors was evident.

198
The pooled imputed data analysis revealed a significant interaction between
teacher and special education on the post post-test; however this interaction was not
statistically significant in the original data. The original data had 124 students
categorized as socioeconomic status while the imputed data revealed 155 students or
about 20% missing data which was not much different from that of all students. The
results from the individual imputations were also mixed. The interaction between teacher
and socioeconomic status for Imputation 1 data was significant (p=.049); for Imputation
2 not significant (p=.051); and for the remaining three imputations not significant with p
values for Imputations 3-6 of .324, .510, and .446 respectively. A possible explanation
for this set of mixed results is that teachers performed quite differently in treatment and
control classes. The teacher effect was quite large and may have overshadowed
socioeconomic status and special education factors. A larger sample might have
produced sufficient power to detect these factors even if the teacher effect was large.
Each teacher was observed twice, once in the treatment class and once in the
control class. Teachers also completed a weekly questionnaire which provided insight
into their teaching in each type of class. Lesson plans and assessments were gathered for
document analysis to provide insight into class activities. The document analysis was
designed to detect consistencies among teachers and classes with respect to three key
constructs: types of representations, Depth of Knowledge, and TPACK.
During classroom observations, all teachers used a starter activity at the beginning
of class. During the course of the study, some treatment teachers used this time to
distribute the TI-Nspire Calculators. During the classroom observations, all teachers
used the numeric, geometric, symbolic, and analytic representations within both classes.

199
Teacher Alpha, Teacher Epsilon, and Teacher Gamma used more representations within
the treatment class than the control class on average. Teacher Zeta used more
representations within the control class than the treatment class on average. In
determining the TPACK level during the classroom observations, all teachers revealed
some aspects of the TPACK level within the control class. However, Teacher Epsilon
was more often at the recognizing TPACK level within the control class observation and
Teacher Zeta was more often at the adapting TPACK level. Within the treatment class
observations, all teachers demonstrated some activity at the accepting TPACK level.
On the weekly questionnaires, Teacher Alpha, Teacher Epsilon, and Teacher
Gamma reported being behind in their treatment class with regard to teaching the
function concept on comparison with their control class. By the beginning of the third
week, all of these classes were able to catch up with the control class. All teachers noted
difficulties in learning a new technology tool (TI-Nspire) and teaching with it. Teachers
pointed out that the students were sometimes distracted with the new tool instead of
focusing on the concepts taught. Teachers commented that they enjoyed using the Texas
Instruments website and the readymade programs. Teacher Gamma noted how eager and
excited the students were about the TI-Nspire. Teacher Zeta commented that it was
easier to teach from the “big picture” with the TI-Nspire instead of having to piece-meal
the individual concepts of functions together. Teachers specifically mentioned the topics
of function notation, ordered pairs, slope, intercepts and tables as being easier to teach
with the TI-Nspire. Teachers also felt that they were more effective in teaching these
topics.

200
Within the lesson plan, all teachers used, on average, more representations in the
treatment class than the control class. Teacher Alpha, Teacher Epsilon, and Teacher
Gamma used on average more representations in the treatment class than the control;
however, Teacher Zeta used on average more representations in the control class than the
treatment. In the lesson plan comparison, Teacher Zeta used the same starters, same state
competencies, and the same goals; however the homework assignments were different.
The homework assignments for both the treatment class and the control class had the
same Depth of Knowledge; however, the treatment class had more representations.
During the lesson plan analysis, treatment classes on average completed activities
at higher depths of knowledge than the control classes. During the analysis of the lesson
plan, Teacher Alpha used, on average, higher Depth of Knowledge activities with the
control class than with the treatment class. While Teacher Epsilon, Teacher Gamma, and
Teacher Zeta used on average higher Depth of Knowledge activities with their treatment
class than with their control class. During the analyses of average state competencies on
the lesson plans, Teacher Alpha, Teacher Epsilon, and Teacher Gamma used
competences that were on average at a higher Depth of Knowledge for the treatment class
than for the control class. Teacher Zeta used the same state competencies for both the
treatment and control class; therefore the average Depth of Knowledge was the same for
both classes. While analyzing the lesson plans with objectives, goals, and listed
technology, all teachers were at the accepting TPACK level for both the treatment class
and the control class.
Homework assignments given by all teachers were either directly from the
textbook or from textbook worksheets. The Depth of Knowledge on the homework

201
included Level 1, Level 2 and Level 3, but was mainly Level 2. The types of
representations used included a combination of numeric, geometric, symbolic, analytic,
and written representations. The test and quizzes were taken directly from the textbook
publishers and included both Level 1 and Level 2 Depth of Knowledge activities and
used a combination of numeric, geometric, symbolic, analytic, and written
representations. Within all assessments, teachers worked at the accepting TPACK level.
All teachers allowed and encouraged students to use calculators on starters, class work,
homework, quizzes, and tests.
OVERALL FINDINGS
Overall, the student scores were significantly different between treatment and
control groups when controlling for teacher effect on the pre-test and the post post-test.
The student scores were also significantly different when considering teacher and type on
the post post-test. When controlling for the pre-test, Teacher Zeta‟s classes post-test and
post post-test scores were significantly different from those of Teacher Epsilon‟s classes
and Teacher Gamma‟s classes. Not enough data was available for the power to analyze
the interaction effects of socioeconomic status and special education by teacher and type.
During the observations, all teachers used multiple representations in all classes.
Teacher Alpha, Teacher Epsilon and Teacher Gamma used, on average, more
representations per activity in their treatment class than their control class. Teacher Zeta
was the only teacher who used, on average, more representations per activity in the
control class than in the treatment class. The use of multiple representations was also
supported by questionnaire responses regarding methods of representations that were
used to teacher function concepts. During the lesson plan analysis, all treatment classes

202
used, on average, more representations per activity in the treatment class versus the
control. Multiple representations also were confirmed to be used by all teachers and all
classes on the homework, quizzes, and tests.
All classes used, on average, higher Depth of Knowledge activities in their
treatment class compared to their control class. Teacher Alpha, Teacher Gamma, and
Teacher Zeta all used Level 1, Level 2, and Level 3 Depth of Knowledge activities within
their treatment class and their control class. Teacher Epsilon only used Level 1 and Level
2 Depth of Knowledge activities within the treatment class and control class. In the
lesson plan analysis, the average Depth of Knowledge used for activities was higher for
Teacher Alpha‟s control class than for the treatment class. The opposite was true for
Teacher Epsilon and Teacher Gamma in that their treatment class had, on average, higher
Depth of Knowledge activities than their control class. Teacher Zeta had the same Depth
of Knowledge levels for both classes because all activities for the two classes were the
same.
Although some control classes reviewed function concept material, the treatment
classes had begun to cover the same material, meaning that the control classes were
ahead of the treatment classes in covering the function concept. However all treatment
classes had caught up with the control classes by the beginning of the third week.
Teachers reported issues were reported within the questionnaire regarding teacher
confidence and ability in learning to use the TI-Nspire and the emulator because it was
new technology to them. Teachers noted that the treatment classes had to go slower over
the material when introducing the TI-Nspire because it was new technology to the
students. Teachers also expressed concern about time needed to distribute the

203
calculators, but as the study progressed, the treatment teachers often used the starter time
to distribute the TI-Nspire calculators.
Teachers indicated that the TI-Nspire made teaching the function concepts such as
slope, tables, domain and range, functional notation, intercepts, ordered pairs, and
graphing much easier and more effective. Teachers liked the capability that the
calculator provided that allowed students to move from table to graph to equation all
within the same exercise with the TI-Nspire. As stated in Chapter 4, Teacher Gamma
explained how quickly her treatment students had learned to relate multiple concepts.
Teachers also pointed out that the TI-Nspire allowed the students opportunities to see the
big picture of how the function representations were all interconnected.
Teachers also benefited from having access to the Texas Instruments website with
ready-made activities, which served to supplement the textbook curriculum with hands-
on activities. Teachers also indicated that using the emulator was effective in teaching
students how to complete problems step-by-step as a class. Teachers also stated that
using the emulator allowed the students to easily see the proper steps to take to complete
a problem, which was especially helpful since the TI-Nspire was a new technology tool
for them.
All teachers demonstrated the TPACK Accepting level during the course of this
study. During the control class observation, Teacher Epsilon demonstrated a
Recognizing TPACK level. Teacher Zeta demonstrated more of an Adapting TPACK
level. All teachers allowed and encouraged the use of calculators on assessments, and all
teachers were willing to participate in professional development on the TI-Nspire, a new
technology tool.

204
LIMITATIONS OF THE STUDY
This study was limited to a single southern rural school so the generalization is
limited to schools of similar size and characteristics. Only the teachers, who taught
Algebra I within the ninth grade, were involved in this study. The sample for this study
was four teachers and eight classrooms. Analysis at the class level was limited to
comparing four treatment classes to four control classes so there was inadequate power to
investigate some factors and interactions between factors.
The assignment of the treatment was conducted at the class level, and although
students are assigned to classes randomly moderated by their schedule and there is no
ranking or tracking system used by Eagle High School to place students into certain
classes still there could be some non-randomness in the scheduling. On the other hand
the research design counterbalanced treatment and control classes by having one of each
in the school class periods so students limited to any one school period for algebra should
have an equal chance of being assigned to a treatment or control class. This assignment
was conducted by the school; however, and the researcher had no control over this
process. Due to both a small sample size and that students were not completely randomly
assigned to the classes, the variation within the classroom and the pedagogy of each
individual teacher could affect the outcome.
Students during the third period had the class interrupted daily for lunch. There
was no control over other interruptions that occurred throughout the school day and
school year such as fire drills, club meetings, etc.
Time was a limiting factor of this study, in that the study occurred over the course
of four weeks. The topics covered by each teacher and the extent to which they covered

205
such topics may or may not have been consistent. The use of TI-Nspire specific activities
within the treatment classes could have impacted the study. The limitations inherent to
self-reporting existed with teachers self-reporting on the questionnaire. Because all
teachers taught a treatment and a control class, all control teachers received the training
on the TI-Nspire. While this was necessary and added internal validity, this also limited
the control teachers by having them exposed to the training for the treatment classes.
IMPLICATIONS
The control group‟s scores were significantly higher than the treatment group‟s
scores on the pre-test, indicating that the control class started out at a significantly higher
level of achievement than the treatment group. On the post-test, the treatment group‟s
scores were about the same as the control group‟s scores. While there was not a
significant difference between the group‟s post-test scores, the treatment group reached
the same level of achievement as the control group. The treatment group‟s scores were
significantly higher than the control group‟s scores on the post post-test, indicating that
the treatment group had a significantly higher level of achievement than the control
group. This result was supported by other research findings that showed improved test
scores when using a calculator (Ellington, 2003; Hembree & Dessart, 1986; Hollar &
Norwood, 1999; Mittag & Taylor, 2000; O‟Callaghan, 1998; and Ruthven, 1990b). This
finding was also supported by classroom observations, and lesson plan analyses showed
that treatment classes on average had experienced more representations and a higher
Depth of Knowledge per activity between the pre-test and post post-test.
When controlling for the pre-test, students‟ post post-test scores were
significantly higher, which implies that the teacher likely had some effect on the student

206
scores. Teacher Zeta‟s class scores on the post-test and post-post test were significantly
lower than Teacher Epsilon‟s class and Teacher Gamma‟s class. This finding implies
that being placed in Teacher Zeta‟s class had a negative impact on student achievement
when compared directly to being placed in the classes of Teacher Epsilon or Teacher
Gamma. While the mean scores the classes of Teacher Zeta appeared to be lower than
those of Teacher Alpha, the differences were not significant. Also interactions between
socioeconomic status and teacher, and special education and teacher, may have been
present, but due to the limitation of four teachers and eight classrooms, not enough power
was available to analyze these interactions. Teacher Zeta‟s class patterns were also
different from those of Teacher Alpha‟s class, Teacher Epsilon‟s class, and Teacher
Gamma‟s class. Teacher Zeta was the only teacher during the observations covering the
same material in both classes. On the lesson plans, Teacher Zeta was the only teacher to
use the same state competencies in both classes. Teacher Zeta was also the only teacher
who modified the worksheets for the TI-Nspire treatment class and gave them to the
control class to work. These differences within the qualitative analysis seem to support
the differences found with the post hoc tests, which showed significant differences in the
scores of the post post-test of Teacher Zeta‟s classes and both Teacher Epsilon‟s classes
and Teacher Gamma‟s classes.
Treatment teachers adjusted for the TI-Nspire by using the time typically spent for
starters to distribute calculators. All teachers used supplementary materials such as the
Texas Instruments Website, TI Activities, and the emulator to teach function concepts to
their treatment classes. The observations, questionnaires, and lesson plans indicated that
teachers taught using more representations per activity within their treatment classes than

207
their control classes. Teachers also taught using activities that were at a higher Depth of
Knowledge level in their treatment classes.
No differences in TPACK levels among the treatment or control classes were
found. This finding was in part to the lack of technology within the classrooms. Prior to
this study, teachers had access only to the Casio non-graphing scientific calculators.
During this study, teachers had the TI-Nspire graphing calculators to use with their
treatment class. With such limited access to technology, the level at which the teachers
would have actually demonstrated on the TPACK level with more technology was
impossible to determine.
During the first two weeks of the study, teachers spent time teaching the treatment
classes how to use the TI-Nspire, in addition to teaching function concepts. Teacher
Alpha, Teacher Epsilon, and Teacher Gamma took longer to begin covering the function
concepts during the first two weeks of this study due to the additional time needed for
students to learn the new TI-Nspire teaching tool (Brenner et al., 1997; Hennessy, Fung,
& Scanlon, 2001; Privateer, 1999; Quesada & Maxwell, 1994; and Simonsen & Dick,
1997). Although Teacher Zeta indicated that introducing the new TI-Nspire to the
treatment class slowed down the teaching process, Teacher Zeta continued to report
within the lesson plans that both the treatment and the control classes were covering the
same function content. By the beginning of the third week, all treatment classes were
covering the same function concepts as the control classes. This information was
supported by the classroom observations, questionnaires, lesson plans, and assessment
analysis.

208
Teachers stated that more time was needed to prepare their treatment classes
because of the new TI-Nspire. This finding about implementing new technology is
consistent with the reports of previous studies (Demana & Waits, 1990; Dunham & Dick,
1994; Hiebert, 1999; Lappan, 1997; and Simonsen & Dick, 1997). During the Weekly
Touchdown Sessions, teachers were shown programs from the Texas Instruments website
that could be integrated into the treatment classroom; however, the teacher had the
responsibility to plan for using them by making copies of the activity worksheets,
downloading the programs to the classroom calculators, and preparing problems in the
emulator. The treatment lesson plans had a higher average number of representations for
the activities and a higher average Depth of Knowledge level for the activities. The
Depth of Knowledge level for the state competencies listed within the lesson plan was
higher for treatment classes than it was for control classes.
Within the control classes, all teachers used textbook exercises, textbook
worksheets, textbook homework, textbook quizzes and textbook tests. Teacher Epsilon
used an activity to map out the control classroom as a graph. Teacher Epsilon also used a
USA Today activity with both the treatment class and the control class. Teacher Zeta
used real-life situations as the basis for the starter questions with both the treatment class
and the control class. Teacher Zeta created programs within PowerPoint for the control
class to teach the function concepts interactively. Teacher Zeta also used some of the
Texas Instruments website activity worksheets for the control class even though they
were not using the TI-Nspire calculator. Texas Instruments programs such as “Scavenger
Hunt,” “What‟s the Point,” and “Function Junction” were used in all of the treatment
classes. Teachers varied in how they compensated for the Texas Instruments activities.
209
For example, Teacher Epsilon would not assign homework to the control class; Teacher
Gamma would not give the treatment class textbook worksheets; and Teacher Alpha and
Teacher Epsilon would modified the quantity of exercises that the treatment class was
assigned.
High quality, sustained professional development was key to assisting the
teachers in how to teach effectively with the TI-Nspire. The TI-Nspire was new
technology to all of the teachers, and they first needed to understand how it worked
before they could be expected to teach and assess with it. A two-day summer
professional development session, which was taught by a National Texas Instruments
Instructor, helped the teachers learn how to use the TI-Nspire from scratch. Additional
trained Texas Instruments Cadre Instructors were also present at the professional
development session to provide one-on-one assistance at any time during the instruction.
Teachers were then given a TI-Nspire, TI-Nspire emulator software, and access to online
Atomic learning, and video training to continue their exploration of the TI-Nspire.
The week prior to the study, teachers attended another 6 hours of professional
development taught by a Texas Instruments Trained Cadre member which reviewed the
TI-Nspire, provided specific training about teaching the function concept with the TI-
Nspire, and allowed time to create lesson plans and activities for this study. During the
four weeks of this study, teachers met once a week for 90 minutes after school to
complete a weekly questionnaire, turn-in lesson plans, assessments, and receive further
professional development on the TI-Nspire. During this time, the Texas Instruments
Instructor answered questions, provided direction for the following week, and allowed
time for the teachers to complete questionnaires.

210
The effective integration of new technology requires sustained and supported
professional development beyond the initial training of the new equipment (Burrill, 1998;
Demana & Waits, 1990; Dunham & Dick, 1994; Hiebert, 1999; Klassen & Vogel, 2001;
Lappan, 1997; Podlesni, 1999; and Simonsen & Dick, 1997). Having access to online
training, online activities, as well as multiple professional development training sessions
with Texas Instruments Instructors was key to assisting the teachers in learning how to
use the TI-Nspire, learning how to implement it into their classroom, and in being able to
extend the use of the TI-Nspire beyond routine calculations. While the teachers had a
steep learning curve, the learning process was necessary when teaching the students how
to use the TI-Nspire as well.
Based upon multiple comments by the teachers, the TI-Nspire made their teaching
of the function concept both easier and more effective. Teachers liked the multiple ways
to represent the same problem while having all the representations connected together
within the TI-Nspire. As previously quoted, Teacher Gamma spoke about how this study
brought to light the need to provide students multiple ways of looking at the same
problem. The ability of the TI-Nspire to allow students to see the immediate and direct
effect of data changes in a graph, an equation and a data table provided a way to web
together the function concepts and show students the bigger picture instead of piece-by-
piece. Research studies supports the findings that students using graphing technology
perform better on visual and graphing tasks (Hollar & Norwood, 1999).
With teacher training and technology within the classroom, teachers are able to
teach at higher TPACK levels. The opportunity for professional development also
encouraged and supported higher TPACK levels. If technology is not provided for within

211
the classroom, teachers cannot teach at higher TPACK levels. School systems must set
technology within the classroom as a priority in order to provide ample opportunity for
classroom teachers to use the technology and increase their TPACK levels.
The emergence of calculators and computers has changed the way mathematics is
both taught and used (Thorpe, 1989; & Kieran, 1992). Thorpe (1989, p. 11) says that “it
is time for algebra instruction in the schools to begin to reflect these changes.” The TI-
Nspire has changed how teachers are able to teach because it allows for multiple ways to
represent mathematics such as numeric, geometric, symbolic, and analytic representations
that were webbed together by the teachers. Research shows that students can effectively
use technology to make and understand connections between graphical and algebraic
concepts (Drijvers & Doorman, 1996; & Choi-Koh, 2003) and using one algebraic
system to extend and acquire an understanding of another (Colgan, 1993, p. 57).
The ability to foster a deeper understanding or higher Depth of Knowledge is
supported by this webbing effect of the TI-Nspire. This webbing, which shows the direct
effect of moving a line, changing the slope, or choosing different values within a table,
not only provides multiple representations, but also allows for teachers to ask more
probing questions about cause and relationships. The higher level thinking skills
promoted using graphing calculators is also supported by other studies (Choi-Koh, 2003;
Graham & Thomas, 1998; Keller & Hirsch, 1998; Dessart, DeRidder, Charleen, &
Ellington, 1999; Huntley, Rasmussen, Villarubi, Sangtong, & Fey, 2000; & Ronau et al.,
2008).
The statistically significant results of the quantitative data analysis allow for the
rejection of the null hypothesis that stated there was no statistically significant difference

212
in student test scores on function concepts in Algebra I classrooms that used TI-Nspire
graphing calculators versus Algebra I classrooms that did not use this device. The
differences regarding the key constructs of representations, Depth of Knowledge and
TPACK reject the null hypothesis that stated there was no difference in the way teachers
taught function concepts in Algebra I classrooms that used TI-Nspire graphing
calculators versus Algebra I classrooms that did not use this device. The differences
found during the lesson plan and questionnaire analysis regarding state standards,
activities, representations, and Depth of Knowledge reject the null hypothesis that no
difference in the way teachers planned lessons for function concepts in Algebra I
classrooms that use TI-Nspire graphing calculators versus Algebra I classrooms that did
not use this device existed.
All test and quizzes were found to be the same for both classes. While some
classroom tasks and homework assignments were modified for the treatment class, all
assessments were essentially the same for both classes. Therefore, the null hypothesis
that stated that there was no difference in the way teachers assessed students of functions
concepts in Algebra I classrooms that used TI-Nspire graphing calculators versus Algebra
I classrooms that did not use this device was supported.
RECOMMENDATIONS
A resounding issue expressed by the teachers was the need to have a better
understanding and working knowledge of the TI-Nspire. This study provided very little
time between the introduction of the new TI-Nspire technology and implementation. For
future research, providing additional time and support through sustained professional
development activities before teachers were expected to implement the new technology is

213
recommended to allow teachers to become more proficient with the technology. While in
this study students started using the new TI-Nspire in the middle of the semester, future
recommendations would be to allow the students to start the school year with the TI-
Nspire calculators to eliminate issues the teachers had teaching both new concepts and
new technology at the same time. This would also reduce the student‟s distraction of a
new toy during the semester. Instead of focusing on only the function concept with the
TI-Nspire, choose several key concepts throughout the Algebra course, therefore,
allowing the generalization of the study to apply to an entire Algebra course.
Although this study was conducted only in ninth grade first-year Algebra classes
at Eagle High School, other research opportunities could involve students in different
grades or across multiple schools. Studies across multiple grades will increase the size of
the study giving it more power. Including more schools in this study would not only
increase the size and provide more power, but would also allow a greater generalization
of the results. Future studies conducted over a longer time span would be desirable to
explore the broader effect of the TI-Nspire and provide additional measures for stability.
Another recommendation would be a longitudinal a study that followed algebra teachers
over multiple years to see if the teachers experienced use with the TI-Nspire would make
a difference and to control for student variance. This would allow for the teacher growth
and understanding through the use of the TI-Nspire over multiple years. Another
longitudinal approach would follow students over multiple years, that is, following
student progression through sequential mathematics classes such as Algebra II and
Geometry while still using the TI-Nspire calculator. This would allow for students to use
the TI-Nspire at different levels of learning mathematics. To increase the power of the

214
analysis for analyzing additional factors such as socioeconomic status and special
education status, a larger sized study is recommended.
SUMMARY
Much research into the benefits of calculator use in the mathematics classroom
has been conducted (Harvey, Waits, & Demana, 1995; Hembree & Dessart, 1986; and
Smith, 1997). “The potential in using technology to extend the range of human
mathematical learning and problem solving is only beginning to be tapped by research
and development projects, much less in the day-to-day life of mathematics classrooms”
(Fey, 1989, p. 266). This study sought to examine the effects of using the TI-Nspire
calculator within the first year of algebra while studying the function concept. Teachers
were provided sustained professional development by trained Texas Instruments
Instructors on how to use the TI-Nspire and how to teach with the TI-Nspire emulator.
Different quantitative analyses were completed on the pre-test, post-test and post post-test
scores. Through observations, questionnaires and document analysis of lesson plans and
assessments, the effect of teaching with the TI-Nspire was qualitatively analyzed.
Treatment classes, using the TI-Nspire, outperformed control classes on tests
about functions. While a statistically significant effect of Teacher Zeta on the post-post
test in comparisons to the other teachers was found most of the teacher effect was
controlled within the design of the study.
Having sustained professional development throughout the study helped teachers
expressing the need for adequate time and assistance for the new technology. Providing
the Function Focus Session the week prior to the study greatly assisted the teachers in
planning how to teach their treatment class. Providing a trained Texas Instruments

215
Instructor on a weekly basis to answer questions, assist in providing direction for the
following week, and meet weekly with the teachers to complete questionnaires were vital
strategies necessary to support teachers with this new technology tool and to assure their
fidelity in treatment implementation and control maintenance.
Teachers modified their teaching when using the TI-Nspire to include higher
Depth of Knowledge activities as well as more representations per activity. Teachers also
made adjustments within their lesson plans to incorporate the Texas Instruments website
activities into their daily activities for their treatment class. Additional adjustments
within the teacher lesson plans included using higher Depth of Knowledge state standards
and activities as well as more representations per activity when using the TI-Nspire.
Teachers did not appear to significantly modify their assessments such as test and quizzes
for their treatment class.
This study supported the use of TI-Nspire graphing calculators into first-year
Algebra classrooms while studying the concept of functions. This study showed that
while using the TI-Nspire graphing calculator, the use of multiple representations and
higher Depth of Knowledge activities can be used to increase student achievement and
impact classroom teaching, and lesson planning. Although further research is needed to
establish the impact of the TI-Nspire across various mathematics topics, this study
demonstrated the impact of the TI-Nspire graphing calculator for the concept of functions
with respect to increasing teacher‟s use of representations and of more complex tasks.
Finally, and perhaps more importantly, the results also indicated a significant increase in
student achievement for the treatment group.

216
REFERENCES
Adams, T. L. (1997). Addressing students‟ difficulties with the concept of function:
applying graphing calculators and a model of conceptual change. Focus on
Learning Problems in Mathematics, 19(2), 43-57.
Alabama State Department of Education. (2006). Algebra I. Retrieved from
http://www.alsde.edu/html/doc_download.asp?id=512§ion=54
Allison, P. D. (2000). Multiple imputation for missing data: A cautionary tale.
Sociological Methods and Research, 28, 301–309.
American Association for the Advancement of Science. (1922). The reorganization of
mathematics in secondary education. Science, 55(1416), 172-173.
The American Diploma Project. (2004). Ready or not: Creating a high school diploma
that counts. Washington, DC: Achieve. Retrieved from
http://www.achieve.org/achieve.nsf/AmericanDiplomaProject?openform
American Mathematical Society. (1994). National policy statement. Retrieved from
http://www.ams.org
Atanda, R. (1999). Do gatekeeper courses expand education options? Educational
Statistics Quarterly, 1(1), 33-38.
Atomic Learning. (2011). TI-Nspire™ Handhelds and Computer Learning. Retrieved
from http://www.atomiclearning.com/ti_nspire
Ball, B. (2003). Teaching and learning mathematics with an interactive whiteboard.
Micromath, 19(1), 4-7.

217
Ball, G. (2004). The birth of a new age. Retrieved from
http://www.xnumber.com/xnumber/birth.htm
Blanton, M. L., & Kaput, J. J. (2005). Helping elementary teachers build mathematical
generality into curriculum and instruction. ZDM – The International Journal on
Mathematics Education, 37(1), 34-42.
Blubaugh, W., & Emmons, K. (1999). Activities: Algebra for all: Graphing for all
students. Mathematics Teacher, 92(4), 323.
Bransford, J. D., Brown, A. L., & Cocking, R. R. (Eds.). (2000). How people learn:
Brain, mind, experience, and school (Expanded Ed.). Washington, DC: National
Academy Press.
Brenner, M. E., Mayer, R. E., Moseley, B., Brar, T., Duran, R., Reed, B. S., & Webb, D.
(1997). Learning by Understanding: The Role of Multiple Representations in
Learning Algebra. American Educational Research Journal, 34(4), 663-689.
Brooks, M. G., & Brooks, J. G. (1999). The courage to be constructivist. Educational
Leadership, 57(3), 18-24.
Burrill, G. (1998). Changes in your classroom: From the past to the present to the future.
Journal for Research in Mathematics Education, 29(5), 583-596.
Bush, W. S. (2006). Kentucky diagnostic assessments for algebra I, geometry, and
algebra II. Paper presented at the Kentucky High School Mathematics Summit,
Bowling Green, KY.
Carpenter, T. P., Franke, M. L., & Levi, L. (2003). Thinking mathematically: Integrating
arithmetic and algebra in the elementary school. Portsmouth, NH: Heinemann.

218
Choike, J. R. (2000). Teaching strategies for “algebra for all.” Mathematics Teacher,
93(7), 556.
Choi-Koh, S. S. (2003). Effect of a graphing calculator on a 10th
-grade student‟s study of
trigonometry. The Journal of Educational Research, 96(6), 359-370.
Colgan, L. E. C. (1993). Graphing tools in the mathematics classroom: Some factors
affecting successful use. (Doctoral dissertation, University of Toronto).
Dissertation Abstracts International, 54, 1712A.
Connors, M. A., & Snook, K. G. (2001). The effects of hand-held CAS on student
achievement in a first-year college core calculus sequence. The International
Journal of Computer Algebra in Mathematics Education, 8(2), 99-114.
Cox, P., & Bridges L. (1999). Algebra for all: Activities: Calculating human
horsepower. Mathematics Teacher, 92(3), 225.
Creswell, J. W. (2009). Research design: Qualitative, quantitative, and mixed methods
approaches (3rd
ed.). Thousand Oaks, CA: Sage.
Davis, M. (2000). The universal computer: The road from Leibniz to Turing. New York,
NY: W.W. Norton.
Demana, F. & Waits, B. K. (1990). The Role of Technology in Teaching Mathematics.
The Mathematics Teacher, 82(1).
Dessart, D. J., DeRidder, C. M., & Ellington, A. J. (1999). The research backs
calculators. Mathematics Education Dialogues, 2(3), 6.
Dimock, V., & Sherron, T. (2005). A final report of a study of the impact of graphing
calculator use on state assessment. Retrieved from
219
http://education.ti.com/sites/US/downloads/pdf/graphing_use_st_assmnts_sedl_20
05.pdf
Dion, G., Harvey, A., Jackson, C., Klag, P., Liu, J., & Wright, C. (2001). A survey of
calculator usage in high schools. School Science and Mathematics, 101(8), 427-
438.
Doerr, H. M., & Zangor, R. (2000). Creating meaning for and with the graphing
calculator. Educational Studies in Mathematics, 41, 143-163.
Drijvers, P., & Doorman, M. (1996). The graphics calculator in mathematics education.
Journal of Mathematical Behavior, 15, 425-440.
Drijvers, P. (2000). Students encountering obstacles using a CAS. International Journal
of Computers for Mathematical Learning, 5(3), 189-209.
Drijvers, P., & Van Herwaarden, O. (2000). Instrumentation of ICT-tools: The case of
algebra in a computer algebra environment. The International Journal of
Computer Algebra in Mathematics Education, 7(4), 255-276.
Driscoll, M., Foster, S., & Moyer, J. (1999). Linked Learning in Mathematics Project.
The Mathematics Teacher, 92(1),72-73.
Dubinsky, E., Schoenfeld, A, & Kaput, J. (1994). Research in collegiate mathematics
education. Providence, RI: American Mathematical Society.
Dunham, P. H. & Dick, T. P. (1994). Research on graphing calculators. The Mathematics
Teacher, 87(6),440-445.
Ellington, A. J. (2003). A meta-analysis of the effects of calculators on students'
achievement and attitude levels in precollege mathematics classes. Journal for
Research in Mathematics Education, 34(5), 433-463.

220
Ellington, A. J. (2004). The calculator‟s role in mathematics attitude. Academic Exchange
Quarterly, 8(2), 110-114.
Ellington, A. J. (2006). The effects of non-CAS graphing calculators on student
achievement and attitude levels in mathematics: A meta-analysis. School Science
and Mathematics, 106(1), 16-27.
Farrell, A. (1996). Roles and behaviors in technology-integrated pre-calculus classrooms.
Journal of Mathematical Behavior, 15(1), 35-53.
Fey, J. T. (Ed.). (1984). Computing and mathematics: The impact on secondary school
curricula. Reston, VA: National Council of Teachers of Mathematics.
Fey, J. T. (1989). Technology and mathematics education: A survey of recent
developments and important problems. Educational Studies in Mathematics,
20(3), 237-272.
Fey, J. T., & Graeber, A. O. (2003). From the New Math to the Agenda for Action. In G.
Stanic & J. Kilpatrick (Eds.), A history of school mathematics (Vol. 1, pp. 521-
558). Reston, VA: National Council of Teachers of Mathematics.
Flattau, P. E., Bracken, J., Van Atta, R., Bandeh-Ahmadi, A., de la Cruz, R., & Sullivan,
K. (2006). The National Defense Education Act of 1958: Selected outcomes.
Washington, DC: Institute for Defense Analyses Science & Technology Policy
Institute.
Fleener, M. (1995a). The relationship between experience and philosophical orientation:
A comparison of pre-service and practicing teachers‟ beliefs about calculators.
Journal of Computers in Mathematics and Science Teaching, 14(3), 359-376.

221
Fleener, M. (1995b). A survey of mathematics teachers‟ attitudes about calculators: The
impact of philosophical orientation. Journal of Computers in Mathematics and
Science Teaching, 14(4), 481-498.
Forester, P. A. (2000). Process and object interpretations of vector magnitude mediated
by use of the graphics calculator. Mathematics Education Research Journal,
12(3), 269-285.
Froelich, G. W., Bartkovich, K. G., & Foerester, P. A. (1991). Connecting mathematics.
In C. R. Hirsch (Ed.), Curriculum and evaluation standards for school
mathematics addenda series, grades 9 - 12. Reston, VA: National Council of
Teachers of Mathematics.
Galbraith, P. (2002). “Life wasn‟t meant to be easy”: Separating wheat from chaff in
technology aided learning? Proceedings of the International Conference on the
Teaching of Mathematics [ED 472 046 SE 066 911].
Gall M. D., Gall J. P., & Borg, W. R. (2003). Educational research: an introduction (7th
ed.). NY: Pearson.
Gardner, H. (1995). “Multiple intelligences” as a catalyst. The English Journal, 84(8),
16-18.
Gardner, H., & Hatch, H. (1989). Multiple intelligences go to school: Educational
implications of the theory of multiple intelligences. Educational Researcher,
18(8), 4-10.
Garrett, A., & Davis, O. (2003). A time of uncertainty and change: School mathematics
from World War II until the new math. In G. Stanic & J. Kilpatrick (Eds.), A
222
history of school mathematics (Vol. 1, pp. 493-520). Reston, VA: National
Council of Teachers of Mathematics.
Gigerenzer, G. (2004). Mindless statistics. Journal of Socio-Economics, 33(5), 587-606.
Golden, W. M. (2006). USICSM in its second decade. Journal of Research in Science
Teaching, 1(3), 265-269.
Goldin, C. (2003). The human capital century: U.S. schools led the world during much
of the 20th
century. Will they continue to do so? Education Next, 1, 73-78.
Retrieved from http://media.hoover.org/documents/ednext20031_73.pdf
Good, T. L., Brophy, J. E. (1990). Educational psychology: A realistic approach
(4th ed.). White Plains, NY: Longman.
Goos, M., Galbraith, P., Renshaw, P., & Geiger, V. (2000). Reshaping teacher and
student roles in technology-enriched classrooms. Mathematics Education
Research Journal, 12(3), 303-320.
Graham, A. T., & Thomas, M. (1998). A graphic calculator approach to algebra.
Mathematics Teaching, 167, 27-34.
Granello, D. H. (2000). Encouraging the cognitive development of supervisees: Using
Bloom‟s taxonomy in supervision. Counselor Education & Supervision, 40(1),
31-46.
Hamley, H. R. (1934). Relational and functional thinking in mathematics: 9th yearbook
of the National Council of Teachers of Mathematics. New York, NY: Teachers
College Press.
223
Harskamp, E. G., Suhre, C. J., & Van Streun, A. (2000). The graphics calculator and
students‟ solution strategies. Mathematics Education Research Journal, 12(1), 37-
52.
Harvey, J. G., Waits, B. K., & Demana, F. D. (1995). The influence of technology on the
teaching and learning of algebra. Journal of Mathematical Behavior, 14, 75-109.
Heid, K. M. (1997). The technological revolution and the reform of school mathematics.
American Journal of Education, 106(1), 5-61.
Hembree, R., & Dessart, D. J. (1986). Effects of hand-held calculators in precollege
mathematics education: A meta-analysis. Journal for Research in Mathematics
Education, 17, 83-99.
Hembree, R., & Dessart, D. J. (1992). Research on calculators in mathematics education.
In J. T. Fey (Ed.), Calculators in mathematics education: 1992 yearbook (pp. 22-
31). Reston, VA: National Council of Teachers of Mathematics.
Hennessy, S., Fung, P., & Scanlon, E. (2001). The role of the graphic calculator in
mediating graphing activity. International Journal of Mathematical Education in
Science and Technology, 32, 267-290.
Herscovics, N. (1989). Cognitive obstacles encounter in the learning of algebra. In S.
Wagner & C. Kieran (Eds.), Research issues in the learning and teaching of
algebra (pp. 60-114). Reston, VA: National Council of Teachers of Mathematics.
Hiebert, J. (1999). Relationships between Research and NCTM Standards. Journal for
Research in Mathematics Education, 30(1), 3-19.

224
Hill, S. A., Griffiths, P.A., Bucy, J. F. et al. (1989). Everybody counts: A report to the
nation on the future of mathematics education. Washington: National Academy
Press.
Hollar, J. C., & Norwood, K. (1999). The effects of a graphing-approach intermediate
algebra curriculum on students‟ understanding of function. Journal of Research in
Mathematics Education, 30(2), 220-226.
Holliday, B., Cuevas, G. J., Moore-Harris, B, Carter, J. A., Marks, D., Casey, R. M. …,
Hayek, L. M. (2005). Algebra 1. New York: McGraw-Hill/Glencoe.
Hong, Y., Toham, M., & Kiernan, C. (2000). Super calculators and university entrance
calculus examinations. Mathematics Education Research Journal, 12(3), 321-336.
Horton, N. J. & Lipsitz, S. R. (2001). Multiple Imputation in Practice: Comparison of
Software Packages for Regression Models with Missing Variables. The American
Statistician, 55(3), 244-254.
Hudnutt, B. S., & Panoff, R. M. (2002). Mathematically appropriate uses of technology.
ON-Math, 1(2). Retrieved from
http://www.nctm.org/eresources/view_media.asp?article_id=2264
Huntley, M., Rasmussen, C., Villarubi, R., Sangton, J., & Fey, J. (2000). Effects of
standards-based mathematics education: A study of the Core-Plus Mathematics
Project Algebra and Functions Strand. Journal for Research in Mathematics
Education, 31(3), 328-361.
Imig, D. R. (1981). The use of film in the measurement of student learning. Family
Relations 30(2), 259-263.
225
James, T., & Tyack, D. (1983). Learning from past efforts to reform the high school. Phi
Delta Kappan, 64, 400-406.
Jones, P. S., & Coxford, A. F., Jr. (1970). Mathematics in the evolving schools. In P. S.
Jones & A. F. Coxford, Jr. (Eds.), A history of mathematics education in the
United States and Canada: 32nd
yearbook. Washington, DC: National Council of
Teachers of Mathematics.
Kaput, J., Carraher, D., & Blanton M. (2007). Algebra in the early grades. Mahwah, NJ:
Erlbaum.
Keller, B., & Hirsch, C. (1998). Student preferences for representations of functions.
International Journal of Mathematical Education in Science and Technology,
29(1), 1-17.
Keller, B., & Russell, C. (1997). Effects of the TI-92 on calculus students solving
symbolic problems. International Journal of Computer Algebra in Mathematics
Education, 4, 77-97.
Keller, B., Russell, C., & Thompson, H. (1999). A large-scale study clarifying the roles
of the TI-92 and instructional format on student success in calculus. International
Journal of Computer Algebra in Mathematics Education, 6, 191-207.
Kendal, M., & Stacey, K. (1999). Varieties of teacher privileging for teaching calculus
with computer algebra systems. International Journal of Computer Algebra in
Mathematics Education, 6, 233-247.
Kentucky Department of Education. (2006). Kentucky core content for assessment [4.1].
Retrieved from

226
http://www.education.ky.gov/users/OTL/CCA%204%201%20FINAL/CCA_41.p
df
Kieran, C. (1989). The early learning of algebra: A structural perspective. In S. Wagner
& C. Kieran (Eds.), Research issues in the learning and teaching of algebra.
Reston, VA: National Council of Teachers of Mathematics.
Kieran, C. (1992). The learning and teaching of school algebra. In D. A. Grouws (Ed.),
Handbook of research on mathematics teaching and learning. New York, NY:
MacMillian.
Klassen, J., & Vogel, D. (2001). Technology-supported learning: Status, issues and
trends. Journal of Computer Assisted Living, 17, 104-114.
Krathwohl, D. R. (2002). A revision of Bloom‟s taxonomy: An overview. Theory into
Practice, 41(4), 212-218.
Lankford, Jr., F. (1959). Implications of the psychology of learning for the teaching of
mathematics. In P. S. Jones (Ed.), The growth of mathematical ideas: Grades K –
12: 24th yearbook (pp. 405-430). Washington, DC: National Council of Teachers
of Mathematics.
Lappan, G. (1997). The Challenges of Implementation: Supporting Teachers. American
Journal of Education, 106(1), 207-239.
Lauten, A., Graham, K., & Ferrini-Mundy, J. (1994). Student understanding of basic
calculus: Interaction with the graphics calculator. Journal of Mathematical
Behavior, 13(2), 225-237.
Lee, V. S. (1999). Creating a blueprint for the constructivist classroom. The National
Teaching and Learning Forum Newsletter, 8(4).

227
Leitz, A. R., & Kitt, N. A. (2000). Algebra for all: Using homemade algebra tiles to
develop algebra and pre-algebra concepts. Mathematics Teacher, 93(6), 462.
Lesser, L. M. (2000). Algebra for all: Reunion of broken parts: Experiencing diversity
in algebra. Mathematics Teacher, 93(1), 62.
Lloyd, G., & Wilson, M. (1998). Supporting innovation: The impact of a teacher‟s
conceptions of functions on his implementation of a reform curriculum. Journal
for Research in Mathematics Education, 29(3), 248-274.
Long, V., & Barrett, L. (2007). The Moore Method and the constructivist theory of
learning: Was R. L. Moore a constructivist? (Unpublished manuscript).
MacLane, S., & Birkhoff, G. (1967). Algebra. New York, NY: MacMillian.
Mariotti, M. A. (2000). Introduction to proof: The mediation of a dynamic software
environment. Education Studies in Mathematics, 44(1/2), 25-53.
Marrades, R., & Gutierrez, A. (2000). Proofs produced by secondary school students
learning geometry in a dynamic computer environment. Educational Students in
Mathematics, 44(1/2), 87-125.
Maxfield, C., & Brown, A. (1997). Bebop BYTES back: An unconventional guide to
computers. Madison, AL: Doone.
May, K. O., & Van Engen, H. (1959). Relations and functions. In P. S. Jones (Ed.), The
growth of mathematical ideas: Grades K-12: 24th yearbook (pp. 65-110).
Washington, D.C.: National Council of Teachers of Mathematics.
McConnell, M., & Bhattacharya, D. N. (1999). Algebra for all: Using the elegance of
arithmetic to enhance the power of algebra. Mathematics Teacher, 92(6), 492.

228
McLeod, D. B. (2003). From consensus to controversy: The story of the NCTM
standards. In G. Stanic & J. Kilpatrick (Eds.), A history of school mathematics
(Vol. 1, pp. 753-818). Reston, VA: National Council of Teachers of
Mathematics.
Meagher, M., Ozgun-Koca, A. et al. (2008). Pre-service teachers‟ experiences with
advanced digital technologies: The interplay between technology in a pre-service
classroom and in field placements. New York, NY: Brooklyn College-CUNY.
Mergel, B. (1998). Instructional design and learning theories. University of
Saskatchewan, College of Education. Retrieved from
http://www.usask.ca/education/coursework/802papers/mergel/brenda.htm
Merriweather, M., & Tharp, M. (1999). The effect of instruction with graphing
calculators on how general mathematics students naturalistically solve algebra
problems. Journal of Computers in Mathematics and Science Teaching, 18(1), 7-
22.
Middleton, J. A., Dougherty, B., Heid, M. K., D‟Ambrosio, B., Reys, R., de Loach-
Johnson, I., Gutstein, E., & Hala, M. (2004). An agenda for research action in
mathematics education: Beginning the discussion. Journal for Research in
Mathematics Education, 35(2), 74-80.
Mitchelmore, M., & Cavanagh, M. (2000). Students‟ difficulties in operating a graphics
calculator. Mathematics Education Research Journal, 12(3), 254-268.
Mittag, K. & Taylor, S. (2000). The evolution of a graphing calculator course for pre-
service mathematics teacher. Issues in the Undergraduate
229
Mathematics Preparation of School Teachers: The Journal, 3. Retrieved from
http://www.k-12prep.math.ttu.edu/journal/technology/mittag01/article.pdf
Museum of HP Calculators. (2004). Slide rules. Retrieved from
http://www.hpmuseum.org/sliderul.htm
National Council of Teachers of Mathematics. (1980). Agenda for Action:
Recommendations for school mathematics of the 1980s. Reston, VA: Author.
National Council of Teachers of Mathematics. (1981). Priorities in school mathematics:
Executive summary of the PRISM Project. Reston, VA: Author.
National Council of Teachers of Mathematics. (1989). Curriculum and evaluation
standards for school mathematics. Reston, VA: Author.
National Council of Teachers of Mathematics. (1991). Professional standards for teaching
mathematics. Reston, VA: Author.
National Council of Teachers of Mathematics. (1995). Assessment standards for school
mathematics. Reston, VA: National Council of Teachers of Mathematics.
National Council of Teachers of Mathematics. (1998). Calculators and the education of
youth. Position Statement. Reston, VA: Author.
National Council of Teachers of Mathematics. (2000). Principles and standards for school
mathematics. Reston, VA: Author.
National Council of Teachers of Mathematics. (2008). Algebra: What, when, and for
whom. Position statement. Retrieved from
http://www.nctm.org/about/content.aspx?id=16229.
National Science Board. (2010). Science and Engineering Indicators 2010. Arlington,
VA: National Science Foundation (NSB 10-01).

230
Niess, M. L., Ronau, R. N., Shafer, K. G., Driskell, S. O., Harper S. R., Johnston, C.,
Browning, C., Özgün-Koca, S. A., & Kersaint, G. (2009). Mathematics teacher
TPACK standards and development model. Contemporary Issues in Technology
and Teacher Education [Online serial], 9(1), 4-24. Retrieved from
http://www.citejournal.org/vol9/iss1/mathematics/article1.cfm
Norfolk Public Schools. (2006). Algebra I report. Norfolk, VA: Author.
O'Callaghan, B. R. (1998). Computer-intensive algebra and students' conceptual
knowledge of functions. Journal for Research in Mathematics Education, 29, 21-
40.
Osborne, A. F., & Crosswhite, F. J. (1970). Forces and issues related to curriculum and
instruction, 7-12. In P. S. Jones & A. F. Coxford, Jr. (Eds.), A history of
mathematics education in the United States and Canada: 32nd
yearbook.
Washington, DC: National Council of Teachers of Mathematics.
Patton, M. Q. (2002). Qualitative research and evaluation methods (3rd
ed.). Thousand
Oaks, CA: Sage.
Philipp, R. A., & Schappelle, B. P. (1999). Algebra for all and discuss with your
colleagues: Algebra as generalized arithmetic: Starting with the known for a
change. Mathematics Teacher, 92(4), 310.
Podlesni, J. (1999). A new breed of calculators: Do they change the way we teach?
Mathematics Teacher, 92(2), 88-89.
Privateer, P. M. (1999). Academic technology and the future of higher education:
Strategic paths taken and not taken. The Journal of Higher Education, 70(1), 60-
79.

231
Pugalee, D. K. (2001). Algebra for all: The role of technology and constructivism in an
algebra course for at-risk students. Preventing School Failure, 45(4), 171-176.
Quesada, A., & Maxwell, M. (1994). The effects of using graphing calculators to enhance
college students‟ performance in pre-calculus. Educational Studies in
Mathematics, 27(2), 205-215.
RAND Mathematics Study Panel. (2003). Mathematical proficiency for all students:
Toward a strategic research and development program in mathematics education.
Santa Monica, CA: RAND.
Rech, J., & Harrington, J. (2000). Algebra as a gatekeeper: A descriptive study at an
urban university. Journal of African American Studies, 4(4), 63-71.
Redin, J. (2004a). A brief history of mechanical calculators: Part I The age of the
polymaths. Retrieved from http://www.xnumber.com/xnumber/mechanical1.htm
Redin, J. (2004b). A brief history of mechanical calculators: Part III getting ready for
the 20th
century. Retrieved from
http://www.xnumber.com/xnumber/mechanical3.htm
Redin, J. (2004c). The calculator wars. Retrieved from
http://www.xnumber.com/xnumber/wars.htm
Reys, B. J., & Arbaugh, F. (2001). Clearing up the confusion over calculator use in
grades K-5. Teaching Children Mathematics, 82, 90.
Roberts, D. M. (1980). The impact of electronic calculators on educational performance.
Review of Educational Research, 50(1), 71-98.

232
Rochowicz, Jr., J. (1996). The impact of using computers and calculators on calculus
instruction. Journal of Computers in Mathematics and Science Teaching, 15, 423-
435.
Ronau, R. N., Niess, M. L., Browning, C., Pugalee, D., Driskell, S. O., & Harrington, R.
(2008). Framing the research on digital technologies and student learning in
mathematics. In L. Bell, L. Schrum & A. D.Thompson (Eds.), Framing research
on technology and student learning in the content areas: Implications for
educators (pp. 13-31). Charlotte, NC: Information Age.
Rostky, G. (1997). Calculator: You can count on it. Electronic Engineering Times, 971,
20-25.
Russell, G. (1990). Webster’s new dictionary and thesaurus for school, home, and office.
New Lanark, Scotland: Geddes & Grosset Ltd.
Ruthven, K. (1990a). The effects of using graphing calculators to enhance college
students‟ performance in pre-calculus. Educational Studies in Mathematics, 27(2),
205-215.
Ruthven, K. (1990b). The Influence of Graphic Calculator Use on Translation from
Graphic to Symbolic Forms. Educational Studies in Mathematics, 21(5), 431-
450.
Sackney, L., & Mergel, B. (2007). Contemporary learning theories, instructional design
and leadership. In J. M. Burger, C. F. Webber, & P. Klinck (Eds.), Intelligent
leadership: Constructs for thinking education leaders (pp. 67-98). Netherlands:
Springer.

233
Schwarz, B. B., & Hershkowitz, R. (1999). Prototypes: Brakes or levers in learning the
function concept? The role of computer tools. Journal for Research in
Mathematics, 30(4), 362-389.
Seeley, C. (2005). Pushing algebra down. NCTM News Bulletin. Reston, VA: National
Council of Teachers of Mathematics.
Shadish, W. R., Cook, T. D., & Campbell, D. T. (2002). Quasi-experimental designs for
generalized causal inference. Boston, MA: Houghton Mifflin.
Shoaf-Grubbs, M. M. (1994). The effect of the graphing calculator on female students‟
spatial visualization skills and level of understanding in elementary graphing and
algebra concepts. In E. Dubinsky, A. Shoenfeld, & J. Kaput (Eds.), Research in
collegiate mathematics education, 1, 169-194.
Silva, C. M., Moses, R. P., Rivers, J., & Johnson, P. (1990). The algebra project: making
middle school mathematics count. Journal of Negro Education, 59(3), 375-391.
Simmt, E. (1997). Graphing calculators in high school mathematics. Journal for
Computers in Mathematics and Science Teaching, 16(2-3), 269-289.
Simonsen, L. M., & Dick, T. P. (1997). Teachers‟ perceptions of the impact of graphing
calculators in the mathematics classroom. The Journal of Computers in
Mathematics and Science, 16(2-3), 239-268.
Skemp, R. (1976). Relational understanding and instrumental understanding.
Mathematics Teaching, 77, 20-26.
Slavit, D. (1996). Graphing calculators in a “hybrid” algebra II classroom. For the
Learning of Mathematics, 15(1), 9-14.

234
Slavit, D. (1997). An alternate route to the reification of function. Educational Studies in
Mathematics, 33, 259-281.
Slavit, D. (1998). Three women‟s understanding of algebra in pre-calculus course
integrated with the graphing calculator. Journal of Mathematical Behavior, 17(3),
303-389.
Smith, B. A. (1997). A meta-analysis of outcomes from the use of calculators in
mathematics education. Dissertation Abstracts International, 58, 787A.
South Carolina State Department of Education. (2009). Algebra I. Retrieved from
http://ed.sc.gov/agency/Standards-and-Learning/Academic-
Standards/old/cso/standards/math/documents/course_standards/algebra1.pdf.
Stanic, G. M. (1986). The growing crisis in mathematics education in the early twentieth
century. Journal for Research in Mathematics Education, 17(3), 190-205.
Stein, N. W. (1983). The effective use of mass media in sociology education:
confronting the competing curriculum. Teaching Sociology, 10(3), 283-317.
Stiff, L. V., Johnson, J. L., & Johnson, M. R. (1993). Cognitive issues in mathematics
education. In P. S. Wilson (Ed.), Research ideas for the classroom: High school
mathematics (pp. 3-20). New York: National Council of Teachers of
Mathematics Research Interpretation Project.
Stone, C. B. (1996). The gatekeepers: Rethinking the math curriculum. Principal, 76, 52-
53.
Tarr, J. E., Uekawa, K., Mittag, K. C., & Lennex, L. (2000). A comparison of calculator
use in eighth-grade mathematics classrooms in the United States, Japan, and

235
Portugal: Results from the Third International Mathematics and Science Study.
School Science and Mathematics, 100(3), 139.
Tashakkori, A. & Teddlie, C. (1998). Mixed methodology: Combining qualitative and
quantitative approaches. Thousand Oaks, CA: Sage.
Tennessee State Department of Education. (2004). Algebra I. Retrieved from
http://170.143.36.85/gate/FMPro?-db=gateways.fp5&-
format=record%5fdetail.htm&-lay=layout%20%231&-sortfield=Subject&-
sortfield=Standard%20Number&-op=eq&Subject=ALGEBRA%20I&-lop=or&-
max=20&-recid=1&-find=.
Tennessee State Department of Education. (2009). Graduation Requirements. Retrieved
from http://www.tennessee.gov/education/TDP/GradReq.shtml.
Tharp, M. L., Fitzsimmons, J. A. & Ayers, R. L. B. (1997). Negotiating a technology
shift: Teacher perception of the implementation of graphing calculators. Journal
of Computers in Mathematics and Science Teaching. 16(4), 551-575.
Thompson, A. D., & Sproule, S. L. (2000). Deciding when to use calculators.
Mathematics Teaching in the Middle School, 6(2), 126.
Thompson, D. R., & Senk, S. L. (2001). The effects of curriculum on achievement in
second-year algebra: The example of the University of Chicago School
Mathematics Project. Journal for Research in Mathematics Education, 32, 58-84.
Thorpe, J. (1989). Algebra: What should we teach and how should we teach it? In S.
Wagner & C. Kieran (Eds.), Research issues in the learning and teaching of
algebra. Reston, VA: National Council of Teachers of Mathematics.

236
Thurlow, M. L., Sinclair, M. F., & Johnson, D. R. (2002). Students with disabilities who
drop out of school: Implications for policy and practice. Issue Brief, 1(2).
Minneapolis, MN: University of Minnesota, Institute on Community Integration,
National Center on Secondary Education and Transition.
United States Department of Education. (2000). Before it’s too late. Retrieved from
http://www.ed.gov/inits/Math/glenn/report.doc
United States Department of Education. (2004a). Proven methods: The facts about
investing in what works. Retrieved from
http://www.ed.gov/nclb/methods/whatworks/whatworks.html
United States Department of Education. (2004b). Proven methods: The facts about math
achievement. Retrieved from http://www.ed.gov/nclb/methods/math/math.html
United States Department of Education. (2008). NAEP – frequently asked questions.
Retrieved from http://nces.ed.gov/nationsreportcard/faq.asp#ques1
United States Department of Education. (2009). The federal role in education. Retrieved
from http://www.ed.gov/about/overview/fed/role.html
United States Department of Veteran‟s Affairs. (2006). History – VA history. Retrieved
from http://www.va.gov/about_va/vahistory.asp and
http://www.va.gov/about_va/vamilestones.asp
Usiskin, Z. (1988). Conceptions of school algebra and uses of variables. In Coxford, A.F.
(Ed.), The ideas of algebra, K-12: 1988 yearbook (pp. 8-19). Reston, VA:
National Council of Teachers of Mathematics.
Usiskin, Z. (1997). Reforming the third R: Changing the school mathematics curriculum:
An introduction. American Journal of Education, 106, 1-61.

237
Usiskin, Z. (2002). From “mathematics for some” to “mathematics for all.” In R.
Biehler, R. Schlz, R. Straber, and B. Winkelmann (Eds.), Didactics of
mathematics as a scientific discipline. New York, NY: Kluwer Academic.
Usiskin, Z. (2004). A significant amount of algebra. Nieuw Archief voor Wiskunde, 5(5),
147-151.
Vendlinski, T. P., Morris, J., & Michels, C. (2008). The importance of intention and
order: Teaching for conceptual understanding using handheld technology. Los
Angeles, CA: University of California at Los Angeles.
Vogel, D., & Klassen, J. (2001). Technology-supported learning: Status, issues, and
trends. Journal of Computer Assisted Learning, 17, 104-114.
Wagner, S., & Parker, S. (1993). Advancing algebra. In P. S. Wilson (Ed.), Research
ideas for the classroom: High school mathematics (pp. 119-139). New York,
NY: National Council of Teachers of Mathematics.
Waits, B. K., & Demana, F. (1998). The role of graphing calculators in mathematics
reform. (ERIC. ED 458 108). Retrieved from
http://www.eric.ed.gov/ERICDocs/data/ericdocs2sql/content_storage_01/0000019
b/80/19/58/1f.pdf
Webb, Norm. (2006). Aligning alternate assessments. Retrieved from
http://wceruw.com/news/coverStories/aligning_alternate_assessments.php
Zbiek, R. M. (1998). Prospective teachers‟ use of computing tools to develop and
validate functions as mathematical models. Journal for Research in Mathematics
Education, 29(2), 184-201.

238
APPENDIX A

239

240

241
APPENDIX B

242
APPENDIX C

243
APPENDIX D

244
APPENDIX E

245
APPENDIX F

246
CURRICULUM VITAE
NAME: Barbara Renee Buckner
ADDRESS: 247 Ayers Drive NE
Cleveland, TN 37323
DOB: Wyandotte, Michigan – August 25, 1973
EDUCATION
& TRAINING: B.S, Mathematics
Lee University
1991-1994
M.S., Education
Tusculum College
1995-1996
Ph.D., Curriculum and Instruction in Mathematics Education
University of Louisville
2002-2011
AWARDS: Honor an Educator Award by Kappa Delta Pi
2008
Who‟s Who among America‟s Teachers
1998, 2000, 2004, 2006, 2008
State of Tennessee, Teacher of the Year Finalist
2007
East Tennessee Teacher of the Year
2007
National Chancellor's List (University of Louisville)
2004, 2006
PROFESSIONAL HISTORY:
Bradley Central High School, Cleveland, Tennessee
Math, Science, & Leadership Teacher
1994 to Present

247
Lee University, Cleveland, Tennessee
Part-time Instructor of Computer Information Systems
1999 to Present
European Bible Seminary, Rudersberg, Germany
Guest Lecturer
March 2002
Poltava Pedagogical Institute, Poltava, Ukraine Exchange Program with Lee
University. Taught in Ukrainian-English classes about American traditions,
history, and culture.
Summer of 1993, 1994, and 1998
PROFESSIONAL SOCIETIES:
Kappa Delta Pi (2008-present)
Appalachian Association of Mathematics Teacher Educators, (2003-present)
Executive Board Member-at-Large (2009-present)
National Council of Teachers of Mathematics (2002-present)
Association of Mathematics Teacher Educators (2002-present)
Tennessee Association of Student Councils (1996-present)
National Education Association (1994-present)
Tennessee Education Association, (1994-present)
LEA State Insurance Representative (2009-present)
Bradley County Education Association (1994-present)
Building Association Representative (2003-present)
High School Executive Board Representative (2008-2010)
PUBLICATIONS:
A correlation study between the amount of alcohol use among teenagers and the
amount of dysfunction within a family.
Tusculum College, Greeneville, Tennessee
1996
Assisted with the Institute for Culturally Responsive Practice work groups to
compile, produce, and publish resources.
Dr. Jo Ann Higginbotham, lead Professor
Lee University, Cleveland, Tennessee
1999
Choices a chapter within Young Women on a Journey to Excellence.
International Women‟s Ministries Department, Church of God Publishing.
Cleveland, Tennessee
2003

248
Reflective Thoughts of the Semester in Ukraine Exchange Program
Contributing author
Poltava Pedagogical Institute, Poltava, Ukraine
Lee University, Cleveland, Tennessee
2002
INVITED PRESENTATIONS
Mentoring and Teaching Methods: Emphasis on Youth.
European Bible Seminary; Kniebis, Germany.
March 2002
Research Poster Session
National Science Foundation Centers for Learning and Teaching Conference
Washington, DC
2005
The Connection Project: Cross-Curriculum Integration between Vo-Tech Classes
and Core-Academic Classes
Tennessee Vocational State Conference, Nashville, Tennessee
2004
GRANTS:
Tennessee Department of Education, Voc-Tech Grant
The ABC‟S of CTE
2009
Best Buy Teach Award (Community Grants)
Infusion of Technology into the Science Classroom, $2,000
2008
Bradley Cleveland Public Educational Foundation Teacher Mini Grant
Integrating 7 Habits of Highly Effective Teens into the Science Classroom, $750
2007
Bradley Cleveland Public Educational Foundation Teacher Mini Grant
Using Mathematics to Solve Science Problems, $500
2007
NCCEP and AT&T Grant
Enhancing the Teaching and Learning Functions through the Use of Instructional
Technologies in GEAR UP Classrooms: A Capacity-Building Program for
Teachers, $48, 275
2006

249
NCCEP and AT&T Grant
Preparing Students for College Attendance and Supporting After-School and
Summer Academic Enrichment Programs in Math, Science, Reaching and
Technological Literacy, $48,507
2006
Tennessee Department of Education, Voc-Tech Grant
The Connection Project: Cross-Curriculum Integration between Vo-Tech
Classes and Core-Academic Classes, $20,000
2003
Tennessee Department of Education Grant
Improving and updating the Bradley Central Physics lab, $9,999
2001
Goals 2000 Technology Grant
Integrating Standards into the curriculum, $250
1999
Tech Prep Mini-Grant
Integrating Science with Auto Mechanics, $1000
1998
Tech Prep Mini-Grant
Integrating Algebra with Auto Mechanics, $1000
1997