teagasc national farm survey 2014 - static.rasset.ie · teagasc national farm survey: preliminary...
TRANSCRIPT

Teagasc National Farm Survey 2014
Thia Hennessy and Brian Moran
Agricultural Economics and Farm Surveys Department
Rural Economy and Development Programme
Teagasc
Athenry
Co Galway
www.teagasc.ie

Executive Summary
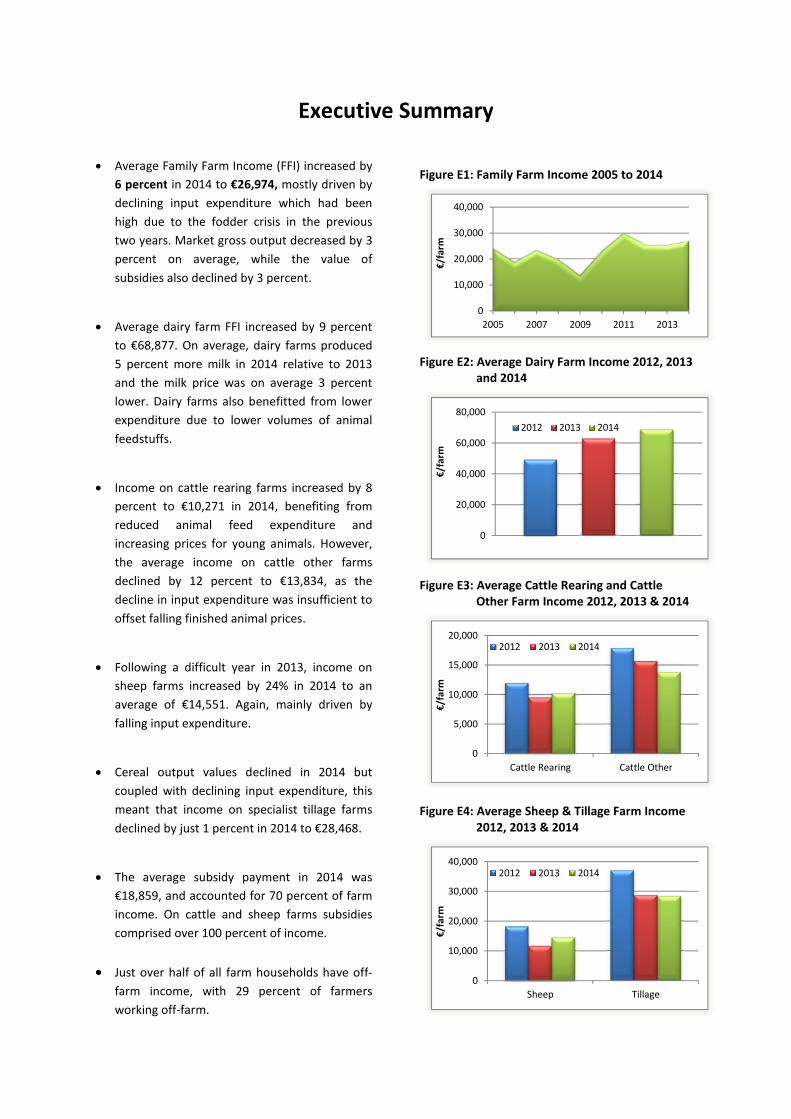
Average Family Farm Income (FFI) increased by
6 percent in 2014 to €26,974, mostly driven by
declining input expenditure which had been
high due to the fodder crisis in the previous
two years. Market gross output decreased by 3
percent on average, while the value of
subsidies also declined by 3 percent.
Average dairy farm FFI increased by 9 percent
to €68,877. On average, dairy farms produced
5 percent more milk in 2014 relative to 2013
and the milk price was on average 3 percent
lower. Dairy farms also benefitted from lower
expenditure due to lower volumes of animal
feedstuffs.
Income on cattle rearing farms increased by 8
percent to €10,271 in 2014, benefiting from
reduced animal feed expenditure and
increasing prices for young animals. However,
the average income on cattle other farms
declined by 12 percent to €13,834, as the
decline in input expenditure was insufficient to
offset falling finished animal prices.
Following a difficult year in 2013, income on
sheep farms increased by 24% in 2014 to an
average of €14,551. Again, mainly driven by
falling input expenditure.
Cereal output values declined in 2014 but
coupled with declining input expenditure, this
meant that income on specialist tillage farms
declined by just 1 percent in 2014 to €28,468.
The average subsidy payment in 2014 was
€18,859, and accounted for 70 percent of farm
income. On cattle and sheep farms subsidies
comprised over 100 percent of income.
Just over half of all farm households have off-
farm income, with 29 percent of farmers
working off-farm.
Figure E1: Family Farm Income 2005 to 2014
Figure E2: Average Dairy Farm Income 2012, 2013and 2014
Figure E3: Average Cattle Rearing and CattleOther Farm Income 2012, 2013 & 2014
Figure E4: Average Sheep & Tillage Farm Income2012, 2013 & 2014
0
10,000
20,000
30,000
40,000
2005 2007 2009 2011 2013
€/f
arm
0
20,000
40,000
60,000
80,000
€/f
arm
2012 2013 2014
0
5,000
10,000
15,000
20,000
Cattle Rearing Cattle Other
€/f
arm
2012 2013 2014
0
10,000
20,000
30,000
40,000
Sheep Tillage
€/f
arm
2012 2013 2014


Teagasc National Farm Survey: Preliminary Results 2014
1
Family Farm Income
2014
Family farm income is the principal measure
used in the National Farm Survey. The average
family farm income across all 78,641 farms in
2014 was €26,974, representing a 6 percent
increase on the 2013 average.
The increase in income was mostly driven by
reduced input expenditure. The value of gross
output declined by 3 percent, driven by
reductions in both the returns to production
and subsidies. The various components of
farm income are outlined in Table 1.
Table 1: Average Family Farm Income 2014
2014 Change
from
2013
€ %
Gross Output 84,214 -3
(of which subsidies) 18,859 -3
Total Costs 57,239 -6
(of which direct costs) 30,972 -11
( of which overheads) 26,267 -1
Family Farm Income 26,974 +6
Lower cattle slaughter prices combined with a
slightly lower milk price led to a fall in gross
output values on many farms, albeit those
involved in sheep production did see an
increase in gross output. The average subsidy
payment fell by 3 percent in 2014, mostly due
to a reduction in the Single Farm Payment to
establish a crisis reserve.
Input expenditure, particularly on animal feed
stuffs, was very high in 2013 as a result of the
fodder crisis. Total direct costs fell by 11
percent from 2013 to 2014. Total overhead
costs were more or less unchanged. Costs
consumed 68 percent of output on the
average farm in 2014, an improvement on the
2013 figure of 71 percent.
Figure 1: Average Family Farm Income 2005
to 2014
Family farm income has generally followed an
upward trend since the low point of 2009.
Following two years of stagnation in 2012 and
2013, a small increase of 6 percent in 2014 is
evident. However, income still lags behind the
record levels recorded in 2011.
0
10000
20000
30000
40000
2005 2007 2009 2011 2013
€/f
arm
Family Farm Income representsthe return from farming for the
farm family to their labour,land and capital. It does not
include non-farm income.
€26,974 was the averagefarm income in 2014, a 6
percent increase from 2013.

Teagasc National Farm Survey: Preliminary Results 2014
2
Income by Farm System
2014
Income varies quite considerably by farm
system. Dairy farms are consistently the most
profitable farms with an average income of
€68,877 in 2014. Cattle rearing farms have the
lowest average farm income at €10,271 in
2014.
Figure 2: Average Farm Income by System
2013 & 2014
The large variation in average farm income
across the farm systems is driven by
differences in both farm size and profitability.
The average farm size in 2014, across all
systems of farming, was 47 hectares and the
average income was €569 per hectare in
2014.
The dry-stock sector, cattle and sheep farms,
is characterised by low profitability and small
holdings. The average income per hectare was
€263 on Cattle Rearing farms in 2014, the
lowest of the farm systems.
Table 2: Average Farm Size and Income perhectare 2014
Size Income
ha €/ha
Dairy 55 1,252
Cattle Rearing 39 263
Cattle Other 40 345
Sheep 55 265
Tillage 58 490
Mixed Livestock 64 904
All 47 569
The year on year change in income varied
across the farm systems. Total production
costs declined across all farm systems.
However, the reduction in expenditure was
insufficient to offset the falling finished cattle
price for cattle other farms and was
insufficient to maintain tillage farm income.
Figure 3: Percentage change in income bysystem 2013 to 2014
-
20,000
40,000
60,000
80,000
Dairy CattleRearing
CattleOther
Sheep Tillage MixedL'stock
€/f
arm
2013 2014
-20 -10 - 10 20 30
Dairy
Cattle Rearing
Cattle Other
Sheep
Tillage
Mixed
% change in income
Dairy is the most profitablesystem with an average
income of €68,877
The largest income reduction ison cattle other farms. Income
is down 12%

Teagasc National Farm Survey: Preliminary Results 2014
3
Income Distribution
2014
There is a wide variation in farm incomes
across the farm population. Although average
farm income increased in 2014, there was no
significant improvement on low income
farms. In 2013 approximately 23% of farms
produced a farm income of less than €5,000
and this proportion increased to 24% in 2014.
At the opposite end of the spectrum, 18% of
farms produced an income of over €50,000.
Figure 4: Farm Income Distribution 2013 &
2014
There is also a wide distribution in income
across farm systems. The vast majority (61%)
of cattle rearing farms earned less than
€10,000. While close to 50 percent of sheep
and cattle other farms also earned less than
€10,000. It is only on the specialist dairy and
mixed livestock farms that there is a core of
farmers earning over €50,000. Almost two-
thirds of dairy farms and just less than half of
mixed livestock farms earned over €50,000.
Figure 5: Income Distribution by System 2013& 2014
On average there is 1.1 family labour units
employed on each farm. The average amount
of unpaid labour supplied was highest on
dairy farms at 1.6 labour units and lowest on
cattle rearing farms at 1.03.
Figure 6 presents the income per labour unit
distribution in 2014. The relatively low labour
input on tillage farms is reflected in the higher
incomes when expressed on a per labour unit
basis. The income per labour unit exceeded
€50,000 on 50% of dairy farms, 35 percent of
mixed farms and 30 percent of tillage farms in
2014.
Figure 6: Income Distribution per labour unit
2014
-
10
20
30
<5,000 5-10,000 10-20,000 20-50,000 >50,000
%o
ffa
rms
2013 2014
0%
25%
50%
75%
100%
Dairy CattleRearing
CattleOther
Sheep Tillage MixedL'stock
<10,000 10-50,000 >50,000
0%
25%
50%
75%
100%
Dairy CattleRearing
CattleOther
Sheep Tillage MixedL'stock
<10,000 10-50,000 >50,000
5% of farms earned over€100,000 while 23% earned
less than €5,000
Teagasc National Farm Survey: Preliminary Results 2014
4
Reliance on Subsidies
2014
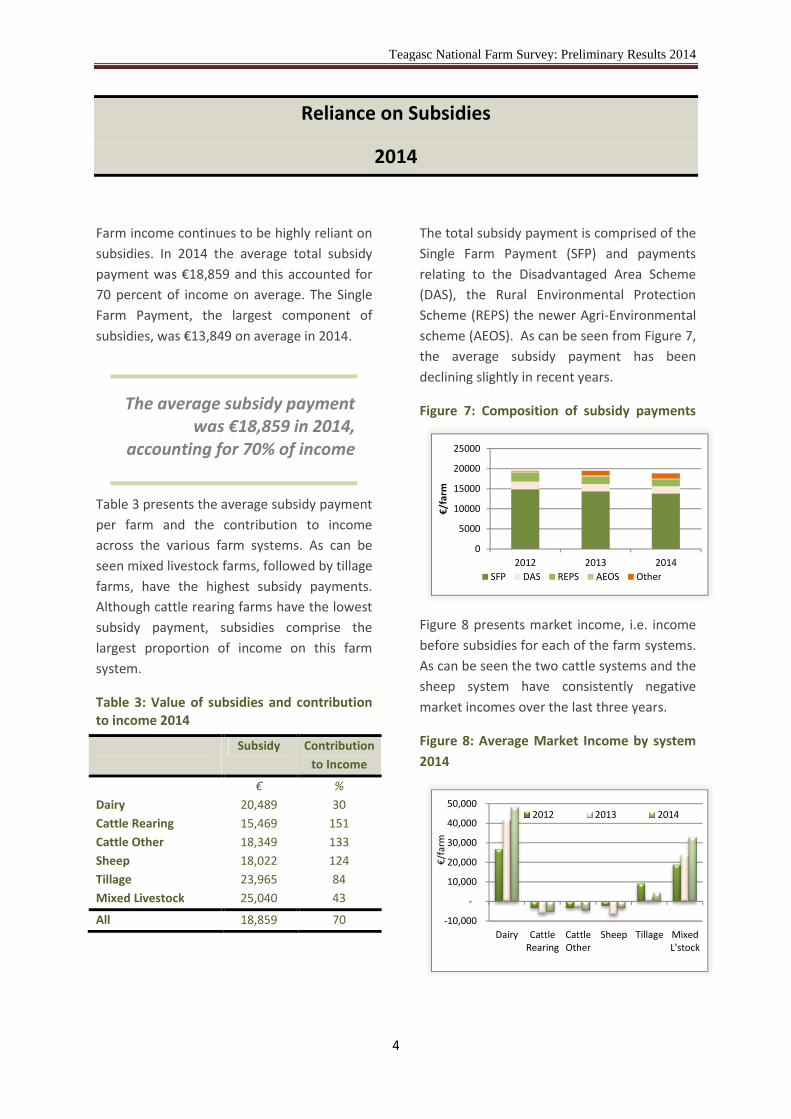
Farm income continues to be highly reliant on
subsidies. In 2014 the average total subsidy
payment was €18,859 and this accounted for
70 percent of income on average. The Single
Farm Payment, the largest component of
subsidies, was €13,849 on average in 2014.
Table 3 presents the average subsidy payment
per farm and the contribution to income
across the various farm systems. As can be
seen mixed livestock farms, followed by tillage
farms, have the highest subsidy payments.
Although cattle rearing farms have the lowest
subsidy payment, subsidies comprise the
largest proportion of income on this farm
system.
Table 3: Value of subsidies and contributionto income 2014
Subsidy Contribution
to Income
€ %
Dairy 20,489 30
Cattle Rearing 15,469 151
Cattle Other 18,349 133
Sheep 18,022 124
Tillage 23,965 84
Mixed Livestock 25,040 43
All 18,859 70
The total subsidy payment is comprised of the
Single Farm Payment (SFP) and payments
relating to the Disadvantaged Area Scheme
(DAS), the Rural Environmental Protection
Scheme (REPS) the newer Agri-Environmental
scheme (AEOS). As can be seen from Figure 7,
the average subsidy payment has been
declining slightly in recent years.
Figure 7: Composition of subsidy payments
Figure 8 presents market income, i.e. income
before subsidies for each of the farm systems.
As can be seen the two cattle systems and the
sheep system have consistently negative
market incomes over the last three years.
Figure 8: Average Market Income by system
2014
0
5000
10000
15000
20000
25000
2012 2013 2014
€/f
arm
SFP DAS REPS AEOS Other
-10,000
-
10,000
20,000
30,000
40,000
50,000
Dairy CattleRearing
CattleOther
Sheep Tillage MixedL'stock
€/f
arm
2012 2013 2014
The average subsidy paymentwas €18,859 in 2014,
accounting for 70% of income
Teagasc National Farm Survey: Preliminary Results 2014
5
Regional Overview and Off-farm Employment
2014
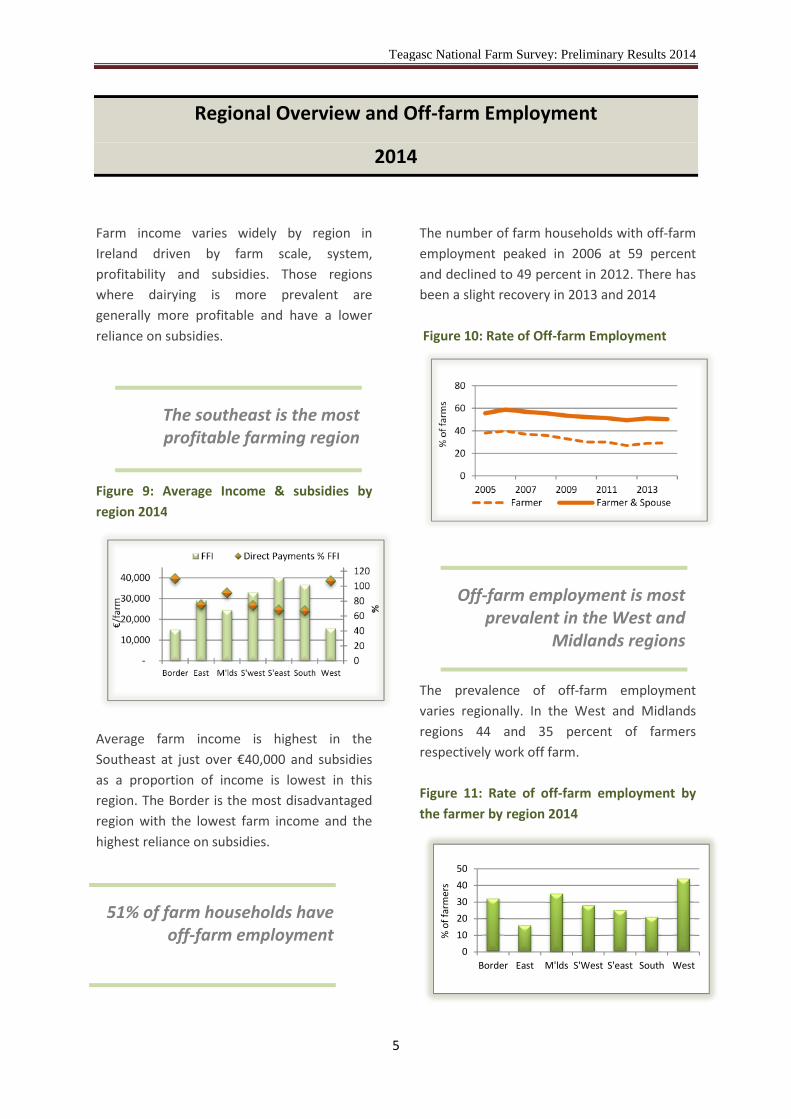
Farm income varies widely by region in
Ireland driven by farm scale, system,
profitability and subsidies. Those regions
where dairying is more prevalent are
generally more profitable and have a lower
reliance on subsidies.
Figure 9: Average Income & subsidies by
region 2014
Average farm income is highest in the
Southeast at just over €40,000 and subsidies
as a proportion of income is lowest in this
region. The Border is the most disadvantaged
region with the lowest farm income and the
highest reliance on subsidies.
The number of farm households with off-farm
employment peaked in 2006 at 59 percent
and declined to 49 percent in 2012. There has
been a slight recovery in 2013 and 2014
Figure 10: Rate of Off-farm Employment
The prevalence of off-farm employment
varies regionally. In the West and Midlands
regions 44 and 35 percent of farmers
respectively work off farm.
Figure 11: Rate of off-farm employment by
the farmer by region 2014
0
20
40
60
80
100
120
-
10,000
20,000
30,000
40,000
Border East M'lds S'west S'east South West
%
€/f
arm
FFI Direct Payments % FFI
0
20
40
60
80
2005 2007 2009 2011 2013
%o
ffa
rms
Farmer Farmer & Spouse
0
10
20
30
40
50
Border East M'lds S'West S'east South West
%o
ffa
rmer
s
51% of farm households haveoff-farm employment
Off-farm employment is mostprevalent in the West and
Midlands regions
The southeast is the mostprofitable farming region

Teagasc National Farm Survey: Preliminary Results 2014
6
Dairy Farm System
2014
There were approximately 15,654 specialist
dairy farms with an average FFI of €68,877 in
2014, a 9 percent increase on 2013.
Table 4: Components of average dairy
income 2014
2014 Change
from
2013
€ %
Gross Output 190,738 -1
(of which subsidies) 20,489 -3
Total Costs 121,861 -7
(of which direct costs) 72,077 -10
( of which overheads) 49,785 -2
Family Farm Income 68,877 +9
The 9 percent increase in the average dairy
farm income was mostly driven by reduced
expenditure. The animal feed bill declined
substantially on dairy farms, with expenditure
on purchased concentrate feeds down 25
percent and bulky feeds down 20 percent.
Milk production per farm increased by 5
percent in 2014, supported by higher yields
and a 3 percent increase in the average dairy
herd size. Despite a 3 percent reduction in the
milk price, the dairy enterprise gross output
fell by just 1 percent in 2014. It is important to
note that the 2014 income figures do not
reflect the superlevy bill due to be paid by
dairy farmers for the 2014/2015 quota year.
Table 5: Average Dairy Enterprise Indicators
2014
2014 Change
from
2013
%
Production (litres/ha) 10,641 +3
Milk Price (€/litre) 38.4 -3
Gross output (€/ha) 4,067 -1
Direct Costs(€/ha) 1,519 -9
Gross Margin ( €/ha) 2,549 +5
Dairy enterprise gross margin per hectare
increased by 5 percent in 2014, driven by
increased production and lower costs.
Figure 12 presents the distribution of income
on dairy farms. Income increased significantly
from 2012 to 2014. The proportion of farms
earning over €100,000 continues to increase.
Figure 12: Distribution of Dairy Income 2012to 2014
-
10
20
30
40
<30,000 30-50,000 50-70,000 70-100,000 >100,000
%o
ffa
rms
2012 2013 2014
Dairy farm incomes increasedby 9% on average in 2014
Milk price down 3% but milkproduction up 5% in 2014

Teagasc National Farm Survey: Preliminary Results 2014
7
Cattle Rearing Farm System
2014
There were approximately 15,707 cattle
rearing farms with an average FFI of €10,271
in 2014. Suckler cow production is the
dominant enterprise on these farms.
Table 6: Components of average cattlerearing farm income 2014
2014 Change
from
2013
€ %
Gross Output 40,310 +2
(of which subsidies) 15,469 -2
Total Costs 30,039 -1
(of which direct costs) 14,199 -5
( of which overheads) 15,839 +4
Family Farm Income 10,271 +8
Total farm gross output increased by 2
percent, despite a 2 percent decline in
subsidies. Market based gross output
increased by almost 7 percent. Although
finished cattle prices fell in 2014, the average
price of weanlings, the principal output of
cattle rearing farms, increased by 5 percent.
As with the other livestock farms, cattle
rearing farms benefitted from the recovery
following the fodder crisis. Expenditure on
concentrate and bulky feed fell by 18 and 34
percent respectively.
Table 7: Farm Indicators 2014
2014
Farm Size (hectares) 39
Livestock Units 27
Livestock units per hectare 1.06
Single Farm Payment(€/ha) 244
Gross Margin (€/ha) 669
The average gross margin per hectare on
cattle rearing farms was €669 in 2014. This
included a Single Farm Payment of €244 per
hectare.
Figure 13 presents the distribution of income
on cattle rearing farms. The proportion of
farms earning over €20,000 increased from
2013 to 2014 but so too did the proportion
earning less than €5,000.
Figure 13: Distribution of Cattle RearingIncome 2012 to 2014
-
10
20
30
40
<5,000 5-10,000 10-20,000 20-50,000 >50,000
%o
ffa
rms
2012 2013 2014
Weanling prices were up 5% in2014, while direct costs were
down 5%
Cattle rearing farm incomesincreased by 8% on average in
2014

Teagasc National Farm Survey: Preliminary Results 2014
8
Cattle Other Farm System
2014
There were approximately 25,674 cattle other
farms, with an average FFI of €13,834 in 2014,
a 12 percent decrease on 2013. Cattle
fattening is the dominant enterprise on these
farms.
Table 8: Components of cattle other averagefarm income 2014
2014 Change
from
2013
€ %
Gross Output 51,054 -9
(of which subsidies) 18,349 -2
Total Costs 37,220 -8
(of which direct costs) 18,963 -15
( of which overheads) 18,257 0
Family Farm Income 13,834 -12
Total farm gross output decreased by 9
percent on cattle other farms. These farms
are mainly specialised in finishing animals for
slaughter and the average annual finished
cattle price was down 11 percent in 2014,
leaving overall cattle enterprise gross output
down 11 percent on average.
Total direct costs declined by 15 percent.
Animal feed is a larger element of total
expenditure on cattle other farms relative to
other farm systems and as such these farms
benefitted disproportionately from the
recovery following the fodder crisis.
Table 9: Farm Indicators 2014
2014
Farm Size (hectares) 40
Number of cows 53
Livestock units per hectare 1.03
Single Farm Payment(€/ha) 335
Gross Margin (€/ha) 802
The average gross margin per hectare on
cattle other farms was €802 in 2014. This
included a Single Farm Payment of €335.
Figure 14 presents the distribution of income
on cattle other farms. The movement of farms
from the higher income to the lower income
categories from 2013 to 2014 is evident.
Figure 14: Distribution of Cattle OtherIncome 2012 to 2014
-
10
20
30
40
<5,000 5-10,000 10-20,000 20-50,000 >50,000
%o
ffa
rms
2012 2013 2014
The average annual finishedcattle price fell by 11 percent in
2014
Average income on cattleother farms decreased by 12%
in 2014
Teagasc National Farm Survey: Preliminary Results 2014
9
Sheep Farm System
2014
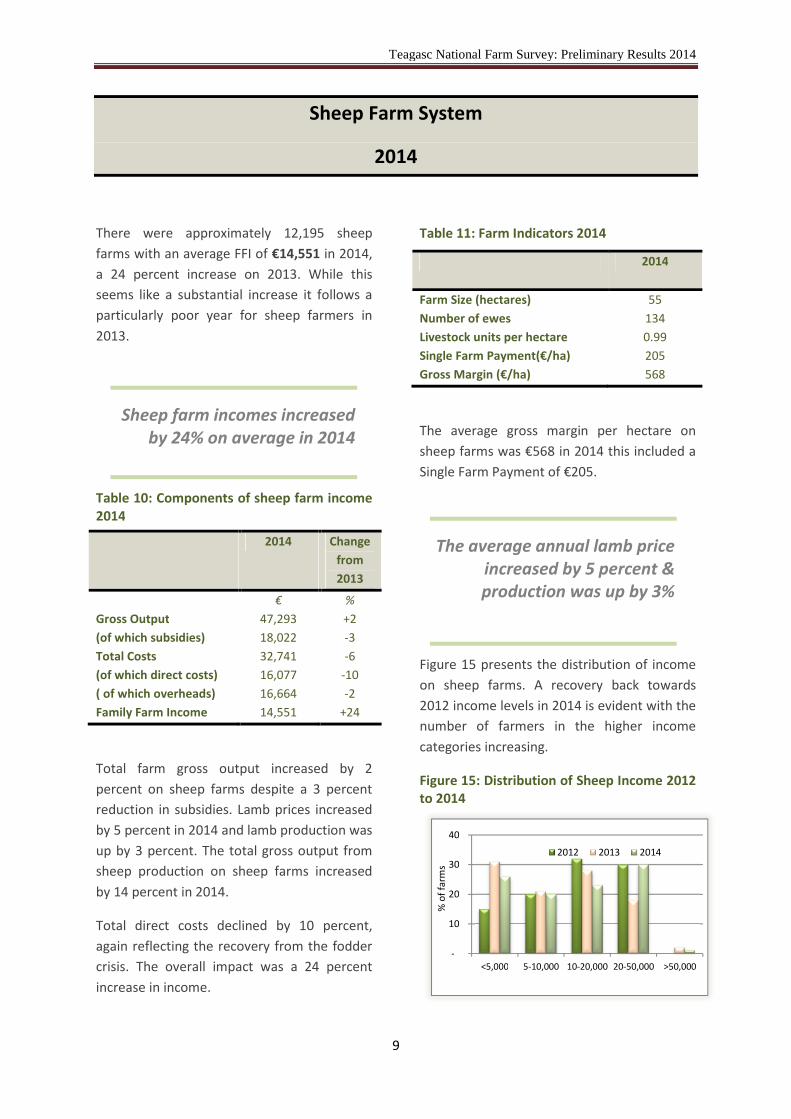
There were approximately 12,195 sheep
farms with an average FFI of €14,551 in 2014,
a 24 percent increase on 2013. While this
seems like a substantial increase it follows a
particularly poor year for sheep farmers in
2013.
Table 10: Components of sheep farm income2014
2014 Change
from
2013
€ %
Gross Output 47,293 +2
(of which subsidies) 18,022 -3
Total Costs 32,741 -6
(of which direct costs) 16,077 -10
( of which overheads) 16,664 -2
Family Farm Income 14,551 +24
Total farm gross output increased by 2
percent on sheep farms despite a 3 percent
reduction in subsidies. Lamb prices increased
by 5 percent in 2014 and lamb production was
up by 3 percent. The total gross output from
sheep production on sheep farms increased
by 14 percent in 2014.
Total direct costs declined by 10 percent,
again reflecting the recovery from the fodder
crisis. The overall impact was a 24 percent
increase in income.
Table 11: Farm Indicators 2014
2014
Farm Size (hectares) 55
Number of ewes 134
Livestock units per hectare 0.99
Single Farm Payment(€/ha) 205
Gross Margin (€/ha) 568
The average gross margin per hectare on
sheep farms was €568 in 2014 this included a
Single Farm Payment of €205.
Figure 15 presents the distribution of income
on sheep farms. A recovery back towards
2012 income levels in 2014 is evident with the
number of farmers in the higher income
categories increasing.
Figure 15: Distribution of Sheep Income 2012to 2014
-
10
20
30
40
<5,000 5-10,000 10-20,000 20-50,000 >50,000
%o
ffa
rms
2012 2013 2014
The average annual lamb priceincreased by 5 percent &production was up by 3%
Sheep farm incomes increasedby 24% on average in 2014
Teagasc National Farm Survey: Preliminary Results 2014
10
Tillage Farm System
2014
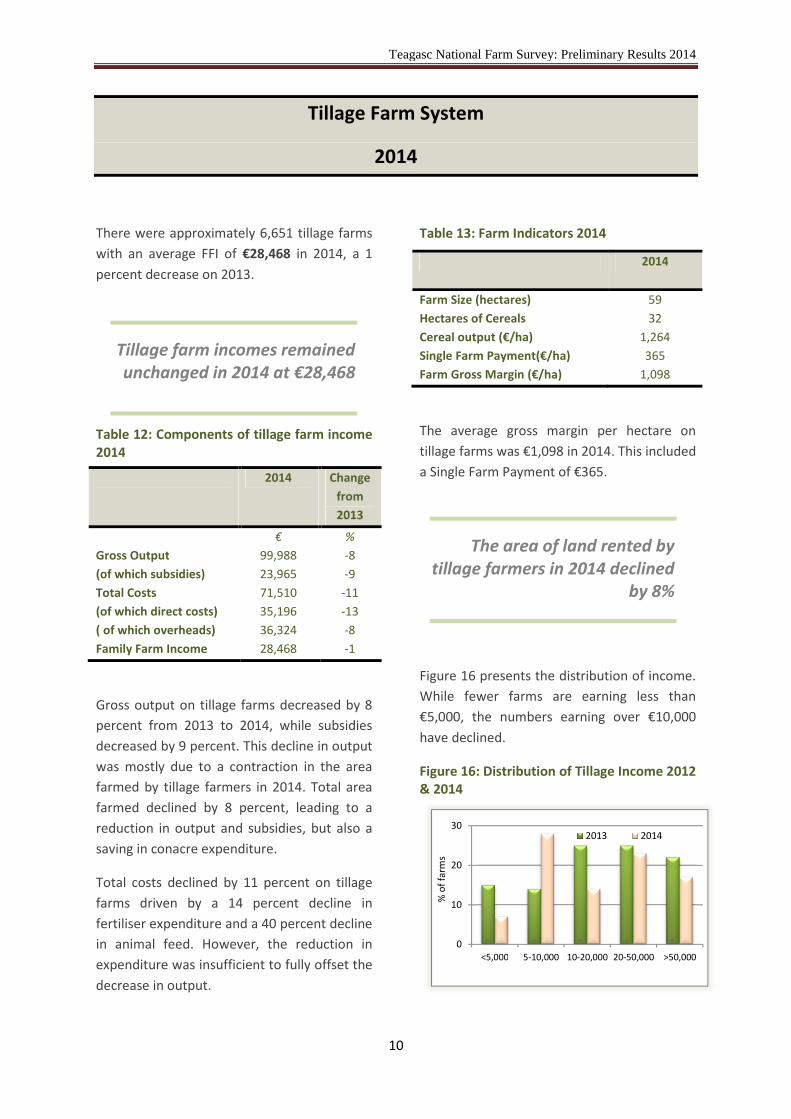
There were approximately 6,651 tillage farms
with an average FFI of €28,468 in 2014, a 1
percent decrease on 2013.
Table 12: Components of tillage farm income2014
2014 Change
from
2013
€ %
Gross Output 99,988 -8
(of which subsidies) 23,965 -9
Total Costs 71,510 -11
(of which direct costs) 35,196 -13
( of which overheads) 36,324 -8
Family Farm Income 28,468 -1
Gross output on tillage farms decreased by 8
percent from 2013 to 2014, while subsidies
decreased by 9 percent. This decline in output
was mostly due to a contraction in the area
farmed by tillage farmers in 2014. Total area
farmed declined by 8 percent, leading to a
reduction in output and subsidies, but also a
saving in conacre expenditure.
Total costs declined by 11 percent on tillage
farms driven by a 14 percent decline in
fertiliser expenditure and a 40 percent decline
in animal feed. However, the reduction in
expenditure was insufficient to fully offset the
decrease in output.
Table 13: Farm Indicators 2014
2014
Farm Size (hectares) 59
Hectares of Cereals 32
Cereal output (€/ha) 1,264
Single Farm Payment(€/ha) 365
Farm Gross Margin (€/ha) 1,098
The average gross margin per hectare on
tillage farms was €1,098 in 2014. This included
a Single Farm Payment of €365.
Figure 16 presents the distribution of income.
While fewer farms are earning less than
€5,000, the numbers earning over €10,000
have declined.
Figure 16: Distribution of Tillage Income 2012& 2014
0
10
20
30
<5,000 5-10,000 10-20,000 20-50,000 >50,000
%o
ffa
rms
2013 2014
The area of land rented bytillage farmers in 2014 declined
by 8%
Tillage farm incomes remainedunchanged in 2014 at €28,468

Teagasc National Farm Survey: Preliminary Results 2014
11
Mixed Livestock Farm System
2014
There were approximately 2,760 mixed
livestock farms with an average FFI of €57,895
in 2014, a 14 percent increase on 2013. While
most mixed livestock farms have a dairy
enterprise, they are not specialised in dairy
production and typically also have a
substantial cattle enterprise.
Table 14: Components of Mixed Livestockfarm income 2014
2014 Change
from
2013
€ %
Gross Output 163,475 -2
(of which subsidies) 25,040 -7
Total Costs 105,580 -9
(of which direct costs) 60,651 -15
( of which overheads) 44,929 +2
Family Farm Income 57,895 +14
Similar to the other farm systems, gross
output and subsidies decreased in value on
mixed livestock farms. Input expenditure
declined, with direct costs in particular
decreasing by 15 percent. Mixed farms
typically have large animal feed bills,
purchased concentrate feed can comprise up
to 25 percent of input costs on these farms. In
2014 expenditure on purchased concentrates
declined by 30 percent.
Table 15: Farm Indicators 2014
2014
Farm Size (hectares) 64
Number of Cows 45
Total Livestock Units 109Livestock units per hectare 1.7
Single Farm Payment(€/ha) 313
Gross Margin (€/ha) 1,606
Mixed livestock farms are intensively stocked
at 1.7 livestock units per hectare. They also
have the largest average land area of all of the
farm systems.
Figure 17 presents the distribution of income.
The numbers earning over €50,000 have
increased considerably in 2014.
Figure 17: Distribution of Mixed LivestockIncome 2012 & 2014
0
10
20
30
<10,000 10-20,000 20-50,000 50-70,000 >70,000
%o
ffa
rms
2013 2014
Mixed farms have a lowspecialisation in dairy
production with an averageherd size of 45 cows
Income on mixed livestockfarms increased by 14% in 2014

Teagasc National Farm Survey: Preliminary Results 2014
12
Background Notes
The National Farm Survey (NFS) has been conducted by Teagasc on an annual basis since 1972. The
survey is operated as part of the Farm Accountancy Data Network of the EU and fulfils Ireland’s
statutory obligation to provide data on farm output, costs and income to the European Commission.
A random, nationally representative sample is selected annually in conjunction with the Central
Statistics Office (CSO). Each farm is assigned a weighting factor so that the results of the survey are
representative of the national population of farms. These preliminary estimates are based on a sub
sample of 798 farms which represents 78,641 farms nationally.
Farms are assigned to six farm systems on the basis of farm gross output, as calculated on a standard
output basis. Standard output measures are applied to each animal and crop output on the farm and
only farms with a standard output of €8,000 or more, the equivalent of 6 dairy cows, 6 hectares of
wheat or 14 suckler cows, are included in the sample. Farms are then classified as one of the six
farm systems on the basis of the main outputs of the farm. Farms falling into the Pigs and Poultry
System are not included in the survey, due to the inability to obtain a representative sample of these
systems.
Table A: Estimated 2014 Farm Population Distribution
Size (ha) <10 10-20 20-30 30-50 50-100 >100 Total
% of farms
Dairy 0.07 0.96 2.34 6.9 8.09 1.43 19.79
Cattle Rearing 0.69 3.01 7.28 8.4 3.05 0.16 22.58
Cattle Other - 4.68 6.51 10.57 6.66 1.32 29.74
Sheep 0.58 2.62 3.34 4.88 3.41 1.17 16
Tillage - 0.96 1.31 2.33 2.49 1.3 8.41
Mixed Livestock - 0.12 0.32 1.06 1.52 0.46 3.49
All 1.34 12.35 21.11 34.15 25.21 5.84 100
Source: Central Statistics Office