team unicamp - cfa society...
TRANSCRIPT

Team Unicamp
André de Teive ArgolloLara Siqueira OliveiraFelipe Husein
Luiz Henrique Mori SartorMurilo Viana

Target Price: BRL 49.35
Current Price: BRL 35.11
Source: Bloomberg and Team’s Estimates
Recommendation
BUY
Upside: 40.5%
Recommendation
(i) expected Brazilian economy recovery(ii) consolidation of car rental segment (iii) strong competitive advantages
Company OverviewIndustry &
CompetitorsFinancial Analysis Valuation Risk Analysis Conclusion
15
20
25
30
35
40
45
50
jan-16 fev-16 mar-16 abr-16 mai-16 jun-16 jul-16 ago-16 set-16 out-16 nov-16
RENT3

CompanyOverview

1973: Established in Belo Horizonte by Mattar and
Resende families 2005: IPO (USD 295 mn)
1999: Fleet Management
segment
80’s and 90’s: Franchising and Car Sales segments
1981: leadership RAC segment
2016: 8 countries, 552 agencies, 117k cars. Leader in the market
1981: Expansion Latin America
1997: PE DL&J acquires 33% of shares for USD 50 mn
Company Overwiew
Company OverviewIndustry &
CompetitorsFinancial Analysis Valuation Risk Analysis Conclusion
Main Shareholder’s
Mattar Family (%) 12.9
Resende Family (%) 15.9
Free Float (%) 72.2
Localiza Rent a Car S.A.
Controlling/Management Shares (%) 27.9
Treasury shares (%) 1.7
Free Float (%) 70.4

Company OverviewIndustry &
CompetitorsFinancial Analysis Valuation Risk Analysis Conclusion
Source: Company`s Data (2016)
Integrated Business Platform Footprint
Business Description

Consolidation Strategy
Core Business
70% of Total Fleet
EBITDA generation
Support Division
Minimize Costs
Direct Sales Channel
Lowest Depreciation
Supplementary Division
Penetration
Brand Recognition
Broaden Horizons
Outsource Management
Purchase on Demand
High Utilization Rates
Taylor-Made Contracts
Car Sales 52%Car Rental
(RAC) 33.5%
Fleet Rental 15.8%
Franchising 0.45%
Company OverviewIndustry &
CompetitorsFinancial Analysis Valuation Risk Analysis Conclusion
Source: Company`s Data (2016)
Business Description: Revenue Breakdown per Segment (2015)

Industry and
Competitors

Industry Overview
Company OverviewIndustry &
CompetitorsFinancial Analysis Valuation Risk Analysis Conclusion
0%
10%
20%
30%
40%
50%
60%
70%
Fleet Prenetation
Source: ABLA
0
100
200
300
400
500
600
700
800
900
0%
10%
20%
30%
40%
50%
60%
2000 2002 2004 2006 2008 2010 2012 2014
Daily fee/Minimum Wage Minimum Wage
Daily Fee/Minimum Wage vs. Minimum Wage

Market Share U.S.
Company OverviewIndustry &
CompetitorsFinancial Analysis Valuation Risk Analysis Conclusion
Source: BCB, Team’s Estimates, Company’s Estimates
51%
23%
20%
5%
Enterprise Holdings Hertz Avis Others
National Market Share Distribution (Revenue)
13%
3%
4%
5%
75%
Localiza Locamerica Unidas JSL - Movida Others
U.S Market Share Distribution (Revenue)

3 Main Segments: RAC, Fleet and Car Sales
Company OverviewIndustry &
CompetitorsFinancial Analysis Valuation Risk Analysis Conclusion
Source: Company’s Data (2016)
7.5% 4.3%3.4%
5%
6.5%
73.3%
Localiza UnidasMovida Ouro VerdeLocamerica Others
Market Share Fleet (Fleet Size)Market Share RAC (Fleet Size)
22.40%
6%
9.9%
61.70%
Localiza Unidas Movida Outros
Less Pulverized
Capital Intensive
Entry Barriers
Business
Leisure
More Fragmented
Lower Entry Barriers
Corporations

3 Main Segments: RAC, Fleet and Car Sales
Company OverviewIndustry &
CompetitorsFinancial Analysis Valuation Risk Analysis Conclusion
8.48.9 9 9.4
10.1 9.9
3.3 3.5 3.6 3.6 3.32.5
0
3
6
9
12
2010 2011 2012 2013 2014 2015
used cars new cars
2.5x 2.5x 2.5x 2.6x 3.1x 4x
Brazilian Market of New Cars vs Used Cars (Millions)
Source: Company’s Data (2016)
7.5%4.3% 3.4%
5%
6.5%
73.3%
Localiza Unidas
Movida Ouro Verde
Locamerica Others
Market Share Fleet (Fleet Size)Market Share RAC (Fleet Size)
22.4%
6%
9.9%
61.7%
Localiza Unidas Movida Outros

Investment Thesis
Company OverviewIndustry &
CompetitorsFinancial Analysis Valuation Risk Analysis Conclusion
0
1
2
3
4
5
Threat ofSubstituteProducts
Bargain Powerof Suppliers
Threat of NewEntrants
Bargain Powerof Customers
CompetitiveRivalry within
Industry
Localiza Average Competitors
Porter’s Five Forces
Source: BCB, Team’s Estimates
0%
5%
10%
15%
20%
25%
30%
Localiza Unidas
Locamerica Ouro Verde
JSL consolidada
ROIC- Localiza X Competitors (2016) ROE – Localiza X Competitors (2016)
17%
9.3%10.5%
6.5%
8.4%
0%
5%
10%
15%
1
Localiza Unidas
Locamerica Ouro Verde
JSL Consolidada

Fund-raising
Car Purchase
Car Rental
Car Sales
1
2
3
4
Competitive Advantages in Each Business Level
Company OverviewIndustry &
CompetitorsFinancial Analysis Valuation Risk Analysis Conclusion

Fund-raising Advantages
Company OverviewIndustry &
CompetitorsFinancial Analysis Valuation Risk Analysis Conclusion
Fund-raising
25%-30% discounts in each car price
Higher
Localiza
1
Bonds - Debt profile (Face value) – Million BRL
Source: Companys Data
brAA+ S&P BB S&P A- (bra) Fitch AA- (bra) Fitch A(bra) Fitch
Aa1.br Moody's AA- (bra) Fitch
AAA (bra) Fitch
Nat
ion
al S
cale
BB+ Fitch Baa1 Moody's B+ S&P Ba3 Moody's
Ba2 Moody's BB- S&P
BB+ S&P
Glo
bal
Sca
le
Ratings
99523
299619 770 672
1169
2016 2017 2018 2019 2020 2021
Debt profile
Cash
921
At 09/30/2016
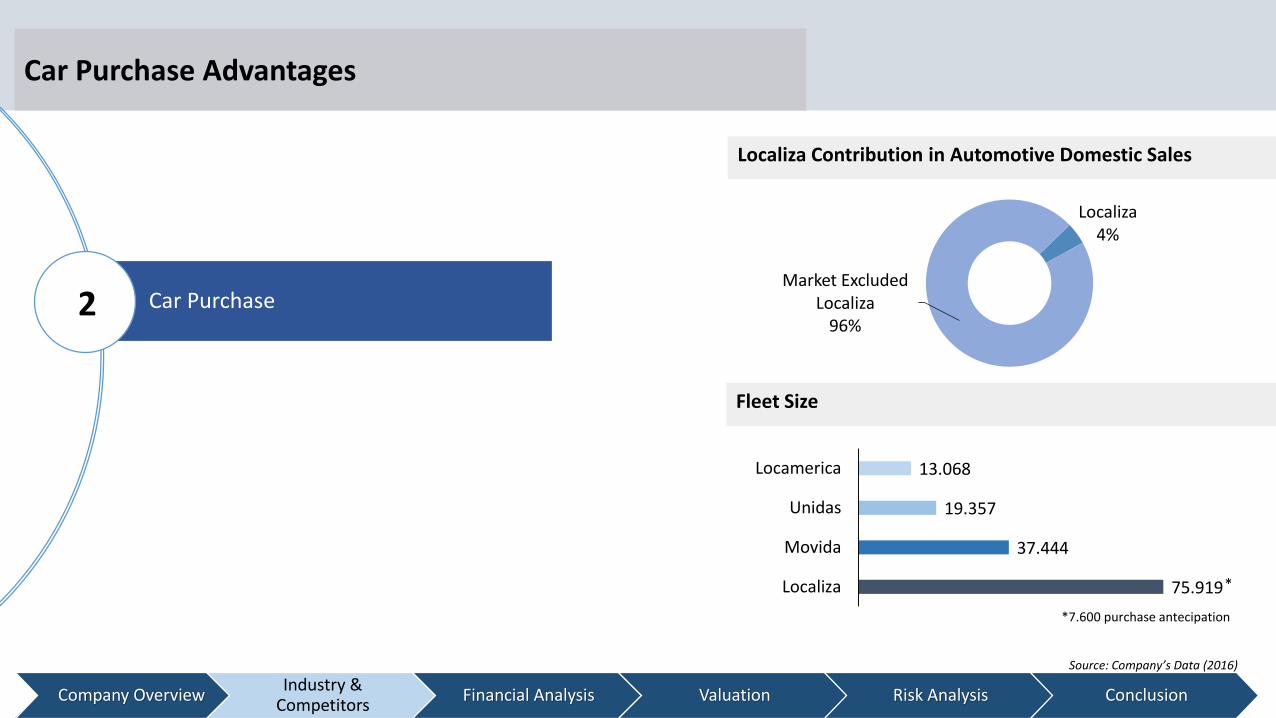
Car Purchase Advantages
Company OverviewIndustry &
CompetitorsFinancial Analysis Valuation Risk Analysis Conclusion
Car Purchase
rates
2
Localiza4%
Market Excluded Localiza
96%
75.919
37.444
19.357
13.068
Localiza
Movida
Unidas
Locamerica
Localiza Contribution in Automotive Domestic Sales
Fleet Size
Source: Company’s Data (2016)
*
*7.600 purchase antecipation

Car Rental3
Competition Advantages
Company OverviewIndustry &
CompetitorsFinancial Analysis Valuation Risk Analysis Conclusion
1Movida Unidas Hertz Localiza
494
100
163
204
10650
4644
2420
0 20 40 60 80 100 120
1
Avis Outros HertzUnidas Movida Localiza
388136
7464
26
0 100 200 300 400 500
Avis Hertz Movida
Unidas Localiza
Airport Agencies Off-Airport Agencies
Source: Company’s Data (2016)
49451.342
6.7
Others
Localiza
Hertz
Number of branchesMarket Share by Revenue
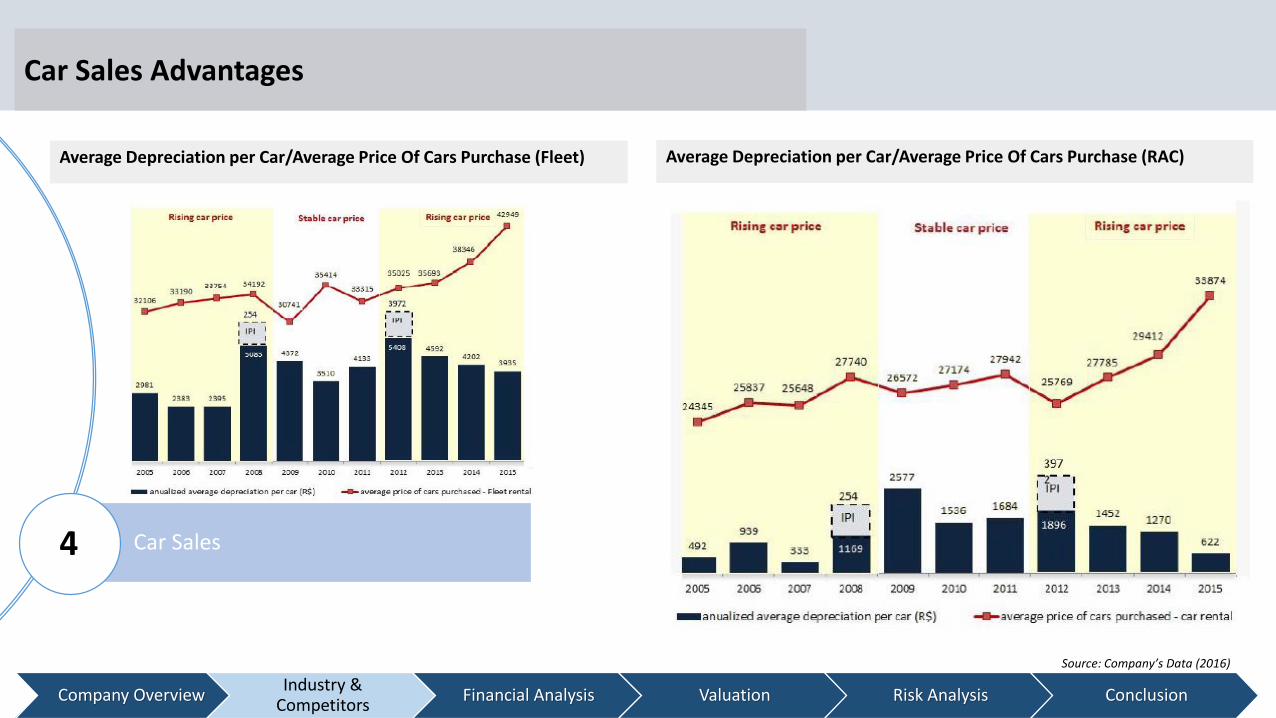
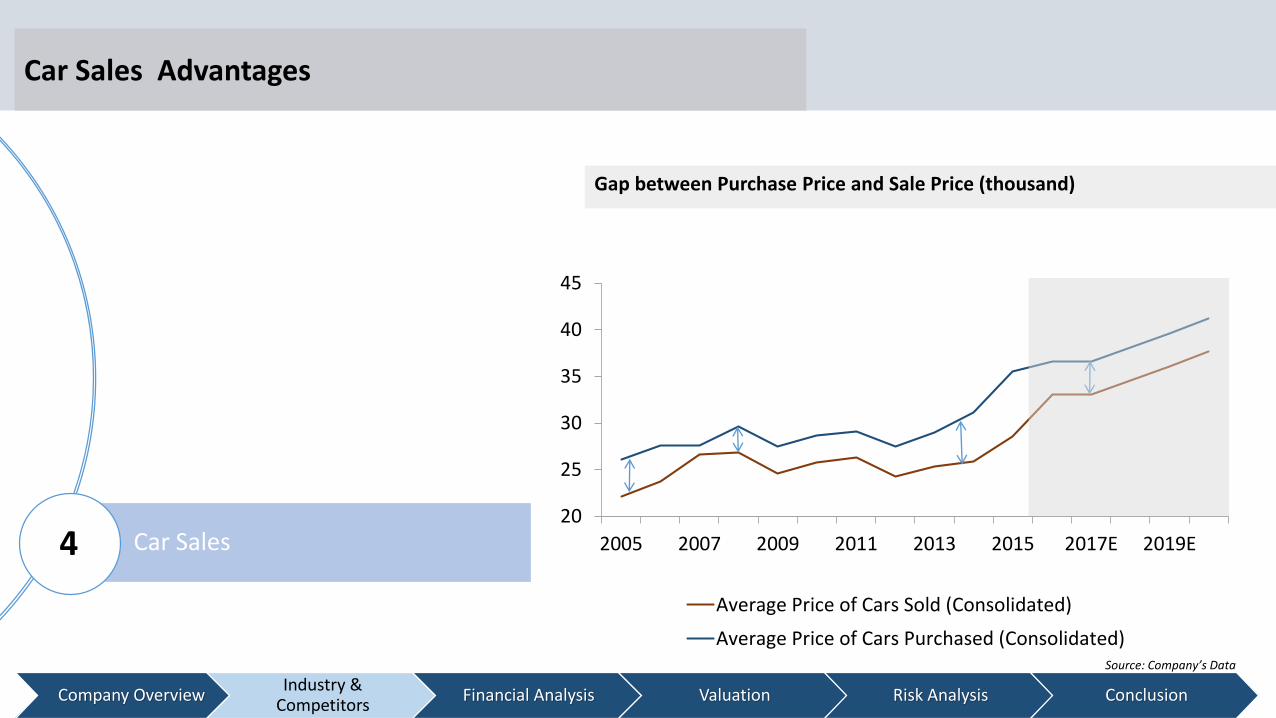
Car Sales Advantages
Company OverviewIndustry &
CompetitorsFinancial Analysis Valuation Risk Analysis Conclusion
494
100
163
204
204
163
100
Car Sales 4
Average Depreciation per Car/Average Price Of Cars Purchase (RAC)
Source: Company’s Data (2016)
Average Depreciation per Car/Average Price Of Cars Purchase (Fleet)
Car Sales
Car Sales Advantages
Company OverviewIndustry &
CompetitorsFinancial Analysis Valuation Risk Analysis Conclusion
163
204
163
100
4
Source: Company’s Data
Gap between Purchase Price and Sale Price (thousand)
20
25
30
35
40
45
2005 2007 2009 2011 2013 2015 2017E 2019E
Average Price of Cars Sold (Consolidated)
Average Price of Cars Purchased (Consolidated)

Competitors’ Recent Moves
Company OverviewIndustry &
CompetitorsFinancial Analysis Valuation Risk Analysis Conclusion
494
100
163
204
204
163
100
4% 6%
25% 27%
40%
48% 48%
0%
10%
20%
30%
40%
50%
60%
0
5
10
15
20
25
30
35
40
2012 2013 2014 1Q15 2Q15 3Q15 4Q15
Tho
usa
nd
s
Movida's fleet size
Movida as % of Localiza in RAC
Movida Fleet Growth In RAC segment as % of Localiza’s Fleet (thousands)
Source: Localiza, Movida and Teams’s Estimates
65.170.7
77.671.3 71.5 71.1
76.8
2.6 4.6
19.2 19.628.4
34.3 37.1
10.6 1419.7 18.7 18.2 18.3 19.3
2012 2013 2014 1H15 2H15 3H15 4H15
Localiza Movida Unidas
Largest Players in RAC Segment ( Fleet size in thousands)

Competition Structure
Company OverviewIndustry &
CompetitorsFinancial Analysis Valuation Risk Analysis Conclusion
494
100
163
204
204
163
100
Source: Company’s Data (2016)
FLEET SEGMENT NICHE RENT A CAR

Financial
Analysis

Revenue Drivers
Company OverviewIndustry &
CompetitorsFinancial Analysis Valuation Risk Analysis Conclusion
494
100
163
204
204
163
100
-5%
0%
5%
10%
15%
20%
2011 2013 2015 2017 2019 2021
Brazilian GDP Net Revenue
GDP x Net Revenue Volume vs. Tariff
40
50
60
70
80
90
100
0
5
10
15
20
25
30
2005 2008 2011 2014 2017E 2020E
Mill
ion
s
RAC Rentals Fleet RentalsRAC - Daily Rental Fleet - Daily Rental
Source: Company’s Data (2016), Team’s Estimates amd BCB

5%
10%
15%
20%
25%
30%
35%
40%
2010 2012 2014 2016E 2018E
Gross profit Margin EBIT MarginNet profit Margin
Margin (Gross Profit, EBIT, Net Profit)EBITDA Historical Breakdown
Margins
Company OverviewIndustry &
CompetitorsFinancial Analysis Valuation Risk Analysis Conclusion
Source: Company’s Data, Bloomberg and Team’s Estimates
37.9%
20.07%
10.76%
45% 47%41%
37% 39%32% 32% 33%
68% 69% 66% 66%60% 62% 61% 65%
3% 3% 4% 6% 6% 7% 8% 6%0%
10%
20%
30%
40%
50%
60%
70%
80%
2010 2011 2012 2013 2014 2015 1H15 1H16
Rent a Car Fleet Rental Car Sales

EBTIDA Evolution
Company OverviewIndustry &
CompetitorsFinancial Analysis Valuation Risk Analysis Conclusion
494
100
163
204
204
163
100
3 34
5 56
8 9 9 10 910
1213
0
2
4
6
8
10
12
14
2005 2006 2007 2008 2009 2010 2011 2012 2013 2014 2015 2016E 2017E 2018E
Hu
nd
red
s o
f M
illio
ns
EBITDA
18%
1%
12%
11%
EBTIDA
Source: Company’s Data (2016) and Team’s Estimates

Profitability
Company OverviewIndustry &
CompetitorsFinancial Analysis Valuation Risk Analysis Conclusion
494
100
163
204
204
163
100
0%
2%
4%
6%
8%
10%
12%
14%
16%
18%
20%
2010 2011 2012 2013 2014 2015 2016 2017 2018 2019 2020
ROIC Kd
6.7%3.8%
491
488
168
0
100
200
300
400
500
2010 2012 2014 Actual 2018E
Localiza Median National Peers Median Global Peers
ROIC vs. Kd Net Income (million)
Source: Company’s Data and Team’s Estimates

Leverage
Company OverviewIndustry &
CompetitorsFinancial Analysis Valuation Risk Analysis Conclusion
100
163
204
204
163
100
JSL 4.3x
Ouro verde 3.8x
Locamerica 2.9x
Unidas 2.5x
Localiza 1.7x
Ouro Verde 9.7x
JSL 4.6x
Locamerica 2.0x
Unidas 1.1x
Localiza0.8x
Net Debt/EBITDA
Source: Company’s Data (2016) and Bloomberg
Net Debt/Equity

Valuation

EBITDA
Net Used Car Sales Revenue
Depreciation
Income Tax
Working capital
CFO
Capex -Renewals
CFO net of Capex
RenewalsCapex -Fleet
Expansion Capex - HQ
FCF Before Interest
-2050 -1050 -50 950 1950
Industry OverviewIndustry &
CompetitorsFinancial Analysis Valuation Risk Analysis Conclusion
CAPEX
CAPEX Ratios (million) Free Cash Flow Breakdown (2015)
Source: Company’s Data and Team’s Estimates
91%
54%
33% 33%
64%
74%
97%
40%
21%16%
13%
21% 22%
32%
0%
10%
20%
30%
40%
50%
60%
70%
80%
90%
100%
0
50
100
150
200
250
300
350
400
450
500
2010 2011 2012 2013 2014 2015 9M16
Net CAPEX for fleet renewal CAPEX Fleet Expansion
CAPEX (total) / CFO CAPEX (total)/D&A

Depreciation
Company OverviewIndustry &
CompetitorsFinancial Analysis Valuation Risk Analysis Conclusion
494
100
163
204
204
163
100
Depreciation = Purchase Price – Transaction Costs – Residual Value
Source: Company’s Data and Team’s Estimates
millions
0%
2%
4%
6%
8%
10%
12%
14%
16%
18%
0
50
100
150
200
250
300
350
400
450
2005 2006 2007 2008 2009 2010 2011 2012 2013 2014 2015 2016E 2017E 2018E 2019E 2020E
Depreciation Depreciation / Tangible Assets (Cars)
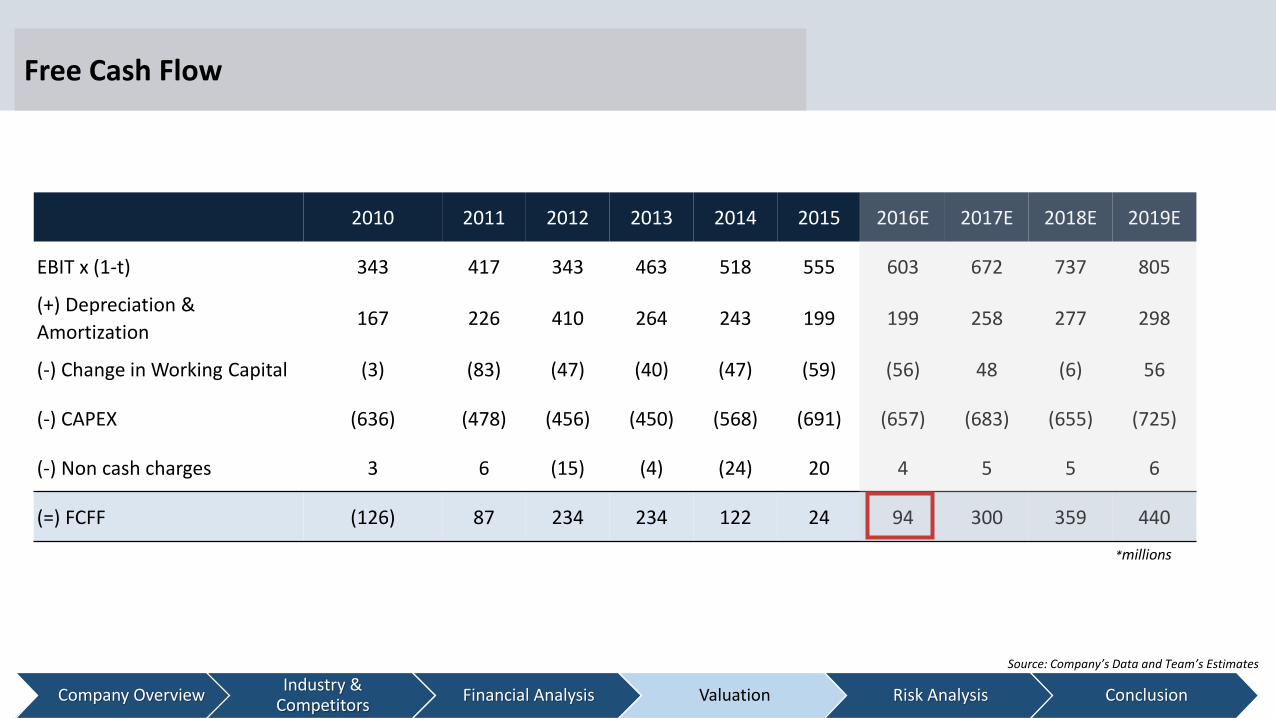
Free Cash Flow
Company OverviewIndustry &
CompetitorsFinancial Analysis Valuation Risk Analysis Conclusion
494
100
163
204
204
163
100 2010 2011 2012 2013 2014 2015 2016E 2017E 2018E 2019E
EBIT x (1-t) 343 417 343 463 518 555 603 672 737 805
(+) Depreciation &
Amortization167 226 410 264 243 199 199 258 277 298
(-) Change in Working Capital (3) (83) (47) (40) (47) (59) (56) 48 (6) 56
(-) CAPEX (636) (478) (456) (450) (568) (691) (657) (683) (655) (725)
(-) Non cash charges 3 6 (15) (4) (24) 20 4 5 5 6
(=) FCFF (126) 87 234 234 122 24 94 300 359 440
Source: Company’s Data and Team’s Estimates
*millions

Weighed Avarege Cost Of Capital
Company OverviewIndustry &
CompetitorsFinancial Analysis Valuation Risk Analysis Conclusion
494
100
163
204
204
163
100
WACC Assumption
WACC Assumptions (%)
Risk Free Rate 1.8%
Target D/E Ratio 60%
Beta 1.16
Equity Risk Premium 5.52%
Brazil Country Risk Premium 3.94%
Inflation Diferential 3.17%
Cost of Equity 15.33%
Cost of Debt 12.3%
Final WACC 11.83%
WACC
11.0% 11.5% 12% 12.5% 13%
Perp
etu
ity
gro
wth 5% 48.20 44.28 40.91 37.98 35.42
5.5% 53.03 48.38 44.44 41.06 38.12
6% 58.82 53.23 48.56 44.61 41.21
6.5% 65.90 59.05 53.43 48.74 44.77
7% 74.74 66.15 59.27 53.63 48.92
Sensitivity Analysis (WACC)
Source: Company’s Data and Team’s Estimates
Terminal Growth of 6%
Inflation 4.5%
Real GDP Growth 1.5%
Relative Valuation
Company OverviewIndustry &
CompetitorsFinancial Analysis Valuation Risk Analysis Conclusion
494
100
163
204
204
163
100
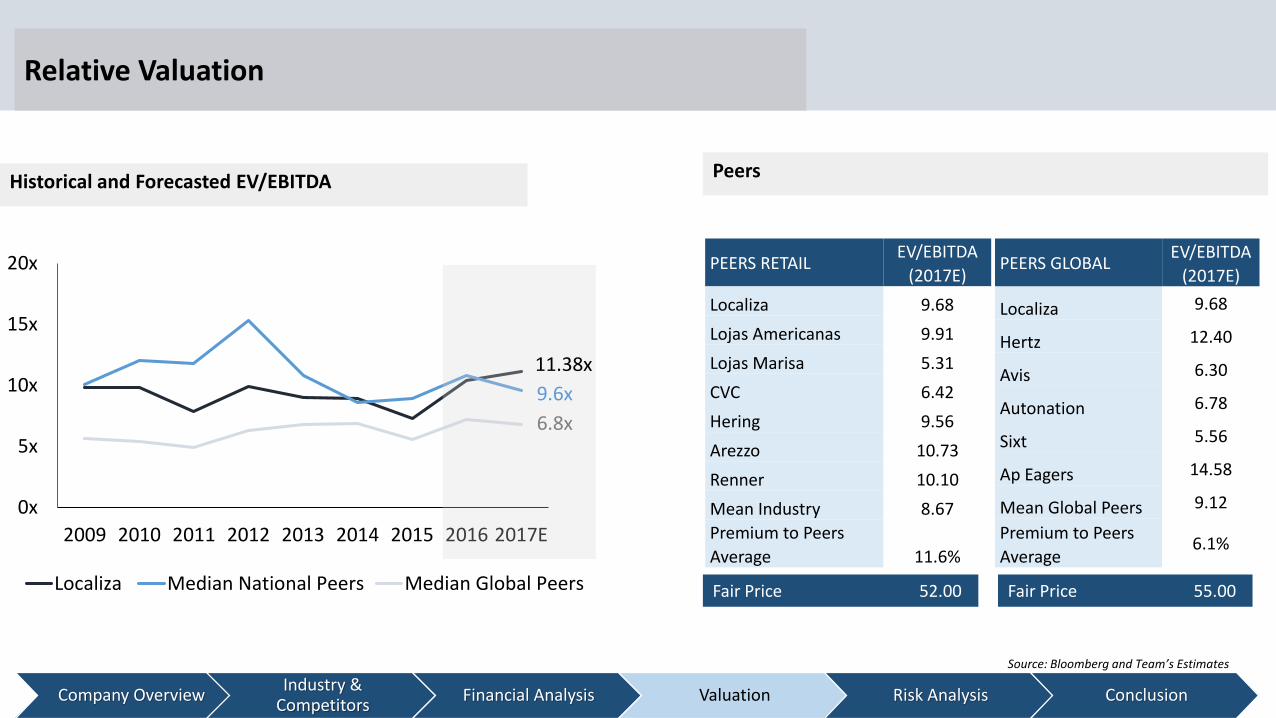
Historical and Forecasted EV/EBITDA
0x
5x
10x
15x
20x
2009 2010 2011 2012 2013 2014 2015 2016 2017E
Localiza Median National Peers Median Global Peers
Peers
11.38x
9.6x
6.8x
Source: Bloomberg and Team’s Estimates
Fair Price 52.00 Fair Price 55.00
PEERS RETAILEV/EBITDA
(2017E)
Localiza 9.68
Lojas Americanas 9.91
Lojas Marisa 5.31
CVC 6.42
Hering 9.56
Arezzo 10.73
Renner 10.10
Mean Industry 8.67
Premium to Peers
Average 11.6%
PEERS GLOBALEV/EBITDA
(2017E)
Localiza 9.68
Hertz 12.40
Avis 6.30
Autonation 6.78
Sixt 5.56
Ap Eagers 14.58
Mean Global Peers 9.12
Premium to Peers
Average6.1%

P/E
Company OverviewIndustry &
CompetitorsFinancial Analysis Valuation Risk Analysis Conclusion
Multiples Analysis
10
15
20
25
30
35
40
Localiza Mean +2 Standard Deviation -2 Standard Deviation
Price to Earnings and Price to Book Value
2
3
4
5
6
7
8
jan-10 mai-10 set-10 jan-11 mai-11 set-11 jan-12 mai-12 set-12 jan-13 mai-13 set-13 jan-14 mai-14 set-14 jan-15 mai-15 set-15 jan-16 mai-16 set-16
Localiza Mean +2 standard deviation -2 Standard deviationSource: Bloomberg
P/E
P/B

Risks
Analysis

Monte Carlo
Industry OverviewIndustry &
CompetitorsFinancial Analysis Valuation Risk Analysis Conclusion
494
100
163
204
204
163
100
Monte Carlo Simulation
0
200
400
600
800
1000
1200
30
32
34
36
38
40
42
44
46
48
50
52
54
56
58
60
62
64
66
68
70
Sell: 1.38% Hold: 21.44% Buy: 77.18%
Risk Variable Distribution
Decrease in
RevenuesGDP Real Growth (%) log-normal
Decrease in
RevenuesInfation Rate - IPCA (%) log-normal
Decrease in
MarginsInterest Rate SELIC (%) log-normal
RENT's price simulation46.92 Mean33.68 Minimum66.08 Maximum5.23 Std Dev
Source: Team’s Estimates

Risk Analysis
494
100
163
204
204
163
100
Risk Matrix
Industry OverviewIndustry &
CompetitorsFinancial Analysis Valuation Risk Analysis Conclusion
Source: Bloomberg and Team’s Estimates

New Generation, Disruptive Ideas, Innovative Companies
Company OverviewIndustry &
CompetitorsFinancial Analysis Valuation Risk Analysis Conclusion
494
100
163
204
204
163
100
Disruptive Ideas
3.33.12
1.72
4.58
3.27
2.162.281.73
0.891.180.94 0.49
2013 2014 2015
18-21 years 22-30 years 31-40 years 41 or more
11.34
9.05
5.26
2013 2014 2015
-53%
Age Range- In million
Issue of driver’s license – Brazil (million)
Source:Denatran/Citylab

Conclusion

BUYTarget Price:
BRL 49.35Upside: 40.5%Current Price:
BRL 35.11
Qualitative Positives Quantitative Positives
Optimal and sophisticated pricing models
Margins and Clear Earning Visibility
Anti-cyclical free cash flows
Low funding costs
Solid financials
Full exploitation of sectorial imperfections
Synergies among commercial units
Broad geographical coverage
Wrap Up
Company OverviewIndustry &
CompetitorsFinancial Analysis Valuation Risk Analysis Conclusion

BUYTarget Price:
BRL 49.35Upside: 20%
Current Price:BRL 38
Qualitative Positives Quantitative Positives
Optimal and sophisticated pricing models
Margins and Clear Earning Visibility
Anti-cyclical free cash flows
Low funding costs
Solid financials
Full exploitation of sectorial imperfections
Synergies among commercial units
Broad geographical coverage
Wrap Up
Company OverviewIndustry &
CompetitorsFinancial Analysis Valuation Risk Analysis Conclusion
Q&A

Appendix 1.1: Balance Sheet
494
100
163
204
204
163
100
100
In BR Millions 2012 2013 2014 2015 2016E 2017E 2018E 2019E
Cash and Cash Equivalents 824 1,011 1,390 1,385 1,164 1,576 1,926 2,242
Trade Accounts Receivable 361 408 460 486 555 569 657 684
Other Current Assets 50 58 95 103 81 88 96 105
Decommissioning Cars to Fleet Renewal 13 17 18 32 31 34 37 40
Total Current Assets 1,248 1,493 1,963 2,006 1,831 2,266 2,716 3,071
Derivative Financial Instruments Swap 0 0 0 46 46 46 46 46
Trade Accounts Receivable 4 7 3 5 5 5 5 5
Escrow Deposit 23 38 42 53 53 53 53 53
Deferred Income Tax and Social Contribution 25 32 33 0 0 0 0 0
Cars 2,534 2,781 3,278 3,611 3,975 4,273 4,602 4,973
Other 171 166 204 314 432 559 610 667
Software 36 47 60 67 43 47 51 56
Goodwill on Acquisition of Investments 5 12 22 22 22 22 22 22
Total Non Current Assets 2,798 3,085 3,735 4,117 4,576 5,004 5,388 5,821
TOTAL ASSETS 4,046 4,578 5,698 6,123 6,407 7,270 8,104 8,893

Appendix 1.2: Balance Sheet
494
100
163
204
204
163
100
100
Trade Accounts Payable 356 461 828 691 702 758 827 904
Payroll and Related Charges 53 74 86 86 87 94 103 113
Loans, Financing and Debentures 210 275 301 422 422 500 500 500
Income Tax and Social Contribution 26 35 41 28 28 28 28 28
Dividends and Interest on Own Capital 19 53 59 29 29 29 29 29
Other Current Liabilities 70 79 82 100 88 95 104 114
Total Current Liabilities 734 977 1,398 1,356 1,358 1,505 1,591 1,688
Loans, Financing and Debentures 1,845 2,068 2,412 2,597 2,597 2,997 3,390 3,674
Provisions 35 51 70 68 68 68 68 68
Deferred Income Tax and Social Contribution 77 112 139 142 142 142 142 142
Other Non Current Liabilities 30 30 23 19 19 19 19 19
Total Non Current Liabilities 1.987 2.260 2.644 2.825 2.825 3.225 3.618 3.903
TOTAL LIABILITIES 2,721 3,237 4,042 4,181 4,183 4,730 5,210 5,591
Capital Social 602 977 977 977 977 977 977 977
Retained Earnings 0 30 40 36 36 36 36 36
Reserves 723 334 638 929 1,207 1,519 1,868 2,270
TOTAL SHAREHOLDERS' EQUITY 1,325 1,341 1,656 1,942 2,224 2,540 2,895 3,302
TOTAL LIABILITIES AND SHAREHOLDERS' EQUITY 4,046 4,578 5,698 6,123 6,407 7,270 8,104 8,893
In BR Millions 2012 2013 2014 2015 2016E 2017E 2018E 2019E
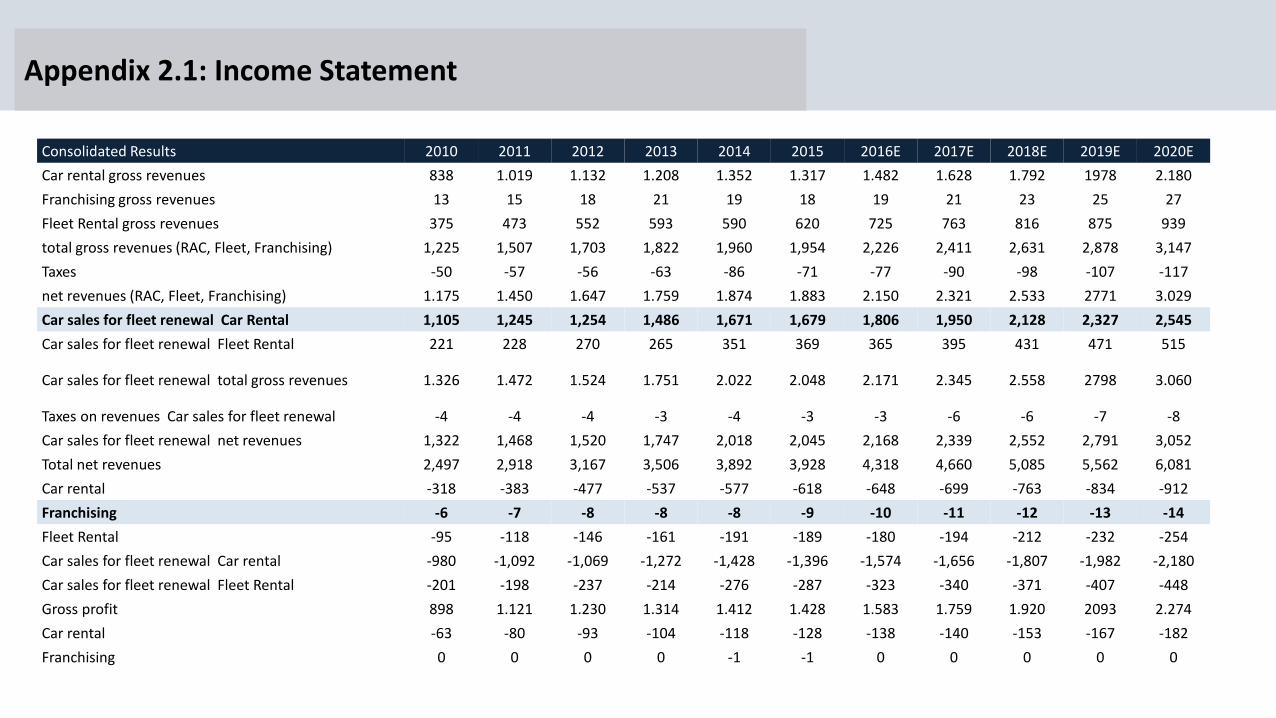
Appendix 2.1: Income Statement
494
100
163
204
204
163
100
100
Consolidated Results 2010 2011 2012 2013 2014 2015 2016E 2017E 2018E 2019E 2020E
Car rental gross revenues 838 1.019 1.132 1.208 1.352 1.317 1.482 1.628 1.792 1978 2.180
Franchising gross revenues 13 15 18 21 19 18 19 21 23 25 27
Fleet Rental gross revenues 375 473 552 593 590 620 725 763 816 875 939
total gross revenues (RAC, Fleet, Franchising) 1,225 1,507 1,703 1,822 1,960 1,954 2,226 2,411 2,631 2,878 3,147
Taxes -50 -57 -56 -63 -86 -71 -77 -90 -98 -107 -117
net revenues (RAC, Fleet, Franchising) 1.175 1.450 1.647 1.759 1.874 1.883 2.150 2.321 2.533 2771 3.029
Car sales for fleet renewal Car Rental 1,105 1,245 1,254 1,486 1,671 1,679 1,806 1,950 2,128 2,327 2,545
Car sales for fleet renewal Fleet Rental 221 228 270 265 351 369 365 395 431 471 515
Car sales for fleet renewal total gross revenues 1.326 1.472 1.524 1.751 2.022 2.048 2.171 2.345 2.558 2798 3.060
Taxes on revenues Car sales for fleet renewal -4 -4 -4 -3 -4 -3 -3 -6 -6 -7 -8
Car sales for fleet renewal net revenues 1,322 1,468 1,520 1,747 2,018 2,045 2,168 2,339 2,552 2,791 3,052
Total net revenues 2,497 2,918 3,167 3,506 3,892 3,928 4,318 4,660 5,085 5,562 6,081
Car rental -318 -383 -477 -537 -577 -618 -648 -699 -763 -834 -912
Franchising -6 -7 -8 -8 -8 -9 -10 -11 -12 -13 -14
Fleet Rental -95 -118 -146 -161 -191 -189 -180 -194 -212 -232 -254
Car sales for fleet renewal Car rental -980 -1,092 -1,069 -1,272 -1,428 -1,396 -1,574 -1,656 -1,807 -1,982 -2,180
Car sales for fleet renewal Fleet Rental -201 -198 -237 -214 -276 -287 -323 -340 -371 -407 -448
Gross profit 898 1.121 1.230 1.314 1.412 1.428 1.583 1.759 1.920 2093 2.274
Car rental -63 -80 -93 -104 -118 -128 -138 -140 -153 -167 -182
Franchising 0 0 0 0 -1 -1 0 0 0 0 0

Appendix 2.2: Income Statement
494
100
163
204
204
163
100
100
Fleet Rental -10 -11 -12 -14 -15 -18 -19 -20 -22 -24 -26
Car sales for fleet renewal -98 -129 -151 -162 -172 -191 -217 -234 -256 -280 -306
General, administrative and other expenses -78 -81 -99 -118 -136 -156 -171 -185 -202 -221 -241
Car rental -66 -86 -213 -86 -78 -39 -39 -80 -85 -92 -99
Fleet Rental -80 -115 -164 -143 -129 -125 -125 -139 -150 -161 -174
Other assets depreciation and amortization -21 -24 -33 -35 -36 -36 -36 -40 -43 -46 -50
Operating profit before financial results and taxes 482 596 466 652 727 736 838 921 1.010 1102 1.194
Expense -168 -239 -199 -187 -276 -370 -461 -431 -450 -464 -464
Income 38 60 61 77 125 167 217 175 187 220 250
Income before tax and social contribution 352 417 327 542 576 533 594 666 747 858 980
Income tax and social contribution -102 -125 -86 -157 -165 -130 -166 -186 -209 -240 -274
Net income for the period 251 292 241 384 411 402 428 479 538 618 706
Consolidated Results 2010 2011 2012 2013 2014 2015 2016E 2017E 2018E 2019E 2020E
CH-IN

Appendix 3: Beta
494
100
163
204
204
163
100
100
EnterpriseMarket Cap.
(USD)
Enterprise Value
(USD)
Total
Debt/Total
Assets (%)
Gross
Beta
Ajusted
Beta
(2/3*1/3)
Industry
Leverage
Beta (%)
Average
Capital
Structure
(%)
Industry
Tax Rate
(%)
Industry
Unleverage
Beta (%)
Localiza
Leverage
Beta (%)
Average 7,191,356,107 10,890,717,024 49 0.92 0.95
LOCALIZA RENT A CAR 2,523,788,115 3,033,972,159 49 0.93 0.95
AVIS BUDGET GROUP INC 3,121,310,315 17,289,310,315 70 1.72 1.48 0.62 0.3
AUTONATION INC 4,971,744,284 11,427,944,284 64 1.19 1.12 0.31 0.18
SIXT SE 249,886,695 5,105,098,501 50 0.95 0.96 0.12 0.06
EUROPCAR GROUPE SA 1,250,955,724 3,576,522,232 48 0.83 0.89 0.08 0.04
LOCAMERICA 102,794,736 296,367,072 60 0.18 0.45 0 0,00
TOTAL 14,195,473,911 40,944,728,458 370 6 6 1.19 0.61 0.37 0.86 1.16

Appendix 4.1: Key Financials
494
100
163
204
204
163
100
100
2011 2012 2013 2014 2015 2016E 2017E 2018E 2019E
Margins
Gross Margin (%) 38% 39% 37% 36% 36% 37% 38% 38% 38%
Net Profit Margin (%) 10% 8% 11% 11% 10% 10% 10% 11% 11%
EBITDA Margin (%) 28% 28% 26% 25% 24% 24% 25% 25% 25%
EBIT Margin (%) 20% 15% 19% 19% 19% 19% 20% 20% 20%
Profitability
ROA (%) 7% 6% 8% 7% 7% 7% 7% 7% 7%
ROE (%) 26% 18% 29% 25% 21% 19% 19% 19% 19%
ROIC (%) 17% 13% 17% 17% 16% 15% 15% 15% 15%
2011 2012 2013 2014 2015 2016E 2017E 2018E 2019E

Appendix 4.2: Key Financials
494
100
163
204
204
163
100
100
Market Ratios
EV/EBITDA (x) 8x 10x 9x 9x 7x 10x 10x 9x 8x
P/E (x) 17x 31x 18x 18x 13x 21x 18x 16x 14x
P/BV (x) 5x 6x 5x 4x 3x 4x 3x 3x 3x
Dividend Yield (%) 0,02x 0,01x 0,05x 0,01x 0,03x 0,02x 0,02x 0,02x 0,03x
Operational Efficiency
Spread ROIC x Wacc (%) 5.4 2 5.9 6 4.1 3.2 3.3 3.3 3.5
Spread ROIC x Kd (%) 8.7 6.2 11.6 10.4 6.2 3.7 6 6.6 7.1
Capital Structure
Assets/Equity (x) 3.6 3.0 3.4 3.4 3.2 2.9 2.9 2.8 2.7
Market Debt/Equity (X) 1.8 1.5 1.7 1.6 1.5 1.3 1.4 1.3 1.3
2011 2012 2013 2014 2015 2016E 2017E 2018E 2019E
2011 2012 2013 2014 2015 2016E 2017E 2018E 2019E
2011 2012 2013 2014 2015 2016E 2017E 2018E 2019E

Appendix 5: Du Pont Analysis
494
100
163
204
204
163
100
100

Appendix 6: Debt Ratios
494
100
163
204
204
163
100
100
1… 1,3631,231
1,333 1.322
1,589 1,624
2,447
2,6822,548
2,798
3.296
3,6433,784
0
500
1.000
1.500
2.000
2.500
3.000
3.500
4.000
2010 2011 2012 2013 2014 2015 2016
Net debt Fleet value

Appendix 7: Returns
494
100
163
204
204
163
100
100
19%
15.4%
7.1%
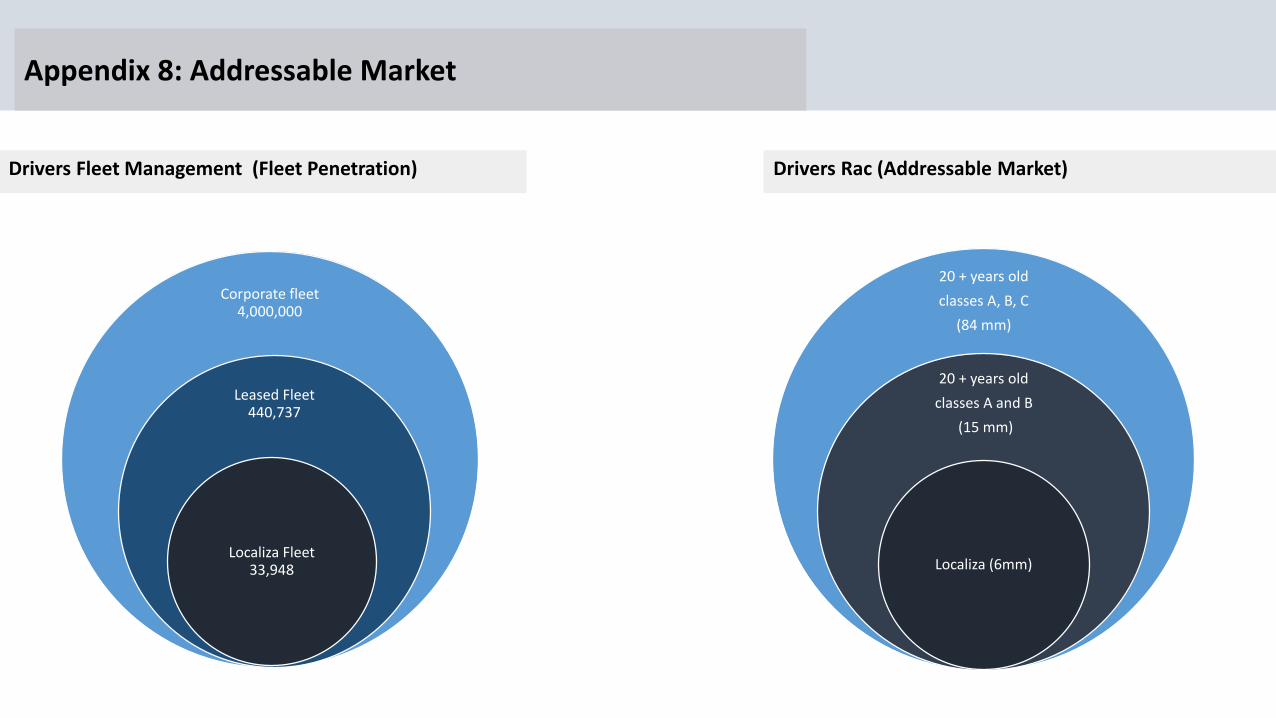
Appendix 8: Addressable Market
494
100
163
204
204
163
100
100
Corporate fleet4,000,000
Leased Fleet440,737
Localiza Fleet33,948
20 + years old
classes A, B, C
(84 mm)
20 + years old
classes A and B
(15 mm)
Localiza (6mm)
Drivers Fleet Management (Fleet Penetration) Drivers Rac (Addressable Market)

Appendix 9: Additional Risks
494
100
163
204
204
163
100
100
0
50
100
150
200
250
Social SecurityClaims Tax Claims Labor Claim Civil Lawsuits
Fin
anci
al L
oss
Remote Possible Probable
2507
241726
3769916208
Chances of Loss
Remote Possible Probable Total
Social Security Claims 4.782 20.288 0 25.070
Tax Claims 194.943 41.630 5.153 241.726
Labor Claim 0 0 37.699 37.699
Civil Lawsuits 0 0 16.208 16.208
Total Financial Impact 199.725 61.918 59.060 320.703
Material Arbitration, Administrative and Court Proceedings Probability of Loss

Appendix 10.1: Risk Analysis (Scenarios Outputs)
494
100
163
204
204
163
100
100
Base case Bear case Bull case
Revenue* 8,6% 8,1% 8,7%
Net Profit* 11,4% 8,8% 12,2%
EBITDA* 10,3% 9,0% 10,7%
Average ROIC** 15,3% 14,6% 15,5%
Average Total Debt / Total Capitalization (Bk. Equity)** 0,56x 0,56x 0,56x
Target Price 49,35 39,27 52,72
Upside/ (Downside) 22,2% -2,8% 30,5%

Appendix 10.2: Risk Analysis (Deterioration Scenarios for CDI rates)
494
100
163
204
204
163
100
100
Scenarios Base case Scenario I : 25% deterioration Scenario II : 50% deterioration
Net debt (dec 2015) 1,588.6 1,588.6 1,588.6
Net detb subject to CDI variation 1,059.2 1,059.2 1,059.2
Effective average rate of CDI in 12 months ended 31.12.15 13.23% 13.23% 13.23%
Estimated average annual rate of CDI, according to scenarios15.38% 19.23% 23.07%
Effect on financial expenses subject to the CDI variation
- According to effective rate (140.1) (140.1) (140.1)
- According to scenarios (162.9) (203.7) (244.4)
(Increase) in annual interest expense (22.8) (63.6) (104.3)

Appendix 11.1: Sensitivy Analysis (USA T-Bond – 10 years)
494
100
163
204
204
163
100
100
Perp
etu
ity
gro
wth
USA T-Bond (10 years)
R$ 49,35 0,0% 0,5% 1,0% 1,5% 2,0% 2,5% 3,0% 3,5%
3% R$ 34,60 R$ 33,60 R$ 32,65 R$ 31,74 R$ 30,88 R$ 30,06 R$ 29,28 R$ 28,53
4% R$ 40,10 R$ 38,80 R$ 37,57 R$ 36,42 R$ 35,32 R$ 34,29 R$ 33,30 R$ 32,37
5% R$ 47,37 R$ 45,62 R$ 43,98 R$ 42,45 R$ 41,01 R$ 39,67 R$ 38,40 R$ 37,20
6% R$ 57,47 R$ 54,97 R$ 52,67 R$ 50,55 R$ 48,58 R$ 46,76 R$ 45,05 R$ 43,46
7% R$ 72,39 R$ 68,58 R$ 65,13 R$ 62,00 R$ 59,14 R$ 56,52 R$ 54,12 R$ 51,90
8% R$ 96,73 R$ 90,19 R$ 84,46 R$ 79,39 R$ 74,88 R$ 70,84 R$ 67,20 R$ 63,90
9% R$ 143,46 R$ 129,84 R$ 118,54 R$ 109,02 R$ 100,89 R$ 93,86 R$ 87,72 R$ 82,31
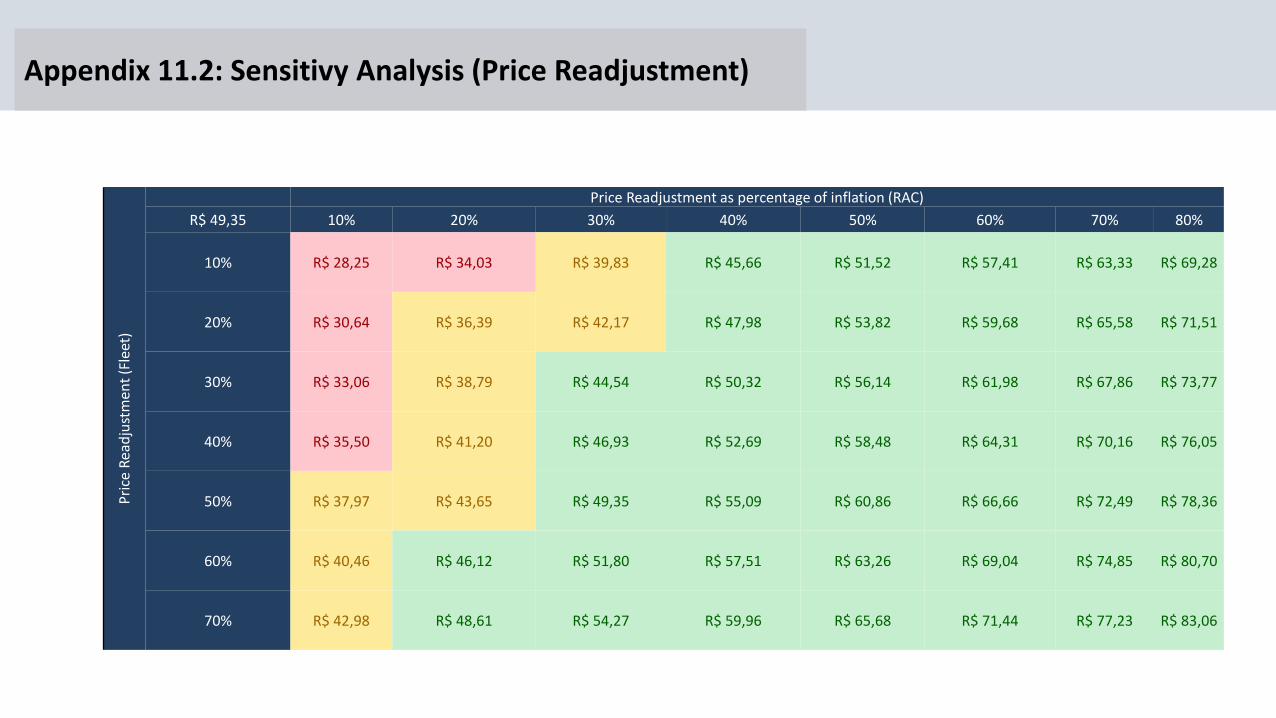
Appendix 11.2: Sensitivy Analysis (Price Readjustment)
494
100
163
204
204
163
100
100
Pri
ce R
ead
just
men
t (F
leet
)
Price Readjustment as percentage of inflation (RAC)
R$ 49,35 10% 20% 30% 40% 50% 60% 70% 80%
10% R$ 28,25 R$ 34,03 R$ 39,83 R$ 45,66 R$ 51,52 R$ 57,41 R$ 63,33 R$ 69,28
20% R$ 30,64 R$ 36,39 R$ 42,17 R$ 47,98 R$ 53,82 R$ 59,68 R$ 65,58 R$ 71,51
30% R$ 33,06 R$ 38,79 R$ 44,54 R$ 50,32 R$ 56,14 R$ 61,98 R$ 67,86 R$ 73,77
40% R$ 35,50 R$ 41,20 R$ 46,93 R$ 52,69 R$ 58,48 R$ 64,31 R$ 70,16 R$ 76,05
50% R$ 37,97 R$ 43,65 R$ 49,35 R$ 55,09 R$ 60,86 R$ 66,66 R$ 72,49 R$ 78,36
60% R$ 40,46 R$ 46,12 R$ 51,80 R$ 57,51 R$ 63,26 R$ 69,04 R$ 74,85 R$ 80,70
70% R$ 42,98 R$ 48,61 R$ 54,27 R$ 59,96 R$ 65,68 R$ 71,44 R$ 77,23 R$ 83,06

Appendix 12.1: Governance and Management (Bord of Directors)
494
100
163
204
204
163
100
100
Name Position Description
Eugênio Pacelli Mattar President Director
Mr. Eugênio Mattar is one of the founders of the Company. Today, he is
counselor of the Company and executive director President of the Company
(CEO) and it`s affiliates. He holds a bachelor`s degree in Civil Engineering from
UFMG in 1975 and a graduate degree in economics engineering in 1976. Mr.
Mattar studied administration in Fundação Dom Cabral.
Roberto Antônio Mendes CFO and Investor Relations
Mr. Roberto Mendes is Director of Finance and Investor Relations of Localiza
rent a car S.A. where he has been working since 1985. He has a bachelor`s
degree in business administration and accounting sciences from UFMG. He
started his career as external auditor first in Pwc, then KPMG (1971-1979),
Controller of Valep (today, Fosfertil) in the time it was from Grupo Vale (1976-
1979), Mendes Júnior (1979-1985). He has a graduate degree in Executive STC
from Fundação Dom Cabral, in strategy and inovation in business from Wharton
University of Pennsylvania (2011) and also attended to Kellogg Scholl of
Management
Bruno Moreira de Andrade Executive Director
Mr. Bruno it is the Franchising Executive Director of the Company, in which he
joined in 1985. He holds a bachelor`s degree in Civil Engineering from Escola de
Engenharia Kennedy in 1983, also holds a graduate degree in economics
engineering from Fundação Dom Cabral, Marketing (UNA), Franchising
development from St. Thomas University (Minneapolis, USA) and Executive STC
from Fundação Dom Cabral and Kellogg Scholl of management (Chicago/USA).
Eugênia Maria Rafael de Oliveira Executive Director
Mrs. Eugênia Oliveira it is Executive Director of the Company, in which se joined
in 1980. She holds a bachelor`s degree in Business Administraton from PUC-MG
in 1981 and a graduate degree in marketing from UMA in 1985. Mrs. Eugênia
Oliveira was part of 2003 class of management from Kellogg

Appendix 12.2: Governance and Management (Bord of Directors)
494
100
163
204
204
163
100
100
Marco Antônio Guimarães Executive Director
Mr. Marco Antônio is the Company`s executive director, in which he joined in
1990. He holds a degree in business administration from FUMEC in 1978 and
holds a graduate degree in management from Keramik Holding Laufen from
Gstaad in Switerland in 1988 and a portable MBA in management in Brazil -
Santili, Schlouchauer & Jucá in 1994. Mr. Guimarães was part of 2002
management program from Kellogg School of management.
Edmar Vidigal Paiva Executive Director
Mr. Paiva it is Executive Director of Localiza rent a car S.A.. He holds a bachelor`s
degree in Accounting Sciences from PUC-MG in 1998. He holds a graduate
degree in Finance from IBMEC, Executive MBA and Executive Development
Program, both from Fundação Dom Cabral. He was Controller manager of Líder
Aviação e auditor manager of Deloitte Touche Tohmatsu.
Heros di Jorge Executive Director
Mr. Heros di Jorge holds a bachelor degree in Economics and Administration,
and also holds a graduate degree in Financial Mathematics and Executive MBA
from Fundação Dom Cabral. Mr. Heros has been working in the Company since
1987, first in sales of car`s rent in São Paulo, then he was Director os sales of
Lozaliza Gestão de Frotas in São Paulo, he was promoted to regional manager of
Localiza Seminovos in São Paulo and in 2012 took the retail`s car sales position
in the headquarters. He is Executive Director since July, 2016
Name Position Description

Appendix 13.1: Administrative Board
494
100
163
204
204
163
100
100
Name Position Description
Salim Mattar President
Mr. Salim Mattar is the Executive President of the Board of directors. He
founded the Company in 1973 and had been being the President Director of
the Company s until May 2013. Salim Mattar holds a bachelor`s degree in
business administration from FUMEC in 1976. Mr. Salim also is: Director of
Locapar Participações e Administração Ltda; Shareholder and advisor of OMNI
Táxi Aéreo andPottencial Seguradora S.A.
Antônio Cláudio Brandão Resende Vice-President
Mr. Antônio Resende is one of the founders of the Company. He holds a
bachelor`s degree in Business Administration from União de Negócios e
Administração in 1977. Currently, he is vice-president of the Administrative
Board Counsil and he was administrative Vice-President of the Company and
it`s affiliates until 2008.
Eugênio Mattar Advisor
Mr. Eugênio Mattar is one of the founders of the Company. Today, he is
counselor of the Company and executive director President of the Company
(CEO) and it`s affiliates. He holds a bachelor`s degree in Civil Engineering from
UFMG in 1975 and a graduate degree in economics engineering in 1976. Mr.
Mattar studied administration in Fundação Dom Cabral.
Flávio Brandão Resende Advisor
Mr. Flávio Resende is one of the founders of the Company and member of the
Administrative Counsil of the Company. He holds a bachelor`s degree in Civil
Engeneering from Escola de Enhenharia Kennedy in 1980. Mr. Resende also is
Administrative Partner of FBR Participações e Administração LTDA and
Administrative Partner of FRJR Empreendimentos imobiliários LTDA.

Appendix 13.2: Administrative Board
494
100
163
204
204
163
100
100
José Galló Advisor
Mr. José Galló is na independent administrative counsil member. He holds a
bachelor`s degree in Business Administration from Fundação Getúlio Vargas in
1974. He has been being administrative counsil member since 1998. Mr. Galló
also is: President Director and Administrative counsil member of Lojas Renner
S.A. and administrative counsil member of SLC Agrícola S.A.
Oscar Bernardes Advisor
Mr. Oscar Bernardes is na independent administrative counsil member of the
Company since 2007. He was Bunge International CEO (1996-1999). Before
Bunge, he was Senior Partner of Booz-Allen & Hamilton. He was also
administrative counsil member of Alpagartas S.A., Delphi Corporation and
Johnson Eletric.
Stefano Bonfiglio Advisor
Mr. Bonfiglio is na independent advisory member since 2000. He holds a
economics degree from Georgetown University in 1985 and a MBA from
Wharton School in 1992, also he holds a M.A. in International Relations from
the University of Pennsylvania.Mr. Stefano Bonfiglio is founder partner of
Stirling Square Capital Partners, a private equity firm specialized in acquisitions
in Europe and Chairman of Axitea S.p.A.
Letícia Costa Advisor
Mrs. Maria Letícia Costa is na independent advisory of the Company. She holds
a bachelor`s degree in Production Engineering from Escola Politécnica da
Universidade de São Paulo and holds a MBA from Johnson School of Cornell
University. Mrs. Maria Letícia Costa also is Partner at Prada Assessoria and
Graduate director of Instituto Insper in São Paulo.
Name Position Description

Appendix 14: Awareness
494
100
163
204
204
163
100
100
2015 Awards
Franchising excellence seal (Brazilian Franchising Association)
32th most valuable Brazilian Brand (Isto É Magazine – BrandAnalytics)
One of the most admirable Brazilian HR (HR Management Magazine)
Best Investor Relationship programs in Brazil (IR Magazine)
Company with good relationship with journalist (Business Communication Magazine)
Localiza: Among 13 Companies in the World cited for GARTNER as a IT reference
Best CEO, CFO, IR and best IR program in Latam (Institucional Investor Magazine)
Best Companies for consumer (Época Reclame Aqui)
25th most valuable Brazilian Brand
Excellence in Finance Award (IBEF 2015)

Appendix 15: SWOT Analysis
494
100
163
204
204
163
100
100
Forces Weaknesses
1. High performance management, widely recognized by the market, which has
been delivering a better result than others competitors. According with
Institutional Investor Magazine, Localiza has the best CEO, CFO and IR in Latam.
1. Some importante and experienced managers like Marco Antônio Guimarães
(Seminovos) and Daltro Leite are expected to retire in short term. In mid-term,
Eugênio Mattar (CEO) and Roberto Mendes (CFO) also are expected to retire.
2. 25th most valuable brazilian brand (Interbrand ranking) and quality recognized
by customers – best Car Rental Company (Época Reclame Aqui Award).
2. Business strongly dependente on GDP performance. The current recession of
two years and uncertainities about the possible recovery of the economy put in
risk the company`s performance.
3. Largest single purchaser of light vehicles, resulting in better bargaining power
and payment discounts.
3.Financial results largely dependent on the conditions of purchase of new
vehicles and the sale of semi-new
4. Seminovos divisions has the strategic function to sell Localiza`s used cars
directly to the final consumer. Without intermediaries, it is possible to have better
margin on the sale.
Opportunities Threats
1. RAC and Fleet markets are not consolidated yet. Localiza is the best positioned
Company to grow with quality in this scenario
1. Major foreign players such as Hertz and Enterprise can raise the bet in the
Brazilian market, competing with Localiza in industry consolidation.
2. Localiza has been being solid financial results, usually better than the
competitors. In this scenario, it is possible to growth with or without mergers and
acquisitions.
2. Possibility of no concession renewal in airports, which may affect considerably
the company`s operating and financial results.

Appendix 16: Brand Recognition
494
100
163
204
204
163
100
100

50
55
60
65
70
75
80
2012 2013 2014 2015 1Q16
Localiza Unidas -adjusted Movida - adjusted
RAC Utilization Rate (adjusted by Localiza’s Method)
Appendix 18: Utilization Rates
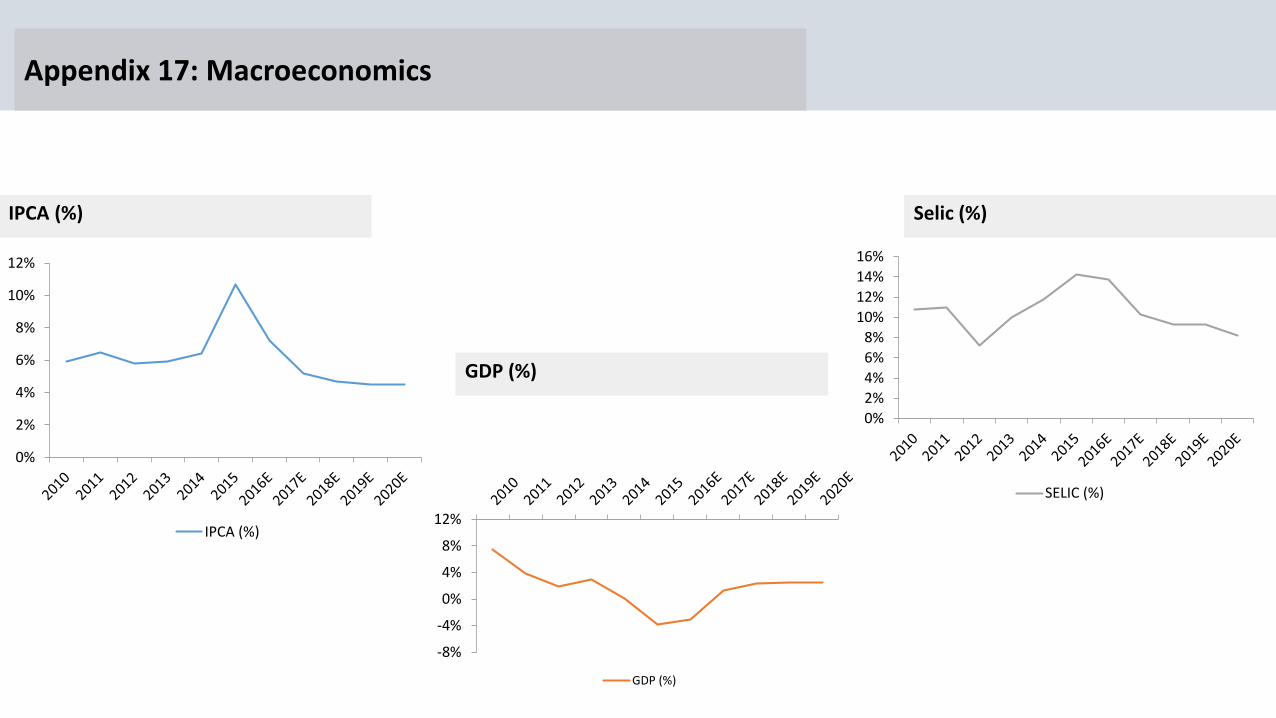
Appendix 17: Macroeconomics
494
100
163
204
204
163
100
100
0%
2%
4%
6%
8%
10%
12%
IPCA (%)
IPCA (%)
0%
2%
4%
6%
8%
10%
12%
14%
16%
SELIC (%)
GDP (%)
-8%
-4%
0%
4%
8%
12%
GDP (%)
Selic (%)
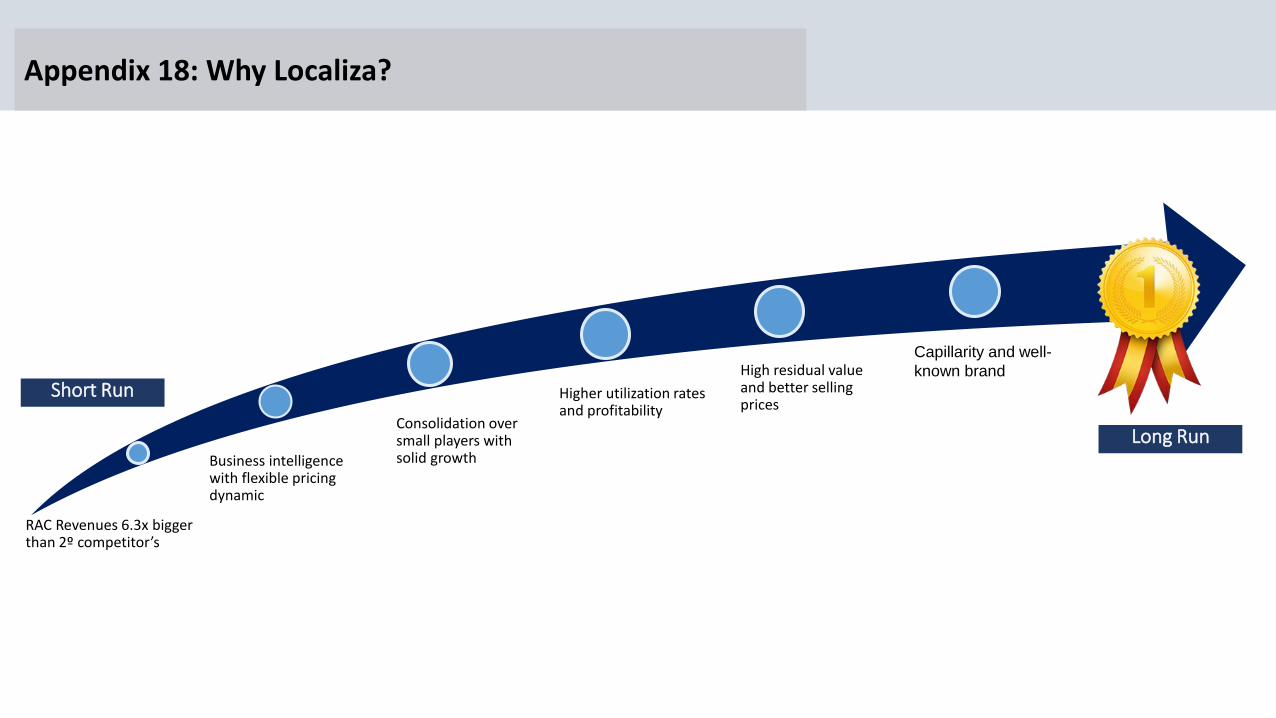
Appendix 18: Why Localiza?
494
100
163
204
204
163
100
RAC Revenues 6.3x bigger than 2º competitor’s
Business intelligence with flexible pricing dynamic
Consolidation over small players with solid growth
Higher utilization rates and profitability
High residual value and better selling prices
Capillarity and well-
known brand
Short Run
Long Run

Appendix 19: Revenue Forecast
494
100
163
204
204
163
100
34% 34% 33% 34% 34% 35% 35%
17% 17%15% 15%
16%16%
16%47%
49%51% 51%
49%49%
49%
0
1
2
3
4
5
6
2012 2013 2014 2015 2016E 2017E 2018E
Car Rental Gross Revenue Fleet Rental Gross Revenue Car Sales Gross Revenue
Revenue Breakdown
Source: Company’s Data
6.0%
6.0%
9.2%
5.8%

Appendix 20: Leverage
100
163
204
204
163
100
Debt Ratios
Source: Company’s Data and Bloomberg
End of period 2010 (*) 2011 2012 2013 2014 2015 9M16
Net debt/Fleet Value 52% 51% 48% 48% 40% 44% 44%
Net debt/Ebitda (**) 2.0x 1.7x 1.4x 1.5x 1.4x 1.7x 1.9x
Net debt/Equity 1.4x 1.2x 0.9x 1.0x 0.8x 0.8x 0.9x
EBITDA/ Net Interest Expenses 5.0x 4.6x 6.3x 8.3x 4.6x 4.6x 4.4x
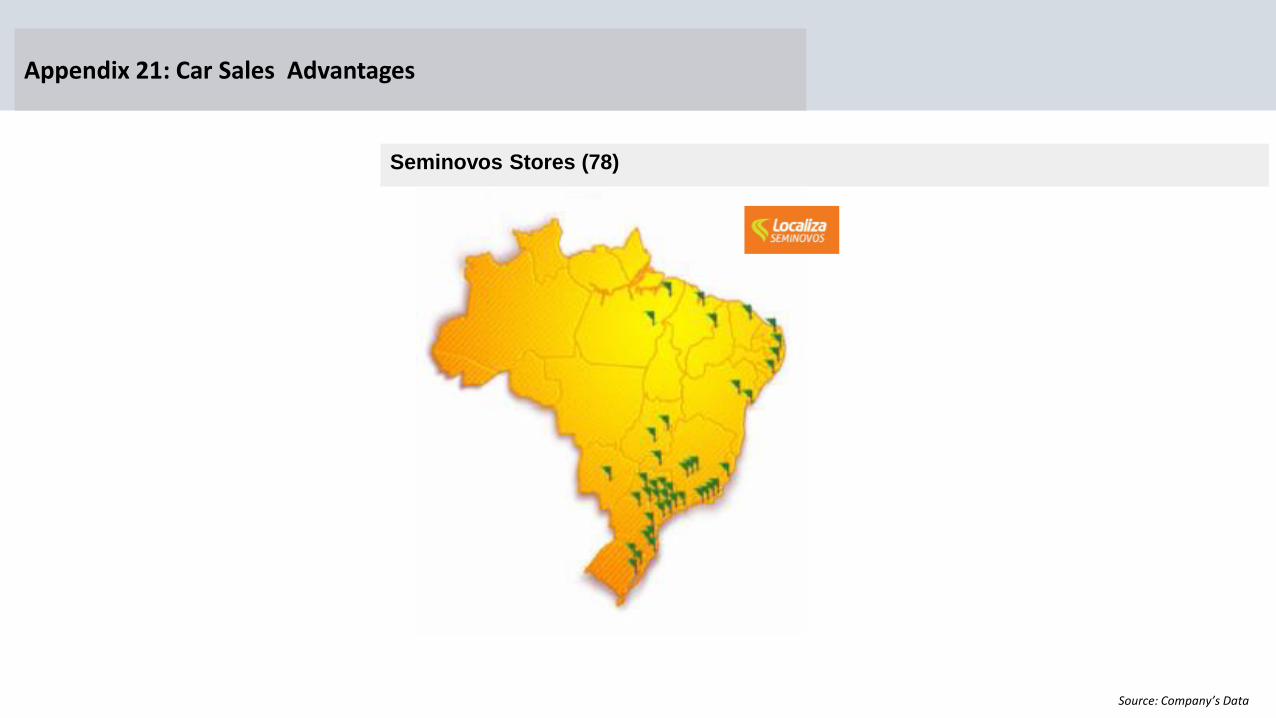
Appendix 21: Car Sales Advantages
494
100
163
204
204
163
100
Seminovos Stores (78)
Source: Company’s Data