teamwork approach in labor and delivery: method to improve
TRANSCRIPT

Teamwork Approach in Labor and Delivery: Method to Improve Maternal and Neonatal
Outcomes at Orotta Maternity Hospital
Susan M Marzolf
A thesis
submitted in partial fulfillment of the
requirements for the degree of
Master of Public Health
University of Washington
2012
Committee:
Marcia Weaver
Catherine Carr
Kibreab Asrat
Program Authorized to Offer Degree:
Public Health

!
©Copyright 2012
Susan M Marzolf
!
!
!
!
!
!
!
!
!
!
!

University of Washington
Abstract
Teamwork Approach in Labor and Delivery: Method to Improve Maternal and Neonatal
Outcomes at Orotta Maternity Hospital
Susan M Marzolf
Chair of the Supervisory Committee:
Research Associate Professor Marcia Weaver
Department of Global Health
Background: Top global priorities in maternal and neonatal health along with health systems
strengthening provide a framework for incorporating quality improvement measures into a new
teaching hospital environment.
Objective: Assess impact of in-service continuing medical education on improved teamwork,
communication, and maternal and neonatal outcomes.
Methods: A 3-month pilot study with a pre-train/post-train research design. Hospital medical
staff (n=45) participated in Ob/Gyn resident taught course within the National Referral Maternity
Hospital in Asmara, Eritrea. A standardized Safety Attitudes Questionnaire (SAQ) along with a
needs assessment questionnaire to identify educational gaps and team attitudes were given before
the course and the SAQ along with a follow up questionnaire for CME effectiveness were given
after. Outcome measures were changes in the mean score of the teamwork survey and relative
risk estimates of specific maternal and neonatal indicators. Data were analyzed with t-test, alpha
0.05, 2-sided p-value using Stata IC10. Neonatal outcomes were also assessed with a set of
quality indicators: the adverse score index, weighted score index and severity score index.
Results: SAQ response rate was 77.6% (45/58) pre-CME and 95.6% (43/45) post-CME. Eight
out of forty questions met statistical significance (p<0.05) in all domains except stress reduction.
Continuation of CME was desired by 94.7% at 2x/year. When domain specific questions were
pooled, four of six domains met statistical significance, as did the overall pooled questions. The
educational intervention did not show statistically significant change in relative risk estimates of
maternal (maternal death, RR 1.08 (0.20-5.84) and blood transfusion, 0.90 (0.74-1.09)) or
neonatal outcomes (intrapartum death, 1.24 (0.57-2.75), neonatal death, RR 0.93 (0.26-3.24),
neonatal transfer, RR 1.02 (0.81-1.27) and Apgar<7 at 5 minutes, RR 1.20 (0.83-1.73)).

Conclusion: Utilizing Ob/Gyn residents to implement staff developed continuing medical
education within a hospital setting is effective and may be a method to create improved
communication and teamwork amongst ward staff. The impact on improving maternal and
neonatal outcomes in the short-term is not evident and continued follow-up is important. This
project may be a method for MOH to provide sustainable, low-cost education for their healthcare
workers while improving work environment and possible quality of care.
!

! "!
TABLE OF CONTENTS
Page
List of Figures ……………………………………………………………………………… ii
List of Tables………………………………………………………………………………. iii
Section I: Introduction………………………………………………………………… 1
Section II: Methods……………………..……………………………………………... 7
Section III: Results ……………………………………………………………………... 16
Section IV: Discussion…………………………………………………………………. 27
Bibliography……………………………………………………………………………….. 34
Appendix A1: Personal Work Diary………………………………………………………. 37
Appendix A2: Labor and Delivery Pre-Educational Questionnaire………………………. 38
Appendix B: CME Schedule of Lectures………………………………………………... 40
Appendix C: Labor and Delivery Post-Educational Questionnaire……………………... 41
Appendix D: Safety Attitudes Questionnaire – SAQ……………………………………. 42
Appendix E: Adverse Index Scoring System……………………………………………. 44
Appendix F: Consent Form……………………………………………………………... 45
Appendix G: % Missing SAQ Responses………………………………………………... 46
Appendix H: Sensitivity Analysis……………………………………………………….. 48
Appendix I: Monthly Delivery Events: 2009-2011…………………………………….. 50

! ""!
LIST OF FIGURES
Figure Number Page
I. SAQ domain definitions…………………………………………………… 10
II. Outcome data collection time periods ……………………………………... 13
III. Study population flowchart……………………………………………….... 17
IV. Mean pooled SAQ before and after education intervention……………….. 22
V. Adverse event and weighted index for neonatal events 2009 – 2011 ……... 24
VI. Severity index for neonatal events 2009 – 2011…………………………… 24
VII. Maternal outcomes 2009 – 2011…………………………………………... 24

! """!
LIST OF TABLES
Table Number Page
I. Delivery Logbook Demographic Variable Definitions…………………………… 12
II. Clinical Maternal and Neonatal Outcome Measure Definitions
and Assigned Weights…………………………………………………………….. 12
III. SAQ Participant Summary………………………………………………………… 16
IV. Lecture Session Attendance……………………………………………………….. 18
V. Mean Responses to SAQ Before and After CME…………………………………. 19
VI. Summary of Pooled Domains Before and After Education Intervention………….. 21
VII. Delivery Log Descriptive Data…………………………………………………….. 23
VIII. Number of Neonatal Events………………………………………………………... 23
IX. Maternal and Neonatal Outcome Time Trend Risk Estimates…………………….. 25
X. Overall Maternal and Neonatal Outcomes Time Trend Risk Estimates…………… 26
!

! "#!
ACKNOWLEDGEMENTS
The author wishes to express sincere appreciation to the Department of Global Health for their
support and willingness to allow me to work and conduct my thesis overseas and to my
Committee Chair and Members whose insightful critique shaped this research. Additional
appreciation is extended to the Ob/Gyn residents and the staff at the Orotta Maternity Hospital
and Orotta School of Postgraduate Medical Education for their undivided attention and
willingness to participate and improve the health of Eritrean women and children. Finally, this
thesis would never have been completed without the encouragement and devotion of my spouse
and family.
!
!
!
!
!
!
!
!
!
!
!
!
!
!
!

! "!
!
!
!
DEDICATION
To the Women and Children of Eritrea
!
!

! "!
SECTION I. INTRODUCTION
Maternal and neonatal morbidity and mortality are top priorities for many developing countries.
The time of birth is critical for both mother and infant with estimates of 3 million early neonatal
deaths (first week of life), 1 million intrapartum-related neonatal deaths, and 358,000 maternal
deaths worldwide per year (Lawn, Lee et al. 2009; Wilmoth 2010; Spector, Agrawal et al. 2012).
With the upcoming deadline for the Millennium Development Goals (MDG) in 2015, many
countries have actively engaged in country-wide programs to encourage women to deliver in a
health care setting with trained healthcare workers. As access to healthcare improves, it is also
important to maintain and evaluate the quality of care within the hospital setting; especially high
risk wards such as Labor and Delivery (L&D).
In 2007, the World Health Organization (WHO) recognized the importance of quality health care
as a key mediator in the process of developing a framework for health systems strengthening
(Leatherman, Ferris et al. 2010; WHO 2007). Though quality of care can have multiple
contextual definitions and various methods of measurement and evaluation, a primary focus must
be at the service provider level in their respective work environments (Leatherman, Ferris et al.
2010; Adleyi and Morrow 1996). Audit studies conducted in both Malawi and Nigeria have
noted that 40-50% of maternal deaths occurring in their hospital system could be attributable to
suboptimal quality of care (Hunyinbo, Fawole et al. 2008; Kongnyuy, Mlava et al. 2009).
Similar statistics are noted in developed countries such as the United Kingdom (UK) where an
audit of intrapartum-related stillbirths noted suboptimal care in over 75% of the cases and that an
educational training course in obstetric emergencies could improve perinatal outcomes
(Draycott, Sibanda et al. 2006). Therefore, this focus on the service provider should include

! #!
concerted efforts for local hospital and government ownership to sustain efforts for continuous
education of its providers along with quality assessments of its service (Leatherman, Ferris et al.
2010; WHO 2007).
Within reproductive health programs in low resource settings, education and training is a key
component of maintaining and supporting quality health care (Kwast 1998). It is vital that this
component be supported at multiple levels within the health organization and Ministry of Health
(MOH). One example of a successful educational program was the implementation of the Life
Saving Skills curriculum (LSS) (Kwast 1998; Grady, Ameh et al. 2011). This program has a
‘systems-based’ approach and allows MOH to provide national level training for their health
service providers. In addition, LSS and other short-course trainings have shown decreases in
maternal and neonatal morbidity and mortality (Leatherman, Ferris et al. 2010; Grady, Ameh et
al. 2011); but there continues to be a paucity of continuing medical education and quality
assurance following these programs. Another concern at the hospital level is the limited number
of staff who attended LSS or other educational courses. These short courses can be expensive,
remove health workers from their work environment, and require continued reinforcement of
knowledge and skills gained in order to improve maternal and neonatal outcomes (Leow, Groen
et al. 2011). Thus efforts to create a system within the hospital environment to develop and
implement continuing medical education is imperative (Leow, Groen et al. 2011).
As development of a strong health system requires human and resource capacity building, efforts
to utilize local health professionals is necessary for a sustainable system towards quality health
care (Leow, Groen et al. 2011). When evaluating various work environments particularly high

! $!
risk and emergency areas, effective and proficient communication and teamwork between
service providers at all levels of hierarchy must occur in order to avert adverse events (Kilday
2012; Charney 2011; Siassakos, Crofts et al. 2009; Salas, Almeida et al. 2009; Hall and Weaver
2001). What is more difficult to define is an evidence-based approach to accomplish effective
communication and team training. If one evaluates research performed in high resource settings,
the literature supports a teamwork approach for L&D based on consistent reports of adverse
events related to both lack of communication and lack of teamwork in the hospital setting. One
review of obstetric malpractice claims in the United States of America (USA) noted that 31% of
adverse events were attributed to communication problems (White, Pichert et al. 2005). In
addition, both in the UK and USA, reviews of perinatal and maternal deaths and injuries have
shown that more than 50% of these outcomes have resulted from both communication and
teamwork issues (Guise and Segel 2008; Charney 2011). As a “high-hazard” industry, as are
aviation, nuclear power plants, and the military, L&D wards are especially prone to poor
outcomes within a short period of time and thus improving joint responsibility and identifying
patient care gaps are of vital importance. In fact, it is estimated that 30% of intrapartum-related
neonatal deaths could be averted by only improving the method of resuscitation at delivery
(Goldenberg and McClure 2009). Reports from the Joint Commission on Accreditation of
Healthcare Organizations (JACHO) in the USA note that poor communication was associated
with 80% of perinatal deaths and injuries and poor teamwork was attributed to 40% of maternal
deaths and 45% of near miss morbidities (Sexton, Holzmueller et al. 2006). Thus it is critical to
have effective teamwork and communication during obstetric emergencies. Though teamwork
training is new for obstetrics, studies to date suggest that teamwork not only improves patient
outcomes but it also positively affects job satisfaction and staff retention (Guise and Segel 2008).
! %!
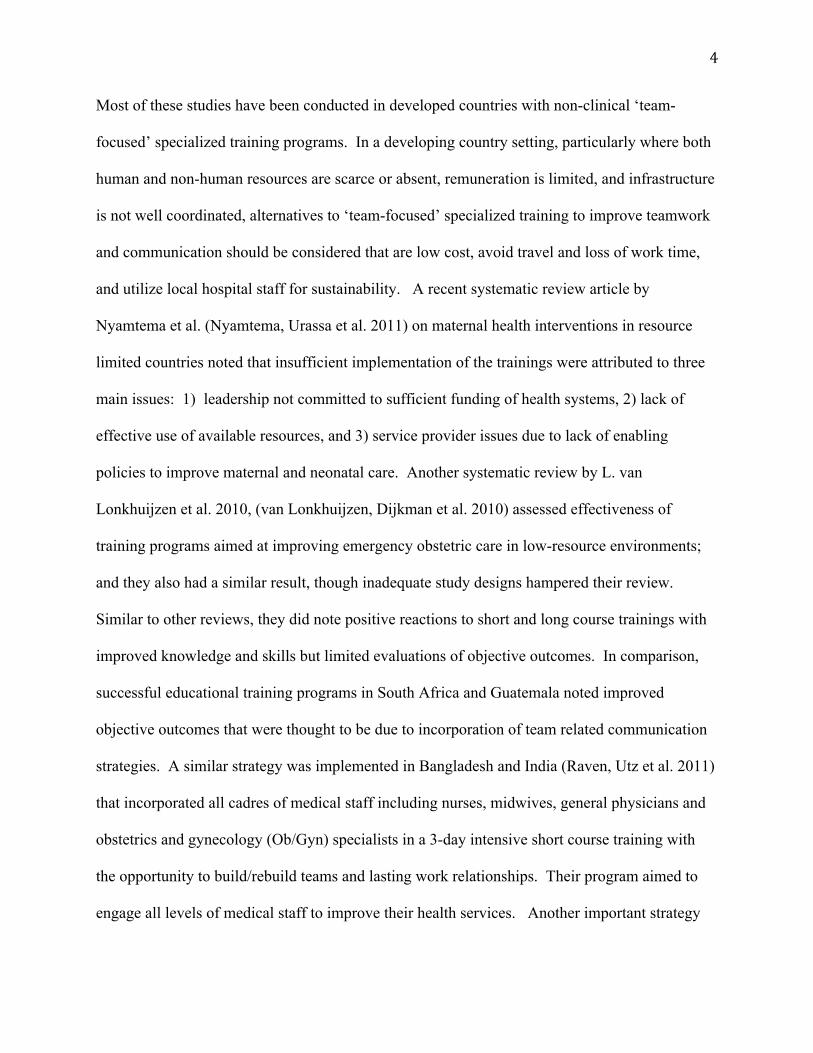
Most of these studies have been conducted in developed countries with non-clinical ‘team-
focused’ specialized training programs. In a developing country setting, particularly where both
human and non-human resources are scarce or absent, remuneration is limited, and infrastructure
is not well coordinated, alternatives to ‘team-focused’ specialized training to improve teamwork
and communication should be considered that are low cost, avoid travel and loss of work time,
and utilize local hospital staff for sustainability. A recent systematic review article by
Nyamtema et al. (Nyamtema, Urassa et al. 2011) on maternal health interventions in resource
limited countries noted that insufficient implementation of the trainings were attributed to three
main issues: 1) leadership not committed to sufficient funding of health systems, 2) lack of
effective use of available resources, and 3) service provider issues due to lack of enabling
policies to improve maternal and neonatal care. Another systematic review by L. van
Lonkhuijzen et al. 2010, (van Lonkhuijzen, Dijkman et al. 2010) assessed effectiveness of
training programs aimed at improving emergency obstetric care in low-resource environments;
and they also had a similar result, though inadequate study designs hampered their review.
Similar to other reviews, they did note positive reactions to short and long course trainings with
improved knowledge and skills but limited evaluations of objective outcomes. In comparison,
successful educational training programs in South Africa and Guatemala noted improved
objective outcomes that were thought to be due to incorporation of team related communication
strategies. A similar strategy was implemented in Bangladesh and India (Raven, Utz et al. 2011)
that incorporated all cadres of medical staff including nurses, midwives, general physicians and
obstetrics and gynecology (Ob/Gyn) specialists in a 3-day intensive short course training with
the opportunity to build/rebuild teams and lasting work relationships. Their program aimed to
engage all levels of medical staff to improve their health services. Another important strategy

! &!
that was associated with success was peer review and continuing education after formal skills
training in Indonesia (McDermott, Beck et al. 2001). Finally, a key component linked to
improved outcomes and is increasingly being recognized as an important marker in program
evaluations is measuring the trust and the respect that occurs between participants and between
hospital systems with the goal of improving the sense of teamwork and sustained collaboration
(Dynes, Buffington et al. 2012).
The importance of increasing human capacity cannot be understated but effective
communication and teamwork among the additional personnel could be of vital importance for
safe and successful patient management, especially in critical conditions. Since L&D is unique
among different healthcare wards such that the loss of a young mother and/or infant may occur in
short notice, there is potential for high rates of staff burnout, staff turnover, and general malaise.
This ultimately translates into sub-optimal patient care. Therefore, by incorporating improved
communication and teamwork among all levels of L&D staff, along with continuing medical
education and staff empowerment, the opportunity to provide support to each team member,
despite limited resources, will translate into improved maternal and neonatal outcomes.
We hypothesized that by implementing a hospital-based continuing medical education (CME)
course whose topics are driven by the maternity staff and taught by Ob/Gyn residents utilizing
different teaching methods, we would improve teamwork and communication within the ward
setting and breakdown hierarchical barriers that may exist and that this link would improve
maternal and neonatal outcomes. The purpose of this study would fulfill two goals: one for
Ob/Gyn residents to fulfill a curricular objective of ‘formal group teaching’ and the second for

! '!
hospital midwives and nurses to upgrade and/or share their skills and knowledge with the
Ob/Gyn residents; thus fulfilling a needed gap for an in-hospital sustainable continuing medical
education program.

! (!
SECTION II. METHODS
Study Setting
This study was a 3- month pilot pre-train/post-train study conducted in Asmara, Eritrea from
April 2011 to June 2011 at the Orotta National Referral Maternity Hospital, which has the largest
obstetric delivery service within the capital city of Asmara and is the primary referral site for
peripheral regional hospitals and health centers for complicated pregnancies. It serves a
population of 500,000 with almost 9000 deliveries per year. In addition, over the past 2 years, a
medical educational training program for medical students, interns and residents has been
implemented within the hospital setting. Though this has increased the medical staff, the L&D
ward, which previously only functioned with midwives and Ob/Gyn specialists, has now
absorbed additional workforce with a new agenda of teaching that puts a strain on an already
busy system
Selection of Study Subjects
The study participants were all hospital based, full time clinical staff who were directly or
indirectly involved in maternity care at the Orotta National Referral Maternity Hospital.
Potential participants included midwives, associate nurses and Ob/Gyn specialists whose names
were provided by the hospital matron and totaled 64.
Description of Intervention Development and Evaluation
The educational curriculum intervention was developed and implemented utilizing the
information provided by all verbally consented participants who filled out the pre-training
questionnaire and a personal work diary. See Appendix A1, A2. A personal work diary was

! )!
offered as a method to stimulate topic ideas during a normal working day. This provided a
baseline needs assessment tool and has been supported in the literature to help identify specific
training needs for the trainee (Perol, Boissel et al. 2002). Thereby, we would implement a more
targeted training program rather than arrange topics, which we felt, were important. The
participants were asked to write daily notes for one week that address issues for improving
patient care in L&D and specific educational topics that would complement their current
knowledge. They could then utilize this personal reflection to fill in the second needs assessment
questionnaire which was developed by the principal investigator with input from the Ob/Gyn
residents and included both demographics of the participant and questions related to their
educational gaps and desires. The questionnaire also included the participant’s thoughts about
improving teamwork and student teaching on the hospital wards.
The educational program occurred 4x/week for 5 weeks with an extension period of 4 weeks for
participants who were unable to attend lectures but desired the opportunity to learn. (See list of
topics in Appendix B) This extension program was computer-based, whereby the participants
viewed all lectures from the lectures series and asked the residents questions on a one-to-one
basis. A computer was placed in L&D with all lectures and other support materials for continued
learning. There were a total of 10 – 2-hour lectures with each lecture repeated once during the 5
weeks to provide optimum opportunity for most participants. Teaching formats were chosen by
the resident and included lectures, case studies, question-answer sessions, and hands on
simulation for maternal and neonatal resuscitation. Participant feedback was requested and
provided for resident evaluation. A third questionnaire was given after the educational
intervention to evaluate participant’s thoughts about continued medical education and its

! *!
effectiveness as a method to improve teamwork and communication in daily work (See
Appendix C).
Measurement Tool
The Safety Attitudes Questionnaire (SAQ) developed by Sexton et al. (Sexton, Helmreich et al.
2006) has previously been validated for developed countries with several versions, including one
for L&D. This survey is a psychometrically sound method to determine healthcare workers
assessments of their work environment and the context of how they deliver care and to measure
effectiveness of work environment interventions. The original survey had 57 questions but we
chose to adapt the form to reflect the local situation of our setting with input and direction both
from the Ob/Gyn residents and two midwives who worked in maternal health at outside
hospitals. We understand that this may compromise the validity of the questionnaire but also felt
that as a pilot project the local input was important. They provided input into clarity of the
questions and local relevance of the questions. The final survey used included 40 adapted
questions out of 57 original questions (See Appendix C). The SAQ elicits attitudes through 6
domains: teamwork, job satisfaction, perception of management, safety, working conditions, and
stress recognition. The response to each of the items is a 5-point Likert scale. (1=disagree
strongly, 2=disagree slightly, 3=neutral, 4=agree slightly, 5=agree strongly). The adapted
version focused on teamwork and safety questions. Figure I outlines the six domain definitions,
number of questions in each domain, and question examples.

! "+!
Domain Definition Number of
Questions
Question Example
Teamwork (T): perceived quality of
collaboration between personnel
12 I feel my input is well received in this
clinical area
Job Satisfaction (J): positivity about the
work experience
6 I like my job
Perceptions of Management (PM):
approval of management action
3 The administration of this hospital is
doing a good job
Safety (S): perceptions of a strong and
proactive organizational commitment to
safety
10 I would feel safe having myself or my
family treated here as a patient
Working conditions (W): perceived quality
of the work environment and support
staff/resources
4 This hospital does a good job of
training new personnel
Stress recognition (SR):
acknowledgement of how performance is
influenced by stressors
5 I am less effective at work when
fatigued
Figure I. SAQ domain definition, number of questions and examples
Data Collection
Two methods of data collection were performed. For the primary teamwork and communication
outcome, data were collected from three separate questionnaires. The first questionnaire
provided participant demographic data, work experience, and thoughts about working in teams.
This was given pre-educational curriculum. The second questionnaire was the verbally
consented standardized teamwork and safety survey (SAQ) and was given both pre-training and
post-training. The final questionnaire was distributed to the original verbally consented
participants post-educational curriculum to reflect their perceived knowledge of skills and
education gained from the resident taught curriculum. The Ob/Gyn residents distributed the
questionnaires to consented participants and answered any questions.
For the secondary maternal and neonatal morbidity and mortality outcome, data were collected
on forms developed to capture specified outcomes of maternal death and blood transfusion and
! ""!
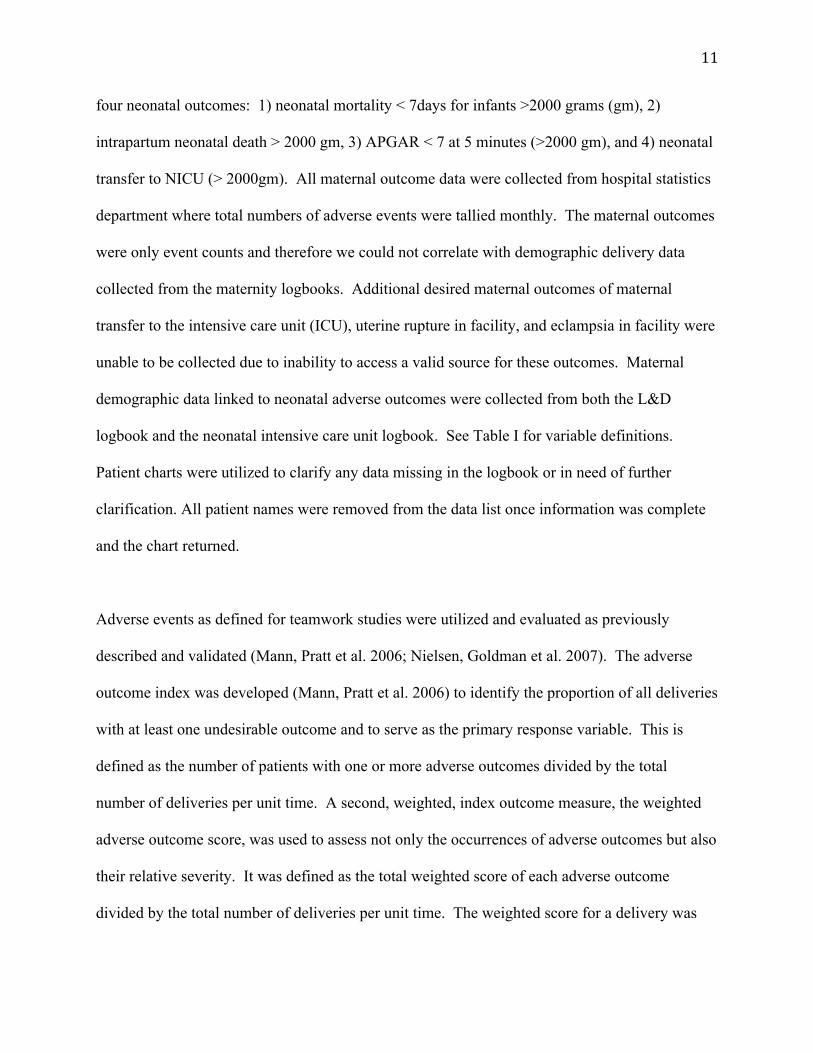
four neonatal outcomes: 1) neonatal mortality < 7days for infants >2000 grams (gm), 2)
intrapartum neonatal death > 2000 gm, 3) APGAR < 7 at 5 minutes (>2000 gm), and 4) neonatal
transfer to NICU (> 2000gm). All maternal outcome data were collected from hospital statistics
department where total numbers of adverse events were tallied monthly. The maternal outcomes
were only event counts and therefore we could not correlate with demographic delivery data
collected from the maternity logbooks. Additional desired maternal outcomes of maternal
transfer to the intensive care unit (ICU), uterine rupture in facility, and eclampsia in facility were
unable to be collected due to inability to access a valid source for these outcomes. Maternal
demographic data linked to neonatal adverse outcomes were collected from both the L&D
logbook and the neonatal intensive care unit logbook. See Table I for variable definitions.
Patient charts were utilized to clarify any data missing in the logbook or in need of further
clarification. All patient names were removed from the data list once information was complete
and the chart returned.
Adverse events as defined for teamwork studies were utilized and evaluated as previously
described and validated (Mann, Pratt et al. 2006; Nielsen, Goldman et al. 2007). The adverse
outcome index was developed (Mann, Pratt et al. 2006) to identify the proportion of all deliveries
with at least one undesirable outcome and to serve as the primary response variable. This is
defined as the number of patients with one or more adverse outcomes divided by the total
number of deliveries per unit time. A second, weighted, index outcome measure, the weighted
adverse outcome score, was used to assess not only the occurrences of adverse outcomes but also
their relative severity. It was defined as the total weighted score of each adverse outcome
divided by the total number of deliveries per unit time. The weighted score for a delivery was

! "#!
the sum of the weights for each adverse outcome that occurred during that delivery, or zero if no
adverse outcome occurred. Finally, a severity index was calculated by using the total weighted
score of each adverse outcome divided by the total number of deliveries with one or more
adverse outcomes. See Appendix E for adverse event scoring system and Table II for outcome
measure definition and assigned weights.
Table I. Delivery Logbook Demographic Variable Definitions
Demographic Variable Definition
Age Recorded maternal age at time of delivery
Address Zoba
Gravidity / Parity Number of pregnancy / Number of delivery
Date Date of Delivery
Weight Birthweight of infant in grams at delivery
Gender Sex of infant: male or female
Time Time of delivery
Table II. Clinical Maternal and Neonatal Outcome Measure Definitions
and Assigned Weights
Outcome Measure Definition Assigned Weight
Maternal Death Any death identified in Maternity Hospital 750
Blood Transfusion Any blood transfusion given in L&D for any
reason
20
Neonatal Death Any infant death whose 1-minute APGAR is > 0
but whose 5-minute APGAR is 0 or any infant that
was transferred to the neonatal intensive care unit
but had a recorded death < 7 days
400
Intrapartum Neonatal
Death
Any infant admitted to L&D with positive heart
beat but with APGAR 0 at delivery and
birthweight > 2000 grams
400
Neonatal Transfer Any neonate transferred to the neonatal intensive
care unit (NICU) for any reason and whose
birthweight was > 2000 grams
35
APGAR* Assigned resuscitation score at one minute and 5-
minutes with a 5-minute score < 7 but > 0
25
*APGAR: appearance, pulse, grimace, activity, respiration

! "#!
Data were collected from three different time periods to reflect any identified differences in the
time associated changes relative to new medical teaching programs: Interns only reflect 2009
time period and Ob/Gyn residents plus interns reflect 2010 time period. Thus the first two time
periods, 2009 and 2010, are for baseline comparison pre-educational curriculum and the final
timeline in 2011 reflects post-educational curriculum. Each time period totals 6-months. The
time period with only medical interns is from January 2009- June 2009. The Ob/Gyn residents
began in the hospital October 2009. In case there is a seasonal distribution of deliveries, the
second time period chosen was from July 2010- December 2010 to reflect the time period where
data were collected post-training, July2011-December2011 based on planned time to give the
educational curriculum (April 2011-June2011). See Figure II for time periods.
January 2009-June 2009 July 2010-Dec 2010 July 2011-Dec 2011
Baseline Intern Only Baseline Intern+Resident Post Intern +Resident
! ! !
Jan2009_____________________July2010______________CME________________Dec2011
Figure II. Outcome data collection time periods
Analysis Plan
The primary outcome (improvement in teamwork and communication) was the mean score
comparison from our adapted version of the validated SAQ for L&D. The t-test was used to
assess whether the mean subgroup scores and total scores between the survey given before and
after the educational curriculum were statistically significantly different. Values <0.05 were

! "%!
considered significant and no adjustment for multiple comparisons was performed due to
exploratory nature of our study.
The secondary outcome measures were the change in observed rates of maternal and neonatal
events. They were first analyzed as a proportion: total number of specific events / total deliveries
per unit time and comparisons are reported as a relative risk. Multiple pregnancies were
counted as a single delivery. All neonates with anomalies, antepartum neonatal deaths and/or no
recorded weight or 5-minute AGPAR were removed from analysis. Neonatal weight >2000
grams was chosen to reflect term/later preterm gestation and avoid adverse outcomes due to
preterm status. Analyses were performed with STATA-IC 10 (StataCorp LP, College Station,
Texas USA).
Human Subjects:
Recruitment for the educational program occurred initially via a “Recruitment Flier” notification
that was posted on all wards in the hospital to attend an informational discussion on a date and
time identified by the hospital Matron to be convenient for most staff (after their monthly
hospital meeting). Those who attended were also requested to convey this educational
opportunity to others who were unable to attend. The information about the training was
provided by both the principal investigator and a research assistant who also translated any
additional information in Tigrinya and answered questions accordingly. After the informational
session, each of 5 Ob/Gyn residents were assigned 12-13 names out of the 64 total potential
participants and verbally offered participation of the research portion of the educational program
which included a copy of the oral consent written in both English and Tigrinya (see Appendix F),

! "&!
a personal work diary, a pre-training questionnaire to identify staff educational gaps to be used to
develop the educational program, and the standardized SAQ survey. The participation to fill in
the questionnaires and survey was voluntary and did not affect formal participation in the
educational series. If the staff agreed to participate in the research, then he/she were asked to
complete the questionnaire packet with instructions to return it anonymously to a folder that each
resident had in a locked cupboard. The study was approved by the UW-Seattle Research
Committee and the Human Research and Development Department of the Ministry of Health in
Eritrea.

! "'!
SECTION III. RESULTS
Study Participants
Out of the original 64 potential participants, 58 were available for formal consent. Figure III
outlines the participant recruitment. The overall response rate was 77.6% (45/58). The median
age of participants was 25 (range 21-58). The median years in the field of obstetrics and
gynecology was 2.5 (range 1-32) with a median of 2 years (range 1-25) working at Orotta
Maternity Hospital and a median of 2 years (range 1-22) within the L&D ward. The majority of
participants were female 74.4% (32/43), which reflects the hospital non-physician staff
demographics. Only 26.8% (11/41) had previously attended other educational courses, 33.3%
(13/39) had attended a specific LSS course and 47.6% (20/42) had attended at least one of these
courses. The responder positions (n=43) were associate nurse 41.9% (18/43), midwife 53.5%
(23/43), physician 4.7% (2/43), and medical administration 0%. See Table III for summary.
Table III. Safety Attitudes Questionnaire (SAQ) Participant Summary
Descriptive Variables (n=45) Mean (SD) Median Range
Age 31.1 (11.2) 25 21 – 58
No. Years in Obstetrics 6.9 (8.5) 2.5 1 – 32
No. Years at OMH 5.5 (6.5) 2 1 – 25
No. Years Labor & Delivery 4.5 (6.3) 2 0 - 23
No. / Total (%)
Gender
Male 11 / 43 (26)
Female 32 / 43 (74)
LSS Courses
No LSS 26 / 39 (67)
Yes LSS 13 / 39 (33)
Other Education
No 30 / 41 (73)
Yes 11 / 41 (27)
Position
Associate Nurse 18 / 43 (42)
Midwife 23 / 43 (53)
Physicians 2 / 43 (4.7)
Administrative Midwife 0 / 43 (0)

! "(!
Figure III. Study Population Flowchart *Educational sessions were voluntary and open to part-time and new medical staff who were not included in the
study. An additional 17 midwives and associate nurses attended one or more educational sessions.
Educational Staff Chosen Topics—Needs Assessment from Midwives and Associate Nurses
The most frequent ten topics were chosen from the 82% (43/45) completed pre-intervention
questionnaire but only 25.6% (11/43) utilized the personal work diary for educational or
teamwork topic ideas. The personal work diary and questionnaire responses were all based on
!"#$%$&'()*+,'-'.$%/)01#2'$.-)3$.++4)
56)71$%8$'.-)
&&!,-./-012342256-781!9:;212!
&!<=2818;-6-7>2!
%!4.?->-28;78-5>!,-./-012!
91-:8$.&;)7.&$'('2.$'18)'8)3*<)3:&=%;)
6>)7.&$'('2.8$#)
%$!,-./-012!3!42256-781!9:;212!
#!<=2818;-6-7>2!
?%8)@%%A)B/:(.$'18.-)3%##'18#)
C6)D)6>)3:&=%;)7.&$'('2.8$#)
#$!,-./-012342256-781!9:;212!
"!<=2818;-6-7>@!
A7881>.1.!5>BC!5>1!2122-5>D!
71#$)EB/:(.$'18.-))3*<)3:&=%;)
6F)7.&$'('2.8$#)
%"!,-./-012!3!42256-781!9:;212!
#!<=2818;-6-7>2!
#!E4F!G7;8-6-7>82!H;7>2I1;1.!85!
J-II1;1>8!K52L-87B!
'!E87II!M>707-B7=B1!

! ")!
specific educational topics that related to maternal and neonatal health and not per se to non-
clinical team training. 97.6% (40/41) already felt that they worked well in a team but also felt
that learning more about a teamwork approach to patient care would be helpful. In contrast,
54.1% (20/37) preferred an individual approach to patient care. Only 26.3% (10/38) were willing
to be a team leader, though 59% (23/39) could identify another person they work with whom has
leadership qualities. Finally, 90.5% (38/42) felt they would be willing to participate and learn
about a teamwork system. Subsequently, a ten-week CME series was developed and
implemented per schedule (See Appendix B for schedule and chosen topics).
Of the participants who took the initial SAQ survey, 53.3% (24/45) attended one or more
lectures and 95.6% (43/45) took the post-CME SAQ survey. The post-CME follow-up
questionnaire to determine effectiveness of resident taught CME showed that 97.5% (40/41)
desired the CME series to continue and 100% (40/40) felt that the educational series improved
how they worked in team. Table IV outlines the total number of participants/biweekly sessions.
Table IV. Lecture Session Attendance*
Attendance Range: 13-29, Mean=21.3
BIWEEKY LECTURE SESSION NUMBER
1 2 3 4 5 6 7 8 9 10
Participant
Totals
15 13 17 22 26 19 27 21 29 24
*Non-SAQ participants (n=17) also attended one or more sessions and are included in the above
numbers
SAQ Domains
There were 8/40 questions (20.0%) that met statistical significance at the p-value, 0.05. Of the
eight questions two were within each of the safety, job satisfaction and perception of

! "*!
management domains and one was within each of the teamwork and the working conditions
domains. Table V outlines the results of the SAQ and the statistically significant questions mean
score responses before and after the educational intervention along with the respective p-values
reflecting the change in mean score after the educational intervention. The domain for each
question and whether the question was reversed scored are also noted. The analysis was based
on complete cases, where the percentage missing per question ranged from 0% -13.3% in the
pre-SAQ (mean=4.3%) and 0%-11.6% in the post-SAQ (mean=7.7%). See Appendix G for the
missing values for each question at each time point.
TABLE V. Mean Responses to SAQ Before and After CME
Survey Question PRE-SAQ POST-SAQ
RESPONSES (n=45) RESPONSES (n=43)
Domain Reverse Mean (SD*) Mean (SD) P-Value
1. I like my job…………………………… J No 3.53 (1.38) 3.95 (1.02) 0.1088
2. I feel that my input is well received in
this clinical area………………………… T No 3.34 (1.06) 3.46 (1.07) 0.5975
3. I would feel safe having myself or my
family treated here as a patient ………… S No 3.42 (1.14) 3.60 (0.90) 0.4254
4. Medical errors* are handled
appropriately in this clinical area………… S No 2.74 (1.00) 2.95 (1.18) 0.3922
5. This hospital does a good job of
training new personnel………………… W No 3.07 (1.32) 3.88 (1.14) 0.0029
6. All the necessary information for
diagnostic and therapeutic decisions is
routinely available to me… W No 3.07 (1.09) 3.10 (0.80) 0.8882
7. Working in this hospital is like being
part of a large family…………………… J No 3.62 (1.19) 4.07 (0.80) 0.0429
8. The administration of this hospital is
doing a good job………………………… PM No 1.82 (1.06) 2.60 (1.15) 0.0016
9. I receive appropriate feedback about
my performance………………………… S No 2.81 (1.17) 3.15 (0.96) 0.1574
10. In this clinical area, it is difficult
to discuss errors…………………………… S Yes 2.77 (1.19) 3.00 (1.26) 0.3889
11. This hospital is a good place
to work………………………….................. J No 3.12 (1.26) 3.81 (0.89) 0.0044
12. Fatigue impairs my performance during
emergency situations (emergency
resuscitation/ hemorrhaging etc.)………… SR No 2.88 (1.17) 2.87 (1.00) 0.9796
13. The level of staffing in this clinical
area are sufficient to handle the number
of patients. PM No 2.05 (1.40) 2.86 (0.91) 0.0019
(Table V: Continued)

! #+!
TABLE V. Mean Responses to SAQ Before and After CME (Continued)
Survey Question PRE-SAQ POST-SAQ
RESPONSES (n=45) RESPONSES(n=43)
Domain Reverse Mean (SD) Mean (SD) P-Value
14. I am encouraged by my colleagues to
report any patient safety concerns I may have S No 3.57 (1.04) 3.81 (0.98) 0.2719
15. The culture in this clinical area makes it
easy to learn from the errors of others…… S No 3.29 (1.08) 3.68 (0.91) 0.0799
16. This hospital deals constructively with
problem physicians and staff……………… W No 2.68 (1.05) 2.85 (1.01) 0.4459
17. In this clinical area, it is difficult to
speak up if I perceive a problem with
patient care.. T Yes 3.05 (1.03) 3.40 (0.99) 0.1098
18. When my workload becomes excessive,
my performance is impaired……………… SR No 3.58 (1.08) 3.33 (1.06) 0.2720
19. I am provided with adequate, timely
information about events in the hospital
that might affect my work………………… PM No 2.60 (1.10) 2.98 (0.81) 0.0738
20. I know the proper channels to direct
questions regarding patient safety in this
clinical area……… S No 3.29 (1.05) 3.24 (0.99) 0.8299
21. I am proud to work at this hospital…… J No 3.19 (1.30) 3.57 (1.06) 0.1381
22. Disagreements here are resolved
appropriately (Not Who is right but
What is best for the patient).. T No 3.18 (1.06) 3.49 (0.98) 0.1717
23. I am less effective at work when
fatigued… SR No 3.20 (1.12) 3.03 (1.23) 0.4942
24. I am more likely to make errors in tense
or hostile situations……………………… SR No 2.86 (1.13) 2.98 (1.07) 0.6458
25. I have the support I need from other
personnel to care for patient……………… T No 3.76 (1.25) 3.95 (0.49) 0.3332
26. It is easy for personnel in this clinical
area to ask questions when there is something
that they do not understand………………. T No 3.36 (1.21) 3.65 (1.04) 0.2238
27. Disruptions in the continuity of care
(ie, shift changes,patient transfers) can be
detrimental to patient safety……………… T No 3.11 (1.05) 3.12 (1.06) 0.9721
28. During emergencies, I can predict what
other personnel are going to do next……… T No 3.57 (0.94) 3.33 (0.99) 0.2475
29. Decision making in this clinical area
utilizes input from relevant personnel……. T No 3.34 (0.80) 3.46 (0.79) 0.5917
30. Trainees in my discipline are adequately
supervised………………………………… W No 2.79 (1.26) 3.23 (1.00) 0.0965
31. I feel burned out from my work……… SR Yes 2.79 (0.98) 3.17 (1.10) 0.0975
32. Important issues are well communicated
at shift changes…………………………… T No 4.02 (0.89) 3.95 (0.86) 0.7072
33. There is widespread adherence to
clinical guidelines and evidence-based criteria
regarding patient safety/care here……… S No 3.52 (0.72) 3.13 (0.91) 0.0360
34. I feel frustrated by my job…………… J Yes 3.23 (1.27) 3.45 (1.04) 0.3847
35. I feel I am working too hard on my job.. J Yes 2.14 (1.03) 1.83 (0.93) 0.1554
(Table V: Continued)

! #"!
TABLE V. Mean Responses to SAQ Before and After CME (Continued)
Survey Question PRE-SAQ POST-SAQ
RESPONSES (n=45) RESPONSES (n=43)
Domain Reverse Mean (SD) Mean (SD) P-Value
36. Personnel frequently disregard rules or
guidelines (handwashing, treatment protocols/
clinical pathways, sterile field) that are
established for this clinical area…………… S Yes 2.61 (1.04) 2.88 (0.99) 0.2259
37. Communication breakdowns which
lead to delay in start surgical procedures
are common……………………………….. S Yes 2.58 (1.03) 3.08 (1.07) 0.0370
38. The physicians, midwives, nurses, health
associates and other affiliated staff in this
clinical area work together in a well
coordinated team…………………………… T No 3.41 (1.30) 3.68 (1.03) 0.2664
39. I am frequently unable to express
disagreement with physicians……….………T Yes 3.02 (1.12) 3.16 (1.03) 0.5772
40. I know the first and last names of
all the personnel I worked with during
my last shift……………………………….. T No 3.20 (1.13) 3.74 (0.98) 0.0197
*SD: standard deviation
For an overall domain score, the mean score of all pooled domain questions was calculated and
were compared before and after the educational intervention. See Table VI for summary.
Table VI. Summary of Pooled Domains:
Mean Pooled Scores Before and After Education Intervention
SAQ Domain Mean Score- Baseline (SD) Mean Score- Follow up (SD) P-Value
Management Perception
*n=45 pre-
*n=43 post-
2.13 (0.87) 2.76 (0.71) 0.0003
Work Conditions
*n=45 pre-
*n=43 post-
2.92 (0.66) 3.28 (0.62) 0.0113
Job Satisfaction
*n=45 pre-
*n=43 post-
3.11 (0.75) 3.46 (0.51) 0.0129
Safety
*n=45 pre-
*n=43 post-
3.04 (0.51) 3.26 (0.44) 0.0301
Teamwork
*n=45 pre-
*n=43 post-
3.36 (0.48) 3.54 (0.39) 0.0577
Stress Reduction
*n=45 pre-
*n=43 post-
3.07 (0.50) 3.07 (0.52) 0.9857
*Complete case analysis, see appendix G for % missing responses

! ##!
Finally all SAQ question mean scores were pooled and compared before (mean 3.07, SD 0.38)
and after (mean 3.32, SD 0.30) the educational intervention to evaluate the overall change in the
SAQ. This overall mean change was statistically significant with p=0.0010. See Figure IV.
Figure IV. Mean score pooled SAQ before and after education intervention, p=0.0010
In order to evaluate whether the educational intervention affected neonatal outcomes, an adverse
outcome index, weight outcome index and severity outcome index were calculated and compared
over the three time periods. The maternal outcomes were compared as a maternal mortality rate
and a total 6-month blood transfusion calculation. Table VII and Table VIII outline the
descriptive delivery logs (Table VII) and the number of events per 6-months (Table VIII) for
each neonatal outcome indicator available in the database. The final events shown reflect total
delivery events including two types of cases with missing outcome information: 1) all infants
born with APGAR of 0 and 2) all infants transferred but unknown final discharge diagnosis (died
versus discharge home). A sensitivity analysis in which these cases were omitted did not reveal
a difference in final results (data not shown, see Appendix H). An observation is a delivery with
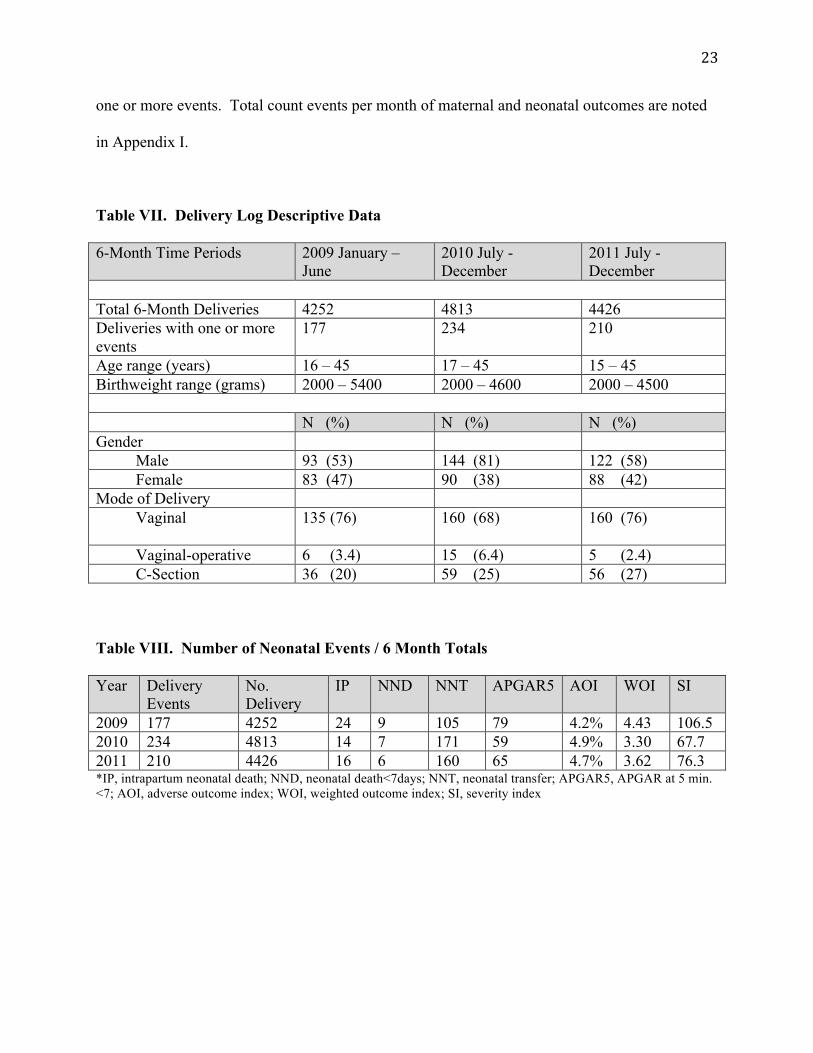
! #$!
one or more events. Total count events per month of maternal and neonatal outcomes are noted
in Appendix I.
Table VII. Delivery Log Descriptive Data
6-Month Time Periods 2009 January –
June
2010 July -
December
2011 July -
December
Total 6-Month Deliveries 4252 4813 4426
Deliveries with one or more
events
177 234 210
Age range (years) 16 – 45 17 – 45 15 – 45
Birthweight range (grams) 2000 – 5400 2000 – 4600 2000 – 4500
N (%) N (%) N (%)
Gender
Male 93 (53) 144 (81) 122 (58)
Female 83 (47) 90 (38) 88 (42)
Mode of Delivery
Vaginal 135 (76)
160 (68)
160 (76)
Vaginal-operative 6 (3.4) 15 (6.4) 5 (2.4)
C-Section 36 (20) 59 (25) 56 (27)
Table VIII. Number of Neonatal Events / 6 Month Totals
Year Delivery
Events
No.
Delivery
IP NND NNT APGAR5 AOI WOI SI
2009 177 4252 24 9 105 79 4.2% 4.43 106.5
2010 234 4813 14 7 171 59 4.9% 3.30 67.7
2011 210 4426 16 6 160 65 4.7% 3.62 76.3 *IP, intrapartum neonatal death; NND, neonatal death<7days; NNT, neonatal transfer; APGAR5, APGAR at 5 min.
<7; AOI, adverse outcome index; WOI, weighted outcome index; SI, severity index

! #%!
Figure V. Adverse Event and Weighted Index Figure VI. Severity Index of Neonatal
Measures of Neonatal Events Events 2009-2011
2009-2011
Figure VII. 6-month maternal mortality ratio and blood transfusions from 2009-2011
Figures V-VII graphically illustrate changes in the neonatal adverse event scores and maternal
event outcomes. Between the first two time periods, 2009 and 2010, there were an increase in
adverse events but an overall decrease in severity for neonatal outcomes. Likewise, there was an
increase in the number of total maternal blood transfusions during this same time period.
Between the new baseline time period, 2010 and the post-educational time period, 2011, the
event counts are noted to be similar for both maternal and neonatal outcomes.
The adverse score index was only used to evaluate quality of care for neonatal outcomes as these
were directly derived from total delivery events from the L&D logs. Since both maternal
Jan-June 09 July-Dec 10 July-Dec 11
AOI 4.2 4.9 4.7
WOI 4.4 3.3 3.62
!"
!#$"
%"
%#$"
&"
&#$"
'"
'#$"
("
(#$"
$"
%" &" '"
)*+"
,*+"
!"
!#$"
%"
%#$"
&"
&#$"
'"
'#$"
("
(#$"
$"
-./0-1/2"!3" -1450627"%!" -1450627"%%"
(#&"
(#3"(#8"
(#("
'#'"
'#9&"
!"#$%&
'#($)*$&!"#$%&+&,$-./0&!"#$%&122341255&
)*+"
,*+"
Jan-June 09 July-Dec 10 July-Dec 11
SI 106.5 67.7 76.3
!"
#!"
$!"
%!"
&!"
'!!"
'#!"
()*+(,*-"!." (,/0+1-2"'!" (,/0+1-2"''"
'!%34"
%535"
5%36"
!"#$%&
'$($)*+,&!"#$%&'-.)$&/0012/033&
78"
Jan -June 2009July-Dec 2010 July-Dec 2011
Maternal Death/100,00070.5 83.1 90.4
No.Blood Transfusions 127 229 189
!"
#!"
$!!"
$#!"
%!!"
%#!"
&'(")&*(+"%!!," &*-.)/+0"%!$!" &*-.)/+0"%!$$"
1!2#"342$" ,!25"
$%1"
%%,"
$3,"
!"#$%&"'()$"#*(+"#$(,(-./0$%(12(3'114(
5%"&62.671&6(899:;89<<(
6'7+8('-"/+'79:$!!;!!!"
<=2>-==?"@8'(AB*AC=(A"

! #&!
mortality and blood transfusion events were not obtained from delivery logs, the link across
delivery events was not possible and the maternal and neonatal events could not be aggregated
events. Therefore, maternal outcomes are analyzed as proportional rates.
To analyze the proportion of all events per total delivery, event rates were calculated and
compared over both time periods evaluated: 2009 – 2010 with the addition of Ob/Gyn residents
and 2010 – 2011 with addition of the educational intervention in 2011. There is a statistically
significant increase in both blood transfusions and neonatal transfer to the neonatal intensive care
unit, though most of these neonates were discharged home, after the addition of Ob/Gyn
residents. This trend did not continue and no significant changes were noted following the
educational intervention. See Table IX and X for proportional rates and relative risk estimates.
Table IX. Maternal and Neonatal Outcome Time Trend Risk Estimates
Ob/Gyn Resident Educational Intervention
Delivery Totals N=4252 N=4813 N=4813 N=4426
Event 2009 2010 RR 95% CI 2010 2011 RR 95% CI
Maternal Death
(n/100,000)
3
(70.6)
4
(83.1)
1.18 0.20 – 8.04 4
(83.1)
4
(90.4)
1.08 0.20 – 5.84
Blood Transfusion
(n/1000)
127
(29.9)
229
(47.6)
1.59 1.28 – 1.99 229
(47.6)
189
(42.7)
0.90 0.74 – 1.09
Intrapartum Death
(n/1000)
24
(5.6)
14
(2.9)
0.52 0.25 – 1.04 14
(2.9)
16
(3.6)
1.24 0.57 – 2.75
Neonatal Death
(n/1000)
9
(2.1)
7
(1.5)
0.69 0.22 – 2.07 7
(1.5)
6
(1.4)
0.93 0.26 – 3.24
NNT Total*
(n/1000)
105
(24.7)
171
(35.6)
1.44 1.1 – 1.85 171
(35.6)
160
(36.2)
1.02 0.81-1.27
Apgar5 <7*
(n/1000)
79
(18.6)
59
(12.3)
0.66 0.46-0.94 59
(12.3)
65
(14.7)
1.20 0.83-1.73
2009 2010 RR 95% CI 2010 2011 RR 95% CI
NNT Total 105 171 171 160
NND/NNT* 7 6 0.53 0.15 – 1.83
6 5 0.89 0.22 – 3.50
*NNT: neonatal transfer, NND: neonatal death, APGAR5: APGAR at 5 minutes < 7

! #'!
Table X. Overall Maternal and Neonatal Outcomes Time Trend Risk Estimate
Delivery Totals N=4252 N=4426
Event 2009 2011 RR 95% CI
Maternal Death
(n/100,000)
3
(70.6)
4
(90.4)
1.28 0.22 – 8.74
Blood Transfusion
(n/1000)
127
(29.9)
189
(42.7)
1.43 1.14 – 1.80
Intrapartum Death
(n/1000)
24
(5.6)
16
(3.6)
0.64 0.32 – 1.26
Neonatal Death
(n/1000)
9
(2.1)
6
(1.4)
0.64 0.19 – 2.01
NNT Total*
(n/1000)
105
(24.7)
160
(36.2)
1.46 1.14 – 1.89
Apgar5 <7*
(n/1000)
79
(18.6)
65
(14.7)
0.79 0.56-1.11
2009 2010 RR 95% CI
NNT Total 105 160
NND/NNT* 7 5 0.47 0.12 – 1.72
*NNT: neonatal transfer, NND: neonatal death, APGAR5: APGAR at 5 minutes < 7

! #(!
SECTION IV. DISCUSSION
This study evaluated the effectiveness of utilizing senior Ob/Gyn residents to teach and build
teamwork with staff midwives and nurses in a busy national referral hospital in a developing
country setting. The strength of the study was the willingness and desire on both the education
side and the service provision side to learn together to improve the quality of patient care and the
work environment. In addition, the study attempted to capture not only the objective aspect of
using ‘resident teaching’ for staff to understand and improve teamwork but also the quantitative
aspect of real life learning and working to measure specific indicators of quality.
At least one SAQ question in each domain met statistical significance except for stress reduction
domain. Of interest is that 4/8 questions at the 0.01 level were related to management and
staffing. Though question 5 (This hospital does a good job of training new personnel) may be a
result of the training program, the other three are likely due to other changes within the hospital
setting that occurred at the same time the teaching program was implemented. Two major
changes within the hospital were change in hospital director, hospital supervisors and non-
clinical administration along with the addition of 26 new graduate midwives and nurse
associates. Thus, leading a respondent to answer in the affirmative to questions 8 (The
administration of this hospital is doing a good job) and 13 (The level of staffing in this clinical
area are sufficient to handle the number of patients). Question 11 (This hospital is a good place
to work) could be important both from the teaching aspect and the active changes in
administration. The other 4 questions likely reflect the educational program as they relate to
improved surgery times (Q37. Communication breakdowns which lead to delay in start of
surgical procedures are common.), knowledge of protocols (evidence) (Q33. There is
widespread adherence to clinical guidelines and evidence-based criteria regarding patient

! #)!
safety/care here), knowing names of co-workers (Q40. I know the first and last names of all the
personnel I worked with during my last shift) and feeling like a family (Q7. Working in this
hospital is like being part of a large family). This is important especially with the new arrivals to
the wards and an important step in forming improved teamwork along with understanding the
benefit of evidenced based protocols.
When evaluating the pooled domain specific questions, four out of six domains showed
statistical significance. As explained above, the most significant domain, perception of
management, is probably not a reflection of the educational course but of other changes that
occurred during this time. The other three domains, working conditions, job satisfaction, and
safety may not have been fully affected by changes in management; and therefore, the
educational intervention may have possibly had a positive effect. Within the teamwork domain,
there was borderline significance at 0.0577. In light of the pre-questionnaire survey noting that
97.6% ‘felt they already worked well in a team’, it is perhaps not surprising that the participant
‘perception of teamwork’ didn’t change from their baseline survey. Though it was encouraging
that the post-CME survey noted 100% of respondents ‘felt that they now worked better in a
team’. The overall pooled questions were statistically significant and therefore, our educational
program showed that, as a whole, the overall hospital environment in these six domains
improved.
Maternal and Neonatal outcome data were revealing in that they did not show any statistically
significant change after the educational intervention, though there were two indicators that
showed statistical significance with implementation of the Ob/Gyn residency program October

! #*!
2009. These were an increase in blood transfusions (p=0.000) and an increase in neonatal
transfer to NICU (p=0.000) in 2010. It is difficult to determine the etiology of the increase in
blood transfusion but one may speculate that in-hospital Ob/Gyn residents may be more likely to
transfuse a patient and/or increased referrals from regional hospitals. Further audit studies are
required to determine the exact etiology. In terms of the increase in neonatal referrals, there was
a new protocol developed by the Pediatric Department that identified specific reasons for the
midwives to refer neonates and this was actively implemented in 2010 by the Maternity Hospital.
Despite the increase in neonatal transfers, there was a decreasing trend in severity of neonatal
indicator across time from 106.5 (2009) to 67.7 (2010) but minimal change after educational
intervention in 2011 at 76.3 (See Figure VI). This suggests that the implementation of the obgyn
residency program had a stronger association with improved neonatal outcomes than did our
educational intervention. Neonatal data may be a reasonable quantitative measure of quality,
though. Draycott et. al. has documented this measure of quality in previous studies where
obstetric training did improve neonatal outcomes (Draycott, Sibanda et al. 2006). Continued
follow up along with continued training may show an effect in the near future along with audit
studies to clarify specific maternal indicators.
Training programs in low resource settings are not new and include both short and long courses,
but their ultimate long-term effectiveness is less well known due to failure to follow up with
outcome based results (van Lonkhuijzen, Dijkman et al. 2010). Another limitation of many
training programs is their requirement for participants to be away from their work environment
while the course is taking place and in areas where human resources are already stretched, this
alone puts patients at risk (Grady, Ameh et al. 2011; Raven, Utz et al. 2011). Some programs,

! $+!
though, are working to be effective yet keep the course short to 2-3 days (Raven, Utz et al.
2011). A common denominator with the training programs is that transfer of knowledge and
skills does occur with an overall positive response to the training and are linked with supervision
and monitoring at the work site (McDermott, Beck et al. 2001; Leow, Groen et al. 2011; Raven,
Utz et al. 2011)
WHO is actively aligned with programs that have mechanisms of sustainability and local
ownership (WHO 2008). Our project fits into their goal whereby, the major stakeholders are the
midwife and nursing staff along with the Ob/Gyn residents who too are working to build up their
knowledge, skills, and teaching ability. A study by Revel and Yusseuf in 2003, also
demonstrated a similar result utilizing staff chosen educational topics to develop an in-country
CME program for staff working in rural areas of United Arab Emirates (Revel and Yussuf 2003).
Their program also noted improved themes of teamwork and communication, though it did not
have an outcomes based evaluation.
When obstetric emergency training programs were reviewed for the most effective components
of training, Siassakos et al. noted that all units that implemented their ‘own’ in-hospital training
were more effective than outside training (Siassakos, Crofts et al. 2009). They were also more
likely to have 100% of staff trained and to maintain continued training. This aspect of in-
hospital training is important to understand as our study noted that 33% of participants had ever
taken the national level LSS course and supports our in-hospital continued medical education
intervention. A common theme in many study results were that improved teamwork does
improve maternal and neonatal outcomes, but that multi-professional ‘in-house’ clinical training
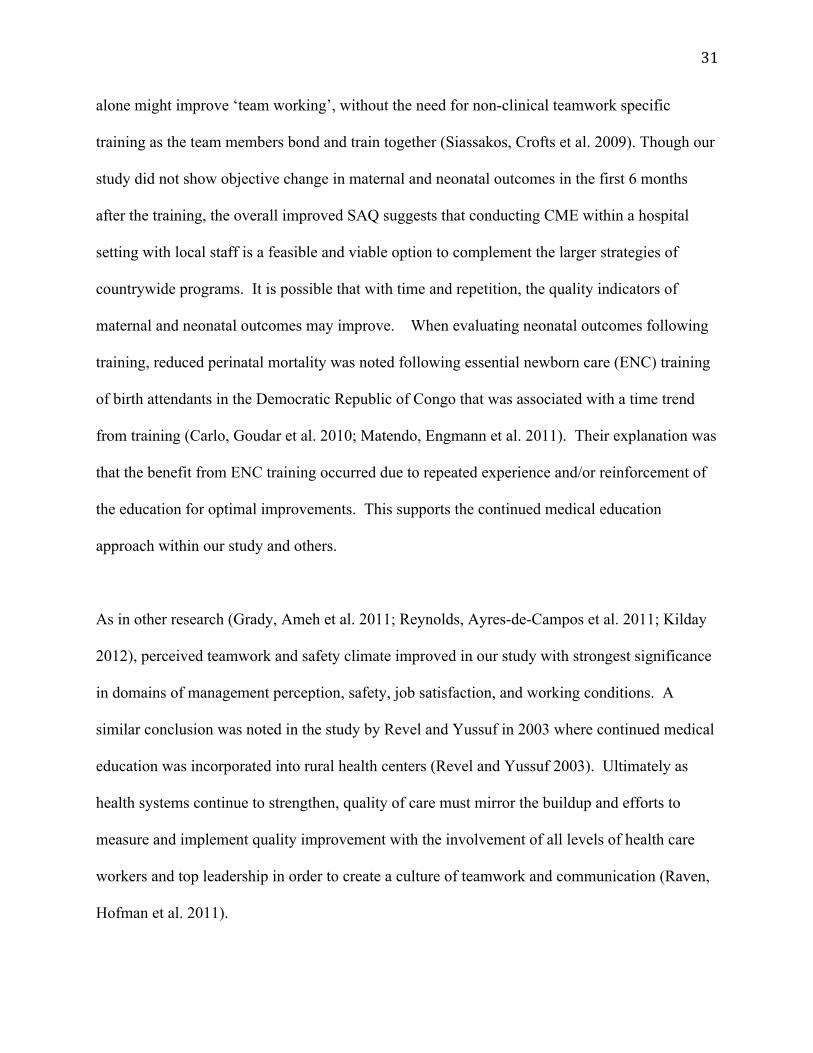
! $"!
alone might improve ‘team working’, without the need for non-clinical teamwork specific
training as the team members bond and train together (Siassakos, Crofts et al. 2009). Though our
study did not show objective change in maternal and neonatal outcomes in the first 6 months
after the training, the overall improved SAQ suggests that conducting CME within a hospital
setting with local staff is a feasible and viable option to complement the larger strategies of
countrywide programs. It is possible that with time and repetition, the quality indicators of
maternal and neonatal outcomes may improve. When evaluating neonatal outcomes following
training, reduced perinatal mortality was noted following essential newborn care (ENC) training
of birth attendants in the Democratic Republic of Congo that was associated with a time trend
from training (Carlo, Goudar et al. 2010; Matendo, Engmann et al. 2011). Their explanation was
that the benefit from ENC training occurred due to repeated experience and/or reinforcement of
the education for optimal improvements. This supports the continued medical education
approach within our study and others.
As in other research (Grady, Ameh et al. 2011; Reynolds, Ayres-de-Campos et al. 2011; Kilday
2012), perceived teamwork and safety climate improved in our study with strongest significance
in domains of management perception, safety, job satisfaction, and working conditions. A
similar conclusion was noted in the study by Revel and Yussuf in 2003 where continued medical
education was incorporated into rural health centers (Revel and Yussuf 2003). Ultimately as
health systems continue to strengthen, quality of care must mirror the buildup and efforts to
measure and implement quality improvement with the involvement of all levels of health care
workers and top leadership in order to create a culture of teamwork and communication (Raven,
Hofman et al. 2011).

! $#!
Though our study adds an important component of health systems strengthening through in-
service training, there were some limitations that affect the ability to generalize the results.
One limitation was the absence of medical midwife administrators (0%) and senior physician
(4.7%) input into the survey response; thus the training and results are not applicable for
physicians or midwife administrators within this hospital setting. There was also a lack of
active, didactic lecture attendance of the respondents with attendance of at most 53.3%. This
lack of attendance, though, wasn’t due to lack of willingness but managing work, family, and
daily living in a developing country. Ninety-seven percent of respondents would like to continue
the educational sessions at least 2x/year. There was also no remuneration, thus it was
encouraging that >50% attendance occurred and attests to the fact that continued education is
desirable and feasible in a hospital setting. The computer option provided a backup system for
continued learning but was not meant to be a replacement for active learning between residents
and staff. Another possible limitation of this study was the small sample size limited to one
maternity unit. Therefore the results may not be applicable to other maternity units, only for
midwives and associate nurses in a large, referral teaching hospital.
Therefore as developing countries work towards decreasing maternal and neonatal morbidity and
mortality, improving the quality of care within a hospital setting is imperative. The results of
this study address the potential ‘human factor’ that can contribute to maternal and neonatal
morbidity and mortality. Though short-term expert training courses have value, efforts to
develop an in-hospital clinical and education-training course will complement the other
programs and allow for constant training throughout the year along with continued reinforcement
of knowledge and skills. This method may also be a tool to further develop more formal

! $$!
teamwork specific training in the future. In a new medical education training system trying to
integrate into a service provision hospital, the opportunity for both the educators and the service
providers to learn from each other and improve quality of care should be valued. This project
has successfully shown that utilizing senior Ob/Gyn residents to implement hospital staff
developed continued medical education within a hospital setting is feasible and may be a
mechanism to create improved communication and teamwork amongst ward staff. As the
medical system develops, the Ob/Gyn graduates can then be the teachers in their assigned
regional hospitals, and extend the continued learning to a non-teaching hospital. Such a strategy
will complement the larger strategies of improving access to and encouraging deliveries at health
facilities along with improving the work environment with readily accessible supplies and
resources.

! $%!
BIBLIOGRAPHY
Adleyi, O. and R. Morrow (1996). "Concepts and methods for assessing the quality of essential
obstetric care." Int J Health Plann Manage 11(2): 119-34.
Carlo, W. A., S. S. Goudar, et al. (2010). "Newborn-care training and perinatal mortality in
developing countries." N Engl J Med 362(7): 614-23.
Charney, C. (2011). "Making a team of experts into an expert team." Adv Neonatal Care 11(5):
334-9.
Draycott, T., T. Sibanda, et al. (2006). "Does training in obstetric emergencies improve neonatal
outcome?" BJOG 113(2): 177-82.
Dynes, M., S. T. Buffington, et al. (2012). "Strengthening maternal and newborn health in rural
Ethiopia: Early results from frontline health worker community maternal and newborn health
training." Midwifery.
Goldenberg, R. L. and E. M. McClure (2009). "Reducing intrapartum stillbirths and intrapartum-
related neonatal deaths." Int J Gynaecol Obstet 107 Suppl 1: S1-3.
Grady, K., C. Ameh, et al. (2011). "Improving essential obstetric and newborn care in resource-
poor countries." J Obstet Gynaecol 31(1): 18-23.
Guise, J. M. and S. Segel (2008). "Teamwork in obstetric critical care." Best Pract Res Clin
Obstet Gynaecol 22(5): 937-51.
Hall, P. and L. Weaver (2001). "Interdisciplinary education and teamwork: a long and winding
road." Med Educ 35(9): 867-75.
Hunyinbo, K. I., A. O. Fawole, et al. (2008). "Evaluation of criteria-based clinical audit in
improving quality of obstetric care in a developing country hospital." Afr J Reprod Health 12(3):
59-70.
Kilday, D. (2012). "The Effectiveness of Combined Training Modalities on Neonatal Rapid
Response Teams." Clinical Simulation in Nursing: e1-e8.
Kongnyuy, E. J., G. Mlava, et al. (2009). "A criterion based audit of the management of
obstructed labour in Malawi." Arch Gynecol Obstet 279(5): 649-54.
Kwast, B. E. (1998). "Quality of care in reproductive health programmes: education for quality
improvement." Midwifery 14(3): 131-6.
Lawn, J. E., A. C. Lee, et al. (2009). "Two million intrapartum-related stillbirths and neonatal
deaths: where, why, and what can be done?" Int J Gynaecol Obstet 107 Suppl 1: S5-18, S19.

! $&!
Leatherman, S., T. G. Ferris, et al. (2010). "The role of quality improvement in strengthening
health systems in developing countries." Int J Qual Health Care 22(4): 237-43.
Leow, J. J., R. S. Groen, et al. (2011). "Teaching emergency and essential surgical care in Sierra
Leone: a model for low income countries." J Surg Educ 68(5): 393-6.
Mann, S., S. Pratt, et al. (2006). "Assessing quality obstetrical care: development of standardized
measures." Jt Comm J Qual Patient Saf 32(9): 497-505.
Matendo, R., C. Engmann, et al. (2011). "Reduced perinatal mortality following enhanced
training of birth attendants in the Democratic Republic of Congo: a time-dependent effect."
BMC Med 9: 93.
McDermott, J., D. Beck, et al. (2001). "Two models of in-service training to improve midwifery
skills: how well do they work?" J Midwifery Womens Health 46(4): 217-25.
Nielsen, P. E., M. B. Goldman, et al. (2007). "Effects of teamwork training on adverse outcomes
and process of care in labor and delivery: a randomized controlled trial." Obstet Gynecol 109(1):
48-55.
Nyamtema, A. S., D. P. Urassa, et al. (2011). "Maternal health interventions in resource limited
countries: a systematic review of packages, impacts and factors for change." BMC Pregnancy
Childbirth 11: 30.
Perol, D., J. P. Boissel, et al. (2002). "A simple tool to evoke physicians' real training needs."
Acad Med 77(5): 407-10.
Raven, J., J. Hofman, et al. (2011). "Methodology and tools for quality improvement in maternal
and newborn health care." Int J Gynaecol Obstet 114(1): 4-9.
Raven, J., B. Utz, et al. (2011). "The 'Making it Happen' programme in India and Bangladesh."
BJOG 118 Suppl 2: 100-3.
Revel, T. and H. Yussuf (2003). "Taking primary care continuing professional education to rural
areas: lessons from the United Arab Emirates." Aust J Rural Health 11(6): 271-6.
Reynolds, A., D. Ayres-de-Campos, et al. (2011). "Self-perceived impact of simulation-based
training on the management of real-life obstetrical emergencies." Eur J Obstet Gynecol Reprod
Biol 159(1): 72-6.
Salas, E., S. A. Almeida, et al. (2009). "What are the critical success factors for team training in
health care?" Jt Comm J Qual Patient Saf 35(8): 398-405.
Sexton, J. B., R. L. Helmreich, et al. (2006). "The Safety Attitudes Questionnaire: psychometric
properties, benchmarking data, and emerging research." BMC Health Serv Res 6: 44.

! $'!
Sexton, J. B., C. G. Holzmueller, et al. (2006). "Variation in caregiver perceptions of teamwork
climate in labor and delivery units." J Perinatol 26(8): 463-70.
Siassakos, D., J. F. Crofts, et al. (2009). "The active components of effective training in obstetric
emergencies." BJOG 116(8): 1028-32.
Spector, J. M., P. Agrawal, et al. (2012). "Improving Quality of Care for Maternal and Newborn
Health: Prospective Pilot Study of the WHO Safe Childbirth Checklist Program." PLoS One
7(5): e35151.
van Lonkhuijzen, L., A. Dijkman, et al. (2010). "A systematic review of the effectiveness of
training in emergency obstetric care in low-resource environments." BJOG 117(7): 777-87.
White, A. A. M. D., J. W. P. Pichert, et al. (2005). "Cause and Effect Analysis of Closed Claims
in Obstetrics and Gynecology." Obstetrics & Gynecology 105(5, Part 1): 1031-1038.
WHO (2007). "Strengthening Health Systems to Improve Health Outcomes: Who's Framework
for Action." WHO.
WHO, G. H. W. A. (2008). "Scaling Up, Saving Lives." GHWA Report.
Wilmoth, J., Mathers C., Say L., Mills S. (2010). "Maternal deaths drop by one-third from 1990
to 2008: A United Nations analysis." Bull World Health Organ 88: 718-718A.
! $(!
APPENDIX A1:
Personal Work Diary
Thank you for your willingness to participate in developing a sustainable educational and
teamwork training program that is specific for Labor and Delivery medical health care
professionals. In order to develop an improved understanding of your specific educational and
work related needs, we would appreciate if you would write daily notes for one week that
address issues for improving patient care in L&D (required resources, barriers to efficient work
flow, work assistance from students) and specific educational topics to complement current
knowledge (shoulder dystocia, postpartum hemorrhage, etc.). This personal diary will be utilized
as an assistance tool for you alone to more specifically fill out the L&D educational and
teamwork questionnaire where the results will be used to formulate the CME training program.
Patient Care Thoughts:
Educational Topic Thoughts:

! $)!
APPENDIX A2:
Labor and Delivery Questionnaire
Date: Variables
Serial # _____ _____ _____
#Years of experience in Ob/Gyn: _____ _____ ____
# Years worked at OMH (any ward): _____ _____ _____
#Years worked OMH/MCH1 _____ _____ _____
Have you taken any LLS courses YES NO
If YES, how many _____________________
Have you taken other educational courses relevant to L&D care YES NO
If YES, how many _____________________
Gender: Male Female
Position: Associate Nurse Midwife Physician Management
What are your top three recommendations for improving patient care in MCH1 (for example,
what do you feel would make your work more efficient, safe, and enjoyable):
1.
2.
3.
What are your top three recommendations/Topic Ideas for Continuing Medical Education (CME)
related to MCH1 (for example, what additional education would make your work more efficient,
safe, and enjoyable):
1.
2.
3.
In order to make the CME courses convenient for you, please indicate the most optimal schedule
for CME teaching/training (one hour):
Choose One Choose Day and Time
Before Duty Shift Monday AM PM
After Duty Shift Tuesday AM PM
Day Off Wednesday AM PM
Thursday AM PM
Friday AM PM
Saturday AM
Please identify up to three barriers in the current working environment of MCH1 that you feel
are barriers to improving the work environment and patient care:
1.
2.
3.
(Appendix A2 Continued)

! $*!
(Appendix A2 Continued)
Please provide up to three recommendations for incorporating students into patient care while
also accomplishing the goal of teaching and of quality patient care:
1.
2.
3.
YES NO
1. Do you feel you work well in a team? …………………………………____ ____
2. Do you prefer an individual approach to patient care? …………… ____ ____
3. Are you willing to be a team leader?........................................................____ ____
4. Can you identify another person whom you work with who has
leadership qualities?.......................................................................................____ ____
5. Do you feel learning more about a teamwork approach to patient
care would be helpful?....................................................................................____ ____
6. Are you willing to participate and learn about a teamwork system?..........____ ____
7. Have you taken this survey before?...........................................................____ ____

! %+!
APPENDIX B: ***Continued Medical Education Schedule***
For Midwives and Associate Nurses
LOCATION: OB/GYN CONFERENCE ROOM
TIME: 3:30 - 5:00 PM
DATE TOPIC RESIDENT INSTRUCTOR
April 18, MONDAY Pregnancy Physiology & Medical
Disorders (Asthma, Hypertension,
Heart Disease, Epilepsy)
Dr. Kifleyesus
April 19, TUESDAY (repeat lecture) Same lecture repeated Dr. Kifleyesus
April 20, WEDNESDAY Antepartum Hemorrhage (1st – 3
rd
trimesters), Ectopic & PostAB
care/FP
Dr. Dawit Estifanos
April 21, THURSDAY (repeat
lecture)
Same lecture repeated Dr. Dawit Estifanos
April 25, MONDAY Severe PIH/Eclampsia/Antenatal
testing
Dr. Abraham! Dr. Kifleyesus
April 26, TUESDAY (repeat lecture) Same lecture repeated Dr Abraham!Dr. Kifelyesus
April 27, WEDNESDAY Normal/Abnormal L&D Dr. Berhane
April 28, THURSDAY (repeat
lecture)
Same lecture repeated Dr. Berhane
May 2, MONDAY Neonatal Resuscitation/Newborn
Care/Breastfeed & family planning
Dr. Dawit Sereke
May 3, TUESDAY (repeat lecture) Same lecture repeated Dr. Dawit Sereke
May 4, WEDNESDAY Teratology & Basic Ultrasound Dr. Kifleyesus
May 5, THURSDAY (repeat lecture) Same lecture repeated Dr. Kifleyesus
May 9, MONDAY Reproductive tumors and Pregnancy/
Infection precaution/Anatomy basics
Dr. Dawit Estifanos
May 10, TUESDAY (repeat lecture) Same lecture repeated Dr. Dawit Estifanos
May 11, WEDNESDAY PPROM/PROM & Postterm
Pregnancy
Dr. Abraham!Dr. Berhane
May 12, THURSDAY (repeat
lecture)
Same lecture repeated Dr Abraham!Dr. Berhane
May 16, MONDAY Labor Monitoring (CTG) & EmOC Dr. Berhane
May 17, TUESDAY (repeat lecture) Same lecture repeated Dr. Berhane
May 18, WEDNESDAY Postpartum Hemorrhage/
Postoperative Care/Postpartum Care-
Patient Assessment Technique
Dr. Dawit Sereke
May 19, THURSDAY (repeat
lecture)
Same lecture repeated Dr. Dawit Sereke
June 20 FINAL Day to Complete
Educational Program for Certificate

! %"!
APPENDIX C: Post-educational Questionnaire
Post Educational Series Labor and Delivery Questionnaire
Date: __________________
Variables
Serial # _________________
#Years of experience in Ob/Gyn: _____ _____ _____
# Years worked at OMH (any ward): _____ _____ _____
#Years worked OMH/MCH1 _____ _____ _____
Have you taken any LLS courses YES NO
If YES, how many _____________________
Have you taken other educational courses relevant to L&D care YES NO
If YES, how many _____________________
Gender: Male Female
Age: ______________
Position: Associate Nurse Midwife Physician Management
Do you feel that this educational series assisted in improving patient care
in MCH1? Y N
Would you like this educational series to continue? Y N
If this educational series were to continue, how many times per year
would it be helpful? Once Two or More
Were the time and dates convenient to attend the educational series? Y N
Do you feel more empowered to teach and incorporate students in the
workflow of patient care in MCH1? Y N
Do you feel the educational series improved how you work in a team? Y N
Do you feel the educational series improved the work environment
of MCH1? Y N
Do you feel confident in the skills taught during the educational series? Y N
In your opinion, what are two continued concerns in providing quality labor and delivery
obstetric care? In your opinion, what are possible solutions to these problems?
Concern Solution
a)
b)
Have you taken the Teamwork survey before? Yes No

! %#!
Thank you for participating in this educational series and for providing information to improve
the care of the women in the Orotta Maternity Hospital.
Appendix D: Labor and Delivery Teamwork & Safety Questionnaire( SAQ)
Instructions: This survey asks for your opinions about teamwork and patient care safety in labor
and delivery. It will take you about 15 minutes to complete. Any question that you would like
further explained, please feel free to ask Dr. Susan or a Resident. If you do not wish to answer a
question, or if a question does not apply to you, you may leave your answer blank. This survey
is anonymous and not linked to any individual person.
*“Medical Error” is defined as any type of error, mistake, incident, accident, or deviation,
regardless of whether or not it results in patient harm
Please answer the following questions by circling one number on a 1-5 scale where:
1=Disagree strongly 2=Disagree 3=Neutral 4=Agree 5=Agree strongly
Scale 1- 5
1. I like my job…………………………………………………………… 1 2 3 4 5
2. I feel that my input is well received in this clinical area……………… 1 2 3 4 5
3. I would feel safe having myself or my family treated here as a patient 1 2 3 4 5
4. Medical errors* are handled appropriately in this clinical area……… 1 2 3 4 5
5. This hospital does a good job of training new personnel…………… 1 2 3 4 5
6. All the necessary information for diagnostic and therapeutic
decisions is routinely available to me…………………………… 1 2 3 4 5
7. Working in this hospital is like being part of a large family………… 1 2 3 4 5
8. The administration of this hospital is doing a good job……………… 1 2 3 4 5
9. I receive appropriate feedback about my performance………………….. 1 2 3 4 5
10. In this clinical area, it is difficult to discuss errors………………… 1 2 3 4 5
11. This hospital is a good place to work…………………………... 1 2 3 4 5
12. Fatigue impairs my performance during emergency situations
(emergency resuscitation/ hemorrhaging etc.)…………………… 1 2 3 4 5
13. The level of staffing in this clinical area are sufficient to handle
the number of patients……………………………………….…… 1 2 3 4 5
14. I am encouraged by my colleagues to report any patient safety
concerns I may have……………………………………………… 1 2 3 4 5
15. The culture in this clinical area makes it easy to learn from
the errors of others……………………………………………….. 1 2 3 4 5
16. This hospital deals constructively with problem physicians
and staff…………………………………………………………… 1 2 3 4 5
17. In this clinical area, it is difficult to speak up if I perceive a
problem with patient care………………………………………… 1 2 3 4 5
18. When my workload becomes excessive, my performance
is impaired………………………………………………………... 1 2 3 4 5
(Survey Continued)

! %$!
(Continued) 1=Disagree strongly 2=Disagree 3=Neutral 4=Agree 5=Agree strongly
Scale 1- 5
19. I am provided with adequate, timely information about events
in the hospital that might affect my work………………………… 1 2 3 4 5
20. I know the proper channels to direct questions regarding patient
safety in this clinical area………………………………………… 1 2 3 4 5
21. I am proud to work at this hospital………………………………….. 1 2 3 4 5
22. Disagreements here are resolved appropriately
(ie. Not Who is right but What is best for the patient)…………… 1 2 3 4 5
23. I am less effective at work when fatigued…………………………… 1 2 3 4 5
24. I am more likely to make errors in tense or hostile situations……….. 1 2 3 4 5
25. I have the support I need from other personnel to care
for patients……………………………………………………….. 1 2 3 4 5
26. It is easy for personnel in this clinical area to ask questions
when there is something that they do not understand……………. 1 2 3 4 5
27. Disruptions in the continuity of care (ie, shift changes,
patient transfers) can be detrimental to patient safety……………. 1 2 3 4 5
28. During emergencies, I can predict what other personnel are
going to do next…………………………………………………... 1 2 3 4 5
29. Decision making in this clinical area utilizes input from relevant
personnel…………………………………………………………. 1 2 3 4 5
30. Trainees in my discipline are adequately supervised………….. 1 2 3 4 5
31. I feel burned out from my work……………………………………... 1 2 3 4 5
32. Important issues are well communicated at shift changes…………… 1 2 3 4 5
33. There is widespread adherence to clinical guidelines and
evidence-based criteria regarding patient safety/care here………. 1 2 3 4 5
34. I feel frustrated by my job…………………………………………… 1 2 3 4 5
35. I feel I am working too hard on my job……………………………… 1 2 3 4 5
36. Personnel frequently disregard rules or guidelines (ie handwashing,
treatment protocols/clinical pathways, sterile field) that are
established for this clinical area……………………………. 1 2 3 4 5
37. Communication breakdowns which lead to delays in
starting surgical procedures are common………………………... 1 2 3 4 5
38. The physicians, midwives, nurses, health associates and other affiliated
staff in this clinical area work together in a well coordinated
team………………………………………………………… 1 2 3 4 5
39. I am frequently unable to express disagreement with physicians…… 1 2 3 4 5
40. I know the first and last names of all the personnel I worked with
during my last shift………………………………………….…. 1 2 3 4 5

! %%!
APPENDIX E: Adverse Event Score Analysis
Adverse Outcome Index: Total deliveries with one or more events per unit time / Total
deliveries per unit time x 100 = AOI %
Weighted Outcome Index: Summation of total specific events x weight specific score / Total
deliveries per unit time = WOI
Severity Index: Weighted Outcome Index / Total deliveries with one or more events per unit
time = SI

! %&!
APPENDIX F: Consent Form
Orotta’s School of Postgraduation Medical Education / University of Washington
Oral Consent Form
“Teamwork Approach in Labor and Delivery: Method to Improve Maternal and Neonatal Outcomes at
Orotta Maternity Hospital”
Researchers: Dr. Susan Marzolf, Dr. Berhane Zekarias, Dr. Abraham Yohannes, Dr. Kifleyesus Tedla,
Dr. Dawit Stefanos, Dr. Dawit Sereke
Researcher’s Statement
We are asking you to be in a research study. The purpose of this oral consent form is to give you the
information you will need to help you decide whether to be in the study or not. You may ask any
questions about the purpose of the research, what we would ask you to do, the possible risks and benefits,
your rights as a volunteer, and anything else about the research that is not clear. When we have answered
all your questions, you can decide if you want to be in the study or not. This process is called “informed
oral consent.”
Purpose of the Study
The primary purpose of the study is to develop a continuing medical educational program for midwives
and medical staff affiliated with labor and delivery utilizing the Ob/Gyn residents as the primary teachers.
The midwives and medical staff will choose the topics for discussion and then utilizing teamwork
approach, a series of didactics and hands-on activities will be developed. This educational series will
span 3 months with each educational seminar lasting 60 minutes, one time per week. Total time
commitment will be about 12 hours. One week prior to the start of the program, each consented person
will be asked to fill out a personal diary to catalogued issues that come up that one feels would be
important to improve the care of the patient. For example, shoulder dystocia and no additional help
available. The first session then will be a questionnaire to identify educational topics of importance for
continued education and also identify issues that may improve the working conditions in labor and
delivery, using the diary you developed for your personal use to bring attention to important topics of
discussion/improvement. In addition a teamwork questionnaire will be given to assist in understanding
current teamwork approach. Any questions that you may feel uncomfortable answering may be left
unanswered.
Risks, Stress, or Discomfort
Since the educational series will require time commitment on your off duty hours, you may feel additional
stress or discomfort as work plus normal daily activities will still occur. Please know that if you are
unable to attend one or more session due to other personal issues, we will work with you to obtain the
missed educational session information in paper format and/or soft copy format. In additional, please
know that this educational series is voluntary and you may choose which sessions to attend or not attend.
Alternatives to taking part of Study
If you choose to not partake in this study, you may still attend any or all of the educational sessions
except you will not be asked to fill out the diary or questionnaires.
Other Information
You may refuse to participate and you are free to withdraw from this study at any time without penalty or
loss of benefits to which you are otherwise entitled. All data collected will be anonymous. Dr. Susan
(07-25-33-52) or Dr. Berhane (07-12-13-86) may be reached for questions any time during the study.

! %'!
Appendix G: Pre- and Post-SAQ Questions with % missing for each question.
Mean Responses to SAQ Before and After CME
PRE-SAQ POST-SAQ
RESPONSES (n=45) RESPONSES (n=43)
Domain Reverse %Missing %Missing
1. I like my job…………………………………… J No 0% 0%
2. I feel that my input is well received in
this clinical area………………………………….. T No 2.2% 4.7%
3. I would feel safe having myself or my family
treated here as a patient ………………………….. S No 4.4% 7.0%
4. Medical errors* are handled appropriately in
this clinical area………………………………….. S No 4.4% 7.0%
5. This hospital does a good job of training new
personnel…………………………………………. W No 4.4% 0%
6. All the necessary information for diagnostic and
therapeutic decisions is routinely available to me… W No 2.2% 4.7%
7. Working in this hospital is like being part
of a large family…………………………………… J No 6.7% 0%
8. The administration of this hospital is doing
a good job………………………………………… PM No 2.2% 2.3%
9. I receive appropriate feedback about
my performance…………………………………… S No 6.7% 4.7%
10. In this clinical area, it is difficult
to discuss errors…………………………………… S Yes 4.4% 4.7%
11. This hospital is a good place
to work…………………………............................. J No 4.4% 2.3%
12. Fatigue impairs my performance during
emergency situations (emergency
resuscitation/ hemorrhaging etc.)………………… SR No 8.9% 9.0%
13. The level of staffing in this clinical area
are sufficient to handle the number of patients. PM No 2.2% 0%
14. I am encouraged by my colleagues to report
any patient safety concerns I may have…………… S No 6.7% 0%
15. The culture in this clinical area makes it
easy to learn from the errors of others…………… S No 8.9% 4.7%
16. This hospital deals constructively with
problem physicians and staff……………………… W No 2.2% 4.7%
17. In this clinical area, it is difficult to
speak up if I perceive a problem with patient care.. T Yes 6.7% 2.3%
18. When my workload becomes excessive,
my performance is impaired……………………… SR No 0% 0%
19. I am provided with adequate, timely information
about events in the hospital that might affect
my work……………………………………………. PM No 0% 2.3%
20. I know the proper channels to direct questions
regarding patient safety in this clinical area……… S No 8.9% 4.7%
21. I am proud to work at this hospital…………… J No 4.4% 2.3%
22. Disagreements here are resolved appropriately
(Not Who is right but What is best for the patient).. T No 2.2% 4.7%
23. I am less effective at work when fatigued… SR No 0% 7.0%
(Mean Responses Continued)

! %(!
(Continued) Mean Responses to SAQ Before and After CME
PRE-SAQ POST-SAQ
RESPONSES (n=45) RESPONSES: (n=43)
Domain Reverse %Missing %Missing
24. I am more likely to make errors in tense
or hostile situations……………………………….. SR No 2.2% 7.0%
25. I have the support I need from other personnel
to care for patients……………………………… T No 0% 0%
26. It is easy for personnel in this clinical area to
ask questions when there is something that they
do not understand……………. …………………. T No 0% 0%
27. Disruptions in the continuity of care
(ie, shift changes,patient transfers) can be detrimental
to patient safety………………………………….. T No 0% 2.3%
28. During emergencies, I can predict what other
personnel are going to do next…………………… T No 2.2% 0%
29. Decision making in this clinical area utilizes
input from relevant personnel…………………… T No 8.9% 9.0%
30. Trainees in my discipline are adequately
supervised……………………………………….. W No 13.3% 7.0%
31. I feel burned out from my work……………. SR Yes 6.7% 2.3%
32. Important issues are well communicated at
shift changes…………………………………… T No 4.4% 4.7%
33. There is widespread adherence to clinical
guidelines and evidence-based criteria regarding
patient safety/care here………. ………………….. S No 11.1% 11.6%
34. I feel frustrated by my job……………………. J Yes 4.4% 2.3%
35. I feel I am working too hard on my job……… J Yes 2.2% 2.3%
36. Personnel frequently disregard rules or
guidelines (handwashing, treatment protocols/
clinical pathways, sterile field) that are established
for this clinical area……………………………… S Yes 2.2% 2.3%
37. Communication breakdowns which lead to
delay in start surgical procedures are common. S Yes 11.1% 7.0%
38. The physicians, midwives, nurses, health
associates and other affiliated staff in this clinical
area work together in a well coordinated team…… T No 2.2% 4.7%
39. I am frequently unable to express disagreement
with physicians…………………………………….. T Yes 6.7% 11.6%
40. I know the first and last names of all the
personnel I worked with during my last shift…… T No 2.2% 0%

! %)!
Appendix H: Sensitivity Analysis:
DESCRIPTIVE TABLE Compare Missing Variables: 2009 (n=27 missing) (n=10
anomaly) (n=3 Both)
Data Analysis Missing Anomaly
Age 18-45 16-36 20-39
BW (gm) 2000-5400 2100-4100 2300-3800
Gender 81- male 18 –male 6-male
76-female 14- female 4-female
Mode of Delivery DATA Missing Anomaly
*Vaginal 118 28 9
*OpVag 6 1 0
*CS 33 4 1
*BW miss= 4 removed (affects removal of 1 NND with low APGAR, affects 1 unknown SB,
affects 2 NNT with low APGAR
DESCRIPTIVE TABLE Compare Missing Variables: 2010 (n= 63 missing) (n= 11
anomaly) (n= 7 Both)
Data Analysis Missing Anomaly
Age 17-44 18-45 20-40
BW (gm) 2000-4700 2000-4500 2300-4700
Gender 108- male 45 –male 8-male
74-female 28- female 10-female
Mode of Delivery DATA Missing Anomaly
*Vaginal 121 54 13
*OpVag 13 2 0
*CS 48 18 5
*4 BW and 2 APGAR missing: affects one IP death with missing BW, one NNT with no
APGAR, affects 2 NNT with low APGAR, affects one unknown SB,
DESCRIPTIVE TABLE Compare Missing Variables: 2011 (n= 52 missing) (n= 18
anomaly) (n= 8 Both)
Data Analysis Missing Anomaly
Age 15-45 16-39 19 -43
BW (gm) 2000-4200 2000-4500 2200-4200
Gender 100- male 36 –male 14-male
76-female 24- female 12-female
Mode of Delivery DATA Missing Anomaly
*Vaginal 130 45 15
*OpVag 4 1 0
*CS 42 14 11
No missing BW or APGAR
(Appendix H: Continued)

! %*!
(Appendix H: Continued)
Missing Data Summary (anomaly removed):
Year Missing/%
2009 27 /177 = 15.2%
2010 63/234 = 26.9%
2011 52 /210 = 24.7%
Number/Total Event (%)
Stillbirth data missing: 2009 16/71= 22.5%
2010 15/54= 27.7%
2011 6/46= 13.0%
NNT Data Missing: 2009 11/105= 10.5%
2010 47/171= 27.5% (most APGAR > 7: #38—reflect
increase in NNT due to new protocol but not necessarily reflect worse outcomes for neonatal—
likely infants transferred but not ‘officially’ admitted to NICU and therefore, final outcome not
documented: Therefore only 9 missing with APGAR < 7)
2011 46/160= 28.8% (Again, 35 of missing NNT had
APGAR >7, indicating improved neonatal transfer per protocol but not necessarily poor
outcomes. Only 11 true missing with APGAR < 7)
APGAR5 Missing: 2009 0/79 = 0%
2010 1/60 = 1.7%
2011 0/65 = 0%
Observation Total Delivery Log (Events analyzed with removal of anomaly & Removal of SB
missing*)
YEAR #Delivery IP NND NNT APGAR5 AOI WOI SI
2009 n=161* 4252 24 9 105 79 3.8% 4.43 117
2010 n= 219* 4813 14 7 171 59 4.5% 3.30 72.4
2011 n=206* 4426 16 6 160 65 4.7% 3.62 77.8
Observation Total Delivery Log (Events analyzed with removal of anomaly & Removal of
SB + NNT missing*)
YEAR #Delivery IP NND NNT APGAR5 AOI WOI SI
2009 n=150* 4252 24 9 94 79 3.5% 4.34 123.1
2010 n= 172* 4813 14 7 124 59 3.6% 2.95 82.6
2011 n=160* 4426 16 6 114 65 3.6% 3.26 90.1
*MD=Maternal Death
*BldTx=Blood Transfusions
*IP=Intrapartum fetal death
*NND=Neonatal death < 7 days
*NNT=Neonatal transfer from L&D to neonatal intensive care with birthweight > 2000 grams
*APGAR<7= 5-minute APGAR < 7
*DH=any neonatal transfer that was discharged home
!
!

! &+!
Appendix I: Total Monthly Outcome Events for Maternal and Neonatal Outcomes
DESCRIPTIVE TABLE: 6- MONTHLY RECORDED EVENTS 2009-2011
Year Del Total Month MD Bldtx IP NND NNtx APGAR5
2009 655 Jan 2 14 1 0 9 4
652 Feb 1 23 6 3 13 11
711 March 0 19 5 3 22 17
696 April 0 19 6 1 18 14
727 May 0 28 1 2 22 15
811 June 0 24 5 0 21 18
4252 3 127 24 9 105 79
2010 800 July 1 27 6 1 26 7
769 Aug 0 38 0 0 34 8
748 Sept 0 29 3 0 32 8
964 Oct 2 39 1 1 24 13
806 Nov 0 46 2 3 30 15
726 Dec 1 50 2 2 25 9
4813 4 229 14 7 171 60
2011 686 July 1 25 3 0 15 3
683 Aug 1 39 4 1 21 8
695 Sept 0 18 1 0 29 7
854 Oct 1 42 4 2 26 13
788 Nov 1 37 2 2 29 19
720 Dec 0 28 2 1 40 15
4426 4 189 16 6 160 65
!
!
!
!
!
!
!
!
!
!