technical advisory cell summary of advice...2020/10/30 · technical advisory cell: summary brief...
TRANSCRIPT

getting
Technical Advisory Cell
Summary of advice
30th October 2020
© Crown copyright 2020
TAC ADVICE ONLY NOT WELSH GOVERNMENT POLICY
Page 2 of 15
Technical Advisory Cell: Summary Brief
30th October 2020
Top-line summary
It is estimated by SAGE that infections could be growing by between 1% and 3% per day. The most recent estimate of the Reproduction number (Rt) for Wales from SAGE is predicted to be between 1.0 and 1.3.
Cases, hospital occupancy and deaths have increased since last week.
Two of the circuit breaker indicators related to transmission have been breached for more than five weeks. Hospital occupancy indicators highlight there is an insufficient number of critical care beds and/or staff to sustain a large COVID-19 outbreak, in addition to existing non-COVID-19 treatments.
According to estimates from the Office for National Statistics COVID-19 Infection study, approximately 1 person in every 120 of the community population in Wales had COVID-19 in the week 17 – 23 October. This has increased from 1 person in every 180 reported since last week.
All mobility data shows very large falls since the firebreak started, with mobility returning to levels last seen in May in some cases. The local lockdowns had reduced mobility, but the firebreak is having a much greater effect. While care should be taken when interpreting self-reported data, survey data indicates mostly similar individual adherence and understanding of current measures.
Due to the inherent lag between exposure to the virus and becoming a confirmed case, the impact of the fire-break on surveillance indicators would not be expected to be seen for at least 2-3 weeks following this period.
A new, simpler, national approach, with sustainable changes in behaviour in many areas of life is needed in order for Rt to remain as near to 1 as possible.
Papers from SAGE considered by the Technical Advisory Cell and Group are published here.

TAC ADVICE ONLY NOT WELSH GOVERNMENT POLICY
Page 3 of 15
Circuit breaker indicators
Transmission
Circuit breaker one: The upper limit of the range of R values for Wales reaches or exceed 1.5, current estimated value from PHW 1.3, SPI-M consensus 1-1.3. PHW and SMI-M consensus, estimates are no longer breached but growth is still expected.
Circuit breaker two: > 40 Cases per 100k (7 day rolling sum), current estimated value 260 per 100,000 (7 day rolling sum), breached since 17 September 2020.
Circuit breaker three: Positivity rate > 5%, current estimated value 19.5%, breached since 27 September 2020.
Two of the circuit breaker indicators related to transmission have been breached for more than five weeks – suggesting that the number of cases is likely to be uncontrolled and the number of cases is likely to continue growing exponentially. It should be noted that the impact of the firebreak on transmission is unlikely to be observed until 21-28 days post its introduction.
Data correct as of 30 October 2020.
Hospital occupancy
Circuit breaker four: Total hospital bed occupancy for confirmed COVID-19 patients reaches or exceeds 500, currently 754, breached, and still increasing, since 23 October 2020.
Circuit breaker five: If the critical care occupancy for confirmed COVID-19 patients reaches or exceeds 70, currently 43 but increasing, not breached.
Circuit breaker six: The total critical care bed occupancy (for COVID and non COVID patients) is above 150, currently 152 but increasing slightly, breached since 29 October.
Supporting indicators on; number of patients on mechanical ventilators has decreased slightly to 111 and number of patients on Continuous Positive Airway Pressure (CPAP) has increased to 56.
These indicators highlight that general hospital bed occupancy for COVID patients is both high and increasing. Total critical care occupancy is also just above the circuit breaker threshold, however this is not largely due to COVID patients. When considered together, there is an insufficient number of critical care beds and/or staff to sustain a large COVID outbreak, in addition to existing non-COVID treatments. It should be noted that the impact of the firebreak on hospital bed occupancy is unlikely to be observed until 21-28 days post its introduction.
Data correct as of 2 November 2020

TAC ADVICE ONLY NOT WELSH GOVERNMENT POLICY
Page 4 of 15
Growth rate and Reproduction number
The current daily growth rate is estimated by SAGE (28th October) to be between 0.01 and 0.05 in Wales, indicating that infections could be increasing by between 1% and 5% per day.
The most recent estimate of the Reproduction number (Rt) for Wales from SAGE (28th October) is predicted to be between 1.0 and 1.3. The estimate of Rt is shown as a range without a central estimate.
Care should still be taken when interpreting Rt and growth rate estimates for the UK, due to their inherently lagged nature, and as these figures mask variation in the number of infections and how rates of transmission are changing in some parts of the country. Availability of testing may also be a constraint.
A growth rate that is lower but still positive, or an Rt number above 1, continues to indicate that the epidemic is growing exponentially.
Doubling time
SAGE estimates doubling times for new infections across the UK to be between 18 and 27 days. There are continued difficulties in interpreting testing data and so estimates of doubling times remain uncertain. There is significant heterogeneity across geographies and the potential for faster doubling times in certain areas.
Age profile
The Figure below shows the number of confirmed COVID-19 episodes per 100,000 population, by week of sample collection and age group. Cases have been increasing in all age groups, with a continued increase in the number of cases seen in older age groups.
Enhanced testing associated with incidents in university settings may have increased case-ascertainment in the 18-25 age-group.

TAC ADVICE ONLY NOT WELSH GOVERNMENT POLICY
Page 5 of 15
Source: Welsh Government dashboard, data from Public Health Wales as at 02/11/20
Deaths
According to provisional death certificate data provided by the Office for National Statistics, there were 47 COVID-19 deaths in Welsh residents registered with COVID-19 mentioned on the death certificate during week 42 (ending 16 October). This has increased by 10 from the previous week.
The weekly number of all cause deaths in Wales is at levels expected for this time of year, with no significant excess in all-cause mortality reported.
The Figure below shows the weekly number of COVID-19 deaths (any mention on the death certificate) and 5-year average (2015-2019), week ending 3 January 2020 (Week 1) to week ending 16 October 2020 (Week 42).
Source: Public Health Wales
International update
The general deterioration in Europe is continuing on from last week. In virtually all areas and countries, the number of cases is rising although this is not reflected universally in hospital bed and ICU occupancy rates – there are one or two exceptions. Regarding deaths, the death rate is creeping up across all areas and is rising very rapidly in some east European countries.
TAC ADVICE ONLY NOT WELSH GOVERNMENT POLICY
Page 6 of 15
After a pause in the rise of cases through early October, Spain is again seeing cases rise in most areas. During the ‘pause’ mentioned above, the rise in death rate slowed but did not reverse. It is expected that deaths will follow the rise in cases. Positivity of tests is about 12%.
France is experiencing a similar pattern to Spain with an inexorably rising number of cases and slow but steady rise in death rate. Positivity of tests is 12% to 13%.
Italy is showing similar patterns to France and Spain but with a slight delay of about 2 weeks, but already its positivity rate is up to 10% having risen by a factor of 3 since early October.
Luxembourg, Portugal, Belgium (severely), Netherlands (severely), Norway (less severely), Ireland, Germany (less severely), Denmark (less severely) are all showing similar patterns to Spain and Italy.
What is notable is the above mentioned countries are not showing equally large rises in death rates; although there is a very muted rise at present in these countries, they are not close to the death rates experienced in March and April. Most of these countries experienced a severe situation in the first wave, unlike the countries described below.
The countries in eastern Europe – Hungary, Czechia, Slovakia, Romania, Bulgaria, the Balkan States, Greece and to a lesser extent the Baltic States are all experiencing very rapid rises in the number of cases and the number of deaths with some countries (Czechia, Slovakia, Hungary, Romania, Poland) equal to or exceeding current death rates in Spain and France. What is worrying is the shape of the death rate curves in these countries, i.e. the curves are rising much faster than in west European countries suggesting that their death rates will match the levels experienced in April in Spain, France and UK.
These east European countries experienced minimal or very modest first waves (in March, April and May) compared to west European countries and their current rapidly rising death rates suggest that their populations are more ‘exposed’, either because of a greater proportion of more susceptible people, or because their health care systems are less well prepared.
France has announced a major escalation in its lockdown measures which will take effect immediately. Germany has announced a more modest national tightening of controls which will take effect on Monday 2nd November. It is clear that most countries across Europe are very worried and are in danger of losing any semblance of control. Not all hope is lost though, Israel has demonstrated that control and a large reduction in cases and deaths is still achievable but only by imposing a draconian and month-long lockdown.
The map below shows the 14-day average incidence rate per 100,000 people for weeks 42-43. As last week, it is clear that in many regions, the incidence has risen to over 120 cases per 100,000 people and to over 240 cases per 100k people in a rising number of areas.
Data on the picture across Europe, including caveats around data lags and variable testing policies is available here.

TAC ADVICE ONLY NOT WELSH GOVERNMENT POLICY
Page 7 of 15
Adherence and understanding of current measures
The most recent IPSOS MORI data for the period 23–28 October for Wales shows mostly similar results to 2 weeks ago for a number of key mitigating behaviours. The largest change was in the percentage who said they were only leaving home for essential trips which increased from 46% to 57%. It should be noted that this is self-reported adherence and will be affected by individuals understanding of the rules and the circumstances that apply to them. The survey also covered the introduction of the firebreak period.
The figure below represents data collected online by IPSOS MORI as part of a multi-country survey on the Global Advisor platform. Each of the waves has included c.600 respondents in Wales. The sample is broadly representative of the adult population aged 16-74. Data is weighted to reflect the age and gender profile of the Welsh population aged 16-74. All samples have a margin of error around them. For a sample of around 500, this is +/- 4.8 percentage points.

TAC ADVICE ONLY NOT WELSH GOVERNMENT POLICY
Page 8 of 15
The latest results from the Public Engagement Survey on Health and Wellbeing during Coronavirus Measures for the period 19-25 October show that 58% of people say they understand the restrictions in their local area ‘very well’. This is up from 48% in the previous survey (5-11 October). A further 32% reported understanding the restrictions ‘fairly well’. The results also show that 47% of people said they were following coronavirus restrictions ‘completely’ and a further 42% reported majority compliance. This is similar to the previous survey and is in-line with results from the covid social study.
Mobility
Much of the mobility data for Wales covers the first few days after the firebreak on 23 October (with the exception of the O2 data, which covers to the 23
October). All the data shows very large falls since the firebreak started – with mobility back to levels last seen in May in some cases. The local lockdowns had reduced mobility, but the firebreak is having a much greater effect. Mobility in the UK shows small reductions (mostly) in the last week.
Mobility of Facebook users in Wales shows large reductions for the week to the 31 October, with movement 35% below the baseline, down from 12% the week to the 23 October. The percentage of users staying put (near to home) was 37% – up from 25% for the week up to the 23 October. Both of these measures are similar to levels seen at the end of May. The baseline is the average value, for the corresponding day of the week, during the 4-week period 2 February – 29 February 2020.

TAC ADVICE ONLY NOT WELSH GOVERNMENT POLICY
Page 9 of 15
Apple data for the week to the 31 October shows that requests for driving directions in Wales are down significantly compared to the week to the 23 October at 68% of the baseline (down from 88%). This is the lowest since the end of May. Requests for walking directions and requests for public transport directions have both fallen sharply over the same period. The baseline is the 13th of January 2020.
The Google mobility data to the week of the 27 October shows increases in residential in the last week (i.e people spending more time at home than last week, up to 13% above the baseline from 9%) and decreases in all other categories. Over the weekend of the 24/25 October, the residential category was at its highest for a weekend since the 23/24 May. Retail and recreation was its lowest since the weekend of the 9/10 May.
The figure below shows the change in mobility in Wales using Google mobility data. The figures are based on the average of the local authorities that have data. The baseline is the median value, for the corresponding day of the week, during the 5-week period Jan 3–Feb 6, 2020. The data for several categories is not available for August 17th – September 10th due to the data not meeting quality thresholds.
Anonymised and aggregated mobile phone data from O2 to the 23rd October has shown that following the introduction of the local lockdowns there were notable falls in trips in all areas the first 2 days after the lockdown started. However trips in those areas have (on average) gradually returned to around pre-local lockdown levels a month after the lockdowns had started. Note that due to the different timings of the introduction of the local lockdowns, this does not mean that all areas were back to pre-lockdown levels as some were introduced more recently than others.
TAC ADVICE ONLY NOT WELSH GOVERNMENT POLICY
Page 10 of 15
Trips in Wales show a small increase in the last week, whilst the UK shows a small decrease. Over much of the summer trips were similar in Wales and the UK relative to March, but are lower in Wales since the local lockdowns started – around 26% lower than they were in the first week March compared to 22% in the UK.
Research
There are currently 6172 Welsh patients recruited to COVID-19 urgent public health studies, an increase of 188 in last 7 days.
COVID-19 weekly surveillance and epidemiological summary from Public Health Wales
(As at 28th October 2020)
The proportion of calls to NHS 111 and NHS direct related to possible COVID-19 symptoms remained stable compared to the previous week.
GP consultations for Acute Respiratory Infection (ARI) decreased in week 43 and consultations for suspected COVID-19 remained stable.
Ambulance calls possibly related to COVID-19 are currently stable.
The number of laboratory confirmed COVID-19 episodes increased nationally compared to the previous week and testing positivity was over 15%.
During week 43, incidence increased across all age groups, incidence was highest in those age 18-25.
Confirmed case incidence and testing episode positivity continue to rise in many health board regions of Wales.
Confirmed case admissions to hospitals and confirmed cases who are inpatients in hospital have increased in recent weeks, particularly in Cwm Taf Morgannwg health board.
Recent surveillance data suggest that COVID-19 infections in Wales are geographically widespread, with the majority of local authority (LA) areas experiencing increasing trends in confirmed case incidence and percentage of testing episodes positive for SARS-CoV2.
There are increasing numbers of incidents reported, mainly in residential care homes, school settings and university students.
Following increases in COVID-19 across all regions of Wales, a Wales-wide ‘fire-break’ restriction on non-essential travel outside the home was introduced on Fri 23 Oct and will be in place until Mon 9 Nov.

TAC ADVICE ONLY NOT WELSH GOVERNMENT POLICY
Page 11 of 15
Incidents continue in young adults of university student age with reports of transmission in shared accommodation. Increasing trends in most other age-groups have been observed within the past two weeks.
All-cause deaths are at seasonally expected levels. Increases in deaths in confirmed cases in hospital have been seen.
Hospital occupancy
The Figure below shows the confirmed COVID-19 hospital occupancy over the first and second wave of the pandemic (7 day rolling average, as at 26th October). Total hospital bed occupancy for confirmed COVID-19 patients has been rising and has exceeded the agreed ‘circuit breaker’ of 500 patients.
The Figure below shows the confirmed COVID-19 intensive care unit (ICU) occupancy over the first and second wave of the pandemic (7 day rolling average, as at 26th October). Covid-related ICU occupancy has not yet reached the ‘circuit breaker’ threshold, but is showing an upward trend. Total critical care bed occupancy (for COVID and non COVID patients) is just above the agreed circuit breaker, but increasing slightly.
TAC ADVICE ONLY NOT WELSH GOVERNMENT POLICY
Page 12 of 15
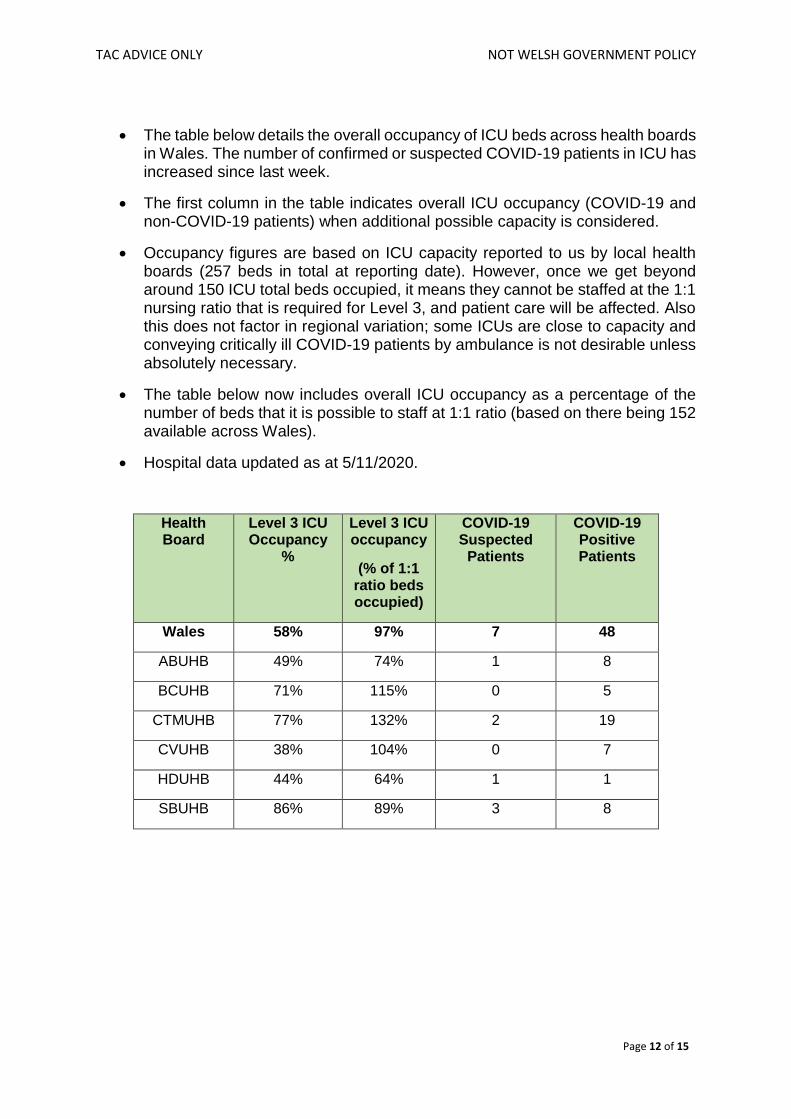
The table below details the overall occupancy of ICU beds across health boards in Wales. The number of confirmed or suspected COVID-19 patients in ICU has increased since last week.
The first column in the table indicates overall ICU occupancy (COVID-19 and non-COVID-19 patients) when additional possible capacity is considered.
Occupancy figures are based on ICU capacity reported to us by local health boards (257 beds in total at reporting date). However, once we get beyond around 150 ICU total beds occupied, it means they cannot be staffed at the 1:1 nursing ratio that is required for Level 3, and patient care will be affected. Also this does not factor in regional variation; some ICUs are close to capacity and conveying critically ill COVID-19 patients by ambulance is not desirable unless absolutely necessary.
The table below now includes overall ICU occupancy as a percentage of the number of beds that it is possible to staff at 1:1 ratio (based on there being 152 available across Wales).
Hospital data updated as at 5/11/2020.
Health Board
Level 3 ICU Occupancy
%
Level 3 ICU occupancy
(% of 1:1 ratio beds occupied)
COVID-19 Suspected
Patients
COVID-19 Positive Patients
Wales 58% 97% 7 48
ABUHB 49% 74% 1 8
BCUHB 71% 115% 0 5
CTMUHB 77% 132% 2 19
CVUHB 38% 104% 0 7
HDUHB 44% 64% 1 1
SBUHB 86% 89% 3 8

TAC ADVICE ONLY NOT WELSH GOVERNMENT POLICY
Page 13 of 15
The Figure below shows the total number of people who have tested Covid-19 positive and are in ICU in hospitals across the different health boards in Wales.
The Figure below shows the number of people admitted to hospital and are either suspected or confirmed as having Covid-19. The purple line represents the total number over a rolling 7 day average, whilst the fainter grey lines show the actual figures at that time.
TAC ADVICE ONLY NOT WELSH GOVERNMENT POLICY
Page 14 of 15
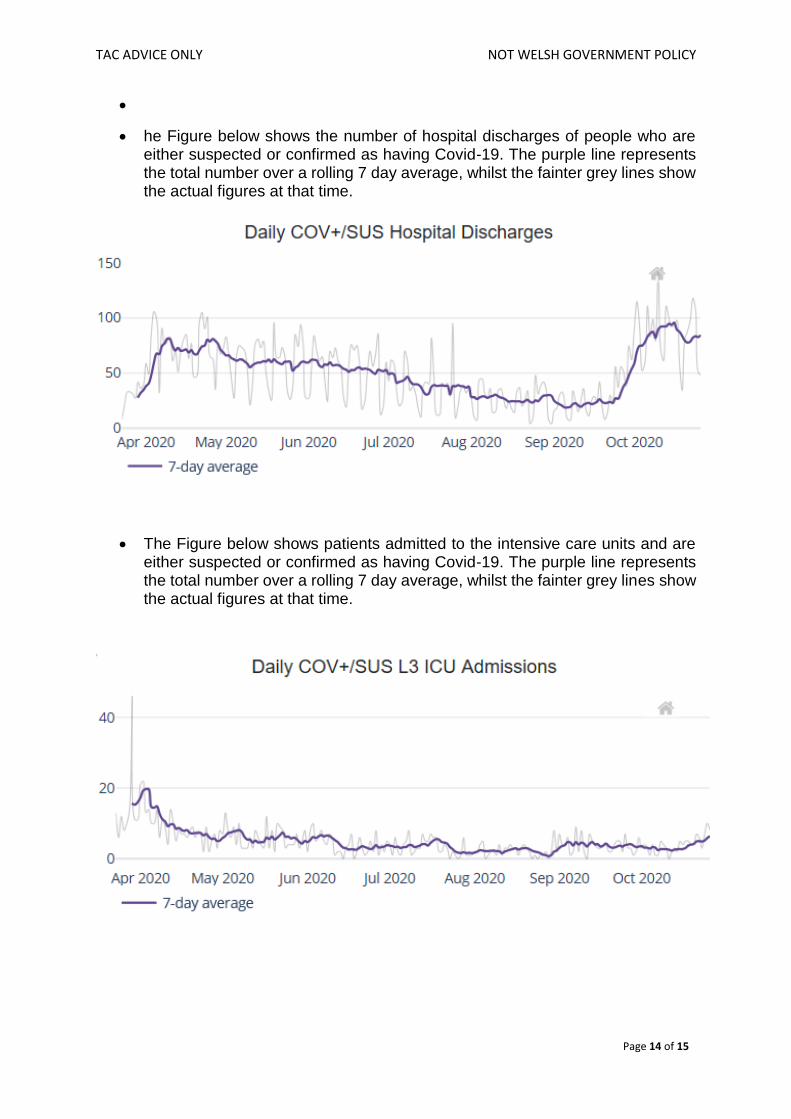
he Figure below shows the number of hospital discharges of people who are either suspected or confirmed as having Covid-19. The purple line represents the total number over a rolling 7 day average, whilst the fainter grey lines show the actual figures at that time.
The Figure below shows patients admitted to the intensive care units and are either suspected or confirmed as having Covid-19. The purple line represents the total number over a rolling 7 day average, whilst the fainter grey lines show the actual figures at that time.

TAC ADVICE ONLY NOT WELSH GOVERNMENT POLICY
Page 15 of 15
Professional Head of Intelligence Assessment (PHIA) probability yardstick
Where appropriate, TAC advice will express Likelihood or confidence in the advice provided using the PHIA probability yardstick to ensure consistency across the different elements of advice.