technical appendix 6: ornithology - buccleuch wind farm environmental statement hopsrig wind farm...
TRANSCRIPT

Hopsrig Wind Farm Environmental Statement
Hopsrig Wind Farm Limited
Volume 4: Technical Appendices TA 6: Ornithology Ramboll Environ
Technical Appendix 6: Ornithology TA 6.1 Ornithology

Hopsrig Wind Farm Environmental Statement
Hopsrig Wind Farm Limited
Volume 4: Technical Appendices TA 6: Ornithology Ramboll Environ
Technical Appendix 6.1: Ornithology

HOPSRIG WIND FARM ORNITHOLOGY Appendix 6.1
Prepared: Sarah Sanders Reviewed: Mark Trinder Date: 03 November 2016 Tel: 0141 342 5404 Web: www.macarthurgreen.com Address: 95 South Woodside Road | Glasgow | G20 6NT
Document Quality Record.
Version Status Person Responsible Date 1.0 Draft Sarah Sanders 11/10/2016 1.1 Reviewed Mark Trinder 02/11/2016 1.2 Updated Sarah Sanders 03/11/2016

Hopsrig Wind Farm ES Volume 4: Technical Appendices TA 6.1: Ornithology
1 | P a g e
CONTENTS
CONTENTS ...........................................................................................................................................1
FIGURES ............................................................................................................................................... 1
1 INTRODUCTION ............................................................................................................................... 2
2 LEGAL PROTECTION ......................................................................................................................... 2
3 METHODS ........................................................................................................................................ 2
3.1 Consultations and Desk-Based Study ...................................................................................... 2
3.2 Field Surveys ............................................................................................................................ 2
4 RESULTS ........................................................................................................................................... 2
4.1 Consultations and Desk-Based Study ...................................................................................... 2
4.2 Field Survey ............................................................................................................................. 3
4.2.1 Flight Activity ........................................................................................................................... 3
4.2.2 Breeding Birds ......................................................................................................................... 5
4.2.3 Winter Walkover ..................................................................................................................... 5
4.2.4 Scarce Breeding Birds .............................................................................................................. 5
4.2.5 Black Grouse ............................................................................................................................ 6
ANNEX A: ORNITHOLOGICAL LEGAL PROTECTION
ANNEX B: ORNITHOLOGICAL SURVEY METHODOLOGIES
ANNEX C: ORNITHOLOGICAL SURVEY EFFORT AND GENERAL INFORMATION
ANNEX D: ORNITHOLOGICAL SURVEY RESULTS
ANNEX E: COLLISION RISK ASSESSMENTS
ANNEX F: CONFIDENTIAL ORNITHOLOGY
FIGURES Figure 6. 1: Designated and non-designated sites: ornithology within 20 km
Figure 6. 2: Site boundary and study areas
Figure 6. 3: Vantage points & viewsheds
Figure 6. 4: 2015 breeding season flight activity
Figure 6. 5: 2015/2016 non-breeding season flight activity
Figure 6. 6: 2016 breeding season flight activity
Figure 6. 7: 2015/2016 non-breeding season flight activity (at-risk)
Figure 6. 8: 2016 breeding season flight activity (at-risk)
Figure 6. 9: 2015 breeding bird survey records
Figure 6. 10: 2016 breeding bird survey records
Figure 6. 11: 2015/2016 winter walkover records
Figure 6. 12: Scarce breeding bird activity 2015 and 2016
Figure 6. 13: CONFIDENTIAL: Scarce breeding bird nest locations 2015 and 2016
Figure 6. 14: Cumulative wind farms

Hopsrig Wind Farm ES Volume 4: Technical Appendices TA 6.1: Ornithology
1 INTRODUCTION MacArthur Green was commissioned by Hopsrig Wind Farm Ltd to complete ornithological surveys at the proposed Hopsrig Wind Farm, Bentpath (hereafter referred to as ‘the proposed development’).
The surveys conducted between May 2015 and August 2016 were commissioned to inform an assessment into the potential ornithological effects of the proposed development on the species assemblage present. A range of survey methods were employed in order to accurately record the baseline conditions within in the proposed development and appropriate survey buffers (collectively referred to as the “study area”).
This Technical Report summarises the methods employed and the results of the field surveys and is supported by the following Annexes:
Annex A: Ornithological Legal Protection;
Annex B: Ornithological Survey Methodologies;
Annex C: Ornithological Survey Effort and General Information;
Annex D: Ornithological Survey Results;
Annex E: Collision Risk Assessments; and
Annex F: Confidential Ornithology.
2 LEGAL PROTECTION With limited exceptions, all wild birds and their eggs are protected by law. Specific levels of protection are determined by a species’ inclusion on certain lists. Annex A to this report details the various levels of legal protection afforded to UK bird species.
3 METHODS 3.1 Consultations and Desk-Based Study The following conservation organisations and resources were consulted regarding the ornithological interests on and adjacent to the proposed development:
The Dumfries and Galloway Raptor Study Group; and
SNH SiteLink (www.snh.gov.uk/sitelink).
3.2 Field Surveys The following additional surveys were undertaken at the proposed development between May 2015 and August 2016:
1 Scottish Natural Heritage (2014) Recommended Bird Survey Methods to inform impact assessment of Onshore Windfarms. 2 EC Directive 79/409 on the Conservation of Wild Birds. Special Protection Area (SPA) Citation. Langholm-Newcastleton Hills (UK9003271), Borders/Dumfries and Galloway. 3 Site of Special Scientific Interest (SSSI) citation: Langholm-Newcastleton Hills (Site code 906), Dumfries and Galloway, Scottish Borders
Flight activity surveys (two breeding seasons and one non-breeding season);
Breeding bird surveys (two breeding seasons);
Winter walkover surveys (one non-breeding season);
Scarce breeding bird surveys (two breeding seasons); and
Black grouse surveys (two breeding seasons).
Survey methods followed the recommended SNH (20141) guidelines available at the time. Methods are described in detail within Annex B. Where possible, each survey was carried out beyond the proposed development extent within a buffer distance specific to that method – e.g. 2 km buffer for the scarce breeding bird survey. Details of these extents are listed within Annex B and illustrated within Figure 6. 2. These extents are hereafter referred to as the ‘study area’ within this report.
The relative importance of the data collected was determined by the specific level of protection assigned to those species recorded, coupled with their perceived susceptibility to potential impacts resulting from the proposed development. The resulting ‘Target Species’ and ‘Secondary Species’ lists are a standard assessment tool for wind farm ornithological studies (see Annex B).
4 RESULTS
4.1 Consultations and Desk-Based Study Information gathered from the consultation exercise revealed that the proposed development is within 20 km of two Special Protection Areas (SPAs) (Figure 6. 1):
Langholm-Newcastleton Hills SPA2 (Table 6-1) (underpinned by Langholm-Newcastleton Hills SSSI3), 10.1 km to the east; and
Castle Loch, Lochmaben SPA4 (Table 6-2) (underpinned by Castle Loch, Lochmaben SSSI5) and Castle Loch, Lochmaben Ramsar, 18.5 km to the south west.
Table 6-1 Summary of qualifying features of Langholm-Newcastleton Hills SPA (and underpinning SSSI)
Feature Qualifying feature category
Status Description
Hen harrier (Circus cyaneus), Breeding
SPA, SSSI December 2008: Unfavourable declining
Breeding population of European importance: 1994 to 1998 mean of 13 breeding females (3% UK population).
Breeding bird assemblage SSSI
July 2003: Unfavourable declining
Supports a diverse population of breeding moorland birds which may include: black grouse,
4 EC Directive 79/409 on the Conservation of Wild Birds. Special Protection Area (SPA) Citation. Castle Loch, Lochmaben (UK319A), Dumfries and Galloway. 5 Site of Special Scientific Interest (SSSI) citation: Castle Loch (Site code 343), Dumfries and Galloway.

Hopsrig Wind Farm ES Volume 4: Technical Appendices TA 6.1: Ornithology
Feature Qualifying feature category
Status Description
red grouse, nine wader species and six raptor species.
Table 6-2 Summary of qualifying features of Castle Loch, Lochmaben SPA (underpinning SSSI) and Castle Loch, Lochmaben Ramsar
Feature Qualifying feature category
Status Description
Pink-footed goose (Anser brachyrhynchus), Non-breeding
SPA, SSSI, Ramsar
March 2003: Unfavourable no change
Wintering population of international importance: 1987/88 to 1991/92 mean peak count of 8,300 individuals (4% of British/world Icelandic/Greenlandic population).
Goosander (Mergus merganser), Non-breeding
SSSI December 2009: Favourable maintained
Wintering population of national importance: 1987/88 to 1991/92 winter peak mean of 66 individuals (1% of British population).
Greylag goose (Anser anser), Non-breeding
SSSI March 2009: Unfavourable no change
Significant wintering population of roosting birds.
In addition, one Local Nature Reserves (LNR), Castle and Hightae Lochs LNR is within 20 km of the proposed development (Figure 6. 1). Key species at these reserves are listed as follows:
Castle and Hightae Lochs LNR6 (18.5 km to the south west) – diverse range of water birds and passerines, most notably a breeding population of willow tit;
4.2 Field Survey All surveys were undertaken during suitable weather conditions (as described within Annex B – Survey Methodologies). The Schedule 1/Annex 1 surveys were carried out by appropriately licensed surveyors. All survey data were reviewed, inputted, and analysed by MacArthur Green.
A total 92 bird species were recorded within, or adjacent to, the proposed development during the various ornithological surveys conducted. Survey effort and results of the field surveys are detailed within Annexes C & D; survey results and information collected through the consultation exercise are also illustrated within Figure 6. 4 to Confidential Figure 6. 13.
The following sections summarise the results from each survey undertaken.
6 Castle and Hightae Lochs LNR (2015) Wildlife Report. Available at: http://www.lochmaben.org.uk/uploads/images/CASTLE%20&%20HIGHTAE%20LOCH%20LNR%20REPORT%202015%20FINAL%20DRAFT%20ONLINE.pdf
4.2.1 Flight Activity The flight activity surveys recorded all flight activity within the proposed development and beyond. These data have been used in the collision risk modelling. The flights used included those within the ‘Collision Risk Analysis Area’ (CRAA) (i.e. the area to be occupied by operational turbines, together with a 500 m buffer).
Flight activity surveys across the 2015 breeding, 2015/2016 non-breeding and 2016 breeding seasons were undertaken from three Vantage Points (VPs). Valid survey effort7 is detailed in Table 6-3 and full details of flight activity surveys are contained in Annex C with methodology in Annex B.
Table 6-3 Summary of total hours of valid survey per VP in each season
Period VP1 VP2 VP3 2015 breeding season 31 33 30 2015/2016 non-breeding season 43 40 40 2016 breeding season 36 36 36
From May 2015 to August 2016, 12 Target Species were recorded during the flight activity surveys (Figure 6. 4, Figure 6. 5 and Figure 6. 6 present observed flightlines and further details are provided in Annex D). For each species across the whole flight activity survey period, Table 6-4 shows the number of flights recorded and the number of birds recorded. This includes flights that would not technically be ‘at-risk’ of collision (e.g. recorded outwith the CRAA and/or not at rotor height). The bird seconds are calculated for each observation as the product of flight duration and number of individuals. This is then summed per species to give the total bird seconds recorded across the entire surveyed period.
Table 6-4 Target species recorded and total number of flights recorded during flight activity surveys, 2015-2016
Species Total number of flightlines recorded
Total number of birds recorded
Total bird seconds recorded
Curlew 3 4 242 Golden plover 3 84 6,212 Goshawk 25 26 1,785 Hen harrier 2 2 116 Herring gull 1 5 185 Merlin 1 1 45 Osprey 1 1 60 Oystercatcher 1 2 203 Peregrine falcon 1 1 35 Pink-footed goose 1 27 7,020 Red kite 6 6 401 Snipe 1 1 22
7 Hours where visibility was >1 km are not considered valid for use in collision risk modelling as less than half the 2 km viewshed can be seen.

Hopsrig Wind Farm ES Volume 4: Technical Appendices TA 6.1: Ornithology
4.2.1.1 Flightlines Used in Collision Risk Modelling Only flightlines identified to be within the CRAA and recorded within the 2 km viewshed of the associated VP are discussed in the sections below. Table 6-5 summarises the number of flightlines identified and the proportion/number of those flightlines considered ‘at-risk’.
‘At-risk’ is defined as – a flight having at least part of its duration (i) at Potential Collision Height (PCH); (ii) within the CRAA; and (iii) recorded within the 2 km viewshed of the associated VP.
PCH is defined as – the altitude between the minimum and maximum blade height8 (39 m to 140 m).
Figure 6. 7 and Figure 6. 8 show the sections of flightlines identified to be within the CRAA and the associated 2km viewshed but do not indicate what proportion of these flightlines are considered to be ‘at-risk’9. Seven target species recorded during flight activity surveys were not identified within the CRAA and associated viewsheds and so are not considered within the sections below. Consequently, no target species were recorded ‘at-risk’ during the 2015 breeding season and the collision risk for the 2015 breeding season is therefore nil and is not discussed in the sections below. These species are: herring gull, merlin, osprey, oystercatcher, peregrine falcon, red kite and snipe. Full survey results detailing the findings from each survey visit (including Target species flightlines considered not ‘at-risk’ and Secondary species information) can be found within Annex D.
Table 6-5 Flightlines identified within the CRAA and associated viewshed and the proportion of these ‘at-risk’, 2015-2016
Species Number of flightlines identified within the CRAA and associated viewshed
Number of these flightlines identified to be ‘at-risk’
Curlew 1 1 Golden plover 3 3 Goshawk 12 11 Hen harrier 2 2 Pink-footed goose 1 1
Table 6-6 and
Table 6-7 detail per species the number and proportion of flight activity within each flight height category (below, at, and above PCH). Only bird seconds for observations identified as within the CRAA and associated
8 Where the actual rotor blade altitude differs from the pre-defined survey height bands, the collision risk model accounts for this difference on the assumption of an even flight distribution within each particular survey height band, and an adjustment can be made to estimate total flight duration at actual rotor blade altitude. 9 In some cases only part of a total flight duration was recorded at PCH, and it is assumed that this proportion is applicable for that part of the flight within the CRAA and 2 km viewshed area.
viewshed are considered in the following discussions. Full Target species results are detailed within Annex D and the Collision Risk Calculations are detailed in Annex E.
Table 6-6 Target species bird seconds within the CRAA (2015/2016 non-breeding season)
Species Bird seconds within height bands (non-breeding season10)
Flights Below PCH At PCH Above PCH Total
Golden plover Seconds
3 1011.73 716.07 0.00 1727.81
Percentage 58.56 41.44 0.00 100.00
Goshawk Seconds
8 138.28 429.93 17.95 586.16
Percentage 23.59 73.35 3.06 100.00
Hen harrier Seconds
1 28.84 1.52 0.00 30.36
Percentage 95.00 5.00 0.00 100.00
Pink-footed goose Seconds
1 0.00 4246.85 0.00 4246.85
Percentage 0.00 100.00 0.00 100.00
Table 6-7 Target species bird seconds within the CRAA (2016 breeding season)
Species Bird seconds within height bands (breeding season11)
Flights Below PCH At PCH Above PCH Total
Curlew Seconds
1 29.30 1.54 0.00 30.84
Percentage 95.00 5.00 0.00 100.00
Goshawk Seconds
4 108.33 22.45 16.09 146.86
Percentage 73.76 15.28 10.95 100.00
Hen harrier Seconds
1 26.53 0.80 0.00 27.33
Percentage 97.08 2.92 0.00 100.00
4.2.1.2 Collision Risk Model Outputs The bird seconds for Target Species flights within the CRAA at PCH were then input into a Collision Risk Model (CRM) to calculate the predicted collision mortality. The CRM calculations for each species can be found in Annex
10 The general non-breeding season is defined as September to mid-March inclusive by SNH (2014). These observations were collected between the dates of 15th September 2015 and 11th March 2016. 11 The general breeding season is defined as mid-March to August inclusive by SNH (2014). These observations were collected between the dates of 29th March to 19th August 2016.

Hopsrig Wind Farm ES Volume 4: Technical Appendices TA 6.1: Ornithology
E. Table 6-8 and Table 6-9 provide the estimated collision rates and number of seasons per collision for each species. A dashed line indicates that no “at-risk” flights were recorded during that season, and estimated collision risk is consequently zero.
Table 6-8 Estimated weighted collision rate per season
Species 2015 breeding season 2015/2016 non-breeding season 2016 breeding season
Curlew - - 0.0004 Golden plover - 0.1052 - Goshawk - 0.0641 0.0054 Hen harrier - 0.0001 0.0001 Pink-footed goose - 0.0831 -
Table 6-9 Estimated number of seasons per collision
Species Equivalent to one bird per breeding seasons (2015)
Equivalent to one bird per non-breeding seasons (2015/2016)
Equivalent to one bird per breeding seasons (2016)
Curlew - - 2,583.6 Golden plover - 9.5 - Goshawk - 15.6 186.6 Hen harrier - 9,411.3 11,193.5 Pink-footed goose - 12. -
4.2.2 Breeding Birds Two complete breeding bird surveys (comprising of four visits) were conducted in the 2015 and 2016 breeding seasons (May to July 2015 and April to July 2016). The proposed development and an associated 500 m study area (Figure 6. 2) were surveyed as per SNH guidance (2014) for moorland breeding birds. Surveys during the 2015 and 2016 breeding season identified breeding territories for curlew and snipe (Table 6-10, Figure 6. 9 and Figure 6. 10). Oystercatcher were also recorded in both years but were not considered to be breeding. Full details of the breeding bird surveys are provided within Annexes C and D and survey methodology is provided within Annex B.
Table 6-10 Breeding wader territories, 2015 and 2016
Species 2015 breeding season 2016 breeding season
Minimum number of territories
Maximum number of territories
Minimum number of territories
Maximum number of territories
Curlew 0 1 1 2 Snipe 2 2 1 1
4.2.3 Winter Walkover Winter Walkover surveys were conducted during the 2015/2016 non-breeding season. The proposed development and an associated 500 m study area were surveyed (Figure 6. 2).
Surveys recorded 36 species of which four are considered to be target species (Table 6-11, Figure 6. 11). Brambling, common crossbill, fieldfare and redwing were also recorded during surveys and although these species are Schedule 1 of the Wildlife and Countryside Act (1981), due to their breeding ecology they are not considered to be ‘at-risk’ from the proposed development. Full details of the winter walkover surveys are provided within Annexes C and D and survey methodology is provided within Annex B.
Table 6-11 Winter walkover: target species records, 2015/2016
Species Visit 1 Visit 2 Visit 3
Number of records
Number of individuals
Number of records
Number of individuals
Number of records
Number of individuals
Goshawk 0 0 0 0 2 2 Pink-footed goose 0 0 0 0 1 66 Red kite 0 0 0 0 1 4 Woodcock 0 0 1 1 1 1
4.2.4 Scarce Breeding Birds Scarce breeding bird surveys to locate breeding raptors/divers and their nest sites were conducted during the 2015 (May to August) and 2016 (March to August) breeding seasons. The proposed development and an associated 2 km study area (Figure 6. 2) were surveyed as per SNH guidance (2014) for breeding target raptors.
Roosting activity by barn owls were recorded two locations (A and B) within the study area during 2015 surveys and again at one of the same locations (A) in 2016 (Confidential Figure 6. 13). Barn owl at location A were also suspected to be breeding but this was unconfirmed as roosting/breeding activity was in the upper/attic floor of a derelict cottage and there was no safe method to access this floor. Location B only had old evidence of roosting and this location had then been boarded up making it unsuitable for further use by barn owl.
Goshawks were recorded on nine occasions across the 2015 and 2016 surveys with adults (male and female) and juveniles recorded (Figure 6. 12). MacArthur Green located no goshawk nests during 2015 or 2016 surveys, however access to forestry outside the proposed development land ownership was limited and it was not possible to cover all the forestry plantation within the study area. Data requested from the Dumfries and Galloway Raptor Study Group indicated two goshawk territories (both outwith the proposed development land ownership boundary) and this information is presented within Chapter 6 Ornithology.
Surveys during the 2016 breeding season recorded an additional three target raptors; hen harrier (two records), peregrine falcon (one record) and red kite (five records) (Figure 6. 12). No breeding activity was recorded for any of these species and activity was concentrated on the open ground within the study area. Merlin (2015/2016 non-breeding season) and osprey (2016 breeding season) were both recorded on one occasion during flight activity surveys (Figure 6. 5 and Figure 6. 6 respectively) and with no other records neither of these species were considered to be breeding within the study area.

Hopsrig Wind Farm ES Volume 4: Technical Appendices TA 6.1: Ornithology
Full details of the scarce breeding bird surveys are provided within Annexes C, D and Confidential Annex F and survey methodology is provided within Annex B.
4.2.5 Black Grouse Surveys to identify areas of black grouse activity and to locate lek locations were conducted in the 2015 and 2016 breeding seasons in April (2015) and May (2015 and 2016). The proposed development and an associated 1.5 km study area (Figure 6. 2) were surveyed as per SNH guidance (2014) for black grouse.
No black grouse or signs of black grouse were recorded during surveys in 2015 or 2016 and no black grouse have been recorded at any time during surveys at the proposed development.
Full details of the black grouse surveys are provided within Annexes C and D and survey methodology is provided within Annex B.

Hopsrig Wind Farm ES Volume 4: Technical Appendices TA 6.1: Ornithology
ANNEX A: ORNITHOLOGICAL LEGAL PROTECTION

Hopsrig Wind Farm ES Volume 4: Technical Appendices TA 6.1: Ornithology Annex A
1 | P a g e
ANNEX A LEGAL PROTECTION In Scotland, all wild birds are protected under the Wildlife and Countryside Act 1981 (the ‘Act’), as amended by the Nature Conservation (Scotland) Act 2004. This protection also extends to their eggs and nests, with it being an offence to intentionally or recklessly1:
kill, injure or take any wild bird2;
take, damage, destroy or otherwise interfere with the nest of any wild bird while it is being built or is in use3;
at any other time takes, damage, destroys or otherwise interferes with any nest habitually used by any wild bird included in Schedule A1 (Protected Nests and Nest Sites for Birds: white-tailed eagle and golden eagle)4;
obstructs or prevents any wild bird from using its nest5; or
take or destroy an egg of any wild bird6.
It is also an offence to have in possession or control any live or dead wild bird or any part thereof; or any egg or part of an egg of any wild bird7.
Further special protection under this legislation is afforded to those species listed on Schedule 1 of the Act. For these species, it is an offence to intentionally or recklessly disturb any wild bird listed on Schedule 1 while it is nest building, or is in, on or near a nest containing eggs or young, or disturb the dependent young of such a bird8;
Intentionally or recklessly disturb any wild birds included on Schedule 1 which leks, while it is doing so9 (in Scotland the capercaillie is the only bird this offence applies to);
Intentionally or recklessly harass any wild bird included in Schedule 1A10 (white-tailed eagle, are the only birds currently listed);
It is also an offence to knowingly cause or permit to be done an act which is made unlawful by any of the above provisions.
Intentionally or recklessly take, damage, destroy or otherwise interfere with any nest and/or nest site habitually used by any bird on Schedule A1 at any time. White-tailed eagle and golden eagle are the only birds currently listed in Schedule A1 at this time11.
1 Exceptions to these offences exist under various circumstances (e.g. controlling pest species; taking birds during specific season; and killing sick or injured birds etc.). 2 Wildlife and Countryside Act 1981, Section 1(1)(a) 3 Wildlife and Countryside Act 1981, Section 1(1)(b) 4 Wildlife and Countryside Act 1981, Section 1(1)(ba) 5 Wildlife and Countryside Act 1981, Section 1(1)(bb) 6 Wildlife and Countryside Act 1981, Section 1(1)(c) 7 Wildlife and Countryside Act 1981, Section 1(2) 8 Wildlife and Countryside Act 1981, Section 1(5) 9 Wildlife and Countryside Act 1981, Section 1(5A) 10 Wildlife and Countryside Act 1981, Section 1(5B)
Schedule 1A of the Wildlife and Countryside Act 1981 (as amended) lists those birds that are protected from harassment. Section 1, subsection 5B states, ‘Subject to the provisions of this Part, any person who intentionally or recklessly harasses any wild bird included in Schedule 1A shall be guilty of an offence’. Schedule 1A includes white-tailed eagle, golden eagle, hen harrier and red kite. This updated legislation was introduced on 16 March 2013
Further protection is described under the EU Birds Directive which requires member states to maintain wild bird species in favourable conservation status12 and promote the conservation of bird species listed within Annex 1 through the protection of their habitat. This is achieved via the designation of Special Protection Areas (SPAs).
Red List bird species are those deemed to be globally threatened and to be suffering population declines within the UK. Although not legally enforceable, the conservation of Red List bird species represents a material consideration, in planning terms.
11 This reflects the changes introduced by the Wildlife and Countryside Act 1981 (as amended by: Variation of Schedules A1 and 1A (Scotland) Order 2013 12 While the term ‘favourable conservation status’ is not used in the Birds Directive, EU court cases over recent years have progressively interpreted the concept as meaningful in a Birds Directive context (SNH, 2006).

Hopsrig Wind Farm ES Volume 4: Technical Appendices TA 6.1: Ornithology
ANNEX B: ORNITHOLOGICAL SURVEY METHODOLOGIES

Hopsrig Wind Farm ES Volume 4: Technical Appendices TA 6.1: Ornithology Annex B
1 | P a g e
ANNEX B ORNITHOLOGICAL SURVEY METHODOLOGIES A range of ornithological surveys have been conducted at the proposed Hopsrig Wind Farm (hereafter referred to as ‘the proposed development’). The methodologies used in these surveys are summarised in the sections below; more detailed descriptions are provided in the SNH guidance (20141) on which these surveys are based.
Study Area Surveys were undertaken during the 2015/2016 non-breeding and 2015 and 2016 breeding seasons. Flight activity, black grouse, winter walkover, breeding and scarce breeding bird surveys were buffered from a Maximum Potential Wind farm Boundary (MPWB) (Figures 6.2 and 6.3).
Delaunay Triangulation from the turbine points created a wind farm area2 and from this the Collision Risk Analysis Area (CRAA) was defined using a 500 m buffer (Figure 6.3). Using the larger 500 m area around the turbines accounts for possible inaccuracies in the recording of flightlines and ensures the assessment is precautionary. Target Species flight activity surveys within this area were used to inform the Collision Risk Analysis.
B.1 Flight Activity Survey The aims of the flight activity (vantage point) surveys are: (1) to record flight activity within the vicinity of the proposed development in order to identify areas of importance to birds; and (2) to quantify flight activity within 500 m of the proposed turbine in order to estimate the likelihood of collision (SNH, 2014 P.14-15).
Timing A survey period of 36 hours is recommended as the minimum level of sampling intensity at each VP for each season (breeding, non-breeding, migratory) (SNH, 2014. P.17);
Watches were spread as evenly throughout the year as possible to ensure that temporally representative data are collected (see Annex C). Specific consideration was given to the period around dawn and twilight for breeding waders and to changing raptor behaviour across seasons (SNH, 2014. P.16);
During the 2015 breeding season (mid-May to August) a total of 94 hours was collected (VP 1 - 31, VP 2 – 33 and VP 3 – 30 hours). A total of 108 hours was collected during the 2016 breeding season (mid-March to August); (VP 1 - 36, VP 2 – 36 and VP 3 – 36 hours);
A total of 123 hours was collected in the 2015/2016 non-breeding season (September 2015 to mid-March 2016); (VP 1 – 43, VP 2 - 40 and VP 3 – 40 hours);
Watches were suspended and resumed to take account of changes in visibility (e.g. fluctuations in cloud base). Watches were undertaken in conditions of good ground visibility when the cloud base was higher than the most elevated ground being observed; and
Watches were conducted in a range of weather conditions and were spread throughout the day (see Annexe C).
1 Scottish Natural Heritage (2014) Recommended Bird Survey Methods to inform impact assessment of Onshore Windfarms. 2 This was adjusted where appropriate depending on the spatial location of the turbines in relation to other turbines. 3 The viewsheds are based on a 5m DTM to provide a representation of visibility from the observer locations; this is confirmed and refined through field site visits.
Field methods Viewshed analysis was conducted using Arc GIS to confirm suitable Vantage Point (VP) locations and their associated visible areas3;
Reconnaissance surveys were undertaken to refine VP locations;
The VP locations and associated viewsheds are detailed in Figure 6.3;
Care was taken to maximize the area visible whilst minimising disturbance to birds;
The final three VP locations were selected with the aim of achieving coverage of the whole study area such that no point was greater than 2 km from a VP. This objective was achieved for the majority of the CRAA, although due to the topography and limited areas of clear ground (due to forestry plantation) five sections across the CRAA (25.2 %) remained ‘invisible’4;
A maximum 180 view arc was scanned. This rule did not however apply when tracking migratory waterfowl, or raptors across the CRAA;
Each watch lasted a maximum of three hours but was suspended and then resumed to take account of changes in visibility (e.g. fluctuations in the cloud base).
For species of high nature conservation importance (target species) the following data were recorded (SNH, 2014 P.17-18):
The flightlines by individuals or flocks of birds;
The time the target bird was detected and the duration (seconds) spent flying over a defined study area (the viewshed);
The birds’ flight heights (defined into the following height bands: 0-20 m, 21-40 m, 41-100 m, 101-150 m, >151 m) were recorded at the point of detection and at 15 second intervals thereafter. From this the proportion of time spent flying below, within (referred to as Potential Collision Height (PCH)) and above approximate rotor height could be estimated. The actual rotor height is 39-140 m. This difference is accounted for within the collision risk models on the assumption of even flight distribution;
The route followed was plotted in the field onto 1:25,000 scale maps;
For secondary species, activity summaries were sub-divided into 5 minute periods at the end of which the number and activity of all secondary species were recorded;
If a target species was being tracked during a 5 minute period, then the activity summary for that period was abandoned and a new one started once observations of the target species had ended;
Observation of target species took priority over recording secondary species;
The number of birds recorded were the minimum number of individuals that could account for the activity observed; and
4 The habitat here is of sufficient similarity such that the survey data collected and subsequently assessed are considered to be representative of the whole CRAA. In addition, there were no records made during any of the BBS, breeding raptor and walkover surveys which would suggest that these areas were of any importance to Target Species.

Hopsrig Wind Farm ES Volume 4: Technical Appendices TA 6.1: Ornithology Annex B
2 | P a g e
Observers only recorded perched birds and birds on water-bodies once only on arrival at the VP. Thereafter only flying birds and newly noticed perched/swimming birds were included in the activity summaries.
B.2 Breeding Bird Survey Upland breeding bird survey methodology was employed as detailed within SNH Guidance (SNH, 2014 P.11-13). Study areas are detailed in Figure 6.2. In summary, surveys involved the following:
Open upland areas (including hedgerows, scrub, isolated trees and copses) was surveyed using methodology detailed in Brown and Shepherd (19935) and Calladine et al. (20096);
The objectives were to map the distribution of breeding bird territories and estimate the approximate size of breeding bird populations;
After each survey visit one overview map was then produced showing all target species. The maps from all four survey visits from that year were then compared, enabling the production of composite breeding territory maps. This was done by grouping the observations into territories using the methodology described by Bibby et al. (2000)7. Due to the cryptic nature of many breeding birds and the necessary assumptions made when plotting territories, a minimum and maximum number of territories was identified for each target species
The survey covered all areas within 500 m of the site boundary; and
All upland wader species were recorded during the breeding bird survey.
Timing The area was surveyed four times during the 2015 breeding season (May to August) and four times during the 2016 breeding season (April to July);
Fieldwork was undertaken between sunrise and sunrise and 1800hrs; and
Fieldwork was not undertaken in conditions considered likely to affect bird detection rates, for example in winds greater than Beaufort Scale Force 4, persistent precipitation, poor visibility (less than 300 m), or in unusually hot weather.
Field methods Walk-routes were used that optimised ground visibility;
Surveyors paused at appropriate vantage and listening points;
Isolated trees, copses and patches of scrub were approached and examined;
Streams, ditches and hedgerows were walked;
All other areas were approached to within 100 m; and
5 Brown, A. F. & Shepherd, K. B. (1993) A method for censusing upland breeding waders. Bird Study, 40: 189-195. 6 Calladine. J., Garner, G., Wernham, C., & Thiel, A. (2009) The influence of survey frequency on population estimates of moorland breeding birds. Bird Study, 56: 3, 381-388. 7 Bibby, C. J., Burgess, N. D., Hill, D. A., & Mustoe, S. H. (2000) Bird Census Techniques, 2nd Edition, London, Academic Press.
Registrations were mapped at the first location that behaviour indicative of breeding was observed. Standard BTO activity codes were used.
B.3 Winter Walkover Winter walkovers were performed in the 2015/2016 non-breeding season to map wintering populations of birds within the site boundary. Study areas are detailed in Figure 6.2.
The area was surveyed six times during the 2015/2016 non-breeding season (October and November 2015 and January 2016);
These surveys involved following a route that optimised ground coverage, such that observers walked within 250 m of every point; and
Observers periodically stopped at appropriate viewing and listening points along the route and longer vantage point watches were included within the walkover to allow potentially important areas to be monitored in greater detail.
B.4 Scarce Breeding Bird Survey The aims were to determine the distribution of occupied nests/territories for target raptor and owl species within 2 km of the site boundary and record breeding success. Secondary species such as buzzard, sparrowhawk and kestrel were included in a survey within 1 km of the site boundary. Surveys were undertaken during the 2015 and 2016 breeding seasons and survey areas are detailed in Figure 6.2.
Surveys were undertaken by experienced and licensed8 field ornithologists. Extreme care was taken to avoid unnecessary disturbance to breeding birds.
Guidance from SNH (SNH, 2014. P.11-13), ‘Bird Monitoring Methods’ (Gilbert et al. 19989) and ‘Raptors: a field guide to survey and monitoring’ (Hardey et al. 201310) were all consulted to inform survey methodology and are referenced where appropriate in the species methodologies below.
Barn owl The surveys used the methodology outlined in Gilbert et al. (1998), as mentioned in SNH Guidance (SNH, 2014. P12-13);
Surveys were undertaken within 1 km of the site boundary; and
Surveyors checked for signs of occupation (moulted feathers, pellets) in all suitable buildings where safe access allowed within this 1 km buffer.
8 All surveyors hold SNH Schedule 1 Licences. 9 Gilbert, G., Gibbons, D. W. & Evans, J. (1998) Bird Monitoring Methods. RSPB, Sandy. 10 Hardey, J., Crick, H., Wernham, C., Riley, H., Etheridge, B. & Thompson, D. (2013) Raptors: a field guide for surveys and monitoring (3rd edition). The Stationery Office, Edinburgh.

Hopsrig Wind Farm ES Volume 4: Technical Appendices TA 6.1: Ornithology Annex B
3 | P a g e
Goshawk Methodology outlined in Hardey et al. (2013) was used as guidance for the surveying of areas for potential goshawk breeding. This methodology is summarised below. Extreme care was taken not to disturb potential nests especially around the time of year when females were likely to be laying or incubating.
Areas of suitable woodland were observed for the presence of nests. Searches for goshawk nests were focused on mature forestry blocks, although their presence was not ruled out of other wooded areas on site;
Searches carried out between March and April focussed on observing territorial and nest building behaviours;
Where nests were known to be present, scans were carried out between mid-March and May to confirm breeding. Scans were kept brief – carried out for between 5-10 minutes and from a distance; and
When breeding was confirmed, searches for further nests were deferred until such a time as the young had hatched. Searches were then undertaken in late May to late June for evidence of provisioning young and then in late July to early August to watch for fledgling activity, this included listening for the begging calls of newly fledged young.
Hen harrier Methodology outlined in Hardey et al. (2013) was used as guidance for the surveying of areas for potential hen harrier breeding. This methodology is summarised below. Extreme care was taken not to disturb potential nests especially around the time of year when females were likely to be laying or in cold/wet weather when females were likely to be incubating or brooding. Areas of suitable habitat were visited during four time periods across the breeding season to:
Check for territory occupancy (between March and mid-April) – this consisted of watching over suitable habitat from a good vantage point for displaying males (and females) and checking all areas of suitable habitat11 to within 250 m (watching out for signs of kills);
Locate incubating females (between mid-April and late May) by listening for female begging calls and watching for food passes between the male and female – surveyors watched for at least four hours as Hardey et al. (2013) notes that when the female is incubating it can be up to six hours between feeding visits from the male, but on average it is less than every four hours. Surveys were undertaken between 06:00 to 12:00 or 16:00 to 20:00;
Check for young or breeding evidence (between late May and late June) again by listening for female begging calls and watching for food passes between male and female when the female is brooding and watching for the male and female provisioning the nest with food once brooding has ended– surveyors watched for at least two hours as Hardey et al. (2013) notes that an adult bird will visit the nest every 1-2 hours. Surveyors also watched for display behaviour which could indicate a failed breeding attempt; and
11 Unsuitable habitat areas include: land above 600 m; improved pasture and arable land; extensive areas of degraded land with no heather cover and low vegetation; the vicinity of cliffs, rocky outcrops, boulder fields and scree; areas within 100m of hill farms and occupied dwellings.
Check for fledged young (between late June and late August).
Merlin Methodology outlined in Hardey et al. (2013) was used as guidance for the surveying of areas for potential merlin breeding. This methodology is summarised below.
Areas of suitable nesting habitat (including forest edge where trees are >5 m high) were closely observed between 20th March and 30th April;
Boulders, fence lines, isolated posts, stone dykes, grouse butts, hummocks, stream banks, crags, trees and recently burnt areas of heather were checked for signs of occupation (e.g. plucked prey, moulted feathers, pellets and faeces);
If merlin were observed, or signs found, areas were visited at least twice to verify occupation of the site; and
Potential nest areas were watched for 4-6 hours if necessary.
Peregrine falcon Potential nest sites were visited and checked for evidence of occupation between March and April;
Sites checked included crags and steep banks identified from OS maps and searches of the study area;
Surveyors checked for signs of occupation (e.g. faecal splash, fresh plucked prey);
If occupied sites were found they were re-visited to verify incubation; and
Searches were made for eyries. Where this was not possible sites were watched from a suitable vantage point for 3-4 hours or until a nest was located.
Red kite Wooded areas were scanned form outside for the presence of nests, with occupation signs searched for between February and March.
Potential territories were watched for 1-2 hours between March and April in an attempt to observe any breeding or nest-building behaviours
Where breeding was confirmed, nests were scanned to determine the breeding success between late April and late June/early July.
Care was taken not to disturb the birds, especially between mid-March and mid-April when disturbance to displaying birds can cause them to move to another area (Hardey et al. 2013).
Short-eared owl At least two visits between early April and the end of May were carried out;

Hopsrig Wind Farm ES Volume 4: Technical Appendices TA 6.1: Ornithology Annex B
4 | P a g e
Surveys were undertaken within 500 m of the site boundary;
Suitable habitat was visited and checked for evidence of hunting males, territorial activity and other signs of presence; and
If breeding was confirmed, a further visit was be made in June to watch birds, locate nest-sites and confirm breeding behaviour wherever possible.
B.5 Black Grouse Preliminary surveys were conducted in May 2015 and April and May 2016 within 1.5 km of the site boundary to identify: suitable habitat, potential lek locations, signs of activity and birds. Any areas of interest were then surveyed as per SNH guidance (SNH, 2014. P12) summarised below. Study areas are detailed in Figure 6.2.
Breeding black grouse were surveyed within 1.5 km of the site boundary by counting total numbers of males and females at leks, most lekking activity taking place at or soon after dawn in spring;
Known lek sites and other areas of suitable habitat which can host leks were identified and visited during April and May within two hours of dawn on calm dry days with good visibility;
Visits involved listening and scanning for lekking black grouse from strategic locations (avoiding disturbance of leks) and during walks between these locations ensuring that all potential habitat was covered;
The maximum count of males in the two hours around dawn gives the standard count estimate but the maximum number of females seen was also presented; and
Leks that were at least 200 m apart within the same year were treated as separate leks.

Hopsrig Wind Farm ES Volume 4: Technical Appendices TA 6.1: Ornithology
ANNEX C: ORNITHOLOGICAL SURVEY EFFORT & GENERAL INFORMATION

Hopsrig Wind Farm ES Volume 4: Technical Appendices TA 6.1: Ornithology Annex C
1 | P a g e
ANNEX C ORNITHOLOGICAL SURVEY EFFORT & GENERAL INFORMATION Table C-1 shows the system used for recording weather conditions on all the surveys detailed in sections C1 to C6 below.
Table C-1 Key to meteorological conditions recorded during all surveys
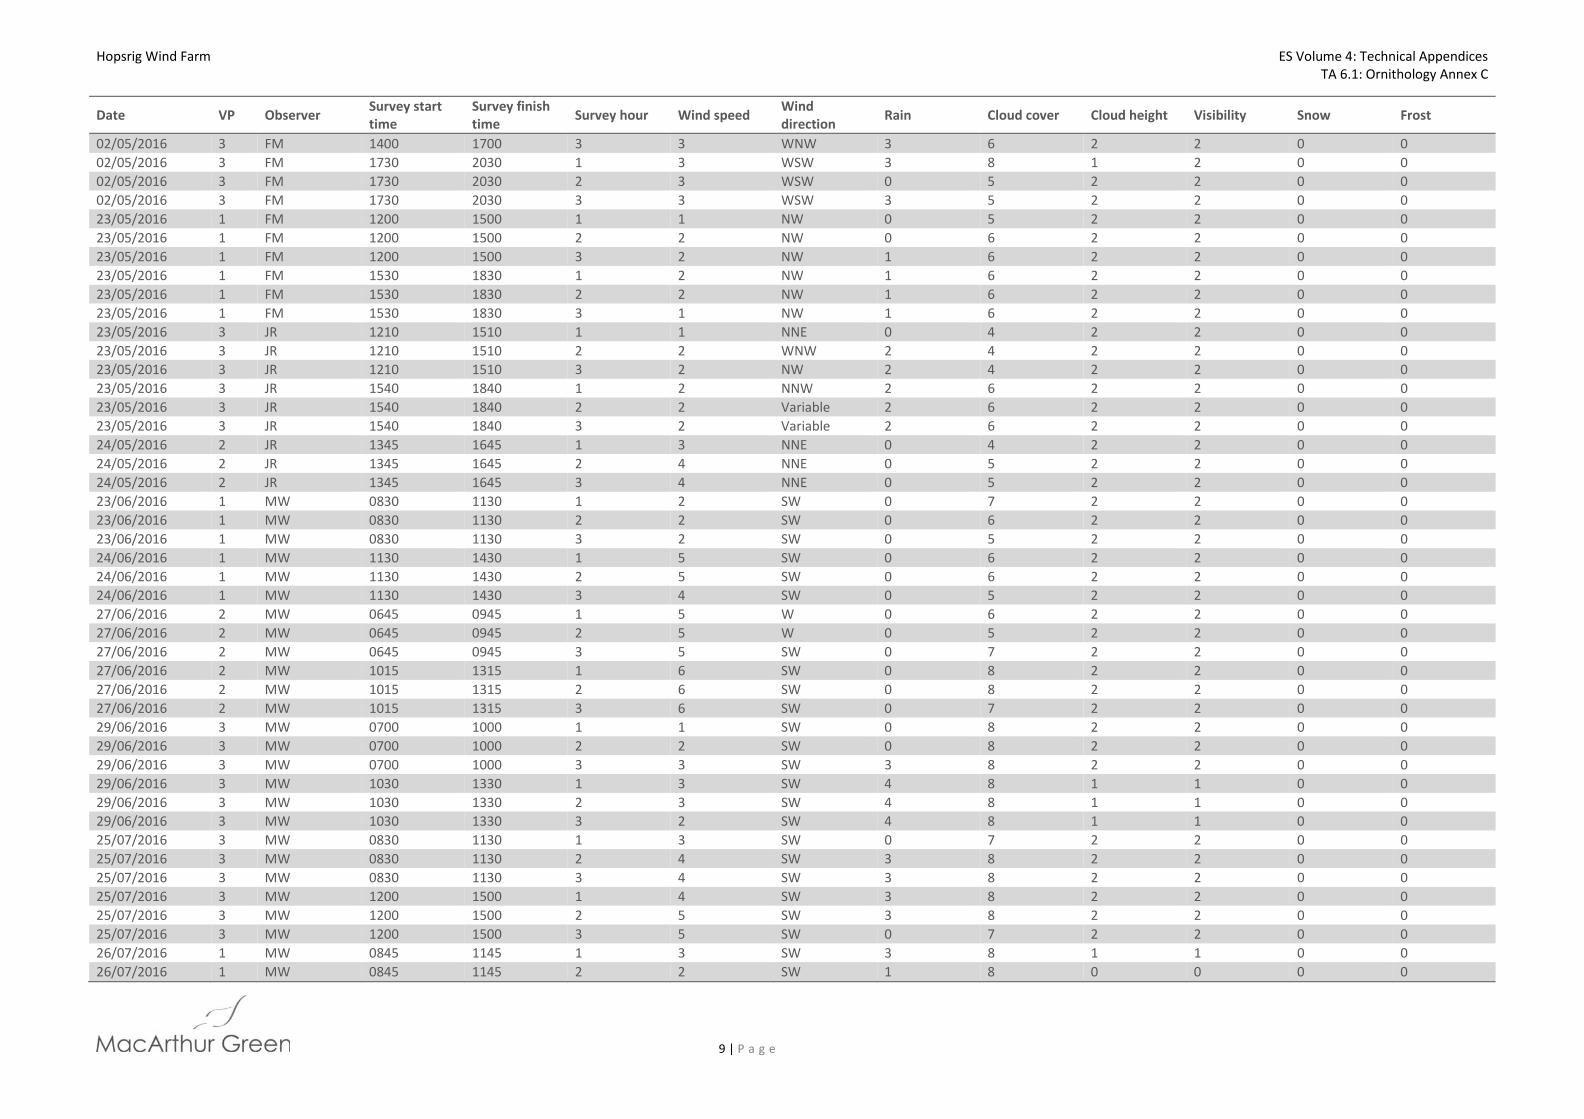
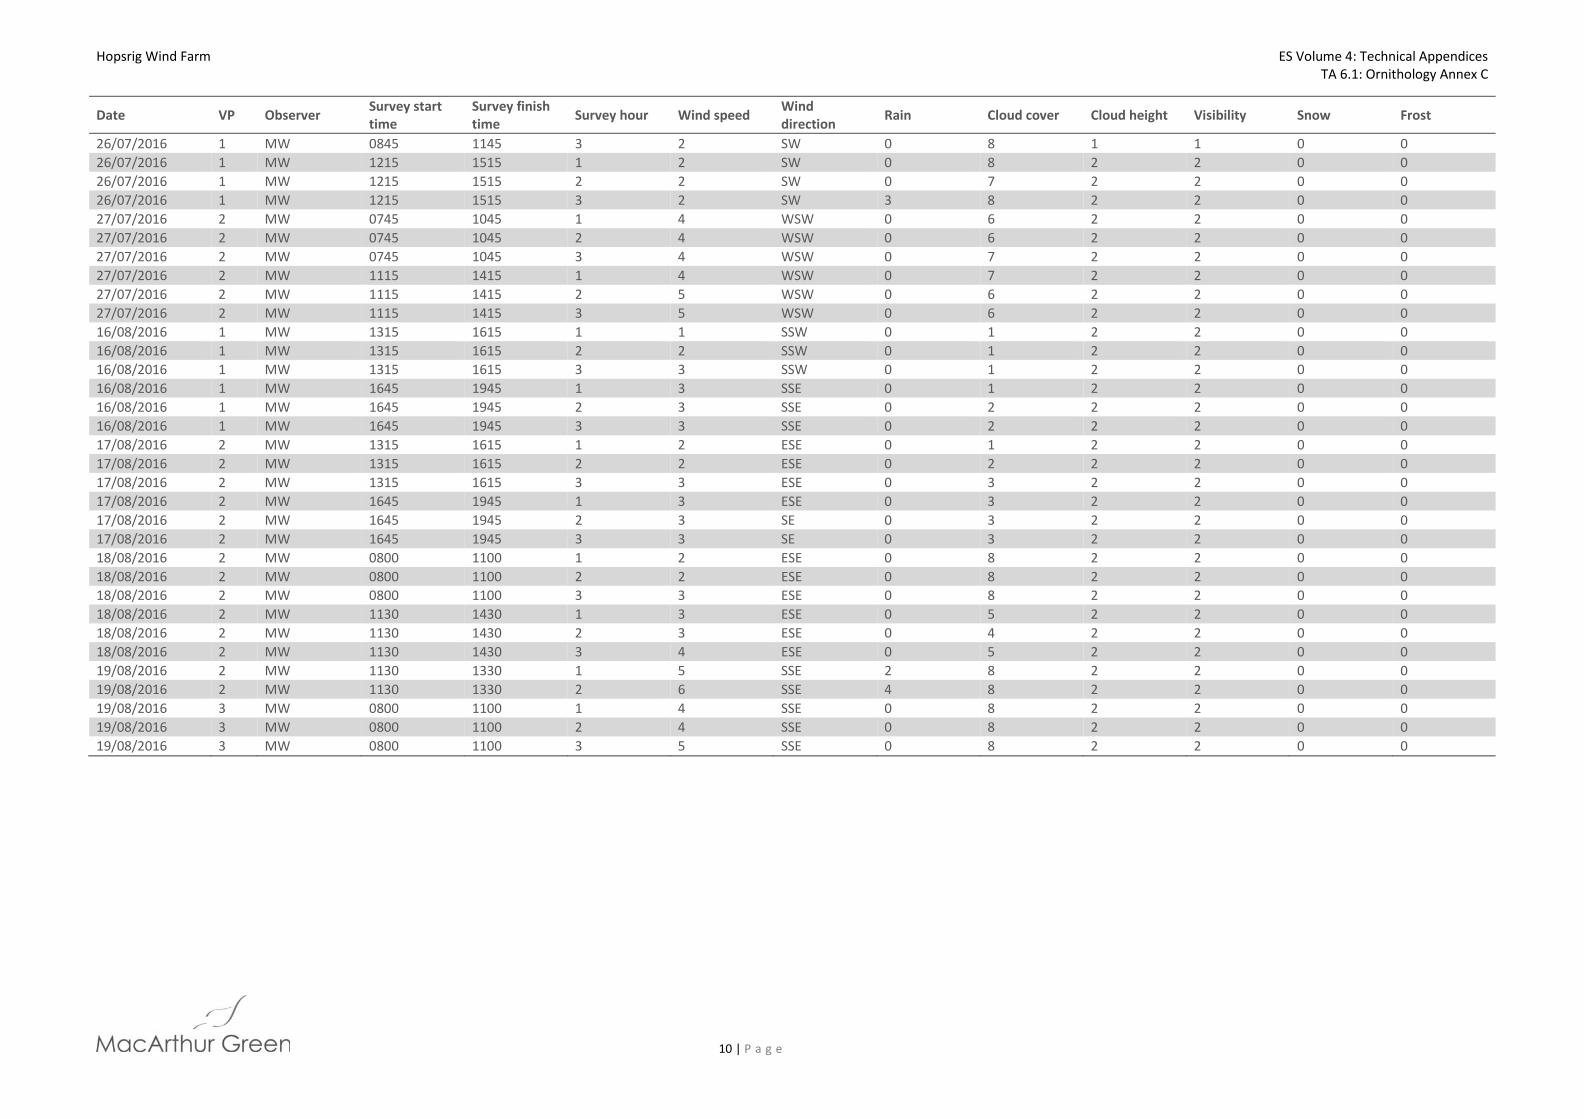
Flight Activity Surveys A series of flight activity surveys were undertaken across three Vantage Points (VPs) during the 2015 breeding, 2015/2016 non-breeding and 2016 breeding seasons (20th of May 2015 – 19th of August 2016). Surveys were performed in accordance with Scottish Natural Heritage (SNH) Guidance (2014). The flight activity surveys were used to record the presence and activity of Target Species and Secondary Species. The details of the flight activity surveys undertaken at all strategic VP locations are detailed in Table C-2 below. See Table C-3 for the weather data recorded during these surveys, Annex B for the survey methodology and Annex D for the survey results.
Table C-2 Summary of flight activity surveys undertaken at Hopsrig
Date Season VP Observer Survey start time
Survey finish time
No. hours1 surveyed
20/05/2015 BR 2015 1 JM 1030 1330 3 20/05/2015 BR 2015 1 JM 1400 1630 2.5 20/05/2015 BR 2015 3 SS 1145 1445 3 20/05/2015 BR 2015 3 SS 1515 1615 1 21/05/2015 BR 2015 2 SS 0650 0950 3 27/05/2015 BR 2015 2 JM 1200 1500 3 28/05/2015 BR 2015 3 JM 0530 0830 3 28/05/2015 BR 2015 3 JM 0900 1200 3 04/06/2015 BR 2015 2 BH 1030 1330 3 05/06/2015 BR 2015 2 BH 0955 1255 3
1 Note: only valid hours (i.e. where visibility was at least 1km) are presented in this column.
Date Season VP Observer Survey start time
Survey finish time
No. hours1 surveyed
16/06/2015 BR 2015 1 JM 0515 0815 3 16/06/2015 BR 2015 1 JM 0845 1145 3 25/06/2015 BR 2015 2 JM 1435 1735 3 25/06/2015 BR 2015 2 JM 1805 2005 0 26/06/2015 BR 2015 3 JM 0655 0955 3 26/06/2015 BR 2015 3 JM 1025 1325 3 13/07/2015 BR 2015 2 JR 1215 1515 0 13/07/2015 BR 2015 2 JR 1910 2210 2 13/07/2015 BR 2015 3 JAOM 1215 1515 1 13/07/2015 BR 2015 3 JAOM 1900 2200 1 14/07/2015 BR 2015 1 JAOM 1015 1315 3 14/07/2015 BR 2015 1 JAOM 1445 1745 3 20/07/2015 BR 2015 1 JR 1000 1300 3 20/07/2015 BR 2015 1 JR 1330 1630 3 20/07/2015 BR 2015 3 JR 1835 2135 2 21/07/2015 BR 2015 3 JR 0835 1135 3 10/08/2015 BR 2015 1 MW 1100 1400 3 10/08/2015 BR 2015 1 MW 1430 1730 3 10/08/2015 BR 2015 2 JR 1110 1410 2 10/08/2015 BR 2015 2 JR 1440 1740 3 11/08/2015 BR 2015 1 MW 0830 1000 1.5 11/08/2015 BR 2015 3 JR 1240 1340 1 11/08/2015 BR 2015 3 JR 1410 1710 3 11/08/2015 BR 2015 3 JR 1800 2100 3 12/08/2015 BR 2015 2 JR 0900 1200 3 12/08/2015 BR 2015 2 JR 1230 1430 2 13/08/2015 BR 2015 2 JR 0540 0840 3 13/08/2015 BR 2015 2 JR 0910 1210 3 15/09/2015 NBR 2015/2016 2 AM 1210 1510 3 15/09/2015 NBR 2015/2016 3 AM 1600 1900 3 16/09/2015 NBR 2015/2016 1 AM 1330 1630 3 16/09/2015 NBR 2015/2016 3 AM 0940 1240 3 17/09/2015 NBR 2015/2016 1 AM 0845 1145 3 17/09/2015 NBR 2015/2016 2 AM 1245 1545 3 24/09/2015 NBR 2015/2016 1 AM 1100 1400 3 24/09/2015 NBR 2015/2016 2 AM 1500 1800 3 25/09/2015 NBR 2015/2016 1 AM 1300 1600 3 25/09/2015 NBR 2015/2016 3 AM 0845 1145 3 12/10/2015 NBR 2015/2016 1 MW 1100 1400 3 12/10/2015 NBR 2015/2016 1 MW 1430 1730 3 13/10/2015 NBR 2015/2016 3 MW 0715 1015 3 13/10/2015 NBR 2015/2016 3 MW 1045 1345 3 14/10/2015 NBR 2015/2016 2 MW 0715 1015 3
Wind speed Rain Cloud cover Cloud height Calm 0 None 0 In eighths <150m 0 Light air 1 Drizzle/Mist 1 e.g. 3/8 150-500m 1 Light breeze 2 Light showers 2 >500m 2 Gentle breeze 3 Heavy showers 3 Moderate breeze 4 Heavy rain 4 Fresh breeze 5Strong breeze 6 Snow Frost Visibility Moderate gale 7 None 0 None 0 Poor (<1km) 0 Fresh gale 8 On site 1 Ground 1 Moderate (1-2km) 1 Strong gale 9 High ground 2 All day 2 Good (>2km) 2 Whole gale 10Storm 11 Hurricane 12

Hopsrig Wind Farm ES Volume 4: Technical Appendices TA 6.1: Ornithology Annex C
2 | P a g e
Date Season VP Observer Survey start time
Survey finish time
No. hours1 surveyed
14/10/2015 NBR 2015/2016 2 MW 1045 1345 3 11/11/2015 NBR 2015/2016 1 MW 0745 1045 3 11/11/2015 NBR 2015/2016 1 MW 1115 1315 2 12/11/2015 NBR 2015/2016 3 MW 0900 1200 3 12/11/2015 NBR 2015/2016 3 MW 1230 1430 2 13/11/2015 NBR 2015/2016 2 MW 0830 1130 3 13/11/2015 NBR 2015/2016 2 MW 1200 1400 2 02/12/2015 NBR 2015/2016 3 MW 1000 1300 3 02/12/2015 NBR 2015/2016 3 MW 1330 1530 2 03/12/2015 NBR 2015/2016 2 MW 0800 1100 3 03/12/2015 NBR 2015/2016 2 MW 1130 1330 2 04/12/2015 NBR 2015/2016 1 MW 0830 1130 3 04/12/2015 NBR 2015/2016 1 MW 1200 1400 2 26/01/2016 NBR 2015/2016 2 AM 1130 1330 2 26/01/2016 NBR 2015/2016 2 AM 1400 1700 3 27/01/2016 NBR 2015/2016 1 AM 0800 1100 3 27/01/2016 NBR 2015/2016 1 AM 1130 1330 2 29/01/2016 NBR 2015/2016 3 AM 1030 1330 3 29/01/2016 NBR 2015/2016 3 AM 1400 1600 2 25/02/2016 NBR 2015/2016 1 AM 1220 1420 2 25/02/2016 NBR 2015/2016 1 AM 1450 1750 3 26/02/2016 NBR 2015/2016 2 AM 1010 1310 3 26/02/2016 NBR 2015/2016 2 AM 1340 1540 2 27/02/2016 NBR 2015/2016 3 AM 0700 1000 3 27/02/2016 NBR 2015/2016 3 AM 1030 1230 2 09/03/2016 NBR 2015/2016 2 AM 1250 1550 3 09/03/2016 NBR 2015/2016 2 AM 1620 1820 2 10/03/2016 NBR 2015/2016 3 AM 1245 1545 3 10/03/2016 NBR 2015/2016 3 AM 1615 1815 2 11/03/2016 NBR 2015/2016 1 AM 0625 0925 3 11/03/2016 NBR 2015/2016 1 AM 0955 1155 2 29/03/2016 BR 2016 2 MW 0715 1015 3 29/03/2016 BR 2016 2 MW 1045 1345 3 30/03/2016 BR 2016 1 AM 0740 1040 2 30/03/2016 BR 2016 1 AM 1110 1410 3 30/03/2016 BR 2016 3 MW 0715 1015 3 30/03/2016 BR 2016 3 MW 1045 1345 3 04/04/2016 BR 2016 2 MW 1600 1900 3 04/04/2016 BR 2016 3 MW 1230 1530 3 06/04/2016 BR 2016 1 MW 0800 1100 3 06/04/2016 BR 2016 1 MW 1130 1430 3 02/05/2016 BR 2016 2 JR 1400 1700 0
Date Season VP Observer Survey start time
Survey finish time
No. hours1 surveyed
02/05/2016 BR 2016 2 JR 1730 2030 0 02/05/2016 BR 2016 3 FM 1400 1700 3 02/05/2016 BR 2016 3 FM 1730 2030 3 23/05/2016 BR 2016 1 FM 1200 1500 3 23/05/2016 BR 2016 1 FM 1530 1830 3 23/05/2016 BR 2016 3 JR 1210 1510 3 23/05/2016 BR 2016 3 JR 1540 1840 3 24/05/2016 BR 2016 2 JR 1345 1645 3 23/06/2016 BR 2016 1 MW 0830 1130 3 24/06/2016 BR 2016 1 MW 1130 1430 3 27/06/2016 BR 2016 2 MW 0645 0945 3 27/06/2016 BR 2016 2 MW 1015 1315 3 29/06/2016 BR 2016 3 MW 0700 1000 3 29/06/2016 BR 2016 3 MW 1030 1330 3 25/07/2016 BR 2016 3 MW 0830 1130 3 25/07/2016 BR 2016 3 MW 1200 1500 3 26/07/2016 BR 2016 1 MW 0845 1145 2 26/07/2016 BR 2016 1 MW 1215 1515 3 27/07/2016 BR 2016 2 MW 0745 1045 3 27/07/2016 BR 2016 2 MW 1115 1415 3 16/08/2016 BR 2016 1 MW 1315 1615 3 16/08/2016 BR 2016 1 MW 1645 1945 3 17/08/2016 BR 2016 2 MW 1315 1615 3 17/08/2016 BR 2016 2 MW 1645 1945 3 18/08/2016 BR 2016 2 MW 0800 1100 3 18/08/2016 BR 2016 2 MW 1130 1430 3 19/08/2016 BR 2016 1 MW 1130 1330 2 19/08/2016 BR 2016 3 MW 0800 1100 3

Hopsrig Wind Farm ES Volume 4: Technical Appendices TA 6.1: Ornithology Annex C
3 | P a g e
Table C-3 Meteorological conditions during flight activity surveys at Hopsrig
Date VP Observer Survey start time
Survey finish time Survey hour Wind speed Wind
direction Rain Cloud cover Cloud height Visibility Snow Frost
20/05/2015 1 JM 1030 1330 1 4 NW 0 6 2 2 0 0 20/05/2015 1 JM 1030 1330 2 4 NW 0 5 2 2 0 0 20/05/2015 1 JM 1030 1330 3 4 NW 0 4 2 2 0 0 20/05/2015 1 JM 1400 1630 1 4 NW 0 4 2 2 0 0 20/05/2015 1 JM 1400 1630 2 4 NW 0 6 2 2 0 0 20/05/2015 1 JM 1400 1630 3 5 NW 0 6 2 2 0 0 20/05/2015 3 SS 1145 1445 1 4 NW 0 5 2 2 0 0 20/05/2015 3 SS 1145 1445 2 4 NW 0 5 2 2 0 0 20/05/2015 3 SS 1145 1445 3 4 NW 0 5 2 2 0 0 20/05/2015 3 SS 1515 1615 1 4 NW 0 7 2 2 0 0 21/05/2015 2 SS 0650 0950 1 2 NW 0 8 2 1 0 0 21/05/2015 2 SS 0650 0950 2 3 NW 0 8 2 2 0 0 21/05/2015 2 SS 0650 0950 3 3 NW 1 8 2 2 0 0 27/05/2015 2 JM 1200 1500 1 4 S 0 8 2 2 0 0 27/05/2015 2 JM 1200 1500 2 4 SSW 2 8 2 2 0 0 27/05/2015 2 JM 1200 1500 3 5 SSW 0 8 2 2 0 0 28/05/2015 3 JM 0530 0830 1 1 SSW 2 7 2 2 0 0 28/05/2015 3 JM 0530 0830 2 2 SSW 0 7 2 2 0 0 28/05/2015 3 JM 0530 0830 3 3 SSW 0 6 2 2 0 0 28/05/2015 3 JM 0900 1200 1 4 SSW 0 7 2 2 0 0 28/05/2015 3 JM 0900 1200 2 4 SSW 2 7 2 2 0 0 28/05/2015 3 JM 0900 1200 3 5 SSE 2 6 2 2 0 0 04/06/2015 2 BH 1030 1330 1 2 SW 0 4 2 2 0 0 04/06/2015 2 BH 1030 1330 2 1 SW 0 6 2 2 0 0 04/06/2015 2 BH 1030 1300 3 3 SW 0 5 2 2 0 0 05/06/2015 2 BH 0955 1255 1 4 SW 1 8 0 1 0 0 05/06/2015 2 BH 0955 1255 2 3 SW 0 8 1 2 0 0 05/06/2015 2 BH 0955 1255 3 4 SW 1 8 0 1 0 0 16/06/2015 1 JM 0515 0815 1 1 S 0 8 1 1 0 0 16/06/2015 1 JM 0515 0815 2 1 S 2 8 1 1 0 0 16/06/2015 1 JM 0515 0815 3 0 0 0 8 1 1 0 0 16/06/2015 1 JM 0845 1145 1 1 N 0 8 1 1 0 0 16/06/2015 1 JM 0845 1145 2 2 SSW 1 8 1 1 0 0 16/06/2015 1 JM 0845 1145 3 3 SSW 0 8 1 2 0 0 25/06/2015 2 JM 1435 1735 1 3 S 1 8 1 1 0 0 25/06/2015 2 JM 1435 1735 2 3 SSW 0 8 1 1 0 0 25/06/2015 2 JM 1435 1735 3 3 S 1 8 0 1 0 0 25/06/2015 2 JM 1805 2005 1 3 S 1 8 0 0 0 0 25/06/2015 2 JM 1805 2005 2 3 S 4 8 0 0 0 0 26/06/2015 3 JM 0655 0955 1 3 S 1 8 1 1 0 0 26/06/2015 3 JM 0655 0955 2 3 S 2 8 1 1 0 0 26/06/2015 3 JM 0655 0955 3 3 S 3 8 1 1 0 0 26/06/2015 3 JM 1025 1325 1 3 S 3 8 2 2 0 0

Hopsrig Wind Farm ES Volume 4: Technical Appendices TA 6.1: Ornithology Annex C
4 | P a g e
Date VP Observer Survey start time
Survey finish time Survey hour Wind speed Wind
direction Rain Cloud cover Cloud height Visibility Snow Frost
26/06/2015 3 JM 1025 1325 2 4 S 3 8 1 1 0 0 26/06/2015 3 JM 1025 1325 3 4 S 3 8 1 1 0 0 13/07/2015 2 JR 1215 1515 1 1 SSW 1 8 1 0 0 0 13/07/2015 2 JR 1215 1515 2 1 SSW 2 8 1 0 0 0 13/07/2015 2 JR 1215 1515 3 1 SSW 1 8 1 0 0 0 13/07/2015 2 JR 1910 2210 1 1 NW 2 8 1 0 0 0 13/07/2015 2 JR 1910 2210 2 2 NNW 0 7 1 2 0 0 13/07/2015 2 JR 1910 2210 3 2 N 0 3 1 2 0 0 13/07/2015 3 JAOM 1215 1515 1 1 SE 1 8 1 1 0 0 13/07/2015 3 JAOM 1215 1515 2 2 SE 2 8 1 0 0 0 13/07/2015 3 JAOM 1215 1515 3 2 S 1 8 1 0 0 0 13/07/2015 3 JAOM 1900 2200 1 1 S 1 8 1 0 0 0 13/07/2015 3 JAOM 1900 2200 2 1 S 0 3 2 2 0 0 13/07/2015 3 JAOM 1900 2200 3 1 S 0 2 2 0 0 0 14/07/2015 1 JAOM 1015 1315 1 1 SW 0 8 2 2 0 0 14/07/2015 1 JAOM 1015 1315 2 2 SW 0 8 2 2 0 0 14/07/2015 1 JAOM 1015 1315 3 1 SW 0 6 2 2 0 0 14/07/2015 1 JAOM 1445 1745 1 2 SW 0 4 2 2 0 0 14/07/2015 1 JAOM 1445 1745 2 3 SW 0 5 2 2 0 0 14/07/2015 1 JAOM 1445 1745 3 2 SW 0 6 2 2 0 0 20/07/2015 1 JR 1000 1300 1 3 SSE 2 8 1 2 0 0 20/07/2015 1 JR 1000 1300 2 2 SSE 2 8 1 2 0 0 20/07/2015 1 JR 1000 1300 3 3 SSE 2 8 1 2 0 0 20/07/2015 1 JR 1330 1630 1 3 SSE 2 8 1 2 0 0 20/07/2015 1 JR 1330 1630 2 3 SSE 2 8 1 2 0 0 20/07/2015 1 JR 1330 1630 3 3 SSE 1 8 1 2 0 0 20/07/2015 3 JR 1835 2135 1 4 SW 1 8 1 0 0 0 20/07/2015 3 JR 1835 2135 2 5 SW 2 8 1 1 0 0 20/07/2015 3 JR 1835 2135 3 5 SW 0 5 2 2 0 0 21/07/2015 3 JR 0835 1135 1 5 SW 1 8 1 2 0 0 21/07/2015 3 JR 0835 1135 2 4 SW 2 8 1 2 0 0 21/07/2015 3 JR 0835 1135 3 4 SW 2 8 1 2 0 0 10/08/2015 1 MW 1100 1400 1 3 S 2 8 2 2 0 0 10/08/2015 1 MW 1100 1400 2 3 S 2 8 2 2 0 0 10/08/2015 1 MW 1100 1400 3 3 SW 3 8 2 2 0 0 10/08/2015 1 MW 1430 1730 1 4 SSW 4 8 0 1 0 0 10/08/2015 1 MW 1430 1730 2 4 SSW 0 8 2 2 0 0 10/08/2015 1 MW 1430 1730 3 3 SSW 0 7 2 2 0 0 10/08/2015 2 JR 1110 1410 1 4 SSW 3 7 2 2 0 0 10/08/2015 2 JR 1110 1410 2 5 SSW 3 8 2 0 0 0 10/08/2015 2 JR 1110 1410 3 5 SSW 3 8 2 2 0 0 10/08/2015 2 JR 1440 1740 1 5 SSW 3 7 2 2 0 0 10/08/2015 2 JR 1440 1740 2 5 SSW 0 6 2 2 0 0 10/08/2015 2 JR 1440 1740 3 5 SSW 0 5 2 2 0 0 11/08/2015 1 MW 0830 1000 1 2 W 0 2 2 2 0 0

Hopsrig Wind Farm ES Volume 4: Technical Appendices TA 6.1: Ornithology Annex C
5 | P a g e
Date VP Observer Survey start time
Survey finish time Survey hour Wind speed Wind
direction Rain Cloud cover Cloud height Visibility Snow Frost
11/08/2015 1 MW 0830 1000 2 3 W 0 5 2 2 0 0 11/08/2015 3 JR 1240 1340 1 3 WNW 0 8 2 2 0 0 11/08/2015 3 JR 1410 1710 1 2 WNW 0 8 2 2 0 0 11/08/2015 3 JR 1410 1710 2 2 W 0 7 2 2 0 0 11/08/2015 3 JR 1410 1710 3 2 W 0 8 2 2 0 0 11/08/2015 3 JR 1800 2100 1 1 W 2 8 2 2 0 0 11/08/2015 3 JR 1800 2100 2 1 WSW 0 8 2 2 0 0 11/08/2015 3 JR 1800 2100 3 1 WSW 0 7 2 2 0 0 12/08/2015 2 JR 0900 1200 1 1 SSW 0 8 2 2 0 0 12/08/2015 2 JR 0900 1200 2 1 0 0 7 2 2 0 0 12/08/2015 2 JR 0900 1200 3 1 NNE 0 7 2 2 0 0 12/08/2015 2 JR 1230 1430 1 1 NNE 0 7 2 2 0 0 12/08/2015 2 JR 1230 1430 2 1 NNE 0 5 2 2 0 0 13/08/2015 2 JR 0540 0840 1 2 S 0 0 2 2 0 0 13/08/2015 2 JR 0540 0840 2 2 S 0 0 2 2 0 0 13/08/2015 2 JR 0540 0840 3 1 S 0 2 2 2 0 0 13/08/2015 2 JR 0910 1210 1 1 S 0 2 2 2 0 0 13/08/2015 2 JR 0910 1210 2 1 S 0 2 2 2 0 0 13/08/2015 2 JR 0910 1210 3 2 S 0 2 2 2 0 0 15/09/2015 2 AM 1210 1510 1 3 W 0 5 2 2 0 0 15/09/2015 2 AM 1210 1510 2 3 WNW 0 5 2 2 0 0 15/09/2015 2 AM 1210 1510 3 3 WNW 0 5 2 2 0 0 15/09/2015 3 AM 1600 1900 1 3 WNW 0 6 2 2 0 0 15/09/2015 3 AM 1600 1900 2 2 WNW 0 6 2 2 0 0 15/09/2015 3 AM 1600 1900 3 2 W 0 6 2 2 0 0 16/09/2015 1 AM 1330 1630 1 1 SE 0 4 2 2 0 0 16/09/2015 1 AM 1330 1630 2 2 NE 0 5 2 2 0 0 16/09/2015 1 AM 1330 1630 3 2 NE 0 5 2 2 0 0 16/09/2015 3 AM 0940 1240 1 1 NNW 0 2 2 2 0 1 16/09/2015 3 AM 0940 1240 2 1 NNW 0 4 2 2 0 0 16/09/2015 3 AM 0940 1240 3 1 NE 0 4 2 2 0 0 17/09/2015 1 AM 0845 1145 1 1 ESE 0 6 2 2 0 1 17/09/2015 1 AM 0845 1145 2 1 NW 0 6 2 2 0 0 17/09/2015 1 AM 0845 1145 3 2 W 0 7 2 2 0 0 17/09/2015 2 AM 1245 1545 1 2 WNW 2 7 2 2 0 0 17/09/2015 2 AM 1245 1545 2 2 WNW 2 6 2 2 0 0 17/09/2015 2 AM 1245 1545 3 2 WNW 3 7 2 2 0 0 24/09/2015 1 AM 1100 1400 1 4 W 0 5 2 2 0 0 24/09/2015 1 AM 1100 1400 2 4 W 0 5 2 2 0 0 24/09/2015 1 AM 1100 1400 3 4 W 3 5 2 2 0 0 24/09/2015 2 AM 1500 1800 1 4 W 2 6 2 2 0 0 24/09/2015 2 AM 1500 1800 2 4 W 2 7 2 2 0 0 24/09/2015 2 AM 1500 1800 3 4 W 2 5 2 2 0 0 25/09/2015 1 AM 1300 1600 1 3 SW 2 5 2 2 0 0 25/09/2015 1 AM 1300 1600 2 3 SW 0 5 2 2 0 0

Hopsrig Wind Farm ES Volume 4: Technical Appendices TA 6.1: Ornithology Annex C
6 | P a g e
Date VP Observer Survey start time
Survey finish time Survey hour Wind speed Wind
direction Rain Cloud cover Cloud height Visibility Snow Frost
25/09/2015 1 AM 1300 1600 3 3 SW 0 4 2 2 0 0 25/09/2015 3 AM 0845 1145 1 3 W 0 6 2 2 0 0 25/09/2015 3 AM 0845 1145 2 3 W 0 6 2 2 0 0 25/09/2015 3 AM 0845 1145 3 3 SW 2 6 2 2 0 0 12/10/2015 1 MW 1100 1400 1 2 NE 0 4 2 2 0 0 12/10/2015 1 MW 1100 1400 2 3 NE 0 5 2 2 0 0 12/10/2015 1 MW 1100 1400 3 4 NE 0 5 2 2 0 0 12/10/2015 1 MW 1430 1730 1 5 NE 0 6 2 2 0 0 12/10/2015 1 MW 1430 1730 2 5 NE 0 6 2 2 0 0 12/10/2015 1 MW 1430 1730 2 6 NE 0 5 2 2 0 0 13/10/2015 3 MW 0715 1015 1 1 ENE 0 3 2 2 0 0 13/10/2015 3 MW 0715 1015 2 1 ENE 0 2 2 2 0 0 13/10/2015 3 MW 0715 1015 3 2 ENE 0 2 2 2 0 0 13/10/2015 3 MW 1045 1345 1 3 ENE 0 6 2 2 0 0 13/10/2015 3 MW 1045 1345 2 3 ENE 2 7 2 2 0 0 13/10/2015 3 MW 1045 1345 3 3 ENE 0 7 2 2 0 0 14/10/2015 2 MW 0715 1015 1 1 ENE 0 1 1 1 0 1 14/10/2015 2 MW 0715 1015 2 1 ENE 0 2 2 2 0 1 14/10/2015 2 MW 0715 1015 3 1 E 0 3 2 2 0 0 14/10/2015 2 MW 1045 1345 1 1 E 0 4 2 2 0 0 14/10/2015 2 MW 1045 1345 2 1 E 0 4 2 2 0 0 14/10/2015 2 MW 1045 1345 3 2 E 0 5 2 2 0 0 11/11/2015 1 MW 0745 1045 1 5 SW 4 8 2 2 0 0 11/11/2015 1 MW 0745 1045 2 5 SW 4 8 2 2 0 0 11/11/2015 1 MW 0745 1045 3 6 SW 3 8 2 2 0 0 11/11/2015 1 MW 1115 1315 1 6 SW 4 8 2 2 0 0 11/11/2015 1 MW 1115 1315 2 6 SW 4 8 2 2 0 0 12/11/2015 3 MW 0900 1200 1 6 SW 0 8 2 2 0 0 12/11/2015 3 MW 0900 1200 2 6 SW 0 8 2 2 0 0 12/11/2015 3 MW 0900 1200 3 6 SW 0 8 2 2 0 0 12/11/2015 3 MW 1230 1430 1 6 SW 0 8 2 2 0 0 12/11/2015 3 MW 1230 1430 2 5 SW 3 8 2 2 0 0 13/11/2015 2 MW 0830 1130 1 6 WNW 2 7 2 2 0 0 13/11/2015 2 MW 0830 1130 2 7 WNW 0 7 2 2 0 0 13/11/2015 2 MW 0830 1130 3 7 WNW 2 8 2 2 0 0 13/11/2015 2 MW 1200 1400 1 7 WNW 0 8 2 2 0 0 13/11/2015 2 MW 1200 1400 2 7 NW 4 7 2 2 0 0 02/12/2015 3 MW 1000 1300 1 4 SW 3 8 1 1 0 0 02/12/2015 3 MW 1000 1300 2 4 SW 3 8 1 1 0 0 02/12/2015 3 MW 1000 1300 3 4 SW 3 8 1 1 0 0 02/12/2015 3 MW 1330 1530 1 5 SW 3 8 2 2 0 0 02/12/2015 3 MW 1330 1530 2 5 W 0 8 2 2 0 0 03/12/2015 2 MW 0800 1100 1 1 W 0 3 2 2 0 1 03/12/2015 2 MW 0800 1100 2 2 W 0 7 2 2 0 0 03/12/2015 2 MW 0800 1100 3 3 W 0 8 2 2 0 0

Hopsrig Wind Farm ES Volume 4: Technical Appendices TA 6.1: Ornithology Annex C
7 | P a g e
Date VP Observer Survey start time
Survey finish time Survey hour Wind speed Wind
direction Rain Cloud cover Cloud height Visibility Snow Frost
03/12/2015 2 MW 1130 1330 1 3 WNW 4 8 2 2 0 0 03/12/2015 2 MW 1130 1330 2 2 WNW 4 8 1 1 0 0 04/12/2015 1 MW 0830 1130 1 7 SW 0 6 2 2 0 0 04/12/2015 1 MW 0830 1130 1 8 WSW 0 8 2 2 0 0 04/12/2015 1 MW 0830 1130 2 7 WSW 0 8 2 2 0 0 04/12/2015 1 MW 0830 1130 2 8 WSW 0 8 2 2 0 0 04/12/2015 1 MW 0830 1130 3 8 WSW 0 8 2 2 0 0 26/01/2016 2 AM 1130 1330 1 5 SW 4 8 1 1 0 0 26/01/2016 2 AM 1130 1330 2 5 SW 4 8 1 1 0 0 26/01/2016 2 AM 1400 1700 1 5 SW 4 8 1 1 0 0 26/01/2016 2 AM 1400 1700 2 5 SW 3 8 1 1 0 0 26/01/2016 2 AM 1400 1700 3 4 SW 3 8 1 2 0 0 27/01/2016 1 AM 0800 1100 1 3 SW 4 8 2 2 0 0 27/01/2016 1 AM 0800 1100 2 1 WSW 3 7 2 2 0 0 27/01/2016 1 AM 0800 1100 3 3 WSW 2 7 2 2 0 0 27/01/2016 1 AM 1130 1330 1 4 WSW 3 5 2 2 0 0 27/01/2016 1 AM 1130 1330 2 4 WSW 0 6 2 2 0 0 29/01/2016 3 AM 1030 1330 1 5 WSW 3 6 2 2 0 0 29/01/2016 3 AM 1030 1330 2 5 WSW 3 6 2 2 0 0 29/01/2016 3 AM 1030 1330 3 4 WSW 2 7 2 2 0 0 29/01/2016 3 AM 1400 1600 1 4 WSW 0 7 2 2 0 0 29/01/2016 3 AM 1400 1600 2 4 WSW 0 8 2 2 0 0 25/02/2016 1 AM 1220 1420 1 1 WNW 0 8 2 2 0 0 25/02/2016 1 AM 1220 1420 2 2 WNW 0 8 2 2 0 0 25/02/2016 1 AM 1450 1750 1 1 NNW 2 8 2 2 0 0 25/02/2016 1 AM 1450 1750 2 1 NNW 2 8 2 2 0 0 25/02/2016 1 AM 1450 1750 3 1 WNW 0 8 2 2 0 0 26/02/2016 2 AM 1010 1310 1 1 SE 2 8 2 2 1 1 26/02/2016 2 AM 1010 1310 2 1 SW 0 8 2 2 1 1 26/02/2016 2 AM 1010 1310 3 1 WNW 0 8 2 2 1 0 26/02/2016 2 AM 1340 1540 1 1 WNW 0 6 2 2 2 0 26/02/2016 2 AM 1340 1540 2 1 WNW 0 5 2 2 2 0 27/02/2016 3 AM 0700 1000 1 0 0 0 4 2 2 0 1 27/02/2016 3 AM 0700 1000 2 0 0 0 6 2 2 0 1 27/02/2016 3 AM 0700 1000 3 0 0 0 7 2 2 0 1 27/02/2016 3 AM 1030 1230 1 1 NE 0 6 2 2 0 0 27/02/2016 3 AM 1030 1230 2 1 NE 0 7 2 2 0 0 09/03/2016 3 AM 1250 1550 1 3 NE 0 7 2 2 2 0 09/03/2016 3 AM 1250 1550 2 3 NE 0 6 2 2 2 0 09/03/2016 3 AM 1250 1550 3 3 NE 0 6 2 2 2 0 09/03/2016 3 AM 1620 1820 1 3 NE 0 5 2 2 2 0 09/03/2016 3 AM 1620 1820 2 2 NE 0 4 2 2 2 0 10/03/2016 3 AM 1245 1545 1 1 NE 0 7 2 2 2 0 10/03/2016 3 AM 1245 1545 2 1 SE 0 7 2 2 2 0 10/03/2016 3 AM 1245 1545 3 1 SE 0 7 2 2 2 0

Hopsrig Wind Farm ES Volume 4: Technical Appendices TA 6.1: Ornithology Annex C
8 | P a g e
Date VP Observer Survey start time
Survey finish time Survey hour Wind speed Wind
direction Rain Cloud cover Cloud height Visibility Snow Frost
10/03/2016 3 AM 1615 1815 1 1 SSW 0 7 2 2 2 0 10/03/2016 3 AM 1615 1815 2 1 SSW 0 6 2 2 2 0 11/03/2016 1 AM 0625 0925 1 0 0 1 4 2 1 2 1 11/03/2016 1 AM 0625 0925 2 1 SE 0 5 2 2 2 1 11/03/2016 1 AM 0625 0925 3 1 SE 1 7 2 2 2 1 11/03/2016 1 AM 0955 1155 1 1 SE 0 7 2 2 2 0 11/03/2016 1 AM 0955 1155 2 1 SE 0 8 2 2 2 0 29/03/2016 2 MW 0715 1015 1 3 SW 0 5 2 2 0 1 29/03/2016 2 MW 0715 1015 2 3 SW 0 5 2 2 0 0 29/03/2016 2 MW 0715 1015 3 3 SW 0 6 2 2 0 0 29/03/2016 2 MW 1045 1345 1 3 SW 0 7 2 2 0 0 29/03/2016 2 MW 1045 1345 2 3 SW 0 8 2 2 0 0 29/03/2016 2 MW 1045 1345 3 4 SSW 3 8 2 2 0 0 30/03/2016 1 AM 0740 1040 1 1 WNW 1 6 1 0 2 1 30/03/2016 1 AM 0740 1040 2 1 NW 0 7 2 2 2 1 30/03/2016 1 AM 0740 1040 3 2 WNW 0 6 2 2 2 0 30/03/2016 1 AM 1110 1410 1 3 WSW 0 6 2 2 2 0 30/03/2016 1 AM 1110 1410 2 3 SW 2 8 2 2 2 0 30/03/2016 1 AM 1110 1410 3 3 SW 0 7 2 2 2 0 30/03/2016 3 MW 0715 1015 1 2 SSW 0 8 1 1 1 1 30/03/2016 3 MW 0715 1015 2 3 SSW 0 7 1 1 1 1 30/03/2016 3 MW 0715 1015 3 3 SSW 0 7 2 2 1 0 30/03/2016 3 MW 1045 1345 1 3 SW 0 8 2 2 2 0 30/03/2016 3 MW 1045 1345 2 3 SW 0 8 2 2 2 0 30/03/2016 3 MW 1045 1345 3 4 SW 0 8 2 2 2 0 04/04/2016 2 MW 1600 1900 1 3 SSW 0 8 2 2 0 0 04/04/2016 2 MW 1600 1900 2 3 SSW 0 8 2 2 0 0 04/04/2016 2 MW 1600 1900 3 3 SSW 0 8 2 2 0 0 04/04/2016 3 MW 1230 1530 1 2 SSW 0 8 2 2 0 0 04/04/2016 3 MW 1230 1530 2 3 SSW 0 8 2 2 0 0 04/04/2016 3 MW 1230 1530 3 3 SSW 0 8 2 2 0 0 06/04/2016 1 MW 0800 1100 1 5 WSW 3 8 2 2 0 0 06/04/2016 1 MW 0800 1100 2 5 WSW 3 8 2 2 0 0 06/04/2016 1 MW 0800 1100 3 6 WSW 4 8 2 2 0 0 06/04/2016 1 MW 1130 1430 1 6 WSW 3 8 2 2 0 0 06/04/2016 1 MW 1130 1430 2 6 WSW 3 8 2 2 0 0 06/04/2016 1 MW 1130 1430 3 7 WSW 3 8 2 2 0 0 02/05/2016 2 JR 1400 1730 1 3 W 0 5 2 2 2 0 02/05/2016 2 JR 1400 1730 2 3 W 2 6 2 2 2 0 02/05/2016 2 JR 1400 1730 3 3 W 3 6 2 2 2 0 02/05/2016 2 JR 1700 2030 1 4 W 2 5 2 2 2 0 02/05/2016 2 JR 1700 2030 2 4 WNW 3 7 2 2 2 0 02/05/2016 2 JR 1700 2030 3 4 WNW 2 6 2 2 2 0 02/05/2016 3 FM 1400 1700 1 3 NW 2 6 2 2 0 0 02/05/2016 3 FM 1400 1700 2 3 WNW 3 7 2 2 0 0
Hopsrig Wind Farm ES Volume 4: Technical Appendices TA 6.1: Ornithology Annex C
9 | P a g e
Date VP Observer Survey start time
Survey finish time Survey hour Wind speed Wind
direction Rain Cloud cover Cloud height Visibility Snow Frost
02/05/2016 3 FM 1400 1700 3 3 WNW 3 6 2 2 0 0 02/05/2016 3 FM 1730 2030 1 3 WSW 3 8 1 2 0 0 02/05/2016 3 FM 1730 2030 2 3 WSW 0 5 2 2 0 0 02/05/2016 3 FM 1730 2030 3 3 WSW 3 5 2 2 0 0 23/05/2016 1 FM 1200 1500 1 1 NW 0 5 2 2 0 0 23/05/2016 1 FM 1200 1500 2 2 NW 0 6 2 2 0 0 23/05/2016 1 FM 1200 1500 3 2 NW 1 6 2 2 0 0 23/05/2016 1 FM 1530 1830 1 2 NW 1 6 2 2 0 0 23/05/2016 1 FM 1530 1830 2 2 NW 1 6 2 2 0 0 23/05/2016 1 FM 1530 1830 3 1 NW 1 6 2 2 0 0 23/05/2016 3 JR 1210 1510 1 1 NNE 0 4 2 2 0 0 23/05/2016 3 JR 1210 1510 2 2 WNW 2 4 2 2 0 0 23/05/2016 3 JR 1210 1510 3 2 NW 2 4 2 2 0 0 23/05/2016 3 JR 1540 1840 1 2 NNW 2 6 2 2 0 0 23/05/2016 3 JR 1540 1840 2 2 Variable 2 6 2 2 0 0 23/05/2016 3 JR 1540 1840 3 2 Variable 2 6 2 2 0 0 24/05/2016 2 JR 1345 1645 1 3 NNE 0 4 2 2 0 0 24/05/2016 2 JR 1345 1645 2 4 NNE 0 5 2 2 0 0 24/05/2016 2 JR 1345 1645 3 4 NNE 0 5 2 2 0 0 23/06/2016 1 MW 0830 1130 1 2 SW 0 7 2 2 0 0 23/06/2016 1 MW 0830 1130 2 2 SW 0 6 2 2 0 0 23/06/2016 1 MW 0830 1130 3 2 SW 0 5 2 2 0 0 24/06/2016 1 MW 1130 1430 1 5 SW 0 6 2 2 0 0 24/06/2016 1 MW 1130 1430 2 5 SW 0 6 2 2 0 0 24/06/2016 1 MW 1130 1430 3 4 SW 0 5 2 2 0 0 27/06/2016 2 MW 0645 0945 1 5 W 0 6 2 2 0 0 27/06/2016 2 MW 0645 0945 2 5 W 0 5 2 2 0 0 27/06/2016 2 MW 0645 0945 3 5 SW 0 7 2 2 0 0 27/06/2016 2 MW 1015 1315 1 6 SW 0 8 2 2 0 0 27/06/2016 2 MW 1015 1315 2 6 SW 0 8 2 2 0 0 27/06/2016 2 MW 1015 1315 3 6 SW 0 7 2 2 0 0 29/06/2016 3 MW 0700 1000 1 1 SW 0 8 2 2 0 0 29/06/2016 3 MW 0700 1000 2 2 SW 0 8 2 2 0 0 29/06/2016 3 MW 0700 1000 3 3 SW 3 8 2 2 0 0 29/06/2016 3 MW 1030 1330 1 3 SW 4 8 1 1 0 0 29/06/2016 3 MW 1030 1330 2 3 SW 4 8 1 1 0 0 29/06/2016 3 MW 1030 1330 3 2 SW 4 8 1 1 0 0 25/07/2016 3 MW 0830 1130 1 3 SW 0 7 2 2 0 0 25/07/2016 3 MW 0830 1130 2 4 SW 3 8 2 2 0 0 25/07/2016 3 MW 0830 1130 3 4 SW 3 8 2 2 0 0 25/07/2016 3 MW 1200 1500 1 4 SW 3 8 2 2 0 0 25/07/2016 3 MW 1200 1500 2 5 SW 3 8 2 2 0 0 25/07/2016 3 MW 1200 1500 3 5 SW 0 7 2 2 0 0 26/07/2016 1 MW 0845 1145 1 3 SW 3 8 1 1 0 0 26/07/2016 1 MW 0845 1145 2 2 SW 1 8 0 0 0 0
Hopsrig Wind Farm ES Volume 4: Technical Appendices TA 6.1: Ornithology Annex C
10 | P a g e
Date VP Observer Survey start time
Survey finish time Survey hour Wind speed Wind
direction Rain Cloud cover Cloud height Visibility Snow Frost
26/07/2016 1 MW 0845 1145 3 2 SW 0 8 1 1 0 0 26/07/2016 1 MW 1215 1515 1 2 SW 0 8 2 2 0 0 26/07/2016 1 MW 1215 1515 2 2 SW 0 7 2 2 0 0 26/07/2016 1 MW 1215 1515 3 2 SW 3 8 2 2 0 0 27/07/2016 2 MW 0745 1045 1 4 WSW 0 6 2 2 0 0 27/07/2016 2 MW 0745 1045 2 4 WSW 0 6 2 2 0 0 27/07/2016 2 MW 0745 1045 3 4 WSW 0 7 2 2 0 0 27/07/2016 2 MW 1115 1415 1 4 WSW 0 7 2 2 0 0 27/07/2016 2 MW 1115 1415 2 5 WSW 0 6 2 2 0 0 27/07/2016 2 MW 1115 1415 3 5 WSW 0 6 2 2 0 0 16/08/2016 1 MW 1315 1615 1 1 SSW 0 1 2 2 0 0 16/08/2016 1 MW 1315 1615 2 2 SSW 0 1 2 2 0 0 16/08/2016 1 MW 1315 1615 3 3 SSW 0 1 2 2 0 0 16/08/2016 1 MW 1645 1945 1 3 SSE 0 1 2 2 0 0 16/08/2016 1 MW 1645 1945 2 3 SSE 0 2 2 2 0 0 16/08/2016 1 MW 1645 1945 3 3 SSE 0 2 2 2 0 0 17/08/2016 2 MW 1315 1615 1 2 ESE 0 1 2 2 0 0 17/08/2016 2 MW 1315 1615 2 2 ESE 0 2 2 2 0 0 17/08/2016 2 MW 1315 1615 3 3 ESE 0 3 2 2 0 0 17/08/2016 2 MW 1645 1945 1 3 ESE 0 3 2 2 0 0 17/08/2016 2 MW 1645 1945 2 3 SE 0 3 2 2 0 0 17/08/2016 2 MW 1645 1945 3 3 SE 0 3 2 2 0 0 18/08/2016 2 MW 0800 1100 1 2 ESE 0 8 2 2 0 0 18/08/2016 2 MW 0800 1100 2 2 ESE 0 8 2 2 0 0 18/08/2016 2 MW 0800 1100 3 3 ESE 0 8 2 2 0 0 18/08/2016 2 MW 1130 1430 1 3 ESE 0 5 2 2 0 0 18/08/2016 2 MW 1130 1430 2 3 ESE 0 4 2 2 0 0 18/08/2016 2 MW 1130 1430 3 4 ESE 0 5 2 2 0 0 19/08/2016 2 MW 1130 1330 1 5 SSE 2 8 2 2 0 0 19/08/2016 2 MW 1130 1330 2 6 SSE 4 8 2 2 0 0 19/08/2016 3 MW 0800 1100 1 4 SSE 0 8 2 2 0 0 19/08/2016 3 MW 0800 1100 2 4 SSE 0 8 2 2 0 0 19/08/2016 3 MW 0800 1100 3 5 SSE 0 8 2 2 0 0

Hopsrig Wind Farm ES Volume 4: Technical Appendices TA 6.1: Ornithology Annex C
11 | P a g e
Moorland Breeding Bird Surveys Moorland breeding bird surveys were undertaken during the 2015 and 2016 breeding seasons and were conducted on four occasions between May and July 2015 and on four occasions between April and July 2016. See Table C-4 for the survey dates and weather data recorded during these surveys, Annex B for the survey methodology and Annex D for the survey results.
Table C-4 Meteorological conditions during breeding bird surveys at Hopsrig
Date Survey visit Observer Survey start time
Survey finish time Survey hour Wind speed Wind direction Rain Cloud cover Cloud height Visibility Snow Frost
21/05/2015 5 JM 0610 1010 1 2 NW 0 8 2 1 0 0 21/05/2015 5 JM 0610 1010 2 3 NW 0 8 2 2 0 0 21/05/2015 5 JM 0610 1010 3 3 NW 1 8 2 2 0 0 04/06/2015 2 BH 1330 1715 1 3 SW 0 4 2 2 0 0 04/06/2015 2 BH 1330 1715 2 3 SW 0 5 2 2 0 0 04/06/2015 2 BH 1330 1715 3 3 SW 0 5 2 2 0 0 04/06/2015 2 BH 1330 1715 4 3 SW 0 5 2 2 0 0 15/06/2015 3 JM 0920 1520 1 2 SW 0 8 2 2 0 0 15/06/2015 3 JM 0920 1520 2 2 SW 0 8 2 2 0 0 15/06/2015 3 JM 0920 1520 3 2 SW 0 8 2 2 0 0 15/06/2015 3 JM 0920 1520 4 2 SW 0 8 2 2 0 0 15/06/2015 3 JM 0920 1520 5 3 SW 0 8 2 2 0 0 15/06/2015 3 JM 0920 1520 6 2 SW 0 8 2 2 0 0 14/07/2015 4 JAOM 1315 1445 1 2 SW 0 5 2 2 0 0 14/07/2015 4 JAOM 1315 1445 2 2 SW 0 4 2 2 0 0 14/07/2015 4 JR 1000 1600 1 1 SW 0 7 2 2 0 0 14/07/2015 4 JR 1315 1445 1 2 SW 0 5 2 2 0 0 14/07/2015 4 JR 1000 1600 2 2 SW 0 5 2 2 0 0 14/07/2015 4 JR 1315 1445 2 2 SW 0 5 2 2 0 0 14/07/2015 4 JR 1000 1600 3 2 WSW 0 6 2 2 0 0 14/07/2015 4 JR 1000 1600 4 2 W 0 4 2 2 0 0 14/07/2015 4 JR 1000 1600 5 1 W 0 4 2 2 0 0 14/07/2015 4 JR 1000 1600 6 2 W 0 4 2 2 0 0 05/04/2016 5 MW 0730 1130 1 0 0 4 8 2 2 0 0 05/04/2016 5 MW 0730 1130 2 1 SW 4 8 2 2 0 0 05/04/2016 5 MW 0730 1130 3 1 SW 4 8 2 2 0 0 05/04/2016 5 MW 0730 1130 4 2 SW 4 8 2 2 0 0 07/04/2016 5 MW 0745 1145 1 1 NNW 0 3 2 2 0 0 07/04/2016 5 MW 0745 1145 2 1 NNW 0 3 2 2 0 0 07/04/2016 5 MW 0745 1145 3 1 NNW 0 3 2 2 0 0 07/04/2016 5 MW 0745 1145 4 2 NNW 0 3 2 2 0 0 08/04/2016 5 MW 0730 1130 1 1 S 0 8 2 2 0 0 08/04/2016 5 MW 0730 1130 2 1 S 0 8 2 2 0 0 08/04/2016 5 MW 0730 1130 3 2 S 2 8 2 2 0 0 08/04/2016 5 MW 0730 1130 4 2 S 3 8 2 2 0 0

Hopsrig Wind Farm ES Volume 4: Technical Appendices TA 6.1: Ornithology Annex C
12 | P a g e
Date Survey visit Observer Survey start time
Survey finish time Survey hour Wind speed Wind direction Rain Cloud cover Cloud height Visibility Snow Frost
03/05/2016 6 FM 0830 1430 1 2 WSW 2 7 2 2 0 0 03/05/2016 6 FM 0830 1430 2 2 WSW 3 7 2 2 0 0 03/05/2016 6 FM 0830 1430 3 2 WSW 2 7 2 2 0 0 03/05/2016 6 FM 0830 1430 4 2 WSW 1 6 2 2 0 0 03/05/2016 6 FM 0830 1430 5 2 W 2 6 2 2 0 0 03/05/2016 6 FM 0830 1430 6 2 W 1 6 2 2 0 0 03/05/2016 6 JR 0830 1430 1 3 W 3 6 2 2 2 0 03/05/2016 6 JR 0830 1430 2 3 W 3 6 2 2 2 0 03/05/2016 6 JR 0830 1430 3 3 W 3 7 2 2 2 0 03/05/2016 6 JR 0830 1430 4 2 WSW 2 5 2 2 2 0 03/05/2016 6 JR 0830 1430 5 3 W 2 6 2 2 2 0 03/05/2016 6 JR 0830 1430 6 3 WNW 2 6 2 2 2 0 23/06/2016 7 MW 1135 1435 1 3 SW 0 5 2 2 0 0 23/06/2016 7 MW 1135 1435 2 3 SW 0 5 2 2 0 0 23/06/2016 7 MW 1135 1435 3 3 SW 0 4 2 2 0 0 24/06/2016 7 MW 0820 1120 1 4 SW 4 8 2 2 0 0 24/06/2016 7 MW 0820 1120 2 4 SW 2 8 2 2 0 0 24/06/2016 7 MW 0820 1120 3 3 SW 0 7 2 2 0 0 30/06/2016 7 MW 0700 1300 1 3 SSW 0 8 2 2 0 0 30/06/2016 7 MW 0700 1300 2 4 SSW 0 8 2 2 0 0 30/06/2016 7 MW 0700 1300 3 4 SW 0 7 2 2 0 0 30/06/2016 7 MW 0700 1300 4 4 SW 3 8 2 2 0 0 30/06/2016 7 MW 0700 1300 5 4 SW 3 8 2 2 0 0 30/06/2016 7 MW 0700 1300 6 4 SW 2 8 2 2 0 0 28/07/2016 8 MW 0815 1415 1 2 WNW 0 8 2 2 0 0 28/07/2016 8 MW 0815 1415 2 2 WNW 4 8 2 2 0 0 28/07/2016 8 MW 0815 1415 3 2 WNW 4 8 2 2 0 0 28/07/2016 8 MW 0815 1415 4 3 WNW 4 8 2 2 0 0 28/07/2016 8 MW 0815 1415 5 3 WNW 4 8 2 2 0 0 28/07/2016 8 MW 0815 1415 6 3 WNW 4 8 2 2 0 0

Hopsrig Wind Farm ES Volume 4: Technical Appendices TA 6.1: Ornithology Annex C
13 | P a g e
Winter Walkover Surveys Winter walkover surveys were undertaken during the 2015/2016 non-breeding season and were conducted during October and November 2015 and January 2016. See Table C-5 for the survey dates and weather data recorded during these surveys, see Annex B for the survey methodology and Annex D for the survey results.
Table C-5 Meteorological conditions during winter walkover surveys at Hopsrig.
Date Survey visit Observer Survey start time
Survey finish time Survey hour Wind speed Wind direction Rain Cloud cover Cloud height Visibility Snow Frost
15/10/2015 1 MW 0730 1330 1 1 ENE 0 1 1 1 0 1 15/10/2015 1 MW 0730 1330 2 1 ENE 0 2 2 2 0 1 15/10/2015 1 MW 0730 1330 3 1 ENE 0 3 2 2 0 0 15/10/2015 1 MW 0730 1330 4 2 ENE 0 3 2 2 0 0 15/10/2015 1 MW 0730 1330 5 2 ENE 0 4 2 2 0 0 15/10/2015 1 MW 0730 1330 6 2 ENE 0 4 2 2 0 0 16/10/2015 1 MW 0715 1215 1 3 NE 0 6 2 2 0 0 16/10/2015 1 MW 0715 1215 2 3 NE 0 6 2 2 0 0 16/10/2015 1 MW 0715 1215 3 4 NE 0 7 2 2 0 0 16/10/2015 1 MW 0715 1215 4 4 NE 0 8 2 2 0 0 16/10/2015 1 MW 0715 1215 5 4 NE 0 8 2 2 0 0 16/10/2015 1 MW 0715 1215 6 5 NE 0 8 2 2 0 0 09/11/2015 2 MW 0930 1430 1 7 SSW 4 8 2 2 0 0 09/11/2015 2 MW 0930 1430 2 7 SSW 4 8 2 2 0 0 09/11/2015 2 MW 0930 1430 3 7 SSW 4 8 2 2 0 0 09/11/2015 2 MW 0930 1430 4 7 SSW 4 8 1 1 0 0 09/11/2015 2 MW 0930 1430 5 8 SSW 4 8 1 1 0 0 10/11/2015 2 MW 0930 1430 1 8 SSW 4 8 0 0 0 0 10/11/2015 2 MW 0930 1430 2 7 SSW 4 8 0 0 0 0 10/11/2015 2 MW 0930 1430 3 7 SSW 4 8 1 1 0 0 10/11/2015 2 MW 0930 1430 4 7 SSW 4 8 1 1 0 0 10/11/2015 2 MW 0930 1430 5 7 SSW 4 8 1 1 0 0 30/01/2016 3 AM 0910 1610 1 4 WSW 0 6 2 2 1 0 30/01/2016 3 AM 0910 1610 2 5 WSW 2 6 2 2 1 0 30/01/2016 3 AM 0910 1610 3 5 WSW 3 6 2 2 1 0 30/01/2016 3 AM 0910 1610 4 5 WSW 2 6 2 2 1 0 30/01/2016 3 AM 0910 1610 5 5 WSW 3 7 2 2 1 0 30/01/2016 3 AM 0910 1610 6 4 WSW 3 6 2 2 1 0 30/01/2016 3 AM 0910 1610 7 4 WSW 3 6 2 2 1 0 31/01/2016 3 AM 0930 1430 1 2 WNW 2 8 1 2 1 0 31/01/2016 3 AM 0930 1430 2 2 WNW 0 8 1 2 1 0 31/01/2016 3 AM 0930 1430 3 2 WNW 1 8 1 2 1 0 31/01/2016 3 AM 0930 1430 4 2 WNW 4 8 1 2 1 0 31/01/2016 3 AM 0930 1430 5 1 WNW 4 8 1 2 1 0

Hopsrig Wind Farm ES Volume 4: Technical Appendices TA 6.1: Ornithology Annex C
14 | P a g e
Scarce Breeding Bird Surveys Scarce breeding bird surveys were undertaken during the 2015 and 2016 breeding seasons and were conducted monthly from May to August 2015 and March to August 2016. See Table C-6 for the survey dates and weather data recorded during these surveys, Annex B for the survey methodology and Annex D for the survey results.
Table C-6 Meteorological conditions during scarce breeding bird surveys at Hopsrig
Date Survey visit Observer Survey start time
Survey finish time Survey hour Wind speed Wind direction Rain Cloud cover Cloud height Visibility Snow Frost
28/05/2015 1 JR 1000 1600 1 4 W 3 4 2 2 0 0 28/05/2015 1 JR 1000 1600 2 5 W 3 3 2 2 0 0 28/05/2015 1 JR 1000 1600 3 5 WSW 3 3 2 2 0 0 28/05/2015 1 JR 1000 1600 4 5 WSW 0 4 2 2 0 0 28/05/2015 1 JR 1000 1600 5 6 WSW 2 4 2 2 0 0 28/05/2015 1 JR 1000 1600 6 6 WSW 2 5 2 2 0 0 29/05/2015 1 JR 0815 1415 1 1 Variable 1 8 2 2 0 0 29/05/2015 1 JR 0815 1415 2 1 SW 0 8 2 2 0 0 29/05/2015 1 JR 0815 1415 3 2 SW 2 7 2 2 0 0 29/05/2015 1 JR 0815 1415 4 3 W 2 6 2 2 0 0 29/05/2015 1 JR 0815 1415 5 3 NW 2 6 2 2 0 0 29/05/2015 1 JR 0815 1415 6 2 W 2 5 2 2 0 0 04/06/2015 2 JAOM 0900 1500 1 2 SW 0 5 2 2 0 0 04/06/2015 2 JAOM 0900 1500 2 2 SW 0 5 2 2 0 0 04/06/2015 2 JAOM 0900 1500 3 1 SW 0 5 2 2 0 0 04/06/2015 2 JAOM 0900 1500 4 3 SW 0 5 2 2 0 0 04/06/2015 2 JAOM 0900 1500 5 2 SW 0 6 2 2 0 0 04/06/2015 2 JAOM 0900 1500 6 2 SW 0 6 2 2 0 0 04/06/2015 2 JAOM 1500 1730 1 1 SW 0 3 2 2 0 0 04/06/2015 2 JAOM 1500 1730 2 1 SW 0 3 2 2 0 0 05/06/2015 2 JAOM 0930 1300 1 3 WSW 0 8 2 2 0 0 05/06/2015 2 JAOM 0930 1300 2 4 WSW 1 8 2 2 0 0 05/06/2015 2 JAOM 0930 1300 3 4 WSW 1 8 2 2 0 0 05/06/2015 2 JAOM 0930 1300 4 4 WSW 1 8 2 2 0 0 13/07/2015 3 JAOM 0830 1215 1 1 SE 1 8 1 1 0 0 13/07/2015 3 JAOM 0830 1215 2 1 SE 1 8 1 0 0 0 13/07/2015 3 JAOM 0830 1215 3 1 SE 1 8 1 1 0 0 13/07/2015 3 JR/JM 0900 1200 1 1 SE 2 8 1 1 0 0 13/07/2015 3 JR/JM 0900 1200 2 1 Variable 1 8 1 1 0 0 13/07/2015 3 JR/JM 0900 1200 3 1 Variable 2 8 1 1 0 0 14/07/2015 3 JR 1600 1800 1 2 0 0 4 2 2 0 0 14/07/2015 3 JR 1600 1800 2 2 0 0 0 2 2 0 0 15/07/2015 3 JR/JM 1000 1100 1 1 Variable 0 3 2 2 0 0 11/08/2015 4 MW 1010 1510 1 3 W 0 5 2 2 0 0 11/08/2015 4 MW 1010 1510 2 4 W 0 6 2 2 0 0

Hopsrig Wind Farm ES Volume 4: Technical Appendices TA 6.1: Ornithology Annex C
15 | P a g e
Date Survey visit Observer Survey start time
Survey finish time Survey hour Wind speed Wind direction Rain Cloud cover Cloud height Visibility Snow Frost
11/08/2015 4 MW 1010 1510 3 3 W 0 7 2 2 0 0 11/08/2015 4 MW 1010 1510 4 4 W 0 7 2 2 0 0 11/08/2015 4 MW 1010 1510 5 4 W 0 8 2 2 0 0 12/08/2015 4 JR 1430 1730 4 1 W 0 3 2 2 0 0 12/08/2015 4 JR 1430 1730 5 1 Variable 0 2 2 2 0 0 12/08/2015 4 JR 1430 1730 6 1 Variable 0 1 2 2 0 0 13/08/2015 4 JR 1230 1530 1 1 S 0 2 2 2 0 0 13/08/2015 4 JR 1230 1530 2 2 SSW 0 2 2 2 0 0 13/08/2015 4 JR 1230 1530 3 2 SSW 0 2 2 2 0 0 14/08/2015 4 JR 0830 1030 1 1 S 4 8 1 2 0 0 14/08/2015 4 JR 0830 1030 2 1 E 4 8 1 1 0 0 31/03/2016 5 AM 0900 1500 1 0 0 1 7 2 2 2 0 31/03/2016 5 AM 0900 1500 2 1 WNW 0 6 2 2 2 0 31/03/2016 5 AM 0900 1500 3 1 WNW 0 6 2 2 2 0 31/03/2016 5 AM 0900 1500 4 2 SW 0 6 2 2 2 0 31/03/2016 5 AM 0900 1500 5 2 SW 0 5 2 2 2 0 31/03/2016 5 AM 0900 1500 6 2 SW 0 5 2 2 2 0 31/03/2016 5 MW 0630 1230 1 1 SW 0 4 2 2 0 1 31/03/2016 5 MW 0630 1230 2 1 SW 0 5 2 2 0 0 31/03/2016 5 MW 0630 1230 3 2 SW 0 5 2 2 0 0 31/03/2016 5 MW 0630 1230 4 2 SW 0 5 2 2 0 0 31/03/2016 5 MW 0630 1230 5 2 SW 0 5 2 2 0 0 31/03/2016 5 MW 0630 1230 6 3 SW 0 6 2 2 0 0 05/04/2016 6 MW 0730 1130 1 0 0 4 8 2 2 0 0 05/04/2016 6 MW 0730 1130 2 1 SW 4 8 2 2 0 0 05/04/2016 6 MW 0730 1130 3 1 SW 4 8 2 2 0 0 05/04/2016 6 MW 0730 1130 4 2 SW 4 8 2 2 0 0 07/04/2016 6 MW 0745 1145 1 1 NNW 0 3 2 2 0 0 07/04/2016 6 MW 0745 1145 2 1 NNW 0 3 2 2 0 0 07/04/2016 6 MW 0745 1145 3 1 NNW 0 3 2 2 0 0 07/04/2016 6 MW 0745 1145 4 2 NNW 0 3 2 2 0 0 08/04/2016 6 MW 0730 1130 1 1 S 0 8 2 2 0 0 08/04/2016 6 MW 0730 1130 2 1 S 0 8 2 2 0 0 08/04/2016 6 MW 0730 1130 3 2 S 2 8 2 2 0 0 08/04/2016 6 MW 0730 1130 4 2 S 3 8 2 2 0 0 03/05/2016 7 FM 1430 1630 1 2 W 0 6 2 2 0 0 03/05/2016 7 FM 1430 1630 2 2 W 0 6 2 2 0 0 03/05/2016 7 JR 1430 1630 1 3 W 0 3 2 2 2 0 03/05/2016 7 JR 1430 1630 2 3 W 0 4 2 2 2 0 04/05/2016 7 FM 0930 1030 1 5 WSW 1 8 2 2 0 0 04/05/2016 7 JR 0930 1030 1 5 SW 1 8 2 2 0 0 23/05/2016 7 FM 0900 1200 1 1 NE 0 6 2 2 0 0

Hopsrig Wind Farm ES Volume 4: Technical Appendices TA 6.1: Ornithology Annex C
16 | P a g e
Date Survey visit Observer Survey start time
Survey finish time Survey hour Wind speed Wind direction Rain Cloud cover Cloud height Visibility Snow Frost
23/05/2016 7 FM 0900 1200 2 2 NE 0 6 2 2 0 0 23/05/2016 7 FM 0900 1200 3 1 NE 0 5 2 2 0 0 23/05/2016 7 JR 0900 1200 1 1 NE 0 6 2 2 0 0 23/05/2016 7 JR 0900 1200 2 2 NE 0 6 2 2 0 0 23/05/2016 7 JR 0900 1200 3 3 NE 0 5 2 2 0 0 24/05/2016 7 FM 0650 0750 1 1 NW 0 3 2 2 0 0 24/05/2016 7 FM 1330 1730 1 1 NE 0 3 2 2 0 0 24/05/2016 7 FM 1330 1730 2 3 NE 0 4 2 2 0 0 24/05/2016 7 FM 1330 1730 3 2 NE 0 4 2 2 0 0 24/05/2016 7 FM 1330 1730 4 3 NE 0 3 2 2 0 0 24/05/2016 7 JR 0650 0750 1 1 NW 0 3 2 2 0 0 25/05/2016 7 FM 0845 1045 1 5 NE 1 8 2 2 0 0 25/05/2016 7 FM 0845 1045 2 5 NE 0 8 2 2 0 0 25/05/2016 7 JR 0900 1100 1 5 NNE 0 8 2 2 0 0 25/05/2016 7 JR 0900 1100 2 5 NNE 0 8 2 2 0 0 28/06/2016 8 MW 0830 1430 1 2 SSW 0 6 2 2 0 0 28/06/2016 8 MW 0830 1430 2 2 SSW 0 7 2 2 0 0 28/06/2016 8 MW 0830 1430 3 3 SSW 2 7 2 2 0 0 28/06/2016 8 MW 0830 1430 4 3 SSW 0 7 2 2 0 0 28/06/2016 8 MW 0830 1430 5 3 SSW 0 7 2 2 0 0 28/06/2016 8 MW 0830 1430 6 2 SSW 0 8 2 2 0 0 29/07/2016 9 MW 0830 1430 1 3 NNE 0 6 2 2 0 0 29/07/2016 9 MW 0830 1430 2 3 NNE 0 5 2 2 0 0 29/07/2016 9 MW 0830 1430 3 4 NNE 0 6 2 2 0 0 29/07/2016 9 MW 0830 1430 4 4 NNE 0 5 2 2 0 0 29/07/2016 9 MW 0830 1430 5 4 NNE 0 6 2 2 0 0 29/07/2016 9 MW 0830 1430 6 5 NNE 0 6 2 2 0 0 15/08/2016 10 MW 0915 1515 1 2 SSW 0 4 2 2 0 0 15/08/2016 10 MW 0915 1515 2 2 SSW 0 5 2 2 0 0 15/08/2016 10 MW 0915 1515 3 3 SSW 0 5 2 2 0 0 15/08/2016 10 MW 0915 1515 4 3 SSW 0 7 2 2 0 0 15/08/2016 10 MW 0915 1515 5 3 SSW 0 7 2 2 0 0 15/08/2016 10 MW 0915 1515 6 3 SSW 0 8 2 2 0 0

Hopsrig Wind Farm ES Volume 4: Technical Appendices TA 6.1: Ornithology Annex C
17 | P a g e
Black Grouse Surveys Black grouse surveys were undertaken during the 2015 and 2016 breeding seasons and were conducted during May 2015 and April and May 2016. See Table C-7 for the survey dates and weather data recorded during these surveys, Annex B for the survey methodology and Annex D for the survey results.
Table C-7 Meteorological conditions during black grouse surveys at Hopsrig
Date Survey visit Observer Survey start time
Survey finish time Survey hour Wind speed Wind direction Rain Cloud cover Cloud height Visibility Snow Frost
21/05/2015 1 JM 0410 0610 1 3 SW 0 8 2 2 0 0 21/05/2015 1 JM 0410 0610 2 3 SW 0 8 2 2 0 0 21/05/2015 1 SS 0400 0600 1 3 NW 0 7 2 2 0 0 21/05/2015 1 SS 0400 0600 2 4 NW 0 7 2 2 0 0 05/04/2016 2 MW 0530 0730 1 0 0 4 8 2 2 0 0 05/04/2016 2 MW 0530 0730 2 0 0 4 8 2 2 0 0 07/04/2016 2 MW 0545 0745 1 1 NNW 0 3 2 2 0 0 07/04/2016 2 MW 0545 0745 2 1 NNW 0 4 2 2 0 0 08/04/2016 2 MW 0530 0730 1 1 S 0 7 2 2 0 0 08/04/2016 2 MW 0530 0730 2 1 S 0 7 2 2 0 0 04/05/2016 3 FM 0430 0730 1 2 WNW 0 8 2 2 0 0 04/05/2016 3 FM 0430 0730 2 2 WNW 0 8 2 2 0 0 04/05/2016 3 FM 0430 0730 3 2 W 0 8 2 2 0 0 04/05/2016 3 JR 0430 0730 1 3 SW 0 8 1 2 0 0 04/05/2016 3 JR 0430 0730 2 4 SW 1 8 1 2 0 0 04/05/2016 3 JR 0430 0730 3 4 SW 0 8 2 2 0 0 24/05/2016 3 FM 0350 0650 1 1 NW 0 1 2 2 0 0 24/05/2016 3 FM 0350 0650 2 1 NW 0 1 2 2 0 0 24/05/2016 3 FM 0350 0650 3 1 NW 0 2 2 2 0 0 24/05/2016 3 JR 0350 0650 1 0 0 0 1 2 2 0 0 24/05/2016 3 JR 0350 0650 2 1 NW 0 1 2 2 0 0 24/05/2016 3 JR 0350 0650 3 1 NW 0 2 2 2 0 0

Hopsrig Wind Farm ES Volume 4: Technical Appendices TA 6.1: Ornithology
ANNEX D: ORNITHOLOGICAL SURVEY RESULTS

Hopsrig Wind Farm ES Volume 4: Technical Appendices TA 6.1: Ornithology Annex D
1 | P a g e
ANNEX D ORNITHOLOGICAL SURVEY RESULTS
Flight Activity Records: Target Species In accordance with SNH Guidance (2014), target species are those which may be considered to be at risk from the potential effects of wind farms. The methodology for defining target species is detailed within the ES Chapter 6 (Ornithology). All flights of Target Species within the site and the surrounding area were mapped and details of each flight recorded. Observations of Target Species were recorded on data sheets and maps. Information on species, time of observation, flight height (in bands), location, and the length of each observation was recorded and the details are given below in Table D-1. The Collision Risk Analysis Area (CRAA) referred to in the table refers to the 500 m buffer associated with the proposed turbine layout. All flightlines of Target Species are displayed in Figures 6.4 to 6.6.
Table D-1 Details of target species recorded during flight activity surveys
Date VP Observer Flight start time Species No. of
birds Duration (seconds)
Inside CRAA (seconds) Outside CRAA (seconds) 0-20 m 21-40 m 41-100 m 101-150 m >151 m 0-20 m 21-40 m 41-100 m 101-150 m >151 m
20/05/2015 1 JM 1543 Oystercatcher 2 51.00 0.00 0.00 0.00 0.00 0.00 0.00 21.00 30.00 0.00 0.0027/05/2015 3 JM 1301 Herring gull 5 37.00 0.00 0.00 0.00 0.00 0.00 0.00 0.00 37.00 0.00 0.0014/07/2015 1 JAOM 1126 Snipe 1 22.00 0.00 0.00 0.00 0.00 0.00 0.00 22.00 0.00 0.00 0.0011/08/2015 1 MW 0850 Goshawk 1 38.00 0.00 0.00 0.00 0.00 0.00 30.00 8.00 0.00 0.00 0.0017/09/2015 2 AM 1308 Goshawk 2 275.00 0.00 0.00 162.43 45.33 0.00 0.00 0.00 52.57 14.67 0.00 24/09/2015 1 AM 1208 Goshawk 1 25.00 0.00 0.00 0.00 0.00 0.00 0.00 0.00 25.00 0.00 0.00 24/09/2015 2 AM 1551 Goshawk 1 38.00 0.00 23.00 15.00 0.00 0.00 0.00 0.00 0.00 0.00 0.00 25/09/2015 3 AM 0952 Pink-footed goose 27 260.00 0.00 0.00 157.29 0.00 0.00 0.00 0.00 102.71 0.00 0.00 12/10/2015 1 MW 1157 Goshawk 1 60.00 0.00 18.66 0.00 0.00 0.00 0.00 41.34 0.00 0.00 0.00 12/10/2015 1 MW 1222 Merlin 1 45.00 0.00 0.00 0.00 0.00 0.00 0.00 0.00 45.00 0.00 0.00 12/10/2015 1 MW 1439 Goshawk 1 65.00 0.00 0.00 0.00 0.00 0.00 20.00 45.00 0.00 0.00 0.00 13/11/2015 2 MW 1151 Goshawk 1 90.00 11.11 22.22 0.00 0.00 0.00 18.89 37.78 0.00 0.00 0.00 13/11/2015 2 MW 1302 Hen harrier 1 44.00 0.00 30.36 0.00 0.00 0.00 0.00 13.64 0.00 0.00 0.00 13/11/2015 2 MW 1312 Golden plover 38 68.00 0.00 28.03 0.00 0.00 0.00 0.00 39.97 0.00 0.00 0.00 03/12/2015 2 MW 0810 Goshawk 1 46.00 0.00 0.00 0.00 0.00 0.00 16.00 30.00 0.00 0.00 0.00 03/12/2015 2 MW 1050 Goshawk 1 62.00 11.74 31.09 0.00 0.00 0.00 5.26 13.91 0.00 0.00 0.00 03/12/2015 2 MW 1140 Golden plover 38 90.00 0.00 0.00 13.06 0.00 0.00 0.00 0.00 76.94 0.00 0.0003/12/2015 2 MW 1213 Goshawk 1 38.00 18.55 0.00 0.00 0.00 0.00 19.45 0.00 0.00 0.00 0.0027/01/2016 1 AM 1246 Goshawk 1 12.00 0.00 7.00 0.00 0.00 0.00 0.00 5.00 0.00 0.00 0.0009/03/2016 2 AM 1414 Goshawk 1 32.00 0.00 0.00 12.27 0.00 0.00 0.00 0.00 19.73 0.00 0.0010/03/2016 3 AM 1708 Golden plover 8 26.00 0.00 0.00 20.81 0.00 0.00 0.00 0.00 5.19 0.00 0.0011/03/2016 1 AM 0923 Red kite 1 66.00 0.00 0.00 0.00 0.00 0.00 0.00 30.00 36.00 0.00 0.0011/03/2016 1 AM 1022 Red kite 1 85.00 0.00 0.00 0.00 0.00 0.00 25.00 15.00 45.00 0.00 0.0011/03/2016 1 AM 1026 Red kite 1 116.00 0.00 0.00 0.00 0.00 0.00 30.00 71.00 15.00 0.00 0.0011/03/2016 1 AM 1028 Red kite 1 68.00 0.00 0.00 0.00 0.00 0.00 38.00 0.00 30.00 0.00 0.0011/03/2016 1 AM 1124 Red kite 1 48.00 0.00 0.00 0.00 0.00 0.00 18.00 0.00 30.00 0.00 0.0030/03/2016 1 AM 1050 Goshawk 1 50.00 0.00 0.00 0.00 0.00 0.00 20.00 15.00 15.00 0.00 0.0030/03/2016 1 AM 1214 Curlew 1 20.00 0.00 0.00 0.00 0.00 0.00 0.00 20.00 0.00 0.00 0.0030/03/2016 1 AM 1232 Goshawk 1 32.00 0.00 0.00 0.00 0.00 0.00 17.00 0.00 15.00 0.00 0.0030/03/2016 3 MW 1338 Goshawk 1 45.00 0.00 42.52 0.00 0.00 0.00 0.00 2.48 0.00 0.00 0.0006/04/2016 1 MW 1138 Curlew 2 92.00 0.00 0.00 0.00 0.00 0.00 32.00 45.00 15.00 0.00 0.00

Hopsrig Wind Farm ES Volume 4: Technical Appendices TA 6.1: Ornithology Annex D
2 | P a g e
Date VP Observer Flight start time Species No. of
birds Duration (seconds)
Inside CRAA (seconds) Outside CRAA (seconds) 0-20 m 21-40 m 41-100 m 101-150 m >151 m 0-20 m 21-40 m 41-100 m 101-150 m >151 m
02/05/2016 3 FM 1818 Curlew 1 38.00 0.00 30.84 0.00 0.00 0.00 0.00 7.16 0.00 0.00 0.00 02/05/2016 3 FM 1839 Goshawk 1 57.00 0.00 18.85 16.97 0.00 0.00 0.00 11.15 10.03 0.00 0.00 23/05/2016 1 FM 1620 Red kite 1 18.00 0.00 0.00 0.00 0.00 0.00 0.00 18.00 0.00 0.00 0.00 24/05/2016 2 JR 1558 Goshawk 1 49.00 0.00 0.00 0.00 0.00 0.00 0.00 34.00 15.00 0.00 0.00 24/06/2016 1 MW 1232 Goshawk 1 105.00 3.22 3.22 0.00 0.00 16.09 11.78 11.78 0.00 0.00 58.91 27/06/2016 2 MW 0916 Osprey 1 60.00 0.00 0.00 0.00 0.00 0.00 0.00 0.00 15.00 45.00 0.00 25/07/2016 2 MW 1109 Hen harrier 1 72.00 11.39 15.94 0.00 0.00 0.00 18.61 26.06 0.00 0.00 0.00 25/07/2016 2 MW 1210 Goshawk 1 46.00 1.00 45.00 0.00 0.00 0.00 0.00 0.00 0.00 0.00 0.00 26/07/2016 1 MW 1110 Goshawk 1 64.00 0.00 0.00 0.00 0.00 0.00 4.00 45.00 15.00 0.00 0.00 27/07/2016 2 MW 0812 Goshawk 1 64.00 0.00 0.00 0.00 0.00 0.00 15.00 45.00 4.00 0.00 0.00 27/07/2016 2 MW 1030 Goshawk 1 60.00 0.00 0.00 0.00 0.00 0.00 15.00 45.00 0.00 0.00 0.00 16/08/2016 1 MW 1450 Goshawk 1 32.00 0.00 0.00 0.00 0.00 0.00 15.00 17.00 0.00 0.00 0.00 17/08/2016 2 MW 1530 Goshawk 1 95.00 0.00 0.00 0.00 0.00 0.00 20.00 45.00 30.00 0.00 0.00 17/08/2016 2 MW 1531 Peregrine falcon 1 35.00 0.00 0.00 0.00 0.00 0.00 20.00 15.00 0.00 0.00 0.00 18/08/2016 2 MW 0914 Goshawk 1 30.00 0.00 0.00 0.00 0.00 0.00 30.00 0.00 0.00 0.00 0.00

Hopsrig Wind Farm ES Volume 4: Technical Appendices TA 6.1: Ornithology Annex D
3 | P a g e
Flight Activity Records: Secondary Species Secondary Species were recorded to give an indication of the use of the site by these species and to allow 5-minute activity summaries to be calculated. Details of the VP, species, minimum number present, the flight height (in the same bands used for Target Species), and location in relation to the site were all recorded (i.e. on Site, within the buffer area, or out-with the buffer area) and are provided in Table D-2.
Table D-2 Details of secondary species recorded during flight activity surveys
Date VP Observer 5 minute recording block Species Number recorded Height On site Within buffer Out-with buffer 20/05/2015 1 JM 1305 Buzzard 2 1 1 20/05/2015 1 JM 1430 Lesser black-backed gull 1 2 1 20/05/2015 1 JM 1555 Buzzard 2 3 120/05/2015 3 SS 1310 Buzzard 2 3 1 04/06/2015 2 BH 1145 Buzzard 1 3 1 04/06/2015 2 BH 1220 Buzzard 1 1 1 20/07/2015 1 JR 1105 Buzzard 1 2 1 20/07/2015 1 JR 1230 Raven 1 2 1 20/07/2015 1 JR 1335 Buzzard 2 2 1 21/07/2015 3 JR 0840 Buzzard 1 1 110/08/2015 1 MW 1115 Raven 2 2 1 10/08/2015 1 MW 1120 Grey heron 1 1 1 10/08/2015 1 MW 1610 Raven 2 1 1 10/08/2015 1 MW 1640 Buzzard 1 1 1 10/08/2015 1 MW 1710 Buzzard 1 1 1 10/08/2015 1 MW 1710 Kestrel 1 1 1 10/08/2015 2 JR 1150 Raven 1 2 1 10/08/2015 2 JR 1610 Raven 1 1 1 11/08/2015 1 MW 0900 Raven 5 2 1 11/08/2015 1 MW 0910 Buzzard 1 1 1 11/08/2015 1 MW 0930 Buzzard 2 2 1 11/08/2015 1 MW 0945 Buzzard 3 2 1 11/08/2015 3 JR 1245 Buzzard 1 1 1 11/08/2015 3 JR 1515 Buzzard 2 1 1 11/08/2015 3 JR 1530 Buzzard 2 3 1 11/08/2015 3 JR 1550 Sparrowhawk 2 1 1 11/08/2015 3 JR 1600 Buzzard 1 2 1 12/08/2015 2 JR 1030 Buzzard 3 3 1 12/08/2015 2 JR 1105 Buzzard 1 3 1 12/08/2015 2 JR 1230 Raven 2 2 1 12/08/2015 2 JR 1240 Kestrel 1 1 1 12/08/2015 2 JR 1250 Raven 1 1 1 12/08/2015 2 JR 1255 Raven 1 2 1 12/08/2015 2 JR 1310 Raven 1 2 1 12/08/2015 2 JR 1315 Raven 4 3 1 12/08/2015 2 JR 1330 Lesser black-backed gull 1 3 1 12/08/2015 2 JR 1335 Raven 1 3 1 12/08/2015 2 JR 1350 Raven 3 1 1 12/08/2015 2 JR 1400 Raven 12 2 1 12/08/2015 2 JR 1405 Sparrowhawk 2 1 1

Hopsrig Wind Farm ES Volume 4: Technical Appendices TA 6.1: Ornithology Annex D
4 | P a g e
Date VP Observer 5 minute recording block Species Number recorded Height On site Within buffer Out-with buffer 13/08/2015 2 JR 0640 Sparrowhawk 3 1 1 13/08/2015 2 JR 0710 Sparrowhawk 1 1 1 13/08/2015 2 JR 0915 Raven 2 2 1 13/08/2015 2 JR 1025 Raven 1 1 1 13/08/2015 2 JR 1120 Sparrowhawk 1 1 1 13/08/2015 2 JR 1125 Raven 1 1 1 13/08/2015 2 JR 1135 Raven 1 2 1 13/08/2015 2 JR 1200 Buzzard 1 2 1 15/09/2015 2 AM 1340 Buzzard 1 3 1 15/09/2015 2 AM 1420 Buzzard 1 2 1 15/09/2015 3 AM 1635 Raven 1 4 1 16/09/2015 1 AM 1450 Raven 1 3 1 16/09/2015 1 AM 1505 Grey heron 1 1 1 16/09/2015 3 AM 1100 Buzzard 1 3 1 17/09/2015 1 AM 0910 Buzzard 1 3 1 17/09/2015 1 AM 0925 Raven 2 3 1 17/09/2015 1 AM 0950 Sparrowhawk 1 1 1 17/09/2015 1 AM 1010 Raven 2 3 1 17/09/2015 1 AM 1125 Buzzard 1 3 1 17/09/2015 2 AM 1330 Buzzard 2 3 1 17/09/2015 2 AM 1350 Raven 3 2 1 17/09/2015 2 AM 1350 Sparrowhawk 1 1 1 17/09/2015 2 AM 1435 Raven 3 3 1 24/09/2015 1 AM 1130 Sparrowhawk 1 3 1 24/09/2015 1 AM 1205 Buzzard 1 3 1 24/09/2015 1 AM 1300 Raven 1 2 1 25/09/2015 1 AM 1345 Buzzard 1 3 1 25/09/2015 1 AM 1445 Grey heron 1 1 1 25/09/2015 1 AM 1515 Buzzard 4 3 1 25/09/2015 3 AM 1135 Raven 1 3 1 12/10/2015 1 MW 1130 Buzzard 2 2 1 12/10/2015 1 MW 1315 Buzzard 3 2 1 14/10/2015 2 MW 1145 Buzzard 1 2 1 14/10/2015 2 MW 1200 Kestrel 1 1 1 14/10/2015 2 MW 1235 Kestrel 1 1 1 11/11/2015 1 MW 1220 Sparrowhawk 2 2 1 11/11/2015 1 MW 1225 Buzzard 2 2 1 12/11/2015 3 MW 1015 Buzzard 2 2 1 12/11/2015 3 MW 1140 Sparrowhawk 2 2 1 12/11/2015 3 MW 1240 Buzzard 2 2 1 12/11/2015 3 MW 1315 Buzzard 4 2 1 13/11/2015 2 MW 1205 Buzzard 1 2 1 02/12/2015 3 MW 1155 Buzzard 1 2 1 02/12/2015 3 MW 1215 Raven 2 1 1 1 02/12/2015 3 MW 1410 Raven 1 2 1 1 03/12/2015 2 MW 1015 Raven 2 2 1

Hopsrig Wind Farm ES Volume 4: Technical Appendices TA 6.1: Ornithology Annex D
5 | P a g e
Date VP Observer 5 minute recording block Species Number recorded Height On site Within buffer Out-with buffer 03/12/2015 2 MW 1310 Raven 2 2 1 04/12/2015 1 MW 1000 Buzzard 2 2 1 1 04/12/2015 1 MW 1110 Buzzard 1 1 1 04/12/2015 1 MW 1215 Sparrowhawk 1 2 1 04/12/2015 1 MW 1310 Buzzard 1 1 1 26/01/2016 2 AM 1255 Buzzard 1 2 1 27/01/2016 1 AM 0815 Buzzard 1 2 1 27/01/2016 1 AM 0955 Buzzard 1 3 1 27/01/2016 1 AM 1000 Buzzard 1 2 1 27/01/2016 1 AM 1000 Buzzard 1 3 1 27/01/2016 1 AM 1025 Buzzard 1 3 1 27/01/2016 1 AM 1045 Raven 2 1 1 27/01/2016 1 AM 1135 Buzzard 4 3 1 27/01/2016 1 AM 1140 Buzzard 1 2 1 29/01/2016 3 AM 1155 Sparrowhawk 1 1 1 25/02/2016 1 AM 1350 Buzzard 1 2 1 25/02/2016 1 AM 1404 Buzzard 2 3 1 25/02/2016 1 AM 1408 Buzzard 1 1 1 25/02/2016 1 AM 1454 Buzzard 1 1 1 25/02/2016 1 AM 1656 Buzzard 1 1 1 25/02/2016 1 AM 1736 Buzzard 1 1 1 26/02/2016 2 AM 1254 Raven 2 4 1 26/02/2016 2 AM 1353 Raven 1 3 1 27/02/2016 3 AM 0820 Sparrowhawk 1 1 1 09/03/2016 2 AM 1340 Buzzard 1 3 1 09/03/2016 2 AM 1355 Raven 4 3 1 09/03/2016 2 AM 1415 Raven 2 3 1 09/03/2016 2 AM 1700 Raven 2 3 1 10/03/2016 3 AM 1310 Buzzard 1 2 1 10/03/2016 3 AM 1725 Raven 4 3 1 11/03/2016 1 AM 0710 Buzzard 1 1 1 11/03/2016 1 AM 0710 Raven 1 1 1 11/03/2016 1 AM 0725 Raven 1 3 1 11/03/2016 1 AM 1015 Raven 2 3 1 1 11/03/2016 1 AM 1035 Buzzard 1 3 1 11/03/2016 1 AM 1035 Raven 3 3 1 11/03/2016 1 AM 1050 Buzzard 1 2 1 29/03/2016 2 MW 0830 Sparrowhawk 2 3 1 29/03/2016 2 MW 0912 Sparrowhawk 1 3 1 1 29/03/2016 2 MW 1214 Buzzard 2 1 1 30/03/2016 1 AM 0935 Buzzard 2 3 1 30/03/2016 1 AM 0945 Buzzard 1 1 1 1 30/03/2016 1 AM 1120 Buzzard 1 3 1 30/03/2016 1 AM 1120 Buzzard 1 1 1 30/03/2016 1 AM 1240 Buzzard 1 3 1 1 30/03/2016 3 MW 1155 Buzzard 1 2 1

Hopsrig Wind Farm ES Volume 4: Technical Appendices TA 6.1: Ornithology Annex D
6 | P a g e
Date VP Observer 5 minute recording block Species Number recorded Height On site Within buffer Out-with buffer 30/03/2016 3 MW 1214 Buzzard 1 2 1 30/03/2016 3 MW 1303 Raven 2 2 1 04/04/2016 2 MW 1417 Raven 2 2 1 06/04/2016 1 MW 1025 Raven 2 3 1 02/05/2016 3 FM 1411 Buzzard 1 2 1 02/05/2016 3 FM 1936 Buzzard 1 3 1 02/05/2016 3 FM 1938 Buzzard 1 1 1 23/05/2016 1 FM 1246 Buzzard 1 3 1 23/05/2016 1 FM 1248 Buzzard 1 1 1 23/05/2016 1 FM 1258 Buzzard 1 3 1 23/05/2016 1 FM 1330 Buzzard 1 3 1 23/05/2016 1 FM 1539 Buzzard 1 2 1 23/05/2016 1 FM 1555 Buzzard 2 2 1 23/05/2016 1 FM 1625 Great black-backed gull 2 2 1 23/05/2016 3 JR 1242 Buzzard 1 1 1 23/05/2016 3 JR 1252 Sparrowhawk 1 3 1 23/05/2016 3 JR 1301 Buzzard 3 3 1 23/05/2016 3 JR 1354 Cormorant 1 2 1 24/05/2016 2 JR 1428 Buzzard 1 2 1 24/05/2016 2 JR 1447 Buzzard 1 2 1 24/05/2016 2 JR 1507 Buzzard 2 2 1 24/05/2016 2 JR 1608 Sparrowhawk 1 2 1 23/06/2016 1 MW 1040 Buzzard 1 2 1 24/06/2016 1 MW 1205 Buzzard 1 2 1 27/06/2016 2 MW 0930 Buzzard 3 3 1 27/06/2016 2 MW 1100 Buzzard 1 2 1 27/06/2016 2 MW 1215 Buzzard 1 3 1 1 29/06/2016 3 MW 0840 Buzzard 1 1 1 1 25/07/2016 3 MW 1030 Buzzard 1 2 1 1 25/07/2016 3 MW 1310 Grey heron 1 3 1 26/07/2016 1 MW 1420 Grey heron 1 4 1 29/07/2016 2 MW 1130 Raven 2 3 1 29/07/2016 2 MW 1240 Raven 2 3 1 1 29/07/2016 2 MW 1310 Buzzard 1 3 1 16/08/2016 1 MW 1410 Buzzard 1 2 1 1 16/08/2016 1 MW 1600 Raven 2 2 1 1 16/08/2016 1 MW 1710 Kestrel 1 1 1 17/08/2016 2 MW 1400 Raven 2 3 1 1 17/08/2016 2 MW 1525 Sparrowhawk 1 3 1 17/08/2016 2 MW 1600 Buzzard 1 3 1 18/08/2016 2 MW 1010 Buzzard 1 3 1 18/08/2016 2 MW 1030 Raven 2 3 1
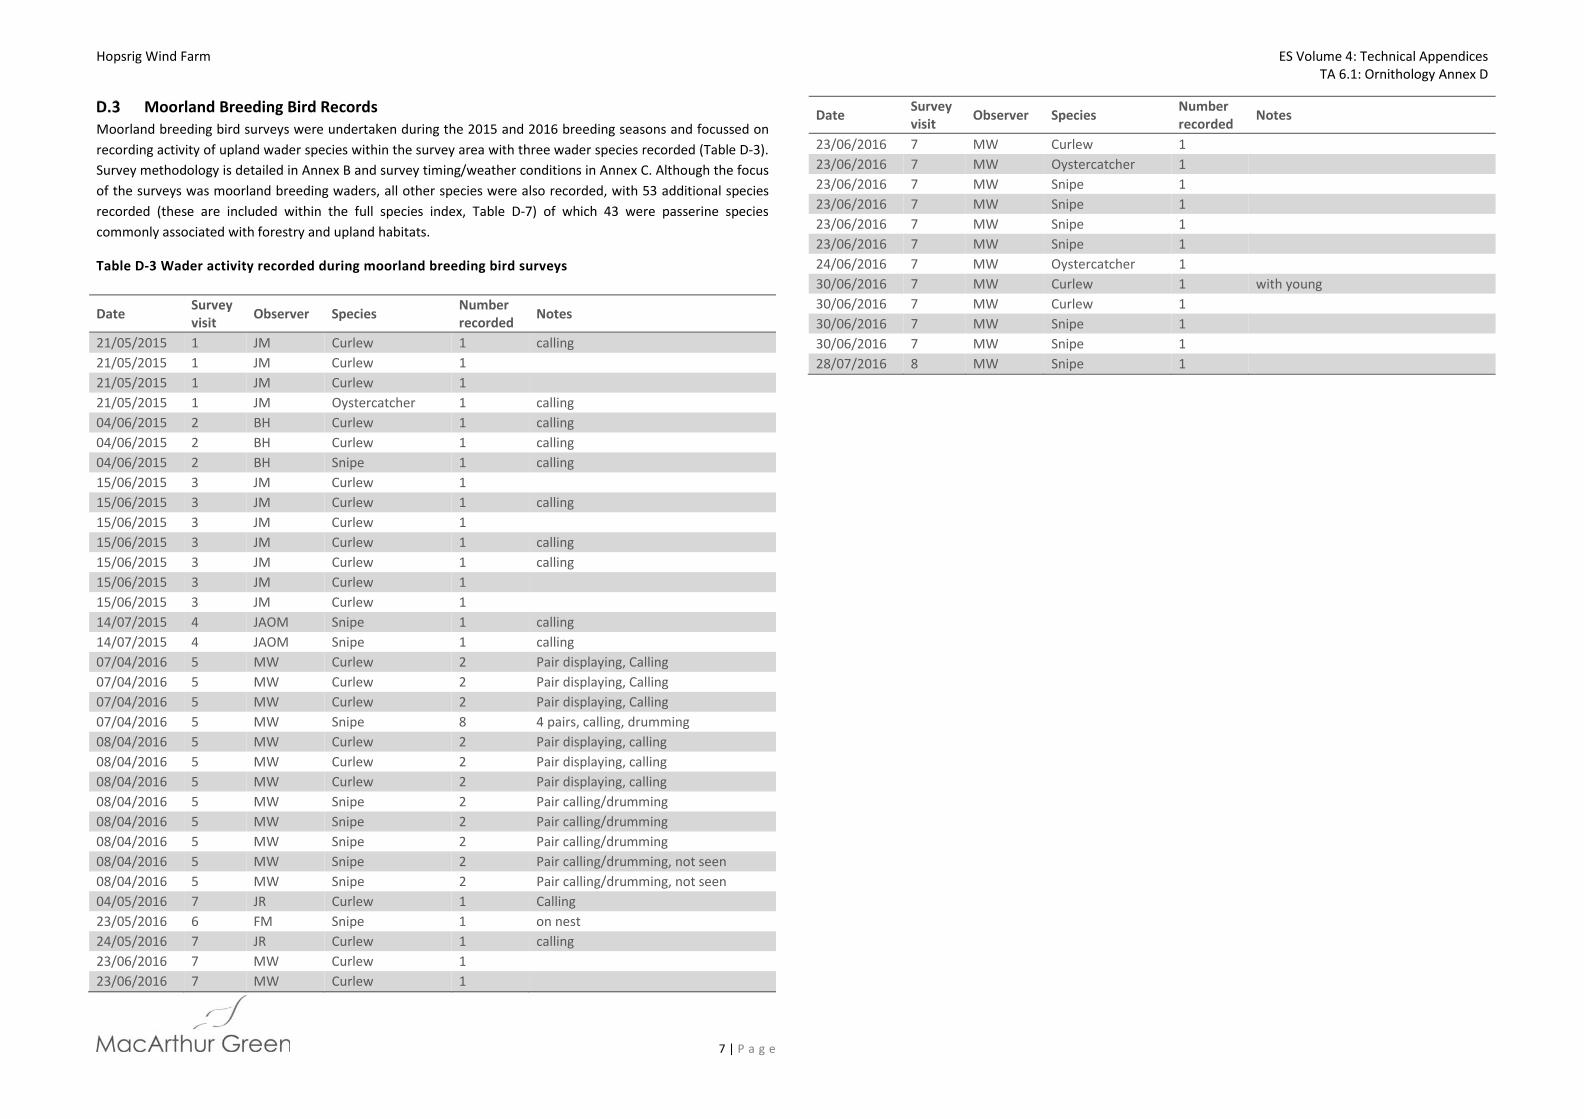
Hopsrig Wind Farm ES Volume 4: Technical Appendices TA 6.1: Ornithology Annex D
7 | P a g e
Moorland Breeding Bird Records Moorland breeding bird surveys were undertaken during the 2015 and 2016 breeding seasons and focussed on recording activity of upland wader species within the survey area with three wader species recorded (Table D-3). Survey methodology is detailed in Annex B and survey timing/weather conditions in Annex C. Although the focus of the surveys was moorland breeding waders, all other species were also recorded, with 53 additional species recorded (these are included within the full species index, Table D-7) of which 43 were passerine species commonly associated with forestry and upland habitats.
Table D-3 Wader activity recorded during moorland breeding bird surveys
Date Survey visit Observer Species Number
recorded Notes
21/05/2015 1 JM Curlew 1 calling 21/05/2015 1 JM Curlew 1 21/05/2015 1 JM Curlew 1 21/05/2015 1 JM Oystercatcher 1 calling 04/06/2015 2 BH Curlew 1 calling 04/06/2015 2 BH Curlew 1 calling 04/06/2015 2 BH Snipe 1 calling 15/06/2015 3 JM Curlew 1 15/06/2015 3 JM Curlew 1 calling 15/06/2015 3 JM Curlew 1 15/06/2015 3 JM Curlew 1 calling 15/06/2015 3 JM Curlew 1 calling 15/06/2015 3 JM Curlew 1 15/06/2015 3 JM Curlew 1 14/07/2015 4 JAOM Snipe 1 calling 14/07/2015 4 JAOM Snipe 1 calling 07/04/2016 5 MW Curlew 2 Pair displaying, Calling 07/04/2016 5 MW Curlew 2 Pair displaying, Calling 07/04/2016 5 MW Curlew 2 Pair displaying, Calling 07/04/2016 5 MW Snipe 8 4 pairs, calling, drumming 08/04/2016 5 MW Curlew 2 Pair displaying, calling08/04/2016 5 MW Curlew 2 Pair displaying, calling08/04/2016 5 MW Curlew 2 Pair displaying, calling08/04/2016 5 MW Snipe 2 Pair calling/drumming 08/04/2016 5 MW Snipe 2 Pair calling/drumming 08/04/2016 5 MW Snipe 2 Pair calling/drumming 08/04/2016 5 MW Snipe 2 Pair calling/drumming, not seen 08/04/2016 5 MW Snipe 2 Pair calling/drumming, not seen 04/05/2016 7 JR Curlew 1 Calling 23/05/2016 6 FM Snipe 1 on nest 24/05/2016 7 JR Curlew 1 calling 23/06/2016 7 MW Curlew 1 23/06/2016 7 MW Curlew 1
Date Survey visit Observer Species Number
recorded Notes
23/06/2016 7 MW Curlew 1 23/06/2016 7 MW Oystercatcher 1 23/06/2016 7 MW Snipe 1 23/06/2016 7 MW Snipe 1 23/06/2016 7 MW Snipe 1 23/06/2016 7 MW Snipe 1 24/06/2016 7 MW Oystercatcher 1 30/06/2016 7 MW Curlew 1 with young 30/06/2016 7 MW Curlew 1 30/06/2016 7 MW Snipe 1 30/06/2016 7 MW Snipe 1 28/07/2016 8 MW Snipe 1
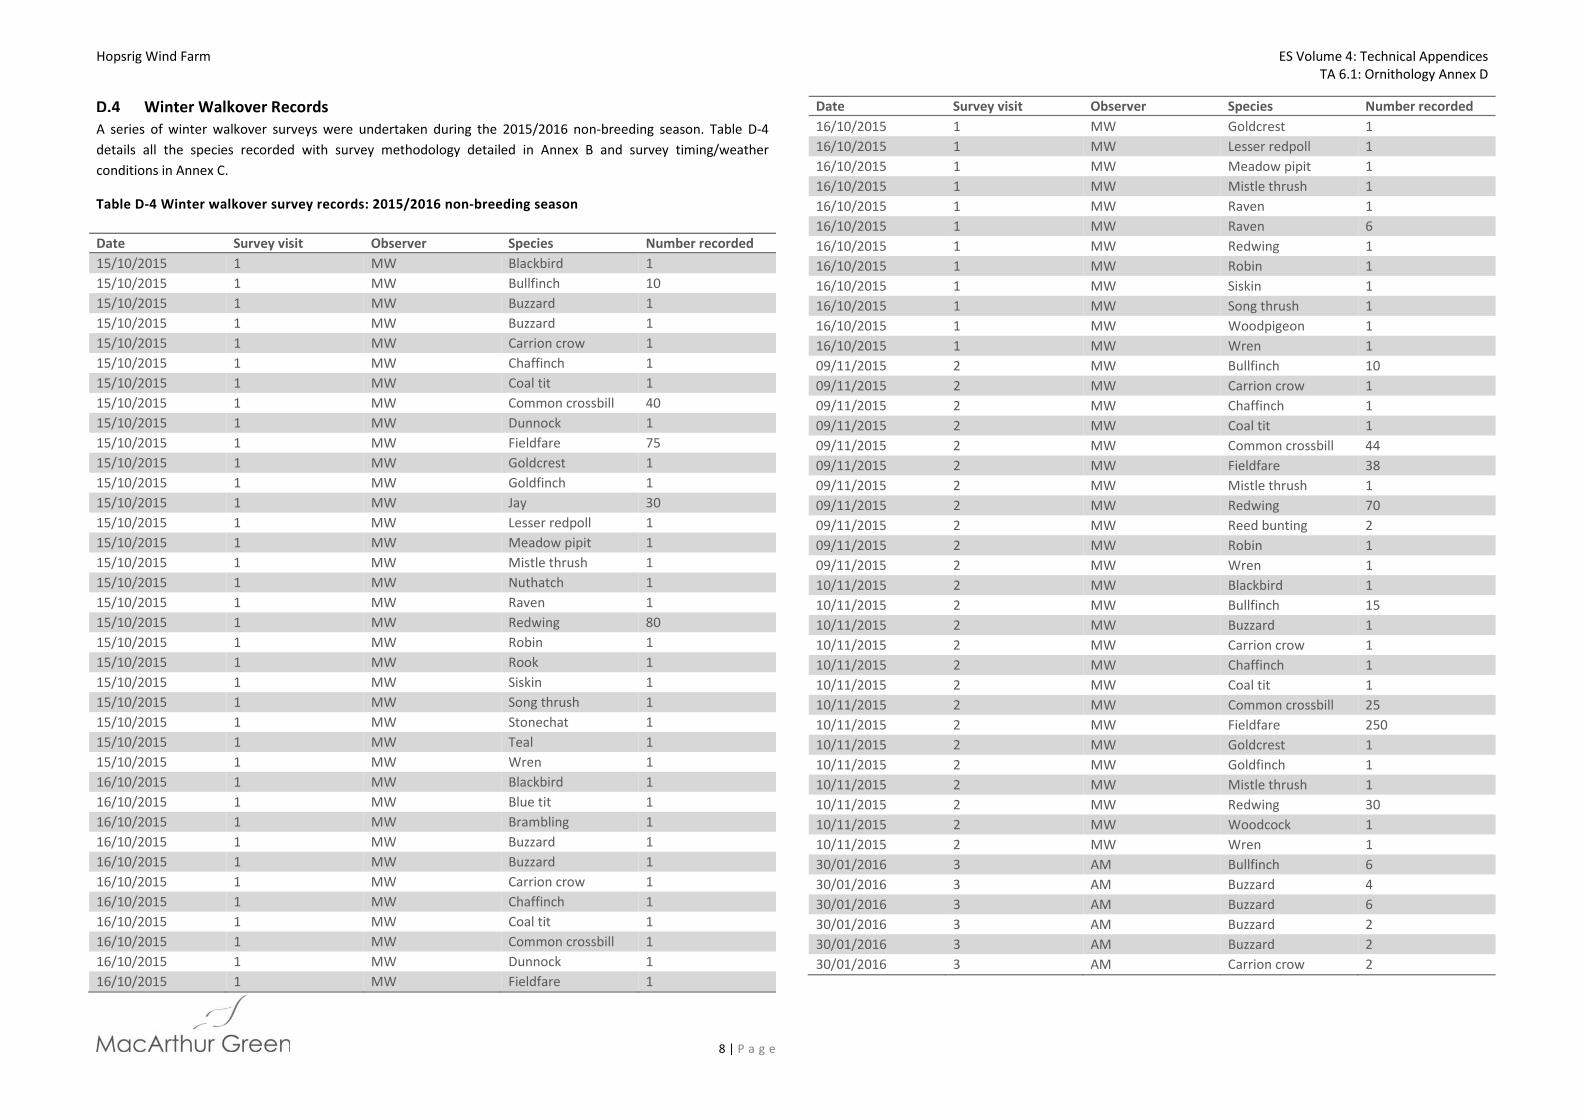
Hopsrig Wind Farm ES Volume 4: Technical Appendices TA 6.1: Ornithology Annex D
8 | P a g e
Winter Walkover Records A series of winter walkover surveys were undertaken during the 2015/2016 non-breeding season. Table D-4 details all the species recorded with survey methodology detailed in Annex B and survey timing/weather conditions in Annex C.
Table D-4 Winter walkover survey records: 2015/2016 non-breeding season
Date Survey visit Observer Species Number recorded 15/10/2015 1 MW Blackbird 1 15/10/2015 1 MW Bullfinch 10 15/10/2015 1 MW Buzzard 1 15/10/2015 1 MW Buzzard 1 15/10/2015 1 MW Carrion crow 1 15/10/2015 1 MW Chaffinch 1 15/10/2015 1 MW Coal tit 1 15/10/2015 1 MW Common crossbill 40 15/10/2015 1 MW Dunnock 1 15/10/2015 1 MW Fieldfare 75 15/10/2015 1 MW Goldcrest 1 15/10/2015 1 MW Goldfinch 1 15/10/2015 1 MW Jay 30 15/10/2015 1 MW Lesser redpoll 1 15/10/2015 1 MW Meadow pipit 1 15/10/2015 1 MW Mistle thrush 1 15/10/2015 1 MW Nuthatch 1 15/10/2015 1 MW Raven 1 15/10/2015 1 MW Redwing 80 15/10/2015 1 MW Robin 1 15/10/2015 1 MW Rook 1 15/10/2015 1 MW Siskin 1 15/10/2015 1 MW Song thrush 1 15/10/2015 1 MW Stonechat 1 15/10/2015 1 MW Teal 1 15/10/2015 1 MW Wren 1 16/10/2015 1 MW Blackbird 1 16/10/2015 1 MW Blue tit 1 16/10/2015 1 MW Brambling 1 16/10/2015 1 MW Buzzard 1 16/10/2015 1 MW Buzzard 1 16/10/2015 1 MW Carrion crow 1 16/10/2015 1 MW Chaffinch 1 16/10/2015 1 MW Coal tit 1 16/10/2015 1 MW Common crossbill 1 16/10/2015 1 MW Dunnock 1 16/10/2015 1 MW Fieldfare 1
Date Survey visit Observer Species Number recorded 16/10/2015 1 MW Goldcrest 1 16/10/2015 1 MW Lesser redpoll 1 16/10/2015 1 MW Meadow pipit 1 16/10/2015 1 MW Mistle thrush 1 16/10/2015 1 MW Raven 1 16/10/2015 1 MW Raven 6 16/10/2015 1 MW Redwing 1 16/10/2015 1 MW Robin 1 16/10/2015 1 MW Siskin 1 16/10/2015 1 MW Song thrush 1 16/10/2015 1 MW Woodpigeon 1 16/10/2015 1 MW Wren 1 09/11/2015 2 MW Bullfinch 10 09/11/2015 2 MW Carrion crow 1 09/11/2015 2 MW Chaffinch 1 09/11/2015 2 MW Coal tit 1 09/11/2015 2 MW Common crossbill 44 09/11/2015 2 MW Fieldfare 38 09/11/2015 2 MW Mistle thrush 1 09/11/2015 2 MW Redwing 70 09/11/2015 2 MW Reed bunting 2 09/11/2015 2 MW Robin 1 09/11/2015 2 MW Wren 1 10/11/2015 2 MW Blackbird 1 10/11/2015 2 MW Bullfinch 15 10/11/2015 2 MW Buzzard 1 10/11/2015 2 MW Carrion crow 1 10/11/2015 2 MW Chaffinch 1 10/11/2015 2 MW Coal tit 1 10/11/2015 2 MW Common crossbill 25 10/11/2015 2 MW Fieldfare 250 10/11/2015 2 MW Goldcrest 1 10/11/2015 2 MW Goldfinch 1 10/11/2015 2 MW Mistle thrush 1 10/11/2015 2 MW Redwing 30 10/11/2015 2 MW Woodcock 1 10/11/2015 2 MW Wren 1 30/01/2016 3 AM Bullfinch 6 30/01/2016 3 AM Buzzard 4 30/01/2016 3 AM Buzzard 6 30/01/2016 3 AM Buzzard 2 30/01/2016 3 AM Buzzard 2 30/01/2016 3 AM Carrion crow 2

Hopsrig Wind Farm ES Volume 4: Technical Appendices TA 6.1: Ornithology Annex D
9 | P a g e
Date Survey visit Observer Species Number recorded 30/01/2016 3 AM Carrion crow 1 30/01/2016 3 AM Coal tit 1 30/01/2016 3 AM Common crossbill 1 30/01/2016 3 AM Common crossbill 12 30/01/2016 3 AM Common crossbill 1 30/01/2016 3 AM Common crossbill 1 30/01/2016 3 AM Fieldfare 14 30/01/2016 3 AM Goldcrest 1 30/01/2016 3 AM Goldfinch 1 30/01/2016 3 AM Goshawk 1 30/01/2016 3 AM Goshawk 1 30/01/2016 3 AM Great tit 1 30/01/2016 3 AM Pheasant 1 30/01/2016 3 AM Red kite 4 30/01/2016 3 AM Robin 1 30/01/2016 3 AM Song thrush 1 30/01/2016 3 AM Woodpigeon 1 30/01/2016 3 AM Wren 1 31/01/2016 3 AM Blackbird 1 31/01/2016 3 AM Buzzard 1 31/01/2016 3 AM Chaffinch 1 31/01/2016 3 AM Coal tit 1 31/01/2016 3 AM Common crossbill 3 31/01/2016 3 AM Dunnock 1 31/01/2016 3 AM Fieldfare 19 31/01/2016 3 AM Fieldfare 5 31/01/2016 3 AM Goldcrest 1 31/01/2016 3 AM Great tit 1 31/01/2016 3 AM Jay 2 31/01/2016 3 AM Jay 1 31/01/2016 3 AM Long-tailed tit 1 31/01/2016 3 AM Meadow pipit 1 31/01/2016 3 AM Mistle thrush 4 31/01/2016 3 AM Pink-footed goose 66 31/01/2016 3 AM Woodcock 1 31/01/2016 3 AM Wren 1
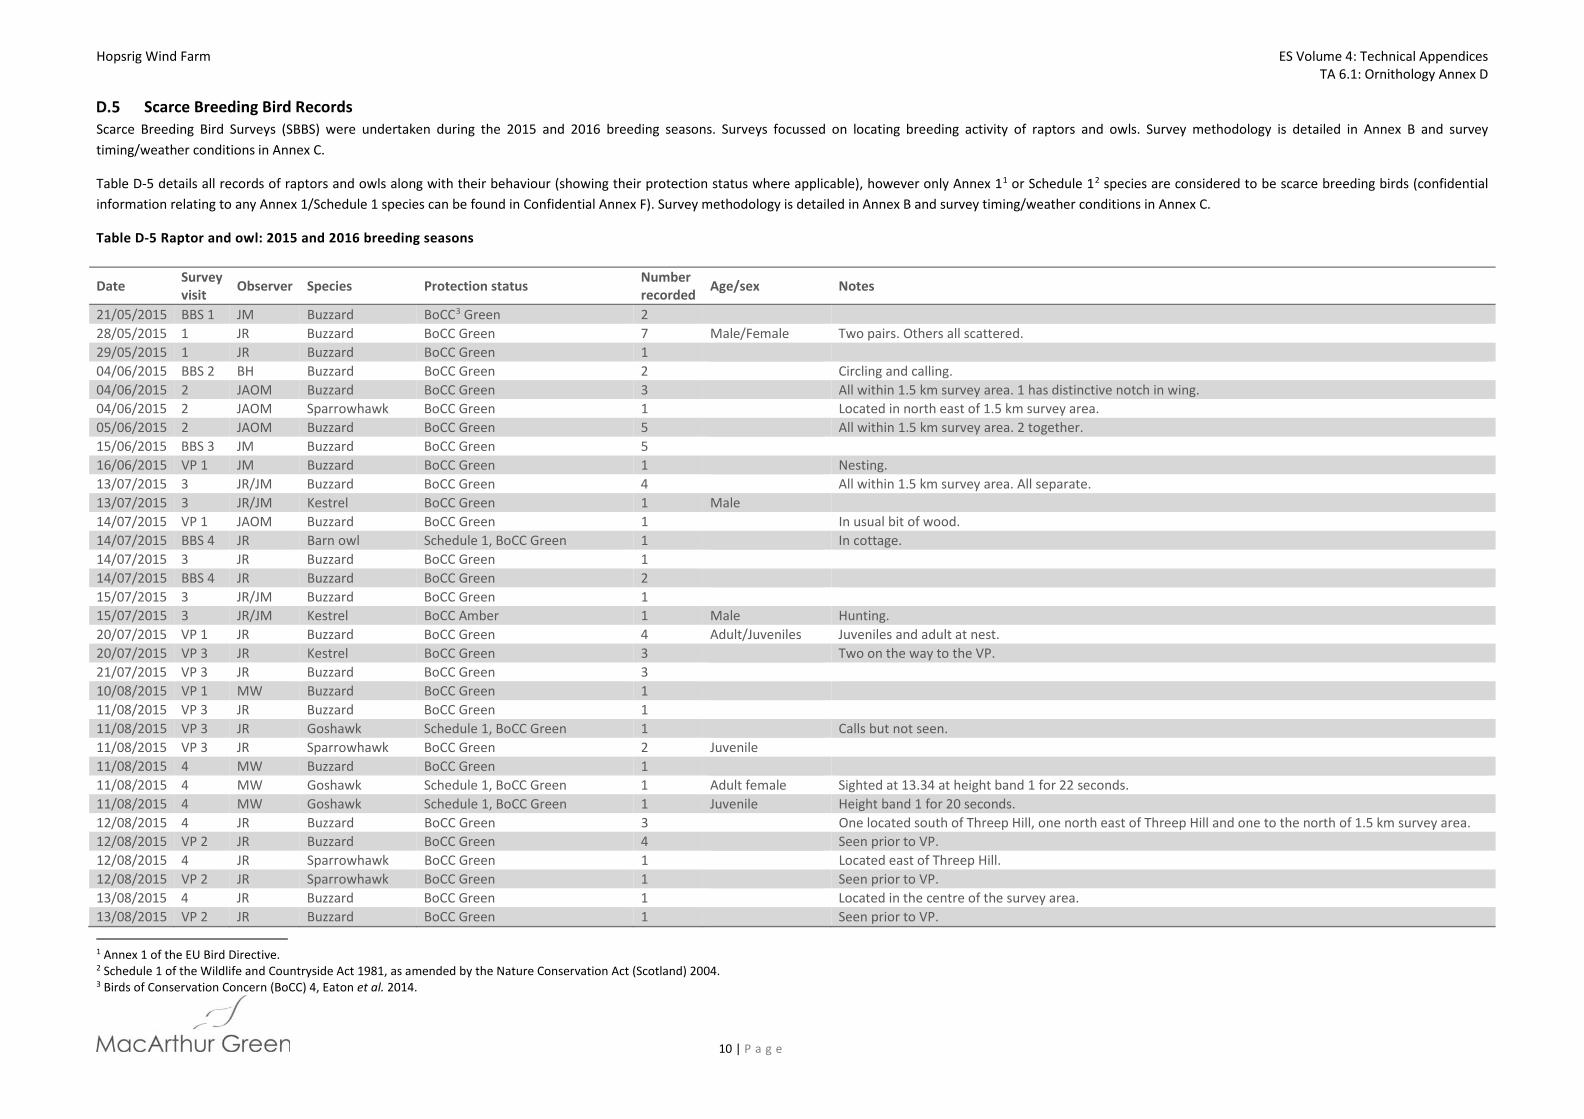
Hopsrig Wind Farm ES Volume 4: Technical Appendices TA 6.1: Ornithology Annex D
10 | P a g e
Scarce Breeding Bird Records Scarce Breeding Bird Surveys (SBBS) were undertaken during the 2015 and 2016 breeding seasons. Surveys focussed on locating breeding activity of raptors and owls. Survey methodology is detailed in Annex B and survey timing/weather conditions in Annex C.
Table D-5 details all records of raptors and owls along with their behaviour (showing their protection status where applicable), however only Annex 11 or Schedule 12 species are considered to be scarce breeding birds (confidential information relating to any Annex 1/Schedule 1 species can be found in Confidential Annex F). Survey methodology is detailed in Annex B and survey timing/weather conditions in Annex C.
Table D-5 Raptor and owl: 2015 and 2016 breeding seasons
Date Survey visit Observer Species Protection status Number
recorded Age/sex Notes
21/05/2015 BBS 1 JM Buzzard BoCC3 Green 228/05/2015 1 JR Buzzard BoCC Green 7 Male/Female Two pairs. Others all scattered. 29/05/2015 1 JR Buzzard BoCC Green 1 04/06/2015 BBS 2 BH Buzzard BoCC Green 2 Circling and calling. 04/06/2015 2 JAOM Buzzard BoCC Green 3 All within 1.5 km survey area. 1 has distinctive notch in wing. 04/06/2015 2 JAOM Sparrowhawk BoCC Green 1 Located in north east of 1.5 km survey area. 05/06/2015 2 JAOM Buzzard BoCC Green 5 All within 1.5 km survey area. 2 together. 15/06/2015 BBS 3 JM Buzzard BoCC Green 5 16/06/2015 VP 1 JM Buzzard BoCC Green 1 Nesting. 13/07/2015 3 JR/JM Buzzard BoCC Green 4 All within 1.5 km survey area. All separate. 13/07/2015 3 JR/JM Kestrel BoCC Green 1 Male 14/07/2015 VP 1 JAOM Buzzard BoCC Green 1 In usual bit of wood. 14/07/2015 BBS 4 JR Barn owl Schedule 1, BoCC Green 1 In cottage. 14/07/2015 3 JR Buzzard BoCC Green 1 14/07/2015 BBS 4 JR Buzzard BoCC Green 2 15/07/2015 3 JR/JM Buzzard BoCC Green 1 15/07/2015 3 JR/JM Kestrel BoCC Amber 1 Male Hunting. 20/07/2015 VP 1 JR Buzzard BoCC Green 4 Adult/Juveniles Juveniles and adult at nest. 20/07/2015 VP 3 JR Kestrel BoCC Green 3 Two on the way to the VP. 21/07/2015 VP 3 JR Buzzard BoCC Green 3 10/08/2015 VP 1 MW Buzzard BoCC Green 1 11/08/2015 VP 3 JR Buzzard BoCC Green 1 11/08/2015 VP 3 JR Goshawk Schedule 1, BoCC Green 1 Calls but not seen. 11/08/2015 VP 3 JR Sparrowhawk BoCC Green 2 Juvenile 11/08/2015 4 MW Buzzard BoCC Green 1 11/08/2015 4 MW Goshawk Schedule 1, BoCC Green 1 Adult female Sighted at 13.34 at height band 1 for 22 seconds. 11/08/2015 4 MW Goshawk Schedule 1, BoCC Green 1 Juvenile Height band 1 for 20 seconds. 12/08/2015 4 JR Buzzard BoCC Green 3 One located south of Threep Hill, one north east of Threep Hill and one to the north of 1.5 km survey area. 12/08/2015 VP 2 JR Buzzard BoCC Green 4 Seen prior to VP. 12/08/2015 4 JR Sparrowhawk BoCC Green 1 Located east of Threep Hill. 12/08/2015 VP 2 JR Sparrowhawk BoCC Green 1 Seen prior to VP. 13/08/2015 4 JR Buzzard BoCC Green 1 Located in the centre of the survey area. 13/08/2015 VP 2 JR Buzzard BoCC Green 1 Seen prior to VP.
1 Annex 1 of the EU Bird Directive. 2 Schedule 1 of the Wildlife and Countryside Act 1981, as amended by the Nature Conservation Act (Scotland) 2004. 3 Birds of Conservation Concern (BoCC) 4, Eaton et al. 2014.

Hopsrig Wind Farm ES Volume 4: Technical Appendices TA 6.1: Ornithology Annex D
11 | P a g e
Date Survey visit Observer Species Protection status Number
recorded Age/sex Notes
13/08/2015 4 JR Sparrowhawk BoCC Green 3 Adult female/fledged juveniles
Located in the centre of the study area.
13/08/2015 VP 2 JR Sparrowhawk BoCC Green 1 Seen prior to VP. 14/08/2015 4 JR Buzzard BoCC Green 1 To the west of the 1.5 km survey area. 17/09/2015 VP 1 AM Buzzard BoCC Green 1 Not flying, perched on top of pine. 09/03/2016 VP 2 AM Buzzard BoCC Green 2 Seen on way into VP. 09/03/2016 VP 2 AM Red kite Annex 1, Schedule 1, BoCC Green 1 Seen on way into site. Untagged bird seen within 1.5 km survey area. 09/03/2016 VP 2 AM Red kite Annex 1, Schedule 1, BoCC Green 1 Seen on way into site. Circling over field north west of Shaw Hill to south of track. 31/03/2016 5 AM Buzzard BoCC Green 6 Male/Female 4 records: 2 pairs and 2 individuals. 31/03/2016 5 AM Goshawk Schedule 1, BoCC Green 2 Male/Female Pair soaring (little displays) to north of Bentpath. 31/03/2016 5 AM Kestrel BoCC Amber 1 Male Hovering briefly landing in a tree in plantation north east of Calkin. 31/03/2016 5 MW Kestrel BoCC Amber 1 07/04/2016 6 MW Red kite Annex 1, Schedule 1, BoCC Green 1 Adult male Roosting in tree. 07/04/2016 6 MW Sparrowhawk BoCC Green 1 08/04/2016 6 MW Hen harrier Annex 1, Schedule 1, BoCC Red 2 Male/Female Male is ringtail. 03/05/2016 7 FM Buzzard BoCC Green 1 One bird in flight. 03/05/2016 7 FM Buzzard BoCC Green 2 Aggressive encounter between 2 birds. 03/05/2016 BBS 6 FM Buzzard BoCC Green 2 Male/Female Pair, alarm calling. 03/05/2016 7 FM Goshawk Schedule 1, BoCC Green 1 Female 03/05/2016 7 JR Buzzard BoCC Green 1 03/05/2016 BBS 6 JR Buzzard BoCC Green 1 03/05/2016 BBS 6 JR Buzzard BoCC Green 1 03/05/2016 BBS 6 JR Buzzard BoCC Green 1 03/05/2016 BBS 6 JR Buzzard BoCC Green 1 03/05/2016 BBS 6 JR Buzzard BoCC Green 1 03/05/2016 BBS 6 JR Buzzard BoCC Green 1 03/05/2016 BBS 6 JR Buzzard BoCC Green 2 Male/Female Pair. 04/05/2016 BK 3 FM Buzzard BoCC Green 1 04/05/2016 7 JR Tawny owl BoCC Amber 1 23/05/2016 7 FM Buzzard BoCC Green 2 Male/Female 23/05/2016 7 FM Buzzard BoCC Green 1 23/05/2016 7 FM Kestrel BoCC Amber 1 23/05/2016 7 JR Buzzard BoCC Green 1 23/05/2016 7 JR Buzzard BoCC Green 1 Alarm calling. 24/05/2016 7 FM Buzzard BoCC Green 3 24/05/2016 7 FM Buzzard BoCC Green 1 24/05/2016 BK 3 FM Buzzard BoCC Green 1 24/05/2016 BK 3 JR Buzzard BoCC Green 1 24/05/2016 7 JR Buzzard BoCC Green 1 24/05/2016 7 JR Tawny owl BoCC Amber 1 Female Calling. 24/05/2016 7 JR Tawny owl BoCC Amber 1 Female Calling. 25/05/2016 7 FM Buzzard BoCC Green 1 25/05/2016 7 JR Buzzard BoCC Green 1 23/06/2016 BBS 7 MW Buzzard BoCC Green 1

Hopsrig Wind Farm ES Volume 4: Technical Appendices TA 6.1: Ornithology Annex D
12 | P a g e
Date Survey visit Observer Species Protection status Number
recorded Age/sex Notes
23/06/2016 BBS 7 MW Red kite Annex 1, Schedule 1, BoCC Green 1 Perched in tree. 23/06/2016 VP 1 MW Red kite Annex 1, Schedule 1, BoCC Green 1 108 second flight, height bands 3 and 4. 24/06/2016 BBS 7 MW Buzzard BoCC Green 2 28/06/2016 8 MW Goshawk Schedule 1, BoCC Green 1 Height band 2, 45 seconds. 28/06/2016 8 MW Hen harrier Annex 1, Schedule 1, BoCC Red 1 Male Hunting, height band 1, 98 seconds. 30/06/2016 BBS 7 MW Buzzard BoCC Green 1 30/06/2016 BBS 7 MW Peregrine falcon Annex 1, Schedule 1, BoCC Green 1 0937: height band 1, 38 seconds. 28/07/2016 BBS 8 MW Goshawk Schedule 1, BoCC Green 1 Juvenile 1122: height band 3 for 30 seconds. 29/07/2016 9 MW Goshawk Schedule 1, BoCC Green 1 Adult 1215: height band 2 for 45 seconds. 15/08/2016 10 MW Buzzard BoCC Green 1 15/08/2016 10 MW Buzzard BoCC Green 1 15/08/2016 10 MW Goshawk Schedule 1, BoCC Green 1 1012: height band 2 for 38 seconds.

Hopsrig Wind Farm ES Volume 4: Technical Appendices TA 6.1: Ornithology Annex D
13 | P a g e
Black Grouse Records Black grouse surveys were undertaken during the 2015 and 2016 breeding seasons and surveys focussed on locating lekking activity.
No black grouse or signs of black grouse and their breeding activity were recorded during either the 2015 or 2016 surveys.
D.7 Bird Species Index A total of 92 bird species, or signs, were recorded at, or adjacent, to the site during the ornithological surveys. Table D-7 comprises a list of all these species along with their conservation status.
Table D-6 All bird species recorded at Hopsrig May 2015 to August 2016
Species Conservation status Species Conservation statusBarn owl Schedule 1, BoCC Green Long-tailed tit BoCC Green Blackbird BoCC Green Magpie BoCC Green Blackcap BoCC Green Mallard BoCC Amber Black-headed gull BoCC Amber Meadow pipit BoCC Amber
Blue tit BoCC Green Merlin Annex 1, Schedule 1, BoCC Red
Brambling Schedule 1, BoCC Green Mistle thrush BoCC Red Bullfinch BoCC Amber, BAP Nuthatch BoCC Green
Buzzard BoCC Green Osprey Annex 1, Schedule 1, BoCC Amber
Carrion crow BoCC Green Oystercatcher BoCC Amber
Chaffinch BoCC Green Peregrine falcon Annex 1, Schedule 1, BoCC Green
Chiffchaff BoCC Green Pheasant No Status Coal tit BoCC Green Pied wagtail BoCC Green Collared dove BoCC Green Pink-footed goose BoCC Amber Common crossbill Schedule 1, BoCC Green Raven BoCC Green
Cormorant BoCC Green Red kite Annex 1, Schedule 1, BoCC Green
Cuckoo BoCC Red, BAP Red-legged partridge No status Curlew BoCC Red, BAP Common Redstart BoCC Amber Dipper BoCC Amber Redwing Schedule 1, BoCC Red Dunnock BoCC Amber, BAP Reed bunting BoCC Amber, BAP Fieldfare Schedule 1, BoCC Red Robin BoCC Green Garden warbler BoCC Green Rook BoCC Green Goldcrest BoCC Green Sand martin BoCC Green Golden plover Annex 1, BoCC Green Siskin BoCC Green
Goldeneye Schedule 1 Part 2, BoCC Amber Skylark BoCC Red, BAP
Goldfinch BoCC Green Snipe BoCC Amber Goosander BoCC Green Song thrush BoCC Red, BAP Goshawk Schedule 1, BoCC Green Sparrowhawk BoCC Green
Species Conservation status Species Conservation status Grasshopper warbler BoCC Red, BAP Spotted flycatcher BoCC Red, BAP Great black-backed gull BoCC Amber Starling BoCC Red, BAP Great-spotted woodpecker BoCC Green Stock dove BoCC Amber
Great tit BoCC Green Stonechat BoCC Green Greenfinch BoCC Green Swallow BoCC Green Grey heron BoCC Green Swift BoCC Amber Grey wagtail BoCC Red Tawny owl BoCC Amber
Greylag goose Schedule 1 Part 2, BoCC Amber Teal BoCC Amber
Hen harrier Annex 1, Schedule 1, BoCC Red Tree pipit BoCC Red, BAP
Herring gull BoCC Red, BAP Tree sparrow BoCC Red, BAP House martin BoCC Amber Treecreeper BoCC Green House sparrow BoCC Red, BAP Wheatear BoCC Green Jackdaw BoCC Green Whinchat BoCC Red Jay BoCC Green Whitethroat BoCC Green Kestrel BoCC Amber Wigeon BoCC Amber Lesser black-backed gull BoCC Amber Willow warbler BoCC Amber Lesser redpoll BoCC Red, BAP Woodcock BoCC Red Linnet BoCC Red, BAP Woodpigeon BoCC Green Little grebe BoCC Green Wren BoCC Green

Hopsrig Wind Farm ES Volume 4: Technical Appendices TA 6.1: Ornithology
ANNEX E: COLLISION RISK ASSESSMENTS
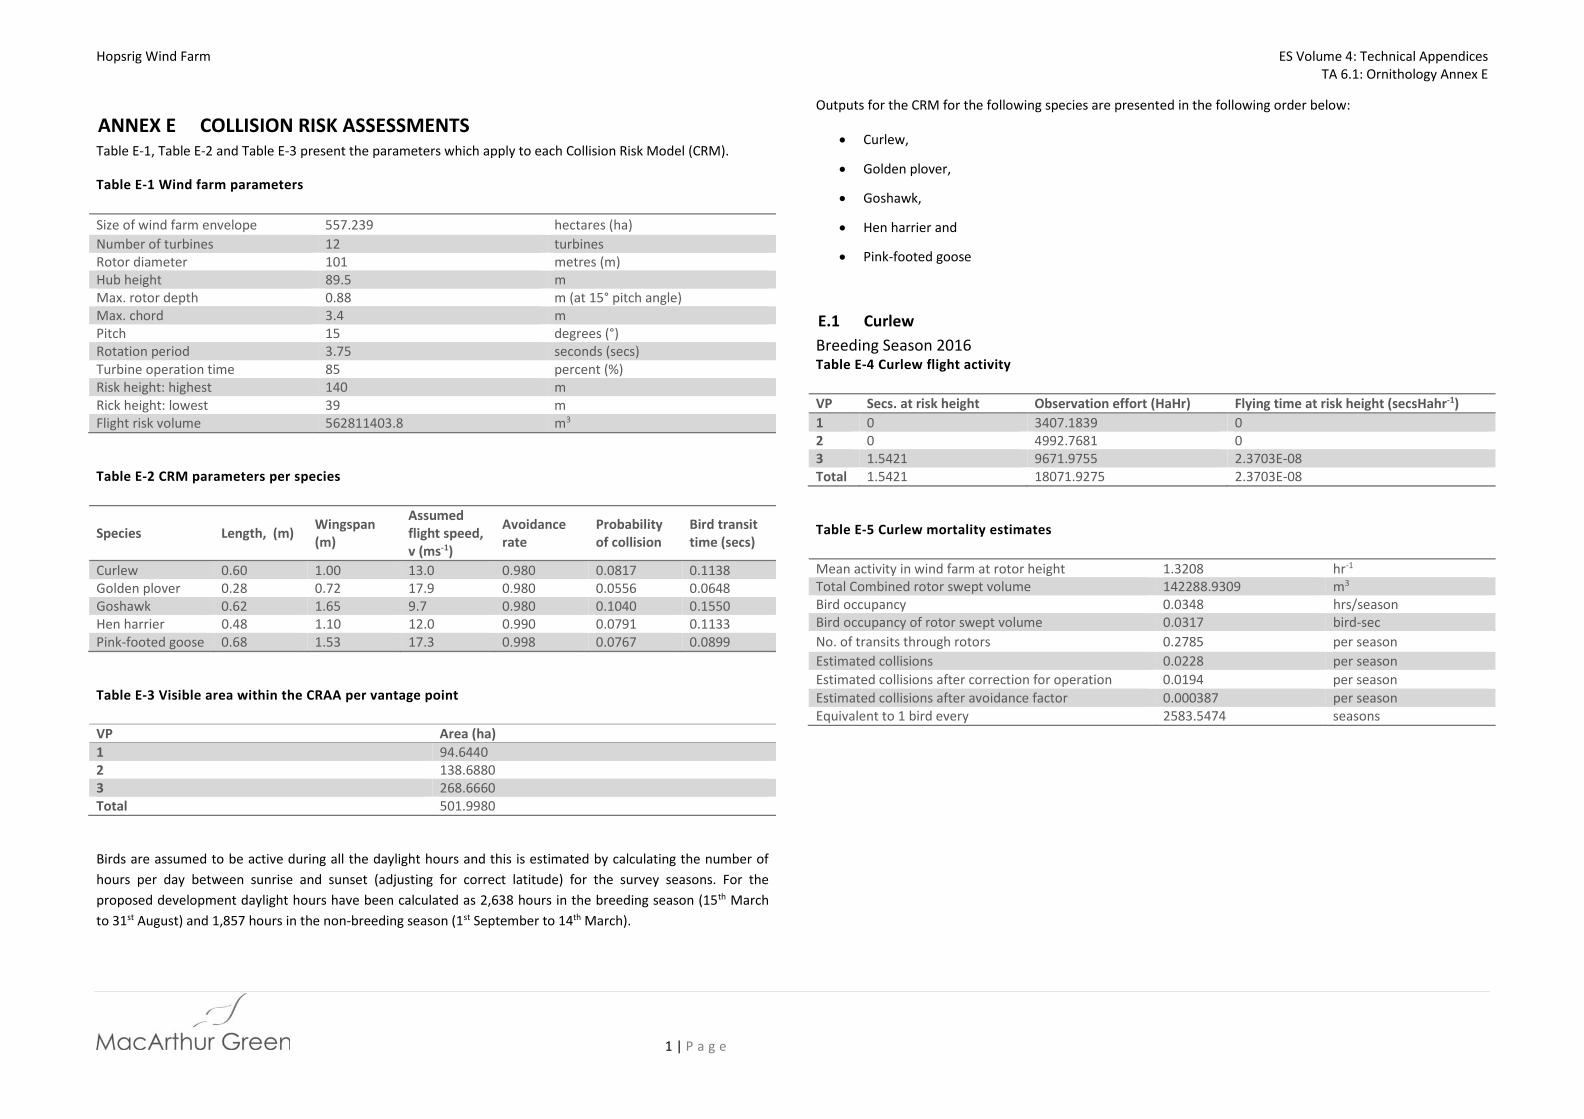
Hopsrig Wind Farm ES Volume 4: Technical Appendices TA 6.1: Ornithology Annex E
1 | P a g e
ANNEX E COLLISION RISK ASSESSMENTS Table E-1, Table E-2 and Table E-3 present the parameters which apply to each Collision Risk Model (CRM).
Table E-1 Wind farm parameters
Size of wind farm envelope 557.239 hectares (ha) Number of turbines 12 turbines Rotor diameter 101 metres (m) Hub height 89.5 m Max. rotor depth 0.88 m (at 15° pitch angle) Max. chord 3.4 m Pitch 15 degrees (°) Rotation period 3.75 seconds (secs) Turbine operation time 85 percent (%) Risk height: highest 140 m Rick height: lowest 39 m Flight risk volume 562811403.8 m3
Table E-2 CRM parameters per species
Species Length, (m) Wingspan (m)
Assumed flight speed, v (ms-1)
Avoidance rate
Probability of collision
Bird transit time (secs)
Curlew 0.60 1.00 13.0 0.980 0.0817 0.1138 Golden plover 0.28 0.72 17.9 0.980 0.0556 0.0648 Goshawk 0.62 1.65 9.7 0.980 0.1040 0.1550 Hen harrier 0.48 1.10 12.0 0.990 0.0791 0.1133 Pink-footed goose 0.68 1.53 17.3 0.998 0.0767 0.0899
Table E-3 Visible area within the CRAA per vantage point
VP Area (ha) 1 94.6440 2 138.6880 3 268.6660 Total 501.9980
Birds are assumed to be active during all the daylight hours and this is estimated by calculating the number of hours per day between sunrise and sunset (adjusting for correct latitude) for the survey seasons. For the proposed development daylight hours have been calculated as 2,638 hours in the breeding season (15th March to 31st August) and 1,857 hours in the non-breeding season (1st September to 14th March).
Outputs for the CRM for the following species are presented in the following order below:
Curlew,
Golden plover,
Goshawk,
Hen harrier and
Pink-footed goose
E.1 Curlew Breeding Season 2016 Table E-4 Curlew flight activity
VP Secs. at risk height Observation effort (HaHr) Flying time at risk height (secsHahr-1) 1 0 3407.1839 0 2 0 4992.7681 0 3 1.5421 9671.9755 2.3703E-08 Total 1.5421 18071.9275 2.3703E-08
Table E-5 Curlew mortality estimates
Mean activity in wind farm at rotor height 1.3208 hr-1 Total Combined rotor swept volume 142288.9309 m3 Bird occupancy 0.0348 hrs/season Bird occupancy of rotor swept volume 0.0317 bird-sec No. of transits through rotors 0.2785 per season Estimated collisions 0.0228 per season Estimated collisions after correction for operation 0.0194 per season Estimated collisions after avoidance factor 0.000387 per season Equivalent to 1 bird every 2583.5474 seasons

Hopsrig Wind Farm ES Volume 4: Technical Appendices TA 6.1: Ornithology Annex E
2 | P a g e
E.2 Golden plover Non-breeding Season 2015/2016 Table E-6 Golden plover flight activity
VP Secs. at risk height Observation effort (HaHr) Flying time at risk height (secsHahr-1) 1 0 4069.6919 0 2 549.6266 5547.5201 7.4973E-06 3 166.4453 10746.6394 2.2704E-06 Total 716.0720 20363.8514 9.7677E-06
Table E-7 Golden plover mortality estimates
Mean activity in wind farm at rotor height 0.00544 hr-1 Total Combined rotor swept volume 111523.4397 m3 Bird occupancy 10.1053 hrs/season Bird occupancy of rotor swept volume 7.2087 bird-sec No. of transits through rotors 111.2385 per season Estimated collisions 6.1859 per season Estimated collisions after correction for operation 5.2580 per season Estimated collisions after avoidance factor 0.1052 per season Equivalent to 1 bird every 9.5093 seasons
E.3 Goshawk Non-breeding Season 2015/2016 Table E-8 Goshawk flight activity
VP Secs. at risk height Observation effort (HaHr) Flying time at risk height (secsHahr-1) 1 1.2832 4069.6919 1.7504E-08 2 428.6455 5547.5201 5.8470E-06 3 0 10746.6394 0 Total 429.9287 20363.8514 5.8645E-06
Table E-9 Goshawk mortality estimates
Mean activity in wind farm at rotor height 0.0033 hr-1 Total Combined rotor swept volume 144211.7741 m3 Bird occupancy 6.0672 hrs/season Bird occupancy of rotor swept volume 5.5967 bird-sec No. of transits through rotors 36.1921 per season Estimated collisions 3.7717 per season Estimated collisions after correction for operation 3.2059 per season Estimated collisions after avoidance factor 0.0641 per season Equivalent to 1 bird every 15.5961 seasons
Breeding Season 2016 Table E-10 Goshawk flight activity
VP Secs. at risk height Observation effort (HaHr) Flying time at risk height (secsHahr-1) 1 0.1609 3407.1839 2.4724E-09 2 2.2500 4992.7681 3.4584E-08 3 20.0367 9671.9755 3.0798E-07 Total 22.4475 18071.9275 3.4503E-07
Table E-11 Goshawk mortality estimates
Mean activity in wind farm at rotor height 0.0002 hr-1 Total Combined rotor swept volume 144211.7741 m3 Bird occupancy 0.5071 hrs/season Bird occupancy of rotor swept volume 0.4678 bird-sec No. of transits through rotors 3.0251 per season Estimated collisions 0.3153 per season Estimated collisions after correction for operation 0.2680 per season Estimated collisions after avoidance factor 0.0054 per season Equivalent to 1 bird every 186.5900 seasons

Hopsrig Wind Farm ES Volume 4: Technical Appendices TA 6.1: Ornithology Annex E
3 | P a g e
E.4 Hen harrier Non-breeding Season 2015/2016 Table E-12 Hen harrier flight activity
VP Secs. at risk height Observation effort (HaHr) Flying time at risk height (secsHahr-1) 1 0 4069.6919 0 2 1.5178 5547.5201 2.0704E-08 3 0 10746.6394 0 Total 1.5178 20363.8514 2.07038E-08
Table E-13 Hen harrier mortality estimates
Mean activity in wind farm at rotor height 1.1537E-05 hr-1 Total Combined rotor swept volume 130751.8717 m3 Bird occupancy 0.0214 hrs/season Bird occupancy of rotor swept volume 0.0179 bird-sec No. of transits through rotors 0.1581 per season Estimated collisions 0.0125 per season Estimated collisions after correction for operation 0.0106 per season Estimated collisions after avoidance factor 0.0001 per season Equivalent to 1 bird every 9411.2619 seasons
Breeding Season 2016 Table E-14 Hen harrier flight activity
VP Secs. at risk height Observation effort (HaHr) Flying time at risk height (secsHahr-1) 1 0 3407.1839 0 2 0.7971 4992.7681 1.2253E-08 3 0 9671.9755 0 Total 0.7971 18071.9275 1.2253E-08
Table E-15 Hen harrier mortality estimates
Mean activity in wind farm at rotor height 6.8277E-06 hr-1 Total Combined rotor swept volume 130751.8717 m3 Bird occupancy 0.0180 hrs/season Bird occupancy of rotor swept volume 0.0151 bird-sec No. of transits through rotors 0.1329 per season Estimated collisions 0.0105 per season Estimated collisions after correction for operation 0.0089 per season Estimated collisions after avoidance factor 8.9338E-05 per season Equivalent to 1 bird every 11193.5037 seasons
E.5 Pink-footed goose Non-breeding Season 2015/2016 Table E-16 Pink-footed goose flight activity
VP Secs. at risk height Observation effort (HaHr) Flying time at risk height (secsHahr-1) 1 0 4069.6919 0 2 0 5547.5201 0 3 4246.8473 10746.6394 5.7930E-05 Total 4246.8473 20363.8514 5.7930E-05
Table E-17 Pink-footed goose mortality estimates
Mean activity in wind farm at rotor height 0.0323 hr-1 Total Combined rotor swept volume 149499.5929 m3 Bird occupancy 59.9320 hrs/season Bird occupancy of rotor swept volume 57.3110 bird-sec No. of transits through rotors 637.6144 per season Estimated collisions 48.9016 per season Estimated collisions after correction for operation 41.5664 per season Estimated collisions after avoidance factor 0.0831 per season Equivalent to 1 bird every 12.0290 seasons

Hopsrig Wind Farm ES Volume 4: Technical AppendicesTA 6.1: Ornithology
ANNEX F: CONFIDENTIAL ORNITHOLOGYContained within Confidential Volume available on request