technical challenges in the power system lewis dale, 18 th nov 2009,
TRANSCRIPT
Technical challenges in the power system
Lewis Dale, 18th Nov 2009,
2
Content
National Grid
Grid development & operations - the immediate tasks
GB
Europe
Technical challenges

Transmission – our activities
Transmission UK – electricity and gas
Transmission US – electricity
Electricity transmission owner
Gas transmission owner
Electricity system operator
Gassystem operator
French interconnector
LNG storage
Electricity transmission owner/operator
Canadian interconnector
We own the electricity transmission system in England and Wales.Our assets comprise ~7,200km of overhead line; ~675km of underground cable; and 337 substations at 244 sites.
We are the Great Britain System Operator, responsible for managing the operations of both the England and Wales transmission system that we own, and also the two independently owned high-voltage electricity transmission networks in Scotland.
We are the gas national transmission system operator, responsible for managing the operations of the Great Britain transmission system that we own.
We own the gas national transmission system in Great Britain.Our assets comprise ~7,400km of high pressure gas pipe and 26 compressor stations, connecting to 8 regional distribution networks and to third party independent systems.
We own and operate the UK assets, and a portion of the sub sea cables, that comprise the electricity interconnector between England and France as part of a joint agreement with the French transmission operator.
We own and operate four liquefied natural gas (LNG) storage facilities in Great Britain.
We own and operate the electricity transmission network spanning upstate New York, Massachusetts, Rhode Island, New Hampshire, and Vermont. Our assets comprise ~13,700km of overhead line; ~160km of underground cable; and 501 substations.
We own and operate a 224km direct current transmission line rated at 450kV that is a key section of an electricity interconnector between new England and Canada.

Gas Distribution – our activities
Gas Distribution US
Gas Distribution UK
UK Networks
Gas Distribution US
US Networks
UK Customers
US Customers
UK additional services
US additional services
Comprises four of the eight regional gas distribution networks in Great Britain
Comprises gas distribution networks across the northeastern US, located in service territories in upstate New York, New York City, Long Island, Massachusetts, New Hampshire and Rhode Island.
Our network of approximately 58,000 kilometres of gas pipelines covers an area of approximately 28,800 square kilometres.
Comprise approximately 132,000 kilometres of gas distribution pipelines.
We transport gas on behalf of approximately 33 active shippers from the gas national transmission system to 10.8 million consumers.
Provide services to 3.5 million consumers.
In addition we also manage the national emergency number for all the gas distribution networks and for other transporters in the UK.
Our core services are the operation and emergency responses for each of our gas distribution networks, in addition to billing, customer service and supply services.
Gas Distribution UK
Electricity Distribution & Generation – our activities
Electricity Distribution & Generation operations
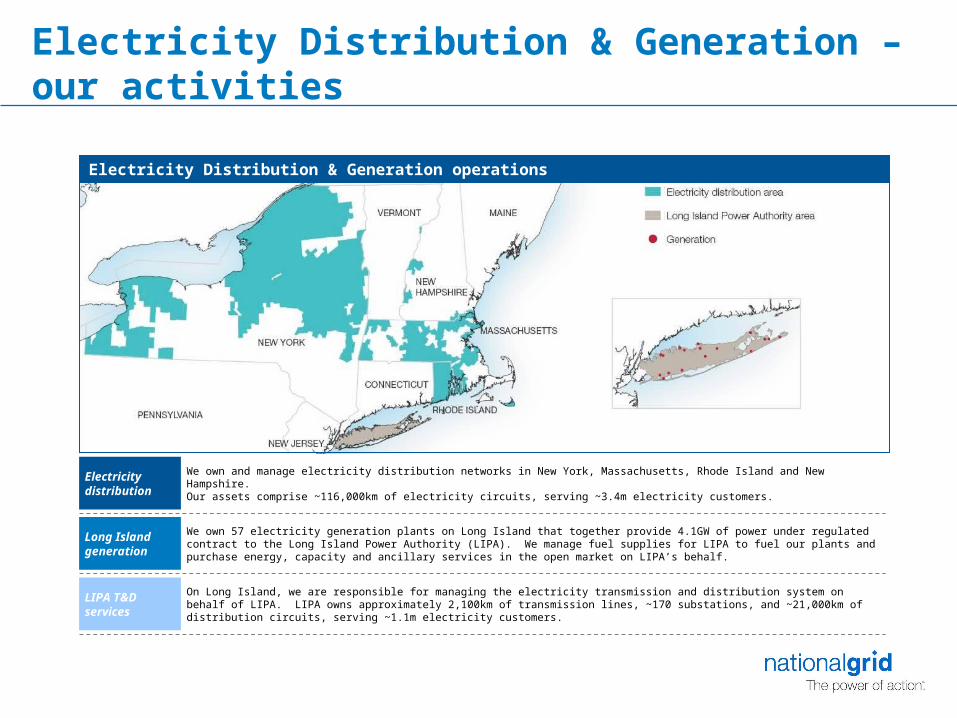
Electricity distribution
Long Island generation
We own and manage electricity distribution networks in New York, Massachusetts, Rhode Island and New Hampshire.Our assets comprise ~116,000km of electricity circuits, serving ~3.4m electricity customers.
We own 57 electricity generation plants on Long Island that together provide 4.1GW of power under regulated contract to the Long Island Power Authority (LIPA). We manage fuel supplies for LIPA to fuel our plants and purchase energy, capacity and ancillary services in the open market on LIPA’s behalf.
LIPA T&D services
On Long Island, we are responsible for managing the electricity transmission and distribution system on behalf of LIPA. LIPA owns approximately 2,100km of transmission lines, ~170 substations, and ~21,000km of distribution circuits, serving ~1.1m electricity customers.
National Grid’s environmental commitments
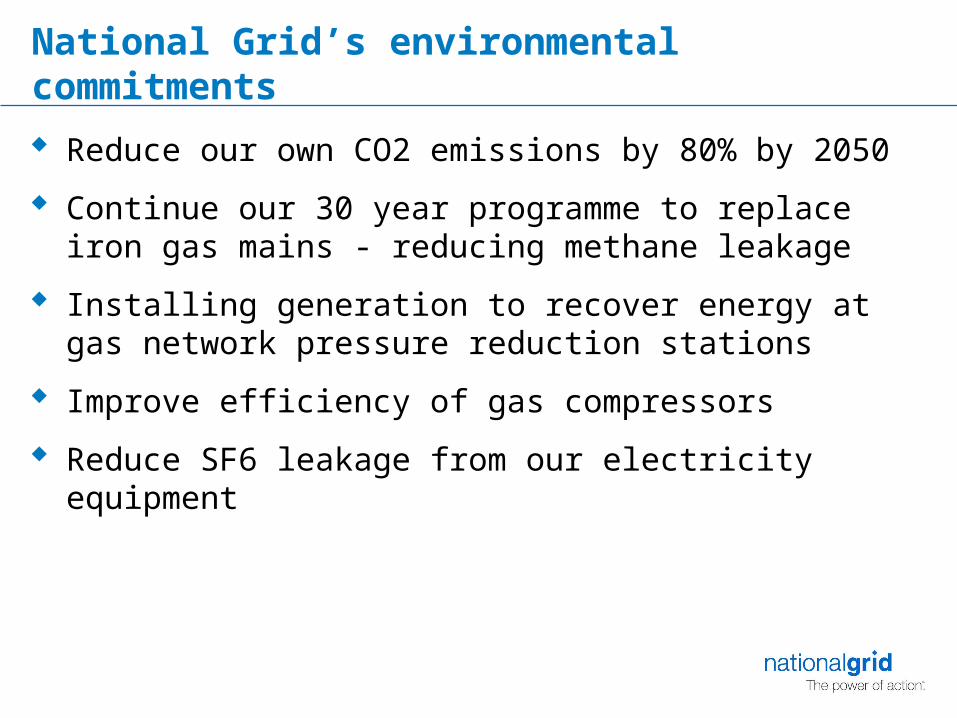
Reduce our own CO2 emissions by 80% by 2050
Continue our 30 year programme to replace iron gas mains - reducing methane leakage
Installing generation to recover energy at gas network pressure reduction stations
Improve efficiency of gas compressors
Reduce SF6 leakage from our electricity equipment

Grid developments
GBEurope

Plant closures…
12GW coal & oil (LCPD)
7.5GW nuclear
Demand growth ~0.5% pa
Incremental nuclear
Lifetime extensions
Two new stations in 2020
Modest renewable growth
6GW offshore & 7GW onshore
Strong fossil growth
3GW of new supercritical coal (some with CCS)
15GW new gas
Gas dominates at 44% share
2020 Target Description ProgressEU Renewable Energy
Target; 15% of final energy demand
2050 CO2 Target on correct ‘flight path’
Scottish Renewables Target
39.0, 44%
23.1, 26%
6.9, 8%
13.4, 15%
1.2, 1%
5.5, 6%
Gas Coal Nuclear Wind Other Renew Other
Summary
Generation gap caused by closures is largely filled with gas-fired plant,
augmented with incremental nuclear and some renewable wind
Risk of missing renewables targetsBusiness as Usual scenario

Plant closures 12GW Coal & oil LCPD 7.5GW nuclear Some gas & additional coal
Significant new renewable 30 GW wind (19GW offshore, 11GW
onshore) Some tidal, wave, biomass & solar PV
Significant new non renewable build 3GW of new nuclear 3GW of new supercritical coal (some CCS) 11GW of new gas
Renewable share grows from 5% to 36% Electricity demand remains flat
Reductions from energy efficiency Increases from heat pumps & cars
Heat & transport efficiencies also required
34.1, 34%
19.8, 20%6.9, 7%
29.1, 30%
3.3, 3%
5.5, 6%
Gas Coal Nuclear Wind Other Renew Other
2020 Target Description Progress
UK Renewable Energy Target 15% of final energy demand
2050 CO2 Target on correct ‘flight path’
Scottish Renewables Target
Summary
Generation gap caused by closures is filled with wind, augmented by gas & clean coal. Nuclear returns in 2020.
What might be needed?Gone Green Scenario

GB network developments
Plant closures 12GW Coal & oil LCPD 7.5GW nuclear Some gas & additional coal
Significant new renewables 30 GW wind (19GW offshore &
11GW onshore) Some tidal, wave, biomass &
solar PV Significant new non renewable build
3GW of new nuclear 3GW of new supercritical coal 11GW of new gas
Major new interconnection Renewable share of generation
grows from 5% to 36% Electricity demand remains flat
Energy efficiency Heat pumps & Cars
France 2
Belgium
BritNed
Ireland
France 1
NIreland
Norway

Reinforcement cost - summary
Onshore
Offshore 7500 (From Ofgem estimate of £15bn for 38GW)

Wind variability: short-term reserves
0
100
200
300
400
500
600
5,000 10,000 15,000 20,000 25,000 30,000 35,000 40,000
Wind Capacity (MW)
Yea
r o
n Y
ear
incr
ease
in M
arg
in C
ost
s fr
om
200
9/10
(£m
)
Forecast wind dispersion effectWind Forecast Error at 10% of Capacity
0
20
40
60
80
100
05/01/2009 06/01/2009 07/01/2009 08/01/2009 09/01/2009 10/01/2009 11/01/2009 12/01/2009
Date
Win
d O
utp
ut
(% o
f ca
pac
ity)
Wind Output (% of metered capacity)
Monday Peak demand ~58GW
Wind Output ~6%
TuesdayTRIAD demand day = 59.2GW
Wind Output ~16%
Wednesday Peak demand ~59GW
Wind Output ~12%
Wind output at peak electricity demand for 2008/09
Reserve requirements depend on forecast accuracy and diversity

A European ApproachA European Approach
• Exploit wind diversity• Share reserves & storage• Maximise CO2
benefits
• Co-ordination needed given cross-border impacts already experienced

Albers Equal Area Conic Projection
DRAFTDRAFT
- Existing submarine cables (2015) - New submarine cable foreseen until 2015
- National grid development plan for 2015
- Candidates for grid reinforcement measures beyond 2015 (long-term RMM)
- Offshore wind park cluster until 2015
•New pumping units
•ES•ES
•PT•PT
2015 Grid Development in Europe2015 Grid Development in Europe
GRGR
•IE•IE
•NL•NL
•DE•DE
2008: 70GW wind. 2015: 140-180GW

Operational measuresOperational measures
• Phase shifting transformers (quad boosters)– Control power sharing on parallel circuits maximising
useable capacity– Require co-ordination across network
• Special protection (intertrip) schemes– Alleviate post-fault conditions by using wider reserves– Co-ordination needed to ensure reserves adequate
• Dynamic line ratings– Monitor conductor temperatures and sags permitting higher
pre and post fault ratings– Voltage and stability issues become more pressing

Wind power outage in Spain in 2008 due to voltage dip
North South Mode (0,4 … 0.5 Hz)
StabilityStability
Power system oscillation modes N-S & E-W

System control System control
Decentralised markets discover/encourage efficient conventional generation behaviour
But central system operators have best information to forecast wind and demand and are best able to act strategically

Offshore grids
Significant synergies achievable in offshore grids
Requires multi-terminal HVDC (offshore)
Large amounts of wind power coming
onshore
Interconnector flowcheaper to dearer
Wind output sold to cheaper market

Implications of SMART technology
Transmission already actively managed (and development will continue)
Real-time re-despatching
Dynamic line ratings (real-time monitoring of temperatures/sags & stability limits)
Network flow control (phase shift transformers, HVDC link & switching)
Special protection schemes (post-fault actions)
Increasingly, wide area monitoring and control
Can SMART technology bring new demand side measures?

Smart Meter
Technology Penetration
Smart Home
SmartGrid
Consumer Supplier DNO / DSO SO TO
Price awareness / sensitivity*
Reduced use *
Peak avoidance
Saved costs from AMR*
Tariff targeting
Improved planning data / investment planning*
Modest reduction in peak demands*
Better planning data from DNOs*
Bulk response to tariffs and TOU pricing. reduced use / peak avoidance*
Intelligent appliances*
More sophisticated tariffs / ‘real’ time price signals
(Capacity / energy driven)
Fault detection
Quality of supply (e.g. voltage, pressure, CV)*
TOU capacity pricing signals
Some demand alignment with intermittent generation / scarcity of fuel*
Greater peak avoidance
Higher demands over minimums
Greater peak avoidance*
Appliances / demand response to external range of drivers
Supplier balancing pre and in BM
Direct intermittent generation contracts.
Gen capacity avoidance
Real time Network Capacity Management
Micro generation / storage management
Avoided / optimised investment
Greater self balancing ‘real’ time.
Aggregated balancing services
Demand BOAs
Avoided peak investment (observed and forecast reduction)
Contracted demand intertrip
Potential from demand responsiveness (DSM)

Active distribution networks
Active management and control of distribution will become increasing beneficial given
Distributed generation
Electric vehicle charging
SMART appliances
Flexibility services required by
transmission system operator,
distribution system operator,
suppliers (balance responsible parties)
Service despatch must respect distribution network limitations

Future GB Networks: Potential New Developments
Series capacitors
Major Increase in HVDC interconnections (CSC & VSC) to external power systems (Ireland, mainland Europe)
Use of HVDC technology (CSC & VSC) embedded in GB synchronous power system
Multi-terminals HVDC systems onshore and offshore
Significant growth in new asynchronous generation technologies such as onshore & offshore wind and other renewables, as well as synchronous large nuclear, clean coal etc
Offshore ac and dc transmission networks as part of the GB power system

Future GB Networks: Technical Challenges (1)
Significant changes to the GB transmission system characteristics
New system design and operation solutions/technologies in GB introducing new phenomena that must be understood and any risks mitigated/managed
Fast control systems on series connected power equipment
Performance of many control systems independently and together (design, specification and testing) under continuously changing generation pattern/demand/network configurations

Future GB Networks: Technical Challenges (2)
System reliability as affected by the reliability of control systems used on series-connected equipment including their software and hardware
Adverse control interactions can cause large system impacts
First installations of Wide Area Measurement, Monitoring and Control (WAM M & C)?
All new controls must work with existing, conventional, fast and slow controls
All these network challenges are in addition to unprecedented changes in generation technologies
Potential R&D Areas (1)
GBSQSS review: Secured Event, boundary definition and boundary capability calculations
Interactions between HVDC and TCSC controls, mechanisms, mitigation etc
For asynchronous CSC or VSC HVDC links: are POD and large signal stabilisation controls technically feasible?
Technical feasibility of inertial (df/dt) response/control from asynchronous CSC and VSC HVDC links
Multi-infeed VSC HVDC

Potential R&D Areas (2)
WAMM&C in real time operation and pre and post fault power flow dispatch
Power system harmonics above 50th; effects of equipment and systems, emission limits for planning and compatibility
TSCS sub-synchronous characteristics, can it be made to look inductive? Laboratory model plus theoretical modelling and analysis
Multi-terminal VSC HVDC, DC faults and recovery

Electricity infrastructure – progress so far
A vision for the transmission network in 2020 produced
Preliminary engineering work commenced
Consultations and scrutiny of next network development steps underway
Planning Act passed
A range of revised Transmission Access rules developed. DECC consulting on use of legislative powers
An effective interim connect & manage regime delivering tangible results