technical design report for the amore 0 decay search ... · technical design report for the amore 0...
TRANSCRIPT
Technical Design Report for the AMoRE 0νββ Decay
Search Experiment
V. Alenkova, P. Aryalb, J. Beyerc, R.S. Boikod, K. Boonine, O. Buzanova,N. Chanthimae, M.K. Cheounf, D.M. Chernyakd, J. Choig, S. Choig,F.A. Danevichd, M. Djamalh, D. Drungc, C. Enssi, A. Fleischmanni,A.M. Gangapshevj, L. Gastaldoi, Yu.M. Gavriljuk j, A.M. Gezhaev j,
V.I. Gurentsovj, D.H. Hab, I.S. Hahnk, J.H. Jangb, E.J. Jeonl, H.S. Jol,H. Joog, J. Kaewkhaoe, C.S. Kangl, S.J. Kangm, W.G. Kangl, S. Karkib,
V.V. Kazalovj, N. Khanbekovn,o, G.B. Kiml, H.J. Kimb, H.L. Kimb,H.O. Kiml, I. Kimg, J.H. Kimp, K. Kimg, S.K. Kimg, S.R. Kiml, Y.D. Kiml,
Y.H. Kiml, K. Kirdsirie, V.V. Kobychevd, V. Kornoukhovn,V.V. Kuzminovj, H.J. Leel, H.S. Leel, J.H. Leep, J.M. Leep, J.Y. Leeb,K.B. Leep, M.H. Leel, M.K. Leep, D.S. Leonardl, J. Lil, J. Liq, Y.J. Liq,P. Limkitjaroenporne, K.J. Mar, O.V. Mineevj, V.M. Mokinad, S.L. Olsenl,
S.I. Panasenkoj, I. Pandeyb, H.K. Parkl, H.S. Parkp, K.S. Parkl,D.V. Podad, O.G. Polischukd, P. Polozovn, H. Prihtiadih, S.J. Ral,S.S. Ratkevichj, G. Roohs, K. Siyeont, N. Srisittipokakune, J.H. Sol,
J.K. Sonb, J.A. Tekuevaj, V.I. Tretyakd, A.V. Veresnikovaj, R. Wirawanu,S.P. Yakimenkoj, N.V. Yershovj, W.S. Yoonl, Y.S. Yoonl, and Q. Yueq
aJSC FOMOS-Materials, Moscow 107023, RussiabDepartment of Physics, Kyungpook National University, Daegu 41566, Korea
cPhysikalisch-Technische Bundesanstalt (PTB), D-38116 Braunschweig,Germany
dInstitute for Nuclear Research, MSP 03680 Kyiv, UkraineeNakhon Pathom Rajabhat University, Nakhon Pathom 73000, Thailand
fDepartment of Physics, Soongsil University, Seoul 06978, KoreagDepartment of Physics, Seoul National University, Seoul 08826, Korea
hInstitut Teknologi Bandung, Jawa Barat 40132, IndonesiaiKirchhoff-Institute for Physics, D-69120 Heidelberg, Germany
jBaksan Neutrino Observatory of INR RAS, Kabardino-Balkaria 361609, RussiakEhwa Womans University, Seoul 03760, Korea
lCenter for Underground Physics, Institute of Basic Science, Daejeon 34047,Korea
mSemyung University, Jecheon 27136, KoreanInstitute of Theoretical and Experimental Physics, Moscow 117218, Russia
oNational Research Nuclear University MEPhI, Moscow, 115409, RussiapKorea Research Institute for Standard Science, Daejeon 34113, Korea
qTsinghua University, 100084 Beijing, ChinarDepartment of Physics, Sejong University, Seoul 05000, Korea
sDepartment of Physics, Abdul Wali Khan University, Mardan 23200, PakistantDepartment of Physics, Chung-Ang University, Seoul 06911, Korea
uUniversity of Mataram, Nusa Tenggara Bar. 83121, Indonesia
December 21, 2015
arX
iv:1
512.
0595
7v1
[ph
ysic
s.in
s-de
t] 1
8 D
ec 2
015

Abstract
The AMoRE (Advanced Mo-based Rare process Experiment) project is a se-ries of experiments that use advanced cryogenic techniques to search for theneutrinoless double-beta decay of 100Mo. The work is being carried out by aninternational collaboration of researchers from eight countries. These searchesinvolve high precision measurements of radiation-induced temperature changesand scintillation light produced in ultra-pure 100Mo-enriched and 48Ca-depletedcalcium molybdate (48deplCa100MoO4) crystals that are located in a deep un-derground laboratory in Korea. The 100Mo nuclide was chosen for this 0νββdecay search because of its high Q-value and favorable nuclear matrix element.Tests have demonstrated that CaMoO4 crystals produce the brightest scintilla-tion light among all of the molybdate crystals, both at room and at cryogenictemperatures. 48deplCa100MoO4 crystals are being operated at milli-Kelvin tem-peratures and read out via specially developed metallic-magnetic-calorimeter(MMC) temperature sensors that have excellent energy resolution and relativelyfast response times. The excellent energy resolution provides good discriminationof signal from backgrounds, and the fast response time is important for minimiz-ing the irreducible background caused by random coincidence of two-neutrinodouble-beta decay events of 100Mo nuclei. Comparisons of the scintillating-lightand phonon yields and pulse shape discrimination of the phonon signals willbe used to provide redundant rejection of alpha-ray-induced backgrounds. Aneffective Majorana neutrino mass sensitivity that reaches the expected range ofthe inverted neutrino mass hierarchy, i.e., 20-50 meV, could be achieved with a200 kg array of 48deplCa100MoO4 crystals operating for three years.

Contents
1 Introduction 3
2 Scientific goals 62.1 Brief summary of ββ experiments . . . . . . . . . . . . . . . . . . 62.2 Choice of 100Mo for 0νββ experiments . . . . . . . . . . . . . . . 92.3 Development of CaMoO4 crystal scintillators . . . . . . . . . . . 102.4 AMoRE project - Parameters . . . . . . . . . . . . . . . . . . . . 112.5 Sensitivity of AMoRE . . . . . . . . . . . . . . . . . . . . . . . . 12
3 CaMoO4 crystal scintillators 163.1 Production of high-purity crystals . . . . . . . . . . . . . . . . . 16
3.1.1 Synthesis of CaMoO4 raw material . . . . . . . . . . . . . 193.1.2 CaMoO4 crystal growth . . . . . . . . . . . . . . . . . . . 20
3.2 Luminescence and scintillation properties of CaMoO4 crystals . 203.2.1 Luminescence properties of CaMoO4 crystals . . . . . . . 203.2.2 Light yield measurements . . . . . . . . . . . . . . . . . . 213.2.3 Absolute light yield measurement . . . . . . . . . . . . . . 223.2.4 Light yield comparison of different CaMoO4 crystals . . . 233.2.5 Room-temperature energy resolution of CaMoO4 crystals 233.2.6 Pulse shape discrimination (PSD) . . . . . . . . . . . . . 253.2.7 Temperature dependence of the light yield of CaMoO4
crystals . . . . . . . . . . . . . . . . . . . . . . . . . . . . 253.3 48Ca-depleted, 100Mo-enriched 48deplCa100MoO4 crystals . . . . . 263.4 Growth of large radio-pure 48deplCa100MoO4 crystals . . . . . . . 273.5 Radioactive contaminants in CaMoO4 crystal scintillators . . . . 29
3.5.1 Low-background setup at Y2L . . . . . . . . . . . . . . . 293.5.2 Contamination of CaMoO4 crystals by thorium and radium. 31
4 Cryogenic particle detection 334.1 Principle of thermal detection in low temperature calorimeters . 344.2 Magnetic Metallic Calorimeter (MMC) . . . . . . . . . . . . . . . 354.3 Phonon measurement with large CaMoO4 crystals . . . . . . . . 364.4 Development of low-temparature photon sensors . . . . . . . . . 384.5 Simultaneous measurement of phonon and photon signals . . . . 40
1

5 Experimental design 435.1 Overview . . . . . . . . . . . . . . . . . . . . . . . . . . . . . . . 435.2 AMoRE-Pilot . . . . . . . . . . . . . . . . . . . . . . . . . . . . . 43
5.2.1 Experimental arrangement . . . . . . . . . . . . . . . . . 435.2.2 Inner shielding . . . . . . . . . . . . . . . . . . . . . . . . 465.2.3 Outer shielding . . . . . . . . . . . . . . . . . . . . . . . . 46
5.3 AMoRE-I . . . . . . . . . . . . . . . . . . . . . . . . . . . . . . . 475.4 AMoRE-II . . . . . . . . . . . . . . . . . . . . . . . . . . . . . . . 51
5.4.1 Crystals for AMoRE-II . . . . . . . . . . . . . . . . . . . 51
6 Simulation tools and background estimations 536.1 Geometry of simulation configuration . . . . . . . . . . . . . . . . 546.2 Internal background in CaMoO4 . . . . . . . . . . . . . . . . . . 556.3 Backgrounds from materials in detector system . . . . . . . . . . 566.4 Cosmic ray induced background . . . . . . . . . . . . . . . . . . . 59
6.4.1 Muon energy spectrum . . . . . . . . . . . . . . . . . . . . 606.4.2 Schematic layout of simulation geometry . . . . . . . . . . 606.4.3 Muon and muon-induced neutron backgrounds . . . . . . 61
6.5 Other backgrounds . . . . . . . . . . . . . . . . . . . . . . . . . . 616.6 Summary of Background Estimation . . . . . . . . . . . . . . . . 62
7 Supply, purification and recovery of enriched materials 647.1 100Mo . . . . . . . . . . . . . . . . . . . . . . . . . . . . . . . . . 647.2 48deplCa . . . . . . . . . . . . . . . . . . . . . . . . . . . . . . . . 657.3 Purification of calcium and molybdenum oxides and recovery of
enriched materials after crystal production . . . . . . . . . . . . 667.4 Deep purification of CaCO3 powder . . . . . . . . . . . . . . . . 667.5 Deep purification of MoO3 powder . . . . . . . . . . . . . . . . . 717.6 Calcium and molybdenum recovery from CaMoO4 crystals . . . . 76
7.6.1 Decomposition of CaMoO4 crystals with 65% HNO3 . . . 767.6.2 Decomposition of CaMoO4 crystal material with 36% HCl 78
8 Offline software 808.1 Environment . . . . . . . . . . . . . . . . . . . . . . . . . . . . . 818.2 Modules . . . . . . . . . . . . . . . . . . . . . . . . . . . . . . . . 81
9 Time, Schedule 829.1 Schedules . . . . . . . . . . . . . . . . . . . . . . . . . . . . . . . 82
2

Chapter 1
Introduction
Even though we now know that neutrinos have mass, their absolute masses andtheir fundamental nature still remain a mystery [1, 2]. The Standard Modelof three-neutrino mixing has been firmly established by a number of neutrinooscillation measurements, including the recent determination of θ13 by the DayaBay, Double-Chooz and RENO experiments. However, mixing measurements donot discriminate between Majorana- and Dirac-type neutrinos and only provideinformation on mass differences, not on mass values themselves. At present, fivefundamental questions about neutrinos remain:
(i) Are they Majorana-type or Dirac-type?
(ii) What is their absolute mass scale?
(iii) What is the mass hierarchy between the three neutrinos?
(iv) Is lepton number conserved?
(v) Does neutrino mixing violate CP symmetry?
Among these, the first question about the nature of neutrinos is most funda-mental in that it remains the major unknown aspect of the Standard Model.Moreover it is an essential element for any theoretical model of neutrino masses.
The universe is comprised of matter and not antimatter; the cause of thismatter-antimatter asymmetry is not understood. Since the now well establishedCP -symmetry violation in the quark sector is not sufficient to generate the ob-served matter excess, particle physicists suspect that the neutrino sector maybe responsible for the current matter-antimatter asymmetry (by a process calledleptogenesis). If this turns out to be the case, this will solve one of the most inter-esting and fundamental puzzles about the development of the universe. However,even if CP is observed to be violated in neutrino oscillation experiments, thetheory for a leptogenesis-induced matter-antimatter asymmetry depends sen-sitively on whether or not neutrinos are Majorana particles. Investigation ofneutrinoless double-beta decays (0νββ) is the only practical way to determinethe nature of the neutrino (Majorana or Dirac particle), check lepton-numberconservation, and determine the absolute scale and the neutrino mass hierar-chy [2, 3, 4, 5, 6, 7, 8].
3

The half-life of 0νββ decay, T1/2(0νββ), is related to the effective Majorananeutrino mass (〈mββ〉) and nuclear matrix element (M0ν), as follows:
[T 0ν1/2]−1 = G0ν |M0ν |2
(〈mββ〉me
)2
, (1.1)
where G0ν is the phase-space factor and 〈mββ〉 is given by
〈mββ〉 = ΣmiU2ei ∼
1
2
∣∣∣m1 +m2e2iβ +m3e
2i(γ−δ)∣∣∣ . (1.2)
Here Uei is the Pontecorvo-Maki-Nakagawa-Sakata (PMNS) neutrino mixing ma-trix, mi are the light Majorana neutrino eigenstate masses, and β, γ and δ areCP-violating phases.
Neutrino oscillation experiments give the mass differences: ∆m223 ∼ 2.43 ×
10−3 eV2, ∆m212 ∼ 8.0×10⁻⁵ eV2, and the mixing angles. The expected value of
〈mββ〉 is shown as a function of the smallest neutrino mass in Fig. 1.1. For high〈mββ〉 values (and correspondingly lower 0νββ half-lives), the neutrino massscale is larger than the mass differences and the neutrinos are nearly degenerate.If the value of 〈mββ〉 approaches that of the mass differences, 〈mββ〉 lies in one ofthe horizontal bands, depending on the neutrino mass hierarchy; for the invertedhierarchy, the value of 〈mββ〉 is in the 0.02 – 0.05 eV range. This interval ofneutrino masses could be accessed with a zero background 0νββ detector with atotal mass of several hundred kilograms. On the other hand, orders-of-magnitudelarger-scale experiments would be needed to access the normal neutrino masshierarchy.
It should be stressed that 0νββ decay-like signals could result from the influ-ence of hypothetical, beyond the Standard Model particles and/or interactions.This might involve, for example, an admixture of right-handed currents in weakinteractions, the emission of massless (or very light) Nambu-Goldstone bosons(so-called Majorons), or a variety of other processes that have been proposedin extensions of the SM [6, 7, 15, 16]. Therefore, investigations of 0νββ decayprocesses are powerful methods for searching for beyond-the-SM effects.
The AMoRE experiment’s aim is to search for 0νββ decay of 100Mo nucleiusing CaMoO4 scintillating crystals operating at milli-Kelvin temperatures. Theultimate goal of the experiment is to achieve a sensitivity that covers the entire〈mββ〉 range that is allowed by the inverted neutrino mass hierarchy. This willrequire advancing the current states-of-the-art in background rejection, radio-pure crystal growing, and cryogenic radiation detector techniques. To accomplishthese ambitious goals, we have formed an international team of researchers thatincludes experts in each of these areas and plan on using a phased approach thatstarts with modest experiments with current state-of-the-art technologies andadvance from there. This report describes the status of our R&D efforts andaccomplishments in radio-pure crystal growing, cryogenic detection, backgroundsimulation and suppression, and the current status of, and plans for, our step-wise approach to a full experiment with a 200 kg detector.
4

Figure 1.1: Effective Majorana neutrino mass (〈mββ〉) as a function of the massof the lightest neutrino together with current limits on the mass from a selectionof the most sensitive experiments [9, 10, 11, 12, 13]. To convert the experimentalhalf life limits to 〈mββ〉 limits, the products of G0ν |M0ν |2 were chosen as thecentral values from the ranges given in [14]. (See Sec. 2.5 for the sensitivity ofAMoRE-II experiment after five years of data taking).
5

Chapter 2
Scientific goals
2.1 Brief summary of ββ experiments
Many experimental techniques for double-beta-decay searches have been devel-oped, starting with the first experiment in 1948 that used Geiger counters, butdid not see ββ any signal [17]. The SM-allowed, second-order weak two-neutrinodouble-beta (2νββ) decay mode was first observed in tellurium and selenium bymeans of geochemical techniques (for a review, see, e.g., [18]). The first obser-vation of 2νββ decay in a direct counting experiment was accomplished in 1987with an apparatus that consisted of a time-projection chamber that surroundeda thin 82Se film source [19]. At present, 2νββ decay modes have been detectedfor eleven nuclides: 48Ca, 76Ge , 82Se, 96Zr, 100Mo, 116Cd, 128Te, 130Te, 136Xe,150Nd and 238U (for reviews, see refs. [20, 21, 22] and references therein). Indi-cations for two-neutrino double-electron capture in 78Kr [23] and 130Ba [24, 25]have also been reported.
In contrast, despite more than sixty years of experimental effort, no un-ambiguous examples of 0νββ decays have yet to be observed. The best half-life limits are at levels of T1/2 = 1023 ∼ 1025 yrs, depending on the nuclide(see [20, 26, 27, 28] and results of recent experiments [29, 30, 31, 32, 9]). Thesehalf-life limits have been used to restrict (using currently available theoreticalcalculations of the nuclear matrix elements) the effective Majorana neutrinomass to be below the level of 〈mββ〉 ∼ (0.2 − 2) eV. The best limits on thehalf-lives for the most studied nuclei and the effective Majorana neutrino massare summarized in Table 2.1.
There is also a claim by Klapdor-Kleingrothaus et al. for the detection of0νββ decays of 76Ge with a half-life of T1/2 ∼ 2×1025 yrs (〈mββ〉>∼ 0.3 eV) [33].This was derived from the data of the Heidelberg-Moscow experiment [34] thatutilized an 11 kg array of 76Ge-enriched high-purity germanium (HPGe) detec-tors [35, 36]. In the context of the SM, this half-life implies nearly degenerateneutrino masses. This claimed observation was criticized in refs. [37, 38, 39] andwas recently challenged by the GERDA experiment that used a similar HPGespectrometry technique [30] and found no evidence for 0νββ decay of 76Geand set a lower limit at the level of limT1/2 = 2.1 × 1025 yr. Unfortunately,the GERDA experiment exposure (21.6 kg×yr) was sufficient to permit only a
6

Figure 2.1: The 0νββ-decay half-lives calculated for an effective Majorana neu-trino mass 〈mββ〉 = 0.05 eV using different theoretical methods to calculate thenuclear matrix element (Figure 24 from ref. [7]).
marginal exclusion of the Klapdor claim.However, as one can see in Fig. 1.1, even the most sensitive current ex-
periments only explore the degenerate region of the neutrino mass pattern.Several new experiments have been proposed to reach the minimum 〈mββ〉 re-gion allowed for the inverted neutrino mass hierarchy, i.e., 〈mββ〉 ≤ 0.05 eV(see reviews in refs. [5, 26, 27, 28, 47, 48, 49, 50, 51] and original propos-als [52, 53, 54, 55, 56, 57, 58, 59, 60, 61, 62]). To cover this region, thehalf-life sensitivity of the next generation experiments should be at the levelof T1/2 ∼ 1026 − 1027 yrs (see Fig. 2.1).
To accomplish these ambitious goals, detectors are required to: sample asufficiently large number of ββ-active nuclei (i.e., 1027 ∼ 1028 nuclei, whichcorresponds to 103 ∼ 104 moles of the isotope of interest); have as low as possible(ideally zero) radioactive background and as high as possible (ideally 100%)detection efficiency; have the ability to distinguish a 0νββ signal from differentbackground components; and, especially, have excellent energy resolution.
The choice of the candidate nuclide is determined by the scale of the experi-ment, the extreme background requirements, the possibility of using calorimetric(“source=detector”) techniques to achieve high detection efficiency, and the en-ergy resolution. Among the theoretically most promising nuclides (see Fig. 2.1),the mass production of enriched isotopes is available for 76Ge, 82Se, 100Mo, 116Cd,130Te and 136Xe [47, 48]. Suppression of background is easier for ββ nuclidesthat have a Qββ-value that is above the 2615 keV gamma line from 208Tl (adaughter nuclide in the 232Th chain). This limits the most promising candidatenuclides to 82Se, 100Mo and 116Cd.
7

Table 2.1: Half-life and Majorana-neutrino-mass limits from the most sensitiveneutrinoless double-beta decay experiments.
NucleusQββ [40][keV] Naturalabundance[41]
T1/2 [years] 〈mββ〉 [eV] ExperimentTechnique
Enrich-ment[%]
Ref.
48Ca 4267.0(4) 0.187(21) > 5.8× 10²² < 3.5 – 22 ElegantVICaF2(Eu)scintillator
Nat. [42]
76Ge 2039.06(1) 7.73(12) > 1.9× 1025 < 0.35 H-M,HPGe
86 [34]
> 1.57× 1025 < 0.33 – 1.35 IGEX,HPGe
86 [43]
2.23+0.44−0.31 0.32± 0.03 HPGe 86 [33]
> 2.1× 1025 < 0.2 – 0.4 GERDA,HPGe
86 [30]
82Se 2996.4(15) 8.73(22) > 3.6× 10²³ < 0.89 – 2.43 NEMO-3,tracking
97 [13]
100Mo 3034.37(40) 9.82(31) > 1.1× 1024 < 0.3 – 0.9 NEMO-3tracking
95-99 [32]
116Cd 2813.50(13) 7.49(18) > 1.7× 10²³ < 1.5 – 1.7 Solotvina,116CdWO4
scintillator
83 [44]
128Te 866.5(9) 31.74(8) > 8.1× 1024 < 1.1 – 1.5 Geochem. [45]130Te 2527.51(1) 34.08(62) > 4.0× 1024 < 0.27 – 0.76 Cuoricino,
CUORE-0CryogenicTeO2
bolometer
Nat. [9]
136Xe 2457.99(27) 8.8573(44)> 1.1× 1025 < 0.19 – 0.45 EXO-200,TPC
80.6 [29]
> 2.6× 1025 < 0.14 – 0.28 KamLAND-Zen,Liquidscintillator
90 [31]
150Nd 3371.38(20) 5.638(28) > 1.8× 10²² < 4.0 – 6.3 NEMO-3tracking
91 [46]
8

Figure 2.2: The computed neutrinoless double-beta decay half-lives for variousnuclei for 〈mββ〉 = 1 eV (Figure 2 from [8]).
2.2 Choice of 100Mo for 0νββ experiments
Among the double-beta-decaying nuclides, we selected 100Mo for the AMoREexperiment because of its high transition energy (Qββ = 3034.40(17) keV [63]),relatively large natural isotopic abundance (δ = 9.82(31)% [41]), and the en-couraging theoretical predictions for the nuclear matrix-element [64, 65, 66, 67,68, 69, 70, 71, 72]. As shown in Figs. 2.1 and 2.2, the 0νββ half-life for 100Mo isexpected to be relatively shorter than those for other candidate nuclei. It shouldbe noted that hundreds of kilograms of the 100Mo isotope can be enriched at areasonable price by centrifugation methods [73].
The most precise measurement to-date of the 100Mo 2νββ half-life was re-ported by the NEMO-3 experiment: T1/2 = (7.11± 0.54)× 1018 years [74]. Thebest 90% confidence-level lower limits on the half-life for the 0νββ mode of 100Moare T1/2(0νββ) > 5.5× 10²² yrs from the ELEGANT V experiment [75], whichused a 171 g sample of 94.5%-enriched 100Mo, and T1/2(0νββ) > 1.1× 1024 yrsfrom NEMO-3, which used a 6.9 kg 100Mo sample [32]. Both experiments useda spectroscopic (passive source) technique with tracking devices exposed to thinMo foils. In both cases, the energy resolution was moderate (8% '12% FWHM)and the detection efficiency (11%'19%) was relatively low. AMoRE is using acalorimetric (source=detector) technique with active scintillating crystals thatcontain 100Mo.
Several molybdate crystal scintillators that would allow for the realization ofa high-detection-efficiency experiment have been identified. The most promisingof these are ZnMoO4 [54, 73, 76, 77, 78, 79, 80, 81], CaMoO4 [82, 83, 84, 85],CdMoO4 [86], PbMoO4 [87] and Li2MoO4 [88, 89, 90]. Among these, CaMoO4
crystal scintillators have the advantages of a high mass-fraction of molybdenum(48%), the highest scintillation efficiency (it is the only molybdate that scintil-
9

Year Summary
2002 CaMoO4 idea for DBD, First CaMoO4 crystal was grown in Korea2003 ITEP(Russia)-Korea collaboration on CaMoO4 R&D2004 First conference presentation2005-2007 1st ISTC project for large CaMoO4 growing2006 INR (Ukraine) joined the collaboration, CaMoO4 grown in Ukraine2007 R&D on cryogenic readout techniques for CaMoO4 started2008 2nd ISTC project for enriched 48deplCa100MoO4 growing2009 AMoRE collaboration formed with institutions from 5 countries2010-2011 48deplCa100MoO4 crystal characterization and internal background stud-
ies2012 ITEP group awarded 8.7M$ for 48deplCa100MoO4 production line R&D
lates at room temperature), and excellent low-temperature bolometric proper-ties.
2.3 Development of CaMoO4 crystal scintillators
Among the inorganic scintillating materials that contain Mo in the structuralform of Scheelite or Wolframite, CaMoO4 produces the largest amount of scin-tillation light at room temperature. We recognized the potential of CaMoO4
crystals for a 100Mo 0νββ decay search and started developing CaMoO4 crystalsin 2002, when the first CaMoO4 crystal was grown with the Czochralski (CZ)technique in Korea. Discussions with V. Kornoukhov (ITEP, Russia) at the 4thInternational Conference on Non-accelerator New Physics (2003) led to a col-laborative R&D program to study the application of 100Mo-enriched CaMoO4
crystals for a 0νββ-decay search experiment. Kornoukhov subsequently sentRussian-grown CaMoO4 crystals to Korea for evaluation. This R&D programconfirmed that CaMoO4 is a promising material for a 0νββ search experimentand first results were presented in 2004 [91]. As part of these R&D activi-ties, other molybdate crystals and cryogenic readout techniques were consid-ered [82]. The INR (Ukraine) group led by F. Danevich was invited to jointhe CaMoO4 collaboration in 2006. This group, which had already performed asensitive experimental search using a CdWO4 scintillating crystal [44, 92] thatdemonstrated the applicability of scintillation crystal techniques for 0νββ decaysearches, added valuable operational experience to our team. Some CaMoO4
crystals were produced at the Institute of Materials (IM), Lviv, Ukraine, andresults from characterization and background studies of these crystals were pub-lished in Ref. [83].
These R&D efforts gained support from the International Science and Tech-nology Center (ISTC), an intergovernmental organization connecting scientistsfrom Russia and other countries of the Commonwealth of Independent States(CIS) with their peers in other countries, including Korea. Our first ISTCProject (#3293) was carried out between 2005 and 2007. A large, high-qualitycrystal (200 mm×30 mm×30 mm) was grown [93] and characterized [94]. Fig-
10
ures 3.3, 3.4 and 3.5 show photographs of CaMoO4 crystals produced at differ-ent places. The initial CaMoO4 crystals were produced by the Bank at PusanNational University, Korea. Subsequently, better quality and larger CaMoO4
crystals were produced by the Innovation Center of the Moscow Steel and Al-loy Institute (ICMSAI) in Moscow, Russia, while others were produced at theInstitute of Materials (IM) in Lviv, Ukraine.
In 2007, a KRISS (Korea Research Institute for Standards and Science) groupspecialized in advanced detector development joined our collaboration and initi-ated the development of cryogenic techniques for reading out CaMoO4 crystals;results from their initial studies were published in Ref. [84]. A second ISTCProject started in 2008 with the primary goal of growing a 48deplCa100MoO4 crys-tal with 3 kg of 100Mo-enriched and 48Ca-depleted, radio-pure powders. Char-acterization and background studies of these crystals were reported in Ref. [95].
The AMoRE collaboration, with members from nine different institutionsfrom five countries was officially formed in 2009. The collaboration has subse-quently expanded to ∼90 researchers from 17 institutions from eight countries.Recently, the Russian members of the AMoRE collaboration were awarded a$8.7M (US) grant to support further development of large-scale quantities ofultra-low-background 48deplCa100MoO4 crystals for the 200 kg phase of AMoRE.
2.4 AMoRE project - Parameters
The basic parameters of the AMoRE experiment are summarized as follows:
• 48deplCa100MoO4 cryogenic scintillating detectors enriched in 100Mo anddepleted in 48Ca
• 100Mo enrichment > 95%
• Operating temperature: 10-30 mK
• Energy resolution: 5 keV @ 3 MeV
• Individual detector-element mass: 0.5 kg
• Location: Y2L (Yangyang underground laboratory) 700 meter depth (AMoRE-pilot, AMoRE Phase I) & a new deeper underground laboratory (for AMoREPhase II)
• Collaboration: 8 countries, 17 institutes, ∼90 researchers
• Phases
AMoRE-pilot Phase I Phase II
Mass of 48deplCa100MoO4 1.5 kg 5 kg 200 kgBackground [counts/(keV ·kg ·year)]
10−2 10−3 10−4
T1/2 sensitivity [years] 3.2× 1024 2.7× 1025 1.1× 1027
〈mββ〉 sensitivity [meV] 210–400 70–140 12–22Schedule 2015–2016 2016–2018 2018–2022
11

2.5 Sensitivity of AMoRE
The sensitivity for a 0νββ experiment is usually defined as the half-life level, T 0ν1/2,
at which the expected signal would have the same strength as a 1σ fluctuationof the background level. For a source=detector arrangement, this is given by
T 0ν1/2 = ln 2×NA
a
Aε
√M · tb ·∆E
× 103, (2.1)
where NA is Avogadro’s number, a is the istopic abundance, ε is the detec-tion efficiency, A is the (dimensionless) atomic mass number of the decayingnuclide, M is the total detector mass of the nuclide of interest (in kilograms), tis the exposure time (in years), b is the background level in the signal region (incounts/keV/kg/yr) and ∆E is the energy window where the signal is expected,in keV (comparable to FWHM energy resolution). For the AMoRE experiment,where we aim for “zero-background1,” the experimental half-life sensitivity canbe expressed as:
T 0ν1/2 = ln 2× a ε NA
A
M · tnCL
× 103, (2.2)
where nCL = 2.4 corresponds to a 90% confidence level. This expression givesa sensitivity that is, at least in principle, independent of both the backgroundlevel and the detector resolution. In the following, the zero-background relationis used for the evaluation of the experiments, including those in the currentproposal. Figure 2.3 shows the resulting nCL = 2.4, 90% confidence level 0νββhalf-life sensitivities versus time for 10 kg and 200 kg arrays of enriched CaMoO4.The effective Majorana neutrino mass (〈mββ〉) sensitivity as a function of datataking time is shown in Fig. 2.4.
Our strategy for achieving a large mass “zero-background” experiment in-cludes the following considerations:
• Since the highest energy single-β/γ quanta from naturally occurring radio-nuclides is the 2615 keV γ-line from 208Tl, we have focused on candidate0νββ nuclides with Qββ values above this level. Our currently preferrednuclide is 100Mo, which has Q = 3034 keV.
• Since most naturally occurring α emitters have Qββ-values above 3034 keV,we need powerful and reliable methods to distinguish α-induced signalsfrom β/γ-induced signals. We have demonstrated that in CaMoO4 crystals,the amount of scintillation light and the pulse-shape of the temperaturesignals provide two independent β/γ-α discriminators, each with a morethan 5σ discrimination power.
• The effects of accidental time overlap of two low-energy signals combiningto form one of higher energy (i.e., pileup) will be controlled by segmentingthe detector array into ∼400 g independent elements and by applicationof pulse-shape discrimination of randomly coinciding events.
1Less than 0.1 events in the experimental region of interest
12

Figure 2.3: Expected half-life sensitivity for AMoRE-I and AMoRE-II as a func-tion of running time.
Figure 2.4: Effective Majorana neutrino mass (〈mββ〉) sensitivity vs. data takingtime for AMoRE-I and AMoRE-II. The widths of the bands correspond to arange of nuclear matrix element calculations from Refs. [8, 14, 96].
13

• In the case of CaMoO4, background from 2νββ decay of 48Ca will bereduced by using crystals produced from calcium depleted in 48Ca.
• We will continue and expand our aggressive R&D program on reducingradioactive contaminations in the crystal powder preparation and growingprocedures that was started over ten years ago.
• The levels of radioactive contaminants in all materials used in the detec-tor, including the cryostat elements and the external-radioactivity shields,will be measured and their influence on the experiment will be carefullysimulated.
• The experiment will be done in a series of phases where at each phase wewill exploit what is learned from the previous one.
• The cosmic muon flux will be minimized by the underground location ofthe experiments and by installation of an active muon veto system.
As mentioned above, we plan to perform CaMoO4 experiments in two phases.We are currently commissioning an array of five 100Mo-enriched 48deplCa100MoO4
crystals, with total mass of 1.5 kg in a cryostat located in the A5 area of Y2L,as an initial “pilot” experiment. We will start data-taking with this setup laterthis year (2015) and continue to take data for about a year. Using measuredbackground rates in these detectors (as discussed below), we estimate a back-ground rate in the 0νββ signal region of ∼0.01 counts/keV/kg/yr and a half-lifesensitivity of T 0ν
1/2 > 1.1×1024 yrs, which is comparable to the current world-best
value from NEMO 3 [32]. While this pilot experiment is running, we will exploitthe experience we gain from implementing, commissioning and operating it toprepare and assemble “AMoRE-I,” a ∼ 5 kg array of CaMoO4 crystals that will,when ready, replace the pilot array. Our goal for AMoRE-I is a background levelon the order of 10−3 counts/keV/kg/yr and a T 0ν
1/2 sensitvity for a two-year expo-
sure of ∼ 8×1024 yrs, which would correspond to an effective Majorana neutrinomass in the range of 0.07 eV – 0.14 eV (see Fig. 2.4), and could confirm or ruleout the controversial 0νββ evidence reported by Klapdor. The next phase willbe “AMoRE-II,” which will start with a 70 kg array of 48deplCa100MoO4 crystalswith a background level that is an order-of-magnitude below that for AMoRE-Iis planned. As background conditions permit, we will increase the detector massto as much as ∼ 200 kg. The projected sensitivity of a five-year exposure withAMoRE-II would be T1/2 ≈ 1× 1027 years (〈mββ〉 ≈ 20 meV). Figure 2.5 com-pares the projected sensitivity with the inverted neutrino hierarchy region andexisting limits. Such a sensitivity will require exquisite energy resolution andan order-of-magnitude improvement in background rejection power. Since theavailable space at the existing Y2L underground laboratory will not be sufficientto accommodate an experiment of this scale, we are proposing the developmentof a larger and deeper underground laboratory in Korea.
14

Figure 2.5: Effective Majorana neutrino mass (〈mββ〉) as a function of the mass ofthe lightest neutrino together with current limits on the mass from a selection ofthe most sensitive experiments [9, 10, 11, 12, 13], as compared with expectationsfor AMoRE-II with five years of data taking. To convert the experimental halflife limits to 〈mββ〉 limits, the products of G0ν |M0ν |2 were chosen as the centralvalues from the ranges given in [14]. For comparison with the inverted hiearchyregion, the AMoRE-II band is shown using the full range of values.
15

Chapter 3
CaMoO4 crystal scintillators
3.1 Production of high-purity crystals
The Czochralski crystal-growing technique is a universally used method for pro-duction of high-quality tungstate and molybdate crystals. For details see ref. [97],the very first review of this technique. For reviews of the history and statusof the development of the Czochralski method see ref. [98]. A sketch of theCzochralski method is shown in Fig. 3.1; a photograph of an operational systemis shown in Fig. 3.2. Natural CaMoO4 occurs in nature as tetragonal-stolzite,scheelite-type, and monoclinic-raspite crystals. X-ray diffraction measurementsof synthetic, Czochralski-grown CaMoO4 crystals have been determined to bescheelite-type crystals with a tetragonal symmetry with a space group of I41/a.
Our initial CaMoO4 crystals were produced in Korea at Pusan NationalUniversity’s Crystal Bank. Subsequently, larger and better-quality CaMoO4
crystals were produced at the Innovation Center of the Moscow Steel and AlloyInstitute (ICMSAI) in Moscow, Russia and at the Institute of Materials (IM) inLviv, Ukraine (see Fig. 3.3).
An extensive R&D program on the optimization of growth techniques for thelarge-sized CaMoO4 crystals was carried out in the framework of ISTC program#3293 [93]. As part of this program, crystals as large as 30×30×200 mm3 weresuccessfully grown, as shown in Figs. 3.4 and 3.5. On the basis of this R&Dprogram, we established crystal growing techniques that are satisfactory for theAMoRE experiment.
The technique for growing single CaMoO4 crystals can be briefly summarizedas a series of steps:
1. Raw material preparation:
- Preparation of chemicals and chemical labware
- Purification of Ca and Mo containing components
- CaMoO4 raw material synthesis, drying and calcination
2. Melting (compactization) of raw material
3. Initial Czochralski growing of raw CaMoO4 single crystals
16

Figure 3.1: a sketch of a Czochralski crystal-growing system. 1– crystal; 2–seedholder; 3–main shaft; 4,5–heat insulation screens; 6–induction coil; 7,8,11–heat insulation ceramics; 9–crucible; 10–melt; 12–bottom support; 13– bottomshaft; 14–seed crystal
Figure 3.2: A photograph of a CRYSTAL-3M Crystal puller (at JSC Fomos-Materials).
17

Figure 3.3: (left) The first CaMoO4 crystal grown in Korea. (right) VariousCaMoO4 crystals grown in Korea, Ukraine and Russia.
Figure 3.4: The first CaMoO4 crystal from the ISTC project. Crystals withvolumes as large as 15 cm3 and light yields of∼ 400 photons/MeV were produced.
18
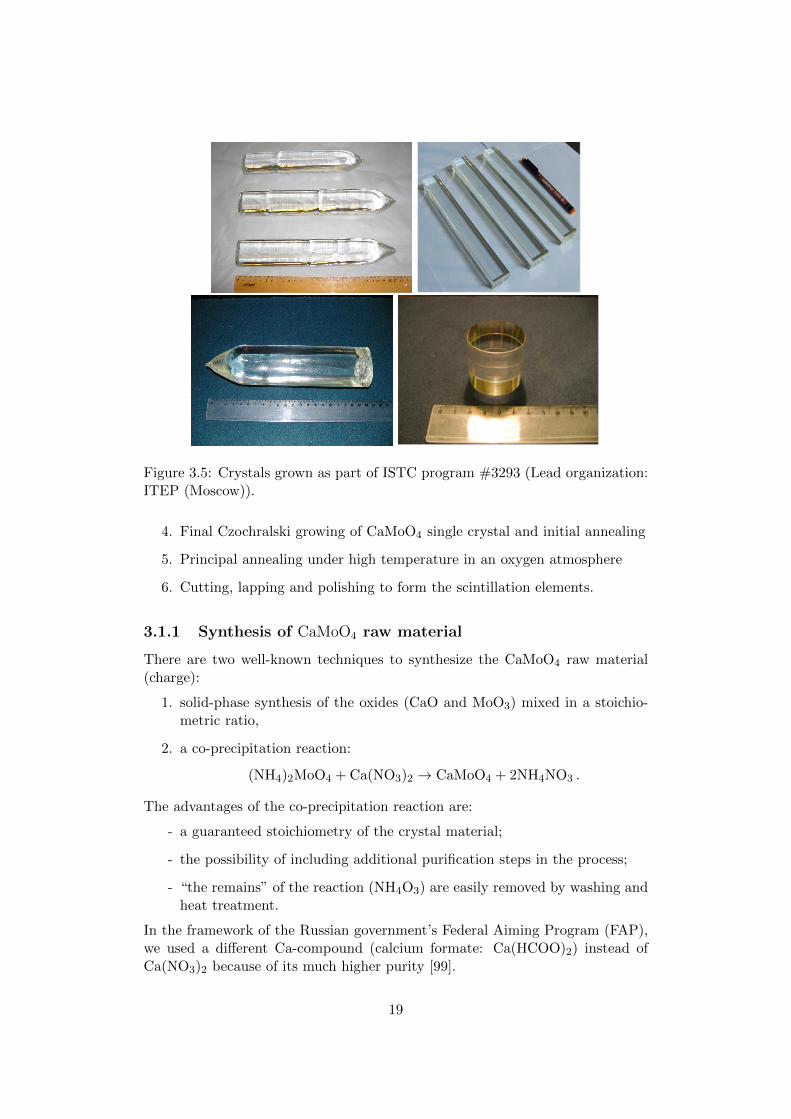
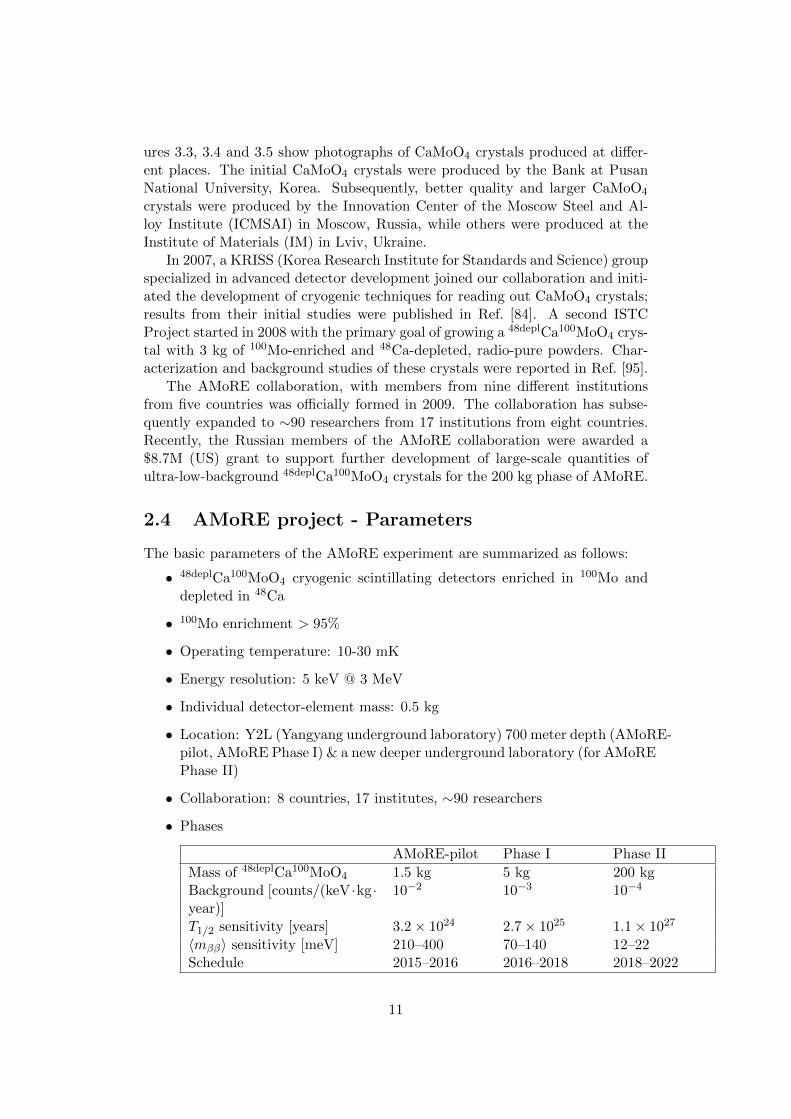
Figure 3.5: Crystals grown as part of ISTC program #3293 (Lead organization:ITEP (Moscow)).
4. Final Czochralski growing of CaMoO4 single crystal and initial annealing
5. Principal annealing under high temperature in an oxygen atmosphere
6. Cutting, lapping and polishing to form the scintillation elements.
3.1.1 Synthesis of CaMoO4 raw material
There are two well-known techniques to synthesize the CaMoO4 raw material(charge):
1. solid-phase synthesis of the oxides (CaO and MoO3) mixed in a stoichio-metric ratio,
2. a co-precipitation reaction:
(NH4)2MoO4 + Ca(NO3)2 → CaMoO4 + 2NH4NO3 .
The advantages of the co-precipitation reaction are:
- a guaranteed stoichiometry of the crystal material;
- the possibility of including additional purification steps in the process;
- “the remains” of the reaction (NH4O3) are easily removed by washing andheat treatment.
In the framework of the Russian government’s Federal Aiming Program (FAP),we used a different Ca-compound (calcium formate: Ca(HCOO)2) instead ofCa(NO3)2 because of its much higher purity [99].
19

Figure 3.6: (a) The room temperature emission spectrum of a CaMoO4 crystal.(b) The transmittance of the same CaMoO4 crystal (also at room temperature).
3.1.2 CaMoO4 crystal growth
The CaMoO4 melting temperature (T=1445C) allows for the crystals to bepulled in normal atmosphere from crucibles made from platinum (Tmelt = 1769C),or in an oxygen-free atmosphere from an iridium crucible (Tmelt = 2454C). Bothapproaches were investigated during our preliminary tests. After analyses of theresulting samples, it was decided to use the first method and pull crystals froma platinum crucible with diameter 90 mm and height 70 mm. In these exper-iments, we also optimized the growth direction relative to the crystallographicaxis of the crystal. The crystal structure consists of complex layers perpendicu-lar to the c-axis. Each layer has a two-dimensional, CsCl-like cubic arrangementwith a Ca cation and MoO4 anion surrounded by eight ions of opposite sign (seeFig. 1 in ref. [100]). There are at least two optimal directions for the seedingand further growth of the CaMoO4 crystal. Crystals of similar quality can bepulled in the directions close to the a- or the c-axis. The crystals grown along thea-axis exhibit an elliptically shaped cross-section with a ∼1.3 ratio of maximalto minimal diameter. We found that by tilting the a-axis by ∼25 degrees relativeto the pulling direction, we were able to produce a nearly circular cross-section,having a diameter ratio of ∼1.15.
3.2 Luminescence and scintillation properties of CaMoO4
crystals
3.2.1 Luminescence properties of CaMoO4 crystals
The luminescence and transmission properties for some of the CaMoO4 crystalsamples were investigated. Figure 3.6(a) shows the excitation and emission spec-tra for one of the samples. The emission spectrum has a broad peak between400 nm and 700 nm with a maximum at around 520 nm. Figure 3.6(b) showsthe transmittance, which demonstrates that the crystal is highly transparent tothe scintillation light.
Room-temperature, X-ray-induced emission spectra were measured with a
20

Figure 3.7: The room-temperature emission spectra for four different CaMoO4
crystals.
QE65000 fiber optic spectrometer (Ocean Optics Co.). The luminescence spectrafor different crystals are shown in Fig. 3.7. They all have broad emission bandsin the 400 to 700 nm range with a peak emission at 520 nm, results that are ingood agreement with the measured photo-luminescence spectrum. Although thelight yields are different for different crystals, the shapes of the spectra are allquite similar.
3.2.2 Light yield measurements
Green-extended, three-inch RbC photocathode photo-multiplier tubes (PMT)(model D726Uk from Electron tube Ltd.) were directly attached to the testcrystal surfaces. The RbC photocathode has a response that is well matchedto the 520 nm peak emission of the CaMoO4 crystals; the effective quantumefficiency (QE) is 14%.
Single photoelectron (SPE) signals can be identified at low energy by meansof a 400 MHz FADC that is used to digitize the PMT output pulses. In scin-tillators with long decay times, the identification and counting of individualSPEs can reduce noise effects and improve the energy resolution. A typicalCaMoO4 response is shown in Fig. 3.8. We investigated the scintillation charac-teristics of the crystals by counting the number of SPEs detected during a 24 µstime window using an offline clustering algorithm that is specially developedto isolate SPEs [101, 102]. Scintillation light yields of various CaMoO4 crys-tal samples from different manufacturers were tested. The number of detectedSPEs measured for 662 keV γ-rays from a 137Cs radioactive source ranged from0.3 to 0.6 photelectrons/keV, depending on the crystal. The light yield of one
21
Figure 3.8: A typical CaMoO4 signal pulse. The inset shows a time-expandedview of the t ≈ 20 µs region.
of the best-quality crystals was also measured at a temperature of 6C. In thiscase, the FADC time window was extended to 82 µs because of the longer decaytime for cooled crystals. For this cooled crystal, we obtained 1.04 photoelec-trons/keV from 137Cs radioactive source measurements. If only photoelectronstatistics are considered, the energy resolution of this cooled crystal at the 3 MeV0νββ endpoint of 100Mo is inferred to be 4% FWHM.
3.2.3 Absolute light yield measurement
We also measured the number of electron-hole (e-h) pairs and the absolute lightyield of some of the CaMoO4 crystals with a UV-sensitive, windowless large-areaavalanche photodiode (LAAPD) produced by Advanced Photonics Co. [103].This has close to 80% quantum efficiency for visible and near-infrared photons.The number of e-h pairs and the absolute light yield of one of the best crystalswere measured at room temperature. The sample crystal was optically coupledto the LAAPD that was read out by a spectroscopic amplifier with a 10 µsshaping time constant. The crystal was irradiated with 5.5 MeV α particlesfrom a 241Am source that produced a clearly identifiable peak; an α/β quenchingfactor (QF) of 0.20 was used for the light yield estimation. After calibrationwith an 55Fe source, the number of e-h pairs of the crystal was determined tobe 3, 500 ± 350 e-h/MeV. This absolute light yield was adjusted to 4, 900 ±490 photons/MeV after correction for the light collection efficiency and losses inthe Teflon reflector (90%). SPE signals from the PMT were also used to inferthe absolute light yield, even though this method has more systematic effectsthat have to be considered [103]. The room temperature light yield obtainedthis way was 4, 500± 1, 000 photons/MeV.
22

Figure 3.9: Responses of different crystals to 662 keV γ-rays from a 137Cs ra-dioactive source.
This large absolute light yield at room temperature, which is about 10% ofthat of the most efficient scintillating cystals such as CsI(Tl), is sufficient toenable crystal-quality tests and radiopurity measurements to be carried out atordinary temperatures. This greatly simplifies detector material developmentand manufacturing quality control during the production of large numbers ofcrystals.
3.2.4 Light yield comparison of different CaMoO4 crystals
The relative light yields of small (1 cm3) CaMoO4 crystals produced in differentplaces were compared using 662 keV γ-rays from a 137Cs radioactive source (seeFig. 3.9). The crystal produced at IM shows highest light yield while the crystalproduced at ICMSAI had the lowest light yields; these results are consistentwith X-ray luminescence measurements. Crystals recently produced by ICMSAIshow similar performance as the IM-produced crystals.
3.2.5 Room-temperature energy resolution of CaMoO4 crystals
The energy resolutions of CaMoO4 crystal samples from different manufacturershave been compared using 662 keV 137Cs γ-rays. The room temperature energyresolutions of the tested crystals range between 10.3 to 14% FWHM. The bestenergy resolution was obtained with the IM-produced CaMoO4 crystal as shownin Fig. 3.10 [83]. The energy resolution for the crystal measured at 6C was11.9%.
23

Figure 3.10: Response of the IM-produced CaMoO4 crystal to a 137Cs source.The inset shows the low-energy response of the same crystal to 60 keV γ-raysfrom a 241Am source.
Figure 3.11: Response of a CaMoO4 scintillator to 5.5 MeV 241Am alpha parti-cles. The energy scale was calibrated with γ rays.
24

Figure 3.12: Mean-time distributions for alpha and gamma radiation.
3.2.6 Pulse shape discrimination (PSD)
Scintillation light signals from highly ionizing particles, such as alphas, usuallyhave different light yields and decay-time characteristics than those produced byelectron- and gamma-radiation-induced signals. The resulting pulse-shape dif-ferences can be used to separate α-induced signals from β/γ-ray-induced signals.Even though the 5.5 MeV alpha particles from a 241Am source stop in the crystal,the visible energy that is recorded by the PMT is only about 20% of that for aγ-ray of the same energy, as shown in Fig. 3.11. This is referred to as the alpha-particle quenching factor. The decay time of alpha-induced signals is also quitedistinct from that for γ-ray-induced signals. A simple energy-weighted mean-time was used to characterize the decay time of scintillation signals. The mean-time-determined Pulse Shape Discrimination (PSD) between alpha-induced andgamma-induced signals is demonstrated in Fig. 3.12 [83]. PSD is a powerfultool for rejecting backgrounds that are induced by alpha particles produced bycontaminants from the U and Th decay chains.
3.2.7 Temperature dependence of the light yield of CaMoO4 crys-tals
The temperature dependence of the relative light output and decay time ofCaMoO4 crystals was studied by Mikhailik et al. [104], as shown in Fig. 3.13. At liquid nitrogen temperatures, the light output is six times larger than atroom-temperature. The scintillation efficiency at temperatures below 1K is notknown and should be measured.
25

Figure 3.13: The temperature dependence of the light output (left) and decaytime (right) of CaMoO4 crystal scintillators [104].
The high detection efficiency and good energy resolution of CaMoO4 crys-tal scintillators make them very suitable sources and detectors for 0νββ-decaysearches. As mentioned above, successful experiments with CdWO4 crystals [44,92] demonstrated the applicability of scintillating crystal techniques for 0νββ-decay searches.
3.3 48Ca-depleted, 100Mo-enriched 48deplCa100MoO4 crys-tals
CaMoO4 crystals produced from enriched 48Ca could be also used to searchfor 0ν decays of 48Ca. However, for AMoRE the 2νββ decay of 48Ca posesan irreducible background. The natural abundance of 48Ca is 0.187% and thehalf-life for 2νββ 48Ca decay is 4.2 × 10¹⁹ yrs. Since the Q-value for 48Ca is4272 keV, this decay would produce a serious background counting rate in the0νββ signal region for 100Mo. For a CaMoO4 crystal made with natural Ca, thebackground level from 48Ca decay at the 100Mo Q-value (3034 keV) would be 0.01counts/keV/kg/yr. Therefore, the concentration of 48Ca in the CaMoO4 crystalshas to be reduced by at least a factor of 100 to get its associated backgroundbelow our ultimate, AMoRE-II, goal of 10−4 counts/keV/kg/yr.
A 4.5 kg quantity of 48Ca-depleted (≤ 0.001%) calcium carbonate powderwith ICP-MS-measured 238U and 232Th contaminations below 0.2 ng/g and 0.8ng/g, respectively, was produced by the Russian ElectroKhimPribor IntegratedPlant (EKP). However, a γ-spectroscopy analysis of the 48deplCaCO3 powdershowed the specific activities due to 226Ra and its progenies to be at the fewhundred mBq/kg level. Therefore, this 48deplCaCO3 material was subjected toadditional purification.
A 8.25 kg quantity of 100Mo-enriched (96%) molybdenum in the form ofMoO3 powder was produced by the JSC Production Association Electrochemicalplant (Zelenogorsk, Russia) by a gas centrifugation technique. The enrichedmaterial is very pure with respect to radioactive elements: the results of ICP-
26

Figure 3.14: 48deplCa100MoO4 crystals grown at the Innovation Center of theMoscow Steel and Alloy Institute (ICMSAI) in Russia.
MS measurements show that the concentrations of 238U and 232Th in the oxideare below 0.07 ng/g and 0.1 ng/g, respectively.
3.4 Growth of large radio-pure 48deplCa100MoO4 crys-tals
The 48deplCa100MoO4 crystal growing process includes the following stages:
1. initial powder ICP-MS analyses;
2. preparation of pellets – 550 g each;
3. initial charge for crystal growing preparation including a small mass excessof MoO3;
4. growth of the initial crystallized charge - crystals up to 550 g each;
5. initial crystallized charge for final-crystal growing preparation;
6. crystallizer assembley and final-crystal growing;
27
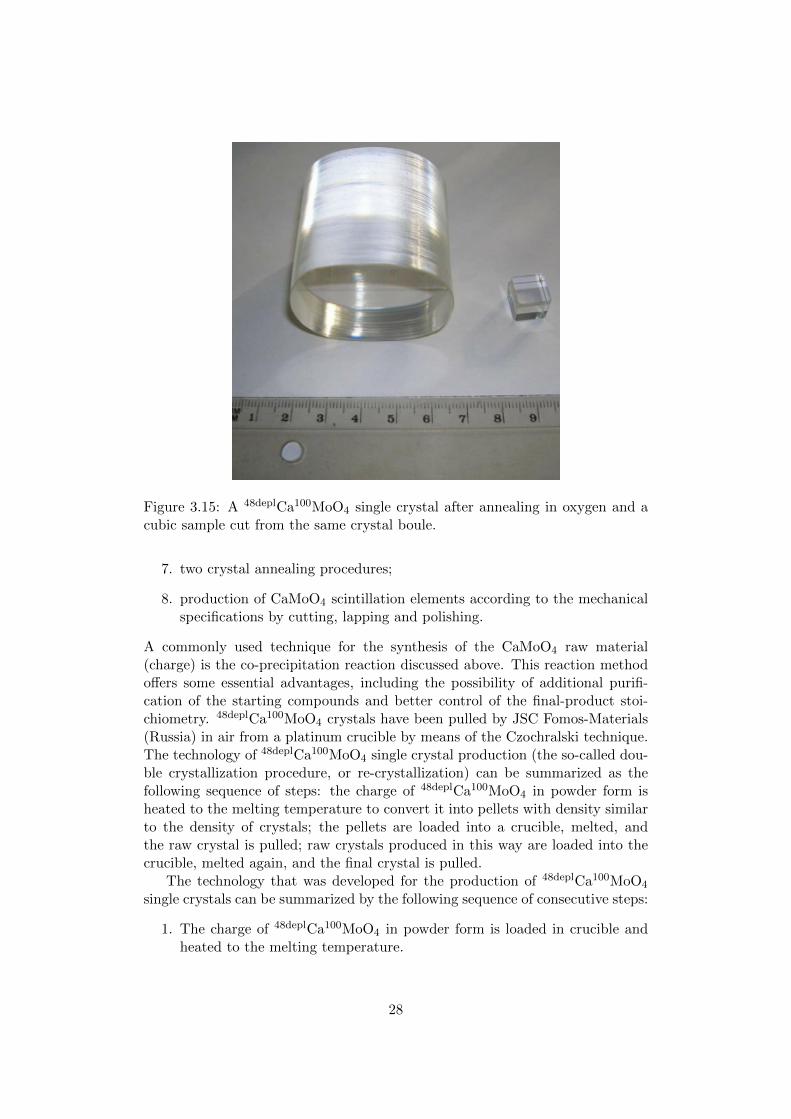
Figure 3.15: A 48deplCa100MoO4 single crystal after annealing in oxygen and acubic sample cut from the same crystal boule.
7. two crystal annealing procedures;
8. production of CaMoO4 scintillation elements according to the mechanicalspecifications by cutting, lapping and polishing.
A commonly used technique for the synthesis of the CaMoO4 raw material(charge) is the co-precipitation reaction discussed above. This reaction methodoffers some essential advantages, including the possibility of additional purifi-cation of the starting compounds and better control of the final-product stoi-chiometry. 48deplCa100MoO4 crystals have been pulled by JSC Fomos-Materials(Russia) in air from a platinum crucible by means of the Czochralski technique.The technology of 48deplCa100MoO4 single crystal production (the so-called dou-ble crystallization procedure, or re-crystallization) can be summarized as thefollowing sequence of steps: the charge of 48deplCa100MoO4 in powder form isheated to the melting temperature to convert it into pellets with density similarto the density of crystals; the pellets are loaded into a crucible, melted, andthe raw crystal is pulled; raw crystals produced in this way are loaded into thecrucible, melted again, and the final crystal is pulled.
The technology that was developed for the production of 48deplCa100MoO4
single crystals can be summarized by the following sequence of consecutive steps:
1. The charge of 48deplCa100MoO4 in powder form is loaded in crucible andheated to the melting temperature.
28

Figure 3.16: Crystal growth process scheme at Fomos Materials
2. The seeding starts at a rotation speed of 5 – 12 min−1 and the raw crystalis produced at a high pulling speed (3 – 5 mm/hr).
3. The resulting (raw) crystals are loaded into the crucible, melted and thefinal crystal is pulled at a slower speed (2 – 3 mm/hr).
4. The produced crystal is subjected to initial annealing heat treatment whilestill in the setup for 12 hours.
The 48deplCa100MoO4 crystals produced in this way have an elliptic cylindricalshape with major and minor diameters of 45 ∼ 55 mm and 40 – 50 mm respec-tively, lengths of 40 – 60 mm (from an original overall length of ∼100 mm), anda total mass of ≈ 0.55 kg.
The possible evaporation of MoO3 during the crystal growth can result in theformation of defects. The best possible optical transparency and light output areensured by growing the crystals from recrystallized raw materials with an ap-proximate 1.0% mass-excess of MoO3 added to the charge. The as-grown crystalhas a notoriously strong blue coloration due to oxygen depletion and a deficiencyof Mo6+ ions (see Fig. 3.14). It has been demonstrated that this coloration canbe removed by prolonged annealing in an oxygen atmosphere [82, 104]. Al-most transparent 48deplCa100MoO4 crystals were obtained after the annealing(see Figs. 3.14 and 3.15). The crystal growth process developed by Fomos Ma-terials is shown in Fig. 3.16.
3.5 Radioactive contaminants in CaMoO4 crystal scin-tillators
3.5.1 Low-background setup at Y2L
Radioactive contamination levels in the CaMoO4 crystals were studied in a spe-cially designed low-radiation setup at the Yangyang Underground Laboratory
29

Figure 3.17: A schematic drawing of the CsI(Tl)-crystal shield 4π-veto cavity.
Figure 3.18: The 4π CsI(Tl) active shielding structure at the Y2L laboratory.
(Y2L).The CaMoO4 crystals being tested were fixed by an acrylic support inside
a cavity in an array of CsI(Tl) crystal scintillators that are used to veto ex-ternal gamma and neutron radiation and residual cosmic muons. The CsI(Tl)crystals that are used to form the “barrel” region of the cavity are trapezoidalwith a length of 30 cm, a larger area of 6.5 cm × 6.5 cm, and smaller area of5.5 cm × 5.5 cm. Twelve crystals that are read out by twelve, 3-inch PMTs formthe barrel. For the data reported here, each PMTs was attached to a pair of crys-tals, forming an interleaved zigzag pattern at the end of the array, in which eachPMT monitored two crystals, and each crystal was monitored by two PMTs,one at each end. The two end-cap regions were covered by crystals that eachhave only one readout PMT, as shown in Fig. 3.17. The CsI(Tl) crystal vetoarray was surrounded by a 10 cm thick passive lead shield. The acrylic cavitywas flushed with a Nitrogen gas flow of 4 L/min in order to eliminate ambientradon [84]. Photographs of the 4π-veto system are shown in Fig. 3.18.
Recently, this 4π-veto system was upgraded to improve the veto efficiency.Now each of the twelve crystals in the barrel section have their own pair ofPMTs that are distinct for each crystal. In addition, a 20 cm thick polyethyleneshield was placed outside of the lead shielding to attenuate external neutronbackgrounds.
30

Table 3.1: Summary of decays of short-lived isotopes and their coincident pro-genitor decays in the 238U, 235U and 232Th decay chains.
232Th family 235U family 238U family(228Th sub-chain) (227Ac sub-chain) (226Ra sub-chain)
Progenitor 220Rn 219Rn 214BiIsotope Q = 6.40 MeV Q = 6.95 MeV Q = 3.27 MeV
(prompt decay) T1/2= 55.6 s T1/2= 3.96 s T1/2= 19.9 min.
Short-liveddaughter
216Po 215Po 214Po
isotope Q = 6.91 MeV Q = 7.53 MeV Q = 7.83 MeV(delayed decay) T1/2= 0.145 s T1/2= 1.78 ms T1/2= 164 µs
Radioactive contamination of the 100Mo-enriched S35, SB28, NSB29 andSS68 crystals by thorium and radium was studied. As indicated in Figure 3.14,the SB28, SB29 and S35 crystals were grown at ICMSAI. Since the transmittanceof SB29 was poor, it was re-annealed at Fomos Materials and the crystal wasre-named as NSB29. To avoid the need for a re-annealing procedure to cure apossible oxygen deficiency, the SS68 crystal was grown with a low-level dopingof Nb. The data were analyzed with the time-amplitude method described inthe following section. The method selects fast sequences of β − α decays in the238U chain and α−α decays in 232Th chain. Background data were accumulatedfor more than 70 days for the S35 crystal and 40 days for the SB28 crystal. Thedata were taken in the Y2L 4π-gamma veto system, which severely attenuatedexternal backgrounds.
3.5.2 Contamination of CaMoO4 crystals by thorium and radium.
The time-amplitude analysis method enables the identification of subchains con-taining short lived isotopes in the 232Th, 235U and 238U chains. Because of thevery low counting rates, the probability of signals from two uncorrelated decaysto occur in a small time interval is quite low. Thus, time correlations betweenconsecutive events can provide unambiguous signatures for specific isotopes (seeTable 3.1). In these analyses pulse-mean-time PSD results are also used to dis-tinguish between β-induced and α-induced events.
As can be seen in Table 3.1, Polonium isotopes in the decay chains haverelatively short half-lives. After a Po nuclei is produced via Bi, Rn or Bi decays,it quickly decays to Pb with a characteristic lifetime. Figure 3.19 illustrates theterms used below and their definitions.
For example, to identify 214Po in 238U decay chain, we examine a 100 µsto 600 µs time window after a detected β-decay. If this β originated from214Bi → 214Po beta decay, this time interval includes 57.6 % of subsequent214Po→ 210Pb alpha decays. Thus, most of the alpha decay events that oc-cur in this time window should have a kinetic energy that is equal to the 7.83MeV Q-value for 214Po→ 210Pb alpha decay and a tag-time distribution shoulddisplay a 164 µs 214Po-lifetime dependence.
31

Figure 3.19: Time difference between two signals.
Table 3.2: Radioactive contamination of 48Ca-depleted, 100Mo-enriched CaMoO4
crystals by 227Ac, 226Ra and 228Th. All units are in µBq/kg. For comparisondata are also shown for the CaMoO4 crystal produced by IM (Lviv, Ukraine)with natural isotopic composition. It should be stressed that the IM crystal wasproduced wit no special attempts to purify the initial materials from radioactivecontamination.
228Th 227Ac 226Ra232Th Chain 235U Chain 238U Chain
SS68 30± 5 200± 14 60± 8
NSB29 80± 9 700± 26 200± 14
S35 500± 22 1200± 35 4400± 66
IM (Lviv, Ukraine) 230± 15 90± 10 1500± 39
SE1 50± 15 60± 8 40± 12
SB28 70± 8 − 80± 9
Using selection efficiencies that were computed by GEANT4 simulations, weconverted the measured 215Po (235U chain), 214Po (238U chain), and 216Po (232Thchain) decay rates to contamination levels in the 48Ca-depleted, 100Mo-enrichedCaMoO4 crystals that are currently on hand, namely SS68, NSB29, S35 andSB28. The results are listed in Table 3.2. The measured contamination levels ofcrystal S35 are relatively high, so we now use it as a control sample to estimatethe alpha/beta discrimination efficiency.
32

Chapter 4
Cryogenic particle detection
Cryogenic particle detectors have been developed in response to the need for de-tectors with superior energy resolution and ultra-low thresholds in nuclear andparticle physics. Recent developments of these detectors have demonstrated en-ergy resolution and threshold performance levels that exceed the extreme limitsof conventional semiconductor-based detectors. Cryogenic detection techniqueshave been adopted for rare-event searches and have become important measure-ment tools for many other applications [105].
In general, the energy deposited in matter by the interaction of radiationwith the atoms in matter can be converted into measurable effects such as ion-ized charged particles, scintillation light, and phonons. The ionization can bemeasured by collecting the charges with an applied electric field. Scintillationlight is, at least in principle, easily measured with photon sensors such as pho-tomultiplier tubes or photo-diodes. However, the major portion of the energydeposition is converted into the phonons. This suggests that phonon measure-ments can be more effective than ionization or scintillation measurements.
However, the accurate measurement of phonons created by particle or radi-ation absorption is not trivial, particularity at room temperatures, since hugenumbers of phonons exist naturally in any condensed material, with a statisticalfrequency/energy distribution that is determined by the temperature of the ma-terial. When an absorber is thermally attached to a heat reservoir the thermalenergy of the absorber fluctuates, resulting in a phonon distribution that changeswith time. These thermal fluctuations can easily overwhelm the phonons createdby radiation absorption. At low temperatures, however, the available thermalenergy (i.e., the heat capacity) is greatly reduced, as are the fluctuations. More-over, because the heat capacity of the absorber is typically lower at low temper-atures, the resulting temperature increase caused by radiation-induced energy isincreased.
The intrinsic energy resolution of the detector is determined by the fluctua-tions of the produced quanta in the energy-loss process. The energy needed toproduce an electron-hole pair or a scintillation photon is typically a few to 10eV. However, in the phonon measurement case, the average energy of a phononat a temperature T is about kBT where kB is the Boltzmann constant. At 10mK, kBT is close to 10−6 eV.
33

In the case of a thermal detector attached to an ideal temperature mea-surement device, statistical fluctuations in the thermal energy limit the intrin-sic resolution. If the total thermal energy of a detector with a heat capac-ity C is approximated as CT , the average number of energy quanta can beexpressed by N ≈ CT/kBT . Thus, the statistical thermal noise or the ul-timate limit on the energy resolution due to thermal energy fluctuations is(δE)rms ≈ CT (N)1/2 ≈ (kBT
2C)1/2. For a 1 kg CaMoO4 detector at T=10mK, the fluctuation limit on the resolution is about 20 eV (FWHM).
4.1 Principle of thermal detection in low tempera-ture calorimeters
When a particle interacts with a solid-state absorber, its energy is transferred tothe electrons and nuclei in the material of the absorber. Most of this transferredenergy is eventually converted into the thermal energy of the solid. If a suitablethermometer is attached to the absorber, the temperature change caused by theinitial energy transfer can be measured. Typical low temperature calorimetersconsist of two parts: one is an absorber to make initial interactions with the par-ticles; the other is a temperature sensor that measures the temperature changeof the absorber. Usually, the absorber and the temperature sensor are in goodthermal contact, while one of them is connected to a thermal reservoir, or heatbath, by a weak thermal link. The bath should have a sufficiently large heatcapacity so that its temperature, typically well below 1 K, does not change withtime.
One of the commonly used temperature sensors for low temperature calorime-ters is the thermistor, which is a critically doped semiconductor operating ata temperature that is near, but below, its metal-insulator transition. Neu-tron transmutation doped (NTD) Ge thermistors are commonly used for low-temperature, rare-event searches. The thermistors are fairly easy to use becausethey can be operated with conventional electronics, such as Field-Effect Tran-sistors (FETs), and do not require sophisticated superconducting electronics.They are typically current-biased and radiation-induced voltage changes acrossthe thermistor are amplified with a FET located at a higher temperature level.NTD Ge sensors are widely used as thermal detectors for various crystals becauseof their reproducibility and their uniformity in doping density. Mass productionof NTD sensors is also possible. The CUORE, LUCIFER and LUMINEU double-beta experiments all use NTD Ge thermistors as their temperature sensors.
Transition Edge Sensors (TESs) are one of the most highly developed typeof cryogenic thermometers. A TES is a superconducting strip operating at itssuperconducting-normal transition temperature. The superconducting strip isoften made from a thin pure superconducting film (W) or from a bilayer ofsuperconductor and a noble metal, such as Mo/Au, Mo/Cu or Ti/Au. Thetransition temperature width of the films is typically a few mK or less. Theresistance in the normal state is usually a few tens of mΩ. Well developeddevices have a very sharp transition with a transition width that is narrower
34

Figure 4.1: (a) A simplified MMC setup with an absorber. (b) Typical M-Tcharacteristics of an Au:Er sensor in a magnetic field. Energy input into anabsorber results in a change in the magnetization of the MMC sensor attachedto the absorber.
than 1 mK. Thus, at the transition, a small change in temperature produces alarge change in resistance. This makes it a very sensitive thermometer, but onethat only works in a very narrow range of operating temperatures.
One advantage of using a TES for particle detection is that the supercon-ducting sensor can be directly evaporated on to the surface of an absorber. Thisdirect contact provides an efficient heat transfer from the absorber to the TES,and this results in a much faster response time for TESs than that for NTDsensors. It is also suitable for detecting athermal phonons that directly deposittheir energy in the sensor. TESs have been used as the temperature sensor forthe CDMS and CRESST dark-matter search experiments.
4.2 Magnetic Metallic Calorimeter (MMC)
Metallic Magnetic Calorimeters (MMCs) utilize a magnetic material whose mag-netization is a function of temperature. The sensor material is a gold alloy withsmall concentration (100-2000 µg/g) of erbium, denoted as Au:Er. The dilutedmagnetic ions in the metallic host have paramagnetic properties that can beapproximated as a spin 1/2 system with a Lande g value of 6.8. The magnetiza-tion is inversely proportional to the temperature, a simple paramagnetic relationknown as Curie’s law. This means that a measurement of magnetization can beused to measure the temperature of a paramagnetic material. This makes a mag-netic thermometer attached to an absorber effectively a “magnetic calorimeter”for particle detection. Au:Er maintains its paramagnetic properties at tens ofmK temperatures. A simplified MMC setup is illustrated in Fig. 4.1.
In early applications of MMCs for particle detection, the Au:Er sensor wasplaced inside the loop of a SQUID. In this early design, the SQUID loop itselfwas used as a pickup coil [106]. The state-of-the-art development of SQUIDtechnologies guaranteed an accurate and fast measurement of the magnetizationchange with low noise for any temperature change caused by energy absorption.The SQUID converts the change of magnetic flux into a measurable voltagesignal on the basis of a quantum interference measurement operating at low
35

temperatures.The detection principle of an MMC can be characterized as E → ∆T →
∆M → ∆Φ → ∆V , where E, T,M,Φ and V indicate the physical quantities ofenergy, temperature, magnetization, magnetic flux and voltage, respectively. AnMMC setup with a two-stage SQUID system achieved an energy resolution of1.6 eV FWHM for X-rays from a 55Fe source in Heidelberg [107]. This detectionmethod has recently been adopted by KRISS for MeV-region alpha spectrometryand Q-spectrometry measurements for radionuclide analysis. Moreover, MMCspermit the investigation of the thermal properties of crystal absorbers and thedetectors’ responses to a wide range of energy inputs because of their superiorenergy resolution, fast response time, and flexible operating temperatures andmagnetic fields. By choosing the dimensions of the temperature sensor and theconcentration of the magnetic material in it appropriately, the detector can bescaled up to a large mass because an optimal detector design that minimizes theenergy-sensitivity degradation caused by the larger heat capacity can be easilyachieved [106].
A meander-type MMC sensor has been developed to be used with an ab-sorber with a large heat capacity [108, 109]. This “meander-type” MMC wasfirst tested with a 2 × 2 × 0.07 mm3 gold foil. The volume of the metal ab-sorber is smaller than typical dimensions of crystal absorbers. However, theheat capacity of this absorber is 0.2 nJ/K and 0.4 nJ/K at 10 mK and 20 mK,respectively, while a 60 cm3 CaMoO4 crystal has heat capacities of 0.17 nJ/Kand 1.4 nJ/K at these same temperatures. The performance of the detectoris shown in Fig. 4.2. In measurements with an external 241Am alpha source,this detector had a measured energy resolution of 1.2 keV FWHM for 5.5 MeValphas. This resolution, which was inferred from a fit with a Gaussian-widthfunction that takes source straggling effect into account by means of exponentialconvolutions, was the best measured resolution ever reported for an 241Am alphaspectrum. Moreover, simultaneously, the lower-energy 60 keV gamma line wasclearly seen, along with other low energy X-ray and conversion-electron lines.The resolution of the 60 keV gamma line was 400 eV FWHM. These measure-ments indicate promising possibilities for high performance applications of theMMC technique with large absorbers, with very good energy resolution over avery wide dynamic range.
4.3 Phonon measurement with large CaMoO4 crystals
An early stage of MMC development for the AMoRE project used an 0.6 cm3
CaMoO4 crystal to test the applicability of the medium for use in a 0νββsearch [84]. This successful experiment showed simultaneous good detector per-formance in both the keV and MeV energy regions. The next experiment useda larger crystal absorber corresponding to a factor of 80 volume increase. Acylindrical CaMoO4 crystal, 4 cm in diameter and 4 cm in height, and a massof 220 g, was instrumented with a meander-type MMC sensor similar to the onedescribed in the previous subsection. Figure 4.3 shows pictures of the detectorsetup. The crystal was mechanically supported by 12 Teflon-coated phosphor-
36
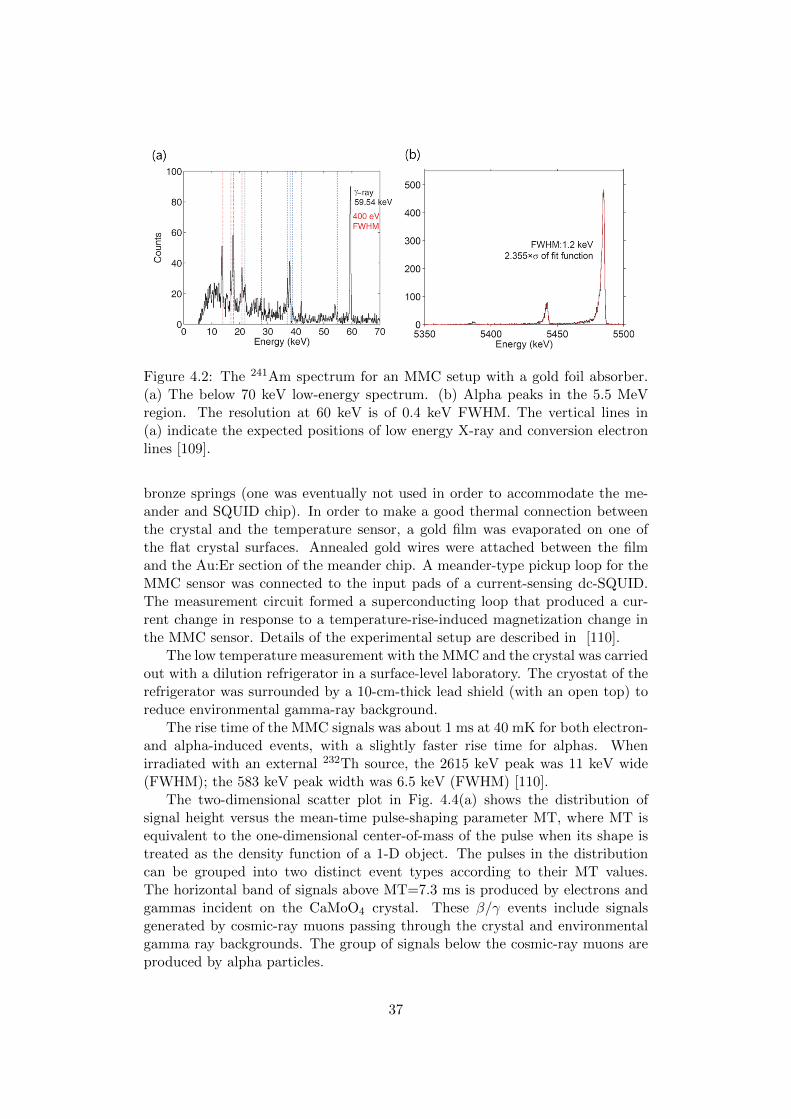
Figure 4.2: The 241Am spectrum for an MMC setup with a gold foil absorber.(a) The below 70 keV low-energy spectrum. (b) Alpha peaks in the 5.5 MeVregion. The resolution at 60 keV is of 0.4 keV FWHM. The vertical lines in(a) indicate the expected positions of low energy X-ray and conversion electronlines [109].
bronze springs (one was eventually not used in order to accommodate the me-ander and SQUID chip). In order to make a good thermal connection betweenthe crystal and the temperature sensor, a gold film was evaporated on one ofthe flat crystal surfaces. Annealed gold wires were attached between the filmand the Au:Er section of the meander chip. A meander-type pickup loop for theMMC sensor was connected to the input pads of a current-sensing dc-SQUID.The measurement circuit formed a superconducting loop that produced a cur-rent change in response to a temperature-rise-induced magnetization change inthe MMC sensor. Details of the experimental setup are described in [110].
The low temperature measurement with the MMC and the crystal was carriedout with a dilution refrigerator in a surface-level laboratory. The cryostat of therefrigerator was surrounded by a 10-cm-thick lead shield (with an open top) toreduce environmental gamma-ray background.
The rise time of the MMC signals was about 1 ms at 40 mK for both electron-and alpha-induced events, with a slightly faster rise time for alphas. Whenirradiated with an external 232Th source, the 2615 keV peak was 11 keV wide(FWHM); the 583 keV peak width was 6.5 keV (FWHM) [110].
The two-dimensional scatter plot in Fig. 4.4(a) shows the distribution ofsignal height versus the mean-time pulse-shaping parameter MT, where MT isequivalent to the one-dimensional center-of-mass of the pulse when its shape istreated as the density function of a 1-D object. The pulses in the distributioncan be grouped into two distinct event types according to their MT values.The horizontal band of signals above MT=7.3 ms is produced by electrons andgammas incident on the CaMoO4 crystal. These β/γ events include signalsgenerated by cosmic-ray muons passing through the crystal and environmentalgamma ray backgrounds. The group of signals below the cosmic-ray muons areproduced by alpha particles.
37

Figure 4.3: A CaMoO4 detector setup with an MMC phonon sensor.
Figure 4.4: (a) A scatter plot of the mean-time vs pulse height obtained froma 95 hr background measurement in a surface laboratory. α and β/γ (includ-ing cosmic muons) events are clearly distinguishable by their mean-time values.(b) The mean time distribution in the 4 – 5 MeV region of alpha-equivalentenergy [110].
The distribution of MT parameters in the 4 – 5 MeV region of alpha-equivalent energies has two distinct peaks as shown in Fig. 4.4(b). The α− β/γdiscrimination power was determined to be 7.6σ by fitting each peak with anormal Gaussian function, although small high-mean-time tails are noticeableon the right-hand sides of each peak. These results indicate the pulse shapediscrimination with high separation power can be realized with phonon signalsonly.
4.4 Development of low-temparature photon sensors
Two of the most important parameters that characterize a scintillating bolometerare the light yield and scintillation quenching factor. An MMC-based light sensoris being developed by our group in order to explore/exploit indications that the
38

Figure 4.5: (a) The prototype cryogenic photon detector. The bottom side ofthe wafer faces a CaMoO4 crystal to measure scintillation light produced therein.(b) A magnified image near the center of the detector [111].
low-temperature QF-based light-phonon separation power of CaMoO4 detectorswill be superior due to their large light output.
The images in Fig. 4.5 show a completed light sensor, in which a two-inchdiameter, 0.5-mm-thick polished Ge wafer is used as a photon absorber. Thewafer was fixed with three small Teflon clips at its edge that were clamped withtwo flat copper rings. The top ring had three spokes in the middle, whereas thebottom ring (not visible in the photograph) had an open hole for light collection.
The performance of the light detector was investigated in a surface-levelcryogen-free adiabatic demagnetization refrigerator (ADR). The ADR cryostatwas surrounded by a 5-cm-thick lead shield. Two sets of experiments were per-formed using 55Fe and 241Am radioactive sources. With the 55Fe source, anenergy resolution with FWHM = 545 eV was obtained for 6 keV X-rays. Thetemperature-dependence of the 241Am source’s 60 keV gamma-induced signalsizes was studied.
As the operating temperature of the light detector was decreased, the 60 keVsignal sizes increased, as shown in Fig. 4.6a. This is expected because the waferheat capacity decreases and the MMC sensitivity increases with decreasing tem-peratures. However, the signal rise times are found to be almost constant atabout 0.2 ms for all of the measured temperatures as shown by the pulses nor-malized by their maximum pulse height in Fig. 4.6b. Heat-flow via athermalphonons is likely responsible for the temperature-independent time constant.Photon signals from MMC have a faster rise-time than that for phonons, whichshould increase the efficiency for distinguishing real events from random overlap-ping events, which will be serious backgrounds for AMoRE, especially randomcoincidences of 2νββ 100Mo decays.
39

Figure 4.6: (a) Typical 60 keV gamma ray signals at various ADR temperatures.(b) The same signals normalized by maximum pulse height. The temperature-independent rise-time is ' 0.2 ms [111].
4.5 Simultaneous measurement of phonon and pho-ton signals
Simultaneous measurements of phonon and photon signals were made using com-binations of the phonon and photon detectors described in the previous sections.These were done in a dilution refrigerator located in a surface-level laboratory. Adoubly enriched 48deplCa100MoO4 crystal (SB28) with a mass 196 g was used asthe absorber. The optical properties of this crystal and its internal backgroundlevels from room-temperature measurements are described in Chapter 3.
A copper sample-holder for the elliptical cylindrically shaped crystal has arectangular-prism shaped structure, as shown in Fig. 4.7a. The phonon collectoris located on the bottom surface of the crystal shown in the image. The photondetector described in the previous section was placed on the top of the crystalto measure the scintillation light (see Fig. 4.7b). A light reflecting foil covers allsides of the sample holder other than the top surface.
Figure 4.8a shows a two-dimensional scatter plot of the signal sizes from thetwo sensors. Roughly four groups of signals appear in the simultaneous measure-ment. Cosmic-ray muons passing through the Ge wafer and the CaMoO4 crystalproduce the upper horizontal band in the scatter plot; the cosmic-ray-inducedphoton-sensor signals were saturated by the muon energy deposits. Environ-mental backgrounds that are absorbed only in the photon detector produce thevertical band near zero phonon signal sizes. The β/γ events absorbed in theCaMoO4 crystal show a linear relation between the two signal sizes. Muonspassing through the CaMoO4 crystal but not the Ge wafer, extend this β/γevent behavior to higher energies. Alpha-induced signals also show a linear re-lation between the two sensors but with smaller light signals than those for β/γsignals. These relative differences of the phonon and photon signals for alphaand β/γ events can be clearly seen in Fig. 4.8b, where the ratio of the two sen-sors are plotted. A separation power of 8.6σ for signals over a wide region of
40

Figure 4.7: The setup for simultaneous measurements with phonon and photonsensors. (a) The phonon collector and MMC sensor are located on the bottomof the CaMoO4 crystal; (b) the Ge light-photon detector is placed on the top.
alpha-equivalent energies (4 MeV< Eα <7 MeV) is found.There is a clear light-yield difference between α- and β/γ-induced events in
the CaMoO4 crystal. This effect, together with PSD from the phonon sensoralone, will provide a powerful tool for attaining our goal of a “zero background”0νββ decay search experiment.
41

Figure 4.8: Surface-level phonon-photon measurements with the 196 g48deplCa100MoO4 bolometer in coincidences with a Ge-based light detector. (a)A two-dimensional scatter plot of signal sizes from the two sensors. (b) The sig-nal size ratios; α- and β/γ-(including cosmic muons) induced events are clearlyseparated.
42
Chapter 5
Experimental design
5.1 Overview
We have recently completed the assembly of the “AMoRE-Pilot” experiment thatconsists of an array of the five 48deplCa100MoO4 R&D crystals that are currentlyon hand, with a total mass of approximately 1.5 kg. The goals of AMoRE-Pilotare: a better understanding of the background conditions; gain experience withthe assemby and operation of the experiment; and reach the current state-of-the-art level of 0νββ half-life sensitivity for 100Mo. After about a year of datataking, we will move to the first phase of the experiment, dubbed AMoRE-I,that will consist of approximately 5 kg of 48deplCa100MoO4 crystals in the samecryostat and shielding as AMoRE-Pilot with modifications based on what welearn from our experience with the Pilot run. This will start at the beginningof 2017 and will run for about three years. During this time, we will continueto pursue our vigorous program of R&D on the deep purification of CaMoO4
and studies of other candidate crystals. Based on our R&D studies and ourexperience with the early AMoRE-I data, we will make decisions on the crystalproduction and procurement for the second phase, AMoRE-II. This phase of theexperiment will start in early 2020 with about 70 kg of crystals instrumentedin a new, larger cryostat situated in a new, deeper laboratory. This will besubsequently upgraded in mass to a maximum of 200 kg if the background levelsare low enough to warrant this.
5.2 AMoRE-Pilot
5.2.1 Experimental arrangement
Figure 5.1 provides a schematic view of the cryostat interior for the AMoRE-Pilot experiment that has been assembled and is currently being commisssioned.The cryostat has five different temperature stages and two separate vacuumchambers. The 4K stage defines the boundary between the inner and outervacuum volumes. The cryostat is surrounded by an external, 15-cm-thick leadshield in the low-temperature room in the A5 tunnel of Y2L.
43

Figure 5.1: A schematic view of the AMoRE-Pilot experimental arrangement.
44
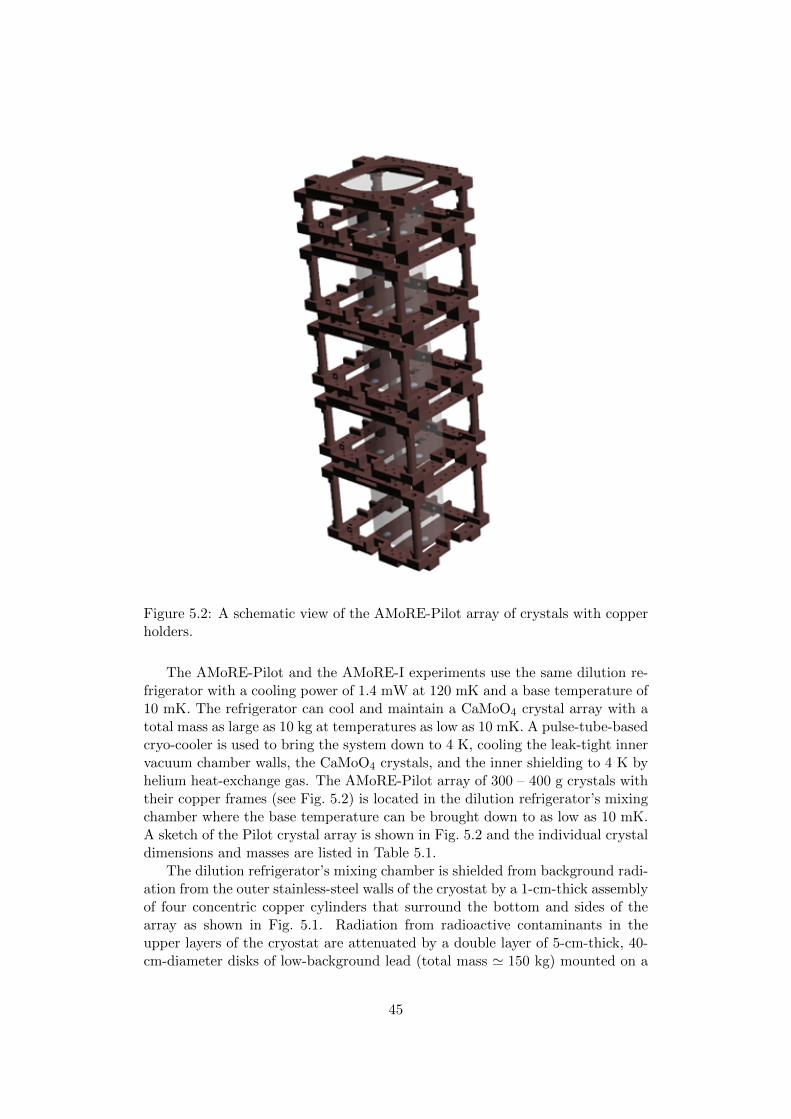
Figure 5.2: A schematic view of the AMoRE-Pilot array of crystals with copperholders.
The AMoRE-Pilot and the AMoRE-I experiments use the same dilution re-frigerator with a cooling power of 1.4 mW at 120 mK and a base temperature of10 mK. The refrigerator can cool and maintain a CaMoO4 crystal array with atotal mass as large as 10 kg at temperatures as low as 10 mK. A pulse-tube-basedcryo-cooler is used to bring the system down to 4 K, cooling the leak-tight innervacuum chamber walls, the CaMoO4 crystals, and the inner shielding to 4 K byhelium heat-exchange gas. The AMoRE-Pilot array of 300 – 400 g crystals withtheir copper frames (see Fig. 5.2) is located in the dilution refrigerator’s mixingchamber where the base temperature can be brought down to as low as 10 mK.A sketch of the Pilot crystal array is shown in Fig. 5.2 and the individual crystaldimensions and masses are listed in Table 5.1.
The dilution refrigerator’s mixing chamber is shielded from background radi-ation from the outer stainless-steel walls of the cryostat by a 1-cm-thick assemblyof four concentric copper cylinders that surround the bottom and sides of thearray as shown in Fig. 5.1. Radiation from radioactive contaminants in theupper layers of the cryostat are attenuated by a double layer of 5-cm-thick, 40-cm-diameter disks of low-background lead (total mass ' 150 kg) mounted on a
45

Table 5.1: The dimensions and masses of the AMoRE-Pilot 48deplCa100MoO4
crystals.SB28 NSB29 S35 SS68 SS81
Height (mm) 25.5 51 40 40 52
Major axis (mm) 49.5 50 45 53 45
Minor axis (mm) 40.5 42.5 40 47.2 41
Mass (g) 196 390 256 352 354
Table 5.2: The measured radioactivity for the internal shielding lead.210Po
[Bq/kg]Total α rate
[cm−2h−1]Total γ from U, Th,K and Cs [mBq/kg]
(0.30± 0.08) 0.01 < 7.4
1-cm-thick low-background copper plate that is supported from the lowest tem-perature stage of the cryostat. The CaMoO4 crystal detector array is encased in a2-mm-thick cylindrical structure made from the same low-background lead. Thiscylinder, which is superconducting at the operating temperature of the experi-ment, shields the detector from external magnetic fields. An additional magneticshield is provided by two layers of mu-metal placed between the cryostat’s outervacuum vessel and the external lead radiation shield (not shown in Fig. 5.1).This magnetic shielding is necessary for reducing possible electronic noise thatis produced in the detector’s readout wires from ground-vibration-induced wiremotions.
5.2.2 Inner shielding
The lead shielding that is inside the cryostat is designed to reduce backgroundsdue to scattered gammas from the gap of the external shield and from radioactivecontaminants of the cryostat components, such as electrical wires, cooling pipes,and other sources from the upper layers of the cryostat. Two layers of standard-thickness lead bricks from ancient lead taken from sunken Roman ships that waspurchased from and machined by LEMER PAX in France are used; the totallead thickness is 10 cm. The supporting disk is made from 1-cm-thick OFHCcopper plate with U/Th levels below 50 pg/g. The radioactivity levels in theancient lead were measured underground in the Modane laboratory in Franceand are listed in Table 5.2.
5.2.3 Outer shielding
The cryostat is situated inside a supporting structure made from steel H beams,as shown Fig. 5.3. This structure supports an array of cosmic-ray veto scintil-lation counters and an external shield formed from a total of 15 tons of leadbricks that attenuate gammas from the surrounding environment such as therock walls of the A5 cavity. The main lead-shielding structure sits on a 3-mm-thick stainless-steel bottom plate and surrounds the bottom and sides of the
46

cryostat with transverse dimensions of 1.5×1.1 m2 and a height of 1.75 m. Thestructure is built in two halves that can be independently moved apart to pro-vide access to the cryostat. The top is covered by a separate lead ceiling at thetop of the support structure, with a gap between it and the sidewall shield forelectrical wires and cooling pipes that run from the cryostat to the readout andcooling control systems elsewhere in the experimental hall (see Fig. 5.4). Thetransverse dimensions of the top lead shield are determined to be sufficient toprevent any external gamma to have an unshielded, direct path to the crystalarray.
The shield is assembled from standard-sized lead bricks, dimension of 50 mm× 100 mm × 200 mm, that were purchased from JL Goslar GmbH in Ger-many. They were cleaned and machined by a local company in Korea. The totalthickness of the external lead shield is 15 cm. The 232Th and 238U contentsin the brick were measured to be 3.8 pg/g and 6.9 pg/g, respectively, with anInductively-Coupled-Plasma Mass Spectrometer (ICP-MS). The 210Pb activitywas measured to be (59 ± 6) Bq/kg at PTB (Physikalisch-Technische Bunde-sanstalt) in Germany.
Cosmic-ray Muon Veto Counters
The top and sides of the external lead shield are surrounded by a cosmic-raymuon veto system based on 5-cm-thick plastic scintillators. Each scintillatorpanel (EJ-200 by Eljen Company) is coupled to 2 inch PMTs via light guidesas shown in Fig. 5.5. The muon-veto scintillation counters are installed on theoutside of the shielding structure as shown in Fig. 5.6.
5.3 AMoRE-I
The AMoRE-I experiment will use about 5 kg of double enriched 48deplCa100MoO4
detectors (about 15 crystals). The crystals are under preparation by the Fomos-Materials company in Russia. A schematic view of the planned crystal array isshown in Figure 5.7 for a 10 kg configuration. With this system, 5 kg of naturalCaMoO4 crystals may be used together with the 5 kg of enriched crystals.
The cryostat and the shielding structure will be the same as AMoRE-Pilotexperiment; our current intent is to phase from AMoRE-Pilot to AMoRE-I ex-periment by adding more crystals from Fomos Materials. We plan to begin theAMoRE-I experiment in 2017. The main purpose of the AMoRE-I experiment isto verify that the background levels are consistent with a zero-background envi-ronment. At the same time, we will finalize the crystal choice for the AMoRE-IIexperiment, that is, whether we will use CaMoO4 crystals for the next phaseor switch to another molybdate crystal, such as ZnMoO4 or Li2MoO4 crystalscintillators. The decision will be made while we run the AMoRE-I experiment.
47

Figure 5.3: The support structure for scintillating counters, external lead shield-ing and cryostat.
48

Figure 5.4: The lead-shielding structure. The top (left) and main (right) struc-ture can slide in and out independently.
Figure 5.5: Different sizes of plastic scintillators that cover the shielding struc-ture.
49

Figure 5.6: A schematic view of the muon veto system.
Figure 5.7: A schematic view of a possible AMoRE-I crystal array.
50

Figure 5.8: A schematic view of a possible configuration of the AMoRE-II crystalarray.
5.4 AMoRE-II
For the AMoRE-II experiment, we aim to ultimately operate with a 200 kg arrayof molybdate crystals; a schematic diagram of a possible crystal arrangement inwhich the AMoRE-I configuration is stretched into long towers is shown in Fig.5.8. The configuration can be changed, and the arrangement shown in Figure5.8 is only one possibility. Our goal is to settle on the AMoRE-II design in themiddle of year 2019.
For a 200 kg array of the crystals, we will need a much larger cryostat thanthat being used for AMoRE-Pilot and AMoRE-I experiments. The design of thelarger cryostat will begin in 2017 and continue for about a year.
5.4.1 Crystals for AMoRE-II
To maintain a zero-background environment that fully exploits the increase indetector mass, the crystals for AMoRE-II must have internal background levels
51

that are an order-of-magnitude below those of the current state-of-the-art crys-tals that will be used in AMoRE-I. Moreover, to reach our total mass goal atreasonable cost, we have to be able to recover the precious 48deplCa and 100Moisotopes from the scrap material produced in the crytal-growing and cuttingprocesses with high efficiency. To accomplish these tasks we are engaged in anaggressive R&D program aimed at improving chemical purification and recov-ery processes. As part of this we have set up our own chemical purificationlaboratory and recruited a PhD-level chemist specialized in low-level impurityextraction to manage it and supervise a small staff of purification laboratory(mostly PhD students). In addition, we have constructed our own crystal grow-ing facility to research crystal-growing techniques. This is managed by a PhDphysicist with a specialty in crystal-growing.
52

Chapter 6
Simulation tools andbackground estimations
To estimate background conditions in the AMoRE experiments, we are perform-ing simulations with the GEANT4 toolkit [112, 113]. Since radiation originatingwithin the CaMoO4 will probably be the dominant source of backgrounds, in-ternal CaMoO4 crystal backgrounds from the full 238U, 232Th, and 235U decaychains, as well as from 40K, were simulated and their effects on the 100Mo 0νββdecay signal region were investigated. For the AMoRE-I experimental config-uration, backgrounds from materials in the nearby detector systems, includingthe internal lead shielding plate, G10 fiberglass, and the outer lead shieldingbox, were simulated, as well as backgrounds from more remote external sources,such as the surrounding rock material. Simulation results were normalized tomeasured activity levels. Activities of 238U, 232Th, 40K, and 235U were mea-sured by HPGe detectors or inductively coupled plasma mass-spectroscopy. TheICP-MS measurements were all performed by the KAIST Analysis Center forResearch Advancement (KARA). For all simulations, except as otherwise statedbelow (with particular exception for the 210Pb subchain) we presently assumethat the decay chains of 238U, 235U, and 232Th are each in equilibrium, thus allrelated activities within the chains are simply equal to the 238U, 235U, and 232Thactivities multiplied by the branching ratios for decay of the daughter isotopes.
For backgrounds that originate from decays outside of the cryostat, such asfrom the lead shield or rock shell, only gamma de-excitations were found to pro-duce signals in the crystals. Random coincidences of radiation from differentbackground sources were found to have the most significant effect on the 100Mo0νββ decay signal region. These are reported here explicitly for sources wherethey were found to be significant. When not explicitly stated, random coinci-dences are not included. Cosmic-ray induced backgrounds were also simulated.Other sources of background (cosmogenic 88Y, residual 48Ca in 48deplCa100MoO4,and 214Bi in copper) are not expected to contribute significantly to the back-ground near the signal region, but they will be considered in the future.
Results from background simulations described in this section are distin-guished as α- or β/γ-like. A separation power of 8.6σ is demonstrated in Sec. 4.5for separation of α- and β/γ-like events, implying that significant α background
53

rates in the region of interest, ROI ≡ 3034± 10 keV, can be safely rejected. Re-sults are reported in Table 6.7 and can be compared to the AMoRE-I backgroundgoal of 0.002 counts/keV/kg/yr.
6.1 Geometry of simulation configuration
(a) (b) (c)
Figure 6.1: (a) CaMoO4 crystal with Vikuiti reflector and Cu supporting frame;(b) bottom view of CaMoO4 crystal; (c) the 35 CaMoO4 crystals were stackedup in 5 layers and 7 columns.
The detector geometry of the AMoRE-I simulation includes the CaMoO4
crystals, the shielding layers internal to the cryostat, the external lead shieldingbox, and the outer rock shell. An array of 35 CaMoO4 crystals is located insidethe cryostat. Each crystal has a cylindrical shape with a 4.5 cm diameter, 4.5 cmheight, and a mass of 310 g. The total simulated crystal mass is 10.9 kg. The 35crystals are arranged in seven vertical columns, each with five crystals stackedcoaxialy, with one center column surrounded by six external ones. The sidesurface of each crystal is covered by a Vikuiti ESR reflecting film.
As discussed above, each crystal is contained in a copper mounting frame asshown in Fig. 6.1. A 10-cm-thick lead plate (diameter 40.8 cm and mass 148.3 kg)placed on a 1-cm-thick copper plate is located just above the CaMoO4 crystalarray to attenuate backgrounds from cryogenic piping, electrical connectors, andother internal cryostat structures. The array is contained inside of four concentriccopper cylinders with a total Cu thickness of 10 mm, all within an outer stainless-steel vacuum cylinder that is 5 mm thick. Sequential top plates are connectedwith G10 tubes. In the current version of the simulation, a simple top platewithout any features or structures is used. Realistic structures and featureshave been positioned on each of the top plates for use in future simulations.
The cryostat is located inside a 15-cm-thick external lead shield. The topplate of the lead shield was placed above the lead shield and covering an area of150× 150 cm2. A 50-cm-thick rock shell surrounds the lead shield and cryostat,representing the rock cavern at the YangYang Underground Laboratory (Y2L)where the AMoRE-I experiment will operate.
54

(a) (b)
Figure 6.2: Geometry of the AMoRE-I Monte Carlo Simulation. The outervacuum cylinder (OVC) and four Cu shields surround the CaMoO4 crystals.Inside the cryostat, the Inner Lead plate (gray) on top of a Cu plate (blue) islocated above the crystals. This lead plate attenuates radiation from the G10support rods (magenta) and other materials in the upper cryostat.
6.2 Internal background in CaMoO4
We simulated the full 238U, 232Th and 235U decay chains, as well as 40K, withcontamination taken to be uniformly distributed inside the thirty-five crystals.The assumed radioactivity levels of the contaminants, listed in Table 6.1, werebased on the measurements described above in Section 3.5. About 106 eventseach for 238U, 232Th, 40K and 235U, and about 107 210Pb events were simulated.
Table 6.1: Levels of radioactive contaminants based on SB28 measurement.210Pb 238U 232Th 40K 235U
Activity10 0.1 0.05 1 1
[mBq/kg]
Background rate estimates were determined from the numbers of events inthe 100Mo 0νββ ROI, as shown in Table 6.2. Most of the events in the signalregion are found to originate from α decays. The β-decay-induced events aremostly from the 232Th chain and originate from 208Tl. Because the 208Tl half-life is only 3.1 minutes, decays of 208Tl can be rejected using time correlationswith the α-signal from the preceding 212Bi→ 208Tl α decays. Rejection of βevents that occur within 15 minutes after a 6.207 MeV α event in the samecrystal, results in a 94% veto efficiency for 208Tl-induced β events in the signal
55

region, while introducing a negligible dead-time.
Table 6.2: Simulated background rates (counts/keV/kg/yr) in the ROI forsources within the crystals, before analysis cuts.
210Pb 238U 232Th 40K 235U
Total anti-coincidence rate 0.023 0.0020 0.0278 0 0.012
α event rate 0.023 0.0017 0.0005 0 0.012
β event rate 0 0.0003 0.0273 0 0
The 2νββ decay in a CaMoO4 approaches zero rate at the end-point en-ergy, but random coincidence of these events can sum together (pileup) creatingbackgrounds for the 0ν decay signal. The expected rate of 2νββ decay in asingle CaMoO4 crystal is 0.00284 counts/s, as listed in Table 6.3 with an energydistribution as shown in Fig. 6.3 (left).
Table 6.3: Expected rate of 2νββ decays.
one crystal 35 crystals
Mass (kg) 0.31 10.87
2νββ rate (counts/s) 2.84 × 10⁻³ 9.93 × 10⁻²
When 5 × 10⁸ 2νββ events were simulated in the CaMoO4 crystals (310 geach), corresponding to about 335 years of operation, ∼ 98.6% of events de-posited energy in one crystal (single-hit events) and the remaining events pro-duced hits in multiple crystals. The random coincidence rate of two 2νββ decayswas calculated by convolving two single-hit 2νββ decay energy distributions (seeFig. 6.3), and the accidental rate, assuming an 0.5 ms coincidence window, is1.18 × 10−4 counts/keV/kg/yr in the ROI. This is substantially lower than theAMoRE-I background goal of 0.002 counts/keV/kg/yr.
6.3 Backgrounds from materials in detector system
We simulated the full decay chains of backgrounds in the outer lead shieldingbox and in other items such as the inner lead plate, the copper support framefor the crystals, the G10 fiberglass structural elements of the cryostat, and thesuperconducting-lead magnetic shield. The assumed concentraions of radioactivebackground nuclides were based mostly on ICP-MS measurements [85] and wereused to normalize the simulation results.
The ICP-MS technique measures concentrations of 39K in the material. Theconcentrations of 40K were calculated by assuming the ratio of concentrations of39K to 40K is equal to the natural abundance ratio. The concentrations shownin Table 6.4 were based on our measurements, some of which were provided bythe vendors.
56

Deposited Energy (MeV)0 0.5 1 1.5 2 2.5 3 3.5 4
Rat
e (c
ount
s/ke
V/k
g/yr
)
0
1
2
3
4
5
6
Deposited Energy in CMO
Energy (MeV)0 1 2 3 4 5 6
Rat
e (c
ount
s/ke
V/k
g/yr
)
0
0.05
0.1
0.15
0.2
0.25
0.3-310×
Figure 6.3: The energy distribution (bottom) of random coincidences of two2νββ decays of 100Mo. The random coincidence spectrum is derived by con-volving two 2νββ spectra (top), and was normalized according to the 2νββ rateassuming an 0.5 ms coincidence window.
In order to reduce backgrounds from the lead shield inside the cryostat, wepurchased T2FA lead bricks from Pax Lemer with a certified activity of 210Pbof 0.3 Bq/kg of 238U and 232Th of < 1 pg/g. The concentration of 40K is not yetknown but decays of 40K are expected to produce a negligible background con-tribution. The low Q-value of these decays implies that they can only contributeto the CaMoO4 0νββ ROI by way of accidental coincidence.
We itemize below the items inside the detector shielding for which radioactivebackgrounds have been measured:
• CaMoO4 copper support frame (the yellow elements in Fig. 6.1);
• G10 fiberglass support tubes for cryostat (the magenta elements of Fig. 6.2);
• lead plate inside cryostat (the gray item in Fig. 6.2);
• superconducting lead magnetic shield (this surrounds the inner crystal ar-ray).
57

Table 6.4: Levels of radioactive contaminants in materials inside the cryostat.Values marked with ”∗” were arbitrary assumptions.
210Pb 238U 232Th natK 235U
Crystal-supporting- 0.027 ng/g 0.051 ng/g - -
copper frame
Inner plate leadfrom Lemer PAXT2FA
0.3 Bq/kg 1∗ pg/g 1∗ pg/g 9∗ ng/g 1∗ pg/g
G10 fiberglass - 1932 ng/g 12380 ng/g 360 µg/g -
Superconductingshield, LemerPAX T2FA lead,
0.3 Bq/kg 1∗ pg/g 1∗ pg/g - -
Outer shield leadfrom JL GoslarGmbh
59± 6 Bq/kg 6.9 pg/g 3.8 pg/g - -
In order to attenuate gammas that originate from the surrounding rock a15-cm-thick lead shielding box surrounds the cryostat. The top lead plate islocated 46.4 cm above the top of the lead side-walls. The total mass is 15.6 tons.The lead was purchased from JL Goslar GmbH in Germany. The lead came witha 210Pb certification from PTB, the National Standards Laboratory of Germanyand was measured by ICP-MS at KARA for 238U and 232Th contamination.Activities are listed in Table 6.4. The expected number of 238U, 232Th decaysoriginating from the lead shield were calculated based on the inferred activitiesand natural isotope abundance ratios. For 238U and 232Th no simulated eventswere found in the experimental ROI.
The expected rate of 210Pb decays in the lead shield is 1.08 × 10¹¹ counts/day(3.943 × 1013 counts/yr) when the concentration of 210Pb in the lead shield ison the level of 60 Bq/kg, (The lead vendor provided a certification of 59 ±6 Bq/kg). We simulated 4.4× 10⁹ 210Pb events uniformly distributed within thelead shielding. This corresponds to the expected number of events for 1.25 hrfor a concentration of 60 Bq/kg. The expected event rate of 210Pb from the leadshield in CaMoO4 is 8.9 × 10⁵ counts/keV/kg/yr. No events were produced inthe signal ROI.
To check the effectiveness of the outer shield at attenuating gammas from thesurrounding rock, and to optimize the size of the top lead plate, mono-energeticγ’s of 2615 keV (emitted from 208Tl) and 1461 keV (from 40K) were generatedrandomly in a 50-cm-thick layer of the surrounding rock shell (Figure 6.4). Thetotal mass of the 50 cm rock shell is 5.7 × 10⁸ g. The measured concentrationsof 238U, 232Th and K in the rock material are given in Table 6.5.
From these simulations we conclude that a top lead plate with transversedimensions 150 cm × 150 cm would be sufficient to block γ’s from enteringthrough the gap in the shielding. The rate of events generated in the detector
58

Figure 6.4: Geometry of the rock shell surrounding the setup.
Table 6.5: Concentrations of 238U, 232Th, and K in the rock sample from A5tunnels in Y2L, measured by ICP-MS.
238U 232Th natK
Concentration (µg/g) 2.7 9.6 2100
from the rock is found to be smaller than the rate of events arising from 210Pbin the shield, but the mean energies of gammas in the rock-produced gammaspectra are higher. No events were produced in the signal ROI. The rate of100Mo 2νββ decays in random coincidence with γ’s from 232Th in the rock wasestimated to be 1.01 × 10⁻⁴ counts/keV/kg/yr in the signal ROI.
6.4 Cosmic ray induced background
We have simulated cosmic muons and neutrons induced by muons passing throughthe detector system. We did not simulate the environmental neutrons producedby radioactive decays in underground rock since these neutrons have energiesbelow 10 MeV and can be shielded with thick polyethylene blocks at outside ofthe detector.
59

6.4.1 Muon energy spectrum
Muon Energy (MeV)
410 510 610 710
Num
ber
of E
vent
s
1
10
210
310
410
510
Figure 6.5: Muon energy spectrum at Yangyang.
High energy neutrons are produced primarily by muons passing through thematerials in the detection system. These neutrons generate secondary neutronsvia hadronic interactions in the surrounding materials. We simulated all theprimary and secondary processes using GEANT4 simulation program startingwith muons passing through the detector system. We used the muon energyspectrum provided by Mei and Hime [114]:
dN
dEµ= Ae−bh(γµ−1) × (Eµ + εµ(1− e−bh))−γµ , (6.1)
where h is the rock slant depth in km.w.e. We used the parameters provided byGroom et al. [115] for εµ, b, and γµ. For Y2L, h=1.8 km.w.e. Figure 6.5 showsthe muon energy spectrum generated at this depth. The average muon energy is201 GeV, which is consistent with the measured values of Mei and Hime [114].
6.4.2 Schematic layout of simulation geometry
Muons were generated in a manner which produced all muons that pass within1.5 m of the detector center, selected randomly for position and angle from thedistribution of dN
dΩ dA proportional to cos2 θ, as shown in Figure 6.6(a). Theprocedure insured that all muons were generated with vertices at least 3 mfrom the detector center. Figure 6.5 shows the energy spectrum of generatedmuons at the hemisphere. The muon flux at Yangyang is taken to be 2.7 ×10⁻⁷ muons/cm2/s or 3.7× 10⁷ muons/(3 m× 3 m)/(48.3 years).
For the conceptual shielding configuration for AMoRE-II, we modeled 432 CaMoO4
crystals, each with a diameter of 5 cm, a height of 5 cm, and a mass of 426 g.
60

(a) (b)
Figure 6.6: (a) Schematic layout of simulation geometry. (b) Shielding config-uration
The total mass of crystals is 184 kg. The target crystals are located inside a1 cm copper shield which is surrounded by lead and polyethylene (PE) shieldsas shown in Fig. 6.6(b). Plastic scintillators with 10 cm thickness are locatedoutside of the lead shield.
6.4.3 Muon and muon-induced neutron backgrounds
In the AMoRE-II conceptual shielding configuration, muon and muon-inducedneutron single-crystal background rates are found to be∼1.1×10⁻⁴ counts/keV/kg/yr,after applying a veto cut for events that are coincident with a hit in a muon scin-tillation counter. The veto efficiency for these events was taken to be 90%.
6.5 Other backgrounds
• Other sources of background (cosmogenic 88Y, residual 48Ca in the CaMoO4
crystals, and 214Bi in the copper) are not expected to contribute signifi-cantly to the background near the signal ROI. Nevertheless, they will alsobe considered in the future.
• Vikuiti reflectorWe also simulated the effects of 238U and 232Th contaminants and theirdaughters, in reflecting foils that surround the CaMoO4 crystals. An in-titial candidate for this part is 3M Vikuiti. Our HPGe counting of thismaterial presently sets limits of about < 1.6 mBq/kg in the 238U chain,< 0.9 mBg/kg for the 232Th chain, and < 15 mBq/kg for 40K. Preliminarysimulation results are reported in Table 6.6. These results are very recentand potassium has not yet been included in the analysis.
61
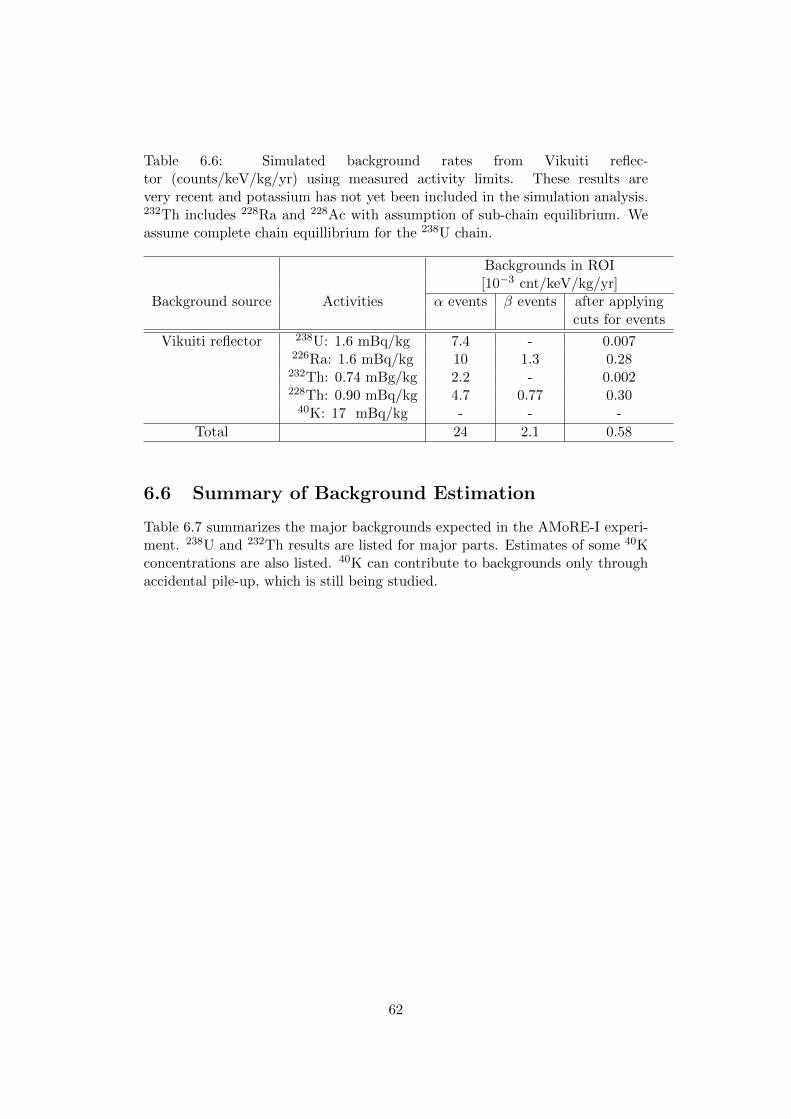
Table 6.6: Simulated background rates from Vikuiti reflec-tor (counts/keV/kg/yr) using measured activity limits. These results arevery recent and potassium has not yet been included in the simulation analysis.232Th includes 228Ra and 228Ac with assumption of sub-chain equilibrium. Weassume complete chain equillibrium for the 238U chain.
Background source
Backgrounds in ROI[10−3 cnt/keV/kg/yr]
Activities α events β events after applyingcuts for events
Vikuiti reflector 238U: 1.6 mBq/kg 7.4 - 0.007226Ra: 1.6 mBq/kg 10 1.3 0.28
232Th: 0.74 mBg/kg 2.2 - 0.002228Th: 0.90 mBq/kg 4.7 0.77 0.30
40K: 17 mBq/kg - - -
Total 24 2.1 0.58
6.6 Summary of Background Estimation
Table 6.7 summarizes the major backgrounds expected in the AMoRE-I experi-ment. 238U and 232Th results are listed for major parts. Estimates of some 40Kconcentrations are also listed. 40K can contribute to backgrounds only throughaccidental pile-up, which is still being studied.
62

.
Table 6.7: Summary of backgrounds in major components of AMoRE-I, esti-mated with measurements and simulation. Limits are 95% C.L. Perfect alpharejection is assumed (see Sec. 4.5). Here, items that have simulated times thatare still less than a year and have not produced any counts in the ROI have notbeen translated into limits.
Backgrounds in ROI(3.03± 0.01 MeV) [10−3
cnt/keV/kg/yr]
IsotopeActivity
[mBq/kg]
SimulatedTime[years]
α eventsβ-likeevents
afterapplyingcuts forevents
InternalCaMoO4
210Pb 10 31 23.0 - -238U 0.1 335 1.7 0.3 0.3
232Th 0.05 698 0.5 27.3 1.540K 1 232 <0.056 <0.056 <0.056235U 1 32 12.0 <0.41 <0.41
Randomcoincidence of
two 2νββ335 <0.039 0.12 0.12
CaMoO4
copper frame
238U 0.330 96 0.63 0.45 ∼ 0.232Th 0.207 207 0.46 1.43 ∼ 0.7
G10 fiberglasssupport tubes
238U 240 000 0.1 - - -232Th 50 000 0.03 - - -
40K 1.2 0.4 - - -
SC lead shield
210Pb 300 1.0 92.8 - -238U .012 4425 0.007 0.004 ∼ 0.001
232Th .0041 17884 0.003 0.002 ∼ 0.001
Inner leadplate
210Pb 300 0.09 - - -238U .012 10 <1.3 <1.3 <1.3
232Th .0041 10 <1.3 <1.3 <1.3
Outer leadshield
210Pb 59 000 1.25 hr - - -238U .085 0.28 - - -
232Th .015 0.53 - - -
γ from rock inrandom
coincidencewith 2νββ
232Th 39 000 1.2 hr - 0.10 0.10
Muons andmuon-induced
neutrons48 - 1.1 0.11
Total 133.8 33.9 5.9
63

Chapter 7
Supply, purification andrecovery of enriched materials
7.1 100Mo
Molybdenum isotopes are separated by centrifuge techniques, which are charac-terized by high productivity and reasonable cost. This technique can work forchemical elements that form volatile compounds at room temperature. Fortu-itously, Molybdenum forms the volatile MoF6 compound at room temperature.There are several facilities at the world that have the capability for the separationof large quantities of Molybdenum: JSC Production Association Electrochemi-cal plant (Zelenogorsk), JSC Ural Electochemical plant (Novouralsk) and JSCSiberian Chemical Plant (Seversk) in Russia, and URENCO (Almelo) in theNetherlands. These plants have dealt with the enrichment of Uranium and alsowith enrichment of stable isotopes of some other chemical elements.
An 8.25 kg quantity of 100Mo (enriched to 96%) was produced by the JSCProduction Association Electrochemical Plant (ECP) in Zelenogorsk, Russia, bythe gas centrifugation technique. This enriched material, supplied in the formof 100MoO3, is very pure with respect to radioactive contaminants: the resultsof ICP-MS measurements show that the concentrations of 238U and 232Th in the100MoO3 powder do not exceed 0.07 ng/g and 0.1 ng/g, respectively.
The general scheme for 100Mo production at the ECP is as follows:
• Fluoridation:natMo + 3 ∗ F2 →nat MoF6
(gaseous impurities: 235,238UF6 +nat WF6 +nat GeF4 + ...)Purification of: ThF4,RaF2,PaF4,AcF3,KF - no volatile high-pressure flu-orides at RT).
• Centrifugation:1st stage: natMoF6 →98−94 MoF6 + (235,238UF6 +nat WF6 + 100MoF6)2d stage: 100MoF6 + (100MoF6 + 235,238UF6 +nat WF6).
• Conversion (“wet” chemistry):100MoF6 + H2O + HNO3 → (evaporation & calcination) → 100MoO3
64

100MoO3 + H2O + NH3 → (evaporation & calcination) → 100MoO3.
The 100Mo production capacity at ECP is, at present, ∼28 kg/yr, in formof 100MoO3 with an isotopic enrichment IE ≥ 95%. At this rate, it would takeabout 3.5 years to produce 100 kg of enriched 100Mo. It is not clear at this time ifthere is another plant capable of enriching 100Mo at this rate. According to ourunderground background measurements at Y2L, the quality of the MoO3 powder(from the point of view of chemical purity and 238U and 232Th contamination)is sufficient for CaMoO4 crystal growing.
The cost to the AMoRE Collaboration is 90∼100 $/g for 100 kg quantities(mass of Mo) with an enrichment to 95%. There is strong “cost competition”between the application of Mo isotopes for Nuclear Medicine (98Mo and 100Mofor production of 99Mo /99mTc)
and Underground Physics. This situation presents a risk to AMoRE (thecost of 98Mo for Nuclear Medicine is at the level of 300 $/g). The MoF6 workinggas for centrifugation is extremely corrosive. If a centrifuge cascade is devotedto Mo isotope enrichment, this production should continue “forever”, i.e., untilthe time of the cascade’s decomissioning.
7.2 48deplCa
Calcium isotopes can be separated by electromagnetic methods that are charac-terized by very low productivity and high cost. There are currently two sites inthe world that possess large-scale facilities for this purpose: the Y-12 NationalSecurity Complex (Calutrons in Oak Ridge, DOE, USA) and FSUE Electrochim-pribor (Lesnoy, Russia). At present, the Calutrons in Oak Ridge are closed. TheSU-20 facility at FSUE Electrochimpribor (EKP) is in operation and is still pro-ducing 48Ca (and 48deplCa). In a search for existing 48Ca-depleted material,we found that EKP has a sizable amount of Ca material from which the 48Cacomponent was depleted by as much as a factor of 187 compared to that for nat-ural calcium. The production of 48Ca-depleted (or, equivalently, 40Ca-enriched)material by means of industrial electromagnetic separators, has been going oncontinuously in the USSR/Russia to provide 48Ca-, 44Ca- and 46Ca-enriched iso-topes for medical and physics applications since the 1950s. The 48Ca-depleted“left-over” material from these projects, which is currently stored in the formof 48deplCaCO3, would be suitable for our needs. We are currently making aninventory of all the world’s quantities of Ca solutions that are depleted on 48Caat the level of less than 0.005%.
The first batches (of 4.5 kg in total) of the calcium carbonate depleted in the48Ca isotope (≤ 0.001%) that were produced by EKP have been characterizedwith mass-spectrometry (ICP-MS) and HPGe detectors. The concentrations of238U and 232Th in the powder measured by ICP-MS are below 0.2 ng/g and0.8 ng/g, respectively. However, a γ-spectroscopic analysis of the 48deplCaCO3
powder revealed some specific activity due to 226Ra and its progenies at thelevel of a few hundred mBq/kg. Also, the content of Sr and Ba elements, whichbelong to the same sub-group of chemical elements as Ra, were quite high (Sr
65

= 25 µg/g and Ba = 26 µg/g), and this also indicates the presence of some Raimpurity. Because of this, the 48deplCaCO3 material was subjected to additionalpurification.
At present, there is 32 kg of 48deplCa available at EKP, in Lesnoy, Russia. Ithas less than 0.001% of 48Ca. AMoRE-II needs about 40 kg of 48deplCa. Thesmall shortage could be covered by the anticipated production of 48Ca-depletedCa in the next few years.
7.3 Purification of calcium and molybdenum oxidesand recovery of enriched materials after crystalproduction
The ultimate sensitivity of AMoRE is limited by internal CaMoO4 backgroundsthat are due to impurities in the form of natural radioactive isotopes, such as208Tl from the 232Th chain and 214Bi among the 226Ra decay products in the 238Uchain [116]. Therefore, the removal of uranium, thorium and radium insuresthe removal of other isotopes in these chains and reduces internal backgroundsin the CaMoO4 detectors. One of our approaches has been to utilize chemicalpurification methods to remove impurities from the raw materials used to growthe scintillation crystals.
In the process of making or cutting crystals, scraps (or crystal wastes) of48deplCa100MoO4 crystals are unavoidable. To reduce the project cost one shouldextract separately materials containing calcium and those containing molybde-num from those scraps. Subsequent mixtures of these two materials can be usedto make 48deplCa100MoO4 crystals. We have recently developed technologies torecover and purify calcium and molybdenum from crystal wastes.
In following section, we present the deep purification methods we use for48deplCaCO3 and 100MoO3 and the methods for their recovery from the crystalwastes.
7.4 Deep purification of CaCO3 powder
The CaCO3 purification process uses an inorganic sorbent MDM that is based onmanganese dioxide (MnO2). A chromatographic column used for this purpose ismade of stainless steel. The major steps in this purification process are discussedin the following.
About 500 grams of calcium carbonate powder are placed in a glass beakerand mixed with a calculated amount of dilute nitric acid (65%) until all of theCaCO3 is completely dissolved. The chemical reaction for the dissolution ofcalcium carbonate in nitric acid is
CaCO3 + HNO3pH1.5−−−−→ Ca(NO3)2 + H2O + CO2 (7.1)
After mixing, the solution has a light brown color due to presence of insolubleimpurities as shown in Fig. 7.1(a). Subsequent filtering removes these impurities
66

Figure 7.1: (a) Dissolution of CaCO3 (b) Vacuum filtration (c) Final filtrate.
as shown in Fig. 7.1(b). The resulting solution after filtration is transparentand has a pH=1.5. Figure 7.1(c) shows the final filtrate obtained after vacuumfiltration.
The filtrate is further purified by passing it through a sorption column filledwith a granular MDM sorbent. The volume of the sorbent inside the column is60 cm3. The feed solution is forced through the column by a peristaltic pumpwith a speed of 120 ml/h, as shown in Fig. 7.2. Filtrates after the column purifi-cation are collected and analyzed for concentrations of iron, uranium, thorium,strontium and barium by an ICP-MS system. Figure 7.3 shows a schematicdrawing of the ion-exchange process using an MnO2 resin.
After purification with the MDM sorbent, the solution is neutralized withaqueous ammonia to pH=9.0 and 50 g of ammonium carbonate are added toprecipitate the remaining quantities of impurities in the calcium carbonate. Thereaction of calcium nitrate solution with ammonium carbonate and aqueousammonia precipitates 5% of CaCO3:
Ca(NO3)2 +NH4CO3(5%)+HN4OHpH9−−→ CaCO3(Th,U,Ba..)+NH4NO3 +CO2
The solution is filtered to collect the impure precipitate of CaCO3 on filter paper.The remaining part of ammonium carbonate (680 g) is added to the filtrate
solution until all of the calcium is precipitated. The reaction of the calciumnitrate solution with ammonium carbonate and aqueous ammonia to precipitate95% of CaCO3 is:
Ca(NO3)2 + NH4CO3(95%) + HN4OHpH9−−→ CaCO3(Pure) + NH4NO3 + CO2
The resulting precipitate of calcium carbonate is filtered off, washed on filterpaper with distilled water and collected in a quartz crucible. Figures 7.4(a), (b)and (c) show the precipitation of CaCO3 with subsequent filtration and collectionof precipitates, respectively.
The crucible containing the CaCO3 precipitate is placed in an electric mufflefurnace and heated initially to 100o C for 2 hours to remove water, and then at
67

Figure 7.2: Photographic view of purification of CaCO3 using MnO2 resin.
Figure 7.3: Schematic of purification of CaCO3 by MnO2.
68

Figure 7.4: (a) Precipitation. (b) Vacuum filtration. (c) CaCO3 pure precipitate.
Figure 7.5: (a) Muffle Furnace. (b) CaCO3 calcination in quartz crucible.
69

Table 7.1: ICP-MS results of the analysis of the filtrates after sorbent MDM.Sample Volume
fractionConcentration [ng/g ]
[ml] Fe Sr Ba Th U
Initial solution - 16120 8129 67.2 0.73 20.4Filtrate (1F) 840 122 1400 0.089 0.011 0.04Filtrate (2F) 840 66 565 0.021 0.003 0.025Filtrate (3F) 880 146 171 0.053 0.0004 0.017Filtrate (4F) 1420 359 132 0.023 0.00006 0.039
Table 7.2: Purification results for the MDM sorbent (DF is the decontaminationfactor).
Sample Volumefract.
DF
[ml] Fe Sr Ba Th U
Filtrate(1F) 840 132 6 755 66 510Filtrate(2F) 840 244 14 3200 243 816Filtrate(3F) 880 110 48 1270 1825 1200Filtrate(4F) 1420 45 62 2920 12170 523
450o C for 2 hours for the final calcination of the material. Figure 7.5 shows thecalcination of CaCO3 in the muffle furnace. The final weight of purified CaCO3
is typically ∼440 g, which is ∼88% of the initial weight. This calcium carbonatesample is analyzed for impurities. Table 7.1 shows the ICP-MS analysis resultsfor an initial and final calcium nitrate solution before and after being passedthrough the MnO2-based ion exchange resin.
To quantify the level of purification, we use the decontamination factor, DF,defined as the ratio of initial-to-final specific radioactivity resulting from thechemical separation process. It numerically quantifies the efficiency with whichimpurities are removed from a chemical substance. In our case, this is the factorby which the radioactive contamination level is reduced. Taking Cin and Cf as theconcentration of impurities in the initial and final materials, the decontaminationfactor is DF = Cin/Cf . A purification process that removes impurities will havea decontamination factor greater than one [117].
Table 7.2 lists measured decontamination factors: iron impurities are de-creased by a factor of 100, strontium by factors of 10 to 15, barium by 1,000,thorium by between 100 to 10,000, and uranium by 100 to 1,000. From theresults for barium, which is the closest family element to radium on the periodictable, it can be inferred that the decontamination factor for radium is also quitehigh (at least 2–3 orders of magnitude).
Table 7.3 shows results from a ICP-MS analysis of the purified CaCO3 pow-der. The iron content in the purified product was reduced by approximately anorder of magnitude, and the uranium and thorium content by 2 orders of mag-
70
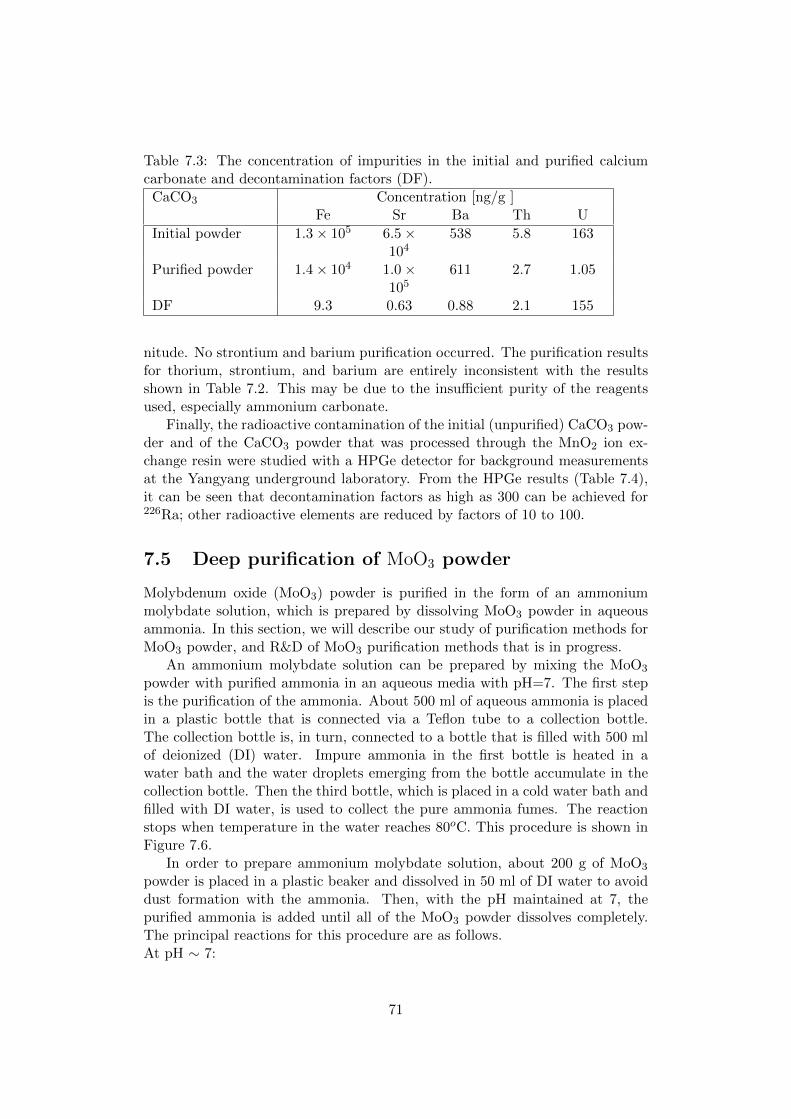
Table 7.3: The concentration of impurities in the initial and purified calciumcarbonate and decontamination factors (DF).
CaCO3 Concentration [ng/g ]Fe Sr Ba Th U
Initial powder 1.3× 10⁵ 6.5×10⁴
538 5.8 163
Purified powder 1.4× 10⁴ 1.0×10⁵
611 2.7 1.05
DF 9.3 0.63 0.88 2.1 155
nitude. No strontium and barium purification occurred. The purification resultsfor thorium, strontium, and barium are entirely inconsistent with the resultsshown in Table 7.2. This may be due to the insufficient purity of the reagentsused, especially ammonium carbonate.
Finally, the radioactive contamination of the initial (unpurified) CaCO3 pow-der and of the CaCO3 powder that was processed through the MnO2 ion ex-change resin were studied with a HPGe detector for background measurementsat the Yangyang underground laboratory. From the HPGe results (Table 7.4),it can be seen that decontamination factors as high as 300 can be achieved for226Ra; other radioactive elements are reduced by factors of 10 to 100.
7.5 Deep purification of MoO3 powder
Molybdenum oxide (MoO3) powder is purified in the form of an ammoniummolybdate solution, which is prepared by dissolving MoO3 powder in aqueousammonia. In this section, we will describe our study of purification methods forMoO3 powder, and R&D of MoO3 purification methods that is in progress.
An ammonium molybdate solution can be prepared by mixing the MoO3
powder with purified ammonia in an aqueous media with pH=7. The first stepis the purification of the ammonia. About 500 ml of aqueous ammonia is placedin a plastic bottle that is connected via a Teflon tube to a collection bottle.The collection bottle is, in turn, connected to a bottle that is filled with 500 mlof deionized (DI) water. Impure ammonia in the first bottle is heated in awater bath and the water droplets emerging from the bottle accumulate in thecollection bottle. Then the third bottle, which is placed in a cold water bath andfilled with DI water, is used to collect the pure ammonia fumes. The reactionstops when temperature in the water reaches 80oC. This procedure is shown inFigure 7.6.
In order to prepare ammonium molybdate solution, about 200 g of MoO3
powder is placed in a plastic beaker and dissolved in 50 ml of DI water to avoiddust formation with the ammonia. Then, with the pH maintained at 7, thepurified ammonia is added until all of the MoO3 powder dissolves completely.The principal reactions for this procedure are as follows.At pH ∼ 7:
71

Table 7.4: HPGe results. “Before” (“After”) stands for before (after) purificationof CaCO3 powder.
PeakEnergy
Rate[counts/day]
Rate[counts/day]
Chain Element [keV] (Before) (After) DF40K 40K 1460.83 164.9 9.31 17.61238U 226Ra 186.2 2246.9 6.97 322.36
214Pb 295.22 4592 41.48 110.7351.94 8387.9 133.99 62.59
214Bi 609.31 6579.7 132.05 42.821120.28 1526.4 17.6 86.721764.51 1323.8 31.14 42.51
12.8 103.425.94 222.86
232Th 228Ac 911.2 151.2 3.54 42.71964.77 63.2 2.55 24.7968.92 76.2 4.54 16.78
224Ra 240.99 17.3212Pb 238.63 410.1 5.9 69.5212Bi 727.33 51.8 0.46 112.6208Tl 2614.53 45.4 4.51 10.06
583.14 180.1 2.74 65.72510.77 2.06 87.42
Figure 7.6: The procedure for purification of aqueous ammonia.
72

Figure 7.7: The recrystallization method procedure.
MoO3 + NH3 + H2O→ (NH4)6Mo7O24(solid)At pH above 7 (8 or 9):(NH4)6Mo7O24 + NH3 + H2O→ (NH4)2MoO4
Th+4,Fe+3,Pb+2 → Th(OH)4,Fe(OH)3,Pb(OH)2. The purification of the
MoO3 powder starts with the solution of (NH4)2MoO4. We have studied thefollowing purification methods:
• Recrystallization
• Co-precipitation
• Sedimentation
• Column chromatography.
In the recrystallization method, we have the highest purity product, but a lowyield. The purified molybdenum is in the form of ammonium hepta-molybdate(NH4)6Mo7O24.4H2O in aqueous solution. In this process, ammonium molyb-date is continuously heated in a teflon evaporation dish to remove the aqueousmedia and purified crystals are collected on filter paper (see Fig. 7.7). In thismethod, the chemical reaction is:
(NH4)2MoO4 → 8NH3 ↑ +(NH4)6Mo7O24.4H2O(Crystals).
Co-precipitation is an impurity selective method. Impurities of radium areseparated in the form of calcium molybdate using calcium chloride (CaCl2) inaqueous solution. In this method, we have to prepare pure calcium chloride usingthe reaction:
CaCO3 + HCl→ CaCl2 + H2O + CO2.
The main reaction in this method is
(NH4)2MoO4 + CaCl2 → CaMoO4 + 2NH4Cl.
About 1% of the calcium molybdate crystals are collected on filter paper, whilethe filtrate solution contains purified ammonium molybdate. The procedure forthe co-precipitation method is presented in Fig. 7.8.
In the sedimentation process we have a comparatively high product yield.Molybdate is collected as ammonium tetramolybdate (NH4)2 ×Mo4O13 froman aqueous solution of ammonium molybdate. The theoretical yield for thisprocess is 96% to 97%. The procedure is (see Fig. 7.9)
73

Figure 7.8: The co-precipitation method procedure.
• 200 ml of ammonium molybdate is placed in a plastic beaker;
• 100 ml of DI water is mixed with 100 ml of HCl;
• this solution is added to ammonium molybdate solution drop wise untilthe pH of the solution reaches 1;
• the precipitates are filtered off, collected on filter paper and dried.
The principal reactions for this method are:
4(NH4)6Mo7O24+6HCl→ 6NH4Cl+(NH4)2Mo4O13(NH4)2Mo4O13+HCl→ MoO3+H2O+NH4Cl.
The column-chromatography method is based on the different behavior ofcomponents in their mixtures with two phases, one stationary and the othermobile. Physical or chemical absorption takes place on the phase boundary.An initial ammonium molybdate solution has anions, Mo8O24
4−, Mo8O244− and
Mo8O42−, and cations, NH4+, K, Pb2+, (Th)n+, (U)n+, etc. We use the Am-
berlite IR-120 H-form cation exchange resin. A purified ammonium molybdatesolution is produced. The column containing the resin is shown in Fig. 7.10. Inthis study, the diameter and height of column are 25 mm and 250 mm, respec-tively.
74

Figure 7.9: The sedimentation method procedure.
Figure 7.10: The column chromatography method. The resin is inside the cylin-der.
75

7.6 Calcium and molybdenum recovery from CaMoO4
crystals
In the procedure to recover calcium and molybdenum from 48deplCa100MoO4
crystals, we first have to make a solution by means of a strong acid, either HClor HNO3.
7.6.1 Decomposition of CaMoO4 crystals with 65% HNO3
The CaMoO4 crystal is first crushed into small pieces using a pestle and mortar.Then the crushed CaMoO4 is milled into a fine powder using a pulverizing millingmachine. After this, milled powder is sieved to select diameters between 0.10 mmand 0.25 mm using a non-metallic sieve.
In the second step, about 300 g of the CaMoO4 powder is placed inside aplastic bottle with 400 ml of 65% HNO3. The bottle is kept in a water bath andheated up to 70C− 80C. This mixture is constantly stirred with a high-speedmechanical stirrer for 6 hours. During this procedure a thick, yellow-coloredmolybdic acid is formed via the reaction
CaMoO4 + 2HNO3 → H2MoO4(solid) + Ca(NO3)2(liq).
In this reaction, all of the ammonium molybdate is in the molybdic acid formand calcium nitrate is in the solution form. In this way, we recover ammoniummolybdate and calcium carbonate separately. The above solution is filteredunder vacuum. The filtered cake is washed with a dilute solution of nitric acid.After filtration we obtain molybdic acid as a residue on the filter paper andcalcium nitrate as the filtrate.
In the third step, the molybdic acid is dissolved in a 25% aqueous ammo-nium hydroxide solution until a transparent solution is obtained. The solutionis then filtered under vacuum. The undissolved CaMoO4 remains as a residueon filter paper and is collected in a quartz crucible and the filtrate solution ispoured into a clean beaker. The solution in the beaker is neutralized with nitricacid up to pH=1.65–1.70. While this happens, a precipitate of fine polyammo-nium molybdate (PAM) crystals is formed. This precipitate solution is filteredunder vacuum and the crystals are washed with a dilute ammonium nitrate so-lution with pH=1.7. The PAM residue on the filter paper is collected in a cleanbeaker and the filtrate solution is discarded. The PAM is again dissolved inaqueous ammonia until a transparent solution is obtained. Some of this solutionis evaporated, leaving crystals of ammonium molybdate (AM). These crystalsare collected and the remaining solution is evaporated, producing more crystals(see Fig. 7.11).
In the fourth step, the calcium nitrate solution is evaporated to remove ex-cess nitric acid. After evaporation a wet salt of calcium nitrate is obtained andthe obtained salt is dissolved in water until a transparent solution is obtained.This solution is neutralized with aqueous ammonia to pH=8. During this neu-tralization, a white precipitate of CaMoO4 is formed. The precipitated solutionis filtered under vacuum and the residue, which is collected on filter paper, is
76

Figure 7.11: Ammonium molybdate obtained from the recovery of CaMoO4
crystals.
Figure 7.12: Pure CaCO3 on filter paper (left), the purified CaCO3 is collectedin the quartz crucible (middle) and calcinated CaCO3 in a furnace (right).
undissolved CaMoO4 that is collected in a quartz crucible and the filtrate is col-lected in clean beaker. In the filtrate solution, enough ammonium carbonate isadded so that 5% of the calcium carbonate precipitates out. During this proce-dure, aqueous ammonia is added to maintain pH=9. This solution is constantlystirred with a mechanical stirrer. The above precipitate solution is filtered undervacuum. The precipitate on the filter paper is calcium carbonate that contains alot of impurities. This is discarded and the filtrate solution is collected in a cleanbeaker. In the filtrate solution we again add ammonium carbonate to precipitatethe remaining 95% of the calcium carbonate. During this procedure, liquid NH3
is added to maintain the pH at 9 and the solution is constantly stirred by amechanical stirrer. The precipitate solution is filtered under vacuum and herethe residue in the filter paper is purified CaCO3 and the filtrate is waste. Thepurified CaCO3 is collected in a quartz crucible and calciniated at 4500C for twohours inside a closed furnace (see Fig. 7.12).
77

Figure 7.13: The procedure to obtain crystals of molybdate; CaMoO4 solution(left), neutralization with liquid NH3, vacuum filtration, and crystals of molyb-date (right).
7.6.2 Decomposition of CaMoO4 crystal material with 36% HCl
In the first step of Mo recovery and purification, about 300 g of CaMoO4 powderis placed in a glass beaker, and 775 ml of HCl and 250 ml of DI water areadded. The mixture is heated for 30 minutes while constantly being stirred by amagnetic stirrer until a transparent solution is obtained. The main reaction forthis procedure is:
CaMoO4 + 6HCl→ H2MoO2Cl4 + CaCl2 + 2H2O.
The CaCl2 precipitate is filtered off. The remaining solution is neutralizedwith liquid NH3 to pH=1–1.5. During the neutralization, a PAM precipitateis formed. The precipitated solution is then passed through a vacuum and thePAM residue is collected in one beaker and the filtrate in another. The residueis washed with a dilute ammonium chloride solution with pH=1.7. From thePAM, we separate AM and obtain calcium carbonate from the filtrated calciumchloride.
In the second step, the PAM is dissolved in liquid ammonia until a transpar-ent solution is obtained. The solution is then vacuum filtered. The undissolvedCaMoO4 is collected as a residue on filter paper and collected in a quartz cruciblewhile the filtrate is collected in a clean beaker. The obtained solution is evap-orated to obtain ammonium molybdate crystals. The initially formed crystalsare collected and the remaining solution is evaporated to obtain the remaining,purified crystals. The procedure is illustrated in Fig. 7.13.
In the third step, we obtain calcium carbonate from the calcium chloride so-lution as shown in Fig. 7.14. The neutralization of the calcium chloride solutionis done with liquid NH3 at pH=8. A precipitate of dissolved CaMoO4 is formed.The precipitate solution is vacuum filtered. The residue on the filter paper isundissolved CaMoO4 that is collected in the same beaker and the filtrate solutionis collected in a clean beaker. In the filtrate solution, we add enough ammoniumcarbonate so that 5% of the calcium carbonate precipitates out. During thisprocedure aqueous ammonia is added to maintain pH=9. This solution is con-stantly stirred by a mechanical stirrer. The above precipitate solution is vacuumfiltered. The precipitate on the filter paper is calcium carbonate that containslots of impurities and is discarded, while the filtrate solution is collected in a
78

Figure 7.14: Calcium carbonate production: neutralization with liquid NH3
(left), filtration, and purified product (right).
clean beaker. In the filtrate solution, we again add ammonium carbonate toprecipitate the remaining 95% of the calcium carbonate. During this procedure,liquid NH3 is added to maintain pH=9 and the solution is constantly stirred bya mechanical stirrer. The precipitate solution is vacuum filtered. The residueon the filter paper is purified CaCO3 and the filtrate is discarded. The purifiedCaCO3 is collected in a quartz crucible and is calcinated at 450 C for two hoursinside a closed furnace.
79
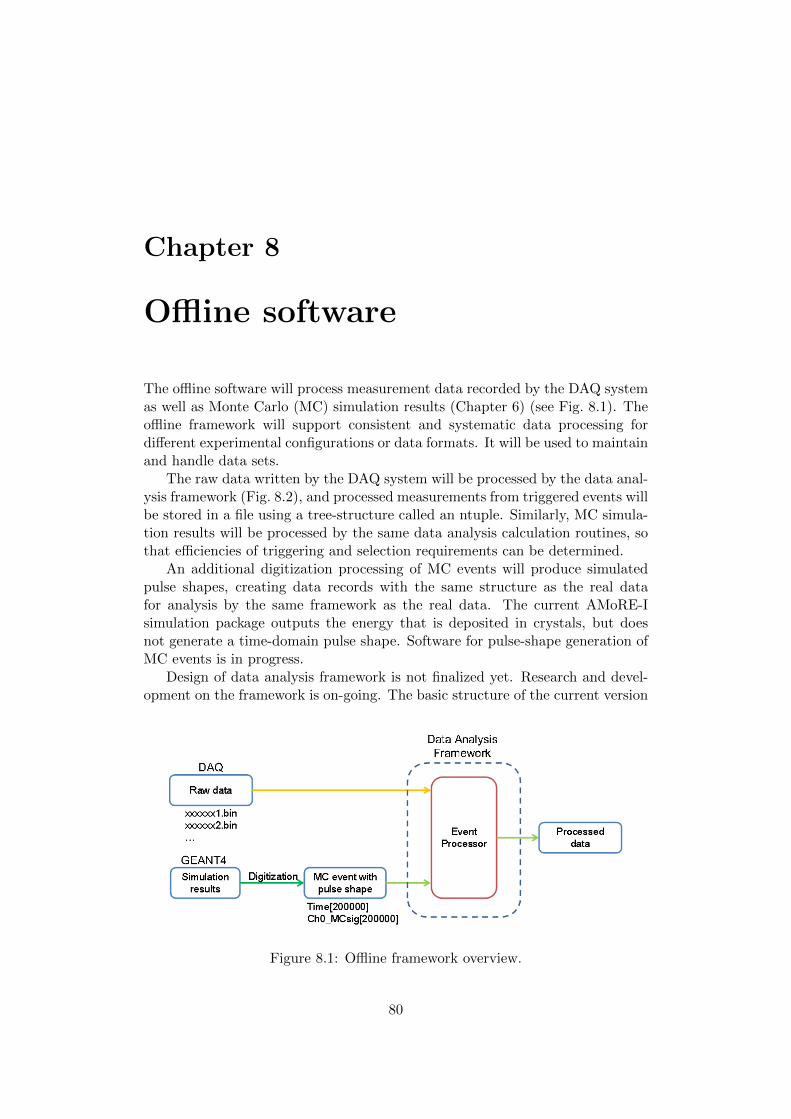
Chapter 8
Offline software
The offline software will process measurement data recorded by the DAQ systemas well as Monte Carlo (MC) simulation results (Chapter 6) (see Fig. 8.1). Theoffline framework will support consistent and systematic data processing fordifferent experimental configurations or data formats. It will be used to maintainand handle data sets.
The raw data written by the DAQ system will be processed by the data anal-ysis framework (Fig. 8.2), and processed measurements from triggered events willbe stored in a file using a tree-structure called an ntuple. Similarly, MC simula-tion results will be processed by the same data analysis calculation routines, sothat efficiencies of triggering and selection requirements can be determined.
An additional digitization processing of MC events will produce simulatedpulse shapes, creating data records with the same structure as the real datafor analysis by the same framework as the real data. The current AMoRE-Isimulation package outputs the energy that is deposited in crystals, but doesnot generate a time-domain pulse shape. Software for pulse-shape generation ofMC events is in progress.
Design of data analysis framework is not finalized yet. Research and devel-opment on the framework is on-going. The basic structure of the current version
Figure 8.1: Offline framework overview.
80

Figure 8.2: Data analysis framework scheme.
of the framework is shown in Figure 8.1.
8.1 Environment
The data analysis framework is being developmed on a linux server, ScientificLinux 6.3. The measured data and the simulation results are stored in thesame system at the Center for Underground Physics, IBS. The data analysisframework software is written in C/C++ and uses ROOT libraries (Ver. 5.24).The framework software will be executed by ROOT scripts or binary executablefiles.
8.2 Modules
The main processor of the data analysis framework, EventProcessor, consists oftwo subclasses, EventReader and EventParameter.EventReader is a routine to read events from files. When the DAQ data format ismodified, the read-out routine in the framework should be updated accordingly.Depending on the data format version, a proper read-out routine can be used.Similarly, a read-out routine for MC simulation data will be added as a module.EventParameter is a routine to calculate variables of each event such as, baseline,pulse height, rise time, etc. User-defined functions or calculation algorithm canbe added as new modules.
More analysis routines, such as optimal filtering, event selection requirementswill be implemented in the future.
81
Chapter 9
Time, Schedule
9.1 Schedules
The AMoRE project will start with the preparation of the 1st phase experimentand R&D for the 2nd phase. The 1st phase experiment will be performed alsoin two steps: first with 1.5 kg of CaMoO4 crystals and later with 5 kg of thecrystals. The 5 kg 1st phase will start at the end of 2016 and will run for aboutthree years.
The R&D for the 2nd phase includes cryogenic techniques, the development oflight sensors, and the reduction of background levels. After three years of R&D,the mass production of crystals and the design of the detector configuration forthe 2nd phase will begin. The setup for the 2nd phase will be ready by the endof the 1st phase data-taking. The detailed schedule for each step is given in theGantt plot below. The 2nd phase of the experiment will begin in early 2020 with70 kg of CaMoO4, and will be upgraded to 200 kg in the following year.
82

Figure 9.1: The time schedule of AMoRE project.
83

Bibliography
[1] R. N. Mohapatra, S. Antusch, K. S. Babu, et al., Theory of neutrinos: Awhite paper, Rep. on Prog. Phys. 70 (2007) 1757.
[2] C. Giunti, C. W. Kim, Fundamentals of neutrino physics and astrophysics,Oxford Press (2009).
[3] J. D. Vergados, Neutrinoless double β decay from a modern perspective,Phys. Rep. 361 (2002) 1.
[4] G. L. Fogli, Observables sensitive to absolute neutrino masses: A reap-praisal after wmap 3-year and first MINOS results, Phys. Rev. D 75 (2007)053001.
[5] F. T. A. III, S. R. Elliott, J. Engel, Double beta decay, Rev. Mod. Phys.80 (2008) 481.
[6] W. Rodejohann, Neutrino-less double beta decay and particle physics,, Int.J. Mod. Phys. E 20 (2011) 1833.
[7] J. D. Vergados, H. Ejiri, F. Simkovic, Rep. Prog. Phys. 75 (2012) 106301.
[8] J. Barea, et al., Limits on neutrino masses from neutrinoless double-βdecay, Phys. Rev. Lett. 109 (2012) 042501.
[9] K. Alfonso, et al., Search for neutrinoless double beta deacy of 130Te withCUORE-0, Phys. Rev. Lett. 115 102502.
[10] M. Auger, et al., Search for neutrinoless double-beta decay in 136Xe withEXO-200, Phys. Rev. Lett. 109 (2012) 032505.
[11] M. Agostini, et al., Limit on neutrinoless double beta decay of 76Ge byGERDA, Phys. Procedia: 13th International Conference on Topics in As-troparticle and Underground Physics 61 (2015) 828.
[12] A. Gando, et al., Limit on neutrinoless ββ Decay of 136Xe from the firstphase of KamLAND-Zen and comparison with the positive claim in 76Ge,Phys. Rev. Lett. 110 (2013) 062502.
[13] A. S. Barabash, V. B. Brudanin (NEMO Collaboration), Investigation ofdouble-beta decay with the NEMO-3 detector, Phys. At. Nucl. 74 (2011)312.
84

[14] A. Faessler, et al., Nuclear matrix elements for neutrinoless double-betadecay and double-electron capture, J. Phys. G: Nucl. Part. Phys. 39 (2012)124006.
[15] S. M. Bilenky, C. Giunti, Neutrinoless double-beta decay. a brief review,Mod. Phys. Lett. A 27 (2012) 1230015.
[16] F. F. Deppisch, M. Hirsch, H. Pas, Neutrinoless double-beta decay andphysics beyond the standard model, J. Phys. G: Nucl. Part. Phys. 39 (2012)124007.
[17] E. Fireman, Artificial radioactive substances, Phys. Rev. 74 (1948) 1238.
[18] O. K. Manuel, Geochemical measurements of double-beta decay, J. Phys.G: Nucl. Part. Phys. 17 (1991) 5221.
[19] S. R. Elliott, A. A. Hahn, M. K. Moe, Direct evidence for two-neutrinodouble-beta decay in 82Se, Phys. Rev. Lett. 59 (1987) 2020.
[20] V. I. Tretyak, Y. G. Zdesenko, Atom. Data and Nucl. Data Tables 80(2002) 83.
[21] A. S. Barabash, Precise half-life values for two-neutrino double-β decay,Phys. Rev. C 81 (2010) 035501.
[22] R. Saakyan, Two-neutrino double-beta decay, Ann. Rev. Nucl. Part. Sci.63 (2013) 503.
[23] Y. M. Gavrilyuk, A. M. Gangapshev, V. V. Kazalov, V. V. Kuzminov,Indications of 2ν2K capture in 78Kr, Phys. Rev. C 87 (2013) 035501.
[24] A. P. Meshik, C. M. Hohenberg, O. V. Pravdivtseva, Y. S. Kapusta, Weakdecay of 130Ba and 132Ba: Geochemical measurements, Phys. Rev. C 64(2001) 935205.
[25] M. Pujol, B. Marty, P. Burnard, P. Philippot, Xenon in archean barite:Weak decay of 130Ba, mass-dependent isotopic fractionation and implica-tion for barite formation, Geochem. Cosmochem. Acta 73 (2009) 6834.
[26] S. R. Elliott, Recent progress in double beta decay, Mod. Phys. Lett. A 27(2012) 123009.
[27] A. Giuliani, A. Poves, Advances in High Energy Physics 2012 (012) 857016.
[28] O. Cremonesi, M. Pavan, Challenges in double beta decay, Advances inHigh Energy Physics 2014 (2014) 951432.
[29] J. B. Albert, et al., Search for Majorana neutrinos with the first two yearsof EXO-200 data, Nature 510 (2014) 229.
[30] M. Agostini, et al., Results on neutrinoless double-β decay of 76Ge fromphase i of the GERDA experiment, Phys. Rev. Lett. 111 (2013) 122503.
85

[31] K. Asakura, et al., Results from KamLAND-Zen, arXiv: 1409.0077v1.
[32] R. Arnold, et al., Search for neutrinoless double-beta decay of 100Mo withthe NEMO-3 detector, Phys. Rev. D 89 (2014) 111101(R).
[33] H. V. Klapdor-Kleingrothaus, I. V. Krivosheina, The evidence for the ob-servation of 0νββ decay: the identification of 0νββ events from the fullspectra, Mod. Phys. Lett. A 21 (2006) 1547.
[34] H. V. Klapdor-Kleingrothaus, et al., Latest results from the Heidelberg-Moscow double beta decay experiment, Eur. Phys. J. A 12 (2001) 147.
[35] H. V. Klapdor-Kleingrothaus, et al., Search for neutrinoless double betadecay with enriched 76Ge in Gran Sasso 1990-2003, Phys. Lett. B 586(2004) 198.
[36] H. V. Klapdor-Kleingrothaus, et al., Data acquisition and analysis of the76Ge double beta experiment in Gran Sasso 19902003, Nucl. Instr. Meth.A 522 (2004) 371.
[37] C. E. Aalseth, et al., Comment on evidence for neutrinoless double betadecay, Mod. Phys. Lett. A 17 (2002) 1475.
[38] F. Feruglio, A. Strumia, F. Vissani, Neutrino oscillations and signals in βand 0ν2β experiments, Nucl. Phys. B 637 (2002) 345.
[39] Y. G. Zdesenko, F. A. Danevich, V. I. Tretyak, Has neutrinoless double βdecay of 76Ge been really observed?, Phys. Lett. B 546 (2002) 206.
[40] M. Wang, et al., The AME2012 atomic mass evaluation (II). Tables, graphsand references, Chin. Phys. C 36 (2012) 1603.
[41] M. Berglund, M. E. Wieser, Isotopic compositions of the elements 2009(IUPAC technical report), Pure Appl. Chem. 83 (2011) 397.
[42] S. Umehara, et al., Neutrino-less double-beta decay of Ca-48 studied byCa F(2)(Eu) scintillators, Phys. Rev. C 78 (2008) 058501.
[43] C. E. Aalseth, et al., The IGEX 76Ge neutrinoless double-beta decay exper-iment: prospects for next generation experiments, Phys. Rev. D 65 (2002)092007.
[44] F. A. Danevich, et al., Search for 2β decay of cadmium and tungstenisotopes: Final results from the Solotvina experiment, Phys. Rev. C 68(2003) 035501.
[45] T. Bernatowicz, et al., Precise determination of relative and absolute ββ-decay rates of 128Te and 130Te, Phys. Rev. C 47 (1993) 806.
[46] J. Argyriades, et al., Measurement of the double-β decay half-life of 150Ndand search for neutrinoless decay modes with the NEMO-3 detector, Phys.Rev. C 80 (2009) 032501(R).
86

[47] A. Giuliani, Searches for neutrinoless double beta decay, Acta PhysicaPolonica B 41 (2010) 1447.
[48] A. S. Barabash, The new generation of double beta decay experiments:are there any limitations?, J. Phys. G: Nucl. Part. Phys. 39 (2012) 085103.
[49] J. J. Gomez-Cadenas, et al., The search for neutrinoless double beta decay,Riv. Nuovo Cim. 35 (2012) 29.
[50] B. Schwingenheuer, Status and prospects of searches for neutrinoless dou-ble beta decay, Ann. Phys. 525 (2013) 269.
[51] S. M. Bilenky, C. Giunti, Neutrinoless double-beta decay: A probe ofphysics beyond the standard model, Int. J. Mod. Phys. A 30 (2015)1530001.
[52] C. Arnaboldi, et al., CUORE: a cryogenic underground observatory forrare events, Nucl. Instr. Meth. A 518 (2004) 775.
[53] R. Arnold, et al., Probing new physics models of neutrinoless double betadecay with SuperNEMO, Eur. Phys. J. C 70 (2010) 927.
[54] J. W. Beeman, et al., A next generation neutrinoless double beta decayexperiment based on ZnMoO4 scintillating bolometers, Phys. Lett. B 710(2012) 318.
[55] V. Alvarez, et al., NEXT-100 technical design report (TDR). Executivesummary, JINST 7 (2012) T06001.
[56] J. J. Gomez-Cadenas, et al., Present status and future perspectives of theNEXT experiment, Advances in High Energy Physics 2014 (2014) 907067.
[57] K. Graham (EXO Collaboration), The EXO search for neutrinoless doublebeta decay, International Workshop on Double Beta Decay and Under-ground Science (2014).
[58] K. Ishidoshiro (KamLAND Collaboration), KamLAND-Zen, InternationalWorkshop on Double Beta Decay and Underground Science DBD2014(2014).
[59] M. Heisel (GERDA Collaboration), Upgrades for GERDA Phase II, In-ternational Workshop on Double Beta Decay and Underground ScienceDBD2014 (2014).
[60] N. Abgrall (Majorana Collaboration), The MAJORANA Demonstratorneutrinoless double-beta decay experiment., Advances in High EnergyPhysics 2014 (2014) 36543.
[61] N. M. Bongrand, Latest results of the NEMO experiment and status ofSuperNEMO, Proceedings of the TAUP 2013 (2013) 33.
87

[62] P. G. Jones (SNO+ Collaboration), The SNO+ experiment, InternationalWorkshop on Double Beta Decay and Underground Science DBD2014(2014).
[63] S. Rahaman, et al., Q value of the 76Ge and 100Mo double-beta decay,Phys. Lett. B 662 (2008) 111.
[64] V. A. Rodin, A. Faessler, F. Simkovic, P. Vogel, Assessment of uncer-tainties in QRPA 0νββ-decay nuclear matrix elements, Nucl. Phys. A 766(2006) 107.
[65] V. A. Rodin, A. Faessler, F. Simkovic, P. Vogel, Assessment of uncer-tainties in QRPA 0νββ-decay nuclear matrix elements, Nucl. Phys. A 793(2007) 213.
[66] M. Kortelainen, J. Suhonen, Nuclear matrix elements of 0νββ decay withimproved short-range correlations, Phys. Rev. C 76 (2007) 024315.
[67] F. Simkovic, A. Faessler, V. Rodin, P. Vogel, J. Engel, Anatomy of the0νββ nuclear matrix elements, Phys. Rev. C 77 (2008) 045503.
[68] A. Faessler, et al., Overconstrained estimates of neutrinoless double betadecay within the QRPA, J. Phys. G: Nucl. Part. Phys. 35 (2008) 075104.
[69] J. Barea, F. Iachello, Neutrinoless double-β decay in the microscopic in-teracting boson model, Phys. Rev. C 79 (2009) 044301.
[70] J. Kotila, J. Suhonen, D. S. Delion, Description of the two-neutrino ββdecay of 100Mo by pnMAVA, J. Phys. G 37 (2010) 0015101.
[71] P. K. Rath, et al., Uncertainties in nuclear transition matrix elementsfor neutrinoless ββ decay within the projected-Hartree-Fock-Bogoliubovmodel, Phys. Rev. C 82 (2010) 064310.
[72] T. R. Rodriguez, G. Martinez-Pinedo, Energy density functional study ofnuclear matrix elements for neutrinoless ββ-decay, Phys. Rev. Lett. 105(2010) 252503.
[73] A. S. Barabash, et al., Enriched Zn100MoO4 scintillating bolometers tosearch for 0νββ decay of 100Mo with the LUMINEU experiment, Eur.Phys. J. C 74 (2014) 3133.
[74] R. Arnold, et al., First results of the search for neutrinoless double-betadecay with the NEMO 3 detector, Phys. Rev. Lett. 95 (2005) 182302.
[75] H. Ejiri, et al., Limits on the majorana neutrino mass and right-handedweak currents by neutrinoless double β decay of 100Mo, Phys. Rev. C 63(2001) 065501.
[76] L. Gironi, Performance of ZnMoO4 crystal as cryogenic scintillatingbolometer to search for double beta decay of molybdenum, J. Instrum.5 (2010) P11007.
88

[77] J. W. Beeman, et al., ZnMoO4: A promising bolometer for neutrinolessdouble beta decay searches, Astropart. Phys. 35 (2012) 813.
[78] J. W. Beeman, et al., An improved ZnMoO4 scintillating bolometer for thesearch for neutrinoless double beta decay of 100Mo, J. Low Temp. Phys.167 (2012) 1021.
[79] J. W. Beeman, et al., Performances of a large mass ZnMoO4 scintillatingbolometer for a next generation 0νββ experiment, Eur. Phys. J. C 72(2012) 2142.
[80] D. M. Chernyak, et al., Optical, luminescence and thermal properties ofradiopure ZnMoO4 crystals used in scintillating bolometers for double betadecay search, Nucl. Instr. Meth. A 729 (2013) 856.
[81] L. Berge, et al., Purification of molybdenum, growth and characterizationof medium volume ZnMoO4 crystals for the LUMINEU program, JINST9 (2014) 06004.
[82] M. V. Korzhik, et al., CaMoO4 scintillation crystal for the search of 100Modouble beta decay, IEEE Trans. Nucl. Sci. 52 (2005) 1131.
[83] A. N. Annenkov, et al., Development of CaMoO4 crystal scintillators fora double beta decay experiment with 100Mo , Nucl. Instr. Meth. A 584(2008) 334.
[84] S. J. Lee, et al., The development of a cryogenic detector with CaMoO4
crystals for neutrinoless double beta decay search, Astropart. Phys. 34(2011) 732.
[85] J. H. So, et al., A study of CaMoO4 crystals for the AMoRE experiment,Nucl. Sci. Symp. (2012) 1987.
[86] V. B. Mikhailik, H. Kraus, Cryogenic scintillators in searches for extremelyrare events, J. Phys. D: Appl. Phys. 39 (2006) 1181.
[87] F. A. Danevich, et al., Feasibility study of PbWO4 and PbMoO4 crystalscintillators for cryogenic rare events experiments, Nucl. Instr. Meth. A622 (2010) 608.
[88] O. Barinova, First test of Li2MoO4 crystal as a cryogenic scintillatingbolometer, Nucl. Instr. Meth. A 613 (2010) 54.
[89] L. Cardani, et al., Development of a Li2MoO4 scintillating bolometer forlow background physics, JINST 8 (2013) P10002.
[90] T. B. Bekker, et al., Aboveground test of an advanced Li2MoO4 scintil-lating bolometer to search for neutrinoless double beta decay of 100Mo,Astropart. Phys. 72 (2013) 38.
[91] H. J. Kim, A search for the 0-neutrino double beta decay with the CaMoO4
scintillation crystal, Proc. New Views in Particle Physics (Vietnam) (2004).
89
[92] O. Polischuk, et al., Investigation of double beta decay of 116Cd with thehelp of enriched 116CdWO4 crystal scintillators, AIP Conf. Proc. 1686(2015) 020017.
[93] M. V. Korzhik, et al., Large volume CaMoO4 scintillation crystals, IEEETrans. Nucl. Sci. 55 (2008) 1473.
[94] H. J. Kim, et al., Neutrino-less double beta decay experiment usingCa100MoO4 scintillation crystals, IEEE Trans. Nucl. Sci. 57 (2010) 1475.
[95] J. H. So, et al., Scintillation properties and internal background studyof 40Ca100MoO4 crystal scintillators for neutrino-less double beta decaysearch, IEEE Trans. Nucl. Sci. 59 (2012) 2214.
[96] F. Simkovic, A. Faessler, H. Muther, V. Rodin, M. Stauf, Anatomy of the0νββ nuclear matrix elements, Phys. Rev. C 79 (2009) 055501.
[97] K. Nassau, A. M. Broyer, Application of czochralski crystal-pulling tech-nique to high-melting oxides, J. Am. Ceram. Soc. 45 (1962) 474.
[98] M. Solskii, D. Y. Sugak, M. M. Vakiv, Growing large-size complex-oxidesingle crystals by the czochralski technique for electronic devices, ActaPhysica Polonica. 124 (2013) 314.
[99] F. A. Danevich, A. S. Georgadze, V. V. Kobychev, V. M. Mokina, S. S.Nagorny, D. V. Poda, R. B. Podviynuk, V. I. Tretyak, S. S. Yurchenko,Measurements of scintillation properties and radioactive contamination ofCaMoO4 crystal scintillators for dark matter experiments. LPD technicalreport 01/2007, Tech. rep., INR NAS of Ukraine (06 Feb 2007).
[100] A. Senyshyn, H. Kraus, V. B. Mikhailik, L. Vasilenkko, M. Knapp, Ther-mal properties of CaMoO4: Lattice dynamics and synchrotron powderdiffraction studies, Phys. Rev. B 73 (2006) 014104.
[101] H. S. Lee, et al., First limit on WIMP cross section with low backgroundCsI(Tl) crystal detector, Phys. Lett. B 633 (2006) 201.
[102] H. S. Lee, et al., Limits on interactions between weakly interacting massiveparticles and nucleons obtained with CsI(Tl) crystal detectors, Phys. Rev.Lett. 99 (2007) 091301.
[103] J. T. M. de Hass, P. Dorenbos, C. W. E. van Eijk, Measuring the absolutelight yield of scintillators, Nucl. Instr. Meth. A 537 (2005) 97.
[104] V. B. Mikhailik, et al., Temperature dependence of CaMoO4 scintillationproperties, Nucl. Instr. Meth. A 583 (2007) 350.
[105] in: C. Enss (Ed.), Cryogenic Particle Detection, Springer, 2005.
[106] A. Fleischmann, C. Enss, G. M. Seidel, Metallic magnetic calorimeters,Top. Appl. Phys. 99 (2005) 151.
90
[107] A. Fleischmann, Metallic magnetic calorimeters for atomic, molecular andparticle physics, Tech. rep., Shanghai, China (11 2014).
[108] P. C. Ranitzsch, et al., Development of cryogenic alpha spectrometers usingmetallic magnetic calorimeters, Nucl. Instr. Meth. A 652 (2011) 299.
[109] W. S. Yoon, et al., Nucl. Instr. Meth. A 784 (2014) 143.
[110] G. B. Kim, et al., A CaMoO4 crystal low yemperature detector for theAMoRE neutrinoless double beta decay search, Advances in High EnergyPhysics 2014 (2014) 817530.
[111] H. J. Lee, et al., Development of a scintillating light detector for a cryogenicrare-event-search experiment, Nucl. Instr. Meth. A 784 (2014) 508.
[112] S. Agostinelli, et al., Geant4 – a simulation toolkit, Nucl. Instr. Meth. A506 (2003) 250.
[113] J. Allison, et al., Geant4 developments and applications, IEEE Trans. Nucl.Sci. 53 (2006) 270.
[114] D. Mei, A. Hime, Muon-induced background study for underground labo-ratories, Phys. Rev. D 73 (2006) 053004.
[115] D. E. Groom, N. V. Mokhov, S. I. Striganov, Muon stopping power andrange tables 10 MeV-100 TeV, At. Data Nucl. Data Tables 78 (2001) 183.
[116] N. Khanbekov, V. V. Alenkov, A. A. Burenkov, O. A. Buzanov, V. N.Kornoukhov, Data analysis of the internal background measurements of40Ca100MoO4 scintillation crystals, Nucl. Phys. Atom. Energy 14 (2013)199.
[117] V. Kumar, R. Goel, R. Chawla, M. Silambarasan, R. K. Sharma, Chemical,biological, radiological, and nuclear decontamination: Recent trends andfuture perspectives, J. Pharm. Bioallied Sci. 2 (2010) 220.
91