technical documentation overview 1. healthy aging
TRANSCRIPT

1
TECHNICAL DOCUMENTATION Overview This report contains details about the development of the 2021 Connecticut Healthy Aging Data report. This includes technical definitions, data sources, years of data used, and definitions of the geographic units employed for various indicators. In addition, we describe the statistical methods used to estimate indicators derived from micro-level data. Our general approach is hierarchical reporting. We report indicators at the smallest, most local level possible (i.e., neighborhood, zip code, or individual community) when data allow, and report in larger geographic units (i.e., county) when necessary. 1. Healthy Aging Indicator Definitions Most of the indicators are derived from secondary data sources and limited to those indicators for which data are available for geographic subareas within Connecticut. Table A-1 contains technical definitions for most of the indicators reported in this study, except the socio-demographic variables used to describe the population composition of communities. 2. Data Sources Multiple data sources are used in this study. Table A-2 contains a summary of all data sources, and the specific years of data used for population composition and healthy-aging indicators. Estimates of community-level indicators of physical/mental health, chronic disease prevalence, access to care, wellness and prevention health behaviors, service utilization, and nutrition and diet were derived from two major data sources: the Medicare Master Beneficiary Summary File (2016-2017) and the Behavioral Risk Factor Surveillance System (2012-2018). Population composition measures were drawn from the Five-Year American Community Survey (2014-2018) produced by the U.S. Census Bureau. These major data sources, and other data sources used for other community, safety, and economic variables, are described below. Medicare Master Beneficiary Summary File Medicare claims data from the Centers for Medicare and Medicaid Services (CMS) are a rich source of data for measuring chronic disease prevalence and Medicare service utilization rates for individual cities and towns. The Master Beneficiary Summary File (MBSF) is an annual data file constructed by the Chronic Conditions Data Warehouse that includes individual records for all persons eligible for Medicare for at least one month during a calendar year. The MBSF is comprised of four data files containing different types of information: (1) The Master Beneficiary Summary File-A/B/D (MBSF-A/B/D) includes standard
Medicare administrative data fields (e.g., sex, race, dates of birth and death), monthly variables indicating specific months of Medicare eligibility, managed care

2
enrollment, and Medicaid state buy-in status, as well as geographic residence identifiers (state, county, zip code) based on each beneficiary’s residence address used for Social Security Administration correspondence.
(2) The Master Beneficiary Summary File-Chronic Conditions (MBSF-CC) includes indicators derived from Medicare algorithms applied to diagnostic codes on individual Medicare fee-for-service provider claims for 27 prevalent chronic conditions (e.g., diabetes, stroke, depression, Alzheimer’s disease or related dementia, chronic obstructive pulmonary disease, hip fracture, cancer), as well as the earliest date since 1999 that the diagnostic criteria for prevalence were first met.
(3) The Master Beneficiary Summary File- Other Chronic or Potentially Disabling
Conditions (MBSF-OC) includes indicators derived from Medicare algorithms applied to diagnostic codes on individual Medicare fee-for-service provider claims for other chronic conditions (e.g., ADHD, Alcohol Use Disorders, Anxiety Disorders, Autism Spectrum Disorders, Bipolar Disorder, Depressive Disorders, Drug Use Disorders, Epilepsy, Fibromyalgia, Chronic Pain and Fatigue, Human Immunodeficiency Virus and/or Acquired Immunodeficiency Syndrome (HIV/AIDS), Leukemias and Lymphomas, Liver Disease, Migraine and Chronic Headache, Mobility Impairments, Obesity, Peripheral Vascular Disease, Personality Disorders, Post-Traumatic Stress Disorder, Pressure and Chronic Ulcers, Schizophrenia, Sensory - Blindness and Visual Impairment, Sensory – Deafness and Hearing Impairment, Tobacco Use, Traumatic Brain Injury), as well as the earliest date since 1999 that the diagnostic criteria for prevalence were first met.
(4) The Master Beneficiary Summary File-Cost and Use (MBSF-CAU) contains
aggregated summaries of annual service utilization and reimbursements for various types of Medicare services (e.g., inpatient hospitalizations, physician visits, home health visits, skilled nursing facility stays, emergency room visits, hospital readmissions, and filled Part D prescriptions, hospice users).
Each beneficiary record contains an encrypted individual identifier so that information from the four data files can be merged together. The four MBSF data files were obtained from CMS for all Medicare beneficiaries who were age 65 years or older on January 1st of the calendar year, and had a state residence code of Connecticut for 2016 or 2017. The data were obtained under a formal data use agreement required for privacy protection of health information contained in research-identifiable data files. A major strength of the MBSF data is their coverage of 100% of aged Medicare beneficiaries living in Connecticut. This permits the estimation of health indicators for relatively small individual towns. These rates potentially can be updated annually. Additionally, the major shortcoming of the MBSF data are that they are derived from claims data. Since chronic condition prevalence is identified from diagnoses on Medicare claims, rates of chronic disease prevalence and service use can only be measured for Medicare beneficiaries who receive their care from fee-for-service providers. Managed care providers such as Medicare Advantage plans do not submit

3
claims data to Medicare for processing. In addition, beneficiaries whose chronic condition is undiagnosed because they do not have access to a physician will not be identified as having that chronic condition. Finally, the health indicators constructed from MBSF data are limited in scope since they are based on administrative data. Nevertheless, these data are rich with respect to geographic specificity compared to other common data sources for health indicators. Behavioral Risk Factor Surveillance System The Behavioral Risk Factor Surveillance System (BRFSS) is a state-based system of annual health surveys established by the Centers for Disease Control and Prevention (CDC) that collects information on health risk behaviors, preventive health practices, and health care access, primarily related to chronic disease and injury. The BRFSS provides a rich source of information about individual health behaviors such as smoking, excessive drinking, obesity, preventive health service use, which are relevant for the development of healthy aging indicators. A core set of questions about such health behaviors are included every year. The Connecticut Department of Public Health (CTDPH) is responsible for collecting BRFSS data for Connecticut. The CTDPH adds questions beyond the core CDC questions on relevant topics to support health care policy planning, to guide preventive health interventions, and to assess health status and its change over time for Connecticut residents. Person-level BRFSS data were obtained from the Connecticut Department of Public Health for this project under a formal data use agreement required for individual privacy protection of health information. The BRFSS survey is carried out under a complex survey design intended to enhance the efficiency of using limited population samples to produce reliable state-level estimates of health indicators. Interviews are administered in three alternative languages (English, Spanish, Portuguese) depending upon respondents’ preferences. Respondents are oversampled in larger cities in the state under the BRFSS complex survey design to increase the representation of racial/ethnic minority respondents. Before 2008, BRFSS data were obtained entirely through land-line telephone surveys. Because of the rising prevalence of households with only cell-phones, the BRFSS survey design was modified in 2011 to include both land-line and cell phone samples. Furthermore, the method used to derive post-stratification factors was changed in 2011 to a raking procedure that permits finer adjustments to population weights based on multiple population attributes. These changes in the 2011 BRFSS survey design introduce some complexities when data from 2010 or earlier are pooled with more recent data. How these changes in survey design are addressed will be discussed later in the description of estimation methods. A major strength of the BRFSS data is its rich information on health behaviors. To our knowledge no other secondary dataset has the range of variables on health behaviors of older Connecticut residents. The BRFSS has several limitations for small area analyses. The BRFSS survey design was developed for obtaining the state-level estimates. Accordingly, the respondent sample sizes for most individual towns in

4
Connecticut in any year are far too small to produce reliable estimates for most towns. Even if appropriate adjustments are made because of unrepresentative samples for many small towns, small area estimation will require that BRFSS survey data be pooled over multiple years. For example, the number of respondents 60 years or older with valid geographic residence identifiers in the entire state BRFSS sample has ranged from 5,259 in 2016 to 4,938 in 2018. This is far too small to estimate town-level rates for all 169 cities and towns in Connecticut. Because of the small sample size of annual BRFSS surveys, multiple years of survey data were pooled together, and multiple cities and towns were aggregated together to create larger geographic areas containing multiple cities and towns. While most estimates were derived from pooling the three most recent years of BRFSS survey data (2016-2018), some questions used for indicator estimates are not asked every year. For these indicators, the three most recent years of data with those survey questions (e.g., 2013, 2015, 2017, or 2014, 2016, 2018) were used. Table A-2 shows the specific years of data used to derive estimates for each BRFSS indicator. Details about estimation methods are provided later on in the section describing BRFSS estimation methods. Medicare Compare Access to Care Data on Medicare service providers (physicians, hospitals, nursing homes, home health agencies, and hospice agencies) were obtained from Medicare website http://www.medicare.gov. Number of primary care providers was obtained from website (https://www.medicare.gov/physiciancompare/) using the search term “city/town name, Connecticut” and “Primary care”. After initial searching with this term, we updated search results by selecting within 5 miles option. Number of hospitals was obtained from website (https://www.medicare.gov/hospitalcompare/) using the search term “city/town name, Connecticut”. After initial searching with this term, we updated search results by selecting within 5 miles option. Number of nursing homes was obtained from website (https://www.medicare.gov/nursinghomecompare/) using the search term “city/town name, Connecticut”. After initial searching with this term, we updated search results by selecting within 5 miles option. Number of home health agencies was obtained from website (https://www.medicare.gov/homehealthcompare/) using the search term “city/town name, Connecticut”. There was no option for selecting within 5 miles for home health agencies. Home Health Compare lists agencies whose geographic service areas contain the selected zip code, city, or town. Number of hospice agencies was obtained from website (https://www.medicare.gov/hospicecompare/) using the search term “city/town name, Connecticut”. There was no option for selecting within 5 miles for hospice agencies. U.S. Census Bureau Data on population composition were downloaded from the U.S. Census Bureau Fact Finder website (https://data.census.gov/cedsci/). All census population estimates reported in the community profiles were derived from the 5-year American Community Survey data (2014-2018). Data were downloaded for all 169 individual cities and towns.

5
In addition, the zip code data were downloaded and aggregated for 12 neighborhoods within the city of Bridgeport, Hartford, New Haven, and Stamford. Each selected town was split into three geographic subareas. Other Data Sources Although the majority of the indicators in this data report were obtained from the CMS, the US Census Bureau, and the BRFSS, additional indicators relied on additional community and county-level data sources.
(1) Life expectancy at birth was obtained from the Robert Wood Johnson Foundation Life Expectancy: Could Where You Live Influence How Long You Live? Data was accessed in November 2020. (https://www.rwjf.org/en/library/interactives/whereyouliveaffectshowlongyoulive.html).
(2) Data on the availability of supermarkets were downloaded from the U.S Department of Agriculture Food Access Research Atlas website (https://www.ers.usda.gov/data-products/food-access-research-atlas/download-the-data/). The data were initially released in January 2017, and updated in May 2017. The percentage of older adults with poor supermarket access was calculated based on the share of older population age 65 and over who were beyond 1 mile (in urban) or 10 miles (in rural) from supermarkets.
(3) The number of drug overdose deaths of all ages were downloaded from the Connecticut Department of Public Health, Connecticut State Unintentional Drug Overdose Reporting System (SUDORS). Data were obtained for year 2015-2020 and accessed October 2020. (https://public.tableau.com/profile/heather.clinton#!/vizhome/SUDORS_Dashboard_final2/OverdoseDashboard).
(4) The number of caregiver support groups were obtained from the Connecticut State Department of Aging. Data was accessed in May 2020. (https://rielderinfo.com/wp-content/uploads/2018/08/Caregiver-Support-Groups-in-Connecticut.pdf).
(5) The number of memory cafes were downloaded from the Memory Café Directory website. Data was accessed in May 2020. (https://www.memorycafedirectory.com/memory-cafes-in-connecticut/).
(6) The number of community health centers were downloaded from the Community Health Center Association of Connecticut. Data was accessed in September 2020. (https://www.chcact.org/find-health-center/).
(7) The number of adult day health centers were downloaded from the National Adult Day Services Association website. Data was accessed in September 2020. (https://www.nadsa.org/locator/?ill_directory_search=1&ill_directory_keywords=&ill_directory_category%5B47173%5D%5B47194%5D=47194&ill_directory_city=&ill_directory_state=).
(8) The AirNow website of the U.S. Environmental Protection Agency provides measures air quality with the Air Quality Index (AQI) with scores ranging from
6
0 to 500. AirCompare provides county-level comparisons of the number of days in a year that AQI values are between 101 and 150 (code orange) and/or exceed 150 (code red) for specific subpopulations. For the subpopulation that includes older persons without specific health concerns, the total count of days includes code red days for any pollutant and code orange days for ozone and particulate matter. Data on annual number of unhealthy days for persons age 65 and older was obtained from (https://www3.epa.gov/aircompare/#trends). The number of unhealthy days were obtained by clicking each county on the map.
(9) Age-friendly communities were collected from the 2016 AARP livable community network. Data was accessed in May 2020. (https://www.aarp.org/livable-communities/network-age-friendly-communities/info-2016/member-list.html).
(10) The number of senior centers were downloaded from the Connecticut Health and Human Services Listing of Senior Centers in the state. Data was accessed in May 2020. (https://data.ct.gov/Health-and-Human-Services/Listing-of-Senior-Centers/kbx6-3an2/data).
(11) The number of universities and community colleges in a community was retrieved from the New England Commission of Higher Education. Data was accessed in May 2020. (https://www.neche.org/institutions/ct/).
(12) The number of public libraries, main library and branch libraries, in a community were obtained from the Connecticut State Library Department, Division of Library Development. Data was accessed in January 2021. (https://libguides.ctstatelibrary.org/ld.php?content_id=7466457).
(13) The number of YMCAs per community were retrieved from the YMCA Southcoast website. Data was accessed in May 2020. (https://ymcasouthcoast.org/membership/ymcas-new-england/).
(14) The percentage of persons in a county with access to broadband was retrieved in 2017 from Federal Communications Commission which was released in 2016. Data was accessed May 2020. (https://docs.fcc.gov/public/attachments/FCC-16-6A1.pdf).
(15) Data for voters of 18 years and older for 2016 were obtained for cities and towns from the Connecticut Secretary of State (https://ctemspublic.pcctg.net/#/voterTurnout). Data could not be reported separately for neighborhoods within Bridgeport, Hartford, New Haven, and Stamford.
(16) The CDC Wonder website was used to access the Multiple Cause of Death, 2014-2018 dataset. Mortality data are coded by each state and given to the National Center for Health Statistics through the Vital Statistics Cooperative Program. See (https://wonder.cdc.gov/wonder/help/mcd.html) for additional information. County-level data for homicide rate per 100,000 people, 65+ deaths by suicide, and number of firearm fatalities were accessed using (https://wonder.cdc.gov/mcd.html).
(17) The number of dentists per 100,000 persons (all ages) were obtained from the Connecticut Department of Public Health and accessed on May 2020. (https://elicense.ct.gov/Lookup/LicenseLookup.aspx>).

7
(18) Data on fatality related with motor vehicle crash were downloaded from the National Highway Traffic Safety Administration (NHTSA) website (http://www.nhtsa.gov/FARS). The Fatality Analysis Reporting System (FARS) is annual data on traffic crashes resulting in at least one fatality occurring within 30 days of the crash. The FARS contains data derived from a census of fatal traffic crashes within 50 states, the District of Columbus, and Puerto Rico. We selected fatal crashes with at least one death of vehicle occupants (e.g. driver or passenger) or non-motorist (e.g. pedestrian) occurring in Connecticut only from 2014 to 2018.
(19) The number of assisted living sites were retrieved in May 2020 from (https://www.seniorcare.com/assisted-living/ct/>).
(20) Four measures of geographic comparative cost of living are reported at the county level using the Elder Index. This index contains county estimates of the minimum income needed by older households to attain a modest standard of living in the community that reflects economic security. “The Elder Index defines economic security as the financial status where elders have sufficient income (from Social Security, pensions, retirement savings, and other sources) to cover basic and necessary living expenses” (Gerontology Institute, 2012). While Elder Index estimates are available at the county-level for 18 different types of community-resident households with a head 65 years or older defined by health status (excellent, good, poor), living situation (alone, couple), housing costs (owner with mortgage, owner without mortgage, renter), we report Elder Index estimates for four types of households in good health (single renters, single owners without mortgages, couple renters, and couple owners without mortgages). Elder indices for 2018 were downloaded for all counties in Connecticut from the Elder Index Database (https://elderindex.org/).
Connecticut GIS Data
The CT GIS maintains an array of geographic services such as data development/distribution, image processing, cartography, spatial analysis, online mapping (https://portal.ct.gov/DEEP/GIS-and-Maps/Maps/Maps-and-GIS-Data). The shape file of city/town boundary was downloaded from the CT GIS.
3. Geographic Area Definitions of Communities Data availability limited the geographic specificity of the community definitions for which some healthy aging indicators could be measured. There are two major factors that constrained how finely geographic communities could be defined. The first factor is the relatively small sample size of the CT BRFSS data. The second factor is the sparse actual populations of older persons residing in some CT towns. Even if data were available for all older persons in some of these towns, some populations are too small for public reporting of town-level estimates due to privacy concerns.
8
In this study we addressed the problems associated with sparsely populated towns by selectively aggregating some smaller towns together into larger geographic areas to increase the sample size used for estimation. The estimates derived for the larger aggregated geographic area are then reported for all individual constituent cities/towns. This is an acknowledged limitation of this study. Geographic Areas for Medicare MBSF Indicators Although the Medicare MSBF contains individual records for 100% of beneficiaries who are eligible for Medicare in at least one month in a calendar year, geographic aggregation of some smaller towns in Connecticut was necessary. Under our CMS data use agreement prevalence rates for any chronic disease or disabling condition must be censored for any geographic area if either fewer than 11 resident beneficiaries have the condition, or all but 10 beneficiaries have the condition. While censoring is not a concern for most towns and MBSF indicators, we employed a two-part strategy to substantially reduce or eliminate the need for censoring indicators. This strategy entailed: (1) spatial aggregation of less-populated towns with adjacent towns to create more-populated geographic areas, and (2) stratification of chronic diseases and disabling conditions into high prevalence, low prevalence, and lowest prevalence subgroups. Geographic Areas for High Prevalence Conditions We classified 46 MBSF indicators as “high prevalence” conditions where the risk of censoring was more likely to be due to sparse population in a town rather than low prevalence of the condition among all aged Medicare beneficiaries. For high prevalence MBSF indicators we employed 160 geographic areas. Most of these geographic areas were individual towns or neighborhoods within Bridgeport, Hartford, New Haven, and Stamford with at least 200 aged Medicare beneficiary residents satisfying sample selection requirements (described below) and where there were at least 11 beneficiaries with nearly all of the conditions classified as high-prevalence. Towns with fewer than 200 such beneficiaries and/or numerous censored indicators were combined with one or more adjacent towns to form an aggregate geographic area with a combined sample size of more than 200 beneficiaries and/or at least 11 beneficiaries for nearly all indicators. Combined towns had to border each other. The aggregation of specific bordering smaller towns together was guided by the following principles:
1. It is preferable to combine a smaller town with another smaller town rather than a
larger town.
2. It is preferable to combine fewer towns rather than more towns together (e.g., a two-town geographic area is preferable to a three-town geographic area).
3. It is preferable to combine towns located within the same county relative to towns
in different counties.

9
4. It is preferable to limit the number of communities with censored rates to 10 or fewer.
Using these principles as a guide, there were defined 160 geographic communities in Connecticut for estimating high prevalence Medicare MBSF indicators. Among these 160 communities there were 132 stand-alone individual cities or towns, and 12 neighborhood areas within Bridgeport, Hartford, New Haven, and Stamford. There were 16 aggregated geographic areas comprised of two or more individual towns. The individual towns that were combined together to form the 16 aggregated geographic areas were: (Andover-Bolton, Ashford-Eastford, Barkhamsted-Hartland, Bethlehem-Morris, Bozrah-Franklin-Sprague, Bridgewater-Roxbury, Canaan-North Canaan, Chaplin-Hampton-Scotland, Colebrook-Winchester, Cornwell-Warren, Griswold-Lisbon-Voluntown, Goshen-Norfolk, Killingly-Plainfield-Sterling, Lyme-Old Lyme, Union-Stafford-Willington, Pomfret-Woodstock). The same common value for MBSF indicators is reported in the community profiles of towns that were combined together to form these aggregated geographic areas. Below, these 16 geographic areas are shown in different colors in Map 1. The Healthy Aging Data Report team would like to thank researcher Mark Abraham from DataHaven (www.ctdatahaven.org) who assisted in defining the three subarea neighborhoods in the four major Connecticut cities based on their personal and professional expertise of the areas. Each city was separated into three subareas which were related by socioeconomic status of the individual zip codes. The city of Bridgeport is disaggregated into 3 subareas representing the following zip codes (Area 1: 06606; Area 2: 06604, 06605; Area 3: 06607, 06608, 06610). The city of Hartford is disaggregated into 3 subareas representing the following zip codes (Area 1: 06112, 06120; Area 2: 06103, 06105; Area 3: 06106, 06114). The city of New Haven is disaggregated into 3 subareas representing the following zip codes (Area 1: 06515; Area 2: 06510, 06511, 06519; Area 3: 06513). The city of Stamford is disaggregated into 3 subareas representing the following zip codes (Area 1: 06903; Area 2: 06901, 06902; Area 3: 06905, 06906, 06907). Below, Map 1 indicates the geographic location of each subarea for the four cities. The CMS Master Beneficiary Summary File-A/B/D obtained from CMS contained 5-digit zip codes for Medicare beneficiaries.

10
Map 1. Geographic Areas for High Prevalence Conditions
Geographic Areas for Low Prevalence Conditions We classified 13 MBSF indicators as “low prevalence” conditions because of the
relatively high frequency of censoring required for reporting these indicators for the 160
high prevalence geographic areas described above. Nearly all of the low prevalence
conditions were disabling mental health conditions. For low prevalence conditions
(endometrial cancer, colorectal cancer, lung cancer, traumatic brain injury, bipolar
disorder, personality disorder, blindness and visual impairments, post-traumatic stress
disorder (PTSD), leukemias and other lymphomas, epilepsy, mobility impairments,
migraine/chronic headache, schizophrenia and other psychotic disorders) we defined
104 larger geographic areas (see Map 2) by selective spatial aggregation of adjacent
high prevalence geographic areas. Decisions about which high prevalence areas to
combine were based on the same goals which guided the spatial aggregation of
individual towns into high prevalence geographic areas, namely, relatively
homogeneous geographic areas with respect to population socioeconomic status and
race/ethnicity. Due to the sparse population of selected low prevalence conditions, there
are additional aggregated towns. For example, Naugatuck and Prospect are combined
for estimation of one indicator, PTSD. Also, Colchester, East Hampton, Hebron,
Marlborough, and Portland are combined for estimation of two indicators (PTSD and
blindness). East Lyme, Lyme, and Old Lyme are combined for estimation of two
indicators (PTSD and blindness). The resulting low prevalence geographic areas are

11
generally relatively homogeneous. However, in a few instances it was not possible to
combine areas with very similar populations without violating the requirement that the
combined communities be adjacent to each other, and some heterogeneity exists. The
same rate is reported in community profiles of all towns or neighborhoods grouped
together for low prevalence geographic areas.
Map 2. Geographic Areas for Low Prevalence Conditions
Geographic Areas for Lowest Prevalence Conditions Two disabling conditions (HIV/AIDS, autism spectrum disorders) that we report have so low prevalence rates among aged Medicare beneficiaries that rates would be censored for most of the 104 low prevalence geographic areas described above. In order to reduce the frequency of censoring for these lowest prevalence conditions, we combined low prevalence geographic areas together to form 10 geographic areas for these lowest prevalence conditions (see Map 3). Spatial aggregation decisions were guided by the same goals discussed above with adjacency strictly required. All individual cities and towns that are grouped together for lowest prevalence conditions have the same value reported in community profiles.

12
Map 3. Geographic Areas for Lowest Prevalence Conditions
Geographic Areas for BRFSS Indicators Given the small sample sizes of BRFSS respondents it was only feasible to estimate BRFSS indicators for 34 geographic subareas in the state. These geographic subareas were defined by spatial aggregation of cities and towns using a multi-step process similar to that used for geographic areas estimated from CMS Medicare data. In the first step we combined selected contiguous individual cities and towns into larger geographic areas, each containing 200 or more BRFSS respondents from 2012-2018 BRFSS surveys under a goal of forming relatively homogenous subareas with respect to socioeconomic status and racial/ethnic mix of the older population. We used ACS estimates of the education (% with less than a high school education, % with a high school education or some college, % with a college degree), income (% with incomes below the poverty level, % with annual incomes exceeding $50,000), and racial composition (% White, % African-American, % Asian, % Other race, % Hispanic) of the population 65 years or older to evaluate population homogeneity. Aggregation decisions were guided by the following principles:
1. It is preferable to combine towns that are spatially contiguous to each other.

13
2. It is preferable to combine a smaller town with another smaller town rather than a larger town.
3. It is preferable to combine fewer towns rather than more towns together (e.g., a
two-town geographic area is preferable to a three-town geographic area).
4. It is preferable to combine towns with more similar population composition in terms of race, education levels, and income.
5. It is preferable to combine towns located within the same county relative to towns
in different counties. In the second step we evaluated whether the preliminary BRFSS areas defined in the first step satisfied the minimum threshold for numerator counts that was used for CMS data privacy rules. For any percentage BRFSS indicator derived from a respondent-level binary (yes/no) variable we required that there be least 11 respondents with the smaller count of yes versus no responses. This process produced a preliminary set of 34 geographic areas for estimating indicators from BRFSS data. Map 4 showcases the 34 unique geographic areas. In addition, the map highlights how the town of Greenwich is combined with the city of Stamford due to data sparsity. For the BRFSS indicator for the percentage of population 60 years or older who reported to be lesbian, gay, bi-sexual or transgendered (LGBT), sparse data issues would allow the rate to be reported only for towns in one BRFSS region, since there is a paucity of survey data on the older LGBT population, we employed a county geographic unit for this indicator. Similar to the BRFSS regions, the same estimated rate is reported for all towns that make up these regions.

14
Map 4. Geographic Areas for BRFSS Indicators
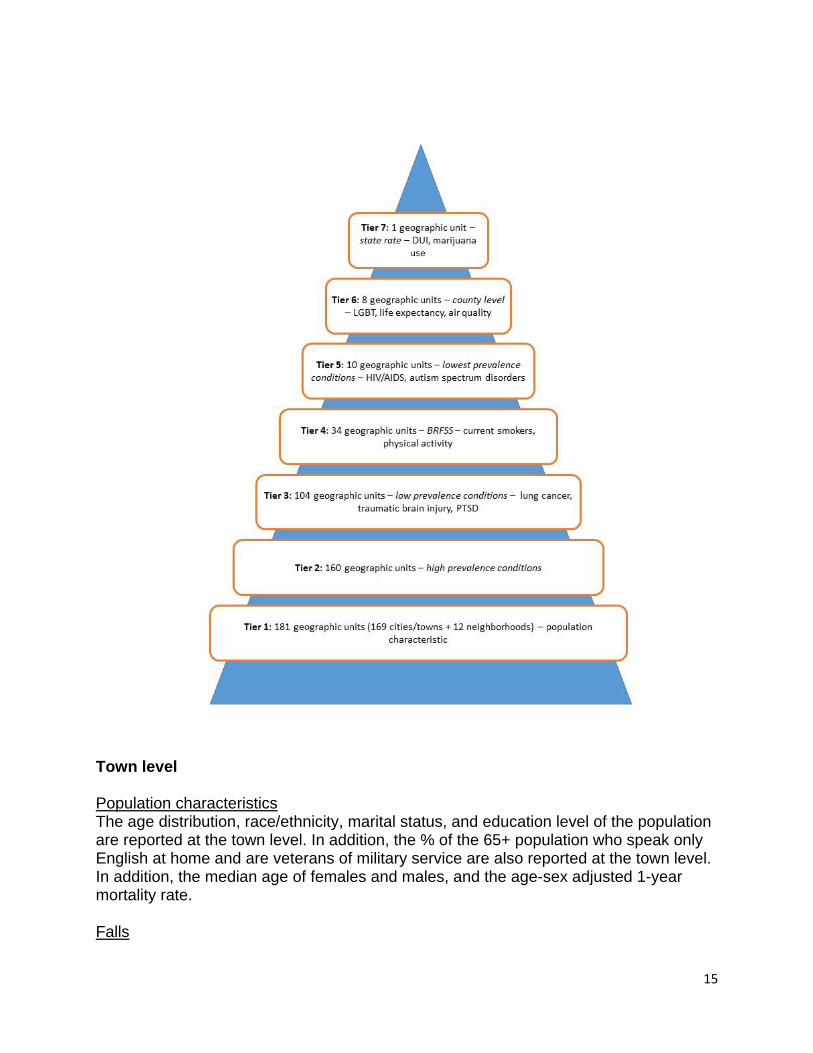
Geographic Level of Indicators The Healthy Aging Data Reports aim to report indicators at the community level, but some indicators are reported at a larger geographic area or county level. As described above, the BRFSS indicators are organized by geographic area of multiple cities and towns with similar socioeconomic status. Below, the indicators are organized by the geographic unit they are reported.
15
Town level Population characteristics The age distribution, race/ethnicity, marital status, and education level of the population are reported at the town level. In addition, the % of the 65+ population who speak only English at home and are veterans of military service are also reported at the town level. In addition, the median age of females and males, and the age-sex adjusted 1-year mortality rate. Falls

16
The % of 65+ who had a hip fracture was reported at the town level. Nutrition/Diet The following nutrition or diet indicators were reported at the town level: % 65+ with poor supermarket access, clinically diagnosed obesity, and high cholesterol. Oral Health The number of dentists per 100,000 persons for all ages is reported at the town level. Chronic Disease All chronic disease indicators are reported at the town level. The HADR reports the % of 65+ with the following chronic diseases: Alzheimer’s disease or related dementias, anemia, asthma, atrial fibrillation, autism spectrum disorders, benign prostatic hyperplasia in men, breast cancer in women, cataract, chronic kidney disease, chronic obstructive pulmonary disease, colon cancer, congestive heart failure, diabetes, endometrial cancer in women, epilepsy, fibromyalgia, chronic pain and fatigue; glaucoma, heart attack, HIV/AIDS, hypertension, hypothyroidism, ischemic heart disease, leukemias and lymphomas, liver disease, lung cancer, migraine and other chronic headache, osteoarthritis or rheumatoid arthritis, osteoporosis, peripheral vascular disease, pressure ulcer or chronic ulcer, prostate cancer in men, stroke, traumatic brain injury, 4+ (out of 15) chronic conditions, and no chronic conditions. Behavioral Health The following behavioral health indicators are reported at the town level: number of drug overdose deaths of all ages, % 65+ with opioid, substance, and tobacco use disorders. Mental Health The following mental health indicators are reported at the town level: the % of 65+ with depression, anxiety, bipolar, post-traumatic stress disorder, and personality disorder; and with schizophrenia and other psychotic disorders. Living with disability The following living with disability indicators are reported at the town level: the % of 65+ with self-reported hearing, vision, cognition, ambulatory, self-care, and independent living difficulty; and % of 65+ with clinical diagnosis of deafness or hearing impairment, blindness or visual impairment, and mobility impairments. Caregiving

17
The following caregiving indicators are reported at the town level: the number of caregiving support groups, and memory cafes; the % of grandparents raising grandchildren, and who live with grandchildren. Access to Care The following access to care indicators are reported at the town level: the % of 65+ dually eligible for Medicare and Medicaid, and Medicare managed care enrollees. The number of primary care providers, hospitals, and nursing homes within 5 miles; home health agencies in same town, community health centers, adult day centers, and hospice agencies. Service Utilization All service utilization indicators were reported at the town level: the number of emergency room visits per 1000 persons 65+ annually, part D monthly prescription fills per person annually, home health visits per year, durable medical equipment claims annually, inpatient hospital stays per 1000 persons 65+ years annually, skilled nursing facility stays per 1000 persons 65+ years annually, skilled nursing home Medicare beds stays per 1000 persons 65+ years annually. The median hospice days per hospice user and median hospice payment per hospice user. The % of 65+ getting Medicaid long term services and supports, hospice users, hospice users as % of decedents, and the % of Medicare inpatient hospital readmissions. Community The following community indicators are reported at the town level: age-friendly efforts in the community, number of senior centers, universities and community colleges, public libraries, and YMCAs; and voter participation rates in 2016 election among 18+. Transportation The following transportation indicators were reported at the town level: the % of 65+ who own a motor vehicle, and the number of fatal crashes involving an adult age 60+ per town. Housing The following housing indicators were reported at the town level: the % of 65+ population living alone, renter households who spend >35% of income on housing, households who spend >35% of income on housing, who moved within same county, who moved from different county in Connecticut, who moved from different state. Average household size of all ages, median house value, number of assisted living sites, and % of vacant homes in community. Economic

18
All economic indicators are reported at the town level: the % 60+ receiving food stamps in past year; % of 65+ employed last year, with income below the poverty level in last year, and % of 65+ households with annual income below $20,000; between $20,000-$49,999, between $50,000-$99,999, and above $100,000. Cost of Living All cost of living indicators are reported at the town level: the cost of living for a single homeowner without a mortgage in good health, the cost of living for a single renter in good health, the cost of living for a couple who are homeowners without a mortgage in good health, and the cost of living for a couple who are renters and in good health. BRFSS area Population characteristics The % of 60+ population that are LGBT is reported at the BRFSS level. Wellness All wellness indicators were reported at the BRFSS level: the % of 60+ getting the recommended hours of sleep, with any physical activity last month, met CDC guidelines for muscle-strengthening activity and aerobic physical activity, with self-reported fair or poor health status, and with 15+ physically unhealthy days last month. Falls Two falls indicators were reported at the BRFSS level: the % of 60+ who fell within last year, and who were injured in a fall within the last year. Prevention All prevention indicators were reported at the BRFSS level: the % of 60+ with physical exam or check up in past year, flu shot in past year, pneumonia vaccine, shingles vaccine, women with a mammogram within last 2 years, with colorectal cancer screening, HIV test, and who met CDC preventive health screening goals. Nutrition/Diet The following nutrition or diet indicators were reported at the BRFSS level: the % of 60+ with 5 or more servings of fruit or vegetables per day, stressed about buying food in last month, self-reported obese, and with a cholesterol screening. Oral Health

19
The following oral health indicators were reported at the BRFSS level: the % of 60+ with dental insurance, annual dental exam, and with loss of 6 or more teeth. Behavioral Health The following behavioral health indicators are reported at the BRFSS level: the % of 60+ who used marijuana in last month, excessive drinking, current smokers, and who used E-Cigarettes in past month. Mental Health The following mental health indicators are reported at the BRFSS level: the % of 60+ who reported receiving adequate emotional support, being satisfied with life, and with 15 days poor mental health last month. Caregiving The % of 60+ who provide care to a family or friend in the last month is reported at the BRFSS level. Access to Care The following access to care indicators are reported at the BRFSS level: the % of 60+ with a regular doctor and who did not see a doctor when needed due to cost. Community The % of 60+ who used internet in last month is reported at the BRFSS level. Transportation The following transportation indicators were reported at the BRFSS level: the % of 60+ who always drive or ride wearing a seatbelt, and who drove under the influence of drinking in last month. Housing The following housing indicators were reported at the BRFSS level: the % of 60+ who own home, who have a mortgage, and are stressed about paying rent or mortgage in last month. County level Population characteristics The life expectancy at birth is reported at the county level.
20
Community The following community indicators are reported at the county level: air pollution: the annual number of unhealthy days for 65+, and the % in county with access to broadband among all ages. Safety and Crime All safety and crime indicators are reported at the county level: the homicide rate per 100,000 persons, the number of firearm fatalities, and number of 65+ deaths by suicide. Transportation The number of fatal crashes involving adults age 60+ per county were reported at the county level. 4. Geographic Data Sources Geographic information is used in this report in a variety of ways, ranging from the creation of cross-walk tables between different geographic units (e.g., 5-digit zip code areas to towns) to the mapping of healthy-aging indicator estimates with GIS software. This section summarizes the sources of other geographic data used in the study. Zip code database CT zip code data was downloaded from (https://www.unitedstateszipcodes.org/). There are 438 zip codes in CT, 2020. The data file contains individual records for all valid 5-digit zip codes, the city/town, county, and state it is located in, and the latitude and longitude coordinates of the centroid of the zip code area. It also contains an indicator of whether the zip code value represents a standard geographic zip code area, a point zip code (e.g., post office box), or a unique zip code assigned to certain entities such as a university. Zip code shape file A zip code shape file used for mapping of 5-digit zip code areas was obtained from the U.S. Census Bureau based on the 2010 Census. The shape file was downloaded from the Census Bureau website (http://www.census.gov/geo/maps-data/data/tiger-line.html). The downloaded zip code database contained about 438 records for all types of 5-digit zip codes (standard, point, etc.) in Connecticut. The Census zip code shape file only contains 283 spatial 5-digit zip code areas. Zip code maps were used to checking the validity of matches between zip codes and towns in BRFSS data and to make decisions about assignments of certain zip codes to individual towns. Some zip code areas are located in more than one town, and some small towns do not have their own zip code. Small towns without their own 5-digit zip code are aggregated together with a bordering

21
town within the same 5-digit zip code. When multiple towns shared a 5-digit zip code, the entire zip code is assigned to the most populated town. Data from the zip code data base and zip code shape file were combined using ArcGIS ArcMap V10.8 software (http://www.esri.com/). Town, county and road shape files Shape files for communities in Connecticut were obtained from Department of Energy and Environmental Protection (https://portal.ct.gov/DEEP). City, town, and county shape files were downloaded from the website: (https://portal.ct.gov/DEEP/GIS-and-Maps/Maps/Maps-and-GIS-Data). These shape files were used with ArcGIS ArcMap V10.8 software to produce maps of the CMS and BRFSS health indicators listed in Table A-1. 5. Estimation Methods for Medicare MBSF indicators Sample Selection Criteria While the Medicare MBSF contains data on all Medicare beneficiaries with at least once month of Medicare Part A or B eligibility in a calendar year, estimates of chronic condition prevalence and service utilization rates can only be derived for beneficiaries who receive care from fee-for-service providers who submit claims to Medicare for reimbursement. Beneficiaries with prevalent chronic conditions are identified through algorithms applied to the diagnostic codes reported on Medicare claims over a defined surveillance period. Chronic condition prevalence is determined by the presence of one or several claims (depending on the condition) containing appropriate condition-specific diagnostic codes within surveillance period.1 Most of these claims algorithms scan claims for both Medicare Part A and B covered services. Claims are not submitted to Medicare during any time interval in which an individual is not eligible for Medicare Part A and/or B and when a beneficiary is enrolled in a Medicare managed care plan that does not submit claims to Medicare for reimbursement. To reliably estimate chronic condition prevalence rates the sample population used for rate estimation should exclude beneficiaries for whom Medicare does not receive claims for services used. To retain such beneficiaries in the sample amounts to an implicit assumption that these beneficiaries used no Medicare covered services when they were not Medicare eligible or enrolled in a Medicare Advantage plan. Hence, rates of chronic condition prevalence and service utilization will generally be underestimated unless such beneficiaries are excluded from the estimation sample. There are several analytic options for restricting the population sample and rate estimation under these circumstances. Pros and cons of several options for imposing restrictions on the estimation sample are discussed in CMS’ Technical Guidance for
1 The diagnostic codes used in the algorithms used to flag Medicare beneficiaries are available from the
Chronic Conditions Warehouse web site (https://www.ccwdata.org/web/guest/condition-categories).

22
Calculating Medicare Population Statistics (2018). The most extreme option is to require “full coverage” where the sample is restricted to beneficiaries with a full year of Medicare Part A and B eligibility and who are never enrolled in a Medicare managed care plan during the year. While requiring full coverage ensures that claims were submitted for all Medicare services used by beneficiaries in a calendar year, such a restriction can result in underestimates of chronic condition prevalence rates because some beneficiaries with partial- year coverage have Medicare claims indicating prevalent chronic conditions in those months that claims were submitted. Under the “partial coverage” option, beneficiaries with nearly a full-year of Medicare Parts A and B eligibility and care from fee-for-service providers are retained in the sample. CMS (2018) note that “a common recommendation is to allow for a one month break in coverage per year of surveillance. This is an attractive option to avoid losing many cases with the condition of interest (i.e., known cases, as indicated in claims) due to the occurrence of only partial FFS coverage” (CMS, 2018). In this study we chose to use this “partial-year coverage” option for estimating population-based chronic condition prevalence and service utilization rates. The sample selection criteria used to apply the partial coverage requirements differ depending on the length of the claims surveillance period employed for the chronic condition of interest. While a one-year claims surveillance period is used for most chronic conditions reported in the Medicare MBSF, for some conditions such as congestive heart failure and diabetes, the claims surveillance period is two years. The claims surveillance period is also two years for all conditions included in the MBSF Other Chronic or Potential Disabling Conditions data file. For Alzheimer’s disease or related dementias, the claims surveillance period is three years. With only two years of Medicare MBSF data (2016-2017) available to this study, we applied the two-year surveillance sample selection criteria for Alzheimer’s disease or related dementia. Since Part A and B Medicare service utilization rates are based on single-year claims surveillance, the same sample selection criteria are employed for single-year surveillance chronic conditions and all Medicare service utilization rates except for Part D prescription drug utilization. Determination of Chronic Condition Prevalence: Ever versus Current Year For each beneficiary the MBSF contains two flag variables for each chronic condition that indicate whether or not the Medicare claims data diagnostic requirements were met for the condition. First, there is a variable noting whether there is claims data evidence of prevalence during the current surveillance period only. This variable reports whether or not full-year surveillance coverage and/or diagnostic requirements from claims data were met for the chronic condition. The four categories are: (1) neither claims diagnosis nor surveillance coverage requirements were met, (2) claims diagnosis requirements were met but surveillance coverage requirements were not met, (3) claims diagnosis requirements were not met but surveillance coverage requirements were met, (4) both claims diagnosis claims and surveillance coverage requirements were met. Current-year prevalence requires that claims diagnosis requirements are met. If partial FFS

23
coverage is used to select beneficiaries meeting surveillance coverage requirements then both (2) and (4) above are used to flag beneficiaries with claims data evidence of prevalence in the current year. For each beneficiary there is a second historical flag variable that contains earliest calendar year from 1999 onward that the CCW Medicare claims data diagnosis requirements for chronic condition prevalence were met. Although chronic conditions can be managed effectively through medications, surgery, and/or diet and lifestyle changes, unlike acute illnesses they remain prevalent after onset. However, depending on the extent and type of a Medicare beneficiary’s service use in any particular calendar year, there may be no current-year claims data evidence of chronic condition prevalence even when such claims data evidence exists in previous calendar years. While questions have been raised about the extent to which some prevalent chronic conditions may be missed for beneficiaries due to the brevity of the MBSF surveillance periods used to determine current-year prevalence2, current-year chronic condition prevalence rates are commonly reported (e.g., see Chronic Conditions Warehouse 508 Files (https://www2.ccwdata.org/web/guest/interactive-data/ams-dashboard), Centers for Medicare and Medicaid Services, 2012). In this report we have chosen to define chronic condition prevalence based on whether there was any CCW claims data algorithm evidence ever since 1999 rather than only current-year 2017 algorithm evidence. There are several reasons for this choice. First, self-reports of chronic conditions are typically based on questions asking whether a doctor ever told a respondent that he/she had a certain condition. The “ever-met” claims algorithm definition of prevalence is more similar to the “ever” time period used in self-reports. Second, while some studies have shown that for some conditions self-reports may result in underestimated prevalence rates (e.g., Porell & Miltiades, 2001), claims-based estimates based on finite surveillance time periods are more likely to understate than overstate prevalence rates (e.g., Gorina & Kramaroy, 2011). Since prevalence rates based on any claims data surveillance evidence since 1999 will naturally include claims evidence from 2017, the prevalence rates reported in this study are higher than those based on current-year surveillance periods. (e.g., see tables on
2 Gorina and Kramaroy (2011) applied Chronic Conditions Warehouse (CCW) claims data algorithms to
the Medicare claims of NHANES I Epidemiologic Follow-up Study respondents who were identified has having one or more of five chronic conditions ( diabetes, ischemic heart disease, COPD, dementia, arthritis) prior to the claims surveillance time periods. Prior-period prevalence was determined from baseline and follow-up interview self-reports by respondents, records from baseline physical examinations conducted by physicians (including X-ray results for arthritis). In the case of dementia, baseline responses to the Mental Status Questionnaire and follow-up interview questions were used to determine prevalence prior to the claims surveillance time period. Among respondents identified as having the chronic condition prior to the claims surveillance period, application of the CCW claims algorithms over defined surveillance periods identified between 17% (arthritis) and 69% (diabetes) of respondent identified as having those conditions from survey information prior to the surveillance period. While Gorina and Kramaroy (2011) acknowledge that there may be errors in pre-surveillance prevalence status based on survey data (e.g., erroneous self-reports of chronic conditions) their empirical results suggest that the CCW chronic condition surveillance time periods are more likely to be too short to identify prevalence for those chronic conditions where there is a lesser need to regularly use Medicare services for management of the condition.

24
Chronic Conditions Warehouse website (https://www.ccwdata.org/web/guest/medicare-tables-reports). The reader should keep these differences in mind when comparing our reported prevalence rates, which are based on ever meeting the claims data requirements for prevalence since 1999, to rates reported elsewhere, which are commonly based on current surveillance period claims data requirements. Specific Sample Selection Requirements Even though chronic condition prevalence is determined on the basis of claims evidence prior to the current surveillance period, the beneficiaries selected to be counted in the denominator for prevalence rate estimation had to meet current-year surveillance rate requirements to avoid substantial under-estimation of prevalence rates because of beneficiaries enrolled in Medicare managed care plans. Below we describe the specific partial-year surveillance coverage requirements employed in rate estimation. Single-year surveillance chronic conditions and Parts A & B service utilization We followed the partial-year coverage requirements recommended by CMS’ Technical Guidance for Calculating Medicare Population Statistics (2018) that differed depending upon whether or not a beneficiary survived the full calendar year. It is important to retain beneficiaries who die during the year in the estimation sample to mitigate potential biases. If a beneficiary dies on the day when a heart attack occurs he/she cannot meet full-year coverage requirement unless the heart attack occurs on December 31st and would not be counted as experiencing a heart attack. The bias of not including beneficiaries who die during the calendar may be substantial given the high medical costs experienced in the last years of life for many beneficiaries. For all single-year surveillance chronic conditions and for all service utilization rates except Part D prescription fills and hospital readmission rates, partial-year coverage for beneficiaries alive at the end of 2017 requires that:
A beneficiary has at least 11 months of both Medicare Part A and B eligibility and at most one month of Medicare managed care enrollment in 2017.
Beneficiaries who died in 2017 are required to have full coverage (Medicare Part A and B eligibility and no Medicare managed care enrollment) in all months that they were alive in 2017. All beneficiaries are further required to have a valid 5-digit residence zip code recorded in the 2017 Medicare MBSF for residence assignment to towns. There were 342,179 aged Medicare beneficiaries who met these one-year sample selection requirements. For the readmission rate indicator, we naturally imposed an additional condition that a beneficiary must have been hospitalized at least once during 2017. There were 60,756 Medicare beneficiaries who met this additional sample selection requirement for hospital readmissions.

25
Two-year surveillance chronic conditions For all other 2-year chronic conditions, partial-year coverage for beneficiaries alive at the end of the 2017 required that:
A beneficiary has at least 22 months of both Medicare Part A and B eligibility and at most two months of Medicare managed care enrollment over the two calendar years 2016-2017.
Beneficiaries who died in 2017 are required to meet the partial-year coverage requirements in 2016 and meet full coverage requirements in the months they were alive in 2017. Beneficiaries are also required to have a valid 5-digit residence zip code recorded in the 2017 Medicare MBSF. There were 317,597 Medicare beneficiaries who met these sample selection requirements. Since Connecticut residence requirements were applied to 2016 MBSF data, there are some beneficiaries with records in the 2017 MBSF who did not meet the two-year surveillance sample selection criteria because they did not live in Connecticut in 2016. Unfortunately, these beneficiaries had to be excluded from the two-year surveillance estimation sample. If Medicare beneficiaries who recently moved to Connecticut tend to have systematically better/worse health status than longer term resident beneficiaries, this difference will not be reflected in the town-level estimated prevalence and service utilization rates. While beneficiaries younger than 65 years of age can be entitled to Medicare due to disability, most beneficiaries are not entitled to Medicare until they reach 65 years of age under Old Age Survivors Insurance status. Accordingly, to satisfy the one-year surveillance sample selection criteria most beneficiaries must have been 65 years old by February 1st of 2017. The two-year surveillance sample selection criteria require that such beneficiaries be 65 years old as of March 1st of 2016. While we do not make this distinction in our general descriptions of the chronic condition prevalence indicators, the prevalence rates for two-year surveillance period chronic conditions strictly pertain to an older population than the population for single-year conditions and service utilization rates. It is also possible that by employing the two-year sample selection criteria for Alzheimer’s disease or related dementias (with a three-year surveillance period), this may have produced underestimates of prevalence rates for this condition. Part D prescription drug utilization rates In contrast to other Medicare covered services the Medicare MBSF contains summary information about Part D prescription drug utilization for both beneficiaries receiving care from fee-for-service providers and Medicare managed care enrollees. Furthermore, some Medicare beneficiaries with Parts A and B eligibility may not have opted to enroll for Part D Medicare coverage. Because of these factors, the sample selection criteria

26
for the Part D prescription drug utilization indicator differ from that employed for other Medicare covered services. For Part D prescription utilization, partial-year coverage for beneficiaries alive at the end of 2017 requires that:
A beneficiary has at least 11 months of Medicare Part D coverage.
Beneficiaries who died in 2017 are required to have Medicare Part D coverage in all months they were alive in 2017. Beneficiaries are also required to have a valid 5-digit residence zip code recorded in the 2017 Medicare MBSF. There were 434,462 Medicare beneficiaries who met these sample selection requirements. Medicaid dual eligibility and Medicare managed care status For our estimates of Medicare managed care enrollment status, dual eligibility for Medicare and Medicaid, and Medicaid-financed use of long-term services and supports (LTSS), no additional sample selection criteria are imposed beyond the basic age and state residence requirements used to select beneficiaries contained in the MBSF data for Connecticut. Beneficiaries had to be 65 years or older on January 1st, 2017, eligible for Medicare for at least one month in 2017, and have a state residence code for Connecticut. There were 600,539 Medicare beneficiaries who met these sample selection requirements. One-year age-sex adjusted mortality rates Although 2017 dates of death are reported for all beneficiaries with at least one month of Medicare eligibility regardless of managed care status, additional sample selection requirements are imposed for estimates one-year mortality rates. We also require that beneficiaries reside in the same zip code in 2016 as 2017 to mitigate any potential bias associated with beneficiaries whose move to a town in 2017 may have been motivated by health concerns in their last year of life. There were 538,457 Medicare beneficiaries who met these sample selection requirements. Single-year surveillance hospice utilization rates For all single-year surveillance hospice utilization rates, partial-year coverage for beneficiaries alive at the end of 2017 requires that:
A beneficiary has at least 11 months of both Medicare Part A and B eligibility and at most one month of Medicare managed care enrollment in 2017.
Beneficiaries who died in 2017 are required to have full coverage (Medicare Part A and B eligibility and at least one month of Medicare managed care enrollment) in all months that they were alive in 2017. There were 520,705 aged Medicare beneficiaries who met these one-year sample selection requirements.

27
Two-year surveillance hospice utilization rates among deceased beneficiaries For all two-year surveillance hospice utilization rates, partial-year coverage for beneficiaries died at 2016 or 2017 requires that:
A beneficiary has at least 22 months of both Medicare Part A and B eligibility and at most two months of Medicare managed care enrollment over the two calendar years 2016-2017.
Beneficiaries who died in 2016 or 2017 are required to meet the partial-year coverage requirements in 2016 and meet full coverage requirements in the months they were alive in 2017. Beneficiaries are also required to have a valid 5-digit residence zip code recorded in the 2016 and 2017 Medicare MBSF. There were 46,507 Medicare beneficiaries who met these sample selection requirements. Post Stratification Weights Medicare beneficiaries are assigned to towns based on their 5-digit residence zip code using a cross-walk file that we created to link all valid 5-digit zip codes to a specific city/town. Because of the sample selection criteria that are employed to ensure the potential presence of Medicare claims for all sample beneficiaries during the surveillance period, the age-sex distributions of these estimation samples in towns may differ from that of all aged Medicare beneficiaries actually residing those towns. Post stratification weights for 10 age-sex classes (males 65-69, males 70-74, males 75-79, males 80-84, males 85+, females 65-69, females 70-74, females 75-59, females 80-84, females 85+) were computed for each geographic area in the state defined for respective high prevalence, low prevalence, and lowest prevalence Medicare MBSF indicators. Individual beneficiaries in age-sex groups that are under-represented (over-represented) in the town’s estimation sample relative to the total town beneficiary population are assigned post-stratification weights greater than (less than 1). These weights are computed so that when these post-stratification weights are applied, the weighted age-sex distribution of the estimation sample in each town matched the actual age-sex distribution of all Medicare beneficiaries in the town. Different town-level post-stratification weights are computed for Medicare indicators depending upon on length of the current surveillance period (single-year versus two-year), and for Medicare Part D versus Medicare Parts A & B service utilization rates. In addition, for estimates of state-level prevalence and service utilization rates, another set of post-stratification weights were computed at the state level to ensure that the weighted age-sex distribution of the entire state estimation sample matched the actual beneficiary age-sex distribution for the state. These state-level post-stratification weights did not ensure that the age-sex distribution of the estimation sample in each town matched the town’s actual beneficiary age-sex distribution. In other words, the target population for these adjustments is the state rather than the town.

28
The post-stratification weights for Medicare service utilization rates were applied to beneficiaries in the estimation sample after another adjustment weight was applied. This additional weight is based on the portion of the year that potential claims could have been submitted for Medicare reimbursement. This first adjustment might best be explained with an example. Beneficiary A, who was continuously entitled for Medicare Parts A and B for a full calendar year and was never enrolled in a Medicare Advantage plan, has claims over the full year showing 6 physician visits. These six visits reflect an annual physician visit rate of 6 visits per year. Consider an otherwise identical beneficiary who had six physician visits before his/her death at the end of June. The annualized rate of physician visits for this beneficiary who died before the end of the year is actually 12 visits per year rather than 6 visits per year. However, in contrast to the former beneficiary who survived the full year, the latter beneficiary who died did was only at risk for making a physician visit for one-half of a year. Hence the decedent beneficiary contributed only ½ of a full person-year to the denominator used for calculating a mean physician visit rate for the town. For all Medicare service utilization rate indicators, the service use reported in the MBSF for beneficiaries in the estimation sample are first annualized to reflect the expected utilization with full-year coverage (12 months). Then individual person-weights are assigned to all sample beneficiaries. These weights are equal to the fraction of the year (i.e., # months of full coverage/12) that they had full coverage. Sampled beneficiaries with full-year coverage are assigned a weight of one (12/12) and beneficiaries with less than full-year coverage are assigned a fractional weight less than one. The post-stratification town-level weights were also computed differently for the one-year mortality rates. In this case the weights were computed so that the weighted age-sex distribution of the estimation sample in each individual town population matched the state-wide age-sex distribution of all aged Medicare beneficiaries. By computing the post-stratification weights in this manner, the one-year mortality rate in a town reflects the expected mortality rate if its age-sex beneficiary population composition matched that of the entire state. Some caveats should be noted about what these post stratification weights do and do not do with respect to rate estimation. By applying these weights the prevalence and service utilization rate estimates are adjusted to reflect differences between the age-sex population composition of the sample and that of actual beneficiaries in the town. The age-sex distribution of all aged beneficiaries in each town contains beneficiaries who were excluded from the estimation sample because they did not have a sufficient history of fee-for-service Medicare claims. This includes the exclusion of Medicare Advantage enrollees. If such managed care enrollees are systematically younger than beneficiaries receiving care from fee-for-service providers, younger beneficiaries in the estimation sample will be assigned larger post-stratification weights to reflect their under-representation in the town estimation sample. However, application of these post-stratification weights will not adjust health indicators to reflect any systematic unmeasured health status differences between Medicare Advantage enrollees and fee-for-service beneficiaries within the same age-sex class. Past research has consistently

29
found that Medicare managed care enrollees tend to be healthier than their counterparts receiving care from fee-for-service providers. A recent study suggests that this still is true in the Medicare Advantage program (Morrissey, Kilgore, Becker, Smith, & Delzell, 2013). Also, although the post-stratification town-level weights were also computed for the hospice utilization rates, we could not apply the post-stratification town-level weights for estimation of median day of hospice utilizations and median payment of hospice utilizations due to the fact that STATA 16.0 are not allowed to add the weighting factors. The reported healthy aging indicators derived from the Medicare MBSF strictly only reflect the health status of fee-for-service Medicare beneficiaries. For this reason we report the percentage of Medicare beneficiaries with at least two months of Medicare Advantage enrollment as a town population composition attribute. Some caution should be exercised in interpreting MBSF indicators for towns where the Medicare Advantage market penetration rate is very high. Fixed Effects Estimation of Rates Geographic residence dummy variables were constructed for beneficiaries in the estimation samples defined for the various MBSF indicator groups discussed above. STATA 16.0 was used to estimate separate fixed effects dummy variable ordinary least squares regressions with a suppressed constant on the full beneficiary estimation samples for each MBSF indicator noted in Tables A1 and A2. Beneficiary cases were weighted with individual population weights equal to the computed post-stratification weights for all MBSF indicators, except for Medicare service utilization rates where an additional partial-year weight adjustment was also made. The estimated dummy variable coefficients corresponding to weighted sample mean rates for towns or clusters of smaller towns. These estimated coefficients are the estimated MBSF rates reported in the main tables. Robust standard errors were estimated for the coefficient estimates. The 95% confidence intervals for these estimates are the reported margins of error for the estimates. The state-level estimates for the MBSF indicators along with their 95% confidence intervals are similarly estimated on the sample of all beneficiaries in the state estimation sample using different population weights. The estimates for health indicators derived from Medicare MBSF data and their margins of error are reported for all towns and neighborhoods within Bridgeport, Hartford, New Haven, and Stamford on the community profiles with confidence intervals available for download. We took a conservative approach in distinguishing those indicators where the difference between the town rate and the state rate is statistically significant at the 5% level. We only distinguish those indicators where the 95% confidence interval of the town estimate does not overlap with the 95% confidence interval of the state estimate, as ones where the difference is estimated with enough precision so that the reported difference is unlikely to be due to chance associated with sampling variation. 6. Estimation Methods for Connecticut BRFSS Indicators

30
While there are some similarities in the methodologies used to obtain estimates from Medicare MBSF and Connecticut BRFSS data, there were some important differences due to the complex survey design of the BRFSS and the much smaller respondent samples in the BRFSS. Sample Selection Criteria The selection criteria for the estimation samples used to estimate BRFSS indicators were straightforward. The estimation samples included all BRFSS respondents who were 60 years or older with a valid residence zip code or town code. These selection criteria were applied to BRFSS data from 2012 through 2018. Assignment of Respondents to Geographic Areas As noted earlier, there were 34 BRFSS geographic areas or regions defined for estimation of BRFSS indicators. Before assigning respondents to their appropriate BRFSS area we examined the correspondence between the 5-digit residence zip codes and the town codes reported in the BRFSS data for all respondents satisfying the age requirement for the estimation samples. Using a zip code-to-town crosswalk file described earlier, we identified a relatively small number of cases where the reported zip codes and towns did not match those recorded in the zip code cross-walk data file. The respondent’s self-reported town was accepted over the reported zip code in these situations. If a respondent’s town code was missing but a valid five-digit zip code was reported, the zip code-to-town cross-walk file was used to assign the respondent to a CT city or town.
1. Respondents were assigned to the Connecticut residence town reported in the BRFSS data.
2. If this town code was invalid or missing and the respondent’s residence five-digit zip code was valid, his/her zip code was used to assign them to a city or town.
Over the six-year period 2012-2018, there were 31,540 BRFSS respondents. The zip code correctly matched the self-reported town for 30,003 BRFSS respondents (95.1%). For 454 respondents (1.5%) we either accepted the self-reported town when the zip code was missing, invalid, or did not match the self-reported town, or when the town was missing and the zip code was valid, we accepted the town corresponding to that zip code from the cross-walk file. Finally, there were 1,083 respondents (3.4%) with missing and/or invalid data for both their residence town and zip code who were dropped from the estimation sample. After assigning individual BRFSS respondents to specific towns, they were subsequently assigned to the 34 geographic BRFSS areas via a cross-walk file.

31
Estimation Samples
The estimation samples for specific BRFSS indicators varied depending upon whether the questions were asked of all respondents every year, to all respondents every other year, to all respondents in some years but to fewer respondents in other years, to a subset of respondents based on gender (e.g., use of mammograms). Due to occasional missing data for individual respondents, the sample sizes of the estimation samples also varied among indicators when the same years of BRSS data were used for estimation. For BRFSS indicators based on three years of data (2016-2018) most of the sample sizes exceeded 10,000 respondents. Sample sizes ranged from 10,284 for the stress about paying rent to 14,956 for self-reported fair or poor health status. Sample sizes for indicators estimated with three years (2014, 2016, and 2018) of BRFSS data were as follows: mammography only for women (7,529) and a dentist visit within a year (13,440). Sample sizes for indicators estimated with three years (2013, 2015, and 2017) of BRFSS data were as follows: 5 and more servings of fruit or vegetables (11,686) and cholesterol screening (13,073). Table A-2 contains information about the specific years of data were used to estimate each of the BRFSS indicators. Survey Design and Post–Stratification Weights The BRFSS data are derived from telephone surveys of the non-institutionalized adult population in Connecticut. Since the BRFSS has a complex survey design in with unequal probabilities of respondent selection, statistical analyses of BRFSS data require the application of design weights to account for different probabilities of selection. The BRFSS uses disproportionate stratified sampling in its landline telephone surveys where the sampling rate differs depending on telephone density. There is also geographic stratification in the Connecticut BRFSS sampling where some geographic areas are sampled at a higher rate than other ones. The probabilities of selection differ among BRFSS respondents due to this stratification, telephone availability, type of phone (cell versus landline since 2011), the number of adults in the household, the number of telephones in the household, and rates of nonresponse by households. Since these factors can affect the representativeness of the sample data, survey design weights are produced to adjust for these factors in statistical analyses of BRFSS survey data. In addition to these survey design weights, raking weights are computed so that summed counts of weighted BRFSS respondents match known state population totals along population characteristics, including age, sex, and race/ethnicity, telephone source, education level, marital status, and renter/owner status. Since these “ready-to-use” raking weights provided with BRFSS data are only suitable for state-level estimates we had to compute our own post-stratification weights to derive estimates for BRFSS geographic areas within the state. Town-level population estimates for 12 age-sex classes (males 60-64, males 65-69, males 70-74, males 75-79, males 80-84, males 85+, females 60-64, females 65-69, females 70-74, females 75-59, females 80-84, females 85+) were obtained from the

32
2014-2018 American Community Survey for all cities and towns within Connecticut (https://data.census.gov/cedsci/). Data for individual towns was aggregated into the 34 BRFSS geographic areas described earlier. These BRFSS area age-sex population distributions served as the target population matrix for computation of raked post-stratification weights. Post-stratification weights were computed using an iterative raking procedure in which inflation weights were computed to match by sex and then recomputed to match by age group. This process was repeated until stable post-stratification were obtained. Individual respondents in age-sex groups that were under-represented (over-represented) in the estimation sample relative to the BRFSS area census population distribution were assigned weights greater than (less than 1) so that when these post-stratification weights are applied, the weighted age-sex distribution of the estimation sample matched the 2014-2018 ACS age-sex distribution of each BRFSS area. Different post-stratification weights are computed for groups of indicators depending upon how many years and which years of BRFSS data were pooled together for the estimation sample. As noted earlier depending upon the health indicator, different years of BRFSS data were pooled together. For state-level BRFSS estimates another set of post-stratification weights were computed at the state level to ensure that the sum of weighted age-sex counts of the entire estimation sample matched the 2014-2018 ACS age-sex distribution for the state of Connecticut. These state-level post-stratification weights did not ensure that the age-sex distribution of the estimation sample for each BRFSS area matched the ACS age-sex population distribution for BRFSS area. In other words, the target population for these latter adjustments was the entire state rather than individual BRFSS geographic areas. The final population weights for individual BRFSS respondents are computed by multiplying the BRFSS survey design weights by our own computed raked post-stratification weights. Fixed Effects Estimation of Rates Geographic residence dummy variables were constructed for each respondent in the various sample populations used to estimating the set of BRFSS indicators. Because of the complex survey design of the BRFSS, a survey design effect regression procedure in Stata 16.0 “regress” was used for parameter estimation. Separate fixed effects dummy variable ordinary least squares regressions with a suppressed constant are estimated on appropriate estimation samples for all BRFSS indicators shown in Tables A-1 and A-2. Respondent cases were weighted with individual population weights equal to the BRFSS survey design weight multiplied by our computed raked post-stratification weights described above.3 The estimated coefficients for the geographic dummy variables from the regression models are the estimated rates for BRFSS geographic areas. The same estimated rates are reported for all individual cities and towns comprising the BRFSS geographic areas. The 95% confidence intervals for these estimates reflect the margins of error of the estimates. State-level estimates for each
3 Weighted ordinary least squares regression was also used to obtain estimates with robust standard
errors without the standard Stata regress procedure. These estimates were virtually identical to those obtained with the Stata svy procedure.

33
BRFSS indicator along with their 95% confidence intervals were similarly estimated using weighted data from the full state estimation samples. The estimates for health indicators derived from BRFSS data and their confidence intervals are reported all towns on the community profiles with confidence intervals available for download. We take a conservative approach in distinguishing those indicators where the difference between the BRFSS geographic area rate and the state rate is statistically significant at the 5% level. We only distinguish those indicators as significant where the BRFSS area 95% confidence interval does not overlap with the state 95% confidence interval as ones where there the difference between the BRFSS area and state estimates is unlikely to be due to chance associated with sampling variation. We note that fewer BRFSS indicator estimates are distinguished as differing significantly from the state estimates than was found for Medicare MBSF town-level estimates. This is a consequence of the much smaller sample populations used to estimate the BRFSS indicators. Some caution should be exercised in interpreting differences between the BRFSS indicators reported for individual towns for several reasons. First, rates for which there is no distinction made regarding the statistical significance of the difference between the town and the state rate may be due to sampling variation. Second, data from multiple towns was pooled together to obtain estimates for the larger BRFSS geographic areas and the same estimates are reported for all towns within the geographic area. Actual BRFSS indicators are likely vary among individual towns that constitute the BRFSS areas. Unfortunately, BRFSS samples were too small to generate town-level estimates for most individual cities and towns.

34
REFERENCES Centers for Medicare and Medicaid Services (CMS). (2012). Chronic Conditions among Medicare Beneficiaries, Chartbook, 2012 Edition. Baltimore, MD. Retrieved from cms.gov/Research-Statistics-Data-and-Systems/Statistics-Trends-and-Reports/Chronic-Conditions/Downloads/2012Chartbook.pdf Centers for Medicare and Medicaid Services (CMS). (2018). CCW Technical Guidance: Calculating Medicare Population Statistics. Retrieved from https://www2.ccwdata.org/documents/10280/19002248/ccw-technical-guidance-calculating-medicare-population-statistics.pdf Gerontology Institute, University of Massachusetts Boston, "The National Elder Economic Security Standard Index" (2012). Gerontology Institute Publications. 75. https://scholarworks.umb.edu/gerontologyinstitute_pubs/75 Gorina, Y. & Kramarow, E. A. (2011). Identifying chronic conditions in Medicare claims data: Evaluating the Chronic Condition Data Warehouse algorithm. Health Services Research, 46, 1610-1627. Morrissey, M. A., Kilgore, M. L., Becker, D. J., Smith, W., & Delzell, E. (2013). Favorable selection, risk adjustment and the Medicare Advantage Program. Health Services Research, 48, 1039-1056. Porell, F. W., & Miltiades, H. B. (2001). Access to care and functional status change among aged Medicare beneficiaries. Journals of Gerontology Social Sciences, 56, S69-S83. The Centers for Disease Control and Prevention (CDC) (2013). The BRFSS Data User Guide. Retrieved from http://www.cdc.gov/brfss/data_documentation/index.htm

35
Table A1: Connecticut Healthy Aging Indicator Definitions
INDICATORS DEFINITION
POPULATION CHARACTERISTICS
Total population all ages The number of all persons in the state or community.
Population 60 years or older as % of total population
The percentage of persons 60 years or older among the total population.
Total population 60 years or older The number of persons 60 years or older.
Population 65 years or older as % of total population
The percentage of persons 65 years or older among the total population.
Total population 65 years or older The number of persons 65 years or older.
% 65-74 years The percentage of persons 65-74 years among population aged 65 year or older.
% 75-84 years The percentage of persons 75-84 years among population aged 65 year or older.
% 85 years or older The percentage of persons 85+ years among population aged 65 year or older.
% 65+ population who are female The percentage of females 65 years or older among population aged 65 year or older.
% 85+ population who are female The percentage of females 85 years or older among population aged 65 year or older.
% White
The percentage of persons 65 years or older reporting their race as “White” or reporting entries such as Irish, German, Italian, Lebanese, Arab, Moroccan, or Caucasian.
% African American
The percentage of persons 65 years or older reporting their race as “Black or African American” or reporting entries such as African American, Kenyan, Nigerian, or Haitian.
% Asian
The percentage of persons 65 years or older reporting their race as “Asian Indian,” “Chinese,” Filipino,” “Korean,” “Japanese,” Vietnamese,” and “Other Asian” or provide other detailed Asian responses.
% Other race
The percentage of persons 65 years or older reporting their race as “American Indian or Alaska Native” or “Native Hawaiian or other Pacific Islander”, or reporting entries such as Navajo, Blackfeet, Inupiat, Yup’ik, or Central American Indian groups, or South American Indian groups.
% Hispanic/Latino The percentage of persons 65 years or older reporting their origin as “Hispanic or Latino”.

36
INDICATORS DEFINITION
% married
The percentage of persons 65 years or older reporting that they are currently married with spouse present or with spouse absent due to employment, living away from home, institutionalization, or serving away from home in the Armed Forces.
% divorced/separated
The percentage of persons 65 years or older reporting that they are legally divorced and who have not remarried, or they are legally separated or otherwise absent from their spouse because of marital discord.
% widowed The percentage of persons 65 years or older reporting they are widows and widowers who have not remarried.
% never married The percentage of persons 65 years or older reporting they have never been married, including people whose only marriage(s) was annulled.
% with less than high school education
The percentage of persons 65 years or older reporting they have completed less than 9th grade, or 9th grade to 12th grade with no diploma.
% with high school or some college
The percentage of persons 65 years or older reporting they have graduated from high school, attended a college but did not receive a degree, or received an associate’s degree.
% with college degree The percentage of persons 65 years or older reporting they received a bachelor’s degree.
% with graduate or professional degree
The percentage of persons 65 years or older reporting they received a master’s, or professional or doctorate degree.
% 65+ population who speak only English at home
The percentage of persons 65 years or older reporting that no language other than English is spoken at home.
% 65+ population who are veterans of military service
The percentage of persons 65 years or older reporting to have served in the military forces for the United States (Army, Navy, Air Force, Marine Corps, or Coast Guard) in time of war or peace.
% of 60+ who are LGBT
The percentage of persons 60 years or older who did not respond “heterosexual” to the question: “Do you consider yourself to be: Heterosexual that is straight; Homosexual that is gay or lesbian; Bisexual; or Other?”
Median age of females The median age among females.
Median age of males The median age among males.
Life expectancy at birth The number of years a person can expect to live at birth

37
INDICATORS DEFINITION
Age-sex adjusted 1-year mortality rate
The percentage of Medicare beneficiaries 65 years or older on January 1, 2017 who lived in the same community for both 2016 and 2017 and who died in 2017 (beneficiary population is weighted to match state age-sex distribution of aged Medicare beneficiaries.
WELLNESS
% 60+ getting recommended hours of sleep
The percentage of persons 60 years or older reporting average hours (7 or 8 hours for age 60-64 years and 7, 8, or 9 hours for age 65 years or older) of sleeping in a 24 period.
% 60+ with any physical activity within last month
The percentage of persons 60 years or older who answered yes to the question- “During the past month, (other than your regular job) did you participate in any physical activities such as running, calisthenics, golf, gardening or walking for exercise?”
% 60+ met CDC guidelines for muscle-strengthening activity
The percentage of persons 60 years or older who met CDC guidelines for muscle-strengthening activity.
% 60+ met CDC guidelines for aerobic physical activity
The percentage of persons 60 years or older who met CDC guidelines for aerobic physical activity.
% 60+ with fair or poor health status The percentage of persons 60 years or older reporting fair or poor to question: “Would you say that in general your health is: excellent, very good, fair, poor?”
% 60+ with 15+ physically unhealthy days last month
The percentage of persons 60 years or older reporting at least 15 days to the question- “Now thinking about your physical health, which includes physical illness and injury, for how many days during the past 30 days was your physical health not good?”
FALLS
% 60+ who fell within last year The percentage of persons 60 years or older reporting to have fallen at least once in the past 12 months.
% 60+ who were injured in a fall within last year
The percentage of persons 60 years or older reporting to have fallen at least once in the past 12 months resulting in injury (defined as causing one to limit regular activities for at least a day or to go see a doctor).
% 65+ had hip fracture
The percentage of Medicare beneficiaries 65 years or older in 2017 who ever met the claims-based criteria indicating a hip/pelvic fracture since 1999. These criteria are having at least 1 inpatient or skilled nursing facility Medicare claim with appropriate diagnosis codes during a 1-year period.

38
INDICATORS DEFINITION
PREVENTION
% 60+ with physical exam/check-up in last year
The percentage of persons age 60 years or older who reporting seeing a doctor for a regular check-up within the past year.
% 60+ flu shot in last year
The percentage of persons age 60 years or older who answered yes to the question- “During the past 12 months, have you had a seasonal flu shot (or seasonal flu vaccine that was sprayed in your nose [added in 2010])?”
% 60+ with pneumonia vaccine The percentage of persons age 60 years or older who reported ever having a pneumonia vaccination.
% 60+ with shingles vaccine The percentage of persons age 60 years or older who reported ever having a shingles vaccination
% 60+ women with a mammogram within last 2 years
The percentage of women 60 years or older whose last mammogram was two years ago or less.
% 60+ with colorectal cancer screening
The percentage of persons age 60 years or older whose last proctoscopy exam was five years ago or less.
% 60+ with HIV test The percentage of persons age 60 years or older who answered yes to the question- “Have you ever been tested for HIV?”
% 60+ met CDC preventive health screening goals
The percentage of persons age 60 or older who were up to date on Centers for Disease Control and Prevention health screening goals for flu shot, colorectal cancer screening, pneumonia vaccine, and mammograms (women only).
NUTRITION/DIET
% 60+ with 5 or more servings of fruit or vegetables per day
The percentage of persons 60 years or older reporting to have eaten five or more servings of fruit or vegetables per day in the last month.
% 65+ with poor supermarket access The percentage of persons age 65 and over who are beyond 1 mile (in urban) or 10 miles (in rural) from supermarkets.
% 60+ stressed about buying food in last month
The percentage of persons 60 years or older reporting stress about buying food in the last month.
% 60+ self-reported obese The percentage of persons 60 years or older with a body mass index of 30 or higher.
% 65+ clinically diagnosed obese
The percentage of Medicare beneficiaries 66 years or older in 2017 who ever met the claims-based criteria indicating obesity since 1999. These criteria are having at least one inpatient or skilled nursing facility Medicare claim, or two hospital outpatient or Part B Medicare claims with appropriate diagnosis codes during a 2-year period.

39
INDICATORS DEFINITION
% 65+ with high cholesterol
The percentage of Medicare beneficiaries 65 years or older in 2017 who ever met the claims-based criteria indicating high cholesterol since 1999. These criteria are having at least one inpatient or skilled nursing facility Medicare claim, or two hospital outpatient or Part B Medicare claims with appropriate diagnosis codes during a 1-year period.
% 60+ with cholesterol screening The percentage of persons age 60 years or older who had their cholesterol checked within past 5 years.
ORAL HEALTH
% 60+ with dental insurance The percentage of persons age 60 years or older who reporting having a dental insurance within the past year.
% 60+ with annual dental exam The percentage of persons age 60 years or older who reporting visiting a dentist or dental clinic within the past year.
# dentists per 100,000 persons (all ages)
The number of professionally active dentists per 100,000 persons.
% 60+ with loss of 6 or more teeth The percentage of persons 60 years or older reporting to have had 6 or more teeth removed because of tooth decay or gum disease.
CHRONIC DISEASE
% 65+ with Alzheimer’s disease or related dementias
The percentage of Medicare beneficiaries 66 years or older in 2017 who ever met the claims-based criteria indicating Alzheimer’s disease or related dementia since 1999. These criteria are having at least one inpatient, skilled nursing facility, home health, hospital outpatient or Part B Medicare claim with appropriate diagnosis codes during a 3-year period.
% 65+ with anemia
The percentage of Medicare beneficiaries 65 years or older in 2017 who ever met the claims-based criteria indicating anemia since 1999. These criteria are having at least one inpatient, skilled nursing facility, or home health Medicare claim or at least one Part B Medicare claim with appropriate diagnosis codes during a 1-year period.
% 65+ with asthma
The percentage of Medicare beneficiaries 65 years or older in 2017 who ever met the claims-based criteria indicating asthma since 1999. These criteria are having at least one inpatient, skilled nursing facility, or home health Medicare claim or at least 2 hospital outpatient or Part B Medicare claims with appropriate diagnosis codes during a 1-year period.

40
INDICATORS DEFINITION
% 65+ with atrial fibrillation
The percentage of Medicare beneficiaries 65 years or older in 2017 who ever met the claims-based criteria indicating atrial fibrillation since 1999. These criteria are having at least one inpatient Medicare claim, or at least 2 hospital outpatient or Part B Medicare claims with appropriate diagnosis codes during a 1-year period.
% 65+ with autism spectrum disorders
The percentage of Medicare beneficiaries 66 years or older in 2017 who ever met the claims-based criteria indicating autism spectrum disorders since 1999. These criteria are having at least one inpatient or skilled nursing facility Medicare claim, or two hospital outpatient or Part B Medicare claims with appropriate diagnosis codes during a 2-year period.
% 65+ with benign prostatic hyperplasia (men)
The percentage of Medicare beneficiaries 65 years or older in 2017 who ever met the claims-based criteria indicating benign prostatic hyperplasia since 1999. These criteria are having at least one inpatient, skilled nursing facility, or home health Medicare claim or at least 2 hospital outpatient or Part B Medicare claims with appropriate diagnosis codes during a 1-year period.
% 65+ with breast cancer (women)
The percentage of female Medicare beneficiaries 65 years or older in 2017 who ever met the claims-based criteria indicating breast cancer since 1999. These criteria are having at least one inpatient or skilled nursing facility Medicare claims or at least 2 hospital outpatient or Part B Medicare claims (or any combination of outpatient or Part B claims at least a day apart) with appropriate diagnosis codes during a 1-year period.
% 65+ with cataract
The percentage of Medicare beneficiaries 65 years or older in 2017 who ever met the claims-based criteria indicating cataract since 1999. These criteria are having at least one Part B Medicare claims with appropriate diagnosis codes during a 1-year period.
% 65+ with chronic kidney disease
The percentage of Medicare beneficiaries 65 years or older in 2017 who ever met the claims-based criteria indicating chronic kidney disease since 1999. These criteria are having at least one inpatient, skilled nursing facility Medicare claim or at least 2 hospital outpatient or Part B Medicare claims with appropriate diagnosis codes during a 2-year period.
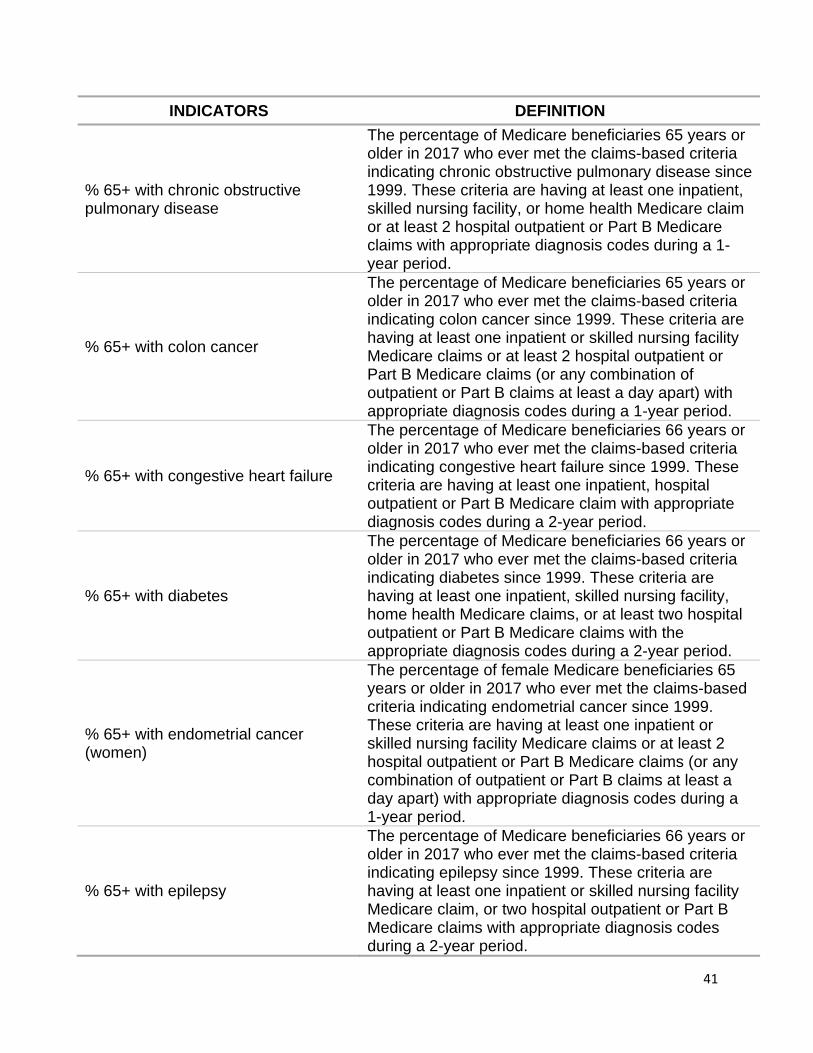
41
INDICATORS DEFINITION
% 65+ with chronic obstructive pulmonary disease
The percentage of Medicare beneficiaries 65 years or older in 2017 who ever met the claims-based criteria indicating chronic obstructive pulmonary disease since 1999. These criteria are having at least one inpatient, skilled nursing facility, or home health Medicare claim or at least 2 hospital outpatient or Part B Medicare claims with appropriate diagnosis codes during a 1-year period.
% 65+ with colon cancer
The percentage of Medicare beneficiaries 65 years or older in 2017 who ever met the claims-based criteria indicating colon cancer since 1999. These criteria are having at least one inpatient or skilled nursing facility Medicare claims or at least 2 hospital outpatient or Part B Medicare claims (or any combination of outpatient or Part B claims at least a day apart) with appropriate diagnosis codes during a 1-year period.
% 65+ with congestive heart failure
The percentage of Medicare beneficiaries 66 years or older in 2017 who ever met the claims-based criteria indicating congestive heart failure since 1999. These criteria are having at least one inpatient, hospital outpatient or Part B Medicare claim with appropriate diagnosis codes during a 2-year period.
% 65+ with diabetes
The percentage of Medicare beneficiaries 66 years or older in 2017 who ever met the claims-based criteria indicating diabetes since 1999. These criteria are having at least one inpatient, skilled nursing facility, home health Medicare claims, or at least two hospital outpatient or Part B Medicare claims with the appropriate diagnosis codes during a 2-year period.
% 65+ with endometrial cancer (women)
The percentage of female Medicare beneficiaries 65 years or older in 2017 who ever met the claims-based criteria indicating endometrial cancer since 1999. These criteria are having at least one inpatient or skilled nursing facility Medicare claims or at least 2 hospital outpatient or Part B Medicare claims (or any combination of outpatient or Part B claims at least a day apart) with appropriate diagnosis codes during a 1-year period.
% 65+ with epilepsy
The percentage of Medicare beneficiaries 66 years or older in 2017 who ever met the claims-based criteria indicating epilepsy since 1999. These criteria are having at least one inpatient or skilled nursing facility Medicare claim, or two hospital outpatient or Part B Medicare claims with appropriate diagnosis codes during a 2-year period.
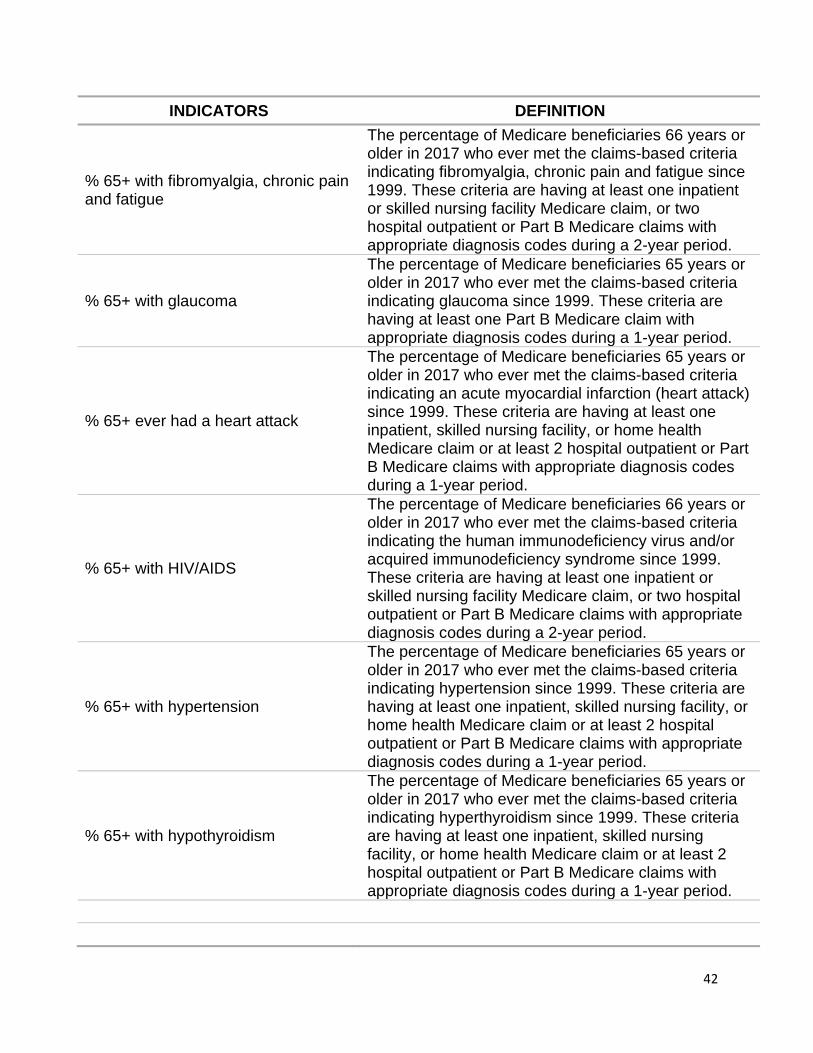
42
INDICATORS DEFINITION
% 65+ with fibromyalgia, chronic pain and fatigue
The percentage of Medicare beneficiaries 66 years or older in 2017 who ever met the claims-based criteria indicating fibromyalgia, chronic pain and fatigue since 1999. These criteria are having at least one inpatient or skilled nursing facility Medicare claim, or two hospital outpatient or Part B Medicare claims with appropriate diagnosis codes during a 2-year period.
% 65+ with glaucoma
The percentage of Medicare beneficiaries 65 years or older in 2017 who ever met the claims-based criteria indicating glaucoma since 1999. These criteria are having at least one Part B Medicare claim with appropriate diagnosis codes during a 1-year period.
% 65+ ever had a heart attack
The percentage of Medicare beneficiaries 65 years or older in 2017 who ever met the claims-based criteria indicating an acute myocardial infarction (heart attack) since 1999. These criteria are having at least one inpatient, skilled nursing facility, or home health Medicare claim or at least 2 hospital outpatient or Part B Medicare claims with appropriate diagnosis codes during a 1-year period.
% 65+ with HIV/AIDS
The percentage of Medicare beneficiaries 66 years or older in 2017 who ever met the claims-based criteria indicating the human immunodeficiency virus and/or acquired immunodeficiency syndrome since 1999. These criteria are having at least one inpatient or skilled nursing facility Medicare claim, or two hospital outpatient or Part B Medicare claims with appropriate diagnosis codes during a 2-year period.
% 65+ with hypertension
The percentage of Medicare beneficiaries 65 years or older in 2017 who ever met the claims-based criteria indicating hypertension since 1999. These criteria are having at least one inpatient, skilled nursing facility, or home health Medicare claim or at least 2 hospital outpatient or Part B Medicare claims with appropriate diagnosis codes during a 1-year period.
% 65+ with hypothyroidism
The percentage of Medicare beneficiaries 65 years or older in 2017 who ever met the claims-based criteria indicating hyperthyroidism since 1999. These criteria are having at least one inpatient, skilled nursing facility, or home health Medicare claim or at least 2 hospital outpatient or Part B Medicare claims with appropriate diagnosis codes during a 1-year period.

43
INDICATORS DEFINITION
% 65+ with ischemic heart disease
The percentage of Medicare beneficiaries 66 years or older in 2017 who ever met the claims-based criteria indicating ischemic heart disease since 1999. These criteria are having at least one inpatient, skilled nursing facility, or home health, hospital outpatient or Part B Medicare claim with appropriate diagnosis codes during a 2-year period.
% 65+ with leukemias and lymphomas
The percentage of Medicare beneficiaries 66 years or older in 2017 who ever met the claims-based criteria indicating leukemia’s and lymphomas since 1999. These criteria are having at least one inpatient or skilled nursing facility Medicare claim, or two hospital outpatient or Part B Medicare claims with appropriate diagnosis codes during a 2-year period.
% 65+ with liver disease
The percentage of Medicare beneficiaries 66 years or older in 2017 who ever met the claims-based criteria indicating liver diseases since 1999. These criteria are having at least one inpatient or skilled nursing facility Medicare claim, or two hospital outpatient or Part B Medicare claims with appropriate diagnosis codes during a 2-year period.
% 65+ with lung cancer
The percentage of male Medicare beneficiaries 65 years or older in 2017 who ever met the claims-based criteria indicating lung cancer since 1999. These criteria are having at least one inpatient or skilled nursing facility Medicare claims or at least 2 hospital outpatient or Part B Medicare claims (or any combination of outpatient or Part B claims at least a day apart) with appropriate diagnosis codes during a 1-year period.
% 65+ with migraine and other chronic headache
The percentage of Medicare beneficiaries 66 years or older in 2017 who ever met the claims-based criteria indicating migraine and other chronic headache since 1999. These criteria are having at least one inpatient or skilled nursing facility Medicare claim, or two hospital outpatient or Part B Medicare claims with appropriate diagnosis codes during a 2-year period.
% 65+ with osteoarthritis or rheumatoid arthritis
The percentage of Medicare beneficiaries 65 years or older in 2017 who ever met the claims-based criteria indicating osteoarthritis/rheumatoid arthritis since 1999. These criteria are having at least 2 inpatient, skilled nursing facility, home health, hospital outpatient, or Part B Medicare claims (or any combination of claim types at least one day apart) with appropriate diagnosis codes during a 1-year period.

44
INDICATORS DEFINITION
% 65+ with osteoporosis
The percentage of Medicare beneficiaries 65 years or older in 2011 who ever met the claims-based criteria indicating osteoporosis since 1999. These criteria are having at least one inpatient, skilled nursing facility, home health Medicare claims or at least 2 hospital outpatient or Part B Medicare claims with appropriate diagnosis codes during a 1-year period.
% 65+ with peripheral vascular disease
The percentage of Medicare beneficiaries 66 years or older in 2017 who ever met the claims-based criteria indicating peripheral vascular disease since 1999. These criteria are having at least one inpatient or skilled nursing facility Medicare claim, or two hospital outpatient or Part B Medicare claims with appropriate diagnosis codes during a 2-year period.
% 65+ with pressure ulcer or chronic ulcer
The percentage of Medicare beneficiaries 66 years or older in 2017 who ever met the claims-based criteria indicating pressure ulcer or chronic ulcer disease since 1999. These criteria are having at least one inpatient or skilled nursing facility Medicare claim, or two hospital outpatient or Part B Medicare claims with appropriate diagnosis codes during a 2-year period.
% 65+ with prostate cancer (men)
The percentage of male Medicare beneficiaries 65 years or older in 2017 who ever met the claims-based criteria indicating prostate cancer since 1999. These criteria are having at least one inpatient or skilled nursing facility Medicare claims or at least 2 hospital outpatient or Part B Medicare claims (or any combination of outpatient or Part B claims at least a day apart) with appropriate diagnosis codes during a 1-year period.
% 65+ with stroke
The percentage of Medicare beneficiaries 65 years or older in 2017 who ever met the claims-based criteria indicating a transient ischemic attack (stroke) since 1999. These criteria are having at least one inpatient Medicare claim or at least 2-hospital outpatient or Part B Medicare claim with appropriate diagnosis codes during a 1-year period.
% 65+ with traumatic brain injury
The percentage of Medicare beneficiaries 66 years or older in 2017 who ever met the claims-based criteria indicating traumatic brain injury since 1999. These criteria are having at least one inpatient or skilled nursing facility Medicare claim, or two hospital outpatient or Part B Medicare claims with appropriate diagnosis codes during a 2-year period.

45
INDICATORS DEFINITION
% 65+ with 4+ (out of 15) chronic conditions
The percentage of Medicare beneficiaries 66 years or older in 2017 who ever met the claims-based criteria indicating at least 4 of 15 chronic conditions since 1999. The 15 chronic conditions include Alzheimer’s disease or related dementia, asthma, atrial fibrillation, cancer (breast, colorectal, lung, and prostate), chronic kidney disease, chronic obstructive pulmonary disease (COPD), depression, diabetes, congestive heart failure, hypertension, hyperlipidemia (cholesterol) ischemic heart disease, osteoporosis, osteoarthritis/rheumatoid arthritis, and stroke.
% 65+ with 0 chronic conditions
The percentage of Medicare beneficiaries 66 years or older in 2017 who never ever met the claims-based criteria indicating any of 15 chronic conditions since 1999.
BEHAVIORAL HEALTH
# of drug overdose deaths (all ages) Number of confirmed drug overdose deaths for all intents by city/town of residence for the decedent among Connecticut residents in 2012-2018
% 65+ with opioid use disorder
The percentage of Medicare beneficiaries 66 years or older in 2017 who ever met the claims-based criteria indicating overarching opioid use disorder indicator, which identifies whether a beneficiary met any of the three opioid-related sub-Indicators as of the end of the calendar year. These criteria are having at least one inpatient or skilled nursing facility Medicare claim, or two hospital outpatient or Part B Medicare claims with appropriate diagnosis codes during a 2-year period.
% 65+ with substance use disorder
The percentage of Medicare beneficiaries 66 years or older in 2017 who ever met the claims-based criteria indicating drug use or alcohol abuse disorders since 1999. These criteria are having at least one inpatient or skilled nursing facility Medicare claim, or two hospital outpatient or Part B Medicare claims with appropriate diagnosis codes during a 2-year period.
% 60+ who used marijuana in last month
The percentage of persons age 60 years or older who answered yes to the question- “During the past 30 days, on how many days did you use marijuana or hashish?”

46
INDICATORS DEFINITION
% 60+ excessive drinking
The percentage of persons 60 years or older reporting excessive alcoholic drinking during the past month. For men excessive drinking is defined as consuming 60 or more alcoholic drinks in the past month or consuming 5 or more alcoholic drinks on at least one occasion during the past month. For women excessive drinking is defined as consuming 30 or more alcoholic drinks in the past month or consuming 4 or more alcoholic drinks on at least one occasion during the past month. One drink is equivalent to a 12-ounce beer, a 5-ounce glass of wine, or a drink with one shot of liquor.
% 65+ with tobacco use disorders
The percentage of Medicare beneficiaries 66 years or older in 2017 who ever met the claims-based criteria indicating tobacco disorders since 1999. These criteria are having at least one inpatient or skilled nursing facility Medicare claim, or two hospital outpatient or Part B Medicare claims with appropriate diagnosis codes during a 2-year period.
% 60+ current smokers The percentage of persons 60 years or older reporting to have ever smoked at least 100 cigarettes and who now smoke on some or all days.
% 60+ ever used E-Cigarettes in last month
The percentage of persons age 60 years or older who answered yes to the question- “Have you ever used an e-cigarette or other electronic “vaping” product, even just one time, in your entire life?”
MENTAL HEALTH
% 60+ who reported receiving adequate emotional support
The percentage of persons 60 years or older responding always or usually to the question- “How often do you get the emotional support you need?”
% 60+ who reported being satisfied with life
The percentage of persons 60 years or older responding very satisfied or satisfied to the question- “In general, how satisfied are you with your life?”
% 60+ with 15+ days poor mental health last month
The percentage of persons 60 years or older reporting at least 15 days to the question- “Now thinking about your mental health, which includes stress, depression, and problems with emotions, for how many days during the past 30 days was your mental health not good?”

47
INDICATORS DEFINITION
% 65+ with depression
The percentage of Medicare beneficiaries 65 years or older in 2017 who ever met the claims-based criteria indicating depression since 1999. These criteria are having at least one inpatient, skilled nursing facility, home health, outpatient or Part B Medicare claim with appropriate diagnosis codes during a 1-year period.
% 65+ with anxiety disorder
The percentage of Medicare beneficiaries 66 years or older in 2017 who ever met the claims-based criteria indicating anxiety disorders since 1999. These criteria are having at least one inpatient or skilled nursing facility Medicare claim, or two hospital outpatient or Part B Medicare claims with appropriate diagnosis codes during a 2-year period.
% 65+ with bipolar disorder
The percentage of Medicare beneficiaries 66 years or older in 2017 who ever met the claims-based criteria indicating bipolar disorders since 1999. These criteria are having at least one inpatient or skilled nursing facility Medicare claim, or two hospital outpatient or Part B Medicare claims with appropriate diagnosis codes during a 2-year period.
% 65+ with post-traumatic stress disorder
The percentage of Medicare beneficiaries 66 years or older in 2017 who ever met the claims-based criteria indicating post-traumatic stress disorders since 1999. These criteria are having at least one inpatient or skilled nursing facility Medicare claim, or two hospital outpatient or Part B Medicare claims with appropriate diagnosis codes during a 2-year period.
% 65+ with schizophrenia & other psychotic disorders
The percentage of Medicare beneficiaries 66 years or older in 2017 who ever met the claims-based criteria indicating schizophrenia & other psychotic disorders since 1999. These criteria are having at least one inpatient or skilled nursing facility Medicare claim, or two hospital outpatient or Part B Medicare claims with appropriate diagnosis codes during a 2-year period.
% 65+ with personality disorder
The percentage of Medicare beneficiaries 66 years or older in 2017 who ever met the claims-based criteria indicating personality disorders since 1999. These criteria are having at least one inpatient or skilled nursing facility Medicare claim, or two hospital outpatient or Part B Medicare claims with appropriate diagnosis codes during a 2-year period.

48
INDICATORS DEFINITION
LIVING WITH DISABILITY
% 65+ with self-reported hearing difficulty
The percentage of persons age 65 or older reporting to be deaf or has serious difficulty hearing.
% 65+ with clinical diagnosis of deafness or hearing impairment
The percentage of Medicare beneficiaries 66 years or older in 2017 who ever met the claims-based criteria indicating deafness or hearing impairment since 1999. These criteria are having at least one inpatient or skilled nursing facility Medicare claim, or two hospital outpatient or Part B Medicare claims with appropriate diagnosis codes during a 2-year period.
% 65+ with self-reported vision difficulty
The percentage of persons age 65 or older reporting to be blind or has serious difficulty seeing even with corrective lenses.
% 65+ with clinical diagnosis of blindness or visual impairment
The percentage of Medicare beneficiaries 66 years or older in 2017 who ever met the claims-based criteria indicating blindness or visual impairment since 1999. These criteria are having at least one inpatient or skilled nursing facility Medicare claim, or two hospital outpatient or Part B Medicare claims with appropriate diagnosis codes during a 2-year period.
% 65+ with self-reported cognition difficulty
The percentage of persons age 65 or older reporting cognitive difficulties (such as learning, remembering, concentrating, or making decisions) because of a physical, mental, or emotional condition.
% 65+ with self-reported ambulatory difficulty
The percentage of persons age 65 or older reporting to have a condition that substantially limits one or more basic activities, such as walking, climbing stairs, reaching, lifting, or carrying.
% 65+ with clinical diagnosis of mobility impairments
The percentage of Medicare beneficiaries 66 years or older in 2017 who ever met the claims-based criteria indicating mobility impairments since 1999. These criteria are having at least one inpatient or skilled nursing facility Medicare claim, or two hospital outpatient or Part B Medicare claims with appropriate diagnosis codes during a 2-year period.
% 65+ with self-reported self-care difficulty
The percentage of persons age 65 or older reporting to have a physical or mental health condition that has lasted at least 6 months and makes it difficult for them to take care of their own personal need, such as bathing, dressing, or getting around inside the home.

49
INDICATORS DEFINITION
% 65+ with self-reported independent living difficulty
The percentage of persons age 65 or older reporting to have a physical, mental, or emotional condition lasting six months or more that makes it difficult or impossible to perform basic activities outside the home alone.
CAREGIVING
# of caregiver support groups A count of dementia-rated support groups in the city/town.
# of Memory cafes A count of memory cafés in the city/town.
% of 60+ who provide care to a family/friend in last month
The percentage of persons age 60 years or older who answered yes to the question- “During the past 30 days, did you provide regular care or assistance to a friend or family member who has a health problem or disability?”
% of grandparents raising grandchildren
The percentage of grandparents who are financially responsible for any or all grandchildren living in the household.
% of grandparents who live with grandchildren
The percentage of grandparents who are living with a grandchild in the household.
ACCESS TO CARE
% 65+ dually eligible for Medicare and Medicaid
The percentage of Medicare beneficiaries age 65 years or older with at least one month of full or restricted Medicaid entitlement in 2017. (Beneficiaries with restricted Medicaid entitlement are only entitled to some Medicaid benefits (e.g., drug coverage only, and/or premium/copayments for services).
% 65+ Medicare managed care enrollees
The percentage of Medicare beneficiaries age 65 years or older enrolled in a Medicare managed care plan (Medicare Advantage) for at least 1 month in 2017.
% 60+ with a regular doctor The percentage of persons 60 years or older reporting to have a personal doctor or health care provider.
% 60+ who did not see doctor when needed due to cost
The percentage of persons 60 years or older responding yes to the question-“Was there a time during the last 12 months when you needed to see a doctor but could not due to the cost?”
# of primary care providers within 5 miles
A count of primary care provider (i.e., family practice, general practice, geriatric medicine, and internal medicine) within 5 miles of the center of the city/town.
# of hospitals within 5 miles A count of short-term general hospitals within 5 miles of the center of the city/town.
# of home health agencies in same town
A count of home health agencies serving patients living in the city/town.

50
INDICATORS DEFINITION
# of nursing homes within 5 miles A count of Medicare-certified nursing homes within 5 miles of the center of the city/town.
# of community health centers A count of community health centers in the city/town.
# of adult day health centers A count of adult day health centers in the city/town.
# of hospice agencies A count of hospice agencies in the city/town.
SERVICE UTILIZATION
# physician visits per year Average Part B physician office visit evaluation and management services received in 2017 by Medicare beneficiaries 65 years or older.
# emergency room visits/1000 persons 65+ years annually
Average number of emergency department visits (where beneficiaries were released or admitted to a hospital) in 2017 per 1,000 Medicare beneficiaries 65 years or older.
# Part D monthly prescription fills per person annually
Average number of standard 30 days supplies of a filled Part D prescription in 2017 by Medicare beneficiaries 65 years or older.
# home health visits per year Average home health visits in 2017 per Medicare beneficiary 65 years or older.
# durable medical equipment claims annually
Average Part B durable medical equipment services received in 2017 by Medicare beneficiaries 65 years or older.
# inpatient hospital stays/1000 persons 65+ years annually
A count of inpatient hospital discharges in 2017 per 1,000 Medicare beneficiaries 65 years or older.
% Medicare inpatient hospital readmissions (as % of admissions)
The percentage of inpatient hospital discharges for Medicare beneficiaries 65 years or older which were followed by an admission to an acute care hospital for any cause within 30 days.
# skilled nursing facility stays/1000 persons 65+ years annually
A count of skilled nursing facility discharges in 2017 per 1,000 Medicare beneficiaries 65 years or older.
# skilled nursing home Medicare beds/1000 persons 65+ years
The number of Medicare- certified nursing home beds in the community per 1,000 Medicare beneficiaries age 65 years or older in 2017.
% 65+ getting Medicaid long term services and supports
The percentage of Medicare beneficiaries age 65 years or older enrolled who had $0 cost-sharing for Medicare Part D for at least 1 month in 2017. (Dual-eligible beneficiaries who are either nursing home residents or who receive Medicaid-financed long term supports and services have $0 Part D cost sharing.

51
INDICATORS DEFINITION
% of 65+ hospice users
The percentage of Medicare beneficiaries 65 years or older in 2017 who ever met the claims-based criteria indicating any of Medicare covered days in the hospice setting in 2017 during a 1-year period. These criteria are having at least one Part B Medicare claims with appropriate diagnosis codes or Medicare managed care plan (Medicare Advantage) for at least 1 month in 2017.
% of 65+ hospice users as % of decedents
The percentage of Medicare beneficiaries 65 years or older in 2016 or Medicare beneficiaries 65 years or older in 2017 who ever met the claims-based criteria indicating any of Medicare covered days in the hospice setting in 2017, but died in 2016 or 2017. These criteria are having at least one inpatient or skilled nursing facility Medicare claim, or two hospital outpatient or Part B Medicare claims with appropriate diagnosis codes or Medicare managed care plan (Medicare Advantage) for at least 1 month during a 2-year period.
Median hospice days per hospice user (65+, deceased)
The median days of hospice users 65 years or older who died in 2016 or in 2017. These criteria are having at least one inpatient or skilled nursing facility Medicare claim, or two hospital outpatient or Part B Medicare claims with appropriate diagnosis codes or Medicare managed care plan (Medicare Advantage) for at least 1 month during a 2-year period.
Median hospice payment (Medicare + other) per hospice user
The median hospice payments (Medicare + other primary) of hospice users 65 years or older who died in 2016 or in 2017. These criteria are having at least one inpatient or skilled nursing facility Medicare claim, or two hospital outpatient or Part B Medicare claims with appropriate diagnosis codes or Medicare managed care plan (Medicare Advantage) for at least 1 month during a 2-year period.
COMMUNITY
Air pollution: annual # of unhealthy days for 65+ (county)
The number of days in 2016 where there was an Air Quality Index score classified as “code red” or “code orange for ozone or particulate matter in the county.
Age-friendly efforts in community City/town that is or that is making efforts to become age-friendly.
# of senior centers The number of senior centers in the community.
# of universities and community colleges
The number of universities or community colleges in the community.
# of public libraries The number of public libraries in the community.

52
INDICATORS DEFINITION
# of YMCAs The number of YMCAs in the community.
% in county with access to broadband (all ages)
The percentage of persons in county with access to broadband.
% 60+ who used Internet in last month
The percentage of persons age 60 years or older who answered yes to the question- “Have you used the internet in the past 30 days?”
Voter participation rate in 2016 presidential election (age 18+)
The % of registered voters aged 18 and older who voted in the 2016 election.
SAFETY & CRIME
Homicide rate /100,000 persons (county)
The number of deaths due to homicide per 100,000 persons from 2010 to 2016.
# firearm fatalities (county) The number of deaths due to firearms per 100,000 persons from 2012 to 2016.
# 65+ deaths by suicide (county) The number of deaths by suicide from 2016 to 2018 among people age 65 and older.
TRANSPORTATION
% 65+ who own a motor vehicle The percentage of households with a householder age 65 years or older who own one or more vehicles.
% 60+ who always drive or ride wearing a seatbelt
The percentage of persons age 60 years or older who reporting to use seat belt always while driving a car.
% 60+ who drove under the influence of drinking in last month
The percentage of persons age 60 years or older who answered yes to the question- “During the past 30 days, how many times have you driven when you’ve had perhaps too much to drink?”
# of fatal crashes involving adult age 60+/town
The number of motor vehicle fatalities in town involving an adult age 60 or older (driver, passenger, or pedestrian) from 2011 to 2017.
# of fatal crashes involving adult age 60+/county
The number of motor vehicle fatalities in county involving an adult age 60 or older (driver, passenger, or pedestrian) from 2011 to 2017.
HOUSING
% 65+ population living alone The percentage of persons 65 years or older reporting that they live alone.
Average household size (all ages) Average number of persons in the household.
Median house value The average median value of houses.
% 60+ own home The percentage of households with a householder age 60 years or older who are homeowners.
% 60+ homeowners who have mortgage
The percentage of households with a householder age 60 years or older who have mortgage on home.
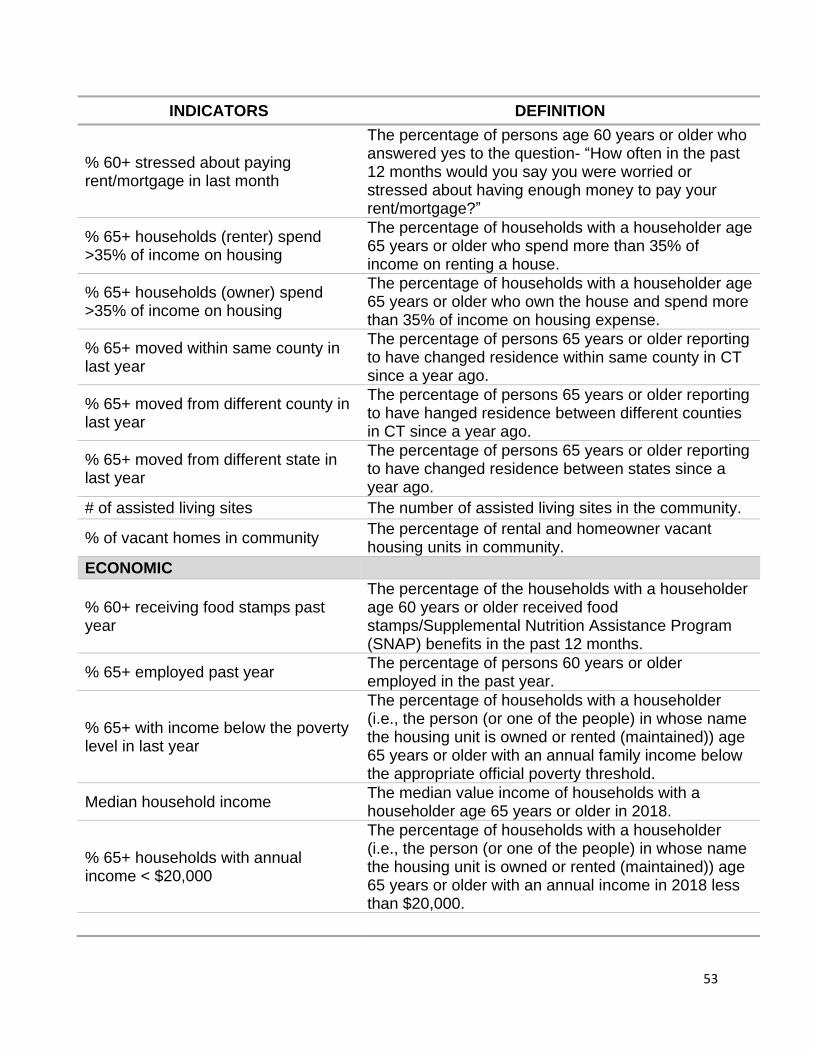
53
INDICATORS DEFINITION
% 60+ stressed about paying rent/mortgage in last month
The percentage of persons age 60 years or older who answered yes to the question- “How often in the past 12 months would you say you were worried or stressed about having enough money to pay your rent/mortgage?”
% 65+ households (renter) spend >35% of income on housing
The percentage of households with a householder age 65 years or older who spend more than 35% of income on renting a house.
% 65+ households (owner) spend >35% of income on housing
The percentage of households with a householder age 65 years or older who own the house and spend more than 35% of income on housing expense.
% 65+ moved within same county in last year
The percentage of persons 65 years or older reporting to have changed residence within same county in CT since a year ago.
% 65+ moved from different county in last year
The percentage of persons 65 years or older reporting to have hanged residence between different counties in CT since a year ago.
% 65+ moved from different state in last year
The percentage of persons 65 years or older reporting to have changed residence between states since a year ago.
# of assisted living sites The number of assisted living sites in the community.
% of vacant homes in community The percentage of rental and homeowner vacant housing units in community.
ECONOMIC
% 60+ receiving food stamps past year
The percentage of the households with a householder age 60 years or older received food stamps/Supplemental Nutrition Assistance Program (SNAP) benefits in the past 12 months.
% 65+ employed past year The percentage of persons 60 years or older employed in the past year.
% 65+ with income below the poverty level in last year
The percentage of households with a householder (i.e., the person (or one of the people) in whose name the housing unit is owned or rented (maintained)) age 65 years or older with an annual family income below the appropriate official poverty threshold.
Median household income The median value income of households with a householder age 65 years or older in 2018.
% 65+ households with annual income < $20,000
The percentage of households with a householder (i.e., the person (or one of the people) in whose name the housing unit is owned or rented (maintained)) age 65 years or older with an annual income in 2018 less than $20,000.

54
INDICATORS DEFINITION
% 65+ households with annual income $20,000-$49,999
The percentage of households with a householder age 65 years or older with an annual income in 2018 between $20,000 and $49,000.
% 65+ households with annual income $50,000-$99,999
The percentage of households with a householder age 65 years or older with an annual income in 2018 between $50,000-$99,999.
% 65+ households with annual income $100,000+
The percentage of households with a householder age 65 years or older with an annual income in 2018 more than $100,000.
COST OF LIVING
Elder Index
Single, homeowner without mortgage, good health
Annual income needed for a single homeowner with no mortgage in good health to attain a modest standard of living in the county.
Single, renter, good health Annual income needed for a single renter in good health to attain a modest standard of living in the county.
Couple, homeowner without mortgage, good health
Annual income needed for a couple who are homeowners with no mortgage in good health to attain a modest standard of living in the county.
Couple, renter, good health Annual income needed for a couple who are renters in good health to attain a modest standard of living in the county.

55
Table A2: Years and Data Sources for Community Profile Indicators
INDICATORS SOURCES and YEAR
POPULATION CHARACTERISTICS
Total population all ages, Population 60 years or older as a % of total population, Total population 60 years or older, Population 65 years or older as a % of total population, Total population 65 years or older, % 65-74 years, 75-84 years, 85 years or older , % 65+ female, % 85+ female
United States Census Bureau. “B01001: SEX BY AGE.” 2014 – 2018 American Community Survey. U.S. Census Bureau’s American Community Survey Office, 2019. Accessed December 2019. (https://data.census.gov/cedsci/).
Race/Ethnicity:
% White, % African American, % Asian, % Other race, % Hispanic/Latino
United States Census Bureau. “B01001A, B01001B, B01001D, B01001I: SEX BY AGE.” 2014 – 2018 American Community Survey. U.S. Census Bureau’s American Community Survey Office, 2019. Accessed December 2019. (https://data.census.gov/cedsci/).
Marital status: % married, divorced/separated, widowed, never married
United States Census Bureau. “B12002: SEX BY MARITAL STATUS BY AGE FOR THE POPULATION 15 YEARS AND OVER.” U.S. Census Bureau’s American Community Survey Office, 2019. Accessed December 2019. (https://data.census.gov/cedsci/).
Education:
% with less than a high school education, high school or some college, college degree, graduate or professional degree
United States Census Bureau. “B15001: SEX BY
AGE BY EDUCATIONAL ATTAINMENT FOR THE
POPULATION 18 YEARS AND OVER.” U.S.
Census Bureau’s American Community Survey
Office, 2019. Accessed December 2019.
(https://data.census.gov/cedsci/).
% 65+ population who speak only English at home
United States Census Bureau. “B16007: AGE BY LANGUAGE SPOKEN AT HOME BY ABILITY TO SPEAK ENGLISH FOR THE POPULATION 5 YEARS AND OVER”. U.S. Census Bureau’s American Community Survey Office, 2019. Accessed December 2019. (https://data.census.gov/cedsci/).
% 65+ population who are veterans of military service
United States Census Bureau. “B21001: SEX BY AGE BY VETERAN STATUS FOR THE CIVILIAN POPULATION 18 YEARS AND OVER”. U.S. Census Bureau’s American Community Survey Office, 2019. Accessed December 2019. (https://data.census.gov/cedsci/).
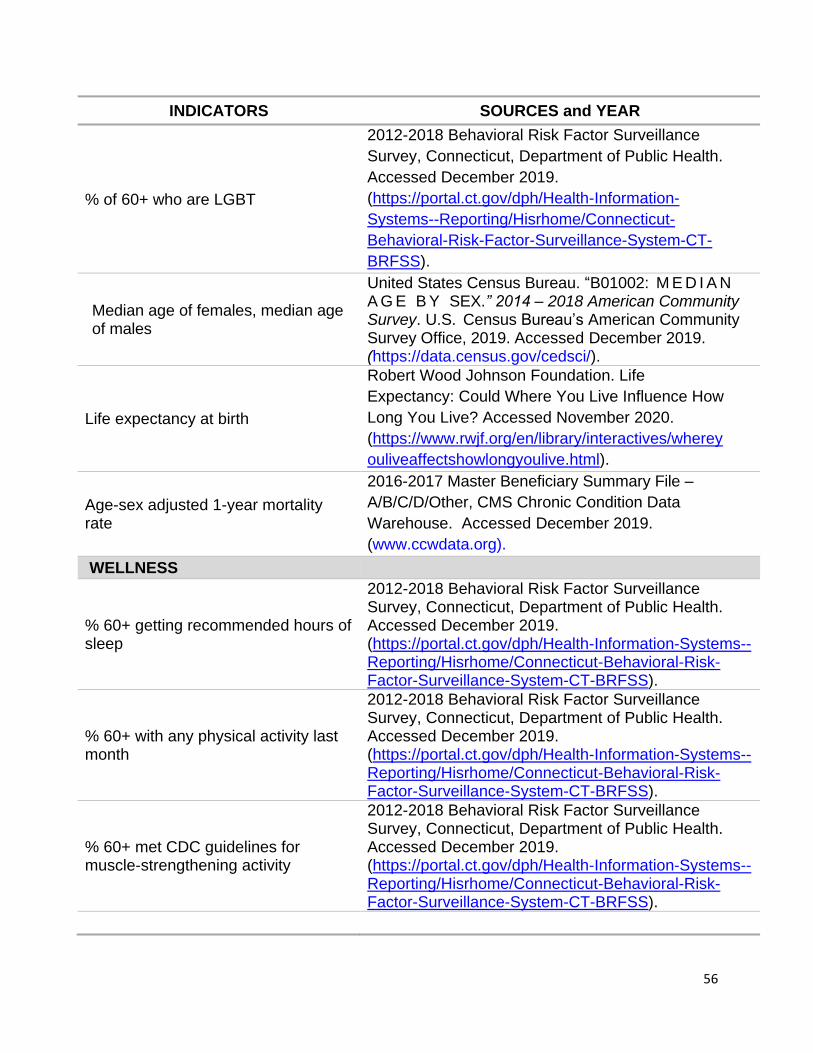
56
INDICATORS SOURCES and YEAR
% of 60+ who are LGBT
2012-2018 Behavioral Risk Factor Surveillance
Survey, Connecticut, Department of Public Health.
Accessed December 2019.
(https://portal.ct.gov/dph/Health-Information-
Systems--Reporting/Hisrhome/Connecticut-
Behavioral-Risk-Factor-Surveillance-System-CT-
BRFSS).
Median age of females, median age of males
United States Census Bureau. “B01002: M E D I A N A G E B Y SEX.” 2014 – 2018 American Community Survey. U.S. Census Bureau’s American Community Survey Office, 2019. Accessed December 2019. (https://data.census.gov/cedsci/).
Life expectancy at birth
Robert Wood Johnson Foundation. Life
Expectancy: Could Where You Live Influence How
Long You Live? Accessed November 2020.
(https://www.rwjf.org/en/library/interactives/wherey
ouliveaffectshowlongyoulive.html).
Age-sex adjusted 1-year mortality rate
2016-2017 Master Beneficiary Summary File –
A/B/C/D/Other, CMS Chronic Condition Data
Warehouse. Accessed December 2019.
(www.ccwdata.org).
WELLNESS
% 60+ getting recommended hours of sleep
2012-2018 Behavioral Risk Factor Surveillance Survey, Connecticut, Department of Public Health. Accessed December 2019. (https://portal.ct.gov/dph/Health-Information-Systems--Reporting/Hisrhome/Connecticut-Behavioral-Risk-Factor-Surveillance-System-CT-BRFSS).
% 60+ with any physical activity last month
2012-2018 Behavioral Risk Factor Surveillance Survey, Connecticut, Department of Public Health. Accessed December 2019. (https://portal.ct.gov/dph/Health-Information-Systems--Reporting/Hisrhome/Connecticut-Behavioral-Risk-Factor-Surveillance-System-CT-BRFSS).
% 60+ met CDC guidelines for muscle-strengthening activity
2012-2018 Behavioral Risk Factor Surveillance Survey, Connecticut, Department of Public Health. Accessed December 2019. (https://portal.ct.gov/dph/Health-Information-Systems--Reporting/Hisrhome/Connecticut-Behavioral-Risk-Factor-Surveillance-System-CT-BRFSS).

57
INDICATORS SOURCES and YEAR
% 60+ met CDC guidelines for aerobic physical activity
2012-2018 Behavioral Risk Factor Surveillance Survey, Connecticut, Department of Public Health. Accessed December 2019. (https://portal.ct.gov/dph/Health-Information-Systems--Reporting/Hisrhome/Connecticut-Behavioral-Risk-Factor-Surveillance-System-CT-BRFSS).
% 60+ with self-reported fair or poor health status
2012-2018 Behavioral Risk Factor Surveillance Survey, Connecticut, Department of Public Health. Accessed December 2019. (https://portal.ct.gov/dph/Health-Information-Systems--Reporting/Hisrhome/Connecticut-Behavioral-Risk-Factor-Surveillance-System-CT-BRFSS).
% 60+ with 15+ physically unhealthy days last month
2012-2018 Behavioral Risk Factor Surveillance Survey, Connecticut, Department of Public Health. Accessed December 2019. (https://portal.ct.gov/dph/Health-Information-Systems--Reporting/Hisrhome/Connecticut-Behavioral-Risk-Factor-Surveillance-System-CT-BRFSS).
FALLS
% 60+ who fell within last year
2012-2018 Behavioral Risk Factor Surveillance Survey, Connecticut, Department of Public Health. Accessed December 2019. (https://portal.ct.gov/dph/Health-Information-Systems--Reporting/Hisrhome/Connecticut-Behavioral-Risk-Factor-Surveillance-System-CT-BRFSS).
% 60+ who were injured in a fall within last year
2012-2018 Behavioral Risk Factor Surveillance Survey, Connecticut, Department of Public Health. Accessed December 2019. (https://portal.ct.gov/dph/Health-Information-Systems--Reporting/Hisrhome/Connecticut-Behavioral-Risk-Factor-Surveillance-System-CT-BRFSS).
% 65+ had hip fracture
2016-2017 Master Beneficiary Summary File –A/B/C/D/Other, CMS Chronic Condition Data Warehouse. Accessed December 2019. (www.ccwdata.org).
PREVENTION
% 60+ with physical exam/check-up in past year
2012-2018 Behavioral Risk Factor Surveillance Survey, Connecticut, Department of Public Health. Accessed December 2019. (https://portal.ct.gov/dph/Health-Information-Systems--Reporting/Hisrhome/Connecticut-Behavioral-Risk-Factor-Surveillance-System-CT-BRFSS).

58
INDICATORS SOURCES and YEAR
% 60+ flu shot past year
2012-2018 Behavioral Risk Factor Surveillance Survey, Connecticut, Department of Public Health. Accessed December 2019. (https://portal.ct.gov/dph/Health-Information-Systems--Reporting/Hisrhome/Connecticut-Behavioral-Risk-Factor-Surveillance-System-CT-BRFSS).
% 60+ with pneumonia vaccine
2012-2018 Behavioral Risk Factor Surveillance Survey, Connecticut, Department of Public Health. Accessed December 2019. (https://portal.ct.gov/dph/Health-Information-Systems--Reporting/Hisrhome/Connecticut-Behavioral-Risk-Factor-Surveillance-System-CT-BRFSS).
% 60+ with shingles vaccine
2012-2018 Behavioral Risk Factor Surveillance Survey, Connecticut, Department of Public Health. Accessed December 2019. (https://portal.ct.gov/dph/Health-Information-Systems--Reporting/Hisrhome/Connecticut-Behavioral-Risk-Factor-Surveillance-System-CT-BRFSS).
% 60+women with mammogram within last 2 years
2012-2018 Behavioral Risk Factor Surveillance Survey, Connecticut, Department of Public Health. Accessed December 2019. (https://portal.ct.gov/dph/Health-Information-Systems--Reporting/Hisrhome/Connecticut-Behavioral-Risk-Factor-Surveillance-System-CT-BRFSS).
% 60+ with colorectal cancer screening
2012-2018 Behavioral Risk Factor Surveillance Survey, Connecticut, Department of Public Health. Accessed December 2019. (https://portal.ct.gov/dph/Health-Information-Systems--Reporting/Hisrhome/Connecticut-Behavioral-Risk-Factor-Surveillance-System-CT-BRFSS).
% 60+ with HIV test
2012-2018 Behavioral Risk Factor Surveillance Survey, Connecticut, Department of Public Health. Accessed December 2019. (https://portal.ct.gov/dph/Health-Information-Systems--Reporting/Hisrhome/Connecticut-Behavioral-Risk-Factor-Surveillance-System-CT-BRFSS).
% 60+ met CDC preventive health screening goals
2012-2018 Behavioral Risk Factor Surveillance Survey, Connecticut, Department of Public Health. Accessed December 2019. (https://portal.ct.gov/dph/Health-Information-Systems--Reporting/Hisrhome/Connecticut-Behavioral-Risk-Factor-Surveillance-System-CT-BRFSS).
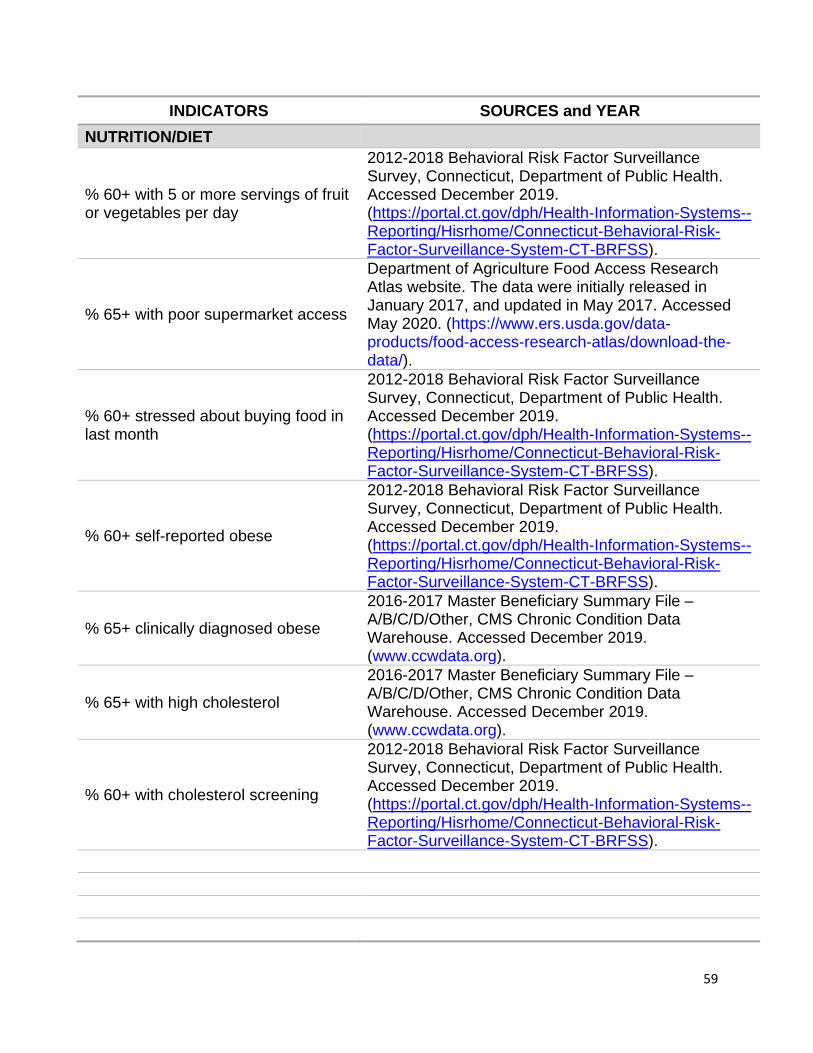
59
INDICATORS SOURCES and YEAR
NUTRITION/DIET
% 60+ with 5 or more servings of fruit or vegetables per day
2012-2018 Behavioral Risk Factor Surveillance Survey, Connecticut, Department of Public Health. Accessed December 2019. (https://portal.ct.gov/dph/Health-Information-Systems--Reporting/Hisrhome/Connecticut-Behavioral-Risk-Factor-Surveillance-System-CT-BRFSS).
% 65+ with poor supermarket access
Department of Agriculture Food Access Research Atlas website. The data were initially released in January 2017, and updated in May 2017. Accessed May 2020. (https://www.ers.usda.gov/data-products/food-access-research-atlas/download-the-data/).
% 60+ stressed about buying food in last month
2012-2018 Behavioral Risk Factor Surveillance Survey, Connecticut, Department of Public Health. Accessed December 2019. (https://portal.ct.gov/dph/Health-Information-Systems--Reporting/Hisrhome/Connecticut-Behavioral-Risk-Factor-Surveillance-System-CT-BRFSS).
% 60+ self-reported obese
2012-2018 Behavioral Risk Factor Surveillance Survey, Connecticut, Department of Public Health. Accessed December 2019. (https://portal.ct.gov/dph/Health-Information-Systems--Reporting/Hisrhome/Connecticut-Behavioral-Risk-Factor-Surveillance-System-CT-BRFSS).
% 65+ clinically diagnosed obese
2016-2017 Master Beneficiary Summary File –A/B/C/D/Other, CMS Chronic Condition Data Warehouse. Accessed December 2019. (www.ccwdata.org).
% 65+ with high cholesterol
2016-2017 Master Beneficiary Summary File –A/B/C/D/Other, CMS Chronic Condition Data Warehouse. Accessed December 2019. (www.ccwdata.org).
% 60+ with cholesterol screening
2012-2018 Behavioral Risk Factor Surveillance Survey, Connecticut, Department of Public Health. Accessed December 2019. (https://portal.ct.gov/dph/Health-Information-Systems--Reporting/Hisrhome/Connecticut-Behavioral-Risk-Factor-Surveillance-System-CT-BRFSS).

60
INDICATORS SOURCES and YEAR
ORAL HEALTH
% 60+ with dental insurance
2012-2018 Behavioral Risk Factor Surveillance Survey, Connecticut, Department of Public Health. Accessed December 2019. (https://portal.ct.gov/dph/Health-Information-Systems--Reporting/Hisrhome/Connecticut-Behavioral-Risk-Factor-Surveillance-System-CT-BRFSS).
% 60+ with annual dental exam
2012-2018 Behavioral Risk Factor Surveillance Survey, Connecticut, Department of Public Health. Accessed December 2019. (https://portal.ct.gov/dph/Health-Information-Systems--Reporting/Hisrhome/Connecticut-Behavioral-Risk-Factor-Surveillance-System-CT-BRFSS).
# dentists per 100,000 persons (all ages)
Connecticut Department of Public Health. Accessed May 2020. (https://elicense.ct.gov/Lookup/LicenseLookup.aspx).
% 60+ with loss of 6 or more teeth
2012-2018 Behavioral Risk Factor Surveillance Survey, Connecticut, Department of Public Health. Accessed December 2019. (https://portal.ct.gov/dph/Health-Information-Systems--Reporting/Hisrhome/Connecticut-Behavioral-Risk-Factor-Surveillance-System-CT-BRFSS).
CHRONIC DISEASE
% 65+ with Alzheimer’s disease or related dementias
2016-2017 Master Beneficiary Summary File –A/B/C/D/Other, CMS Chronic Condition Data Warehouse. Accessed December 2019. (www.ccwdata.org).
% 65+ with anemia
2016-2017 Master Beneficiary Summary File –A/B/C/D/Other, CMS Chronic Condition Data Warehouse. Accessed December 2019. (www.ccwdata.org).
% 65+ with asthma
2016-2017 Master Beneficiary Summary File –A/B/C/D/Other, CMS Chronic Condition Data Warehouse. Accessed December 2019. (www.ccwdata.org).
% 65+ with atrial fibrillation
2016-2017 Master Beneficiary Summary File –A/B/C/D/Other, CMS Chronic Condition Data Warehouse. Accessed December 2019. (www.ccwdata.org).
% 65+ with autism spectrum disorders
2016-2017 Master Beneficiary Summary File –A/B/C/D/Other, CMS Chronic Condition Data Warehouse. Accessed December 2019. (www.ccwdata.org).
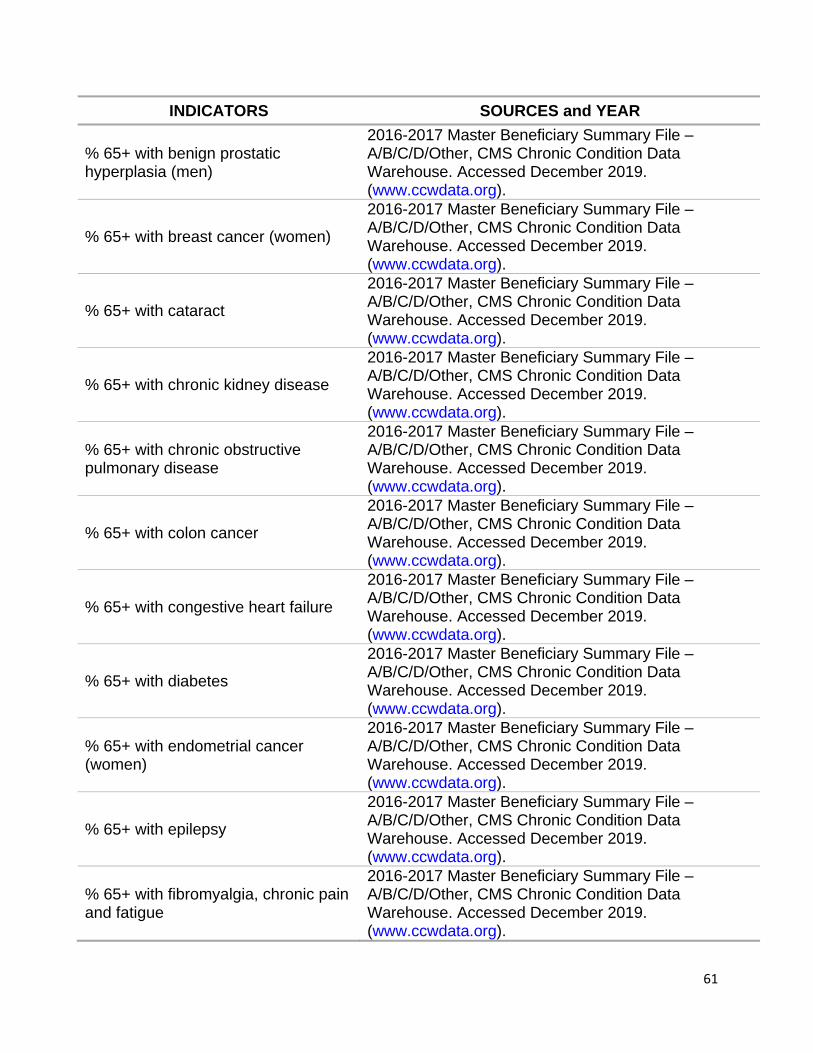
61
INDICATORS SOURCES and YEAR
% 65+ with benign prostatic hyperplasia (men)
2016-2017 Master Beneficiary Summary File –A/B/C/D/Other, CMS Chronic Condition Data Warehouse. Accessed December 2019. (www.ccwdata.org).
% 65+ with breast cancer (women)
2016-2017 Master Beneficiary Summary File –A/B/C/D/Other, CMS Chronic Condition Data Warehouse. Accessed December 2019. (www.ccwdata.org).
% 65+ with cataract
2016-2017 Master Beneficiary Summary File –A/B/C/D/Other, CMS Chronic Condition Data Warehouse. Accessed December 2019. (www.ccwdata.org).
% 65+ with chronic kidney disease
2016-2017 Master Beneficiary Summary File –A/B/C/D/Other, CMS Chronic Condition Data Warehouse. Accessed December 2019. (www.ccwdata.org).
% 65+ with chronic obstructive pulmonary disease
2016-2017 Master Beneficiary Summary File –A/B/C/D/Other, CMS Chronic Condition Data Warehouse. Accessed December 2019. (www.ccwdata.org).
% 65+ with colon cancer
2016-2017 Master Beneficiary Summary File –A/B/C/D/Other, CMS Chronic Condition Data Warehouse. Accessed December 2019. (www.ccwdata.org).
% 65+ with congestive heart failure
2016-2017 Master Beneficiary Summary File –A/B/C/D/Other, CMS Chronic Condition Data Warehouse. Accessed December 2019. (www.ccwdata.org).
% 65+ with diabetes
2016-2017 Master Beneficiary Summary File –A/B/C/D/Other, CMS Chronic Condition Data Warehouse. Accessed December 2019. (www.ccwdata.org).
% 65+ with endometrial cancer (women)
2016-2017 Master Beneficiary Summary File –A/B/C/D/Other, CMS Chronic Condition Data Warehouse. Accessed December 2019. (www.ccwdata.org).
% 65+ with epilepsy
2016-2017 Master Beneficiary Summary File –A/B/C/D/Other, CMS Chronic Condition Data Warehouse. Accessed December 2019. (www.ccwdata.org).
% 65+ with fibromyalgia, chronic pain and fatigue
2016-2017 Master Beneficiary Summary File –A/B/C/D/Other, CMS Chronic Condition Data Warehouse. Accessed December 2019. (www.ccwdata.org).

62
INDICATORS SOURCES and YEAR
% 65+ with glaucoma
2016-2017 Master Beneficiary Summary File –A/B/C/D/Other, CMS Chronic Condition Data Warehouse. Accessed December 2019. (www.ccwdata.org).
% 65+ ever had a heart attack
2016-2017 Master Beneficiary Summary File –A/B/C/D/Other, CMS Chronic Condition Data Warehouse. Accessed December 2019. (www.ccwdata.org).
% 65+ with HIV/AIDS
2016-2017 Master Beneficiary Summary File –A/B/C/D/Other, CMS Chronic Condition Data Warehouse. Accessed December 2019. (www.ccwdata.org).
% 65+ with hypertension
2016-2017 Master Beneficiary Summary File –A/B/C/D/Other, CMS Chronic Condition Data Warehouse. Accessed December 2019. (www.ccwdata.org).
% 65+ with hypothyroidism
2016-2017 Master Beneficiary Summary File –A/B/C/D/Other, CMS Chronic Condition Data Warehouse. Accessed December 2019. (www.ccwdata.org).
% 65+ with ischemic heart disease
2016-2017 Master Beneficiary Summary File –A/B/C/D/Other, CMS Chronic Condition Data Warehouse. Accessed December 2019. (www.ccwdata.org).
% 65+ with leukemias and lymphomas
2016-2017 Master Beneficiary Summary File –A/B/C/D/Other, CMS Chronic Condition Data Warehouse. Accessed December 2019. (www.ccwdata.org).
% 65+ with liver disease
2016-2017 Master Beneficiary Summary File –A/B/C/D/Other, CMS Chronic Condition Data Warehouse. Accessed December 2019. (www.ccwdata.org).
% 65+ with lung cancer
2016-2017 Master Beneficiary Summary File –A/B/C/D/Other, CMS Chronic Condition Data Warehouse. Accessed December 2019. (www.ccwdata.org).
% 65+ with migraine and other chronic headache
2016-2017 Master Beneficiary Summary File –A/B/C/D/Other, CMS Chronic Condition Data Warehouse. Accessed December 2019. (www.ccwdata.org).
% 65+ with osteoarthritis or rheumatoid arthritis
2016-2017 Master Beneficiary Summary File –A/B/C/D/Other, CMS Chronic Condition Data Warehouse. Accessed December 2019. (www.ccwdata.org).

63
INDICATORS SOURCES and YEAR
% 65+ with osteoporosis
2016-2017 Master Beneficiary Summary File –A/B/C/D/Other, CMS Chronic Condition Data Warehouse. Accessed December 2019. (www.ccwdata.org).
% 65+ with peripheral vascular disease
2016-2017 Master Beneficiary Summary File –A/B/C/D/Other, CMS Chronic Condition Data Warehouse. Accessed December 2019. (www.ccwdata.org).
% 65+ with pressure ulcer or chronic ulcer
2016-2017 Master Beneficiary Summary File –A/B/C/D/Other, CMS Chronic Condition Data Warehouse. Accessed December 2019. (www.ccwdata.org).
% 65+ with prostate cancer (men)
2016-2017 Master Beneficiary Summary File –A/B/C/D/Other, CMS Chronic Condition Data Warehouse. Accessed December 2019. (www.ccwdata.org).
% 65+ with stroke
2016-2017 Master Beneficiary Summary File –A/B/C/D/Other, CMS Chronic Condition Data Warehouse. Accessed December 2019. (www.ccwdata.org).
% 65+ with traumatic brain injury
2016-2017 Master Beneficiary Summary File –A/B/C/D/Other, CMS Chronic Condition Data Warehouse. Accessed December 2019. (www.ccwdata.org).
% 65+ with 4+ (out of 15) chronic conditions
2016-2017 Master Beneficiary Summary File –A/B/C/D/Other, CMS Chronic Condition Data Warehouse. Accessed December 2019. (www.ccwdata.org).
% 65+ with 0 chronic conditions
2016-2017 Master Beneficiary Summary File –A/B/C/D/Other, CMS Chronic Condition Data Warehouse. Accessed December 2019. (www.ccwdata.org).
BEHAVIORAL HEALTH
# of drug overdose deaths (all ages)
Connecticut Department of Public Health, Connecticut State Unintentional Drug Overdose Reporting System (SUDORS). Data were obtained for year 2015-2020. Accessed October 2020. (https://public.tableau.com/profile/heather.clinton#!/vizhome/SUDORS_Dashboard_final2/OverdoseDashboard).
% 65+ with opioid use disorder
2016-2017 Master Beneficiary Summary File –A/B/C/D/Other, CMS Chronic Condition Data Warehouse. Accessed December 2019. (www.ccwdata.org).

64
INDICATORS SOURCES and YEAR
% 65+ with substance use disorder
2016-2017 Master Beneficiary Summary File –A/B/C/D/Other, CMS Chronic Condition Data Warehouse. Accessed December 2019. (www.ccwdata.org).
% 60+ who used marijuana in last month
2012-2018 Behavioral Risk Factor Surveillance Survey, Connecticut, Department of Public Health. Accessed December 2019. (https://portal.ct.gov/dph/Health-Information-Systems--Reporting/Hisrhome/Connecticut-Behavioral-Risk-Factor-Surveillance-System-CT-BRFSS).
% 60+ excessive drinking
2012-2018 Behavioral Risk Factor Surveillance Survey, Connecticut, Department of Public Health. Accessed December 2019. (https://portal.ct.gov/dph/Health-Information-Systems--Reporting/Hisrhome/Connecticut-Behavioral-Risk-Factor-Surveillance-System-CT-BRFSS).
% 65+ with tobacco use disorders
2016-2017 Master Beneficiary Summary File –A/B/C/D/Other, CMS Chronic Condition Data Warehouse. Accessed December 2019. (www.ccwdata.org).
% 60+ current smokers
2012-2018 Behavioral Risk Factor Surveillance Survey, Connecticut, Department of Public Health. Accessed December 2019. (https://portal.ct.gov/dph/Health-Information-Systems--Reporting/Hisrhome/Connecticut-Behavioral-Risk-Factor-Surveillance-System-CT-BRFSS).
% 60+ ever used E-Cigarettes in last month
2012-2018 Behavioral Risk Factor Surveillance Survey, Connecticut, Department of Public Health. Accessed December 2019. (https://portal.ct.gov/dph/Health-Information-Systems--Reporting/Hisrhome/Connecticut-Behavioral-Risk-Factor-Surveillance-System-CT-BRFSS).
MENTAL HEALTH
% 60+ who reported receiving adequate emotional support
2012-2018 Behavioral Risk Factor Surveillance Survey, Connecticut, Department of Public Health. Accessed December 2019. (https://portal.ct.gov/dph/Health-Information-Systems--Reporting/Hisrhome/Connecticut-Behavioral-Risk-Factor-Surveillance-System-CT-BRFSS).

65
INDICATORS SOURCES and YEAR
% 60+ who reported being satisfied with life
2012-2018 Behavioral Risk Factor Surveillance Survey, Connecticut, Department of Public Health. Accessed December 2019. (https://portal.ct.gov/dph/Health-Information-Systems--Reporting/Hisrhome/Connecticut-Behavioral-Risk-Factor-Surveillance-System-CT-BRFSS).
% 60+ with 15+ days poor mental health last month
2012-2018 Behavioral Risk Factor Surveillance Survey, Connecticut, Department of Public Health. Accessed December 2019. (https://portal.ct.gov/dph/Health-Information-Systems--Reporting/Hisrhome/Connecticut-Behavioral-Risk-Factor-Surveillance-System-CT-BRFSS).
% 65+ with depression
2016-2017 Master Beneficiary Summary File –A/B/C/D/Other, CMS Chronic Condition Data Warehouse. Accessed December 2019. (www.ccwdata.org).
% 65+ with anxiety disorder
2016-2017 Master Beneficiary Summary File –A/B/C/D/Other, CMS Chronic Condition Data Warehouse. Accessed December 2019. (www.ccwdata.org).
% 65+ with bipolar disorder
2016-2017 Master Beneficiary Summary File –A/B/C/D/Other, CMS Chronic Condition Data Warehouse. Accessed December 2019. (www.ccwdata.org).
% 65+ with post-traumatic stress disorder
2016-2017 Master Beneficiary Summary File –A/B/C/D/Other, CMS Chronic Condition Data Warehouse. Accessed December 2019. (www.ccwdata.org).
% 65+ with schizophrenia & other psychotic disorders
2016-2017 Master Beneficiary Summary File –A/B/C/D/Other, CMS Chronic Condition Data Warehouse. Accessed December 2019. (www.ccwdata.org).
% 65+ with personality disorder
2016-2017 Master Beneficiary Summary File –A/B/C/D/Other, CMS Chronic Condition Data Warehouse. Accessed December 2019. (www.ccwdata.org).
LIVING WITH DISABILITY
% 65+ with self-reported hearing difficulty
United States Census Bureau. “B18102: SEX BY AGE BY HEARING DIFFICULTY”. U.S. Census Bureau’s American Community Survey Office, 2019. Accessed December 2019. (https://data.census.gov/cedsci/).

66
INDICATORS SOURCES and YEAR
% 65+ with clinical diagnosis of deafness or hearing impairment
2016-2017 Master Beneficiary Summary File –A/B/C/D/Other, CMS Chronic Condition Data Warehouse. Accessed December 2019. (www.ccwdata.org).
% 65+ with self-reported vision difficulty
United States Census Bureau. “B18103: SEX BY AGE BY VISION DIFFICULTY”. U.S. Census Bureau’s American Community Survey Office, 2019. Accessed December 2019. (https://data.census.gov/cedsci/).
% 65+ with clinical diagnosis of blindness or visual impairment
2016-2017 Master Beneficiary Summary File –A/B/C/D/Other, CMS Chronic Condition Data Warehouse. Accessed December 2019. (www.ccwdata.org).
% 65+ with self-reported cognition difficulty
United States Census Bureau. “B18104: SEX BY AGE BY COGNITIVE DIFFICULTY”. U.S. Census Bureau’s American Community Survey Office, 2019. Accessed December 2019. (https://data.census.gov/cedsci/).
% 65+ with self-reported ambulatory difficulty
United States Census Bureau. “B18105: SEX BY AGE BY AMBULATORY DIFFICULTY”. U.S. Census Bureau’s American Community Survey Office, 2019. Accessed December 2019. (https://data.census.gov/cedsci/).
% 65+ with clinical diagnosis of mobility impairments
2016-2017 Master Beneficiary Summary File –A/B/C/D/Other, CMS Chronic Condition Data Warehouse. Accessed December 2019. (www.ccwdata.org).
% 65+ with self-reported self-care difficulty
United States Census Bureau. “B18106: SEX BY AGE BY SELF-CARE DIFFICULTY”. U.S. Census Bureau’s American Community Survey Office, 2019. Accessed December 2019. (https://data.census.gov/cedsci/).
% 65+ with self-reported independent living difficulty
United States Census Bureau. “B18107: SEX BY AGE BY INDEPENDENT DIFFICULTY”. U.S. Census Bureau’s American Community Survey Office, 2019. Accessed December 2019. (https://data.census.gov/cedsci/).
CAREGIVING
# of caregiver support groups
CT State Department of Aging. CT Caregiver Support Group List. Accessed May 2020. (https://rielderinfo.com/wp-content/uploads/2018/08/Caregiver-Support-Groups-in-Connecticut.pdf).
# of Memory cafes
Memory cafes were downloaded from the Memory Café Directory website. Accessed May 2020. (https://www.memorycafedirectory.com/memory-cafes-in-connecticut/).

67
INDICATORS SOURCES and YEAR
% of 60+ who provide care to a family/friend in last month
2012-2018 Behavioral Risk Factor Surveillance Survey, Connecticut, Department of Public Health. Accessed December 2019. (https://portal.ct.gov/dph/Health-Information-Systems--Reporting/Hisrhome/Connecticut-Behavioral-Risk-Factor-Surveillance-System-CT-BRFSS).
% of grandparents raising grandchildren
United States Census Bureau. “B10050: GRANDPARENTS LIVING WITH OWN GRANDCHILDREN UNDER 18 YEARS BY RESPONSIBILITY FOR OWN GRANDCHILDREN BY LENGTH OF TIME RESPONSIBLE FOR OWN GRANDCHILDREN FOR THE POPULATION 30 YEARS AND OVER”. U.S. Census Bureau’s American Community Survey Office, 2019. Accessed December 2019. (https://data.census.gov/cedsci/).
% of grandparents who live with grandchildren
United States Census Bureau. “B10050: GRANDPARENTS LIVING WITH OWN GRANDCHILDREN UNDER 18 YEARS BY RESPONSIBILITY FOR OWN GRANDCHILDREN BY LENGTH OF TIME RESPONSIBLE FOR OWN GRANDCHILDREN FOR THE POPULATION 30 YEARS AND OVER”. U.S. Census Bureau’s American Community Survey Office, 2019. Accessed December 2019. (https://data.census.gov/cedsci/).
ACCESS TO CARE
% 65+ dually eligible for Medicare and Medicaid
2016-2017 Master Beneficiary Summary File –A/B/C/D/Other, CMS Chronic Condition Data Warehouse. Accessed December 2019. (www.ccwdata.org).
% 65+ Medicare managed care enrollees
2016-2017 Master Beneficiary Summary File –A/B/C/D/Other, CMS Chronic Condition Data Warehouse. Accessed December 2019. (www.ccwdata.org).
% 60+ with a regular doctor
2012-2018 Behavioral Risk Factor Surveillance Survey, Connecticut, Department of Public Health. Accessed December 2019. (https://portal.ct.gov/dph/Health-Information-Systems--Reporting/Hisrhome/Connecticut-Behavioral-Risk-Factor-Surveillance-System-CT-BRFSS).

68
INDICATORS SOURCES and YEAR
% 60+ who did not see doctor when needed due to cost
2012-2018 Behavioral Risk Factor Surveillance Survey, Connecticut, Department of Public Health. Accessed December 2019. (https://portal.ct.gov/dph/Health-Information-Systems--Reporting/Hisrhome/Connecticut-Behavioral-Risk-Factor-Surveillance-System-CT-BRFSS).
# of primary care providers within 5 miles
The number of primary care providers were downloaded from (http://www.medicare.gov/physiciancompare/). in September 2020 using the search term “city/town name, Connecticut” and option for within 5 miles.
# of hospitals within 5 miles
The number of hospitals were downloaded from (http://www.medicare.gov/hospitalcompare/). in September 2020 using the search term “city/town name, Connecticut” and option for within 5 miles.
# of home health agencies in same town
The number of home health agencies were downloaded from (http://www.medicare.gov/homehealthcompare/). in September 2020 using the search term “city/town name, Connecticut”.
# of nursing homes within 5 miles
The number of nursing homes were downloaded from (http://www.medicare.gov/nursinghomecompare/). in September 2020 using the search term “city/town name, Connecticut”.
# of community health centers
The number of community health centers were downloaded from the Community Health Center Association of Connecticut. Accessed September 2020. (https://www.chcact.org/find-health-center/).
# of adult day health centers
Data were downloaded from the National Adult Day Services Association website. Accessed September 2020. (https://www.nadsa.org/locator/?ill_directory_search=1&ill_directory_keywords=&ill_directory_category%5B47173%5D%5B47194%5D=47194&ill_directory_city=&ill_directory_state=).
# of hospice agencies
The number of hospice agencies were downloaded from (https://www.medicare.gov/hospicecompare/). in September 2020 using the search term “city/town name, Connecticut”.
SERVICE UTILIZATION
# physician visits per year
2016-2017 Master Beneficiary Summary File –A/B/C/D/Other, CMS Chronic Condition Data Warehouse. Accessed December 2019. (www.ccwdata.org).

69
INDICATORS SOURCES and YEAR
# emergency room visits/1000 persons 65+ years annually
2016-2017 Master Beneficiary Summary File –A/B/C/D/Other, CMS Chronic Condition Data Warehouse. Accessed December 2019. (www.ccwdata.org).
# Part D monthly prescription fills per person annually
2016-2017 Master Beneficiary Summary File –A/B/C/D/Other, CMS Chronic Condition Data Warehouse. Accessed December 2019. (www.ccwdata.org).
# home health visits per year
2016-2017 Master Beneficiary Summary File –A/B/C/D/Other, CMS Chronic Condition Data Warehouse. Accessed December 2019. (www.ccwdata.org).
# durable medical equipment claims annually
2016-2017 Master Beneficiary Summary File –A/B/C/D/Other, CMS Chronic Condition Data Warehouse. Accessed December 2019. (www.ccwdata.org).
# inpatient hospital stays/1000 persons 65+ years annually
2016-2017 Master Beneficiary Summary File –A/B/C/D/Other, CMS Chronic Condition Data Warehouse. Accessed December 2019. (www.ccwdata.org).
% Medicare inpatient hospital readmissions (as % of admissions)
2016-2017 Master Beneficiary Summary File –A/B/C/D/Other, CMS Chronic Condition Data Warehouse. Accessed December 2019. (www.ccwdata.org).
# skilled nursing facility stays/1000 persons 65+ years annually
2016-2017 Master Beneficiary Summary File –A/B/C/D/Other, CMS Chronic Condition Data Warehouse. Accessed December 2019. (www.ccwdata.org).
# skilled nursing home Medicare beds/1000 persons 65+ years
2016-2017 Master Beneficiary Summary File –A/B/C/D/Other, CMS Chronic Condition Data Warehouse. Accessed December 2019. (www.ccwdata.org).
% 65+ getting Medicaid long term services and supports
2016-2017 Master Beneficiary Summary File –A/B/C/D/Other, CMS Chronic Condition Data Warehouse. Accessed December 2019. (www.ccwdata.org).
% of 65+ hospice users
2016-2017 Master Beneficiary Summary File –A/B/C/D/Other, CMS Chronic Condition Data Warehouse. Accessed December 2019. (www.ccwdata.org).
% of 65+ hospice users as % of decedents
2016-2017 Master Beneficiary Summary File –A/B/C/D/Other, CMS Chronic Condition Data Warehouse. Accessed December 2019. (www.ccwdata.org).
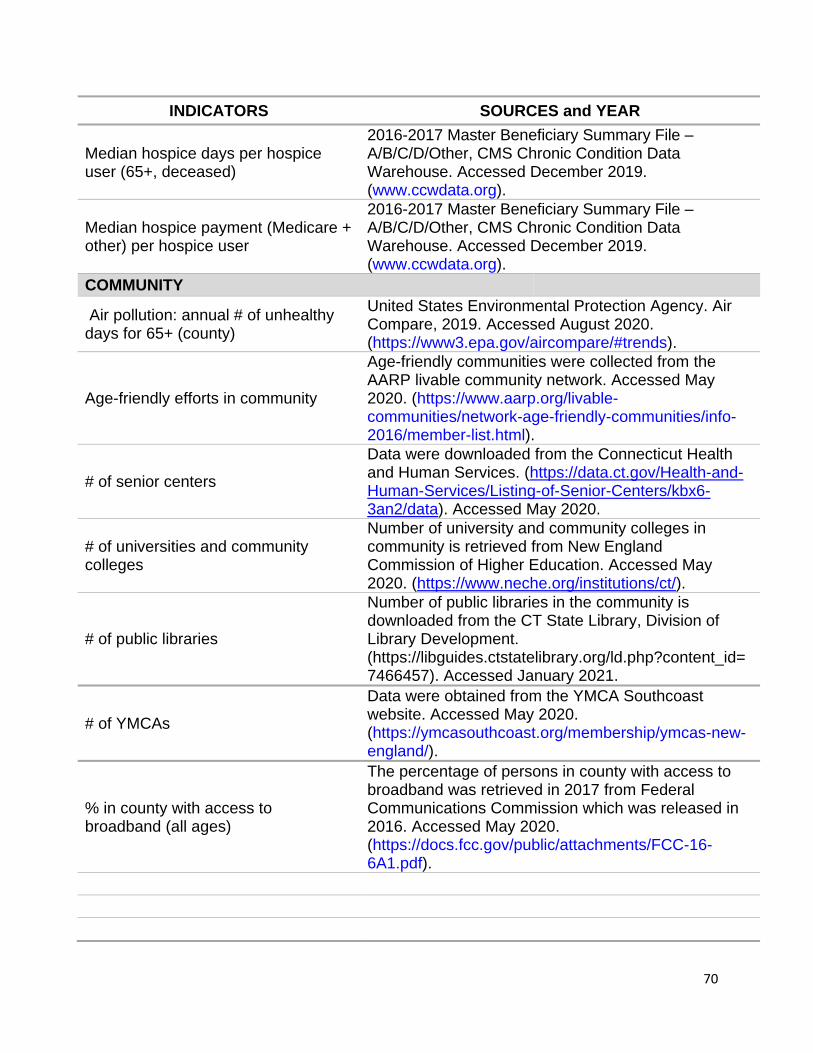
70
INDICATORS SOURCES and YEAR
Median hospice days per hospice user (65+, deceased)
2016-2017 Master Beneficiary Summary File –A/B/C/D/Other, CMS Chronic Condition Data Warehouse. Accessed December 2019. (www.ccwdata.org).
Median hospice payment (Medicare + other) per hospice user
2016-2017 Master Beneficiary Summary File –A/B/C/D/Other, CMS Chronic Condition Data Warehouse. Accessed December 2019. (www.ccwdata.org).
COMMUNITY
Air pollution: annual # of unhealthy days for 65+ (county)
United States Environmental Protection Agency. Air Compare, 2019. Accessed August 2020. (https://www3.epa.gov/aircompare/#trends).
Age-friendly efforts in community
Age-friendly communities were collected from the AARP livable community network. Accessed May 2020. (https://www.aarp.org/livable-communities/network-age-friendly-communities/info-2016/member-list.html).
# of senior centers
Data were downloaded from the Connecticut Health and Human Services. (https://data.ct.gov/Health-and-Human-Services/Listing-of-Senior-Centers/kbx6-3an2/data). Accessed May 2020.
# of universities and community colleges
Number of university and community colleges in community is retrieved from New England Commission of Higher Education. Accessed May 2020. (https://www.neche.org/institutions/ct/).
# of public libraries
Number of public libraries in the community is downloaded from the CT State Library, Division of Library Development. (https://libguides.ctstatelibrary.org/ld.php?content_id=7466457). Accessed January 2021.
# of YMCAs
Data were obtained from the YMCA Southcoast website. Accessed May 2020. (https://ymcasouthcoast.org/membership/ymcas-new-england/).
% in county with access to broadband (all ages)
The percentage of persons in county with access to broadband was retrieved in 2017 from Federal Communications Commission which was released in 2016. Accessed May 2020. (https://docs.fcc.gov/public/attachments/FCC-16-6A1.pdf).

71
INDICATORS SOURCES and YEAR
% 60+ who used Internet in last month
2012-2018 Behavioral Risk Factor Surveillance Survey, Connecticut, Department of Public Health. Accessed December 2019. (https://portal.ct.gov/dph/Health-Information-Systems--Reporting/Hisrhome/Connecticut-Behavioral-Risk-Factor-Surveillance-System-CT-BRFSS).
Voter participation rate in 2016 presidential election (age 18+)
Number of voters were obtained from the Connecticut Secretary of the State. (https://ctemspublic.pcctg.net/#/voterTurnout). Accessed May 2020.
SAFETY & CRIME
Homicide rate /100,000 persons (county)
CDC Wonder, Multiple Cause of Death, 2014-2018. Accessed August 2019. (https://wonder.cdc.gov/controller/datarequest/D77;jsessionid=3AC202E57AC0BFE77BAEFB8769E8148D?stage=results&action=toggle&p=O_show_suppressed&v=true).
# firearm fatalities (county)
CDC Wonder, Multiple Cause of Death, 2014-2018. Accessed August 2019. (https://wonder.cdc.gov/controller/datarequest/D77;jsessionid=3AC202E57AC0BFE77BAEFB8769E8148D?stage=results&action=toggle&p=O_show_suppressed&v=true).
# 65+ deaths by suicide (county)
CDC Wonder, Multiple Cause of Death, 2014-2018. Accessed August 2019. (https://wonder.cdc.gov/controller/datarequest/D77;jsessionid=3AC202E57AC0BFE77BAEFB8769E8148D?stage=results&action=toggle&p=O_show_suppressed&v=true).
TRANSPORTATION
% 65+ who own a motor vehicle
United States Census Bureau. “B25045: TENURE BY VEHICLES AVAILABLE BY AGE OF HOUSEHOLDER”. U.S. Census Bureau’s American Community Survey Office, 2019. Accessed December 2019. (https://data.census.gov/cedsci/).
% 60+ who always drive or ride wearing a seatbelt
2012-2018 Behavioral Risk Factor Surveillance Survey, Connecticut, Department of Public Health. Accessed December 2019. (https://portal.ct.gov/dph/Health-Information-Systems--Reporting/Hisrhome/Connecticut-Behavioral-Risk-Factor-Surveillance-System-CT-BRFSS).

72
INDICATORS SOURCES and YEAR
% 60+ who drove under the influence of drinking in last month
2012-2018 Behavioral Risk Factor Surveillance Survey, Connecticut, Department of Public Health. Accessed December 2019. (https://portal.ct.gov/dph/Health-Information-Systems--Reporting/Hisrhome/Connecticut-Behavioral-Risk-Factor-Surveillance-System-CT-BRFSS).
# of fatal crashes involving adult age 60+/town or county
National Highway Traffic Safety Administration, Fatal Accident Reporting System (FARS) representing data for years 2014-2018. Downloaded from (http://www.nhtsa.gov/FARS). in August 2020.
HOUSING
% 65+ population living alone
United States Census Bureau. “B09020: RELATIONSHIP BY HOUSEHOLD TYPE (INCLUDING LIVING ALONE) FOR THE POPULATION 65 YEARS AND OVER”. U.S. Census Bureau’s American Community Survey Office, 2019. Accessed December 2019. (https://data.census.gov/cedsci/).
Average household size (all ages)
United States Census Bureau. “B11016: HOUSEHOLD TYPE BY HOUSEHOLD SIZE”. U.S. Census Bureau’s American Community Survey Office, 2019. Accessed December 2019. (https://data.census.gov/cedsci/).
Median house value
United States Census Bureau. “B25077: Median House Value”. U.S. Census Bureau’s American Community Survey Office, 2019. Accessed December 2019. (https://data.census.gov/cedsci/).
% 60+ own home
United States Census Bureau. “B25007: TENURE BY AGE HOUSEHOLDER”. U.S. Census Bureau’s American Community Survey Office, 2019. Accessed December 2019. (https://data.census.gov/cedsci/).
% 60+ homeowners who have mortgage
United States Census Bureau. “B25027: MORTGAGE STATUS BY AGE HOUSEHOLDER”. U.S. Census Bureau’s American Community Survey Office, 2019. Accessed December 2019. (https://data.census.gov/cedsci/).
% 60+ stressed about paying rent/mortgage in last month
2012-2018 Behavioral Risk Factor Surveillance Survey, Connecticut, Department of Public Health. Accessed December 2019. (https://portal.ct.gov/dph/Health-Information-Systems--Reporting/Hisrhome/Connecticut-Behavioral-Risk-Factor-Surveillance-System-CT-BRFSS).
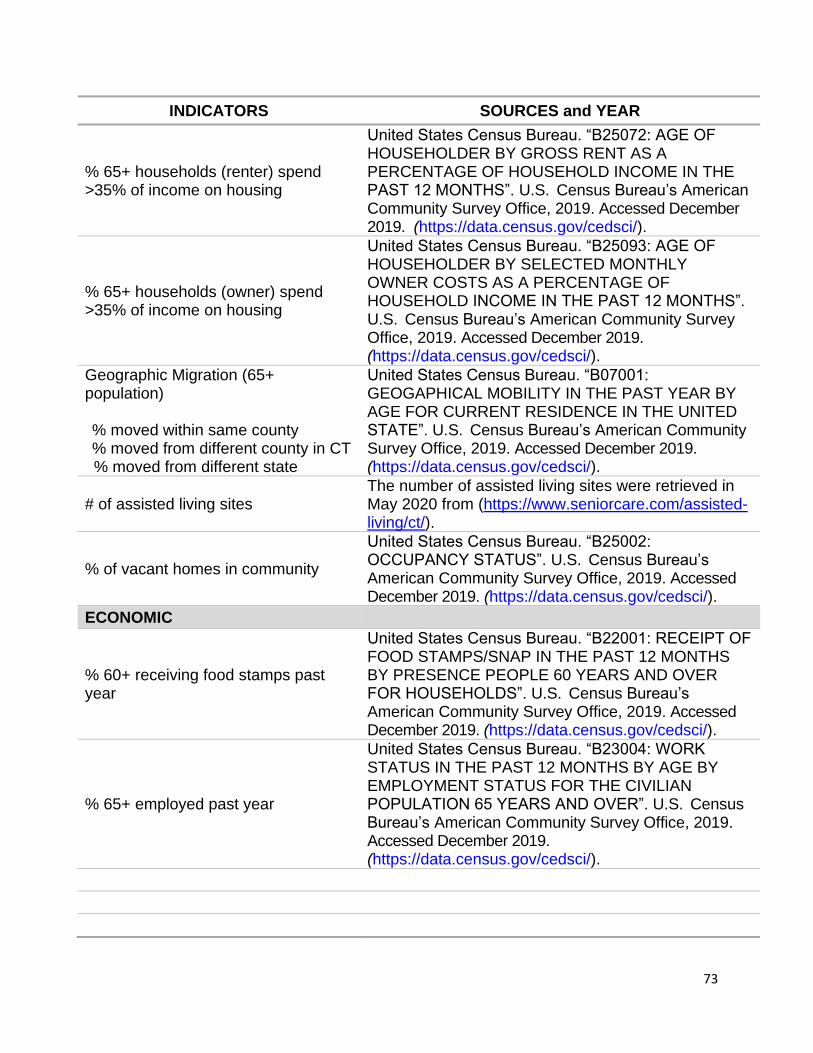
73
INDICATORS SOURCES and YEAR
% 65+ households (renter) spend >35% of income on housing
United States Census Bureau. “B25072: AGE OF HOUSEHOLDER BY GROSS RENT AS A PERCENTAGE OF HOUSEHOLD INCOME IN THE PAST 12 MONTHS”. U.S. Census Bureau’s American Community Survey Office, 2019. Accessed December 2019. (https://data.census.gov/cedsci/).
% 65+ households (owner) spend >35% of income on housing
United States Census Bureau. “B25093: AGE OF HOUSEHOLDER BY SELECTED MONTHLY OWNER COSTS AS A PERCENTAGE OF HOUSEHOLD INCOME IN THE PAST 12 MONTHS”. U.S. Census Bureau’s American Community Survey Office, 2019. Accessed December 2019. (https://data.census.gov/cedsci/).
Geographic Migration (65+ population) % moved within same county % moved from different county in CT
% moved from different state
United States Census Bureau. “B07001: GEOGAPHICAL MOBILITY IN THE PAST YEAR BY AGE FOR CURRENT RESIDENCE IN THE UNITED STATE”. U.S. Census Bureau’s American Community Survey Office, 2019. Accessed December 2019. (https://data.census.gov/cedsci/).
# of assisted living sites The number of assisted living sites were retrieved in May 2020 from (https://www.seniorcare.com/assisted-living/ct/).
% of vacant homes in community
United States Census Bureau. “B25002: OCCUPANCY STATUS”. U.S. Census Bureau’s American Community Survey Office, 2019. Accessed December 2019. (https://data.census.gov/cedsci/).
ECONOMIC
% 60+ receiving food stamps past year
United States Census Bureau. “B22001: RECEIPT OF FOOD STAMPS/SNAP IN THE PAST 12 MONTHS BY PRESENCE PEOPLE 60 YEARS AND OVER FOR HOUSEHOLDS”. U.S. Census Bureau’s American Community Survey Office, 2019. Accessed December 2019. (https://data.census.gov/cedsci/).
% 65+ employed past year
United States Census Bureau. “B23004: WORK STATUS IN THE PAST 12 MONTHS BY AGE BY EMPLOYMENT STATUS FOR THE CIVILIAN POPULATION 65 YEARS AND OVER”. U.S. Census Bureau’s American Community Survey Office, 2019. Accessed December 2019. (https://data.census.gov/cedsci/).

74
INDICATORS SOURCES and YEAR
% 65+ with income below the poverty level in last year
United States Census Bureau. “B17001: “POVERTY STATUS IN THE PAST 12 MONTHS BY SEX BY AGE”. U.S. Census Bureau’s American Community Survey Office, 2019. Accessed December 2019. (https://data.census.gov/cedsci/).
Household income (65+ householder) % households with annual income ( < $20,000 % households with annual income $20,000-$49,999 % households with annual income $50,000-$99,999 % households with annual income > $100,000
United States Census Bureau. “B19037: AGE OF HOUSEHOLDER BY HOUSEHOLD INCOME IN THE PAST 12 MONTHS (IN 2013 INFLATION-ADJUSTED DOLLARS)”. U.S. Census Bureau’s American Community Survey Office, 2019. Accessed December 2019. (https://data.census.gov/cedsci/).
COST OF LIVING
Elder Index
Elder Economic Security Index data from the University of Massachusetts Boston Center for Social and Demographic Research on Aging, August, 2017. Accessed May 2020.
Single, homeowner without mortgage, good health
Single, renter, good health
Couple, homeowner without mortgage, good health
Couple, renter, good health