technical guidance manual for evaluating emerging ... · ecology developed this guidance document...
TRANSCRIPT

Technical Guidance Manual for Evaluating Emerging Stormwater Treatment Technologies
Technology Assessment Protocol – Ecology (TAPE) August 2011 revision of Publication no. 02-10-037 Publication no. 11-10-061

Publication and Contact Information
This report is available on the Department of Ecology’s website at https://fortress.wa.gov/ecy/publications/summarypages/1110061.html For more information contact: Water Quality Program P.O. Box 47696 Olympia, WA 98504-7696 Phone: 360-407-6600 Washington State Department of Ecology – www.ecy.wa.gov
o Headquarters, Olympia 360-407-6000 o Northwest Regional Office, Bellevue 425-649-7000 o Southwest Regional Office, Olympia 360-407-6300 o Central Regional Office, Yakima 509-575-2490 o Eastern Regional Office, Spokane 509-329-3400 If you need this document in a format for the visually impaired, call the Water Quality Program at 360-407-6600. Persons with hearing loss can call 711 for Washington Relay Service. Persons with a speech disability can call 877-833-6341.

Technical Guidance Manual for Evaluating Emerging Stormwater
Treatment Technologies
Technology Assessment Protocol – Ecology (TAPE)
Water Quality Program Washington State Department of Ecology
Olympia, Washington

This page is purposely left blank
Revised June 2011 iii TAPE
Table of Contents
Page
List of Tables ................................................................................................................................. v
Acknowledgements ...................................................................................................................... vii
Acronyms ..................................................................................................................................... ix
Introduction .................................................................................................................................... 1
TAPE Program Overview .............................................................................................................. 3 Use level designations .............................................................................................................. 4 Performance goals .................................................................................................................... 6
Preparing a Quality Assurance Project Plan (QAPP) .................................................................... 9 Background .............................................................................................................................. 9
Technology description ................................................................................................. 10 Results of previous studies ............................................................................................ 11
Project description ................................................................................................................. 11 Organization and schedule ..................................................................................................... 11 Quality objectives .................................................................................................................. 12
Bias ................................................................................................................................ 12 Precision ........................................................................................................................ 13 Representativeness ........................................................................................................ 13 Completeness ................................................................................................................. 15 Comparability ................................................................................................................ 16
Experimental design............................................................................................................... 16 Monitoring site .............................................................................................................. 16 Treatment system sizing ................................................................................................ 18 Precipitation monitoring ................................................................................................ 18 Flow monitoring ............................................................................................................ 19 Water sampling .............................................................................................................. 20 Sediment sampling ........................................................................................................ 23 Supplemental laboratory testing procedures ................................................................. 23
Sampling procedures .............................................................................................................. 24 Precipitation monitoring ................................................................................................ 24 Flow monitoring ............................................................................................................ 25 Water sampling .............................................................................................................. 25 Sediment sampling ........................................................................................................ 27
Measurement procedures ....................................................................................................... 27 Water sampling .............................................................................................................. 28 Sediment sampling ........................................................................................................ 29
Quality control ....................................................................................................................... 30 Field quality assurance and quality control ................................................................... 30 Laboratory quality control ............................................................................................. 33
Data management procedures ................................................................................................ 33 Audits and reports .................................................................................................................. 34 Data verification and validation ............................................................................................. 34

Revised June 2011 iv TAPE
Data quality assessment ......................................................................................................... 34
Preparing a Technical Evaluation Report (TER) ......................................................................... 35 Cover letter............................................................................................................................. 36 Executive summary ................................................................................................................ 36 Introduction ............................................................................................................................ 36 Technology description .......................................................................................................... 36
Physical description ....................................................................................................... 37 Site requirements ........................................................................................................... 37 Sizing methodology ....................................................................................................... 37 Installation ..................................................................................................................... 38 Operation and maintenance requirements ..................................................................... 39 Reliability ...................................................................................................................... 39 Other benefits or challenges .......................................................................................... 40
Sampling procedures .............................................................................................................. 40 Data summaries and analysis ................................................................................................. 40
Storm event data ............................................................................................................ 40 Individual storm reports ................................................................................................ 41 Statistical comparisons of influent and effluent pollutant concentrations ..................... 42 Pollutant removal efficiency calculations ..................................................................... 42 Statistical evaluation of performance goals ................................................................... 43 Pollutant removal as a function of flow rate ................................................................. 44
Operation and maintenance information ................................................................................ 45 Discussion .............................................................................................................................. 46 Conclusions ............................................................................................................................ 46 Appendices ............................................................................................................................. 46 Third-party review ................................................................................................................. 47
References .................................................................................................................................... 49
Appendix Glossary ..................................................................................................................... 51

Revised June 2011 v TAPE
List of Tables Page
Table 1. TAPE use level designations ....................................................................................... 5 Table 2. Basic, dissolved metals, phosphorus, and oil treatment and pretreatment
performance goals and required water quality parameters for TAPE monitoring. ................................................................................................................... 7
Table 3. Example stormwater treatment mechanisms. ............................................................ 10 Table 4. Example measurement quality objectives for water quality monitoring. .................. 13 Table 5. Storm event guidelines for TAPE monitoring. .......................................................... 14 Table 6. Sample collection requirements for automated, flow-proportional composite
sampling. .................................................................................................................... 14 Table 7. Sample collection requirements for discrete flow sampling. ..................................... 15 Table 8. Required water quality parameters for TAPE monitoring. ........................................ 22 Table 9. Optional sediment sampling parameters for TAPE monitoring. ............................... 23 Table 10. Example sample container, preservation, and holding times for water quality
monitoring. ................................................................................................................. 26 Table 11. Reporting limits and analytical methods for water quality parameters. .................... 28 Table 12. Required particle size distribution size categories for the modified suspended
sediment concentration method. ................................................................................ 29 Table 13. Reporting limits and analytical methods for optional sediment parameters. ............. 30 Table 14. Example quality control sample summary for water quality monitoring. ................. 31 Table 15. Example equipment maintenance and calibration schedule. ..................................... 33

Revised June 2011 vi TAPE
This page is purposely left blank
Revised June 2011 vii TAPE
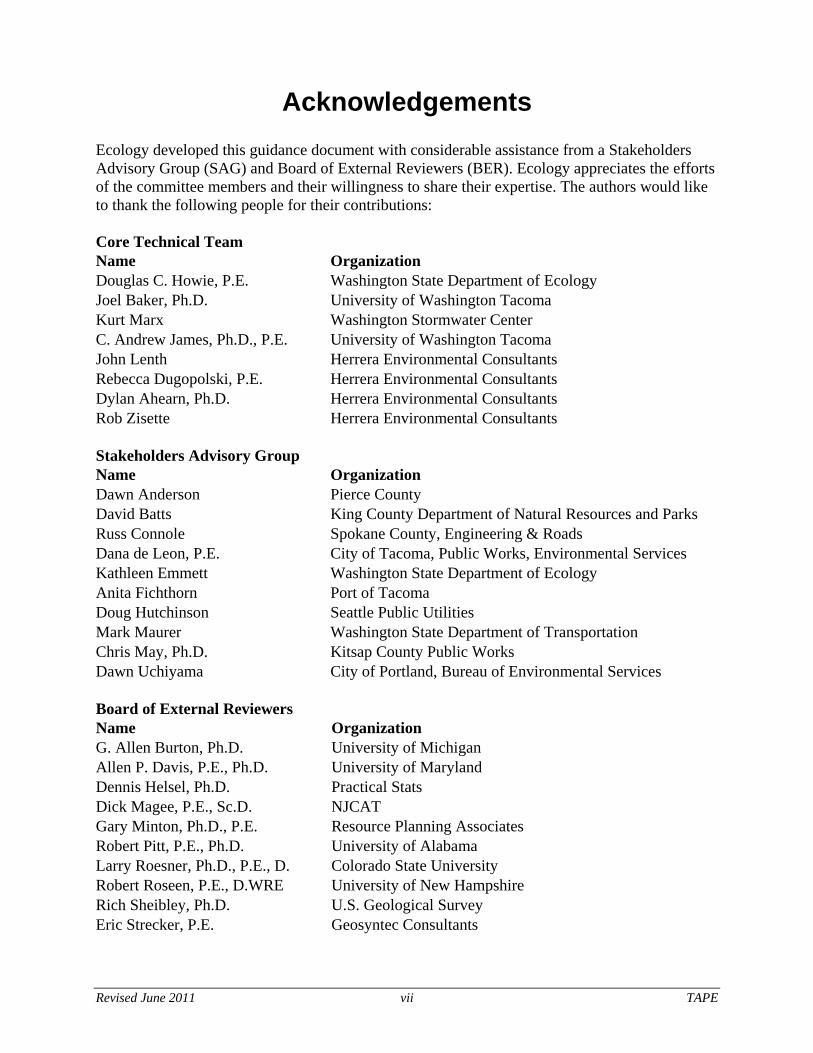
Acknowledgements Ecology developed this guidance document with considerable assistance from a Stakeholders Advisory Group (SAG) and Board of External Reviewers (BER). Ecology appreciates the efforts of the committee members and their willingness to share their expertise. The authors would like to thank the following people for their contributions: Core Technical Team Name Organization Douglas C. Howie, P.E. Washington State Department of Ecology Joel Baker, Ph.D. University of Washington Tacoma Kurt Marx Washington Stormwater Center C. Andrew James, Ph.D., P.E. University of Washington Tacoma John Lenth Herrera Environmental Consultants Rebecca Dugopolski, P.E. Herrera Environmental Consultants Dylan Ahearn, Ph.D. Herrera Environmental Consultants Rob Zisette Herrera Environmental Consultants Stakeholders Advisory Group Name Organization Dawn Anderson Pierce County David Batts King County Department of Natural Resources and Parks Russ Connole Spokane County, Engineering & Roads Dana de Leon, P.E. City of Tacoma, Public Works, Environmental Services Kathleen Emmett Washington State Department of Ecology Anita Fichthorn Port of Tacoma Doug Hutchinson Seattle Public Utilities Mark Maurer Washington State Department of Transportation Chris May, Ph.D. Kitsap County Public Works Dawn Uchiyama City of Portland, Bureau of Environmental Services Board of External Reviewers Name Organization G. Allen Burton, Ph.D. University of Michigan Allen P. Davis, P.E., Ph.D. University of Maryland Dennis Helsel, Ph.D. Practical Stats Dick Magee, P.E., Sc.D. NJCAT Gary Minton, Ph.D., P.E. Resource Planning Associates Robert Pitt, P.E., Ph.D. University of Alabama Larry Roesner, Ph.D., P.E., D. Colorado State University Robert Roseen, P.E., D.WRE University of New Hampshire Rich Sheibley, Ph.D. U.S. Geological Survey Eric Strecker, P.E. Geosyntec Consultants

Revised June 2011 viii TAPE
This page is purposely left blank

Revised June 2011 ix TAPE
Acronyms BER Board of External Reviewers BMP Best management practices CRM Certified reference materials C-TAPE Chemical Technology Assessment Protocol-Ecology CULD Conditional use level designation EMC Event mean concentration EvTEC Environmental Technology Evaluation Center ETV Environmental Technology Verification GULD General use level designation ISR Individual storm report MQO Method quality objectives MS Matrix spike MSD Matrix spike duplicate NPDES National Pollutant Discharge Elimination System NWTPH-Dx Northwest total petroleum hydrocarbons – motor oil and diesel fractions NWTPH-Gx Northwest total petroleum hydrocarbons – gasoline fraction PE Performance evaluations PSD Particle size distribution PULD Pilot use level designation QA Quality assurance QA/QC Quality assurance/quality control QC Quality control QAPP Quality Assurance Project Plan

Revised June 2011 x TAPE
RPD Relative percent difference SSC Suspended sediment concentration SWMMWW Stormwater Management Manual for Western Washington SWMMEW Stormwater Management Manual for Eastern Washington TAPE Technology Assessment Protocol-Ecology TARP Technology Acceptance and Reciprocity Partnership TER Technical Evaluation Report TP Total phosphorus TPH Total petroleum hydrocarbons TSS Total suspended solids TVSS Total volatile suspended solids WWHM Western Washington Hydrology Model

Revised June 2011 1 TAPE
Introduction This technical guidance manual was written to assist vendors, designers, manufacturers, and their consultants (all referred to herein as “proponents”) in monitoring site selection, Quality Assurance Project Plan (QAPP) development, monitoring program implementation, and preparation of a Technical Evaluation Report (TER), all of which are required to certify stormwater treatment technologies through the Washington State Technology Assessment Protocol-Ecology (TAPE) program. This manual updates the January 2008 revision of the Guidance for Evaluating Emerging Stormwater Treatment Technologies TAPE (Publication Number 02-10-037), in conjunction with the following documents:
• Emerging Stormwater Treatment Technologies Application for Certification (Publication Number ECY 070-391) (Application) (Ecology 2011a): www.ecy.wa.gov/biblio/ecy070391.html
• Technology Assessment Protocol – Ecology (TAPE) Process Overview (Publication Number 11-10-010) (TAPE Overview Document) (Ecology 2011b): www.ecy.wa.gov/biblio/1110010.html
• Guidelines for Preparing Quality Assurance Project Plans for Environmental Studies (Publication Number 04-03-030) (QAPP Guidelines) (Ecology 2004a): www.ecy.wa.gov/biblio/0403030.html
This manual provides three sections:
• TAPE Program Overview: General description of the TAPE program, including definitions of the use level designations and performance goals for each designation. (Additional information on the program is available in the TAPE Overview document described above.)
• Preparing a QAPP: The required structure for QAPP submittals. This section describes the information required for QAPP submittals, monitoring site selection, monitoring program implementation, required monitoring methods, and experimental design components.
• Preparing a TER: The required structure and content for TER submittals and data analysis methods required as part of the TER submittal.

Revised June 2011 2 TAPE
This page is purposely left blank

Revised June 2011 3 TAPE
TAPE Program Overview The Stormwater Management Manual for Western Washington (SWMMWW) (Ecology 2005) and Stormwater Management Manual for Eastern Washington (SWMMEW) (Ecology 2004b) include design criteria and performance goals for stormwater treatment facilities in the state of Washington. These criteria ensure stormwater treatment facilities meet performance goals for new development and redevelopment. Volume V, Chapter 12 of the SWMMWW and Chapter 5, Section 12 of the SWMMEW discuss emerging treatment technologies. Both manuals can be found online at: www.ecy.wa.gov/programs/wq/stormwater/municipal/StrmwtrMan.html. However, neither manual provides criteria for the selection and sizing of emerging technologies, because the technologies and knowledge of them evolve rapidly. This manual describes how emerging stormwater treatment technologies should be evaluated. The TAPE program provides a peer-reviewed regulatory certification process for emerging stormwater treatment technologies. The TAPE program is administered by the Washington State Department of Ecology (Ecology), with assistance from staff at the Washington Stormwater Center (www.wastormwatercenter.org), which provides stormwater management assistance including guidance on certification of emerging treatment technologies. Ecology and the Washington Stormwater Center established a Board of External Reviewers (BER) to review emerging treatment technology design and performance data, and recommend whether or not a proposed technology should be certified. Based on BER technical reviews, Washington Stormwater Center staff advises Ecology regarding which new stormwater treatment technologies meet performance goals and therefore should be added to the list of approved technologies in the SWMMWW and SWMMEW. Ecology makes the final decision to certify new stormwater treatment technologies. Performance must be demonstrated by the proponent by testing their stormwater treatment technology under rainfall conditions typical of the Pacific Northwest, using the protocol described within this manual. This protocol is specifically designed to evaluate flow through best management practices (BMPs) with relatively short detention times, and may not be suitable for all stormwater treatment technologies. Ecology has developed a draft alternative monitoring protocol that applies to long-detention BMPs (e.g., wet ponds) (Ecology 2008). A proponent may request a preliminary meeting with Ecology to discuss which portions of this technical guidance manual apply to the technology they will be monitoring and to obtain input on other testing protocols that may be applicable. Vendors or manufacturers may prepare a Quality Assurance Project Plan (QAPP), conduct their own field monitoring, and prepare a Technical Evaluation Report (TER). However, an independent professional third party must verify that monitoring was conducted in accordance with this protocol and prepare a third-party review memorandum. Alternatively, a vendor or manufacturer may retain a third-party to prepare the QAPP, conduct field monitoring, and prepare a TER. This satisfies the third-party review requirement. Portions of this manual may also be used to evaluate the effectiveness of both innovative and existing non-proprietary BMPs, possibly resulting in changes to the design standards for these practices in the stormwater management manuals. Local governments statewide can use the emerging technology use level designations (see Use Level Designations section) posted on Ecology’s website to identify approved stormwater technologies or those that are in the process of approval: www.ecy.wa.gov/programs/wq/stormwater/newtech/index.html.

Revised June 2011 4 TAPE
The protocol presented in this manual is intended to characterize an emerging technology’s effectiveness (with a given level of statistical confidence) in removing pollutants from stormwater runoff, and to compare test results with a proponent’s performance claims and TAPE performance goals. The test protocol also assesses technologies with respect to other factors such as maintenance, reliability, and longevity (see Preparing a TER [Technology Description]). The following sections summarize the use level designations and the performance goals of the TAPE program.
Use level designations To enter the TAPE program, proponents must complete the Emerging Stormwater Treatment Technologies Application for Certification (Application) (Ecology 2011a) and submit it to Ecology for review. Ecology (possibly in consultation with the BER) will evaluate the Application to determine an initial use level designation for the technology. The application process is discussed in more detail in the Technology Assessment Protocol – Ecology (TAPE) Process Overview (TAPE Overview Document) (Ecology 2011b). Ecology evaluates the existing data on a stormwater treatment technology to assign use level designations that determine how many installations may occur in Washington and what the monitoring requirements are for obtaining additional data on treatment performance. Depending on the relevance, amount, and quality of performance data provided with the Application, Ecology may give the technology one of two use level designations: pilot use level designation (PULD) or conditional use level designation (CULD) (Table 1). PULDs are typically given when there are sufficient laboratory data available to indicate a treatment technology may meet the performance goals for TAPE that are described in the next subsection. CULDs are typically given when there are both laboratory and field data available for a treatment technology that would indicate an even greater likelihood of meeting these performance goals. The PULD and CULD allow the technology to be installed and operated in the state of Washington to gather the performance data required for final general use level designation (GULD) certification. Installation is subject to approval by local jurisdictions. Refer to Table 1 for additional conditions. Because local installation and testing provide useful information, Ecology encourages local jurisdictions, industrial or commercial establishments, and consultants to consider installing technologies with a PULD or CULD. Local governments covered by a municipal stormwater National Pollutant Discharge Elimination System (NPDES) permit must submit a Notice of Intent form (www.ecy.wa.gov/biblio/ecy070423.html) to Ecology when a PULD technology is proposed for installation in their jurisdiction. The proponent must submit a QAPP that meets Ecology’s QAPP guidance and the requirements of the TAPE protocol within 6 months of finding a suitable monitoring site and notifying Ecology. Failure to submit the QAPP within this 6-month timeframe will result in a suspension of the PULD or CULD by Ecology. Ecology may remove the suspension if the proponent provides justification for missing the deadline and submits a QAPP for technical review.
Revised June 2011 5 TAPE
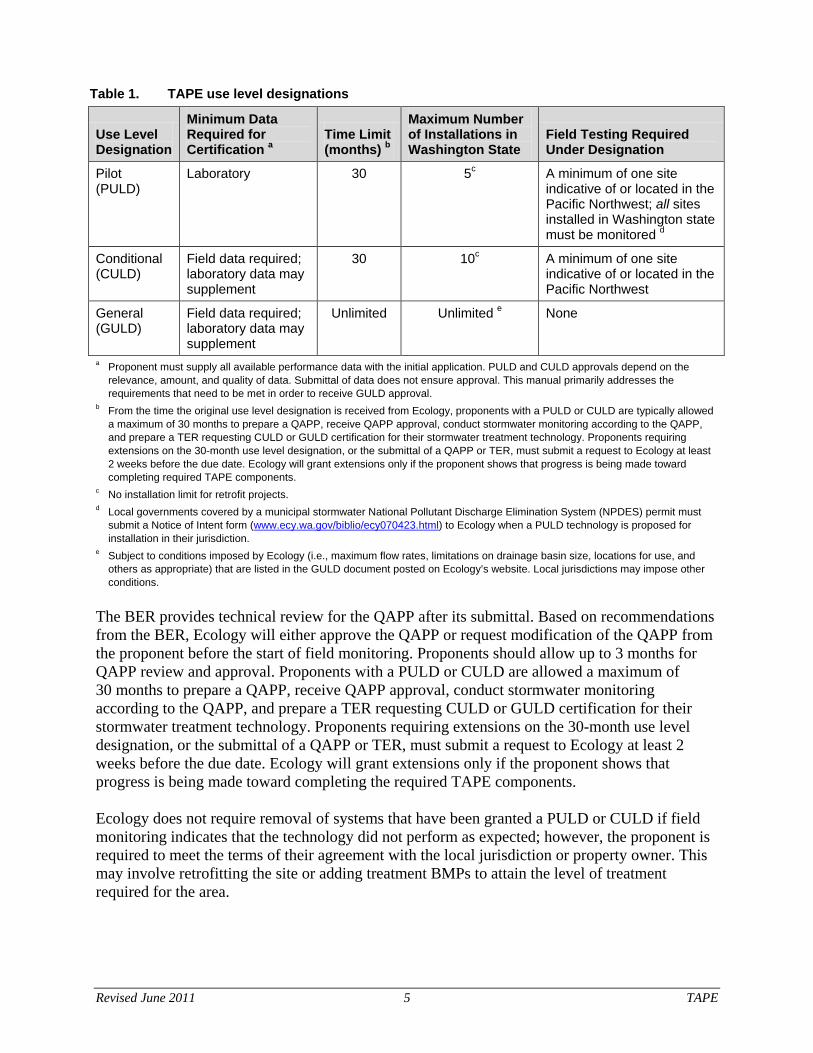
Table 1. TAPE use level designations
Use Level Designation
Minimum Data Required for Certification a
Time Limit (months) b
Maximum Number of Installations in Washington State
Field Testing Required Under Designation
Pilot (PULD)
Laboratory 30 5c A minimum of one site indicative of or located in the Pacific Northwest; all sites installed in Washington state must be monitored d
Conditional (CULD)
Field data required; laboratory data may supplement
30 10c A minimum of one site indicative of or located in the Pacific Northwest
General (GULD)
Field data required; laboratory data may supplement
Unlimited Unlimited e None
a Proponent must supply all available performance data with the initial application. PULD and CULD approvals depend on the relevance, amount, and quality of data. Submittal of data does not ensure approval. This manual primarily addresses the requirements that need to be met in order to receive GULD approval.
b From the time the original use level designation is received from Ecology, proponents with a PULD or CULD are typically allowed a maximum of 30 months to prepare a QAPP, receive QAPP approval, conduct stormwater monitoring according to the QAPP, and prepare a TER requesting CULD or GULD certification for their stormwater treatment technology. Proponents requiring extensions on the 30-month use level designation, or the submittal of a QAPP or TER, must submit a request to Ecology at least 2 weeks before the due date. Ecology will grant extensions only if the proponent shows that progress is being made toward completing required TAPE components.
c No installation limit for retrofit projects. d Local governments covered by a municipal stormwater National Pollutant Discharge Elimination System (NPDES) permit must
submit a Notice of Intent form (www.ecy.wa.gov/biblio/ecy070423.html) to Ecology when a PULD technology is proposed for installation in their jurisdiction.
e Subject to conditions imposed by Ecology (i.e., maximum flow rates, limitations on drainage basin size, locations for use, and others as appropriate) that are listed in the GULD document posted on Ecology’s website. Local jurisdictions may impose other conditions.
The BER provides technical review for the QAPP after its submittal. Based on recommendations from the BER, Ecology will either approve the QAPP or request modification of the QAPP from the proponent before the start of field monitoring. Proponents should allow up to 3 months for QAPP review and approval. Proponents with a PULD or CULD are allowed a maximum of 30 months to prepare a QAPP, receive QAPP approval, conduct stormwater monitoring according to the QAPP, and prepare a TER requesting CULD or GULD certification for their stormwater treatment technology. Proponents requiring extensions on the 30-month use level designation, or the submittal of a QAPP or TER, must submit a request to Ecology at least 2 weeks before the due date. Ecology will grant extensions only if the proponent shows that progress is being made toward completing the required TAPE components. Ecology does not require removal of systems that have been granted a PULD or CULD if field monitoring indicates that the technology did not perform as expected; however, the proponent is required to meet the terms of their agreement with the local jurisdiction or property owner. This may involve retrofitting the site or adding treatment BMPs to attain the level of treatment required for the area.

Revised June 2011 6 TAPE
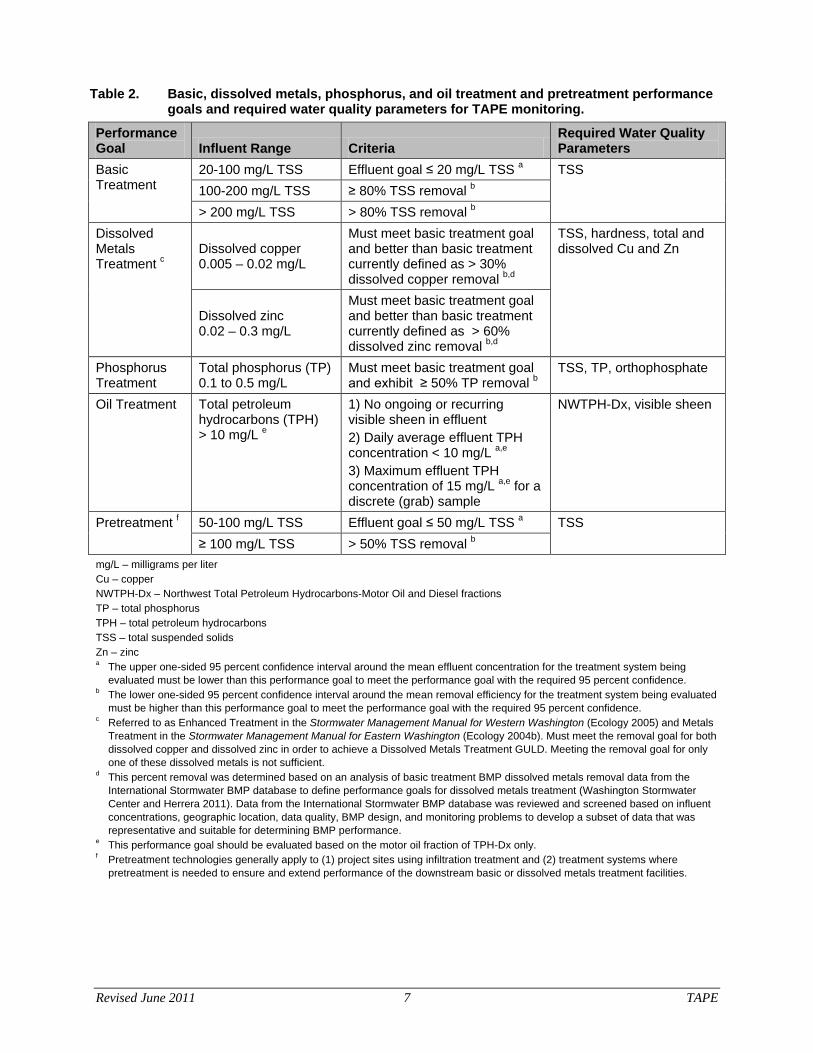
Performance goals As summarized in Table 2, Ecology’s stormwater manuals specify pretreatment, basic, dissolved metals, phosphorus, and oil treatment performance goals in Volume V, Chapter 3, of the SWMMWW (Ecology 2005) and Chapter 5, Section 1 of the SWMMEW (Ecology 2004b). These goals are also used in the TAPE program to evaluate emerging stormwater treatment technologies. Proponents attempting to obtain a GULD for a specific stormwater treatment technology must demonstrate that applicable treatment performance goals are achieved by monitoring the water quality parameters listed in Table 2. The performance goals depend on whether the technology is a standalone facility or part of a treatment train. If part of a treatment train, the proponent must evaluate the performance of the entire treatment train. The proponent may also monitor the components of a treatment train in addition to the entire treatment train. However, this is not required if the system design will always include the same treatment train configuration. Ecology and the BER also evaluate factors other than treatment performance (e.g., site requirements, sizing methodology, installation, operation and maintenance requirements, reliability) to determine the appropriate uses (e.g., specific land use types, siting restrictions) of the stormwater treatment technology (see Preparing a TER [Technology Description]). The treatment performance goals identified in Table 2 apply to the water quality design hydraulic loading rate. The proponent must also measure and report the portion of the discharge volume that bypasses the stormwater treatment technology on an average basis. The incremental portion of runoff in excess of the water quality design hydraulic loading rate can be routed around the facility (off-line treatment facilities) or passed through the facility (on-line treatment facilities). However, this incremental portion of the runoff should not be considered in analyses performed to determine if the stormwater treatment technology is meeting the applicable treatment performance goals; rather, these data are only used to confirm correct application of system sizing criteria and evaluate the accuracy of maintenance schedules indicated by the proponent. If the proponent has already received a GULD for basic treatment and is conducting a second monitoring study for dissolved metals or phosphorus treatment, it may not be necessary to perform monitoring to demonstrate basic treatment performance. Instead, the proponent may resubmit monitoring data from the TER that was used to document basic treatment performance if there has been no change in the treatment technology, media, or sizing criteria.
Revised June 2011 7 TAPE
Table 2. Basic, dissolved metals, phosphorus, and oil treatment and pretreatment performance goals and required water quality parameters for TAPE monitoring.
Performance Goal Influent Range Criteria
Required Water Quality Parameters
Basic Treatment
20-100 mg/L TSS Effluent goal ≤ 20 mg/L TSS a TSS 100-200 mg/L TSS ≥ 80% TSS removal b > 200 mg/L TSS > 80% TSS removal b
Dissolved Metals Treatment c
Dissolved copper 0.005 – 0.02 mg/L
Must meet basic treatment goal and better than basic treatment currently defined as > 30% dissolved copper removal b,d
TSS, hardness, total and dissolved Cu and Zn
Dissolved zinc 0.02 – 0.3 mg/L
Must meet basic treatment goal and better than basic treatment currently defined as > 60% dissolved zinc removal b,d
Phosphorus Treatment
Total phosphorus (TP) 0.1 to 0.5 mg/L
Must meet basic treatment goal and exhibit ≥ 50% TP removal b
TSS, TP, orthophosphate
Oil Treatment Total petroleum hydrocarbons (TPH) > 10 mg/L e
1) No ongoing or recurring visible sheen in effluent 2) Daily average effluent TPH concentration < 10 mg/L a,e 3) Maximum effluent TPH concentration of 15 mg/L a,e for a discrete (grab) sample
NWTPH-Dx, visible sheen
Pretreatment f 50-100 mg/L TSS Effluent goal ≤ 50 mg/L TSS a TSS ≥ 100 mg/L TSS > 50% TSS removal b
mg/L – milligrams per liter Cu – copper NWTPH-Dx – Northwest Total Petroleum Hydrocarbons-Motor Oil and Diesel fractions TP – total phosphorus TPH – total petroleum hydrocarbons TSS – total suspended solids Zn – zinc a The upper one-sided 95 percent confidence interval around the mean effluent concentration for the treatment system being
evaluated must be lower than this performance goal to meet the performance goal with the required 95 percent confidence. b The lower one-sided 95 percent confidence interval around the mean removal efficiency for the treatment system being evaluated
must be higher than this performance goal to meet the performance goal with the required 95 percent confidence. c Referred to as Enhanced Treatment in the Stormwater Management Manual for Western Washington (Ecology 2005) and Metals
Treatment in the Stormwater Management Manual for Eastern Washington (Ecology 2004b). Must meet the removal goal for both dissolved copper and dissolved zinc in order to achieve a Dissolved Metals Treatment GULD. Meeting the removal goal for only one of these dissolved metals is not sufficient.
d This percent removal was determined based on an analysis of basic treatment BMP dissolved metals removal data from the International Stormwater BMP database to define performance goals for dissolved metals treatment (Washington Stormwater Center and Herrera 2011). Data from the International Stormwater BMP database was reviewed and screened based on influent concentrations, geographic location, data quality, BMP design, and monitoring problems to develop a subset of data that was representative and suitable for determining BMP performance.
e This performance goal should be evaluated based on the motor oil fraction of TPH-Dx only. f Pretreatment technologies generally apply to (1) project sites using infiltration treatment and (2) treatment systems where
pretreatment is needed to ensure and extend performance of the downstream basic or dissolved metals treatment facilities.

Revised June 2011 8 TAPE
This page is purposely left blank

Revised June 2011 9 TAPE
Preparing a Quality Assurance Project Plan (QAPP)
This section provides guidance on preparing the QAPP required as part of the TAPE certification process. The proponent must submit a QAPP that meets Ecology’s QAPP guidance and the requirements of the TAPE protocol within 6 months of finding a suitable monitoring site and notifying Ecology. Proponents with a PULD or CULD are allowed a maximum of 30 months to prepare a QAPP, receive QAPP approval, conduct stormwater monitoring according to the QAPP, and prepare a TER requesting CULD or GULD certification for their stormwater treatment technology. The QAPP can be prepared by the vendor/manufacturer, an independent professional third party that will be conducting the monitoring program for the vendor/manufacturer, or another independent third party. QAPPs must include detailed information on the actual site that is selected for monitoring. Incomplete QAPPs will be returned to the proponent without review. This section is structured similarly to the Guidelines for Preparing Quality Assurance Project Plans for Environmental Studies (QAPP Guidelines) (Ecology 2004a), to assist proponents with developing a monitoring program consistent with the guidelines proposed by Ecology. The proponent should refer to the QAPP Guidelines for full details. The required elements of a QAPP are described in the following sections:
• Background • Project description • Organization and schedule • Quality objectives • Experimental design • Sampling procedures • Measurement procedures • Quality control • Data management procedures • Audits and reports • Data verification and validation • Data quality assessment Note: The “Title page with approvals” and “Table of contents and distribution list” QAPP elements were not included in this manual, since they are well defined in the QAPP Guidelines. This section focuses on the components of the QAPP that have specific TAPE program requirements that are not described in the QAPP Guidelines. Both of these documents should be used when preparing a QAPP for the TAPE program.
Background The background section of the QAPP must contain information on the use level designation that the proponent has received from Ecology, and which performance goals that the proponent will evaluate through their monitoring program. These use level designations are presented in Table 1

Revised June 2011 10 TAPE
and performance goals are presented in Table 2 in the TAPE Program Overview section. The background section must also provide a detailed description of the stormwater treatment technology and briefly summarize the results of laboratory testing or field monitoring results provided in the Application.
Technology description This section of the QAPP provides a generic description of the technology with sufficient detail to allow the reader to fully understand how the technology works. The Experimental Design section of the QAPP describes the specifics of the site selected for TAPE monitoring. The technology description in the QAPP must include the elements listed below at a minimum.
• Description of biological, chemical, or physical treatment mechanisms (see examples in Table 3)
• Design drawings and photographs • Equipment dimensions • Design hydraulic loading rate (gallons per minute [gpm], cubic feet per second [cfs], inches
per hour [in/hr]) • Explanation of site installation requirements (see examples in Preparing a TER [Technology
Description]) • Description of any pretreatment requirements or recommendations • Description of any components of the treatment system that may contain copper, zinc, or
phosphorus or any other constituent of concern that might contribute to increased pollutant concentrations in the effluent
• Description of any components (i.e., concrete) that may result in pH fluctuations in the effluent
• Operation and maintenance requirements, including the anticipated frequency and duration of a typical maintenance cycle
Table 3. Example stormwater treatment mechanisms.
Treatment Category Treatment Mechanisms a Biological • Biological growth
• Denitrification • Microbially mediated transformations
• Nitrification • Plant uptake and storage
Chemical • Absorption • Adsorption
• Anion exchange • Cation exchange
Physical • Adhesion • Adsorption • Filtration • Flocculation • Impaction
• Interception • Sedimentation • Settling • Straining • Vortexing separation
a This table provides examples of common biological, chemical, and physical treatment mechanisms that are present in stormwater treatment technologies. Additional treatment mechanisms not listed in this table may also be included.

Revised June 2011 11 TAPE
Results of previous studies In this section of the QAPP, proponents should summarize results from previous laboratory testing. Include results from field monitoring using protocols other than the TAPE, such as the Environmental Technology Verification (ETV), Environmental Technology Evaluation Center (EvTEC), and Technology Acceptance and Reciprocity Partnership (TARP).
Project description The QAPP should briefly describe the project, including the following information:
• Project objectives (i.e., characterizing pollutant removal effectiveness and effluent quality at the design hydraulic loading rate, providing data demonstrating the removal effectiveness of the system for dissolved metals)
• Information (i.e., data) that will be required to meet the project objectives
• Number of test locations and approximate duration of monitoring
• Tasks that will be required to collect the data
• Potential constraints (i.e., seasonal or meteorological conditions, limited access, safety, or availability of personnel or equipment)
Organization and schedule The organization and schedule section of the QAPP must specify the following:
• Name, organization, and phone numbers of key members of the project team (i.e., project manager, test site owner/manager, field personnel, consultant oversight participants, and analytical laboratory contacts)
• Identification of who will perform the third-party evaluation
• Roles and responsibilities of the key members of the project team
• Project schedule documenting when the treatment system and associated monitoring equipment will be installed, the expected field monitoring start date, projected field sampling completion, and TER submittal
Proponents with a PULD or CULD are typically allowed a maximum of 30 months to prepare a QAPP, receive QAPP approval, conduct stormwater monitoring according to the QAPP, and prepare a TER requesting CULD or GULD certification for their stormwater treatment technology. Proponents should allow up to 3 months for QAPP review and approval. It is also recommended that the proponent allow time for initial startup and testing of the treatment system and monitoring equipment at the beginning of the monitoring period. Proponents requiring extensions on the 30-month use level designation, or the submittal of a QAPP or TER, must submit a request to Ecology at least 2 weeks before the due date. Ecology may grant extensions only if the proponent shows that progress is being made toward completing required TAPE components.
Revised June 2011 12 TAPE
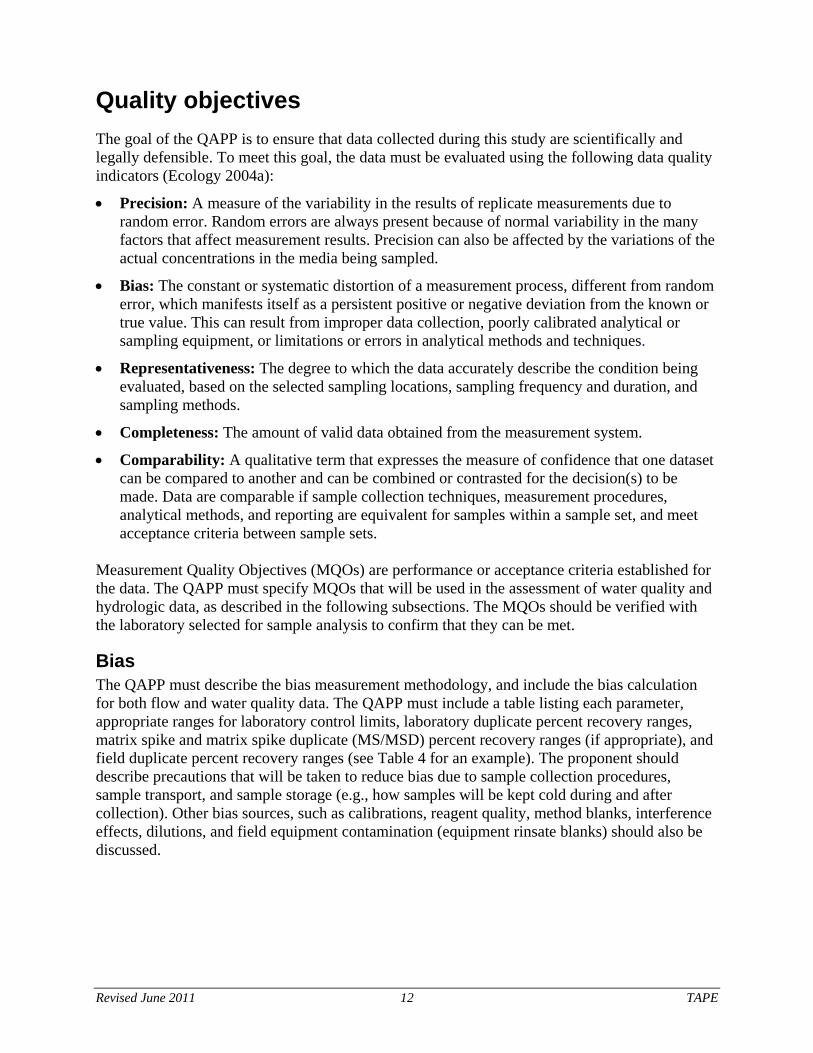
Quality objectives The goal of the QAPP is to ensure that data collected during this study are scientifically and legally defensible. To meet this goal, the data must be evaluated using the following data quality indicators (Ecology 2004a):
• Precision: A measure of the variability in the results of replicate measurements due to random error. Random errors are always present because of normal variability in the many factors that affect measurement results. Precision can also be affected by the variations of the actual concentrations in the media being sampled.
• Bias: The constant or systematic distortion of a measurement process, different from random error, which manifests itself as a persistent positive or negative deviation from the known or true value. This can result from improper data collection, poorly calibrated analytical or sampling equipment, or limitations or errors in analytical methods and techniques.
• Representativeness: The degree to which the data accurately describe the condition being evaluated, based on the selected sampling locations, sampling frequency and duration, and sampling methods.
• Completeness: The amount of valid data obtained from the measurement system.
• Comparability: A qualitative term that expresses the measure of confidence that one dataset can be compared to another and can be combined or contrasted for the decision(s) to be made. Data are comparable if sample collection techniques, measurement procedures, analytical methods, and reporting are equivalent for samples within a sample set, and meet acceptance criteria between sample sets.
Measurement Quality Objectives (MQOs) are performance or acceptance criteria established for the data. The QAPP must specify MQOs that will be used in the assessment of water quality and hydrologic data, as described in the following subsections. The MQOs should be verified with the laboratory selected for sample analysis to confirm that they can be met.
Bias The QAPP must describe the bias measurement methodology, and include the bias calculation for both flow and water quality data. The QAPP must include a table listing each parameter, appropriate ranges for laboratory control limits, laboratory duplicate percent recovery ranges, matrix spike and matrix spike duplicate (MS/MSD) percent recovery ranges (if appropriate), and field duplicate percent recovery ranges (see Table 4 for an example). The proponent should describe precautions that will be taken to reduce bias due to sample collection procedures, sample transport, and sample storage (e.g., how samples will be kept cold during and after collection). Other bias sources, such as calibrations, reagent quality, method blanks, interference effects, dilutions, and field equipment contamination (equipment rinsate blanks) should also be discussed.
Revised June 2011 13 TAPE
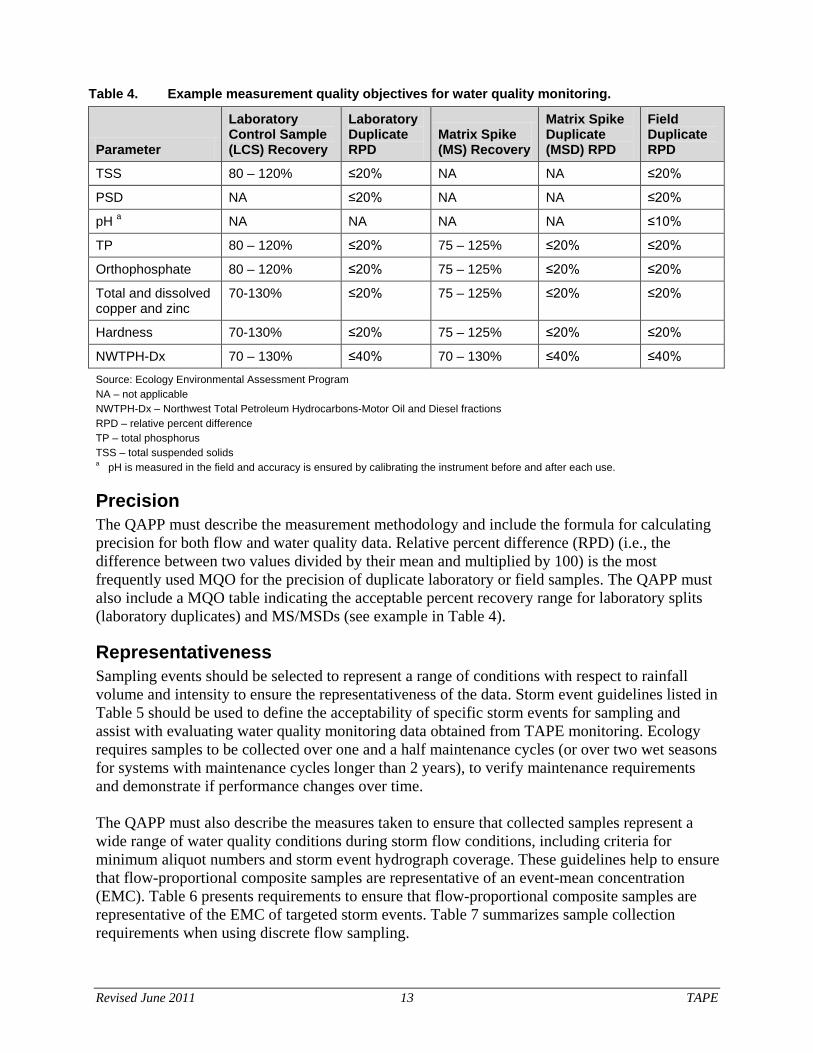
Table 4. Example measurement quality objectives for water quality monitoring.
Parameter
Laboratory Control Sample (LCS) Recovery
Laboratory Duplicate RPD
Matrix Spike (MS) Recovery
Matrix Spike Duplicate (MSD) RPD
Field Duplicate RPD
TSS 80 – 120% ≤20% NA NA ≤20%
PSD NA ≤20% NA NA ≤20%
pH a NA NA NA NA ≤10%
TP 80 – 120% ≤20% 75 – 125% ≤20% ≤20%
Orthophosphate 80 – 120% ≤20% 75 – 125% ≤20% ≤20%
Total and dissolved copper and zinc
70-130% ≤20% 75 – 125% ≤20% ≤20%
Hardness 70-130% ≤20% 75 – 125% ≤20% ≤20%
NWTPH-Dx 70 – 130% ≤40% 70 – 130% ≤40% ≤40%
Source: Ecology Environmental Assessment Program NA – not applicable NWTPH-Dx – Northwest Total Petroleum Hydrocarbons-Motor Oil and Diesel fractions RPD – relative percent difference TP – total phosphorus TSS – total suspended solids a pH is measured in the field and accuracy is ensured by calibrating the instrument before and after each use.
Precision The QAPP must describe the measurement methodology and include the formula for calculating precision for both flow and water quality data. Relative percent difference (RPD) (i.e., the difference between two values divided by their mean and multiplied by 100) is the most frequently used MQO for the precision of duplicate laboratory or field samples. The QAPP must also include a MQO table indicating the acceptable percent recovery range for laboratory splits (laboratory duplicates) and MS/MSDs (see example in Table 4).
Representativeness Sampling events should be selected to represent a range of conditions with respect to rainfall volume and intensity to ensure the representativeness of the data. Storm event guidelines listed in Table 5 should be used to define the acceptability of specific storm events for sampling and assist with evaluating water quality monitoring data obtained from TAPE monitoring. Ecology requires samples to be collected over one and a half maintenance cycles (or over two wet seasons for systems with maintenance cycles longer than 2 years), to verify maintenance requirements and demonstrate if performance changes over time. The QAPP must also describe the measures taken to ensure that collected samples represent a wide range of water quality conditions during storm flow conditions, including criteria for minimum aliquot numbers and storm event hydrograph coverage. These guidelines help to ensure that flow-proportional composite samples are representative of an event-mean concentration (EMC). Table 6 presents requirements to ensure that flow-proportional composite samples are representative of the EMC of targeted storm events. Table 7 summarizes sample collection requirements when using discrete flow sampling.

Revised June 2011 14 TAPE
Table 5. Storm event guidelines for TAPE monitoring.
Parameter Definition Guideline a
Minimum storm depth Total rainfall amount during the storm event 0.15 inches
Storm start (antecedent dry-period)
Defines the storm event’s beginning as designated by minimum time interval without significant rainfall
6 hours minimum with less than 0.04 inches of rain
Storm end (post storm dry period)
Defines the storm event’s end as designated by minimum time interval without significant rainfall
6 hours minimum with less than 0.04 inches of rain
Minimum storm duration Shortest acceptable rainfall duration 1 hour
Average storm intensity Total rainfall amount divided by total rainfall duration (e.g., inches per hour)
Range of rainfall intensities b
a Provide justification in the Technical Evaluation Report (TER) for storm event data that does not meet the storm event guidelines, but is included in the data analysis.
b To assess performance on an annual average basis and performance at the system’s peak design rate, proponents should collect samples over a range of rainfall intensities.
Table 6. Sample collection requirements for automated, flow-proportional composite sampling.
Parameter Definition Requirement
Minimum aliquot number The number of equal-volume samples collected during a storm event that are combined to create a composite sample
10 aliquots a
Storm event coverage The percentage of the total storm volume that the collected aliquots represent
For storm events lasting less than 24 hours, samples shall be collected for at least 75% of the storm event hydrograph (by volume). For storm events lasting longer than 24 hours, samples shall be collected for at least 75% of the hydrograph (by volume) of the first 24 hours of the storm.
Maximum sampling duration Time in hours between the collection of the first and last aliquots
36 hours
Minimum number of samples Number of storm events with successfully collected flow-proportional composite samples that meet the influent concentration ranges and the storm event guidelines
12 samples b
a Ecology may accept as few as 7 aliquots. Proponents must include rationale in the TER why less than 10 aliquots were collected, but the sample accepted.
b Paired influent and effluent data from more than one site can be combined (pooled) to meet the minimum number of samples.
Revised June 2011 15 TAPE
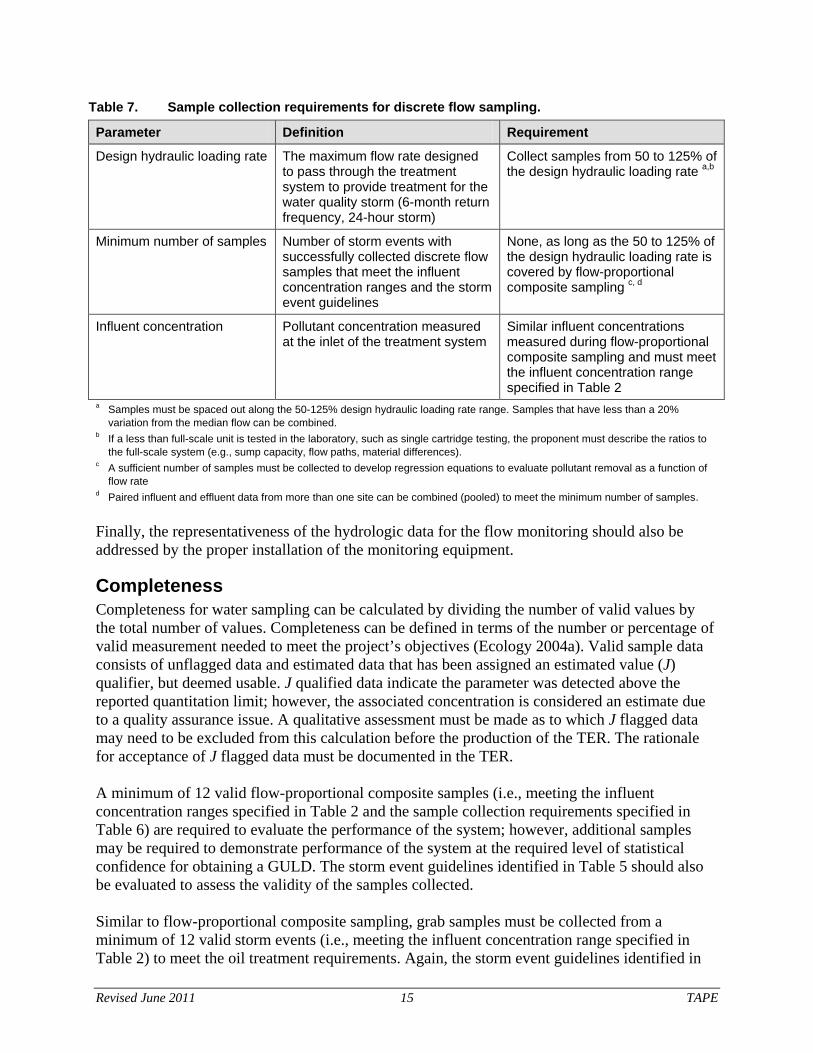
Table 7. Sample collection requirements for discrete flow sampling.
Parameter Definition Requirement
Design hydraulic loading rate The maximum flow rate designed to pass through the treatment system to provide treatment for the water quality storm (6-month return frequency, 24-hour storm)
Collect samples from 50 to 125% of the design hydraulic loading rate a,b
Minimum number of samples Number of storm events with successfully collected discrete flow samples that meet the influent concentration ranges and the storm event guidelines
None, as long as the 50 to 125% of the design hydraulic loading rate is covered by flow-proportional composite sampling c, d
Influent concentration Pollutant concentration measured at the inlet of the treatment system
Similar influent concentrations measured during flow-proportional composite sampling and must meet the influent concentration range specified in Table 2
a Samples must be spaced out along the 50-125% design hydraulic loading rate range. Samples that have less than a 20% variation from the median flow can be combined.
b If a less than full-scale unit is tested in the laboratory, such as single cartridge testing, the proponent must describe the ratios to the full-scale system (e.g., sump capacity, flow paths, material differences).
c A sufficient number of samples must be collected to develop regression equations to evaluate pollutant removal as a function of flow rate
d Paired influent and effluent data from more than one site can be combined (pooled) to meet the minimum number of samples. Finally, the representativeness of the hydrologic data for the flow monitoring should also be addressed by the proper installation of the monitoring equipment.
Completeness Completeness for water sampling can be calculated by dividing the number of valid values by the total number of values. Completeness can be defined in terms of the number or percentage of valid measurement needed to meet the project’s objectives (Ecology 2004a). Valid sample data consists of unflagged data and estimated data that has been assigned an estimated value (J) qualifier, but deemed usable. J qualified data indicate the parameter was detected above the reported quantitation limit; however, the associated concentration is considered an estimate due to a quality assurance issue. A qualitative assessment must be made as to which J flagged data may need to be excluded from this calculation before the production of the TER. The rationale for acceptance of J flagged data must be documented in the TER. A minimum of 12 valid flow-proportional composite samples (i.e., meeting the influent concentration ranges specified in Table 2 and the sample collection requirements specified in Table 6) are required to evaluate the performance of the system; however, additional samples may be required to demonstrate performance of the system at the required level of statistical confidence for obtaining a GULD. The storm event guidelines identified in Table 5 should also be evaluated to assess the validity of the samples collected. Similar to flow-proportional composite sampling, grab samples must be collected from a minimum of 12 valid storm events (i.e., meeting the influent concentration range specified in Table 2) to meet the oil treatment requirements. Again, the storm event guidelines identified in
Revised June 2011 16 TAPE
Table 5 should also be evaluated to assess the validity of the grab samples collected. Proponents may collect more than one grab sample from each storm event as long as the minimum requirement of 12 valid storm events is met. Completeness for flow monitoring must be assessed based on the occurrence of gaps in the data record. Gaps include data that are known to be inaccurate and cannot be corrected using available calibration data. The associated MQO must identify the maximum percentage of the data record during storms and over the entire monitoring period that can be missing and still meet the goals for flow monitoring specified in the QAPP. Completeness will also be ensured through routine maintenance of all monitoring equipment and the immediate implementation of corrective actions if problems arise.
Comparability There is no numeric MQO for this data quality indicator; however, standard sampling procedures, analytical methods, units of measurement, and reporting limits applied during TAPE monitoring will address the goal of data comparability. The results should be tabulated in standard spreadsheets to facilitate analysis and comparison with performance data from other stormwater treatment technologies.
Experimental design As described above, performance of a stormwater treatment technology must be demonstrated based on field testing performed under rainfall conditions typical of the Pacific Northwest. This testing will involve continuous flow and precipitation monitoring, the collection of water quality samples during discrete storm events, and accumulated sediment sampling. The QAPP must provide detailed information on the following experimental design elements for this testing:
• Monitoring site • Treatment system sizing • Precipitation monitoring • Flow monitoring • Water sampling • Sediment sampling The following sections provide guidance on each of these elements.
Monitoring site To obtain a GULD, proponents that receive a PULD or a CULD for their stormwater treatment technologies must conduct field monitoring at a minimum of one site. Proponents that receive a PULD must monitor at every site installation. The proponent is responsible for the cost of completing this evaluation, including laboratory testing and field monitoring. Neither Ecology nor the BER will provide funding for this work; however, Ecology recognizes the need to minimize the cost of implementing the TAPE program. To the extent applicable, the following list provides ways to minimize cost yet provide sufficient verification data:
• Conduct field reconnaissance to confirm suitability of site for monitoring based on predominant land use, drainage system configuration, and property access.
Revised June 2011 17 TAPE
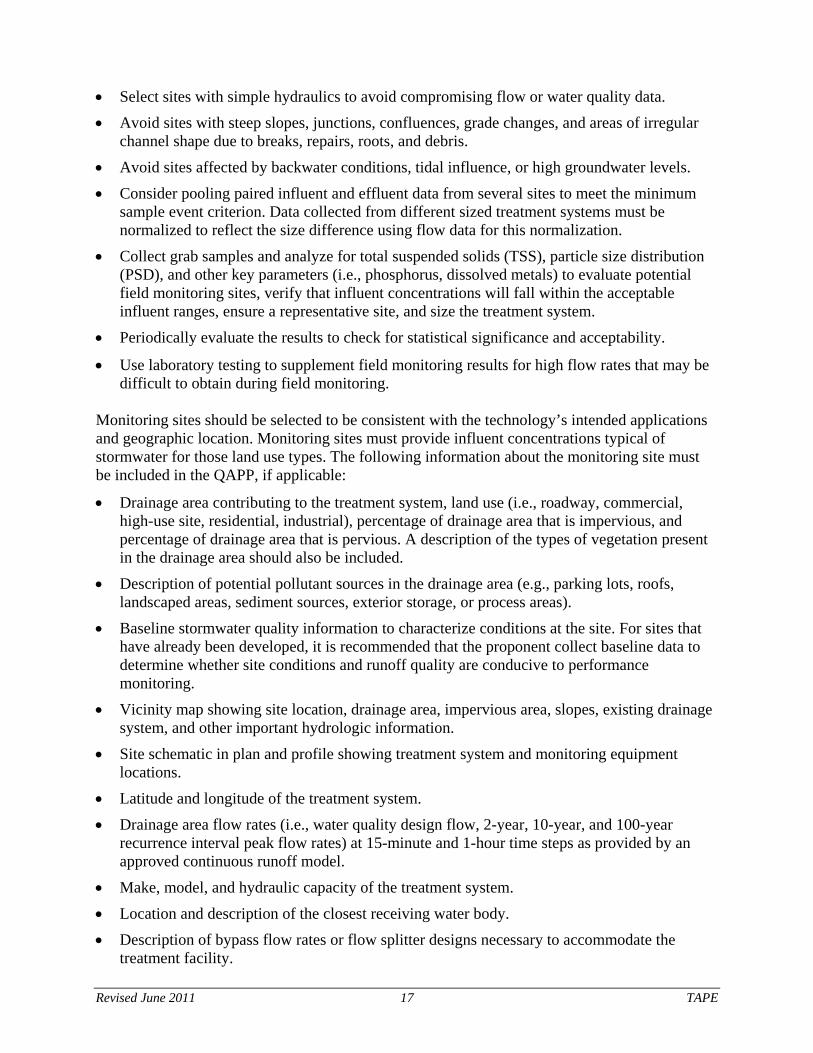
• Select sites with simple hydraulics to avoid compromising flow or water quality data. • Avoid sites with steep slopes, junctions, confluences, grade changes, and areas of irregular
channel shape due to breaks, repairs, roots, and debris. • Avoid sites affected by backwater conditions, tidal influence, or high groundwater levels. • Consider pooling paired influent and effluent data from several sites to meet the minimum
sample event criterion. Data collected from different sized treatment systems must be normalized to reflect the size difference using flow data for this normalization.
• Collect grab samples and analyze for total suspended solids (TSS), particle size distribution (PSD), and other key parameters (i.e., phosphorus, dissolved metals) to evaluate potential field monitoring sites, verify that influent concentrations will fall within the acceptable influent ranges, ensure a representative site, and size the treatment system.
• Periodically evaluate the results to check for statistical significance and acceptability.
• Use laboratory testing to supplement field monitoring results for high flow rates that may be difficult to obtain during field monitoring.
Monitoring sites should be selected to be consistent with the technology’s intended applications and geographic location. Monitoring sites must provide influent concentrations typical of stormwater for those land use types. The following information about the monitoring site must be included in the QAPP, if applicable:
• Drainage area contributing to the treatment system, land use (i.e., roadway, commercial, high-use site, residential, industrial), percentage of drainage area that is impervious, and percentage of drainage area that is pervious. A description of the types of vegetation present in the drainage area should also be included.
• Description of potential pollutant sources in the drainage area (e.g., parking lots, roofs, landscaped areas, sediment sources, exterior storage, or process areas).
• Baseline stormwater quality information to characterize conditions at the site. For sites that have already been developed, it is recommended that the proponent collect baseline data to determine whether site conditions and runoff quality are conducive to performance monitoring.
• Vicinity map showing site location, drainage area, impervious area, slopes, existing drainage system, and other important hydrologic information.
• Site schematic in plan and profile showing treatment system and monitoring equipment locations.
• Latitude and longitude of the treatment system. • Drainage area flow rates (i.e., water quality design flow, 2-year, 10-year, and 100-year
recurrence interval peak flow rates) at 15-minute and 1-hour time steps as provided by an approved continuous runoff model.
• Make, model, and hydraulic capacity of the treatment system. • Location and description of the closest receiving water body. • Description of bypass flow rates or flow splitter designs necessary to accommodate the
treatment facility.

Revised June 2011 18 TAPE
• Description of pretreatment system, if required by site conditions or treatment system operation.
• Description of any known adverse site conditions such as climate, tidal influence, high groundwater, rainfall pattern, steep slopes, erosion, high spill potential, illicit connections to stormwater drainage system, or industrial runoff.
• Photo documentation of site conditions.
Treatment system sizing The stormwater treatment technology must be sized for the selected monitoring location. Since the criteria for obtaining a GULD in Washington are focused on selecting a site representative of (or located in) the Pacific Northwest, this section of the QAPP will focus on the sizing criteria in the SWMMWW. (Note: the TER must include sizing criteria for both western and eastern Washington.) According to the SWMMWW, the stormwater treatment technology must be sized to meet applicable performance goals at the design hydraulic loading rate that coincides with treating at least 91 percent of the total runoff volume, using an Ecology-approved continuous simulation model such as the Western Washington Hydrology Model (WWHM), King County Runoff Time Series (KCRTS), or MGS Flood (Ecology 2005). If the stormwater treatment technology is sited downstream of a detention facility, it must be sized to handle the full 2-year release rate of that facility. Any stormwater treatment technology located downstream of a detention facility must include any treatment accomplished by the pond in the overall analysis of the system. It is likely that approval of the system will require inclusion of a detention facility. The QAPP must document the treatment system basis of design and all related modeling assumptions and inputs.
Precipitation monitoring This section of the QAPP must describe the monitoring location and equipment selected for precipitation monitoring. Rainfall monitoring must be performed within the treatment system drainage basin or adjacent to monitoring equipment installed for the project. The actual rain gauge for this monitoring must be sited appropriately (e.g., away from large trees, out of the rain shadow of an adjacent building) to ensure accurate measurements. Rainfall monitoring must be performed to measure and record rainfall continuously throughout the monitoring period at 15-minute intervals or less. The QAPP must indicate the type of rain gauge used (e.g., an automatic recording electronic rain gauge, such as a tipping bucket connected to a data logger, that records rainfall in 0.01-inch increments) and make and model number of the selected rain gauge. The rain gauge location must be shown on the site schematic if it is located at the monitoring site or on the vicinity map if it is located in another portion of the drainage basin. If the onsite rainfall monitoring equipment fails during a storm event, the proponent should use data from the next closest, representative monitoring station to determine whether the storm event meets the defined storm guidelines. Nearby third-party rain gauges may be used only in the event of individual rain gauge failure and only for the period of failure. The location of third-party rain gauges that will be used for this purpose should be identified in the QAPP. If third-party rain gauges are used to fill in data gaps, the proponent will be required to establish a regression relationship for individual storm events between the site and third-party rain gauges

Revised June 2011 19 TAPE
and use the regression equation to adjust the third-party data to represent site rainfall when needed.
Flow monitoring This section of the QAPP must describe monitoring locations and equipment selected for flow monitoring. This section must also include guidelines used to ensure that the flow monitoring experimental design is representative, comparable, and complete.
Monitoring locations and equipment Influent, effluent, and bypass flow rates must be measured continuously throughout the monitoring period. If the proponent can demonstrate in the QAPP that the influent and effluent flow rates are equivalent (or lag time is minimal), Ecology may allow monitoring of either influent or effluent only. For offline systems or those with bypasses, flow must be measured at the bypass as well as at the inlet and outlet. For offline flow, the proponent must describe the type of flow splitter that will be used and specify the bypass flow set point. The following requirements apply when selecting specific locations for flow monitoring: • Influent: Measure flow as close as possible to the treatment system inlet to ensure that the
depth and flow measurements represent the water that actually enters the system. The influent flow should be measured in or adjacent to the treatment system.
• Effluent: Measure flow as close as possible to the treatment system outlet to ensure that the depth and flow measurements represent the water leaving the treatment system. Do not measure effluent flow in areas of the conveyance system that are mixed with bypass flows.
• Bypass: The proponent must measure all bypass flows to determine if the stormwater treatment technology meets the requirements for water quality treatment specified by Ecology (i.e., treating at least 91 percent of the total runoff volume). Do not measure bypass flows in areas of the conveyance system that are mixed with effluent flow.
The QAPP must also identify site conditions (i.e., tidal influence, backwater conditions, or high groundwater levels) that could affect flow measurement accuracy. Ecology recommends that monitoring sites be established at locations where gravity flow conditions exist, because obtaining accurate flow measurements with existing flow measuring equipment under backwater conditions is difficult. All flow measurement equipment should be installed in locations that can be accessed easily and safely. Because this equipment requires frequent calibration and maintenance, it must be directly accessible over the course of the monitoring. Flow monitoring equipment must be selected to continuously measure and record flow into and out of the treatment system over the entire monitoring period. Flow must be logged at a 15-minute or shorter interval, depending on site conditions. The appropriate flow measurement method depends on the nature of the monitoring site and the stormwater drainage system. Depth measurement devices and velocity measurement devices are commonly used types of flow measurement equipment. The QAPP should identify the make and model number of the selected flow monitoring equipment. Additionally, the flow monitoring equipment locations must be identified in the QAPP on the site schematic in plan and profile.

Revised June 2011 20 TAPE
Water sampling This section of the QAPP must describe monitoring locations and equipment, sampling methodology, monitoring parameters, and the monitoring duration for water sampling. This section must also include guidelines used to ensure that the water sampling experimental design is representative, comparable, and complete.
Monitoring locations and equipment To accurately measure system performance, water quality samples must be collected from both the inlet and outlet of each treatment system. The proponent is not required to measure water quality parameters in the bypass flow. Automated samplers should be used for sample collection, except for chemical constituents that require manual grab samples (e.g., TPH) or field meters (e.g., pH). Tygon or Teflon tubing may be used for sampling conventional parameters and metals. The QAPP should also identify the make and model number of the selected automated sampling equipment and the pH field meter. Additionally, the automated sampler locations must be identified in the QAPP on the site schematic. When selecting monitoring locations, the proponent should be aware that settleable or floating solids, and their related bound pollutants may become stratified across the flow column in the absence of adequate mixing. Influent and effluent samples must be collected at a location where the stormwater flow is well-mixed. The following requirements apply when selecting specific locations for water sampling: • Influent: Collect samples as close as possible to the treatment system inlet to ensure that the
samples represent the water that actually enters the system. The influent must be sampled at a location unaffected by accumulated or stored pollutants. The sampling location should be located an appropriate distance from the flow monitoring equipment to avoid skewing depth and flow measurements when the automated sampler pump is operating.
• Effluent: Collect samples as close as possible to the treatment system outlet to ensure that the samples represent the treated effluent. Do not sample in areas of the conveyance system that mix with bypass flows. The sampling location should be located an appropriate distance from the flow monitoring equipment to avoid skewing depth and flow measurements when the automated sampler pump is operating.
The rationale for selecting specific sampling locations must be documented in the QAPP.
Sampling methodology Automated sampler programming (e.g., composite versus discrete sampling, proposed sampling triggers, and flow pacing scheme) must be included in the QAPP. Proponents should refer to the Standard Operating Procedure for Automatic Sampling for Stormwater Monitoring (Ecology 2009a) and the Standard Operating Procedure for Collecting Grab Samples from Stormwater Discharges (Ecology 2009b) when developing this section of the QAPP. Ecology has identified the following five sampling methods for evaluating emerging stormwater treatment technologies. Sampling methods 1 and 5 are required for all monitoring programs. Sampling method 2 may be required to evaluate pollutant removal as a function of flow rate; however, these same data may be obtained in a laboratory setting. Sampling method 3 is not commonly used, but can be an alternative method to combine sampling methods 1 and 2. Sampling method 4 is only used to satisfy the oil treatment performance goal monitoring requirements.
Revised June 2011 21 TAPE
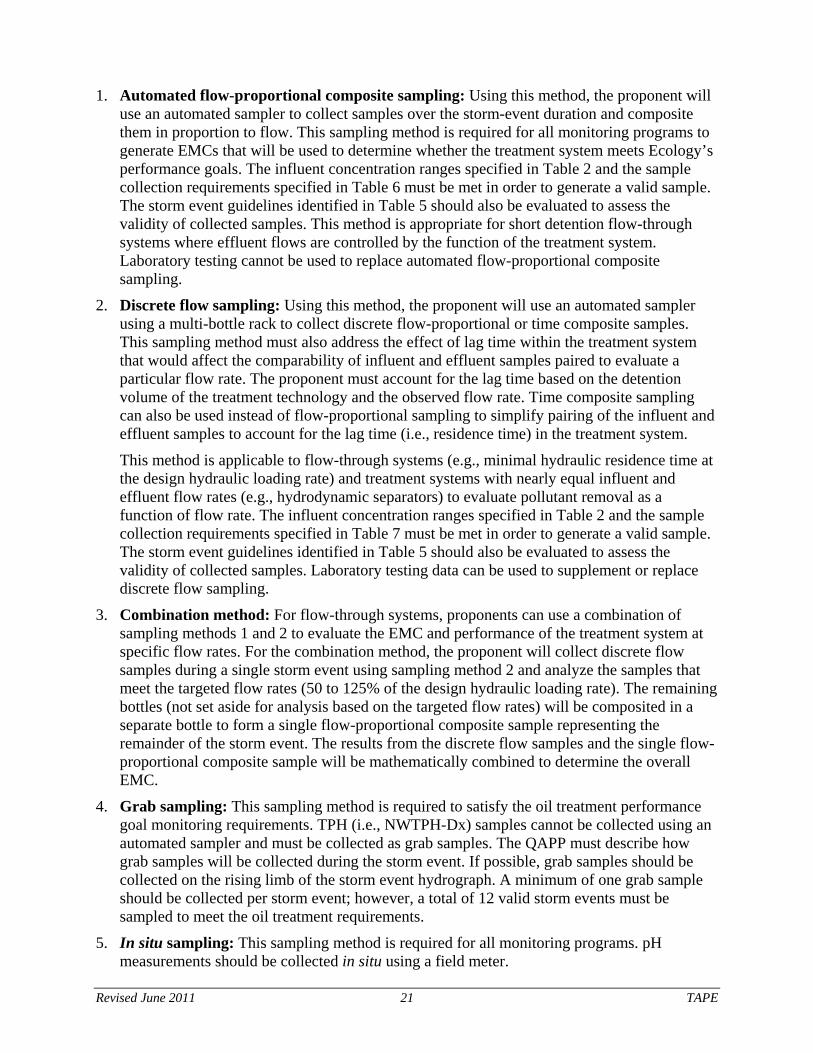
1. Automated flow-proportional composite sampling: Using this method, the proponent will use an automated sampler to collect samples over the storm-event duration and composite them in proportion to flow. This sampling method is required for all monitoring programs to generate EMCs that will be used to determine whether the treatment system meets Ecology’s performance goals. The influent concentration ranges specified in Table 2 and the sample collection requirements specified in Table 6 must be met in order to generate a valid sample. The storm event guidelines identified in Table 5 should also be evaluated to assess the validity of collected samples. This method is appropriate for short detention flow-through systems where effluent flows are controlled by the function of the treatment system. Laboratory testing cannot be used to replace automated flow-proportional composite sampling.
2. Discrete flow sampling: Using this method, the proponent will use an automated sampler using a multi-bottle rack to collect discrete flow-proportional or time composite samples. This sampling method must also address the effect of lag time within the treatment system that would affect the comparability of influent and effluent samples paired to evaluate a particular flow rate. The proponent must account for the lag time based on the detention volume of the treatment technology and the observed flow rate. Time composite sampling can also be used instead of flow-proportional sampling to simplify pairing of the influent and effluent samples to account for the lag time (i.e., residence time) in the treatment system.
This method is applicable to flow-through systems (e.g., minimal hydraulic residence time at the design hydraulic loading rate) and treatment systems with nearly equal influent and effluent flow rates (e.g., hydrodynamic separators) to evaluate pollutant removal as a function of flow rate. The influent concentration ranges specified in Table 2 and the sample collection requirements specified in Table 7 must be met in order to generate a valid sample. The storm event guidelines identified in Table 5 should also be evaluated to assess the validity of collected samples. Laboratory testing data can be used to supplement or replace discrete flow sampling.
3. Combination method: For flow-through systems, proponents can use a combination of sampling methods 1 and 2 to evaluate the EMC and performance of the treatment system at specific flow rates. For the combination method, the proponent will collect discrete flow samples during a single storm event using sampling method 2 and analyze the samples that meet the targeted flow rates (50 to 125% of the design hydraulic loading rate). The remaining bottles (not set aside for analysis based on the targeted flow rates) will be composited in a separate bottle to form a single flow-proportional composite sample representing the remainder of the storm event. The results from the discrete flow samples and the single flow-proportional composite sample will be mathematically combined to determine the overall EMC.
4. Grab sampling: This sampling method is required to satisfy the oil treatment performance goal monitoring requirements. TPH (i.e., NWTPH-Dx) samples cannot be collected using an automated sampler and must be collected as grab samples. The QAPP must describe how grab samples will be collected during the storm event. If possible, grab samples should be collected on the rising limb of the storm event hydrograph. A minimum of one grab sample should be collected per storm event; however, a total of 12 valid storm events must be sampled to meet the oil treatment requirements.
5. In situ sampling: This sampling method is required for all monitoring programs. pH measurements should be collected in situ using a field meter.

Revised June 2011 22 TAPE
Monitoring parameters The QAPP must identify the required water quality parameters to be monitored from Table 8. The proponent must tailor the sampling regime to support the desired treatment level (basic, dissolved metals, phosphorus, oil, or pretreatment). The performance claims may be evaluated in relation to one or more of the parameters listed in the tables below. Proponents must analyze applicable parameters listed in Table 8 at both the inlet and outlet sampling stations.
Table 8. Required water quality parameters for TAPE monitoring.
Performance Goal Required Parameters Required Screening Parameters a
Basic and pretreatment
TSS PSD, pH b, TP, orthophosphate, hardness, total and dissolved Cu and Zn
Phosphorus TSS, TP, orthophosphate PSD, pH b, hardness, total and dissolved Cu and Zn
Dissolved metals TSS, hardness, total and dissolved Cu and Zn
PSD, pH b, TP, orthophosphate
Oil NWTPH-Dx,c visible sheen pH b, TP, orthophosphate, hardness, total and dissolved Cu and Zn
a Screening parameters are required to be analyzed on three of the composite samples (or three in situ samples for pH) collected during the monitoring period (preferably spread throughout the monitoring period, with one sample collected towards the beginning, one in the middle, and one towards the end). Proponents may also choose to analyze the screening parameters for additional storm events.
b In situ sample only. If a substantial change in pH is measured (> 1 standard unit difference between influent and effluent measurements) or an abnormal pH value is measured (< 4 or > 9 standard units), additional storm events must be monitored.
c Grab sample only. Cu – copper NWTPH-Dx – Northwest Total Petroleum Hydrocarbons-Motor Oil and Diesel fractions PSD – particle size distribution TP – total phosphorus TSS – total suspended solids Zn – zinc Required screening parameters must also be collected from all treatment systems during three storm events during the monitoring period (preferably spread throughout the monitoring period, with one sample collected towards the beginning, one in the middle, and one toward the end) in order to determine if the treatment system could potentially export phosphorus or metals or cause a change in pH. The results from the screening parameter analysis will be used to determine if restrictions may be required for specific treatment systems based on their effluent quality, or if pH adjustment is a necessary component of the treatment system. PSD analysis is also listed as a required screening parameter to determine if the influent PSD to the treatment system consists primarily of silt-sized particles (i.e., 3.9 to 62.5 microns) and thus is representative of Pacific Northwest stormwater. PSD data can also provide information regarding solids transport during a storm.
Monitoring duration As indicated in Table 6, a minimum of 12 flow-proportional composite samples must be collected to ensure representative concentrations are available for assessing system performance across a variety of storm event conditions. However, there is no maximum number of samples specified under this protocol. Rather, sampling must continue until enough samples have been collected to demonstrate performance of the system at the required level of statistical confidence

Revised June 2011 23 TAPE
for obtaining a GULD. In all cases, samples must fall within the influent concentration ranges specified in Table 2 and meet the sample collection requirements specified in Tables 6 and 7 for flow-proportional composite and discrete flow samples, respectively. The storm event guidelines identified in Table 5 should also be evaluated to assess the validity of collected samples.
Sediment sampling The proponent should measure the sediment accumulation rate (if feasible, based on the design of the stormwater treatment technology) to help demonstrate facility performance and design an operation and maintenance plan. Optimally, the test system should be cleaned at the beginning of the monitoring period. The sediment depth should then be measured just prior to any subsequent cleanings during the monitoring period and at the end of the monitoring period. This information should then be used to verify the proponent’s maintenance schedule for the system is reasonably accurate. Table 9 also lists optional parameters for sediment chemistry analysis. Although sediment chemistry analysis is not required by this protocol, it may be useful to help in developing an operation and maintenance plan and disposal requirements. Refer to Measurements Procedures for a detailed listing of chemical analyses, methods, and reporting limits.
Table 9. Optional sediment sampling parameters for TAPE monitoring.
Performance Goal Optional Parameters a
Basic and pretreatment PSD, percent solids, grain size, percent volatile solids
Phosphorus PSD, TP
Dissolved metals PSD; total Cd, Cu, Pb, and Zn
Oil PSD, NWTPH-Dx a Not all stormwater treatment facilities are designed to facilitate this type of sediment sampling; however, accumulated sediment
monitoring may be beneficial to assist the proponent with developing an operation and maintenance plan and disposal requirements.
Cd – cadmium Cu – copper NWTPH-Dx – Northwest Total Petroleum Hydrocarbons-Motor Oil and Diesel fractions Pb – lead PSD – particle size distribution TP – total phosphorus Zn – zinc
Supplemental laboratory testing procedures Laboratory testing can be used to augment field monitoring, but cannot replace it. The minimum number of automated flow-proportional composite samples meeting the performance goals with the required statistical confidence is still required to be collected in the field, and performance goals must be met with those data. However, peak design and higher flow rates may not be observed in the field, thus supplemental laboratory testing may be applied to augment or replace that portion of the field monitoring. The proponent must provide detailed laboratory testing descriptions (e.g., photos, illustrations, process/flow diagrams), including all relevant factors such as treatment and hydraulic design flow and loading rates on a unit basis (e.g., gallons per minute per square foot), dead
Revised June 2011 24 TAPE
storage/detention volumes, inspection protocols to determine when maintenance is needed, maintenance performed during testing, and media type/quantity/thickness. If a less than full-scale unit is tested in the laboratory, such as single cartridge testing, the proponent must describe the ratios to the full-scale system (e.g., sump capacity, flow paths, material differences). Laboratory testing must be conducted under the following conditions: • Tests must be run at a minimum of four constant flow rates of 50 percent, 75 percent, 100
percent, and 125 percent (plus or minus 10 percent) of the manufacturer’s facility design hydraulic loading rate or design hydraulic velocity rate.
• Proponents must use Sil-Co-Sil 106 ground silica, a readily available ground silica product manufactured by U.S. Silica Corporation, to represent a typical PSD for testing basic treatment technologies.
• Influent concentrations used for the laboratory analysis should be similar to the TSS concentrations measured during field monitoring and must meet the influent concentration range specified in Table 2.
• Basic treatment systems must be able to remove at least 80 percent of Sil-Co-Sil 106 particles at the water quality design hydraulic loading rate, and pretreatment systems must be able to remove at least 50 percent of Sil-Co-Sil 106 particles at the water quality design hydraulic loading rate.
Filters or settling chambers must not be cleaned between tests, unless required under the proponent’s normal operation and maintenance schedule. Proponents must test the facility’s maximum hydraulic loading rate to check for TSS resuspension and washout (negative removal efficiency). The laboratory testing must be conducted with the facility’s treatment capability fully utilized (e.g., at the time maintenance would normally be performed, such as when the sediment settling area is full or filter media is saturated). The proponent should determine the flow rate where washout begins, and provide for bypassing flows exceeding this flow rate in design guidelines. Proponents may also analyze for parameters other than TSS during laboratory testing. The proponent must consult with Ecology on test methods before initiating work. The laboratory testing procedures must be presented in the QAPP or a QAPP amendment (if laboratory testing is deemed necessary to supplement field monitoring data after the field monitoring portion of the project has been completed).
Sampling procedures This section of the QAPP describes field sampling procedures necessary to ensure the quality and representativeness of the collected samples. This section includes information on precipitation monitoring, flow monitoring, water sampling, and sediment sampling.
Precipitation monitoring The proponent must install and calibrate the rain gauge in accordance with manufacturer’s instructions, inspect the rain gauge monthly (at a minimum), and perform maintenance on the rain gauge (if necessary). Rain gauge calibration should be checked upon installation and once

Revised June 2011 25 TAPE
annually (at a minimum). This section of the QAPP should describe the specific steps that will be performed during these activities.
Flow monitoring The proponent must install and calibrate monitoring equipment in accordance with manufacturer’s instructions, inspect equipment after each sampled storm event (at a minimum), and perform maintenance on the equipment (if necessary). This section of the QAPP should discuss the specific measures taken during pre-storm visits to remove blockages from the conveyance system, check the operational status of the flow monitoring equipment, and calibrate sensors installed at the inlet, outlet, and bypass monitoring stations. Flow monitoring equipment calibration should be checked upon installation and monthly throughout the monitoring period (at a minimum). Control charts and other quality assurance measures should be used to track instrument drift. Control limits (statistical warning and action limits calculated based on control charts) should be established to track instrument drift. Warning limits are generally set at ±2 standard deviations from the mean and action limits at ±3 standard deviations from the mean. Flumes used in conjunction with flow monitoring may not match factory specification, become distorted during installation, be installed incorrectly, or settle unevenly over time; all of which will affect flow measurements. Dynamic in-situ flow calibration is recommended to address these issues.
Water sampling This section of the QAPP must discuss equipment decontamination, sample preservation and handling, and recordkeeping.
Sample preservation and handling Proponents should preserve samples in accordance with U.S. EPA-approved methods (U.S. EPA 1983) or Standard Methods (APHA, AWWA, WEF 2005). For composite samples that will be split into separate aliquots for preservation and/or analysis, maintain the sample at ≤ 6 degrees Celsius (°C) until collection, splitting, and preservation is completed (40 CFR 136.3). Holding times before and after sample preservation and filtration should be observed and must be recorded. Automated samplers must be filled with ice or refrigerated to maintain low temperatures throughout the sample collection period. The chain-of-custody form for composite samples must include the date and time of the last aliquot collection and the date and time of filtration or preservation (if applicable). The analytical laboratory needs this information to determine if a holding time has been exceeded. The QAPP must include a table listing analytical container material, minimum required sample volume, sample preservation requirements, and pre- and post-preservation holding time limits for the analyzed pollutants (see example in Table 10). A similar table should be developed for sediment sampling if optional sediment sampling will be conducted. The minimum required sample volume can vary based on the laboratory, methodology, and sampling configuration selected, thus it is not included in Table 10. Additional sample volume may be required for laboratory quality assurance and quality control (QA/QC) samples. Proponents should check with their selected laboratory to determine the minimum required sample volume for each parameter to be analyzed and list this volume in the QAPP. Proponents should obtain pre-cleaned sample bottles directly from the analytical laboratory. If the proponent proposes to obtain bottles from another source, a detailed bottle cleaning procedure must be provided in the QAPP. The QAPP must also describe procedures that will be employed to label and track
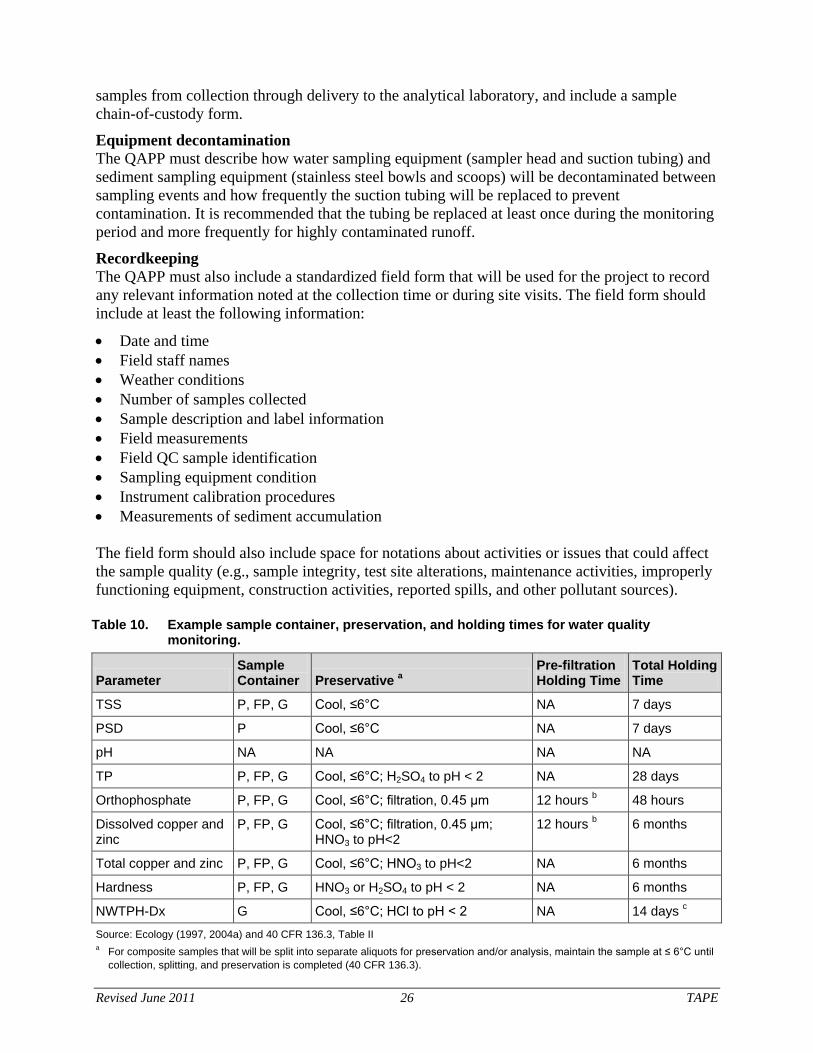
Revised June 2011 26 TAPE
samples from collection through delivery to the analytical laboratory, and include a sample chain-of-custody form.
Equipment decontamination The QAPP must describe how water sampling equipment (sampler head and suction tubing) and sediment sampling equipment (stainless steel bowls and scoops) will be decontaminated between sampling events and how frequently the suction tubing will be replaced to prevent contamination. It is recommended that the tubing be replaced at least once during the monitoring period and more frequently for highly contaminated runoff.
Recordkeeping The QAPP must also include a standardized field form that will be used for the project to record any relevant information noted at the collection time or during site visits. The field form should include at least the following information:
• Date and time • Field staff names • Weather conditions • Number of samples collected • Sample description and label information • Field measurements • Field QC sample identification • Sampling equipment condition • Instrument calibration procedures • Measurements of sediment accumulation The field form should also include space for notations about activities or issues that could affect the sample quality (e.g., sample integrity, test site alterations, maintenance activities, improperly functioning equipment, construction activities, reported spills, and other pollutant sources).
Table 10. Example sample container, preservation, and holding times for water quality monitoring.
Parameter Sample Container Preservative a
Pre-filtration Holding Time
Total Holding Time
TSS P, FP, G Cool, ≤6°C NA 7 days
PSD P Cool, ≤6°C NA 7 days
pH NA NA NA NA
TP P, FP, G Cool, ≤6°C; H2SO4 to pH < 2 NA 28 days
Orthophosphate P, FP, G Cool, ≤6°C; filtration, 0.45 µm 12 hours b 48 hours
Dissolved copper and zinc
P, FP, G Cool, ≤6°C; filtration, 0.45 µm; HNO3 to pH<2
12 hours b 6 months
Total copper and zinc P, FP, G Cool, ≤6°C; HNO3 to pH<2 NA 6 months
Hardness P, FP, G HNO3 or H2SO4 to pH < 2 NA 6 months
NWTPH-Dx G Cool, ≤6°C; HCl to pH < 2 NA 14 days c
Source: Ecology (1997, 2004a) and 40 CFR 136.3, Table II a For composite samples that will be split into separate aliquots for preservation and/or analysis, maintain the sample at ≤ 6°C until
collection, splitting, and preservation is completed (40 CFR 136.3).
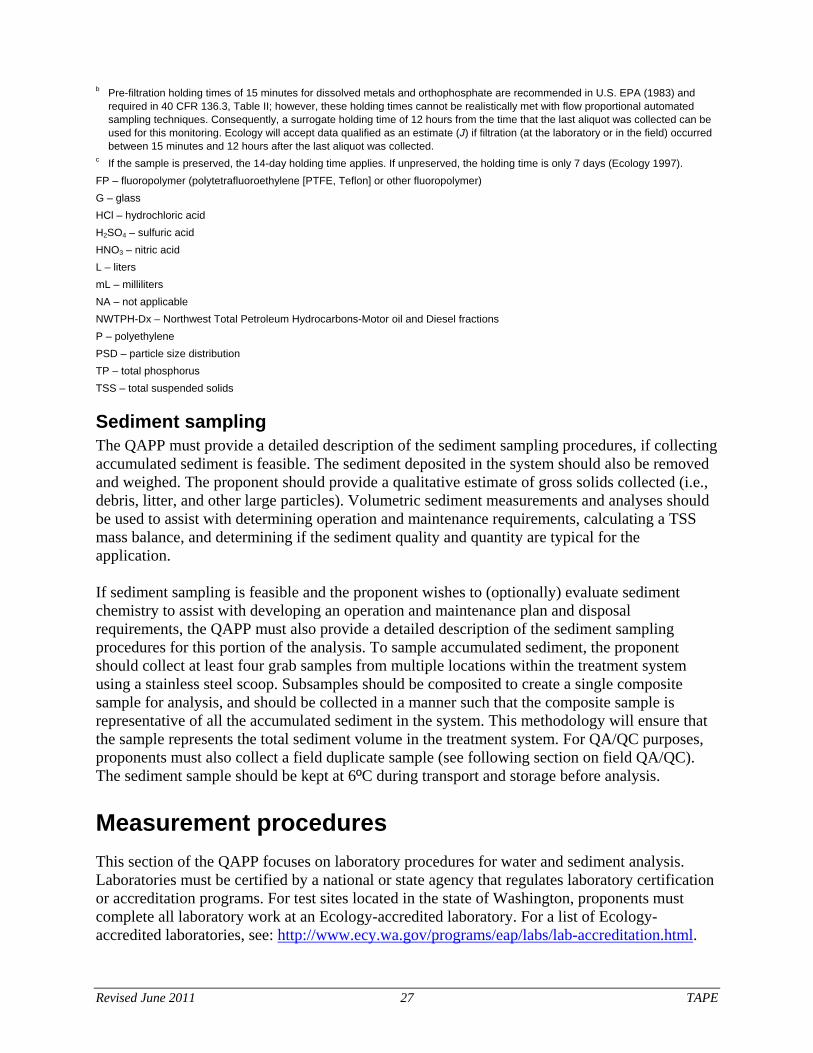
Revised June 2011 27 TAPE
b Pre-filtration holding times of 15 minutes for dissolved metals and orthophosphate are recommended in U.S. EPA (1983) and required in 40 CFR 136.3, Table II; however, these holding times cannot be realistically met with flow proportional automated sampling techniques. Consequently, a surrogate holding time of 12 hours from the time that the last aliquot was collected can be used for this monitoring. Ecology will accept data qualified as an estimate (J) if filtration (at the laboratory or in the field) occurred between 15 minutes and 12 hours after the last aliquot was collected.
c If the sample is preserved, the 14-day holding time applies. If unpreserved, the holding time is only 7 days (Ecology 1997). FP – fluoropolymer (polytetrafluoroethylene [PTFE, Teflon] or other fluoropolymer) G – glass HCl – hydrochloric acid H2SO4 – sulfuric acid HNO3 – nitric acid L – liters mL – milliliters NA – not applicable NWTPH-Dx – Northwest Total Petroleum Hydrocarbons-Motor oil and Diesel fractions P – polyethylene PSD – particle size distribution TP – total phosphorus TSS – total suspended solids
Sediment sampling The QAPP must provide a detailed description of the sediment sampling procedures, if collecting accumulated sediment is feasible. The sediment deposited in the system should also be removed and weighed. The proponent should provide a qualitative estimate of gross solids collected (i.e., debris, litter, and other large particles). Volumetric sediment measurements and analyses should be used to assist with determining operation and maintenance requirements, calculating a TSS mass balance, and determining if the sediment quality and quantity are typical for the application. If sediment sampling is feasible and the proponent wishes to (optionally) evaluate sediment chemistry to assist with developing an operation and maintenance plan and disposal requirements, the QAPP must also provide a detailed description of the sediment sampling procedures for this portion of the analysis. To sample accumulated sediment, the proponent should collect at least four grab samples from multiple locations within the treatment system using a stainless steel scoop. Subsamples should be composited to create a single composite sample for analysis, and should be collected in a manner such that the composite sample is representative of all the accumulated sediment in the system. This methodology will ensure that the sample represents the total sediment volume in the treatment system. For QA/QC purposes, proponents must also collect a field duplicate sample (see following section on field QA/QC). The sediment sample should be kept at 6ºC during transport and storage before analysis.
Measurement procedures This section of the QAPP focuses on laboratory procedures for water and sediment analysis. Laboratories must be certified by a national or state agency that regulates laboratory certification or accreditation programs. For test sites located in the state of Washington, proponents must complete all laboratory work at an Ecology-accredited laboratory. For a list of Ecology-accredited laboratories, see: http://www.ecy.wa.gov/programs/eap/labs/lab-accreditation.html.
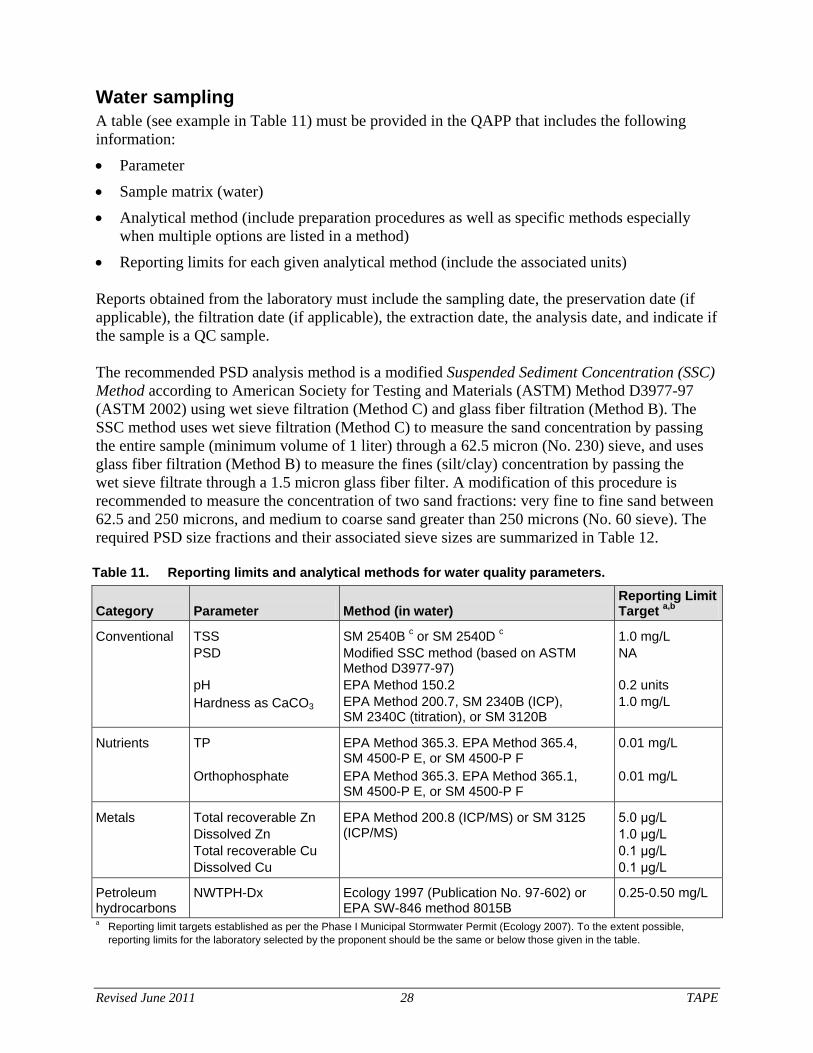
Revised June 2011 28 TAPE
Water sampling A table (see example in Table 11) must be provided in the QAPP that includes the following information: • Parameter • Sample matrix (water) • Analytical method (include preparation procedures as well as specific methods especially
when multiple options are listed in a method) • Reporting limits for each given analytical method (include the associated units) Reports obtained from the laboratory must include the sampling date, the preservation date (if applicable), the filtration date (if applicable), the extraction date, the analysis date, and indicate if the sample is a QC sample. The recommended PSD analysis method is a modified Suspended Sediment Concentration (SSC) Method according to American Society for Testing and Materials (ASTM) Method D3977-97 (ASTM 2002) using wet sieve filtration (Method C) and glass fiber filtration (Method B). The SSC method uses wet sieve filtration (Method C) to measure the sand concentration by passing the entire sample (minimum volume of 1 liter) through a 62.5 micron (No. 230) sieve, and uses glass fiber filtration (Method B) to measure the fines (silt/clay) concentration by passing the wet sieve filtrate through a 1.5 micron glass fiber filter. A modification of this procedure is recommended to measure the concentration of two sand fractions: very fine to fine sand between 62.5 and 250 microns, and medium to coarse sand greater than 250 microns (No. 60 sieve). The required PSD size fractions and their associated sieve sizes are summarized in Table 12. Table 11. Reporting limits and analytical methods for water quality parameters.
Category Parameter Method (in water) Reporting Limit Target a,b
Conventional TSS PSD pH Hardness as CaCO3
SM 2540B c or SM 2540D c Modified SSC method (based on ASTM Method D3977-97) EPA Method 150.2 EPA Method 200.7, SM 2340B (ICP), SM 2340C (titration), or SM 3120B
1.0 mg/L NA 0.2 units 1.0 mg/L
Nutrients TP Orthophosphate
EPA Method 365.3. EPA Method 365.4, SM 4500-P E, or SM 4500-P F EPA Method 365.3. EPA Method 365.1, SM 4500-P E, or SM 4500-P F
0.01 mg/L 0.01 mg/L
Metals Total recoverable Zn Dissolved Zn Total recoverable Cu Dissolved Cu
EPA Method 200.8 (ICP/MS) or SM 3125 (ICP/MS)
5.0 μg/L 1.0 μg/L 0.1 μg/L 0.1 μg/L
Petroleum hydrocarbons
NWTPH-Dx Ecology 1997 (Publication No. 97-602) or EPA SW-846 method 8015B
0.25-0.50 mg/L
a Reporting limit targets established as per the Phase I Municipal Stormwater Permit (Ecology 2007). To the extent possible, reporting limits for the laboratory selected by the proponent should be the same or below those given in the table.
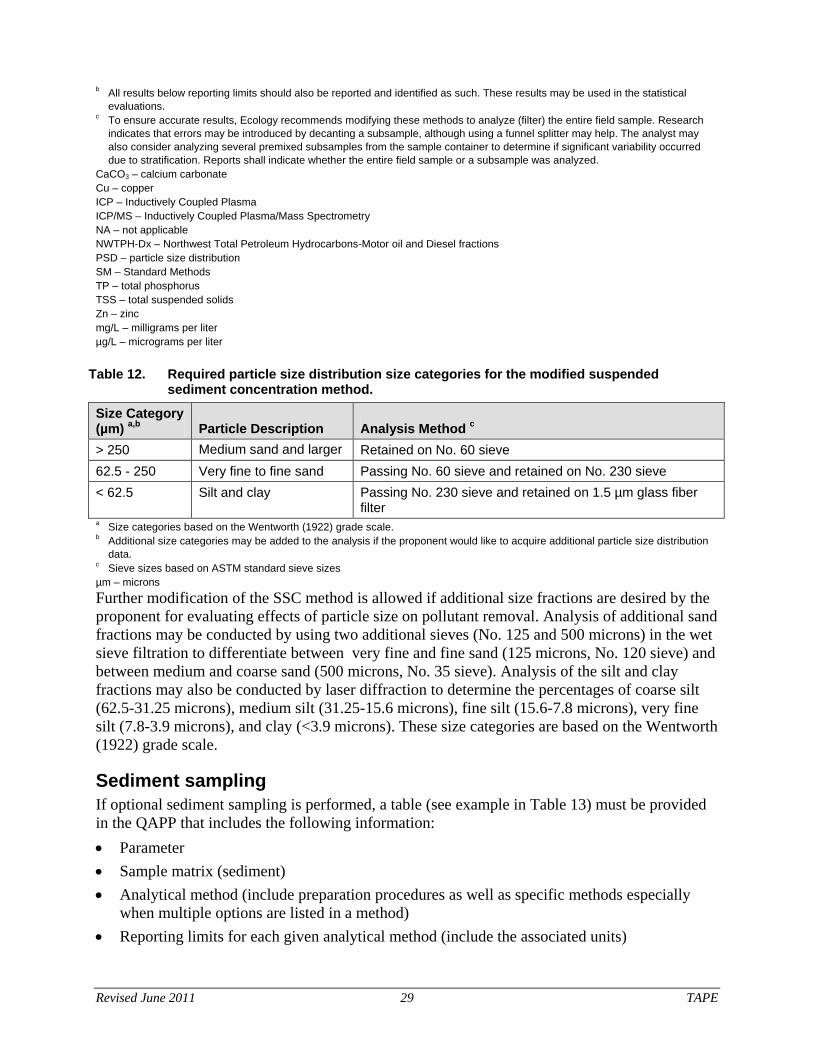
Revised June 2011 29 TAPE
b All results below reporting limits should also be reported and identified as such. These results may be used in the statistical evaluations.
c To ensure accurate results, Ecology recommends modifying these methods to analyze (filter) the entire field sample. Research indicates that errors may be introduced by decanting a subsample, although using a funnel splitter may help. The analyst may also consider analyzing several premixed subsamples from the sample container to determine if significant variability occurred due to stratification. Reports shall indicate whether the entire field sample or a subsample was analyzed.
CaCO3 – calcium carbonate Cu – copper ICP – Inductively Coupled Plasma ICP/MS – Inductively Coupled Plasma/Mass Spectrometry NA – not applicable NWTPH-Dx – Northwest Total Petroleum Hydrocarbons-Motor oil and Diesel fractions PSD – particle size distribution SM – Standard Methods TP – total phosphorus TSS – total suspended solids Zn – zinc mg/L – milligrams per liter µg/L – micrograms per liter
Table 12. Required particle size distribution size categories for the modified suspended sediment concentration method.
Size Category (µm) a,b Particle Description Analysis Method c > 250 Medium sand and larger Retained on No. 60 sieve 62.5 - 250 Very fine to fine sand Passing No. 60 sieve and retained on No. 230 sieve < 62.5 Silt and clay Passing No. 230 sieve and retained on 1.5 µm glass fiber
filter a Size categories based on the Wentworth (1922) grade scale. b Additional size categories may be added to the analysis if the proponent would like to acquire additional particle size distribution
data. c Sieve sizes based on ASTM standard sieve sizes µm – microns Further modification of the SSC method is allowed if additional size fractions are desired by the proponent for evaluating effects of particle size on pollutant removal. Analysis of additional sand fractions may be conducted by using two additional sieves (No. 125 and 500 microns) in the wet sieve filtration to differentiate between very fine and fine sand (125 microns, No. 120 sieve) and between medium and coarse sand (500 microns, No. 35 sieve). Analysis of the silt and clay fractions may also be conducted by laser diffraction to determine the percentages of coarse silt (62.5-31.25 microns), medium silt (31.25-15.6 microns), fine silt (15.6-7.8 microns), very fine silt (7.8-3.9 microns), and clay (<3.9 microns). These size categories are based on the Wentworth (1922) grade scale.
Sediment sampling If optional sediment sampling is performed, a table (see example in Table 13) must be provided in the QAPP that includes the following information: • Parameter • Sample matrix (sediment) • Analytical method (include preparation procedures as well as specific methods especially
when multiple options are listed in a method) • Reporting limits for each given analytical method (include the associated units)

Revised June 2011 30 TAPE
Table 13. Reporting limits and analytical methods for optional sediment parameters.
Category Parameter Method (in Sediment) Reporting Limit Target a,b
Grain-size Percent solids
Percent volatile solids Grain size
SM 2540G SM 2540G Ecology Method Sieve and Pipet (PSEP 1997), ASTM F312-97, ASTMD422, or PSEP 1986/2003
NA 0.1% NA
Conventional Total phosphorus EPA Method 200.7, SW-6020 0.01 mg/kg
Metals Total recoverable zinc Total recoverable lead Total recoverable copper Total recoverable cadmium
EPA Method 200.8 (ICP/MS), EPA Method 6160, EPA Method 6020, SM 3125 (ICP/MS), or EPA Method 200.7 (ICP) EPA Method 200.8 (ICP/MS), EPA Method 6160, EPA Method 6020, or SM 3125 (ICP/MS) EPA Method 200.8 (ICP/MS), EPA Method 6160, EPA Method 6020, or SM 3125 (ICP/MS) EPA Method 200.8 (ICP/MS), EPA Method 6160, EPA Method 6020, or SM 3125 (ICP/MS)
5.0 mg/kg 0.1 mg/kg 0.1 mg/kg 0.1 mg/kg
Petroleum hydrocarbons
NWTPH-Dx Ecology 1997 (Publication No. 97-602) or EPA SW-846 method 8015B
25.0-100.0 mg/kg
a Reporting limit targets established as per the Phase I Municipal Stormwater Permit (Ecology 2007). Reporting limits may vary with each lab. To the extent possible, reporting limits for the laboratory selected by the proponent should be the same or below those given in the table.
b All results below reporting limits shall also be reported and identified as such. These results may be used in the statistical evaluations.
ICP/MS – Inductively Coupled Plasma/Mass Spectrometry NA – not applicable NWTPH-Dx – Northwest Total Petroleum Hydrocarbons-Motor Oil and Diesel fractions PSEP – Puget Sound Estuary Program SM – Standard Methods SW – Solid Waste mg/kg – milligrams per kilogram The proponent must include the sampling date, the preservation date if applicable, the extraction date, the analysis date, and whether the sample is a QC sample on each laboratory sheet.
Quality control This section of the QAPP includes information on field QA/QC and laboratory quality control.
Field quality assurance and quality control The field QA/QC section of the QAPP must describe the measures that the proponent will employ to ensure the representativeness, comparability, and quality of field samples. Field QA/QC must include the following elements:
• Quality control (QC) samples • Equipment maintenance and calibration • Equipment decontamination (see Sampling Procedures) • Sample preservation and handling (see Sampling Procedures) • Recordkeeping (see Sampling Procedures)

Revised June 2011 31 TAPE
Quality control samples The field QC samples that should be collected by the proponent include equipment rinsate blanks and field duplicate samples. The QAPP must also include a table specifying the frequency and type of quality control to be performed with each batch of samples to be analyzed (see example in Table 14). Additional field QC samples (e.g., transport blanks, transfer blanks, filter blanks, field reagent blanks) may also be analyzed, but are not specifically required by this protocol.
Equipment rinsate blanks The proponent must collect equipment rinsate blanks to verify the adequacy of the decontamination process. This verifies that the equipment is not a source of sample contamination. The proponent should collect equipment rinsate blanks by passing reagent-grade water through clean equipment and collecting samples for chemical analyses. The amount of reagent-grade water used for the sample should represent the volume of stormwater that will be collected during a typical sampling event. These samples should be analyzed as regular samples, with all of the appropriate quality control performed. Equipment rinsate blanks should be collected at the inlet monitoring station where stormwater is expected to contain the highest contaminant concentrations. However, if the inlet station is difficult to access (e.g., confined space entry required), proponents may collect the rinsate blank from the outlet station. At a minimum, proponents must collect three rinsate blanks: • One rinsate blank after decontaminating the equipment, according to the procedures specified
in the QAPP during initial equipment startup • One rinsate blank after the first or second storm event, following the initial equipment startup
(to “contaminate” the equipment) • One rinsate blank at the end of the monitoring program
Table 14. Example quality control sample summary for water quality monitoring.
Parameter
Field Laboratory Equipment Rinsate Blanks a
Field Duplicates b
Laboratory Control Samples c
Method Blanks c
Laboratory Duplicates c MS/MSDs c
TSS 3 10% of samples
1/batch 1/batch 1/batch NA
PSD NA 10% of samples
NA NA 1/batch NA
pH d NA 10% of samples
NA NA NA NA
TP 3 10% of samples
1/batch 1/batch 1/batch 1/batch
Orthophosphate 3 10% of samples
1/batch 1/batch 1/batch 1/batch
Total and dissolved copper and zinc
3 10% of samples
1/batch 1/batch 1/batch 1/batch
Hardness 3 10% of samples
1/batch 1/batch 1/batch 1/batch
NWTPH-Dx NA e 10% of samples
1/batch 1/batch 1/batch 1/batch
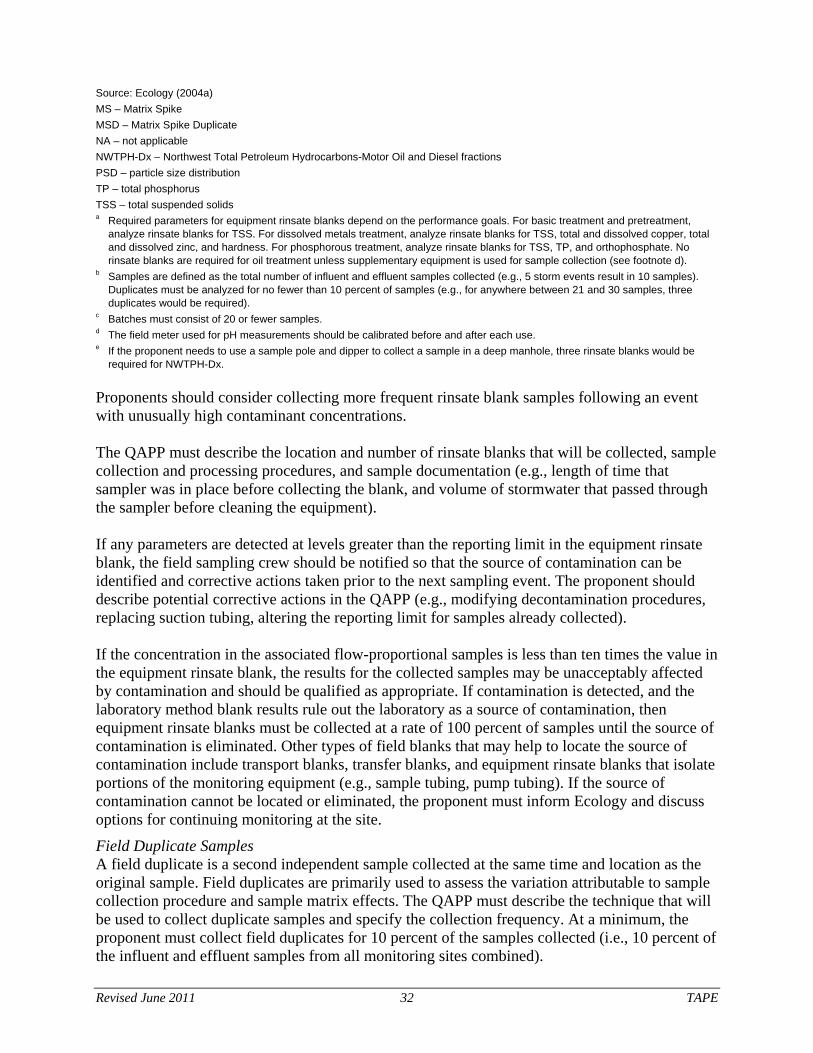
Revised June 2011 32 TAPE
Source: Ecology (2004a) MS – Matrix Spike MSD – Matrix Spike Duplicate NA – not applicable NWTPH-Dx – Northwest Total Petroleum Hydrocarbons-Motor Oil and Diesel fractions PSD – particle size distribution TP – total phosphorus TSS – total suspended solids a Required parameters for equipment rinsate blanks depend on the performance goals. For basic treatment and pretreatment,
analyze rinsate blanks for TSS. For dissolved metals treatment, analyze rinsate blanks for TSS, total and dissolved copper, total and dissolved zinc, and hardness. For phosphorous treatment, analyze rinsate blanks for TSS, TP, and orthophosphate. No rinsate blanks are required for oil treatment unless supplementary equipment is used for sample collection (see footnote d).
b Samples are defined as the total number of influent and effluent samples collected (e.g., 5 storm events result in 10 samples). Duplicates must be analyzed for no fewer than 10 percent of samples (e.g., for anywhere between 21 and 30 samples, three duplicates would be required).
c Batches must consist of 20 or fewer samples. d The field meter used for pH measurements should be calibrated before and after each use. e If the proponent needs to use a sample pole and dipper to collect a sample in a deep manhole, three rinsate blanks would be
required for NWTPH-Dx. Proponents should consider collecting more frequent rinsate blank samples following an event with unusually high contaminant concentrations. The QAPP must describe the location and number of rinsate blanks that will be collected, sample collection and processing procedures, and sample documentation (e.g., length of time that sampler was in place before collecting the blank, and volume of stormwater that passed through the sampler before cleaning the equipment). If any parameters are detected at levels greater than the reporting limit in the equipment rinsate blank, the field sampling crew should be notified so that the source of contamination can be identified and corrective actions taken prior to the next sampling event. The proponent should describe potential corrective actions in the QAPP (e.g., modifying decontamination procedures, replacing suction tubing, altering the reporting limit for samples already collected). If the concentration in the associated flow-proportional samples is less than ten times the value in the equipment rinsate blank, the results for the collected samples may be unacceptably affected by contamination and should be qualified as appropriate. If contamination is detected, and the laboratory method blank results rule out the laboratory as a source of contamination, then equipment rinsate blanks must be collected at a rate of 100 percent of samples until the source of contamination is eliminated. Other types of field blanks that may help to locate the source of contamination include transport blanks, transfer blanks, and equipment rinsate blanks that isolate portions of the monitoring equipment (e.g., sample tubing, pump tubing). If the source of contamination cannot be located or eliminated, the proponent must inform Ecology and discuss options for continuing monitoring at the site.
Field Duplicate Samples A field duplicate is a second independent sample collected at the same time and location as the original sample. Field duplicates are primarily used to assess the variation attributable to sample collection procedure and sample matrix effects. The QAPP must describe the technique that will be used to collect duplicate samples and specify the collection frequency. At a minimum, the proponent must collect field duplicates for 10 percent of the samples collected (i.e., 10 percent of the influent and effluent samples from all monitoring sites combined).

Revised June 2011 33 TAPE
Equipment maintenance and calibration Equipment must be installed and maintained in accordance with the manufacturer’s recommendations, and the QAPP must indicate any deviations from these recommendations. An equipment maintenance schedule must be provided in this section of the QAPP that includes the field equipment calibration schedule and procedures for rain gauges, flow monitoring equipment, automated samplers, and pH field meters (see example in Table 15). It is recommended that the proponent use AC power whenever possible to avoid issues associated with power failure of battery-powered systems.
Laboratory quality control In the laboratory QC section of the QAPP, the proponent must describe the laboratory’s data quality assurance summary package requirements (i.e., case narrative, performance evaluations [PE], certified reference materials [CRM], laboratory control samples, method blanks, MS/MSDs, laboratory duplicates, surrogates, and reference samples). Laboratory control samples, method blanks, laboratory duplicates, and MS/MSDs must be analyzed with each batch. For metals, at least two separate pairs of MS/MSDs per year should be performed on samples specifically from this project. The QAPP must include a table listing all QC samples being performed (see example in Table 14). Quality control results may indicate problems with the data, thus corrective actions (i.e., re-calibrations, re-analyses of samples, need to re-sample, need for additional samples, or qualifying results) should be included in the QAPP. Table 15. Example equipment maintenance and calibration schedule.
Equipment Item Procedure Minimum Frequency Rain gauge Funnel and screen Check for debris Monthly
Level check Verify level with bubble indicator Monthly Calibration Calibrate in accordance with
manufacturer’s instructions At installation and once annually
Flow monitoring Desiccant Check color – when pink, exchange for new desiccant
Every visit
Vent tubing Check for obstructions Every visit Calibration Calibrate in accordance with
manufacturer’s instructions At installation and monthly
Automated sampler
Pump tubing Check integrity Every visit Sample tubing and intake
Check integrity; verify no obstructions at intake
Every visit
Humidity indicator Check surface indicator Every visit pH field meter Calibration Calibrate in accordance with
manufacturer’s instructions Before and after each use
Data management procedures The QAPP must include requirements for the data package from the laboratory or laboratories selected for the project (i.e., detailed case narrative that discusses problems with the analyses, corrective actions if applicable, deviations from analytical methods, QC results, and a complete

Revised June 2011 34 TAPE
definitions list for each qualifier used). The QAPP must specify field/laboratory electronic data transfer protocols, state the percent of data that will undergo QC review, and describe corrective procedures. Corrections to data entries should include initials of the person making the correction and the date corrected. The QAPP must also indicate where and how the data will be stored.
Audits and reports This section of the QAPP must include information on technical systems audits (qualitative) and proficiency audits (quantitative). Both types of audits are described in the Guidelines for Preparing Quality Assurance Project Plans for Environmental Studies (Ecology 2004a). This section must also provide a basic outline of the information that will be included in the TER that will be prepared at the completion of the monitoring program and submitted to Ecology (see detailed description of required content in Preparing a TER).
Data verification and validation The QAPP must describe the process that will be used verify and validate the hydrologic and water quality data. The proponent should review all data to ensure they are consistent, correct and complete, and that all required quality control information has been provided. Specific quality control elements for the data must also be examined to determine if the MQOs for the project have been met.
Data quality assessment This section of the QAPP must describe the data quality assessment procedures that will be used to establish the usability of the data. If the MQOs have been met, then data quality should be usable for meeting project objectives. If the MQOs have not been met for data (i.e., the data have been qualified), the proponent will need to determine if they are still usable. The data quality assessment procedures must include an assessment of whether the requirements for representativeness, completeness, and comparability have been met (see Quality Objectives section). This section of the QAPP must also include the following information related to the analysis of the data:
• Summary of the methods that will be used to analyze and present the data
• Description of any statistical calculations and graphical representations that will be used
• Description of how the data will be presented (e.g., tables or charts) to illustrate trends, relationships, and anomalies, and how data below the lower reporting limit or detection limit will be handled.
• Description of how monitoring site and data will be evaluated to determine if the sampling design has been adequate
Revised June 2011 35 TAPE
Preparing a Technical Evaluation Report (TER) This section provides guidance on preparing the TER required as part of the TAPE certification process. The TER should support the stormwater treatment technology’s ability to obtain a GULD. If information included in the TER meets the requirements of the TAPE protocol, Ecology will grant a GULD for the technology, post the information on Ecology’s website, and add the technology to future stormwater management manuals. Proponents with a PULD or CULD are allowed a maximum of 30 months to prepare a QAPP, conduct stormwater monitoring according to the QAPP, and prepare a TER requesting CULD or GULD certification for their stormwater treatment technology. The TER must be produced as a standalone document; however, the QAPP should be included as an appendix to the TER. The TER can be prepared by the vendor/manufacturer, an independent professional third party that developed the QAPP and conducted the monitoring program for the vendor/manufacturer, or another independent professional third party. If the vendor/manufacturer prepares the TER, a separate third-party review memorandum is required (described at the end of this manual). Proponents may request that certain records or other information be considered confidential. Such requests will be considered by Ecology consistent with Washington State law (RCW 43.21A.160). In order for such records or information to be considered confidential, the proponent must certify that the records or information is unique to the design and construction of the technology, or release to the public or to a competitor would adversely affect the competitive position of the proponent. The proponent must request that such records or information be made available only for the confidential use of Ecology. All monitoring data including, but not limited to, laboratory results and field measurements, QA/QC data, data qualifiers, and monitoring site information cannot be considered confidential. To make a request for confidentiality, the proponent must clearly mark only those pages that contain confidential material with the word “confidential” and submit these pages as a separate file from the TER to Ecology. Placeholder pages must be placed in the TER that state “confidential material has been provided as a separate document to Ecology.” The proponent must also provide a letter of explanation as to why these pages are confidential. Ecology will review the request and send notice to the proponent either granting or denying the confidentiality. Proponents may request return of material if Ecology denies the request for confidentiality. At a minimum, requests for confidentiality require a 1-month review. A TER requires the following elements, which are described in the following sections:
• Cover letter • Executive summary • Introduction • Technology description • Sampling procedures • Data summaries and analysis • Operation and maintenance information • Discussion • Conclusions

Revised June 2011 36 TAPE
• Appendices • Third party review Using the document structure outlined above will allow for an efficient review of the TER by Ecology and the BER. If the proponent chooses to monitor multiple sites, the results can be summarized in a single TER.
Cover letter The cover letter accompanying the TER must include:
• A description of the current use level designation (i.e., PULD or CULD) and the performance goals (i.e., basic, dissolved metals, phosphorus, oil, or pretreatment)
• What use level designation, the proponent is requesting (i.e., CULD or GULD) and the performance goals (i.e., basic, dissolved metals, phosphorus, oil, or pretreatment). For example, “we are requesting a general use level designation for basic treatment…”
• A summary of the specific land use monitored and the removal performance of target pollutants. For example, “this stormwater treatment technology can remove 85% of total suspended solids from parking lots and residential streets…”
• The signature of a company representative
Executive summary The executive summary should briefly describe each section of the TER and summarize key findings or results.
Introduction The introduction of the TER should reiterate the information included in the cover letter. It should include a description of the current use level designation, the requested use level designation, and a summary of the removal performance of monitored parameters. Finally, the introduction should list the TER’s contents.
Technology description The technology description in the TER should include the elements listed below. The description should ensure that the reader can understand completely how the product works after reading this section. Factors other than treatment performance should also be discussed in this section of the TER to assist the reader with evaluating other relevant factors along with the treatment system’s verified pollutant removal performance. Ecology and the BER may also take these factors into consideration when evaluating a stormwater treatment technology for a GULD. This section of the TER is intended to be a generic description of the technology, but should contain sufficient detail to allow the reader to fully understand how the technology works. This section is divided into the following components:

Revised June 2011 37 TAPE
• Physical description • Site requirements • Sizing methodology • Installation • Operation and maintenance requirements • Reliability • Other benefits or challenges
Physical description This section of the TER should include the following information:
• Description of physical, chemical, or biological treatment mechanisms (see Table 3) • Design drawings and photographs • Equipment dimensions • Engineering plans/diagrams • Description of each component’s hydraulic capacity
Site requirements This section of the TER should describe the following site installation requirements, if applicable:
• Necessary soil characteristics.
• Hydraulic grade requirements.
• Depth to groundwater limitations.
• Utility requirements.
• Applications that the manufacturer recommends for the technology (e.g., land uses such as roadways, high-use sites, commercial, industrial, residential runoff areas) and the rationale for these recommendations.
• Pretreatment requirements
• List of the facilities that are installed in the United States. Include location, land use, and size of each facility. Provide at least three references with names and telephone numbers.
Proponents should also describe whether any of the following site characteristics or safety considerations favor or limit the technology’s use: climate, freezing weather/ice, rainfall pattern, steep slopes, high groundwater, seepage or base flows, tidal action, soil type, proximity to wells, septic systems and buildings, facility depth limits for access and safety, hazardous materials spill risk, driving head requirements, and power availability.
Sizing methodology This section of the TER must describe design criteria and include sizing information for both eastern and western Washington. Relevant design criteria to be considered and sizing methodology for each portion of the state are briefly described below; however, the proponent must refer to the SWMMWW and the SWMMEW for additional information regarding facility sizing.
Revised June 2011 38 TAPE
Design criteria This section of the TER should describe the following design criteria, if applicable:
• Expected pollutant removal at the design flow and for representative stormwater characteristics
• Design hydraulics (e.g., design flow, bypass flow, hydraulic grade line, scour velocities) • Design residence time, vertical and horizontal velocities • Treatment limitations for specific stormwater constituents, including fouling factors • Specific media flow rate (i.e., design velocity) • Media head loss curves • Minimum media contact time and minimum thickness • Estimated design life of system components before major overhaul • Media specifications ensuring adequate media quality at all times. A physical/chemical and
impurity specifications list should be provided.
Western Washington The treatment system must be sized to meet applicable performance goals at the design hydraulic loading rate coinciding with treating at least 91 percent of the total runoff volume, using an Ecology-approved continuous simulation model such as WWHM, KCRTS, or MGS Flood. If the treatment system is located downstream of a detention facility, it must be sized to meet the full 2-year release rate of the detention facility.
Eastern Washington The proponent should specify which of the following methods will be used to size their treatment systems preceding detention facilities or when detention facilities are not required:
• Method 1 (Default Method): The runoff flow rate predicted for the proposed development condition from the short-duration storm with a 6-month return frequency.
• Method 2: The runoff flow rate predicted for the proposed development condition from the Soil Conservation Service (SCS) Type II 24-hour storm with a 6-month return frequency,
• Method 3: The runoff flow rate for the proposed development condition calculated by the Rational Method using the 2-year Mean Recurrence Interval (see Chapter 4.7 of the SWMMEW). This method may be used only to design facilities based on instantaneous peak flow rates.
If the treatment system is located downstream of a detention facility, it must be sized to meet the full 2-year release rate of the detention facility.
Installation This section of the TER should describe the following, if applicable:
• Technology installation requirements • Provisions for factors such as structural integrity, water tightness, and buoyancy • Types of problems that can occur or have occurred in designing and installing the technology

Revised June 2011 39 TAPE
• Methods for diagnosing and correcting potential problems and person responsible to diagnose and correct problems
• Impacts to the technology’s effectiveness if problems are not corrected • Technology availability (e.g., where do the major components come from and how much
lead time is needed)
Operation and maintenance requirements This section of the TER should include information on the following for a typical installation with typical stormwater, if applicable:
• How inspections are performed and their frequency • How to forecast when maintenance will be needed (i.e., what is the "trigger" for determining
maintenance needs) and rationale for these maintenance triggers • How maintenance is performed • Maintenance area accessibility by people and equipment (i.e., special equipment or methods
needed for access, confined space entry areas) • Estimated maintenance frequency and basis for how this frequency is determined • Estimated media capacity for pollutant removal for filter systems • An estimation of the design life of the facility or its individual components before needing
replacement • Maintenance equipment and materials required • Maintenance service contract availability (e.g., cost information about mobilization,
equipment rental, mileage, solids/spent media disposal) • How solids and spent media are classified (waste type) and disposed • Whether the technology can be damaged due to delayed maintenance, and if so, describe how
it can be restored • The number of years the manufacturer has been in business and how or where the facility
owner will find needed parts, materials, and service if the vendor goes out of business or the product model changes
Reliability This section of the TER should describe the following, if applicable:
• Assuming the technology is designed and installed correctly, list the factors that can cause it not to perform as designed
• Describe any circumstances where the technology can add, transform, or release accumulated pollutants
• Does the filter medium decompose or is it subject to slime/bacteria growth? • Is the technology sensitive to heavy or fine sediment loadings—is pretreatment required? • How is underperformance diagnosed and treated?

Revised June 2011 40 TAPE
• What is the warranty? • What initial or ongoing user support is provided? Does the vendor charge for support?
Other benefits or challenges The proponent may also consider discussing whether the technology provides benefits or presents challenges in other potentially relevant areas, such as groundwater recharge, thermal effects on surface waters, habitat creation, aesthetics, vectors, safety, community acceptance, recreational use, and efficacy on redevelopment sites. This section should also describe any copper, lead, or zinc components of the treatment system that may be exposed to stormwater runoff and could potentially leach into the effluent. Concrete components that may result in pH fluctuations in the effluent should also be described
Sampling procedures This section of the TER must describe any deviations from the sampling procedures that were identified in the QAPP and provide site-specific information. The approved QAPP and any subsequent addenda must be included as an appendix to the TER. Detailed information (e.g., dates, monitoring locations) related to deviations from the QAPP must also be provided to assist with the data evaluation in the Discussion section of the TER. A vicinity map showing the site location, drainage area, impervious area, slopes, existing drainage system, and other important hydrologic information must be included in this section of the TER. A site schematic showing the treatment system and monitoring equipment locations must also be included. The treatment system basis of design must also be summarized and supported with design calculations, modeling assumptions, and modeling output reports.
Data summaries and analysis The proponent must include a summary of the storm event data and an Individual Storm Report (ISR) for each sampled storm event summarizing storm, hydrologic, and pollutant data. ISRs must be produced for all sampled storm events, regardless of whether the storm even met all the required storm event criteria or not. The proponent must also present statistical comparisons of influent and effluent concentrations, pollutant removal efficiency calculations, a statistical evaluation of the compiled data relative to the desired performance goals, and an analysis of pollutant removal as a function of flow rate. Each requirement is described in more detail below. Alternative approaches to analyzing the data may be used; however, any deviation from the approaches described herein must be described in the QAPP and approved by Ecology in advance.
Storm event data The TER must include a summary table with the following data from sampled storm events:
• Storm ID or number • Location • Storm depth
Revised June 2011 41 TAPE
• Antecedent dry period • Storm duration • Influent, effluent, and bypass volume of water • Peak and average flow rates through the treatment system • Number of influent aliquots • Number of effluent aliquots • Percentage of influent and effluent storm volume sampled • Comparisons of data to storm event guidelines (Table 5) and sample collection requirements
(Tables 6 and 7)
Justification must be provided in the TER for storm event data that does not meet the storm event guidelines, but will be included in the data analysis.
Individual storm reports Individual storm reports compare data and provide a detailed description of each storm event monitored in an easy to read format. A summary table of the water quality results from each storm event is required in the main text of the TER, but ISRs must be included as an appendix to the TER. Individual storm reports must include the following general, storm, hydrologic, and pollutant information:
General information
• Monitoring site name • Site location (UTM or latitude/longitude) • Drainage area
Storm information
• Storm name or number • Storm event date • Antecedent dry period conditions • Total precipitation depth (inches) • Precipitation duration (hours) • Mean precipitation intensity (inches per hour) • Maximum precipitation intensity (inches per hour)
Hydrologic information
• Influent peak flow rate (gpm or cfs) • Effluent peak flow rate (gpm or cfs) • Average influent flow rate (gpm or cfs) • Average effluent flow rate (gpm or cfs) • Bypass peak flow rate (gpm or cfs) • Total influent runoff volume (gallons or cubic feet [cf]) • Total effluent runoff volume (gallons or cf)
Revised June 2011 42 TAPE
• Total bypass runoff volume (gallons or cf) • Event hydrograph with time on x-axis, flow and precipitation on y-axes) that includes
precipitation, influent flow, effluent flow, influent aliquots, and effluent aliquots • Data flags for identified QA issues
Pollutant information
• Number of influent aliquots • Number of effluent aliquots • Percent of storm sampled • Parameters monitored • Influent EMCs • Effluent EMCs • Removal efficiency • Laboratory detection limits • Data flags for identified QA issues
Statistical comparisons of influent and effluent pollutant concentrations The proponent must conduct statistical analyses to determine whether there are significant differences in pollutant concentrations between the influent and effluent stations across individual storm events. The specific null hypothesis (Ho) and alternative hypothesis (Ha) for these analyses are as follows:
Ho: Effluent pollutant concentrations are equal to or greater than influent concentrations. Ha: Effluent concentrations are less than influent concentrations.
To evaluate these hypotheses, a 1-tailed Wilcoxon signed-rank test (Helsel and Hirsch 2002) should be used to compare the influent and effluent performance data. (The Wilcoxon signed-rank test is a nonparametric analogue to the paired t-test.) Statistical significance should be assessed based on an alpha (α) level of 0.05.
Pollutant removal efficiency calculations The proponent must calculate removal efficiencies for each measured pollutant using one of the two methods presented below. Note that these methods are only appropriate for short detention time systems having influent and effluent samples that can be realistically paired. The calculated pollutant removal efficiency estimates should be presented with the applicable performance goal in a table or graph.
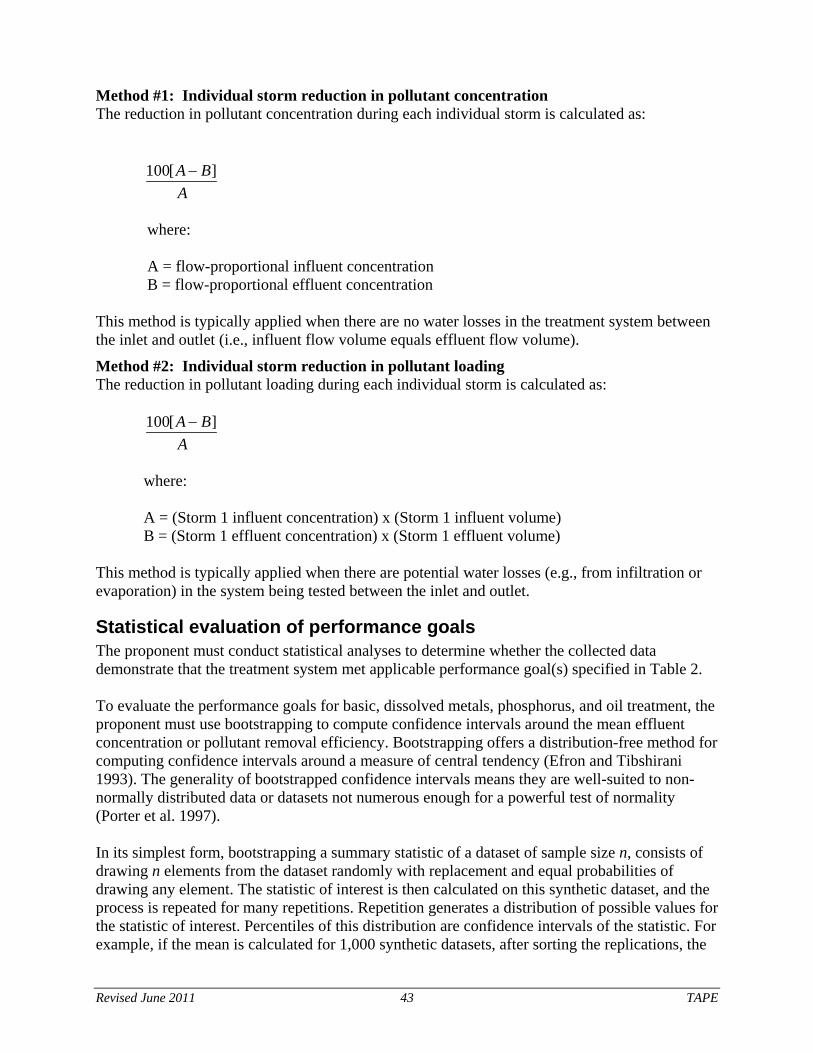
Revised June 2011 43 TAPE
Method #1: Individual storm reduction in pollutant concentration The reduction in pollutant concentration during each individual storm is calculated as:
ABA ][100 −
where: A = flow-proportional influent concentration B = flow-proportional effluent concentration
This method is typically applied when there are no water losses in the treatment system between the inlet and outlet (i.e., influent flow volume equals effluent flow volume).
Method #2: Individual storm reduction in pollutant loading The reduction in pollutant loading during each individual storm is calculated as:
ABA ][100 −
where: A = (Storm 1 influent concentration) x (Storm 1 influent volume) B = (Storm 1 effluent concentration) x (Storm 1 effluent volume)
This method is typically applied when there are potential water losses (e.g., from infiltration or evaporation) in the system being tested between the inlet and outlet.
Statistical evaluation of performance goals The proponent must conduct statistical analyses to determine whether the collected data demonstrate that the treatment system met applicable performance goal(s) specified in Table 2. To evaluate the performance goals for basic, dissolved metals, phosphorus, and oil treatment, the proponent must use bootstrapping to compute confidence intervals around the mean effluent concentration or pollutant removal efficiency. Bootstrapping offers a distribution-free method for computing confidence intervals around a measure of central tendency (Efron and Tibshirani 1993). The generality of bootstrapped confidence intervals means they are well-suited to non-normally distributed data or datasets not numerous enough for a powerful test of normality (Porter et al. 1997). In its simplest form, bootstrapping a summary statistic of a dataset of sample size n, consists of drawing n elements from the dataset randomly with replacement and equal probabilities of drawing any element. The statistic of interest is then calculated on this synthetic dataset, and the process is repeated for many repetitions. Repetition generates a distribution of possible values for the statistic of interest. Percentiles of this distribution are confidence intervals of the statistic. For example, if the mean is calculated for 1,000 synthetic datasets, after sorting the replications, the

Revised June 2011 44 TAPE
result at rank 50 is the one-sided lower 95 percent confidence limit for the mean, and the result at rank 950 is the one-sided upper 95 percent confidence limit for the mean. For basic, dissolved metals, and phosphorus treatment with goals that are expressed as a minimum removal efficiency (i.e., 80 percent TSS removal, 30 percent dissolved copper removal, 60 percent dissolved zinc removal, and 50 percent TP removal), bootstrapping should be used to compute the 95 percent confidence interval around the mean removal efficiency for the treatment system being evaluated. (Individual removal efficiency values should be computed using either Method #1 or Method #2 as described above.) The lower one-sided 95 percent confidence limit should then be compared to the applicable performance goal. If this limit is higher than the treatment goal, it can be concluded that the system met the performance goal with the required 95 percent confidence. For basic and oil treatment with goals that are expressed as a maximum effluent concentration (i.e., 20 mg/L TSS and 10 mg/L TPH), bootstrapping should be used to compute the 95 percent confidence interval around the mean effluent concentration for the treatment system being evaluated through the TAPE process. The upper one-sided 95 percent confident limit as computed above should then be compared to the applicable performance goal. If the upper one-sided confidence limit is lower than the treatment goal, it can be concluded that the system met the performance goal with the required 95 percent confidence.
Pollutant removal as a function of flow rate The proponent must conduct a regression analysis to evaluate pollutant removal performance as a function of flow rate. The goal of this analysis is to determine if the applicable performance goal for a given parameter is being met at the design hydraulic loading rate for the treatment system. Ecology will generally not approve a treatment system for a design hydraulic loading rate that is higher than the highest flow rate in the monitored data (field or lab). To perform this analysis, the proponent should determine an “aliquot-weighted influent flow rate” for each composite sample and an instantaneous influent flow rate for each grab sample. Next, the proponent should perform a regression analysis to determine whether the treatment performance increases, decreases, or remains unchanged as function of influent flow rate. More detailed information on these steps is provided in the following subsections.
Flow rate determination For flow-proportional composite sampling, the proponent should calculate an aliquot-weighted flow rate based on the time that each aliquot was collected. Specifically, the influent flow rate at the time each aliquot was collected should be determined for each storm event based on the continuous flow measurements from the influent monitoring station; these values should then be averaged to obtain an aliquot-weighted flow rate for the sampled storm event. For grab sampling, the proponent should determine the flow rate at the time each sample was collected based on comparisons of sample collection times to the continuous measurements from the influent monitoring station.
Regression analysis The proponent should develop linear regression models using the influent flow rates described in the previous subsection as the independent variable and pollutant removal performance data (from the composite samples or grab samples) as the dependent variable. The suitability of the

Revised June 2011 45 TAPE
regression equation should be evaluated using the following diagnostics (described in more detail in Helsel and Hirsch [2002]):
• Data coverage – to develop a usable linear regression model, an adequate number of data must have been collected across the influent flow range of interest (i.e., 50 to 125 percent of the design hydraulic loading rate or velocity).
• Outliers – extreme outliers should be evaluated and removed if they impart undue influence on the regression relationship.
• Linearity – scatter plots should be used to determine if a linear regression model provides a good fit to the data; as necessary, data transformations should be performed to improve the linear fit.
• Constant variance – to obtain a valid linear regression model, the variance of the dependent variable should remain relatively constant across the range of values for the independent variable; as necessary, data transformations should be performed to remove or reduce this problem.
• Other explanatory variables – other explanatory variables correlated with the independent variable can influence the dependent variable. For example, influent concentrations of “source limited” parameters can decrease as the influent flow rate increases; this can lead to an overall decrease in system performance. To evaluate this and other potential confounding factors, residuals from the linear regression model should be plotted against other likely explanatory variables. Advanced methods for performing linear regression analyses with multiple explanatory variables are described in Helsel and Hirsch (2002).
After performing these diagnostics to obtain the best linear regression model for the data, the p-value of the associated regression line should be evaluated to determine the statistical significance of the associated slope coefficient. If the p-value is greater than 0.05, the slope coefficient can be deemed insignificant (i.e., not significantly different from zero). In these instances it can be assumed that there is no relationship between flow and pollutant removal performance over the range of flow rates measured. If the p-value is less than or equal to 0.05, the slope coefficient can be deemed significant. In these instances, the linear regression model can be used to estimate mean system performance at the design hydraulic loading rate.
Operation and maintenance information This section of the TER must include the following, if applicable:
• Any data available about operation and maintenance of the stormwater treatment technology being tested.
• An evaluation of pollutant removal or bypass frequency over time (using a graphical representation that highlights the time periods when maintenance was performed). If the treatment system is configured with a bypass, it is recommended that treated flow rate during bypass conditions be plotted against time and compared to the system design hydraulic loading rate. The TER should describe how this information will be used to verify maintenance cycles.
Revised June 2011 46 TAPE
• An evaluation of the average bypass frequency to determine if the treatment system was appropriately sized (i.e., treats 91 percent of the average runoff volume).
• The results of the required screening parameter testing (Table 8).
• The results of the accumulated sediment sampling (if conducted) to determine the types of pollutants that were trapped in the settled sediment based on the performance goal(s) that the proponent is trying to achieve (Table 2).
• Specific disposal requirements based on the pollutant concentrations measured (if sediment chemistry analysis was performed). Since no specific regulations currently exist for disposal of sediment from catch basins, street sweeping, and stormwater treatment facilities, the Model Toxics Control Act (MTCA) Cleanup Regulations (Chapter l73-340 WAC) is often used to determine the disposal requirements for these types of sediment. Proponents can also refer to Appendix IV-G in the SWMMWW or Appendix 8B in the SWMMEW for a discussion of sediment disposal and recommended disposal thresholds.
Discussion This section of the TER must include at a minimum:
• A statistical data evaluation
• An explanation of any deviations from sampling procedures
• Information about anticipated performance in relation to climate, design storm, or site conditions
• Information on recommended operation and maintenance schedules
• Identification of any special disposal requirements
• An explanation of poor performance (if observed)
Conclusions This section of the TER must provide conclusions based on the findings of the monitoring program, and should summarize the pollutant removal performance of the monitored parameters. Conclusions and recommendations should also include recommended operation and maintenance procedures and frequency, pretreatment requirements (if applicable), use limitations, sizing criteria (flow or volume), recommended information to be posted on Ecology’s website, and additional testing recommendations (if needed). Ecology will utilize information from this section to prepare the use level designation letter.
Appendices Appendices to the TER must include:
• The approved QAPP and any subsequent QAPP addendums

Revised June 2011 47 TAPE
• All raw data (i.e., laboratory reports, chain of custody forms. Note: Large datasets may be submitted as a CD.)
• Any available non-standard data (data not collected per the TAPE, out-of-state testing not indicative of the Pacific Northwest, or field performance testing with real storms not meeting protocol guidelines)
• Supplemental laboratory testing results
• ISRs
• Completed standardized field forms for each sampled storm event
• Maintenance records for the treatment system
• Operation and maintenance plan (if available)
• Data analysis documentation
Third-party review For all submittals that contain field monitoring data that was collected by a vendor or manufacturer of a stormwater treatment technology, an independent professional third party must prepare a third-party review memorandum that contains the following elements:
• A signature page verifying that the opinions contained in the review memorandum are that of an independent third-party reviewer and no conflict of interest is present.
• A data validation review verifying that the site setup was performed according to the QAPP, and that monitoring was conducted in accordance with this protocol and the QAPP.
• A data summary that includes a review of monitoring data and ISRs from all sampled storm events, a test results summary, conclusions, and a comparison with the vendor or manufacturer’s performance claims.
• A recommendation of the appropriate use level designation for the treatment system.
• Additional testing recommendations, if needed. If the field monitoring was conducted by an independent professional third party, and the TER was also prepared by the same or a different independent professional third party, then a third-party review memorandum is not required.

Revised June 2011 48 TAPE
This page is purposely left blank

Revised June 2011 49 TAPE
References
APHA, AWWA, and WEF. 2005. Standard Methods for the Examination of Water and Wastewater, 21th Edition. American Public Health Association, American Water Works Association, and Water Environment Federation, Washington, D.C.
APWA. 1999. Protocol for the Acceptance of Unapproved Stormwater Treatment Technologies for Use in the Puget Sound Watershed. Prepared by the APWA Task Committee for American Public Works Association, Washington Chapter, Stormwater Managers Committee, Washington.
ASTM. 2002. Standard test methods for determining sediment concentration in water samples. Method D 3977. American Society for Testing and Materials, Philadelphia, Pennsylvania.
Ecology. 1997. Analytical Methods for Petroleum Hydrocarbons. No. ECY 97-602. Washington State Department of Ecology, Toxics Cleanup Program and Environmental Laboratory, Olympia, Washington.
Ecology. 2004a. Guidelines for Preparing Quality Assurance Project Plans for Environmental Studies. No. 04-03-030. Washington State Department of Ecology, Olympia, Washington.
Ecology, 2004b. Stormwater Management Manual for Eastern Washington. No. 04-10-076. Washington State Department of Ecology, Olympia, Washington. September 2004.
Ecology. 2005. Stormwater Management Manual for Western Washington. No. 05-10-029 through 05-10-033. Washington State Department of Ecology, Olympia, Washington. February 2005.
Ecology. 2007. Western Washington Phase I Municipal Stormwater Permit. Washington State Department of Ecology Water Quality Program. Issued January 17, 2007, modified June 17, 2009.
Ecology. 2008. Guidance for Evaluating Emerging Stormwater Treatment Technologies-Technology Assessment Protocol—Ecology (TAPE)—Modification: Evaluating Stormwater Treatment Technologies with Long Detention Times. DRAFT Washington State Department of Ecology, Olympia, Washington. March 27, 2008.
Ecology. 2009a. Standard Operating Procedure for Automatic Sampling for Stormwater Monitoring, Version 1.0. No. ECY 002. Washington State Department of Ecology, Olympia, Washington. September 16, 2009.
Ecology. 2009b. Standard Operating Procedure for Collecting Grab Samples from Stormwater Discharges, Version 1.0. No. ECY 001. Washington State Department of Ecology, Olympia, Washington. September 16, 2009.
Ecology. 2011a. Emerging Stormwater Treatment Technologies Application for Certification. No. ECY 070-391. Washington State Department of Ecology, Olympia, Washington.
Revised June 2011 50 TAPE
Ecology. 2011b. Technology Assessment Protocol – Ecology (TAPE) Process Overview. No. 11-10-010. Washington State Department of Ecology, Olympia, Washington.
Efron, B. and R.J. Tibshirani. 1993. An introduction to the bootstrap: Monographs on statistics and applied probability. Chapman & Hall, New York.
Helsel, D.R. and R.M. Hirsch. 2002 . Statistical Methods in Water Resources. Elsevier Publications, Amsterdam.
Porter, P.S., S.T. Rao, J.Y Ku, R.L. Poirot, and M. Dakins. 1997. Small sample properties of nonparametric bootstrap t confidence intervals. Journal of the Air and Waste Management Association 47:1197-1203.
U.S. EPA, November 1997. Monitoring Guidance for Determining the Effectiveness of Nonpoint Source Controls, EPA 841-B-96-004. U. S. Environmental Protection Agency, Nonpoint Source Control Branch, Washington, D.C.
U.S. EPA. 1995. EPA Clean Water Act Section 403 Report to Congress, NPDES Permitting Program, EPA 842-R-94-001. U.S. Environmental Protection Agency, Washington, D.C.
U.S. EPA. 1983. Methods for Chemical Analysis of Water and Wastes. EPA-600/4-79-020. Environmental Monitoring and Support Laboratory, Cincinnati, Ohio.
Washington Stormwater Center and Herrera. 2011. Defining enhanced treatment for the Technology Assessment Protocol – Ecology (TAPE). Prepared by the Washington Stormwater Center, Tacoma, Washington and Herrera Environmental Consultants, Inc., Seattle, Washington. April 25, 2011.
Wentworth, C.K. 1922. A scale of grade and class terms for sediments. Journal of Geology 30:377-392.

Revised June 2011 51 TAPE
Appendix Glossary Accreditation – A certification process for laboratories, designed to evaluate and document a lab’s ability to perform analytical methods and produce acceptable data. Accuracy – the degree to which a measured value agrees with the true value of the measured property. The terms precision and bias are often used to convey the information associated with this term. Absorption – The penetration of a substance into or through another, such as the dissolving of a soluble gas in a liquid. Adsorption – The adhesion of a substance to the surface of a solid or liquid; often used to extract pollutants by causing them to be attached to such adsorbents as activated carbon or silica gel. Heavy metals such as zinc and lead often adsorb onto sediment particles. Analyte – An element, ion, compound, or chemical moiety (pH, alkalinity) which is to be determined. Anion exchange – The chemical process where negative ions of one chemical are preferentially replaced by negative ions of another chemical. Automated sampler – A portable unit that can be programmed to collect discrete sequential samples, time-composite samples, or flow-composite samples. Backwater – Water upstream from an obstruction which is deeper than it would normally be without the obstruction. Basic treatment – Treatment of stormwater with the goal of removing at least 80 percent of the solids present in the runoff. Receiving waters and areas subject to this treatment requirement are specified in the SWMMWW and SWMMEW. Additional treatment to remove metals, oil or phosphorus may be required at some sites or for some receiving water bodies. Best management practice (BMP) – The schedules of activities, prohibitions of practices, maintenance procedures, and structural and/or managerial practices, that when used singly or in combination, prevent or reduce the release of pollutants and other adverse impacts to waters of Washington State. Bias – The difference between the population mean and the true value. Bias usually describes a systematic difference reproducible over time, and is characteristic of both the measurement system, and the analyte(s) being measured. Blank – A synthetic sample, free of the analyte(s) of interest. For example, in water analysis, pure water is used for the blank. In chemical analysis, a blank is used to estimate the analytical response to all factors other than the analyte in the sample. In general, blanks are used to assess possible contamination or inadvertent introduction of analyte during various stages of the sampling and analytical process.

Revised June 2011 52 TAPE
Bypass – A design feature that allows flow rates or flow volumes higher than the design hydraulic loading rate to be routed past the stormwater treatment technology without receiving treatment. Calibration – The process of establishing the relationship between the response of a measurement system and the concentration of the parameter being measured. Cation exchange – A process where positively charged ions of one chemical are preferentially replaced by positive ions of another chemical. Comparability – The degree to which different methods, datasets and/or decisions agree or can be represented as similar. Completeness – The amount of valid data obtained from a data collection project compared to the planned amount. Completeness is usually expressed as a percentage. Composite sample – Used to determine “average” loadings or concentrations of pollutants, such samples are collected at specified intervals, and pooled into one large sample, can be developed on time, flow volume, or flow rate. Conditional use level designation (CULD) – A use level designation assigned by Ecology for emerging technologies that have a considerable amount of performance data that were not collected using the TAPE protocol. Ecology will limit the number of installations to ten development and redevelopment projects for this use level designation; however, there is no installation limit for retrofit projects. Field monitoring is only required to be conducted at one installed system with this use level designation. Confined space entry – A space that is large enough and so configured that an employee can bodily enter and perform assigned work, has limited or restricted means for entry or exit (for example, tanks, vessels, silos, storage bins, hoppers, vaults, and pits are spaces that may have limited means of entry) and is not designed for continuous employee occupancy. Control chart – A graphical representation of quality control results demonstrating the performance of an aspect of a measurement system. Control limits – Statistical warning and action limits calculated based on control charts. Warning limits are generally set at ± 2 standard deviations from the mean, action limits at ± 3 standard deviations from the mean. Dataset – A grouping of samples, usually organized by date, time, and/or analyte. Data validation – An analyte-specific and sample-specific process that extends the evaluation of data beyond data verification to determine the analytical quality of a specific dataset. It involves a detailed examination of the data package using professional judgment to determine whether the MQOs for precision, bias, and sensitivity have been met.

Revised June 2011 53 TAPE
Data verification – Examination of the data for errors or omissions and of the quality control results for compliance with acceptance criteria. Design storm – A prescribed hyetograph and total precipitation amount (for a specific duration recurrence frequency) used to estimate runoff for a hypothetical storm of interest or concern for the purposes of analyzing existing drainage, designing new drainage facilities or assessing other impacts of a proposed project on the flow of surface water. (A hyetograph is a graph of percentages of total precipitation for a series of time steps representing the total time during which the precipitation occurs.) Detention – The release of stormwater runoff from the site at a slower rate than it is collected by the stormwater facility system, the difference being held in temporary storage. Detention time – The theoretical time required to displace the contents of a stormwater treatment facility at a given rate of discharge (volume divided by rate of discharge). Discrete sample – An individual sample collected at a specific time and flow rate. Dissolved metals treatment –Treatment of stormwater with the goal of removing dissolved metals (i.e., copper and zinc) present in the runoff. Receiving waters and areas subject to this treatment requirement are specified in the SWMMWW and SWMMEW. Additional treatment to remove oil or phosphorus may be required at some sites or for some receiving water bodies. Drainage area – The area contributing runoff to a single point measured in a horizontal plane, which is enclosed by a ridge line. Drainage – Refers to the collection, conveyance, containment, and/or discharge of surface and stormwater runoff. Effluent – Discharge from the outlet that is not comingled with stormwater bypassing the stormwater treatment technology. Emerging technology – Treatment technologies that have not been evaluated with approved protocols, but for which preliminary data indicate that they may provide a necessary function(s) in a stormwater treatment system. Emerging technologies need additional evaluation to define design criteria to achieve, or to contribute to achieving, state performance goals, and to define the limits of their use. Erosion – The wearing away of the land surface by running water, wind, ice, or other geological agents, including such processes as gravitational creep. This term also includes detachment and movement of soil or rock fragments by water, wind, ice, or gravity. Equipment rinsate blank – A quality control sample collected by passing reagent-grade water through clean equipment and collecting samples for chemical analyses. The amount of reagent-grade water used for the sample should represent the volume of stormwater that will be collected during a typical sampling event. The equipment rinsate blank may also detect contamination from the surroundings, contamination from the containers, or from cross-contamination during

Revised June 2011 54 TAPE
transportation and storage of the samples and is therefore the most comprehensive type of field blank. Event Mean Concentration (EMC) – Pollutant concentration of a composite of multiple samples (aliquots) collected during the course of a storm. The EMC accurately depicts pollutant levels from a site and is most representative of average pollutant concentrations over an entire runoff event. Field blank – A blank used to obtain information on contamination introduced during sample collection, storage, and transport. Includes transport blanks, transfer blanks, equipment rinsate blanks, and filter blanks. Field duplicates – Separate samples collected simultaneously at the identical source location and analyzed separately. Field duplicates are used to assess total sample variability (i.e., field plus analytical variability). Filter blank – A special case of a rinsate blank prepared by filtering pure water through the filtration apparatus after routine cleaning that may detect contamination from the filter or other part of the filtration apparatus. Filtration – Use of various media such as sand, perlite, zeolite, and carbon, to remove low levels of total suspended solids (TSS). Specific media such as activated carbon or zeolite can remove hydrocarbons and soluble metals. Filter systems can be configured as basins, trenches, or cartridges. Frequency of storm (design storm frequency) – The anticipated period in years that will elapse, based on average probability of storms in the design region, before a storm of a given intensity and/or total volume will recur; thus a 10-year storm can be expected to occur on the average once every 10 years. Gauge – Device for registering precipitation, water level, discharge, velocity, pressure, temperature, etc. General use level designation (GULD) – A use level designation assigned by Ecology for emerging technologies that have achieved the monitoring and reporting requirements specified in the TAPE protocol. This use level designation confers a general acceptance for the treatment technology. Technologies with this use level designation may be installed anywhere in Washington, subject to Ecology’s conditions. Grab sample – A sample collected during a very short time period at a single location. Groundwater – Water in a saturated zone or stratum beneath the land surface or a surface waterbody. Head (hydraulics) – The height of water above any plane of reference. The energy, either kinetic or potential, possessed by each unit weight of a liquid, expressed as the vertical height through which a unit weight would have to fall to release the average energy possessed. Used in various compound terms such as pressure head, velocity head, and head loss.
Revised June 2011 55 TAPE
Head loss – Energy loss due to friction, eddies, changes in velocity, or direction of flow. Hydraulic gradient – Slope of the potential head relative to a fixed datum. Hydrograph – A graph of runoff rate, inflow rate or discharge rate past a specific point as a function of time. Illicit connection – Any man-made conveyance that is connected to a municipal separate storm sewer without a permit, excluding roof drains and other similar type connections. Examples include sanitary sewer connections, floor drains, channels, pipelines, conduits, inlets, or outlets that are connected directly to the municipal separate storm sewer system. Impervious surface – A hard surface area which either prevents or retards the entry of water into the soil mantle as under natural conditions prior to development. A hard surface area which causes water to run off the surface in greater quantities or at an increased rate of flow from the flow present under natural conditions prior to development. Common impervious surfaces include, but are not limited to, roof tops, walkways, patios, driveways, parking lots or storage areas, concrete or asphalt paving, gravel roads, packed earthen materials, and oiled, macadam or other surfaces which similarly impede the natural infiltration of stormwater. Open, uncovered retention/detention facilities shall be considered impervious surfaces for purposes of runoff modeling. Infiltration – The downward movement of water from the surface to the subsoil. Influent – Stormwater runoff entering the inlet of the stormwater treatment technology. Inlet – A form of connection between surface of the ground and the stormwater treatment technology for the admission of surface and stormwater runoff. Laboratory control sample (LCS) – A sample of known composition prepared using contaminant-free water or an inert solid that is spiked with analytes of interest at the midpoint of the calibration curve or at the level of concern. It is prepared and analyzed in the same batch of regular samples using the same sample preparation method, reagents, and analytical methods employed for regular samples. Laboratory replicates – Repeated analyses of a variable performed on the contents of a single sample bottle. Laboratory replicates are used to assess analytical precision. Duplicate analyses are sufficient for procedures that are well proven in the laboratory. Lag time – The detention time for a stormwater treatment technology that occurs between the inlet and outlet. Maintenance – Repair and maintenance includes activities conducted on currently serviceable structures, facilities, and equipment that involves no expansion or use beyond that previously existing and resulting in no significant adverse hydrologic impact. It includes those usual activities taken to prevent a decline, lapse, or cessation in the use of structures and systems and includes replacement of disfunctioning facilities, including cases where environmental permits

Revised June 2011 56 TAPE
require replacing an existing structure with a different type structure, as long as the functioning characteristics of the original structure are not changed. Matrix spike (MS) and matrix spike duplicate (MSD) – A QC sample prepared by adding a known amount of the target analyte(s) to an aliquot of a sample to check for bias due to interference or matrix effects. Measurement quality objectives (MQOs) – Performance or acceptance criteria for individual data quality indicators, usually including precision, bias, sensitivity, completeness, comparability, and representativeness. Metals – Elements, such as cadmium, chromium, cobalt, copper, lead mercury, nickel, and zinc, which are of environmental concern because they do not degrade over time. Although many are necessary nutrients, they are sometimes magnified in the food chain, and they can be toxic to life in high enough concentrations. They are also referred to as heavy metals. Method – A formalized group of procedures and techniques for performing an activity (e.g., sampling, chemical analysis, data analysis), systematically presented in the order in which they are to be executed. Method blank – A blank prepared to represent the sample matrix, prepared and analyzed with a batch of samples. A method blank will contain all reagents used in the preparation of a sample, and the same preparation process is used for the method blank and samples. Monitoring – The collection of data by various methods for the purposes of understanding natural systems and features, evaluating the impacts of development proposals on such systems, and assessing the performance of mitigation measures imposed as conditions of development. National Pollutant Discharge Elimination System (NPDES) – The part of the federal Clean Water Act, which requires point source dischargers to obtain permits. These permits are referred to as NPDES permits and, in Washington State, are administered by the Washington State Department of Ecology. New development – Land disturbing activities, including Class IV-general forest practices that are conversions from timber land to other uses; structural development, including construction or installation of a building or other structure; creation of impervious surfaces; and subdivision, short subdivision and binding site plans, as defined and applied in Chapter 58.17 RCW. Projects meeting the definition of redevelopment shall not be considered new development. Nutrients – Essential chemicals needed by plants or animals for growth. Excessive amounts of nutrients can lead to degradation of water quality and algal blooms. Some nutrients can be toxic at high concentrations. NWTPH-Dx (Northwest total petroleum hydrocarbon – motor oil and diesel fractions) – Qualitative and quantitative method (extended) for semi-volatile (“diesel”) petroleum products in soil and water. Petroleum products applicable for this include jet fuels, kerosene, diesel oils, hydraulic fluids, mineral oils, lubricating oils and fuel oils.
Revised June 2011 57 TAPE
NWTPH-Gx (Northwest total petroleum hydrocarbon – gasoline fraction) – Qualitative and quantitative method (extended) for volatile (“gasoline”) petroleum products in soil and water. Petroleum products applicable for this method include aviation and automotive gasolines, mineral spirits, Stoddard solvent and naphtha. Off-line facilities – Water quality treatment facilities to which stormwater runoff is restricted to some maximum flow rate or volume by a flow-splitter. Oil treatment –Treatment of stormwater with the goal of removing oil present in the runoff. Receiving waters and areas subject to this treatment requirement are specified in the SWMMWW and SWMMEW. This type of treatment is required for high-use sites and high average daily traffic (ADT) areas. Additional treatment to remove metals or phosphorus may be required at some sites or for some receiving water bodies. On-line facilities – Water quality treatment facilities which receive all of the stormwater runoff from a drainage area. Flows above the water quality design hydraulic loading rate or volume are passed through at a lower percent removal efficiency. Outlet – Point of water disposal from a stormwater treatment technology. Parameter – A specified characteristic of a population or sample. Also, an analyte or grouping of analytes. Total suspended solids, total phosphorus, and total petroleum hydrocarbons are all “parameters”. Particle size – The effective diameter of a particle as measured by sedimentation, sieving, or micrometric methods. Percent relative standard deviation (%RSD) – A statistic used to evaluate precision in environmental analysis. It is determined in the following manner:
%RSD = (100 * s)/x where s = sample standard deviation, and x = sample mean Pervious surface – A surface that allows infiltration of stormwater into the underlying soil. Common pervious surfaces include, but are not limited to, lawns, pastures, and forests. pH – A measure of the alkalinity or acidity of a substance which is conducted by measuring the concentration of hydrogen ions in the substance. Phosphorus treatment –Treatment of stormwater with the goal of removing 50 percent of the total phosphorus present in the runoff. Receiving waters and areas subject to this treatment requirement are specified in the SWMMWW and SWMMEW. This type of treatment is required only where federal, state, or local government has determined that a water body is sensitive to phosphorus and that a reduction in phosphorus from new development and redevelopment is necessary to achieve water quality standards. Additional treatment to remove metals or oil may be required at some sites or for some receiving water bodies. Pilot use level designation (PULD) – A use level designation assigned by Ecology for emerging technologies with limited performance data or laboratory testing data. Ecology will limit the number of installations to five new development and redevelopment projects for this use level
Revised June 2011 58 TAPE
designation; however, there is no installation limit for retrofit projects. Field monitoring must be conducted at all installed systems with this use level designation. Pollutant – A contaminant in a concentration or amount that adversely alters the physical, chemical, or biological properties of the natural environment. Dredged soil, solid waste, incinerator residue, filter backwash, sewage, garbage, sewage sludge, munitions, chemical wastes, biological materials, radioactive materials (except those regulated under the Atomic Energy Act of 1954, as amended), heat, wrecked or discarded equipment, rock, sand, cellar dirt and industrial, municipal, and agricultural waste discharged into water. Pollutant load – A mass concentration multiplied by the total volume of water passing by a certain point in time. Precision – The extent of random variability among replicate measurements of the same property. Pretreatment – The removal of material such as solids, grit, grease, and scum from flows prior to physical, biological, or physical treatment processes to improve treatability. Pretreatment may include screening, grit removal, settling, oil/water separation, or application of a Basic Treatment BMP prior to infiltration. Proponent – The person(s) who would like to certify their stormwater treatment technology through the TAPE process. This can include the designer, manufacturer, vendor, and their consultant(s). Quality assurance (QA) – A set of activities designed to establish and document the reliability and usability of measurement data. Quality Assurance Project Plan (QAPP) – A document that describes the objectives of a project, and the processes and activities necessary to develop data that will support those objectives. Quality control (QC) – The routine application of measurement and statistical procedures to assess the accuracy of measurement data. Redevelopment – On a site that is already substantially developed (i.e., has 35 percent or more of existing impervious surface coverage), the creation or addition of impervious surfaces; the expansion of a building footprint or addition or replacement of a structure; structural development including construction, installation or expansion of a building or other structure; replacement of impervious surface that is not part of a routine maintenance activity; and land disturbing activities. Retrofitting – The renovation of an existing structure or facility to meet changed conditions and/or to improve performance. Relative percent difference (RPD) – The difference between two values divided by their mean and multiplied by 100.
Revised June 2011 59 TAPE
Reporting limit – The lowest amount of an analyte in a sample that can be quantitatively determined with stated, acceptable precision and accuracy under stated analytical conditions (i.e., the lower limit of quantitation). Representativeness – The degree to which a sample reflects the population from which it is taken. Return frequency – A statistical term for the average time of expected interval that an event of some kind will equal or exceed given conditions (e.g., a stormwater flow that occurs every 2 years). Runoff – Water originating from rainfall and other precipitation that is found in drainage facilities, rivers, streams, springs, seeps, ponds, lakes and wetlands as well as shallow ground water. It also means the portion of rainfall or other precipitation that becomes surface flow and interflow. Sensitivity – In general, denotes the rate at which the analytical response (e.g., absorbance, volume, meter reading) varies with the concentration of the parameter being determined. In a specialized sense, it has the same meaning as the detection limit. Settleable solids – Those suspended solids in stormwater that separate by settling when the stormwater is held in a quiescent condition for a specified time. Settling – The process by which particulates settle to the bottom of a liquid and form a sediment. Slope – Degree of deviation of a surface from the horizontal; measured as a numerical ratio, percent, or in degrees. Expressed as a ratio, the first number is the horizontal distance (run) and the second is the vertical distance (rise), as 2:1. Soil Conservation Service (SCS) Method – A single-event hydrologic analysis technique for estimating runoff based on the Curve Number method. The Curve Numbers are published by NRCS in Urban Hydrology for Small Watersheds, 55 TR, June 1976. Standard operating procedure (SOP) – A document which describes in detail a reproducible and repeatable organized activity. Steep slope – Slopes of 40 percent gradient or steeper within a vertical elevation change of at least ten feet. A slope is delineated by establishing its toe and top, and is measured by averaging the inclination over at least ten feet of vertical relief. Stormwater – That portion of precipitation that does not naturally percolate into the ground or evaporate, but flows via overland flow, interflow, pipes and other features of a stormwater drainage system into a defined surface waterbody, or a constructed infiltration facility. Stormwater facility – A constructed component of a stormwater drainage system, designed or constructed to perform a particular function, or multiple functions. Stormwater facilities include, but are not limited to, pipes, swales, ditches, culverts, street gutters, detention ponds, retention

Revised June 2011 60 TAPE
ponds, constructed wetlands, infiltration devices, catch basins, oil/water separators, and biofiltration swales. Stormwater Management Manual for Eastern Washington (SWMMEW) – A manual, prepared by Ecology, that contains BMPs to prevent, control, or treat pollution in stormwater, and reduce other stormwater-related impacts to waters of the state. The manual is intended to provide guidance on measures necessary in eastern Washington to control the quantity and quality of stormwater runoff from new development and redevelopment. Stormwater Management Manual for Western Washington (SWMMWW) – A manual, prepared by Ecology, that contains BMPs to prevent, control or treat pollution in stormwater and reduce other stormwater-related impacts to waters of the State. The manual is intended to provide guidance on measures necessary in western Washington to control the quantity and quality of stormwater runoff from new development and redevelopment. Surrogate – For environmental chemistry, a surrogate is a substance with properties similar to those of the target analyte(s). Surrogates are unlikely to be native to environmental samples. They are added to environmental samples for quality control purposes, to track extraction efficiency and/or measure analyte recovery. Deuterated organic compounds are examples of surrogates commonly used in organic compound analysis. Total petroleum hydrocarbons (TPH) – TPH-Gx: The qualitative and quantitative method (extended) for volatile (“gasoline”) petroleum products in water; and TPH-Dx: The qualitative and quantitative method (extended) for semi-volatile (“diesel”) petroleum products in water. Total suspended solids (TSS) – That portion of the solids (organic or inorganic particles including sand, mud, and clay particles and associated pollutants) carried by stormwater that can be captured on a standard glass filter. Transfer blank – A sample container of pure water, which is prepared at the laboratory and carried unopened to the field and back with the other sample containers to check for possible contamination in the containers or for cross-contamination during transportation and storage of the samples. Transport blank – A sample container of pure water which is filled during routine sample collection to check for possible contamination from the surroundings, contamination from the containers, or from cross-contamination during transportation and storage of the samples. Treatment BMP – A BMP that is intended to remove pollutants from stormwater. A few examples of treatment BMPs are wet ponds, oil/water separators, biofiltration swales, and constructed wetlands. Treatment train – A combination of two or more treatment facilities connected in series. Vortexing separation – Physical stormwater treatment technology that employs the use of cylindrical chambers to induce rotational forces that separate settleable solids and associated pollutants.
Revised June 2011 61 TAPE
Water quality – A term used to describe the chemical, physical, and biological characteristics of water, usually in respect to its suitability for a particular purpose. Water quality design storm – The 24-hour rainfall amount with a 6-month return frequency. Commonly referred to as the 6-month, 24-`hour storm.