technical memorandum 620 2012 comprehensive...
TRANSCRIPT

Technical Memorandum 620
2012 Comprehensive Combined Sewer Overflow Control Program Review
Cost Estimating Methodology for CSO Control Facilities
May 2011
King Street Center, KSC-NR-0512
201 South Jackson Street Seattle, WA 98104
For comments or questions contact: Karen Huber, Project Manager King County Wastewater Treatment Division 201 S. Jackson St. KSC-NR-0512 Seattle, WA 98104-3855 (206) 264-1246 [email protected]
Alternate Formats Available 206-684-1280 (voice) or 711 (TTY)
Technical Memorandum 620, Cost Estimating Methodology for CSO Control Facilities (May 2011) i
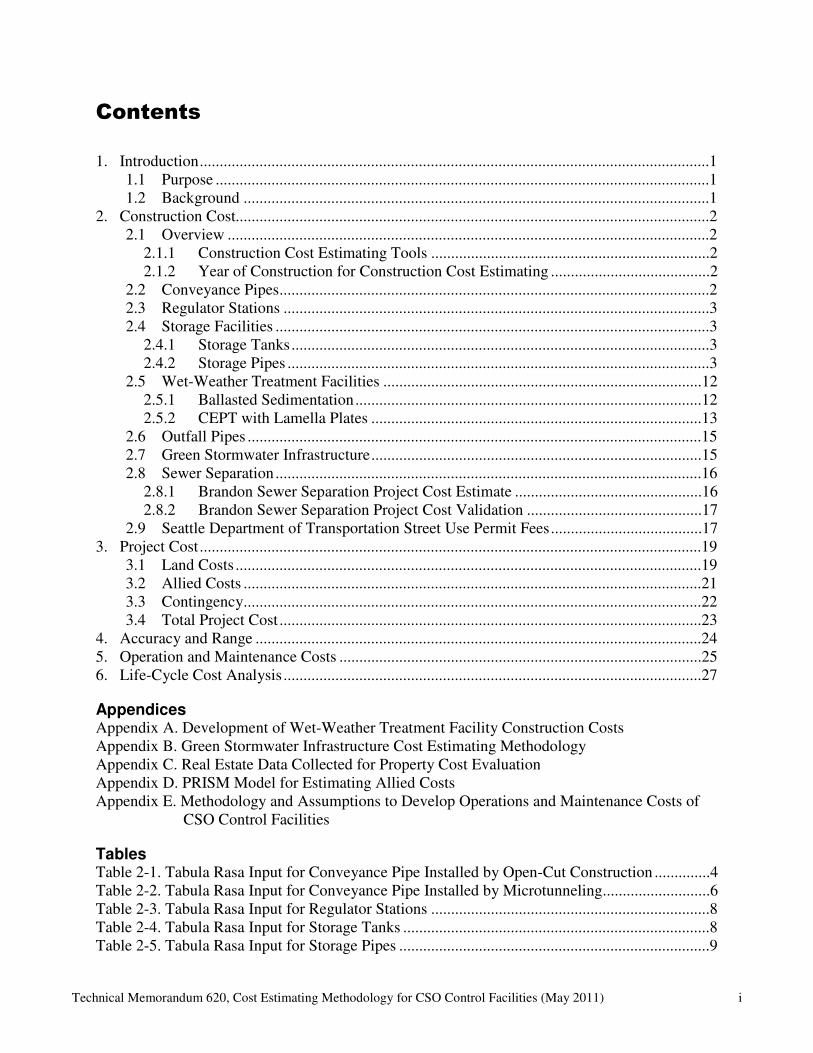
Contents
1. Introduction ................................................................................................................................1
1.1 Purpose ............................................................................................................................1
1.2 Background .....................................................................................................................1
2. Construction Cost.......................................................................................................................2
2.1 Overview .........................................................................................................................2
2.1.1 Construction Cost Estimating Tools ......................................................................2
2.1.2 Year of Construction for Construction Cost Estimating ........................................2
2.2 Conveyance Pipes ............................................................................................................2
2.3 Regulator Stations ...........................................................................................................3
2.4 Storage Facilities .............................................................................................................3
2.4.1 Storage Tanks .........................................................................................................3
2.4.2 Storage Pipes ..........................................................................................................3
2.5 Wet-Weather Treatment Facilities ................................................................................12
2.5.1 Ballasted Sedimentation .......................................................................................12
2.5.2 CEPT with Lamella Plates ...................................................................................13
2.6 Outfall Pipes ..................................................................................................................15
2.7 Green Stormwater Infrastructure ...................................................................................15
2.8 Sewer Separation ...........................................................................................................16
2.8.1 Brandon Sewer Separation Project Cost Estimate ...............................................16
2.8.2 Brandon Sewer Separation Project Cost Validation ............................................17
2.9 Seattle Department of Transportation Street Use Permit Fees ......................................17
3. Project Cost ..............................................................................................................................19
3.1 Land Costs .....................................................................................................................19
3.2 Allied Costs ...................................................................................................................21
3.3 Contingency ...................................................................................................................22
3.4 Total Project Cost ..........................................................................................................23
4. Accuracy and Range ................................................................................................................24
5. Operation and Maintenance Costs ...........................................................................................25
6. Life-Cycle Cost Analysis .........................................................................................................27
Appendices Appendix A. Development of Wet-Weather Treatment Facility Construction Costs Appendix B. Green Stormwater Infrastructure Cost Estimating Methodology Appendix C. Real Estate Data Collected for Property Cost Evaluation Appendix D. PRISM Model for Estimating Allied Costs Appendix E. Methodology and Assumptions to Develop Operations and Maintenance Costs of CSO Control Facilities
Tables Table 2-1. Tabula Rasa Input for Conveyance Pipe Installed by Open-Cut Construction ..............4
Table 2-2. Tabula Rasa Input for Conveyance Pipe Installed by Microtunneling ...........................6
Table 2-3. Tabula Rasa Input for Regulator Stations ......................................................................8
Table 2-4. Tabula Rasa Input for Storage Tanks .............................................................................8
Table 2-5. Tabula Rasa Input for Storage Pipes ..............................................................................9

Technical Memorandum 620, Cost Estimating Methodology for CSO Control Facilities (May 2011) ii
Table 2-6. Tabula Rasa Input for Odor Control Facility and Submersible Pumps for Storage Pipes .........................................................................................................................................11
Table 2-7. Cost Equations for Ballasted Sedimentation Treatment Facility .................................13
Table 2-8. Solids Handling Construction Costs for CEPT with Lamella Plates ...........................14
Table 2-9. Cost Equations for Wet-Weather Treatment Facility Using CEPT with Lamella Plates, Excluding Solids Handling Facility .........................................................................................14
Table 2-10. Sewer Separation Unit Construction Cost Comparison .............................................17
Table 3-1. Land Cost Assumptions ................................................................................................20
Table 3-2. Allied Costs as Percentage of Total Construction Cost................................................22
Table 4-1. Design Status for Determining AACE Cost Estimate Class ........................................24
Figures Figure 2-1. Construction Costs for Ballasted Sedimentation Treatment Facilities ................12
Figure 2-2. Construction Costs for CEPT with Lamella Plates, Excluding Solids Handling Facilities ........................................................................................................................14
Figure 4-1. Accuracy Range for Cost Estimating Classes under AACE International System ...........................................................................................................................24

Technical Memorandum 620, Cost Estimating Methodology for CSO Control Facilities (May 2011) iii
Acronyms
AACE Advancement of Cost Engineering CCI Construction cost index CEPT Chemically enhanced primary treatment CPES CH2M Hill parametric cost estimating system CSO Combined sewer overflow ENR Engineering News Record gpd Gallons per day gpd/sf Gallons per day per square foot MG Million gallons MGD Million gallons per day O&M Operation and maintenance SDOT Seattle Department of Transportation SOR Surface overflow rate SPU Seattle Public Utilities TSS Total suspended solids

This page left blank intentionally.

Technical Memorandum 620, Cost Estimating Methodology for CSO Control Facilities (May 2011) 1
1. INTRODUCTION
1.1 Purpose This technical memorandum presents the project cost estimating methodologies for the King County 2012 Combined Sewer Overflow (CSO) Control Program Review. These methodologies will be used to estimate project and life-cycle costs for the final alternatives evaluated in the Program Review. This technical memorandum is a deliverable of Subtask 620 (Develop Standardized Planning-Level Cost Estimating Methodology for CSO Facilities).
1.2 Background The 2012 CSO Control Program Review will update priorities and assumptions for King County’s CSO Control Program and may recommend changes to the 1999 Regional Wastewater Service Plan to meet current conditions. The goal of the Program Review is to select CSO control projects that optimize and balance environmental, social, and financial goals to meet current needs while protecting future opportunities.
King County must have reliable project cost estimates for plan decisions and long-range financial planning. In addition, cost information must be understandable to elected leaders, management, and stakeholders. King County has developed models for planning-level conveyance facility estimating (the Tabula Rasa model) and for estimating project costs. These are incorporated in the cost estimating methodologies described in this technical memorandum.

This page left blank intentionally.

Technical Memorandum 620, Cost Estimating Methodology for CSO Control Facilities (May 2011) 2
2. CONSTRUCTION COST
2.1 Overview Base construction costs are defined as the actual cost for a contractor to construct a facility, plus the following:
• Contractor overhead and profit
• Contractor mobilization and demobilization
• Contractor bonds and insurance.
2.1.1 Construction Cost Estimating Tools Detailed engineering data and design are not available for this Program Review, so existing cost estimating tools will be used to provide order-of-magnitude estimates for project alternatives:
• Tabula Rasa Costing Tool (Version 3.1.2)—King County developed Tabula Rasa to provide planning-level cost estimates for conveyance and storage facilities.
• Omaha CSO Cost Tool (Version 2.8)—This model provides planning-level cost estimates for wet-weather treatment facilities.
Cost estimates from these models are general and do not reflect project-specific features that can impact overall construction costs.
2.1.2 Year of Construction for Construction Cost Estimating The year of construction for alternatives evaluated in the Program Review will be estimated to the same year of construction (2010) for a fair comparison among alternatives; no annual escalation will be assumed. During preferred alternative development, construction costs will be adjusted to the actual year of construction based on the projected year of control.
Construction costs are monitored by the Engineering News Record (ENR). The ENR Construction Cost Index (ENR CCI) averages the cost of a set amount of labor and materials over a 20-city average of labor rates and material costs. In addition, the ENR has a specific value for the Seattle area. The following year of construction and ENR CCI will be used as the basis of Program Review construction cost estimates:
• Year: 2010 (2010 dollars); January 2010 was selected as the year of construction to be consistent with Seattle Public Utilities (SPU) for collaborative alternatives
• ENR CCI: 8645.35 (CCI for City of Seattle, January 2010)
2.2 Conveyance Pipes Tabula Rasa’s pipe costing tool will be used to estimate construction costs for new conveyance pipes, including gravity sewers and force mains. It is assumed that most pipes will be installed using open cut construction.
Technical Memorandum 620, Cost Estimating Methodology for CSO Control Facilities (May 2011) 3
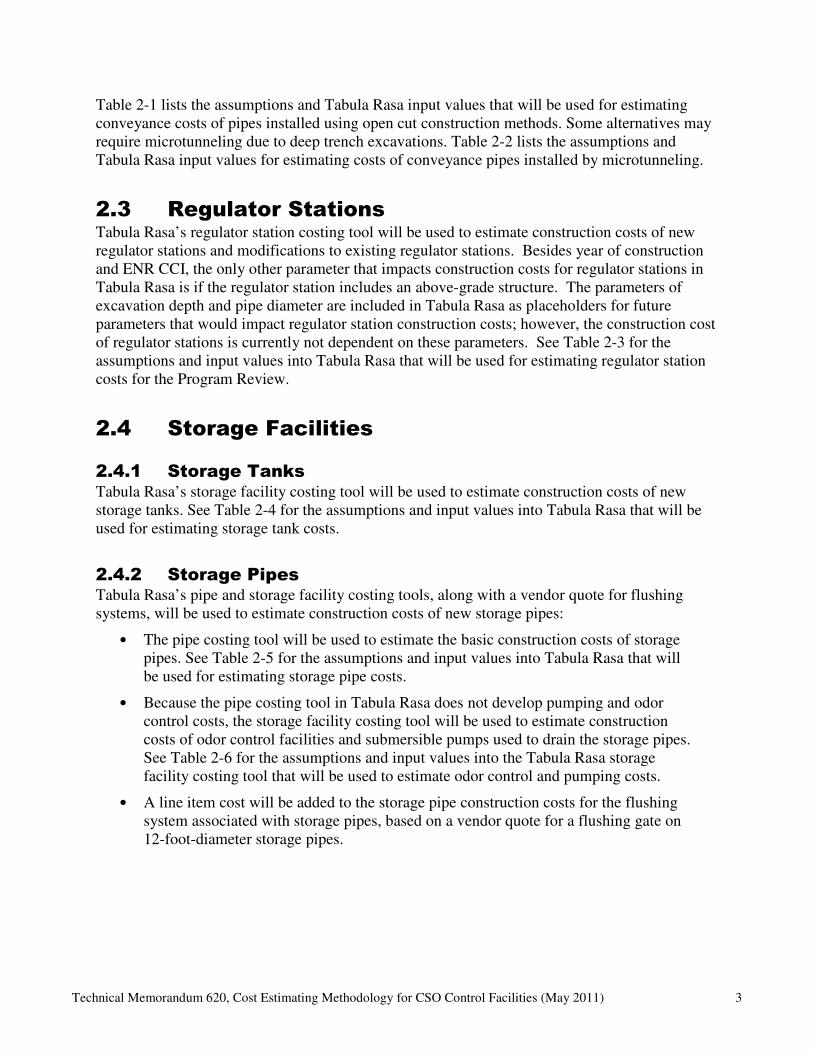
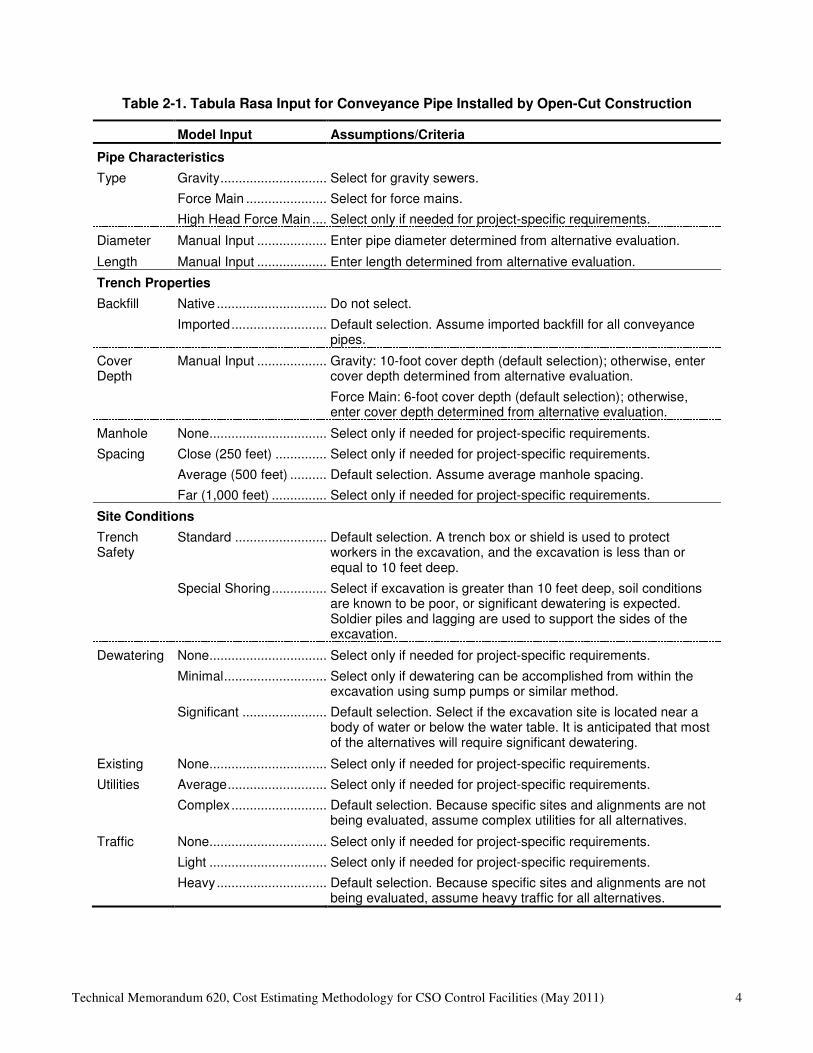
Table 2-1 lists the assumptions and Tabula Rasa input values that will be used for estimating conveyance costs of pipes installed using open cut construction methods. Some alternatives may require microtunneling due to deep trench excavations. Table 2-2 lists the assumptions and Tabula Rasa input values for estimating costs of conveyance pipes installed by microtunneling.
2.3 Regulator Stations Tabula Rasa’s regulator station costing tool will be used to estimate construction costs of new regulator stations and modifications to existing regulator stations. Besides year of construction and ENR CCI, the only other parameter that impacts construction costs for regulator stations in Tabula Rasa is if the regulator station includes an above-grade structure. The parameters of excavation depth and pipe diameter are included in Tabula Rasa as placeholders for future parameters that would impact regulator station construction costs; however, the construction cost of regulator stations is currently not dependent on these parameters. See Table 2-3 for the assumptions and input values into Tabula Rasa that will be used for estimating regulator station costs for the Program Review.
2.4 Storage Facilities
2.4.1 Storage Tanks Tabula Rasa’s storage facility costing tool will be used to estimate construction costs of new storage tanks. See Table 2-4 for the assumptions and input values into Tabula Rasa that will be used for estimating storage tank costs.
2.4.2 Storage Pipes Tabula Rasa’s pipe and storage facility costing tools, along with a vendor quote for flushing systems, will be used to estimate construction costs of new storage pipes:
• The pipe costing tool will be used to estimate the basic construction costs of storage pipes. See Table 2-5 for the assumptions and input values into Tabula Rasa that will be used for estimating storage pipe costs.
• Because the pipe costing tool in Tabula Rasa does not develop pumping and odor control costs, the storage facility costing tool will be used to estimate construction costs of odor control facilities and submersible pumps used to drain the storage pipes. See Table 2-6 for the assumptions and input values into the Tabula Rasa storage facility costing tool that will be used to estimate odor control and pumping costs.
• A line item cost will be added to the storage pipe construction costs for the flushing system associated with storage pipes, based on a vendor quote for a flushing gate on 12-foot-diameter storage pipes.
Technical Memorandum 620, Cost Estimating Methodology for CSO Control Facilities (May 2011) 4
Table 2-1. Tabula Rasa Input for Conveyance Pipe Installed by Open-Cut Construction
Model Input Assumptions/Criteria
Pipe Characteristics
Type Gravity ................................Select for gravity sewers.
Force Main ................................Select for force mains.
High Head Force Main ............................Select only if needed for project-specific requirements.
Diameter Manual Input ................................Enter pipe diameter determined from alternative evaluation.
Length Manual Input ................................Enter length determined from alternative evaluation.
Trench Properties
Backfill Native ................................Do not select.
Imported ................................Default selection. Assume imported backfill for all conveyance pipes.
Cover Depth
Manual Input ................................Gravity: 10-foot cover depth (default selection); otherwise, enter cover depth determined from alternative evaluation.
Force Main: 6-foot cover depth (default selection); otherwise, enter cover depth determined from alternative evaluation.
Manhole None................................ Select only if needed for project-specific requirements.
Spacing Close (250 feet) ................................Select only if needed for project-specific requirements.
Average (500 feet) ................................Default selection. Assume average manhole spacing.
Far (1,000 feet) ................................Select only if needed for project-specific requirements.
Site Conditions
Trench Safety
Standard ................................Default selection. A trench box or shield is used to protect workers in the excavation, and the excavation is less than or equal to 10 feet deep.
Special Shoring ................................Select if excavation is greater than 10 feet deep, soil conditions are known to be poor, or significant dewatering is expected. Soldier piles and lagging are used to support the sides of the excavation.
Dewatering None................................ Select only if needed for project-specific requirements.
Minimal ................................Select only if dewatering can be accomplished from within the excavation using sump pumps or similar method.
Significant ................................Default selection. Select if the excavation site is located near a body of water or below the water table. It is anticipated that most of the alternatives will require significant dewatering.
Existing None................................ Select only if needed for project-specific requirements.
Utilities Average ................................Select only if needed for project-specific requirements.
Complex ................................Default selection. Because specific sites and alignments are not being evaluated, assume complex utilities for all alternatives.
Traffic None................................ Select only if needed for project-specific requirements.
Light ................................ Select only if needed for project-specific requirements.
Heavy ................................Default selection. Because specific sites and alignments are not being evaluated, assume heavy traffic for all alternatives.

Technical Memorandum 620, Cost Estimating Methodology for CSO Control Facilities (May 2011) 5
Table 2-1 (continued). Tabula Rasa Input for Conveyance Pipe Installed by Open-Cut Construction
Model Input Assumptions/Criteria
Site Conditions (continued)
Required Easement
None................................ Select for all conveyance pipes. Easement acquisition will not be estimated using Tabula Rasa. See Chapter 3 for details about estimating easement acquisition costs for the Program Review.
Residential ................................Do not select.
Industrial ................................Do not select.
Office/Commercial ................................Do not select.
Easement Adjustment
Seattle ................................Select Seattle for all conveyance pipes.
Land Acquisition
None................................ Select for all conveyance pipes. Land acquisition will not be estimated using Tabula Rasa. See Section 3 for details about estimating land acquisition costs for the Program Review.
Pavement None................................ Do not select.
Restoration Trench Width ................................Do not select.
Half Width ................................• Arterial (22’) • Collector Street (18’) • Residential Street
(14’)
Select for all pipes 36 inches in diameter or less. Select appropriate roadway type based on the predominant type of street within the potential site boundary.
Full Width ................................• Arterial (44’) • Collector Street (36’) • Residential Street
(28’)
Select for all pipes greater than 36 inches in diameter. Select appropriate roadway type based on the predominant type of street within the potential site boundary.
Additional Costs
Manual Input ................................Include additional large item costs that were not accounted for in the construction cost estimated with Tabula Rasa.

Technical Memorandum 620, Cost Estimating Methodology for CSO Control Facilities (May 2011) 6
Table 2-2. Tabula Rasa Input for Conveyance Pipe Installed by Microtunneling
Model Input Assumptions/Criteria
Geometry
Diameter Manual Input ................................Enter diameter determined from alternative evaluation.
Length Manual Input ................................Enter length determined from alternative evaluation.
Casing Yes ................................Select only if needed for project-specific requirements.
Required No ................................Default selection.
Launch Shaft
Excavation Depth
Manual Input ................................Enter excavation depth determined from alternative evaluation.
Existing None ................................Select only if needed for project-specific requirements.
Utilities Average ................................Select only if needed for project-specific requirements.
Complex ................................Default selection. Because specific sites and alignments are not being evaluated, assume complex utilities for all alternatives.
Surface Restoration
None ................................Select only if special additional unit cost for surface restoration is used.
Hydroseed ................................Select if excavation is outside of urban area and pavement restoration is not anticipated.
Pavement ................................Select if excavation is in urban area with existing pavement.
Retrieval Shaft
Excavation Depth
Manual Input ................................Enter excavation depth determined from alternative evaluation.
Existing None ................................Select only if needed for project-specific requirements.
Utilities Average ................................Select only if needed for project-specific requirements.
Complex ................................Default selection. Because specific sites and alignments are not being evaluated, assume complex utilities for all alternatives.
Surface Restoration
None ................................Select only if special additional unit cost for surface restoration is used.
Hydroseed ................................Select if excavation is outside of urban area, and pavement restoration is not anticipated.
Pavement ................................Select if excavation is in urban area with existing pavement.
Site Conditions
Dewatering None ................................Select only if needed for project-specific requirements.
Minimal ................................Select only if dewatering can be accomplished from within the excavation using sump pumps or similar method.
Significant ................................Default selection. Select if the excavation site is located near a body of water or below the water table. It is anticipated that most of the alternatives will require significant dewatering.
Required Easement
None ................................Select for all conveyance pipes. Easement acquisition will not be estimated using Tabula Rasa. See Section 3 for details about estimating easement acquisition costs for the Program Review.
Residential ................................Do not select.
Industrial ................................Do not select.
Office/Commercial ................................Do not select.
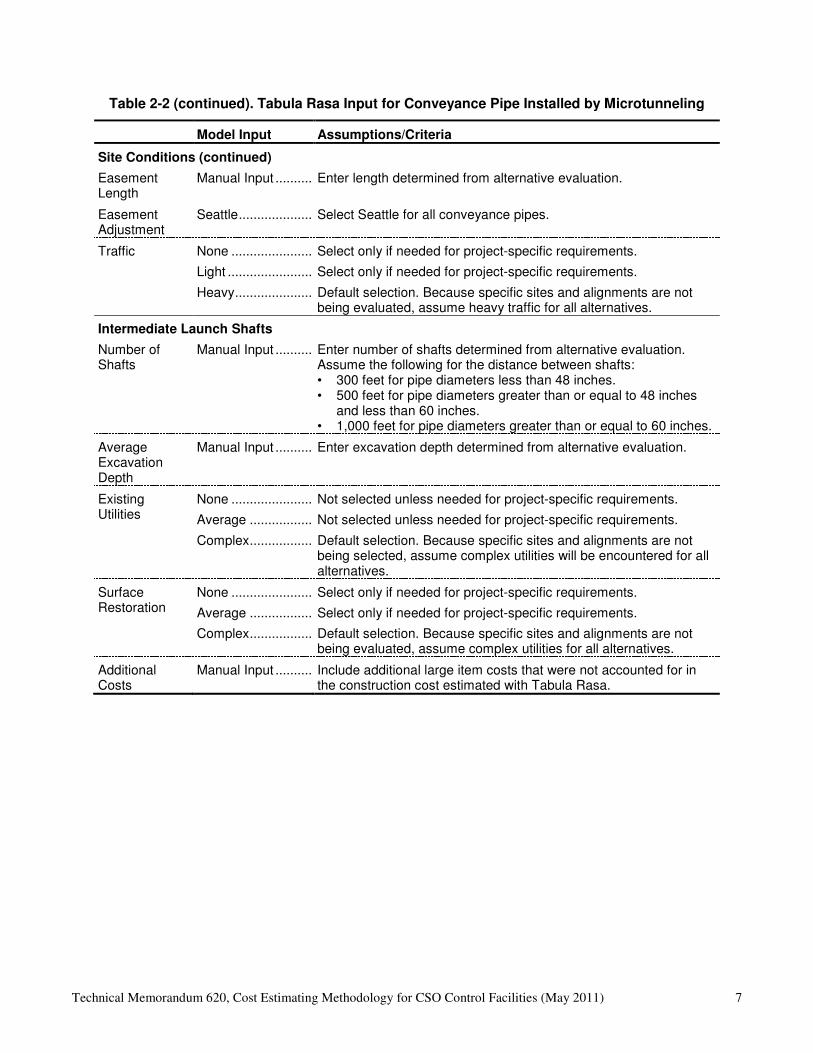
Technical Memorandum 620, Cost Estimating Methodology for CSO Control Facilities (May 2011) 7
Table 2-2 (continued). Tabula Rasa Input for Conveyance Pipe Installed by Microtunneling
Model Input Assumptions/Criteria
Site Conditions (continued)
Easement Length
Manual Input ................................Enter length determined from alternative evaluation.
Easement Adjustment
Seattle ................................Select Seattle for all conveyance pipes.
Traffic None ................................Select only if needed for project-specific requirements.
Light ................................Select only if needed for project-specific requirements.
Heavy ................................Default selection. Because specific sites and alignments are not being evaluated, assume heavy traffic for all alternatives.
Intermediate Launch Shafts
Number of Shafts
Manual Input ................................Enter number of shafts determined from alternative evaluation. Assume the following for the distance between shafts: • 300 feet for pipe diameters less than 48 inches. • 500 feet for pipe diameters greater than or equal to 48 inches
and less than 60 inches. • 1,000 feet for pipe diameters greater than or equal to 60 inches.
Average Excavation Depth
Manual Input ................................Enter excavation depth determined from alternative evaluation.
Existing Utilities
None ................................Not selected unless needed for project-specific requirements.
Average ................................Not selected unless needed for project-specific requirements.
Complex ................................Default selection. Because specific sites and alignments are not being selected, assume complex utilities will be encountered for all alternatives.
Surface Restoration
None ................................Select only if needed for project-specific requirements.
Average ................................Select only if needed for project-specific requirements.
Complex ................................Default selection. Because specific sites and alignments are not being evaluated, assume complex utilities for all alternatives.
Additional Costs
Manual Input ................................Include additional large item costs that were not accounted for in the construction cost estimated with Tabula Rasa.

Technical Memorandum 620, Cost Estimating Methodology for CSO Control Facilities (May 2011) 8
Table 2-3. Tabula Rasa Input for Regulator Stations
Model Input Assumptions/Criteria
Excavation Depth
Manual Input ................................Not used. Excavation depth was incorporated into the recent update of Tabula Rasa as a placeholder for a future parameter that would impact regulator station construction costs; however, the construction cost of regulator stations is currently not dependent on this parameter. Further research is required.
Pipe Diameter
Manual Input ................................Not used. Pipe diameter was incorporated into the recent update of Tabula Rasa as a placeholder for a future parameter that would impact regulator station construction costs; however, the construction cost of regulator stations is currently not dependent on this parameter. Further research is required.
Above Grade Yes ................................Select for all regulator stations.
Structure No ...........................................................Do not select.
Table 2-4. Tabula Rasa Input for Storage Tanks
Model Input Assumptions/Criteria
Operations
Storage Capacity
Manual Input ................................Enter storage volume determined from hydraulic modeling.
Outflow Gravity ................................Do not select.
Type Pump ................................Select pump outflow to drain the storage tank. This selection estimates costs of submersible pumps within the structure of the storage tank instead of estimating costs of a separate pump station structure.
Odor Yes ..........................................................Default selection. Odor control is assumed for all storage tanks.
Control No ............................................................Do not select.
Site Conditions
Footprint Manual Input ................................Enter total footprint area for storage tank, odor control facility, and electrical/controls/standby generator room as estimated from alternative evaluation.
Land Acquisition
None ................................Select for all storage facilities. Land acquisition will not be estimated using Tabula Rasa. See Section 3 for details about estimating land acquisition costs for the Program Review.
Surface Restoration
None ................................Select only if special additional unit cost for surface restoration is used.
Hydroseed ................................Select if excavation is outside of urban area and pavement restoration is not anticipated.
Pavement ................................Select if excavation is in urban area with existing pavement.

Technical Memorandum 620, Cost Estimating Methodology for CSO Control Facilities (May 2011) 9
Table 2-4 (continued). Tabula Rasa Input for Storage Tanks
Model Input Assumptions/Criteria
Site Conditions (continued)
Dewatering None ................................Select only if needed for project-specific requirements.
Minimal ................................Select only if dewatering can be accomplished from within the excavation using sump pumps or similar method.
Significant ................................Default selection. Select if the excavation site is located near a body of water or below the water table. It is anticipated that most of the alternatives will require significant dewatering.
Construction Cast-in-Place ................................Default selection.
Type Precast ................................Do not select.
Additional Costs
Manual Input ................................Include additional large item costs that were not accounted for in the construction cost estimated with Tabula Rasa.
Table 2-5. Tabula Rasa Input for Storage Pipes
Model Input Assumptions/Criteria
Pipe Characteristics
Type Gravity ................................Select for storage pipes.
Force Main ................................Do not select.
High Head Force Main ............................Do not select.
Diameter Manual Input ................................Enter 144 inches in pipe diameter.
Length Manual Input ................................Enter length determined from alternative evaluation.
Trench Properties
Backfill Native ......................................................Do not select.
Imported ................................Default selection. Assume imported backfill for all conveyance pipes.
Cover Depth
Manual Input ................................Enter 15-foot cover depth.
Manhole None........................................................Do not select.
Spacing Close (250 feet) ................................Do not select.
Average (500 feet) ................................Default selection. Assume average manhole spacing.
Far (1,000 feet) ................................Do not select.
Site Conditions
Trench Standard ................................Do not select.
Safety Special Shoring ................................Select for all storage pipes.
Dewatering None........................................................Do not select.
Minimal ................................Do not select.
Significant ................................Select for all storage pipes. It is anticipated that most of the alternatives will require significant dewatering.
Technical Memorandum 620, Cost Estimating Methodology for CSO Control Facilities (May 2011) 10
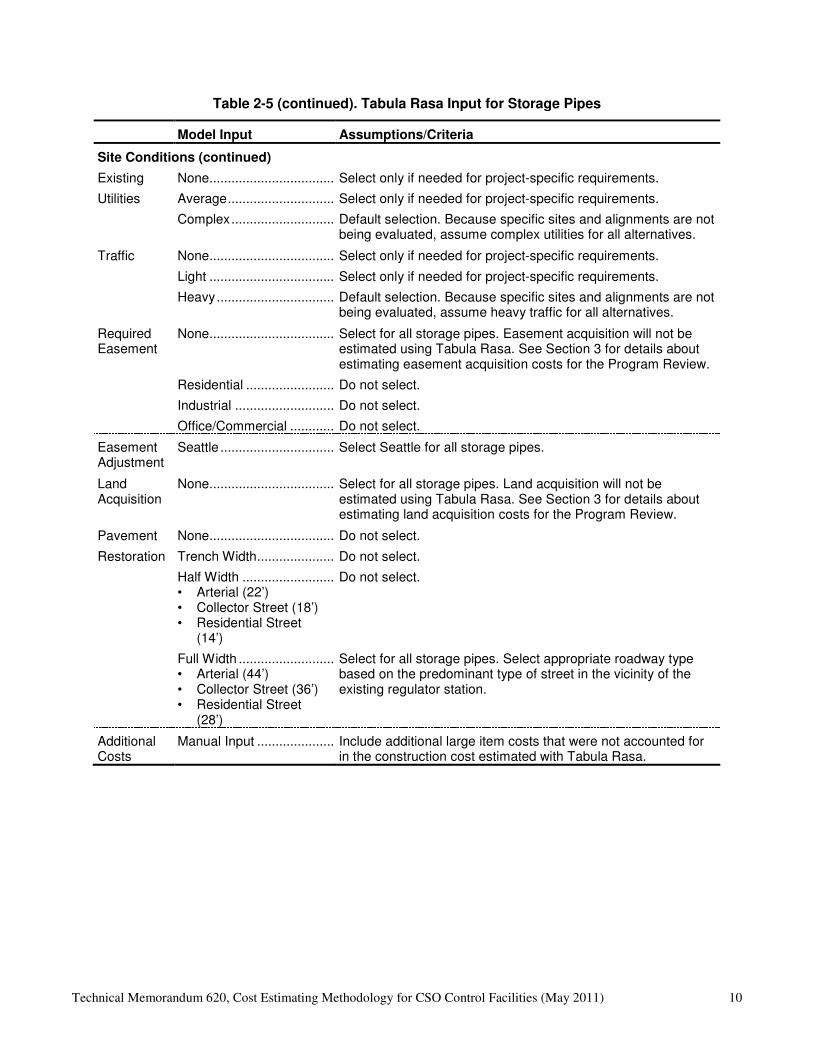
Table 2-5 (continued). Tabula Rasa Input for Storage Pipes
Model Input Assumptions/Criteria
Site Conditions (continued)
Existing None........................................................Select only if needed for project-specific requirements.
Utilities Average ................................Select only if needed for project-specific requirements.
Complex ................................Default selection. Because specific sites and alignments are not being evaluated, assume complex utilities for all alternatives.
Traffic None........................................................Select only if needed for project-specific requirements.
Light ........................................................Select only if needed for project-specific requirements.
Heavy ......................................................Default selection. Because specific sites and alignments are not being evaluated, assume heavy traffic for all alternatives.
Required Easement
None........................................................Select for all storage pipes. Easement acquisition will not be estimated using Tabula Rasa. See Section 3 for details about estimating easement acquisition costs for the Program Review.
Residential ................................Do not select.
Industrial ................................Do not select.
Office/Commercial ................................Do not select.
Easement Adjustment
Seattle ................................Select Seattle for all storage pipes.
Land Acquisition
None........................................................Select for all storage pipes. Land acquisition will not be estimated using Tabula Rasa. See Section 3 for details about estimating land acquisition costs for the Program Review.
Pavement None........................................................Do not select.
Restoration Trench Width ................................Do not select.
Half Width ................................• Arterial (22’) • Collector Street (18’) • Residential Street
(14’)
Do not select.
Full Width ................................• Arterial (44’) • Collector Street (36’) • Residential Street
(28’)
Select for all storage pipes. Select appropriate roadway type based on the predominant type of street in the vicinity of the existing regulator station.
Additional Costs
Manual Input ................................Include additional large item costs that were not accounted for in the construction cost estimated with Tabula Rasa.

Technical Memorandum 620, Cost Estimating Methodology for CSO Control Facilities (May 2011) 11
Table 2-6. Tabula Rasa Input for Odor Control Facility and Submersible Pumps for Storage Pipes
Model Input Assumptions/Criteria
Operations
Storage Capacity
Manual Input ................................Enter storage volume determined from hydraulic modeling. If storage volume is less than 0.5 million gallons (MG), which is the minimum volume for Tabula Rasa, enter 0.5 MG and calculate the unit construction cost per MG. Multiply the estimated storage volume by this unit construction cost to estimate construction cost.
Outflow Gravity ................................Do not select.
Type Pump ................................Select pump outflow to drain the storage pipe.
Odor Yes ..........................................................Default selection. Odor control is assumed for all storage pipes.
Control No ............................................................Do not select.
Site Conditions
Footprint Manual Input ................................Enter total footprint area for storage pipe, odor control facility, vaults, and electrical/controls/standby generator room as estimated from alternative evaluation.
Land Acquisition
None ................................Select for all storage facilities. Land acquisition will not be estimated using Tabula Rasa. See Section 3 for details about estimating land acquisition costs for the Program Review.
Surface Restoration
None ................................Select only if special additional unit cost for surface restoration is used.
Hydroseed ................................Select if excavation is outside of urban area and pavement restoration is not anticipated.
Pavement ................................Select if excavation is in urban area with existing pavement.
Dewatering None ................................Do not select.
Minimal ................................Do not select.
Significant ................................Select for all storage pipes. It is anticipated that most of the alternatives will require significant dewatering.
Construction Cast-in-Place ................................Do not select.
Type Precast ................................Select for all storage pipes.
Additional Costs
Manual Input ................................Include additional large item costs that were not accounted for in the construction cost estimated with Tabula Rasa.

Technical Memorandum 620, Cost Estimating Methodology for CSO Control Facilities (May 2011) 12
2.5 Wet-Weather Treatment Facilities For wet-weather treatment facility alternatives evaluated in the Program Review, cost estimates will be developed using cost curves that show the expected cost for such facilities based on the treatment peak flow rate, which is the equalized peak flow rate determined from the optimum capacity assessment (described in the Technical Memorandum 970, CSO Control Alternatives
Development). These cost curves have been developed for the two types of CSO treatment processes selected for consideration in the Program Review:
• Ballasted sedimentation.
• Chemically enhanced primary treatment (CEPT) with lamella plates.
For each type of facility, total cost curves were developed by summing the curves for individual system components. The Omaha CSO cost tool was used for the treatment process component. Tabula Rasa and other specialized methodologies were used for other components. The development and validation of cost curves for each type of CSO treatment process is described in Appendix A. Results are presented in the following sections.
2.5.1 Ballasted Sedimentation Figure 2-1 shows the cost curves developed for ballasted sedimentation. The figure shows curves for individual components of the treatment facility, as well as total estimated construction cost. Table 2-7 provides best-fit equations for each curve. To develop construction cost estimates for a ballasted sedimentation treatment facility alternative, use the treatment peak flow rate determined from the alternative evaluation and the curve or equation for total construction costs in Figure 2-1 or Table 2-7.
$0
$20,000,000
$40,000,000
$60,000,000
$80,000,000
$100,000,000
$120,000,000
0 50 100 150 200 250 300
Co
nst
ruct
ion
Co
sts
(20
10
Do
lla
rs)
Peak Flow Rate (mgd)
Total Construction Cost
Ballasted Sedimentation Process
Influent Pump Station
Solids Handling Facility
Grit Removal Facility
Regulator Station
Total Construction Costs,
y = -441.60x2 + 503,118.57x + 6,866,939.90
Figure 2-1. Construction Costs for Ballasted Sedimentation Treatment Facilities

Technical Memorandum 620, Cost Estimating Methodology for CSO Control Facilities (May 2011) 13
Table 2-7. Cost Equations for Ballasted Sedimentation Treatment Facility
Component Construction Cost Equationa (2010 Dollars)
Ballasted Sedimentation Construction Cost = -308.06x2 + 248,995.12x + 5,012,751.25
Influent Pump Station Construction Cost = -133.54x2 + 212,088.62x + 979,951.34
Solids Handling Facility Construction Cost = 34,273.93x + 389,237.31
Grit Removal Facility Construction Cost = 7,760.90x
Regulator Station Construction Cost = 485,000
Total of All Components Construction Cost = -441.60x2 + 503,118.57x + 6,866,939.90
a. x = Peak flow rate in million gallons per day
2.5.2 CEPT with Lamella Plates For wet-weather treatment facilities using CEPT with lamella plates, cost curves based on treatment peak flow rate were developed for all components except the separate solids handling facility. Cost estimates for alternatives using this CSO treatment process will consist of estimates based on project location for the solids handling facility and estimates based on peak flow rates for all other components.
Solids Handling Facility Cost
The CEPT settling basin can store some solids. It was assumed that the basin would store approximately 5 to 7 feet of solids during peak wet-weather events. In order to determine the additional solids handling volume required, it was necessary to calculate the solids generated in each of the ten wet-weather treatment alternatives. Line item costs for solids handling facilities were then calculated for each alternative, as described in Appendix A and shown in Table 2-8.
Total Cost for All Other Components
Figure 2-2 shows the cost curves developed for a wet-weather treatment facility using CEPT with lamella plates. The figure shows curves for all individual components of the treatment facility except the separate solids handling facility, as well as total estimated construction cost for the components shown. Table 2-9 provides best-fit equations for each curve.
Total Wet-Weather Treatment Facility Cost
Cost estimates for wet-weather treatment facilities using CEPT with lamella plates will be developed as follows:
• Determine the cost for the solids handling facility from Table 2-8.
• Determine the total construction cost excluding the solids handling facility using the treatment peak flow rate determined from the alternative evaluation and the cost curve or equation for total construction costs presented in Figure 2-2 or Table 2-9.
• Add the two cost estimate components to determine total estimated construction cost.

Technical Memorandum 620, Cost Estimating Methodology for CSO Control Facilities (May 2011) 14
Table 2-8. Solids Handling Construction Costs for CEPT with Lamella Plates
Wet-Weather Treatment Facility Alternative
Solids Handling Facility Construction Cost (2010 Dollars)
Brandon St $249,600
S Michigan St $2,355,000
S Michigan St and Brandon St $1,902,840
Hanford #2 $2,091,240
Lander St $976,560
Kingdome $1,915,400
King St/Kingdome $1,483,620
Hanford #2/Lander St $3,026,960
Hanford #2/Lander St/Kingdome $4,840,000
Hanford #2/Lander St/Kingdome/King St $4,440,000
Figure 2-2. Construction Costs for CEPT with Lamella Plates, Excluding Solids Handling Facilities
Table 2-9. Cost Equations for Wet-Weather Treatment Facility Using CEPT with Lamella Plates, Excluding Solids Handling Facility
Component Construction Cost Equationa (2010 Dollars)
CEPT Construction Cost = -320.37x2 + 228,220.40x + 3,886,640.69
Influent Pump Station Construction Cost = -133.54x2 + 212,088.62x + 979,951.34
Lamella Plates Construction Cost = 21,052.12x
Regulator Station Construction Cost = 485,000
Total (Excluding Solids Handling) Construction Cost = -453.91x2 + 461,361.14x + 5,351,592.03
a. x = Peak flow rate in million gallons per day

Technical Memorandum 620, Cost Estimating Methodology for CSO Control Facilities (May 2011) 15
2.6 Outfall Pipes For the alternatives evaluation (cost estimates presented in Technical Memorandum 970, CSO
Control Alternatives Development), a unit cost of $60/in-diameter/linear foot is assumed for construction of new CSO outfalls or extensions to existing CSO outfalls.
This cost estimating methodology may be refined following the evaluation of wet-weather treatment facility CSO outfall options in the Duwamish waterways. The outfall evaluation will include the preparation of the CSO Treatment Plant Outfall Evaluation TM, which will include outfall design concepts and outfall cost estimates for the wet-weather treatment facility alternatives.
2.7 Green Stormwater Infrastructure Green stormwater infrastructure (GSI) strategies generally are not enough to eliminate CSOs by themselves, but by reducing the volume of runoff close to the sources, they can help reduce the size of more expensive control measures downstream. The Program Review evaluates the GSI approach separately from the evaluation of alternatives developed from other CSO control approaches. It is assumed that most alternatives have opportunities for a GSI component that could reduce the size of the CSO control facility, but the facility size is not reduced as part of this Program Review because additional monitoring and modeling is needed. Future evaluations will consider the benefits and costs of GSI techniques in corresponding CSO basins to reduce the sizes of CSO control facilities. Cost estimates for GSI techniques developed for the Program Review will be used to help guide GSI strategies in future evaluations. Additional information on the GSI evaluation is included in Technical Memorandum 800, Green Stormwater
Infrastructure Feasibility Evaluation.
Construction and incentive costs are assumed to be paid by King County for the Program Review. Construction costs were developed for the following green stormwater infrastructure (GSI) strategies:
• In-street Bioretention – Strategy would be designed and built by the King County Wastewater Treatment Division.
• Residential Rainwise – This is a residential incentive program that would offer rebates to property owners for installing rain cisterns and rain gardens on their property.
• Commercial/Industrial Rainwise – This is a commercial/industrial incentive program that would offer rebates to property owners for installing rain cisterns, permeable pavement, green roofs, and rain gardens on their property.
• Green Schools – This is a private/public school incentive program that would offer rebates to build and maintain rain gardens on school properties.
The methodology and assumptions used to estimate construction and incentive costs for these GSI strategies in the Program Review were documented in a memorandum that is included in Appendix B.
Technical Memorandum 620, Cost Estimating Methodology for CSO Control Facilities (May 2011) 16
2.8 Sewer Separation Sewer separation is under consideration for only one King County CSO Basin—the Brandon St CSO Basin. Cost estimates will not be needed for any other sewer separation alternatives, so base construction cost estimates for the proposed Brandon alternative were directly developed as part of this technical memorandum. A validation of the estimate was also performed.
2.8.1 Brandon Sewer Separation Project Cost Estimate The estimated construction cost for the Brandon sewer separation project includes four components, calculated as follows:
• New sewers—Costs were estimated in the conveyance pipe costing tool of Tabula Rasa using the following input:
– Construction year: 2010
– ENR CCI: 8645.35
– Type: Force main
– Diameter: 8-inch (this is the minimum size available in Tabula Rasa; actual proposed pipe diameter is 4 inches; sewer cost estimate adjusted by ratio of pipe sizes)
– Length: 27,200 feet
– Backfill: Imported
– Cover Depth: 4 feet
– Dewatering: Significant.
• Vacuum system—A vendor quote for the proposed vacuum system was provided by Air-Vac, based on the following system criteria:
– Central vacuum system consisting of three 25-hp pumps, equalization tank, and generator
– Enclosed building, 50 feet by 50 feet
– Electrical/instrumentation.
• Side sewer connections—A unit cost per connection was derived from previous King County project experience and applied to the Brandon sewer separation project:
– Average cost per connection: $30,000
– Number of connections for Brandon project: 250
• Stormwater treatment cost—A construction cost of approximately $17.21 million was estimated for stormwater treatment. This estimate was based on using GSI strategies in the Brandon St CSO Basin, using the methodology described in Section 2.7.
The resulting estimated construction cost for the Brandon sewer separation project is approximately $34.19 million.

Technical Memorandum 620, Cost Estimating Methodology for CSO Control Facilities (May 2011) 17
2.8.2 Brandon Sewer Separation Project Cost Validation The validity of the Brandon sewer separation construction cost estimate was checked by developing a unit cost per foot of installed sewer and comparing it to unit costs from previously-implemented separation projects. Costs for the other projects used in the comparison do not include stormwater treatment, so the stormwater treatment cost component was removed from the Brandon sewer separation project cost estimate before developing unit costs. The total estimated construction cost for the Brandon sewer separation project without stormwater treatment is approximately $16.98 million. The other projects were escalated to January 2010 using the ENR CCI. Table 2-10 presents the sewer separation cost comparison.
Table 2-10. Sewer Separation Unit Construction Cost Comparison
Project Total Length of Sewer
(feet) Cost per foot (2010
Dollars)
Lansing, Michigan 219,198 $469
Port Huron, Michigan 77,195 $343
West Street, New York 3,812 $849
Onondaga Creek n/a $647
St Paul, Minnesota 3,168,000 $162
Average $494
Brandon Sewer Separation 27,200 $624
The unit cost for the Brandon sewer separation project without stormwater treatment is approximately $624 per foot of installed sewer. The average estimated cost for sewer separation for the previous projects is approximately $494 per foot. These projects generally were implemented in residential right-of-way. The Brandon sewer separation project would be implemented in a busy commercial area, with multiple side sewer connections within commercial parcels. It is therefore reasonable that unit costs for the Brandon sewer separation project would be slightly higher.
2.9 Seattle Department of Transportation Street
Use Permit Fees A Street Use Permit is required from the Seattle Department of Transportation (SDOT) for any work or occupation in the public rights-of-way to minimize impacts to mobility. As part of this strategy, SDOT charges fees for the temporary use of the right-of-way for purposes other than public use, which includes construction projects by the King County Wastewater Treatment Division. SDOT Street Use Permit fees accrue based on the amount of area occupied within the public right-of-way, the duration that the area within the public right-of-way is impacted, and the type of street impacted. SDOT Street Use Permit fees can be minimized by phasing construction and limiting the duration areas would be impacted as well as limiting construction to non-arterial streets.

Technical Memorandum 620, Cost Estimating Methodology for CSO Control Facilities (May 2011) 18
For the Program Review, SDOT Street Use Permit fees are estimated for installation of conveyance pipes, influent and effluent gravity sewers, force mains, regulator stations, storage pipes, and vacuum sewers – all of which are assumed to be located below-grade in public right-of-way.
As part of the Program Review, King County identified broad potential project areas rather than specific sites for the alternatives. Specific alignments for conveyance pipes, influent and effluent gravity sewers, force mains, and storage pipes were not identified. Thus, general assumptions were used for the Program Review to estimate SDOT Street Use Permit fees for alternatives. SDOT Street Use Permit fees can be refined during preferred alternative development when specific alignments are identified, and different approaches to phasing construction are considered. The following assumptions were used for the Program Review to estimate SDOT Street Use Permit fees for alternatives.
• Construction occurs during five working days per week. Fees are accrued during the two non-working days per week if construction areas in public right-of-way remain closed.
• Construction is located on arterial streets.
• Closure of construction area will occur in phases. Installation of pipe will occur in 1,000-ft segments.
• Production rate for conveyance pipes, influent and effluent gravity sewers, and force mains will be 15 linear feet per working day. This production rate includes the time that the construction area will be closed, including installation and full restoration.
• Production rate for 12-foot-diameter storage pipes will be 8 linear feet per working day. This production rate includes the time that the construction area will be closed, including installation and full restoration.
• For pipe diameters less than or equal to 36 inches in diameter, assume half width of road will be closed during construction (22-foot width).
• For pipe diameters greater than 36 inches in diameter, assume full width of road will be closed during construction (44-foot width).
• Regulator stations will require the public right-of-way to be closed for two months for installation and full restoration.

This page left blank intentionally.

Technical Memorandum 620, Cost Estimating Methodology for CSO Control Facilities (May 2011) 19
3. PROJECT COST
Project costs are estimated as the sum of the construction costs, determined as described in Section 2, and the land costs, allied costs, and contingency described in the sections below.
3.1 Land Costs A market-based approach was used to estimate property values in the County’s uncontrolled CSO basins. The market-based approach uses sales data of properties that have sold over a specific time period to estimate values for similar properties. This approach provides an assessment of values as influenced by current market conditions. Property sales information was obtained from CoStar COMPS, a commercial database of verified property sales commonly used by commercial real estate appraisers. In some cases, the values were compared to King County’s assessed values; however, the King County Assessor’s office did not provide full information necessary for the comparative analysis. Sale data for representative sites in each basin were collected and compared to develop a range and average value (cost/square foot). The following criteria were used to find representative sites:
• Industrial sites: Industrial land was selected since the projects are likely to be in industrial zones. It is possible that some future facilities may be in commercial zones; however, industrial zoning appears to be more representative for most of the uncontrolled CSO basins.
• Minimum size: A minimum size of 50,000 square feet was used for the search. If a larger site was sold recently, it would appear in the search.
• Sales period: The period from January 1, 2007 to August 31, 2010 was selected. Sensitivity runs indicated that a 3-year time period provides sufficient value ranges.
• Search radius: Searches for sold properties were based on a 3-mile radius from King County’s existing regulator stations in each uncontrolled CSO basin. Searches for properties within a one-mile radius did not generate sufficient sales to determine a credible range of values. A five-mile radius search criteria resulted in too many sales.
Sales by basin were collected using the above criteria. Sales with the following characteristics were eliminated from the analysis because they are considered to be not representative of typical sales:
• Sales that involved relatives, principals of the same company, or different companies that have the same owner (prices for these sales may not be market-driven)
• Title vesting changes listed as sales (e.g., a private owner transfers a property to a corporation of which he or she is the president)
• Transfers from one governmental agency to another, documented in a memorandum of agreement (e.g., when the Washington Department of Transportation transfers a property to the City of Seattle as part of an infrastructure improvement project; the value exchanged may include factors that are not market-driven)

Technical Memorandum 620, Cost Estimating Methodology for CSO Control Facilities (May 2011) 20
• Sales at an unusually low or high price per square foot based on comparable sales (e.g., one sale showed BNSF Railway paying approximately $0.49/square foot for vacant industrial land, approximately one fiftieth of the average sales price per square foot for most other sales of industrial vacant land in the same basin).
Two value ranges were determined: one for “land only” and another for “land with building.” Based on a preliminary siting assessment, it was determined that property values for this planning project would be based on “land with building” values. The siting search revealed that there is a higher probability that King County will need to acquire land with buildings for the projects, given the scarcity of vacant land and the size of the sites needed. Even though King County may acquire land without buildings for all or part of a project, using the higher property value for cost estimating provides a measure of conservativeness.
Table 3-1 presents the land cost assumptions for each type of CSO control facility. The summary of collected sale data for each uncontrolled CSO basin, including the number of sales and a range and average cost per square foot, are presented in Appendix C.
Table 3-1. Land Cost Assumptions
Components General Assumptions Land Cost Assumptions
Storage Tanks • Storage Tank Located below-grade on
private property.
• 100% of market value, land and building estimate • Basin-dependent
• Odor Control Facility • Electrical/ Controls/
Standby Generator Building
Located above-grade on private property.
• 100% of market value, land and building estimate • Basin-dependent
• Conveyance Piping • Diversion Structure
Located below-grade in street ROW.
• Conveyance Piping Located below-grade on private property.
• 20-foot-wide permanent easement: 30% of market value, land and building estimate
• 40-foot-wide temporary construction easement: 10% of market value, land and building estimate
• Basin-dependent
Storage Pipes • Storage Pipe • End and Intermediate
Flushing Access Structures
• Drain Structure • Valve Vault • Conveyance Piping • Diversion Structure
Located below-grade in street ROW.
• Odor Control Facility • Electrical/ Controls/
Standby Generator Building
Located above-grade on private property.
• 100% of market value, land and building estimate • Basin-dependent
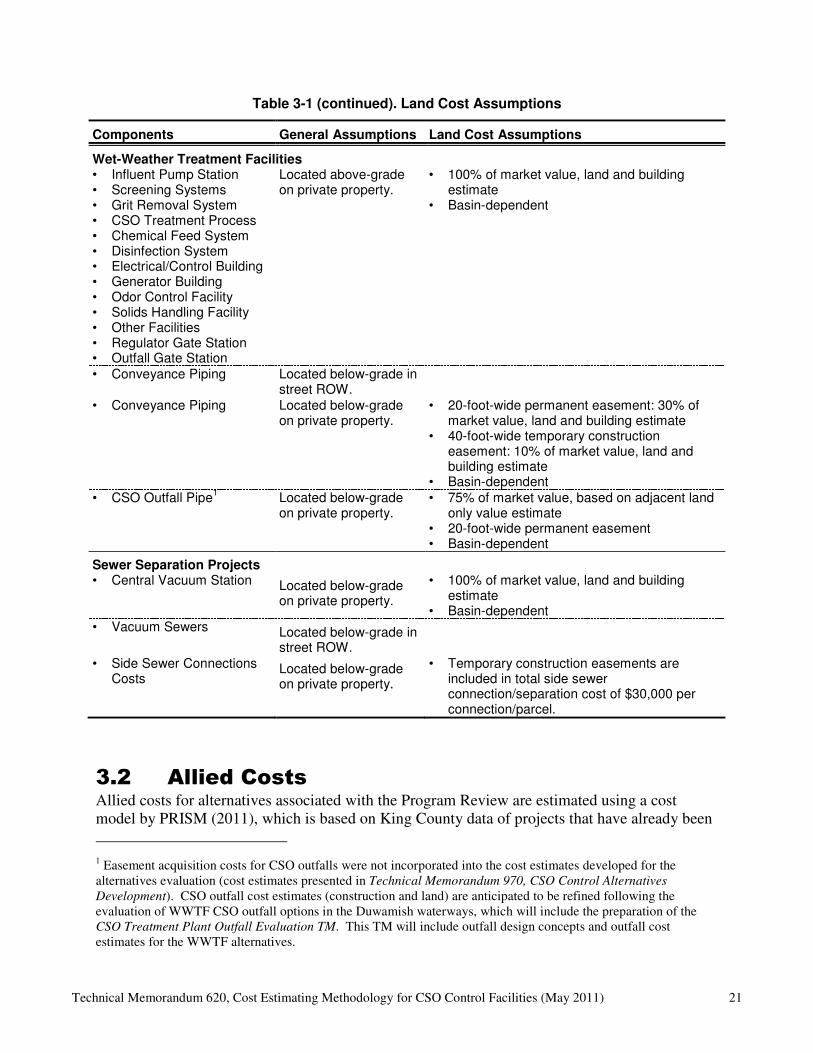
Technical Memorandum 620, Cost Estimating Methodology for CSO Control Facilities (May 2011) 21
Table 3-1 (continued). Land Cost Assumptions
Components General Assumptions Land Cost Assumptions
Wet-Weather Treatment Facilities • Influent Pump Station • Screening Systems • Grit Removal System • CSO Treatment Process • Chemical Feed System • Disinfection System • Electrical/Control Building • Generator Building • Odor Control Facility • Solids Handling Facility • Other Facilities • Regulator Gate Station • Outfall Gate Station
Located above-grade on private property.
• 100% of market value, land and building estimate
• Basin-dependent
• Conveyance Piping Located below-grade in street ROW.
• Conveyance Piping Located below-grade on private property.
• 20-foot-wide permanent easement: 30% of market value, land and building estimate
• 40-foot-wide temporary construction easement: 10% of market value, land and building estimate
• Basin-dependent • CSO Outfall Pipe
1 Located below-grade
on private property. • 75% of market value, based on adjacent land
only value estimate • 20-foot-wide permanent easement • Basin-dependent
Sewer Separation Projects • Central Vacuum Station Located below-grade
on private property.
• 100% of market value, land and building estimate
• Basin-dependent • Vacuum Sewers Located below-grade in
street ROW.
• Side Sewer Connections Costs
Located below-grade on private property.
• Temporary construction easements are included in total side sewer connection/separation cost of $30,000 per connection/parcel.
3.2 Allied Costs Allied costs for alternatives associated with the Program Review are estimated using a cost model by PRISM (2011), which is based on King County data of projects that have already been
1 Easement acquisition costs for CSO outfalls were not incorporated into the cost estimates developed for the alternatives evaluation (cost estimates presented in Technical Memorandum 970, CSO Control Alternatives
Development). CSO outfall cost estimates (construction and land) are anticipated to be refined following the evaluation of WWTF CSO outfall options in the Duwamish waterways, which will include the preparation of the CSO Treatment Plant Outfall Evaluation TM. This TM will include outfall design concepts and outfall cost estimates for the WWTF alternatives.
Technical Memorandum 620, Cost Estimating Methodology for CSO Control Facilities (May 2011) 22
constructed. The cost model is organized by type of construction (treatment, conveyance, or pump station) and the construction cost. The model includes the following components in allied costs:
• Miscellaneous capital costs
• Engineering services
• Planning and management services
• Permitting and other agency support
• Right-of-way services
• Miscellaneous services and materials
• Wastewater Treatment Division support
• King County staff support outside Wastewater Treatment Division (e.g., legal services).
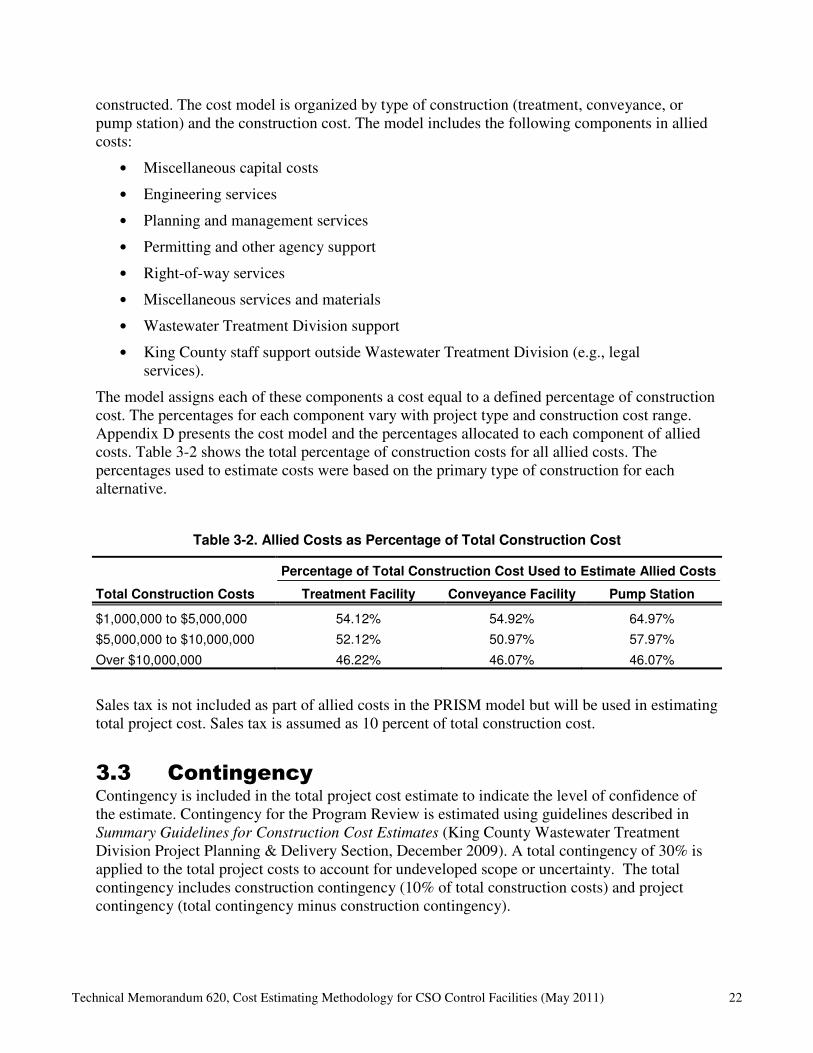
The model assigns each of these components a cost equal to a defined percentage of construction cost. The percentages for each component vary with project type and construction cost range. Appendix D presents the cost model and the percentages allocated to each component of allied costs. Table 3-2 shows the total percentage of construction costs for all allied costs. The percentages used to estimate costs were based on the primary type of construction for each alternative.
Table 3-2. Allied Costs as Percentage of Total Construction Cost
Percentage of Total Construction Cost Used to Estimate Allied Costs
Total Construction Costs Treatment Facility Conveyance Facility Pump Station
$1,000,000 to $5,000,000 54.12% 54.92% 64.97%
$5,000,000 to $10,000,000 52.12% 50.97% 57.97%
Over $10,000,000 46.22% 46.07% 46.07%
Sales tax is not included as part of allied costs in the PRISM model but will be used in estimating total project cost. Sales tax is assumed as 10 percent of total construction cost.
3.3 Contingency Contingency is included in the total project cost estimate to indicate the level of confidence of the estimate. Contingency for the Program Review is estimated using guidelines described in Summary Guidelines for Construction Cost Estimates (King County Wastewater Treatment Division Project Planning & Delivery Section, December 2009). A total contingency of 30% is applied to the total project costs to account for undeveloped scope or uncertainty. The total contingency includes construction contingency (10% of total construction costs) and project contingency (total contingency minus construction contingency).
Technical Memorandum 620, Cost Estimating Methodology for CSO Control Facilities (May 2011) 23
3.4 Total Project Cost Estimate total project cost for each CSO control alternative by totaling the construction cost estimated as described in Section 2 with the land, allied, and contingency costs described in this chapter.

This page left blank intentionally.
Technical Memorandum 620, Cost Estimating Methodology for CSO Control Facilities (May 2011) 24
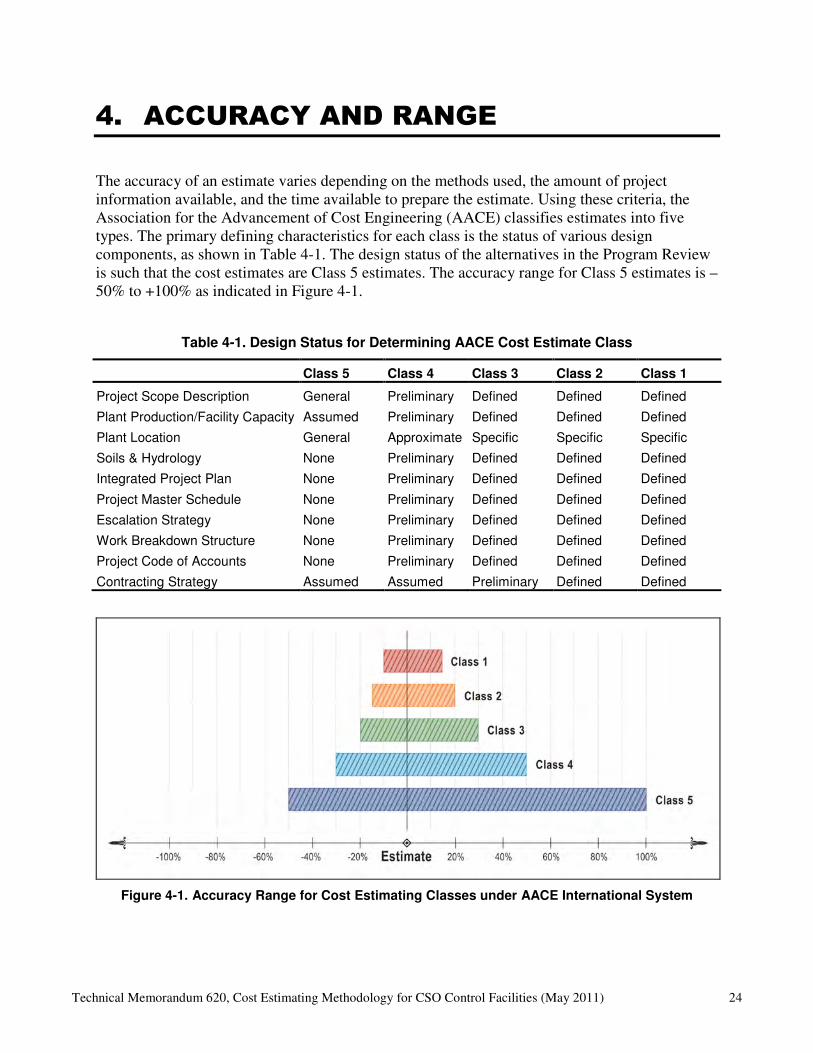
4. ACCURACY AND RANGE
The accuracy of an estimate varies depending on the methods used, the amount of project information available, and the time available to prepare the estimate. Using these criteria, the Association for the Advancement of Cost Engineering (AACE) classifies estimates into five types. The primary defining characteristics for each class is the status of various design components, as shown in Table 4-1. The design status of the alternatives in the Program Review is such that the cost estimates are Class 5 estimates. The accuracy range for Class 5 estimates is –50% to +100% as indicated in Figure 4-1.
Table 4-1. Design Status for Determining AACE Cost Estimate Class
Class 5 Class 4 Class 3 Class 2 Class 1
Project Scope Description General Preliminary Defined Defined Defined
Plant Production/Facility Capacity Assumed Preliminary Defined Defined Defined
Plant Location General Approximate Specific Specific Specific
Soils & Hydrology None Preliminary Defined Defined Defined
Integrated Project Plan None Preliminary Defined Defined Defined
Project Master Schedule None Preliminary Defined Defined Defined
Escalation Strategy None Preliminary Defined Defined Defined
Work Breakdown Structure None Preliminary Defined Defined Defined
Project Code of Accounts None Preliminary Defined Defined Defined
Contracting Strategy Assumed Assumed Preliminary Defined Defined
Figure 4-1. Accuracy Range for Cost Estimating Classes under AACE International System

This page left blank intentionally.

Technical Memorandum 620, Cost Estimating Methodology for CSO Control Facilities (May 2011) 25
5. OPERATION AND MAINTENANCE
COSTS
Annual operation and maintenance (O&M) costs are defined as the annual cost of operating and maintaining a facility, including labor, chemicals, supplies, and energy.
The methodology to estimate annual O&M costs for the project alternatives associated with the Program Review, not including green stormwater infrastructure, is based on O&M storage facility costs that were developed for the 1995 King County CSO update report, which were then updated in 2002. For the Program Review, the O&M cost estimates were reviewed and updated based on input received from the King County Offsite and Facilities Inspection group. A memorandum that describes the methodology and assumptions used to develop annual O&M costs for different types of facilities, not including green stormwater infrastructure, associated with this Program Review is included in Appendix E. Equipment replacement was not included in these O&M costs. The assumptions of what is included in the annual O&M costs for each type of facility are summarized below.
• Conveyance Pipes (Gravity Sewer/Combined Sewer Pipelines) – Annual O&M costs include sewer inspection, maintenance, repairs, and cleaning.
• Conveyance Pipes (Force Mains) – Annual O&M costs include visual ground inspection.
• Regulator Stations (Regulating Structures and Flow Control Structures) – Annual O&M costs include inspection and maintenance.
• Storage Tanks (Rectangular Storage Tanks) - Annual O&M costs include inspection, cleaning, energy consumption (for drainage pumps, aeration and mixing, and odor control), chemical replacement, and carbon replacement and disposal associated with odor control.
• Storage Pipes (Off-Line Storage Pipes) – Annual O&M costs include inspection and cleaning.
• Pump Stations – Annual O&M costs include labor (operation and maintenance), equipment replacement, energy, miscellaneous utility charges, carbon replacement, and spent carbon disposal.
• Wet-Weather Treatment Facilities (High-Rate Sedimentation Facilities) – Annual O&M costs include corrective and preventative maintenance, equipment testing and calibration, restocking of chemicals (ballasted sand, polymers, etc.), compliance sampling and reporting, energy usage and bulb replacement associated with UV disinfection, etc.
• Outfall Pipes (Outfalls) - Annual O&M costs include inspection.
• Tunnels – Annual O&M costs include inspection.
Technical Memorandum 620, Cost Estimating Methodology for CSO Control Facilities (May 2011) 26
The Program Review evaluates the GSI approach separately from the evaluation of alternatives developed from other CSO control approaches. It is assumed that most alternatives have opportunities for a GSI component that could reduce the size of the CSO control facility, but the facility size is not reduced as part of this Program Review because additional monitoring and modeling is needed. Future evaluations will consider the benefits and costs of GSI techniques in corresponding CSO basins to reduce the sizes of CSO control facilities. O&M cost estimates for GSI techniques developed for the Program Review will be used to help guide GSI strategies in future evaluations. Additional information on the GSI evaluation is included in Technical
Memorandum 800, Green Stormwater Infrastructure Feasibility Evaluation.
Operations and maintenance costs for GSI alternatives were assumed to be paid by King County for the Program Review. Costs were developed for the following GSI strategies:
• In-street Bioretention – Strategy would be designed and built by the King County Wastewater Treatment Division.
• Residential Rainwise – This is a residential incentive program that would offer rebates to property owners for installing cisterns and rain gardens on their property.
• Commercial/Industrial Rainwise – This is a commercial/industrial incentive program that would offer rebates to property owners for installing cisterns, permeable pavement, green roofs, and rain gardens on their property.
• Green Schools – This is a private/public school incentive program that would offer rebates to build and maintain rain gardens on school properties.
The methodology and assumptions used to estimate O&M costs for these GSI strategies in the Program Review were documented in a memorandum that is included in Appendix B.

Technical Memorandum 620, Cost Estimating Methodology for CSO Control Facilities (May 2011) 27
6. LIFE-CYCLE COST ANALYSIS
The King County Life-Cycle Cost Model was used to estimate life-cycle costs for the project alternatives associated with the Program Review.
Project life-cycle costs combine capital and O&M costs to allow reasonable comparisons between alternatives with high capital costs and those with high O&M costs. The life-cycle cost is the project cost plus the present worth value of ongoing O&M costs over the expected lifetime of the project. A present worth factor is used to convert annual O&M costs to a present value:
P = A x [(1 + i)n - 1] / [i (1 + i)n]
Where:
P = Present worth of O&M cost (2010 dollars)
A = Annual O&M cost (2010 dollars)
i = Discount Rate (annual percentage rate)
n = Period of Analysis (years)
The discount rate, expressed as an annual percentage, accounts for future price changes to convert O&M costs over the project lifespan to dollars in the same year used for capital cost estimating. For the Program Review, a discount rate of 2.2 percent was chosen, which is based on the recent Wastewater Treatment Division borrowing costs of 3 percent net annual inflation.
The period of analysis is chosen to approximate the life of the capital facilities to be compared in the economic analysis. For the Program Review, a planning period of 50 years was chosen.

This page left blank intentionally.
Technical Memorandum 620, Cost Estimating Methodology for CSO Control Facilities (May 2011) A-1
APPENDIX A. DEVELOPMENT OF WET-
WEATHER TREATMENT FACILITY
CONSTRUCTION COSTS

This page left blank intentionally.
Technical Memorandum 620, Cost Estimating Methodology for CSO Control Facilities (May 2011) A-2
For wet-weather treatment facility alternatives evaluated in the Program Review, cost estimates will be developed using cost curves showing the expected cost for such facilities based on the design peak flow rate. These cost curves have been developed for the two types of CSO treatment processes selected for consideration in the Program Review:
• Ballasted sedimentation
• Chemically enhanced primary treatment (CEPT) with lamella plates.
For each type of facility, total cost curves were developed by summing the curves for individual system components. The Omaha CSO cost tool was used for the CSO treatment process component. Tabula Rasa and other specialized methodologies were used for other components. The development and validation of cost curves for each type of CSO treatment process is described in this appendix.
A.1 Ballasted Sedimentation
A.1.1 Cost Curve Development The following sections describe the assumptions and general methodology used to develop cost curves for each component of the ballasted sedimentation treatment facility.
CSO Treatment Process (Ballasted Sedimentation)
The ballasted sedimentation treatment process was assumed to include the following elements:
• Actiflo system (chemical injection tank, flocculation tank, and settling tank),
• 4-mm fine screens
• Sump pumps for dewatering
• Ultraviolet disinfection
• Polymer feed system
• Coagulant feed system
• Microsand storage
• Odor control facility.
The cost curve for this component was developed using the ballasted flocculation costing tool included in the Omaha CSO cost tool, as follows:
1. Input peak flow rate into costing tool.
2. Include odor control facility.
3. Escalate costs to January 2010 using an ENR CCI of 8645.35.
4. Reduce construction cost estimate by 67 percent to remove the contingency that is applied in the Omaha CSO cost tool. (The Omaha CSO cost tool uses the CH2M Hill parametric cost estimating system (CPES) to estimate contingency. For this Program Review, contingency is not included in construction cost estimates. Contingency and

Technical Memorandum 620, Cost Estimating Methodology for CSO Control Facilities (May 2011) A-3
other mark-ups are added when estimating total project costs, as described in Section 3.)
5. For peak flow rates greater than 100 million gallons per day (MGD), adjust cost estimate using economy-of-scale equation (correlation exponent = 0.6).
Influent Pump Station
The influent pump station was assumed to include the following elements:
• An architecturally-treated superstructure,
• An activated carbon odor control unit,
• Variable frequency drives for the raw wastewater pumps,
• Separate wet well and drywells,
• Chemical feed for odor and corrosion control, and a
• Standby generator power supply for the firm pump station capacity.
The cost curve for this component was developed using the pump station costing tool included in Tabula Rasa, as follows:
1. Enter a construction year of 2010 and an ENR CCI of 8645.35.
2. Input the excavation depth, capacity, and total dynamic head per Table A-1.
Table A-1. Tabula Rasa Input for Pump Stations for Wet-Weather Treatment Facilities
Model Input Assumptions/Criteria
Excavation Depth Manual Input ...............................Assume 30 feet, unless alternative evaluation determines that a deeper excavation is required.
Capacity Manual Input ...............................Capacity is based on the treatment peak flow rate determined from alternative evaluations.
Total Dynamic Head Manual Input ...............................Add 5 feet to the maximum excavation depth assumed for the pump station.
Solids Handling Facility
Solids handling is a component of a ballasted sedimentation treatment facility because the high overflow rates for ballasted sedimentation result in a settling basin with a small area that does not provide sufficient storage for solids. It is therefore assumed that all solids will be stored in a separate facility. The following elements are assumed to be included in the solids handling facility:
• Storage facility
• Odor control facility.
The cost curve for this component was developed using the storage facility costing tool included in Tabula Rasa, as follows:

Technical Memorandum 620, Cost Estimating Methodology for CSO Control Facilities (May 2011) A-4
1. Enter a construction year of 2010 and an ENR CCI of 8645.35.
2. Use the following assumptions:
a. Percentage of peak flow rate sent to solids handling facility = 5 percent
b. Surface overflow rate (SOR) of solids handling facility = 800 gallons per day per square foot (gpd/sf)
c. Depth of basin = 15 feet
d. Assume significant construction dewatering
e. Assume cast-in-place construction
3. Estimate footprint of facility using SOR in gallons per day per square foot and peak flow rate in gallons per day (gpd).
4. Estimate the volume of the facility using the estimated footprint and assumed depth.
5. Input estimated volume and footprint into costing tool.
6. Select gravity for draining the facility.
7. Add odor control facility.
8. Select pavement restoration.
9. For facility volumes less than 0.5 million gallons (MG), estimate construction cost of facility for 0.5 MG, and then use the unit price ($/MG) and volume to estimate the construction cost of the smaller facility.
Regulator Station
The regulator station component was assumed to include the following elements:
• Above-grade structure,
• Two actuated gates, and a
• Real time control system.
The cost curve for this component was developed using the regulator station costing tool included in Tabula Rasa, as follows:
1. Enter a construction year of 2010 and an ENR CCI of 8645.35.
2. Input parameters per Table 2-3.
Grit Removal Facility
The grit removal component was assumed to include the following elements:
• Mechanical grit removal system (e.g., vortex separator)
Cost curves for this component were developed using the methodology presented in Investigation of Structural Control Measures for New Development (Larry Walker Associates, 1999), as follows:

Technical Memorandum 620, Cost Estimating Methodology for CSO Control Facilities (May 2011) A-5
1. Estimate unit cost ($/MGD) from Table 1 on page TMT-29 of Investigation of
Structural Control Measures for New Development.
2. Escalate average cost to 2010 dollars (ENR CCI of 8645.35).
A.1.2 Cost Results Figure A-1 presents cost curves (in 2010 dollars) for ballasted sedimentation treatment facilities developed using the methodologies described above. The separate cost curves were summed to develop the total cost curve shown on the figure.
$0
$20,000,000
$40,000,000
$60,000,000
$80,000,000
$100,000,000
$120,000,000
0 50 100 150 200 250 300
Co
nst
ruct
ion
Co
sts
(20
10
Do
lla
rs)
Peak Flow Rate (mgd)
Total Construction Cost
Ballasted Sedimentation Process
Influent Pump Station
Solids Handling Facility
Grit Removal Facility
Regulator Station
Total Construction Costs,
y = -441.60x2 + 503,118.57x + 6,866,939.90
Figure A-1. Construction Costs for Ballasted Sedimentation Treatment Facilities (No Contingency)
A.1.3 Cost Curve Validation
Total Facility Construction Cost
An initial assessment of the validity of the cost curves in Figure A-1 compared unit costs (costs per gallon per day) from the cost curves to unit costs calculated from actual construction of two ballasted sedimentation treatment facilities with capacities representative of those envisioned for King County:
• A 40-MGD Actiflo facility in Lawrence, Kansas
• A 232-MGD DensaDeg facility in Toledo, Ohio
Actual unit costs were estimated by dividing total costs from the cost estimates for each facility by the facility’s design peak flow rate. The results were compared to unit costs calculated from the total construction cost curve shown in Figure A-1 at the corresponding peak flow rates. Table A-2 shows the results.
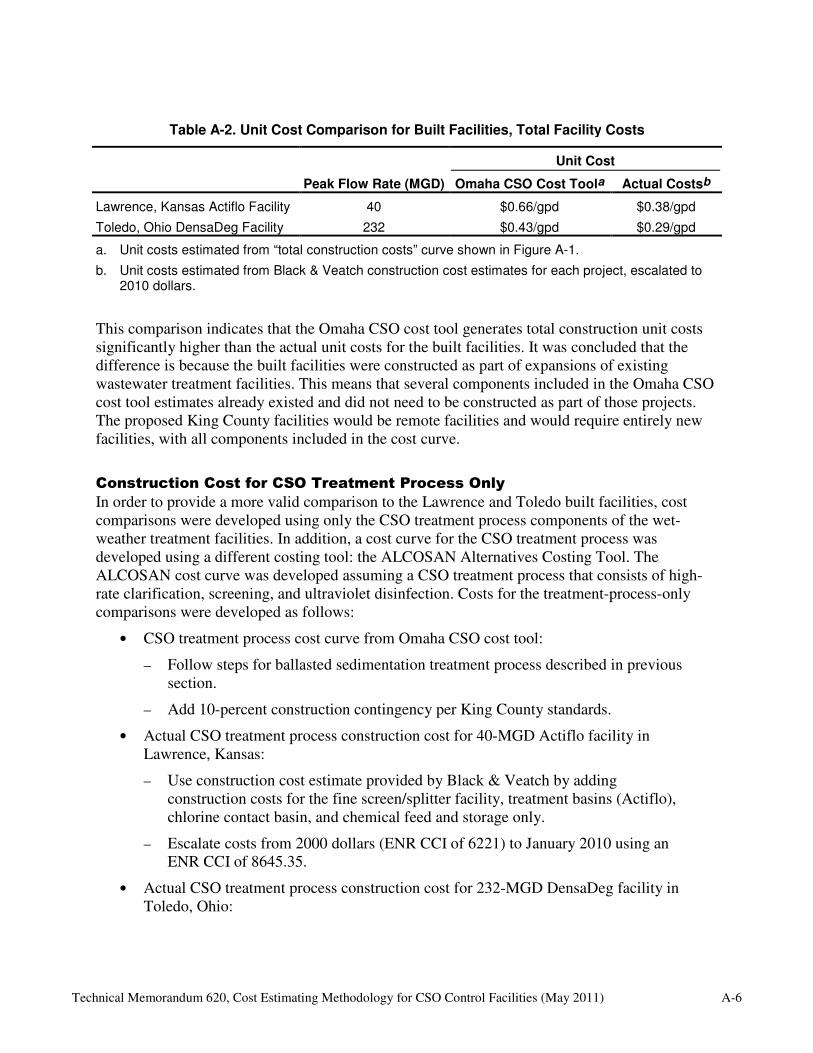
Technical Memorandum 620, Cost Estimating Methodology for CSO Control Facilities (May 2011) A-6
Table A-2. Unit Cost Comparison for Built Facilities, Total Facility Costs
Unit Cost
Peak Flow Rate (MGD) Omaha CSO Cost Toola Actual Costsb
Lawrence, Kansas Actiflo Facility 40 $0.66/gpd $0.38/gpd
Toledo, Ohio DensaDeg Facility 232 $0.43/gpd $0.29/gpd
a. Unit costs estimated from “total construction costs” curve shown in Figure A-1.
b. Unit costs estimated from Black & Veatch construction cost estimates for each project, escalated to 2010 dollars.
This comparison indicates that the Omaha CSO cost tool generates total construction unit costs significantly higher than the actual unit costs for the built facilities. It was concluded that the difference is because the built facilities were constructed as part of expansions of existing wastewater treatment facilities. This means that several components included in the Omaha CSO cost tool estimates already existed and did not need to be constructed as part of those projects. The proposed King County facilities would be remote facilities and would require entirely new facilities, with all components included in the cost curve.
Construction Cost for CSO Treatment Process Only
In order to provide a more valid comparison to the Lawrence and Toledo built facilities, cost comparisons were developed using only the CSO treatment process components of the wet-weather treatment facilities. In addition, a cost curve for the CSO treatment process was developed using a different costing tool: the ALCOSAN Alternatives Costing Tool. The ALCOSAN cost curve was developed assuming a CSO treatment process that consists of high-rate clarification, screening, and ultraviolet disinfection. Costs for the treatment-process-only comparisons were developed as follows:
• CSO treatment process cost curve from Omaha CSO cost tool:
– Follow steps for ballasted sedimentation treatment process described in previous section.
– Add 10-percent construction contingency per King County standards.
• Actual CSO treatment process construction cost for 40-MGD Actiflo facility in Lawrence, Kansas:
– Use construction cost estimate provided by Black & Veatch by adding construction costs for the fine screen/splitter facility, treatment basins (Actiflo), chlorine contact basin, and chemical feed and storage only.
– Escalate costs from 2000 dollars (ENR CCI of 6221) to January 2010 using an ENR CCI of 8645.35.
• Actual CSO treatment process construction cost for 232-MGD DensaDeg facility in Toledo, Ohio:

Technical Memorandum 620, Cost Estimating Methodology for CSO Control Facilities (May 2011) A-7
– Use construction cost estimate provided by Black & Veatch by adding construction costs for the influent screening/pump station modifications, treatment basins (DensaDeg), chlorine contact basin/effluent outfall, and chemical feed and storage only.
– Escalate costs from 2006-07 dollars (ENR CCI of 8705) to January 2010 using an ENR CCI of 8645.35.
• Cost curve from ALCOSAN Alternatives Costing Tool:
– Use a construction year of 2010 and an ENR CCI of 8645.35.
– Use high-rate clarification costing tool for various flow rates.
– Use screening costing tool for various flow rates.
– Use disinfection costing tool, specifying ultraviolet, for various flow rates.
– Add construction costs for high-rate clarification, screening, and disinfection together.
– Remove 25-percent construction contingency added by costing tool.
– Add 10-percent construction contingency per King County standards.
The comparison is shown in Figure A-2. Generally, the Omaha CSO cost tool estimates CSO treatment process costs that are slightly lower than the costs estimated by the ALCOSAN Alternatives Costing Tool. The differences between the two tools increases at higher peak flow rates (up to a difference of approximately 10 percent).
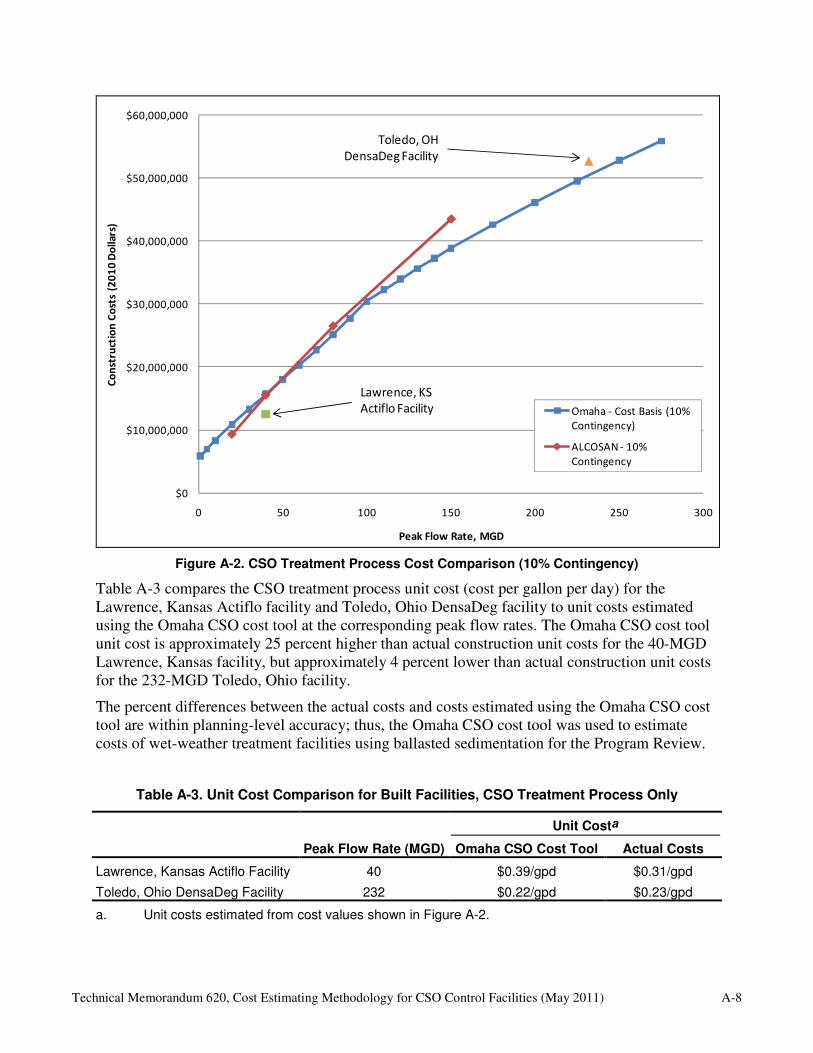
Technical Memorandum 620, Cost Estimating Methodology for CSO Control Facilities (May 2011) A-8
$0
$10,000,000
$20,000,000
$30,000,000
$40,000,000
$50,000,000
$60,000,000
0 50 100 150 200 250 300
Co
nst
ruct
ion
Co
sts
(20
10
Do
llars
)
Peak Flow Rate, MGD
Omaha - Cost Basis (10%
Contingency)
ALCOSAN - 10%
Contingency
Toledo, OH
DensaDeg Facility
Lawrence, KS
Actiflo Facility
Figure A-2. CSO Treatment Process Cost Comparison (10% Contingency)
Table A-3 compares the CSO treatment process unit cost (cost per gallon per day) for the Lawrence, Kansas Actiflo facility and Toledo, Ohio DensaDeg facility to unit costs estimated using the Omaha CSO cost tool at the corresponding peak flow rates. The Omaha CSO cost tool unit cost is approximately 25 percent higher than actual construction unit costs for the 40-MGD Lawrence, Kansas facility, but approximately 4 percent lower than actual construction unit costs for the 232-MGD Toledo, Ohio facility.
The percent differences between the actual costs and costs estimated using the Omaha CSO cost tool are within planning-level accuracy; thus, the Omaha CSO cost tool was used to estimate costs of wet-weather treatment facilities using ballasted sedimentation for the Program Review.
Table A-3. Unit Cost Comparison for Built Facilities, CSO Treatment Process Only
Unit Costa
Peak Flow Rate (MGD) Omaha CSO Cost Tool Actual Costs
Lawrence, Kansas Actiflo Facility 40 $0.39/gpd $0.31/gpd
Toledo, Ohio DensaDeg Facility 232 $0.22/gpd $0.23/gpd
a. Unit costs estimated from cost values shown in Figure A-2.

Technical Memorandum 620, Cost Estimating Methodology for CSO Control Facilities (May 2011) A-9
A.2 CEPT with Lamella Plates
A.2.1 Cost Curve Development The following sections describe the assumptions and general methodology used to develop cost curves for each component of the wet-weather treatment facility using CEPT with lamella plates.
CSO Treatment Process (CEPT)
The CEPT treatment process was assumed to include the following elements:
• Settling basin with additional depth for solids handling,
• Chemical mixing basin,
• 4-mm fine screens,
• Sump pumps for dewatering,
• Ultraviolet disinfection,
• Polymer feed system,
• Coagulant feed system, and
• Odor control facility.
Cost Curve from Omaha CSO Cost Tool The cost curve for all elements of the CEPT treatment process, with the exception of the settling basin and chemical mixing basin, was developed using the ballasted flocculation costing tool included in the Omaha CSO cost tool, as follows:
1. Input peak flow rate into costing tool.
2. Include odor control facility.
3. Escalate costs to January 2010 using an ENR CCI of 8645.35.
4. Reduce construction cost estimate by 67 percent to remove the contingency that is applied in the Omaha CSO cost tool.
5. For design flow rates greater than 100 MGD, adjust cost estimate using economy-of-scale equation (correlation exponent = 0.6).
6. Subtract cost associated with Actiflo system. Determine amount to subtract based on percentage of total costs associated with Actiflo system from CPES estimates (percentages vary between 37 percent and 51 percent, based on flow rate).
7. Retain costs associated with the chemical feed system and storage, based on best-fit equation developed from estimated percentage of chemical feed and storage associated with treatment system (see Figure A-3 for best-fit equation). Best-fit equation was developed based on assumed percentages of chemical feed and storage from construction costs of Lawrence and Toledo facilities:
a. Lawrence, Kansas Actiflo Facility (40 MGD): 29% of Actiflo system construction cost associated with chemical feed and storage.

Technical Memorandum 620, Cost Estimating Methodology for CSO Control Facilities (May 2011) A-10
b. Toledo, Ohio DensaDeg Facility (232 MGD): 8% of DensaDeg system construction cost associated with chemical feed and storage.
Figure A-3. Percentage of Chemical Feed System and Storage Costs Associated with Actiflo/DensaDeg System
Settling Basin Cost Curve from Tabula Rasa The cost curve for the settling basin was developed using the storage facility costing tool in Tabula Rasa, as follows:
1. Enter a construction year of 2010 and an ENR CCI of 8645.35.
2. Use the following assumptions:
a. Surface overflow rate (SOR) = 20,000 gpd/sf.
b. Depth of settling basin = 15 feet.
c. Additional depth for storage of solids = 5 feet.
d. Significant construction dewatering.
e. Cast-in-place construction.
3. Estimate footprint of settling basin using SOR and peak flow rate of treatment facility.
4. Estimate the volume of the facility using the estimated footprint and assumed depth.
5. Input estimated volume and footprint into costing tool.
6. Select gravity for draining the facility.
7. Add odor control facility.
8. Select no restoration since settling basin is located above grade.
9. For volumes less than 0.5 MG, estimate construction cost of settling basin for 0.5 MG, and then use the unit price ($/MG) and volume to estimate construction cost of the smaller settling basin.

Technical Memorandum 620, Cost Estimating Methodology for CSO Control Facilities (May 2011) A-11
Chemical Mixing Basin Cost Curve from Tabula Rasa The cost curve for the chemical mixing basin was developed using the storage facility costing tool in Tabula Rasa, as follows:
1. Enter a construction year of 2010 and an ENR CCI of 8645.35.
2. Use the following assumptions:
a. Detention time = 8 minutes.
b. Significant construction dewatering.
c. Cast-in-place construction.
3. Estimate the volume of the basin using the peak flow rate and detention time.
4. Input estimated volume into costing tool.
5. Select gravity for draining the facility.
6. Do not include an odor control facility since it has been included with settling basin.
7. Select no restoration since chemical mixing basin is located above grade.
8. For volumes less than 0.5 MG, estimate construction cost of settling basin for 0.5 MG, and then use the unit price ($/MG) and volume to estimate construction cost of the smaller settling basin.
Influent Pump Station
The influent pump station was assumed to include the following elements:
• An architecturally-treated superstructure,
• An activated carbon odor control unit,
• Variable frequency drives for the raw wastewater pumps,
• Separate wet well and drywells,
• Chemical feed for odor and corrosion control, and a
• Standby generator power supply for the firm pump station capacity.
The cost curve for this component was developed using the pump station costing tool included in Tabula Rasa, as follows:
1. Enter a construction year of 2010 and an ENR CCI of 8645.35.
2. Input the excavation depth, capacity, and total dynamic head per Table A-1.
Regulator Station
The regulator station component was assumed to include the following elements:
• Above-grade structure,
• Two actuated gates, and a
• Real time control system.

Technical Memorandum 620, Cost Estimating Methodology for CSO Control Facilities (May 2011) A-12
The cost curve for this component was developed using the regulator station costing tool included in Tabula Rasa, as follows:
1. Enter a construction year of 2010 and an ENR CCI of 8645.35.
2. Input parameters per Table 2-3.
Lamella Plates
The lamella plates component was assumed to include the following elements:
• 304 Stainless Steel Lamella Plates
• Lamella Plates to Settling Basin square footage ratio: 11.5
• Inclined Angle: 60°
The cost curve for this component was developed using an approach developed by Meurer Research, as follows:
1. Estimate planning-level costs ($/SF) based on planning-level cost estimate ($15/SF) and include estimate for installation of lamella plates (40% of equipment costs).
2. Estimate surface area of lamella plates using the ratio of horizontal projected surface area of lamella plates to clarifier surface area: 11.5.
Solids Handling Facility
Wet-weather treatment facilities using CEPT with lamella plates require a separate solids handling facility due to the small settling basin volume. However, the settling basin is larger than required for a ballasted sedimentation treatment facility and can store some solids. It was assumed that the CEPT settling basin would store approximately 5 to 7 feet of solids during peak wet-weather events. In order to determine the additional solids handling volume required, it was necessary to calculate the solids generated in each of the ten wet-weather treatment facility alternatives, as follows:
• Influent total suspended solids (TSS) loads were calculated using 32 years of King County overflow data from storm events in each basin.
• Influent annual average TSS volume was calculated using TSS concentrations analyzed from grab samples from past CSO events and assuming a solids concentration of 2.5 percent.
• Influent TSS volume was compared to the settling basin storage for 5 to 7 feet of solids.
Table A-4 summarizes the estimated solids volume and corresponding solids handling facility footprint size for each wet-weather treatment facility alternative.

Technical Memorandum 620, Cost Estimating Methodology for CSO Control Facilities (May 2011) A-13
Table A-4. Estimated Solids Volume and Solids Handling Facility Footprint for Treatment Alternatives Using CEPT with Lamella Plates
Wet-Weather Treatment Facility Alternative
Volume of Solids Handling Facility, Additional Storage Needed (MG)
Footprint of Solids Handling Facility (SF)
Brandon St 0.04 356
S Michigan St 0.38 3,342
S Michigan St and Brandon St 0.30 2,700
Hanford #2 0.33 2,968
Lander St 0.16 1,390
Kingdome 0.31 2,718
King St/Kingdome 0.24 2,112
Hanford #2/Lander St 0.48 4,296
Hanford #2/Lander St/Kingdome 0.88 7,860
Hanford #2/Lander St/Kingdome/King St 0.79 7,014
Because the solids handling volume varies for each treatment alternative, a line item cost for the solids handling facility was calculated for each alternative rather than developing a cost curve. The solids handling facility cost estimate for each alternative was developed using the storage facility costing tool of Tabula Rasa, as follows:
1. Enter a construction year of 2010 and an ENR CCI of 8645.35.
2. Use the following assumptions:
a. Depth of facility = 15 feet.
b. Significant construction dewatering.
c. Cast-in-place construction.
3. Input estimated volume and footprint (see Table A-4).
4. Select gravity for draining the facility.
5. Add odor control facility.
6. Select pavement restoration.
7. For facility volumes less than 0.5 MG, estimate construction cost of facility for 0.5 MG, and then use the unit price ($/MG) and volume to estimate construction cost of the smaller facility.
A.2.2 Cost Results The separate cost curves for individual components were added together to develop the total cost curve, excluding solids handling, for wet-weather treatment facilities using CEPT with lamella plates. The component and total cost curves are shown in Figure A-4. Table A-5 summarizes the estimated solids handling facility construction cost for each wet-weather treatment facility alternative. The solids handling costs will be added to total construction cost for all other

Technical Memorandum 620, Cost Estimating Methodology for CSO Control Facilities (May 2011) A-14
components, as calculated from the cost curve based on the design peak flow rate for each alternative.
A.2.3 Cost Curve Validation There are no known applications of CEPT with lamella plate clarification in North America for CSO applications. One facility that uses CEPT with lamella plates to treat wet-weather flows is at the Gold Bar treatment plant, which is operated by the City of Edmonton in Alberta, Canada. This facility, however, was part of an expansion of the existing wastewater treatment facility, and costs would not be representative of a new King County remote CSO treatment facility.
The approach used to validate costs was to compare costs to existing CEPT facilities without lamella plates. The Northeast Ohio Regional Sewer District is currently in conceptual design of a new 400-MGD CEPT facility. The facility includes retention treatment tanks and high-rate chemical mixing equipment to enhance and optimize solids removal. The project also includes equalization, screening, and disinfection facilities. The estimated unit cost is approximately $0.26/gpd. Using the total cost curve in Figure A-4, the unit cost for a 400-MGD facility would be approximately $0.29/gpd. The percent differences between the actual costs and costs estimated using the total cost curve in Figure A-4 are within planning-level accuracy.
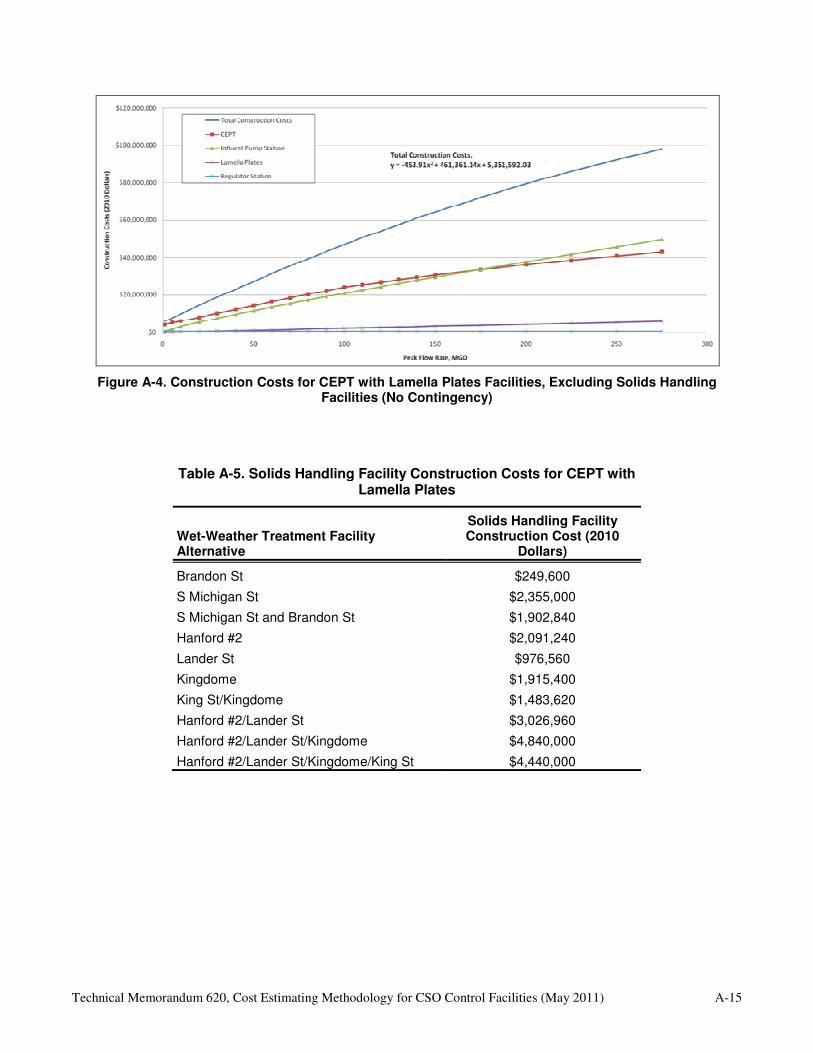
Technical Memorandum 620, Cost Estimating Methodology for CSO Control Facilities (May 2011) A-15
Figure A-4. Construction Costs for CEPT with Lamella Plates Facilities, Excluding Solids Handling Facilities (No Contingency)
Table A-5. Solids Handling Facility Construction Costs for CEPT with Lamella Plates
Wet-Weather Treatment Facility Alternative
Solids Handling Facility Construction Cost (2010
Dollars)
Brandon St $249,600
S Michigan St $2,355,000
S Michigan St and Brandon St $1,902,840
Hanford #2 $2,091,240
Lander St $976,560
Kingdome $1,915,400
King St/Kingdome $1,483,620
Hanford #2/Lander St $3,026,960
Hanford #2/Lander St/Kingdome $4,840,000
Hanford #2/Lander St/Kingdome/King St $4,440,000

Technical Memorandum 620, Cost Estimating Methodology for CSO Control Facilities (May 2011) B-1
APPENDIX B. GREEN STORMWATER
INFRASTRUCTURE COST ESTIMATING
METHODOLOGY

This page left blank intentionally.
Page 1 of 5
Introduction
King County’s Wastewater Treatment Division is considering implementation of green stormwater infrastructure as one of several means to control its combined sewer overflows (CSOs) so that they meet the Washington State standard of no more than one overflow on average per year at each CSO site.
Green stormwater infrastructure techniques reduce the amount of stormwater and groundwater in the combined sewer system. Examples include sewer separation, infiltration and inflow reduction, and stormwater diversion/management. Green stormwater infrastructure (GSI) is a cost-effective, sustainable, and environmentally friendly approach to diverting and managing stormwater.
The cost estimating for GSI includes capital project costs, allied costs, incentive costs, and maintenance costs. In estimating allied and lifecycle costs, standard WTD forms were used similar to those for other capital projects in WTD to provide a realistic comparison between GSI project costs and traditional (or grey) project costs.
This memo describes the methodology and assumptions for cost estimates for GSI strategies for consideration in the 2012 Combined Sewer overflow (CSO) Program Review. The cost estimates will be used to help guide the GSI strategy for the Program Review.
GSI Strategies Considered for CSO control
In-Street Bioretention
This strategy employs the use of bioretention for CSO control. Through a GIS spatial analysis, several acres of Right of Way area was identified as feasible for implementing bioretention based on slopes, street widths and infiltration potential. Using areas outside the travel lanes in either parking strips or planting strips, bioretention cells intercept runoff and infiltrate stormwater and retain stormwater that would flow directly into the combined sewer system. The bioretention cells are sized to meet a specific target of flow reduction to reduce or eliminate the need for storage or reduce the peak flow for treatment. Other names are Roadside Rain Gardens and Green Streets.
For cost estimating, the facilities are sized to mitigate the impervious right of way area calculated through a mass balance using the peak one-year storm volume identified through the MOUSE model. Capital costs are derived from historic project costs (bid sheets); including the Ballard Roadside Rain Gardens built by SPU and the Barton CSO GSI Project. The capital construction cost is $3.50 per square foot mitigated.
1 http://www.greatcity.org/campaigns/green-infrastructure/
What is Green Infrastructure?
The concept of green infrastructure originated in the strategic conservation planning field. In this context, large forests, wetlands, greenbelts, and so forth—all part of the natural environment—are viewed as infrastructure because they support essential ecosystem functions (Great City, 2009).
1
The term is increasingly being used to refer to engineered infrastructure at a smaller scale in relation to green stormwater management practices such as rain gardens and green roofs. These practices make use of soils and vegetation, in combination with other decentralized storage and infiltration approaches such as rain barrels and permeable pavement, to infiltrate, evaporate, capture, and reuse stormwater.
In addition to helping reduce CSOs and the amount of untreated stormwater that finds its way to surface water, green stormwater management facilitates natural processes that recharge groundwater, preserve baseflow in streams, moderate impacts to water and air temperature, and protect hydrologic and hydraulic stability.
Other names for green stormwater management include low impact development (LID), natural drainage, and water-sensitive design. This technical memorandum uses the term “green stormwater infrastructure” (GSI).

Page 2 of 5
Operations and maintenance costs are based on the Water Environment Research Foundation (WERF) BMP and LID Life Costs Model Version 2.0. The values derived from the cost model were compared to current maintenance costs from privately maintained projects in the Seattle area. A simplified cost per square foot was not used because the cost per square foot changed depending on the overall size (total area) of the project. The basis for the cost modeling is in hours needed to perform maintenance tasks and replacement costs.
Residential RainWise
Beginning in the summer of 2010 SPU initiated a program to incentivize residents to reduce stormwater runoff from their property in CSO basins with the Residential RainWise program. The program offers rebates to property owners for the cost of installing cisterns and/or rain gardens on private property; in the future downspout disconnection may also be offered. To qualify for the RainWise residential rebates the residents must live in specific CSO basins and meet the following requirements:
• Rain gardens or cisterns must be installed on properties within a target CSO basin
• Work must be done by a licensed contractor.
• Post-construction inspections by a SPU or King County inspector, an infiltration test, and completed forms are required (pre-construction inspection currently also conducted but likely to be scaled back in the future as contractors are more familiar with the program elements)
• Rebate request forms must be received within 90 days of completion
The City or County will pay most of the cost of installing rain gardens and cisterns, depending on how many square feet of roof runoff is controlled. The proposed rebates currently range from $1.50 to $4.00 per square foot mitigated and depend on the green strategy employed and also on whether the property is within a combined or partially separated basin. In a fully combined area, the sewer and storm system is fully combined while in the partially separated system, the street runoff is directed to a separate storm system while roof water goes to the sewer. Rebates have not yet been made permanent and may be adjusted in the future. The amount of the rebate was based on an estimated cost to mitigate the same volume, and peak flow in the right of way.
Commercial/Industrial RainWise
This program offers rebates to commercial and industrial property owners for the cost of installing cisterns, permeable pavement, green roofs and/or rain gardens on private property. The program would differ from the residential program by increasing the incentive amount and allowing for additional strategies to be employed. To qualify for the RainWise rebates the property must be in specific CSO basins and meet the following requirements:
• Work must be done by a licensed contractor.
• Post-construction inspections by a SPU or King County inspector, an infiltration test, and completed forms are required (pre-construction inspection currently also conducted but likely to be scaled back in the future as contractors are more familiar with the program elements)
• Rebate request forms must be received within 90 days of completion
The City or County will pay most of the cost of installation, depending on how many square feet of impervious area is controlled. The proposed rebates currently range from $4.00 to $6.00 per

Page 3 of 5
square foot mitigated and depend on the green strategy employed and also on whether the property is within a combined or partially separated basin. Rebates have not yet been made permanent and may be adjusted in the future. The amount of the rebate was based on an estimated cost to mitigate the same volume, and peak flow in the right of way.
Green Schools
This program is for both private and public schools to build and maintain rain gardens on site. It would also encourage comprehensive strategies to mitigate impervious area. It is similar to the commercial and industrial RainWise program, but would also contain a community outreach and education component as teachers, students and parents would be exposed to the projects.
The City or County will pay most of the cost of installation, depending on how many square feet of impervious area is controlled. The proposed rebates currently range from $4.00 to $6.00 per square foot mitigated and depend on the green strategy employed and also on whether the property is within a combined or partially separated basin. Rebates have not yet been made permanent and may be adjusted in the future. The amount of the rebate was based on an estimated cost to mitigate the same volume, and peak flow in the right of way.
Background
Construction Costs
In-street bioretention would be the only strategy designed and built by WTD. Therefore, it is similar to other capital projects and estimating costs follow the same guidance.
SPU and WTD agreed to use similar values in estimating construction costs and based the values on data collected from multiple agencies. For in-street bioretention several project costs were identified in cost per square foot of facility from Chicago, Portland and locally. The costs ranged from $36.00 - $88.00 per square foot. Each project had degrees of complexity and design so an average for the costs were used and compared to the bids received for the Ballard Roadside Rain Garden project and the cost estimate form the Barton CSO GSI Project. Both comparisons included unit and quantity line items to compare. The costs for the two projects were $44, $54 and $67 per square foot. The difference in the Barton project was the use of curb extensions for one option which raises the costs due to additional work in the right of way. The average cost is $55 per square foot. Because the total square footage needed to mitigate a certain impervious area is about 6% of the area of the facility; cost per square foot mitigated was estimated at $3.50 per square foot. For example, to mitigate 1,000 square feet of impervious area, the model assumes a 60 square foot facility.
Incentives
Providing an incentive to construct GSI on private property allows for the reduction in impervious contributing area to the CSS. To easily calculate the estimated costs for planning purposes, the cost to mitigate is used and applied to the incentive. This allows some flexibility by the property owner to use the money to build enough rain gardens to mitigate a portion or all impervious area, mostly roofs. For residences, the incentive is $4 square foot mitigated. A property owner would receive $4,000 to build a rain garden that mitigates 1,000 square feet of roof area. However, under the guidelines of the program if the rain garden only costs $3,000 to build then the property owner would only get the actual cost to construct, in this case $3,000.
In the commercial, industrial and school program extra money was added as the number of techniques available was increased. The incentive for large parcel property owners is $6 per square foot maximum and is based on the cost of installing a green roof. It is also assumed that the green roof alone would only be part of the overall strategy as the green roof does not provide full mitigation like a rain garden would. The property owner would combine the green

Page 4 of 5
roof with permeable paving or rain gardens to retain additional flow. This program follows the same guidance as the residential program as the property owner is only reimbursed up to the maximum amount or the actual cost of construction. For example, if a property owner installs a green roof and two rain gardens to mitigate 10,000 square feet of roof for a cost of $72,000, they would only be reimbursed for $60,000.
Allied Costs
The WTD PRISM Allied Cost model was used for the conveyance project, assuming that the conveyance project is the least complex and GSI is similar in allied costs to conveyance projects as they are also linear and involve work in the public right-of-way.
Operations and Maintenance Costs
GSI projects have little to know operational costs and the costs are based on the costs to maintain the facilities over a fifty year life span. Although these facilities are designed to last over 100 years, with standard maintenance, fifty years was used to directly compare to the traditional (or grey) infrastructure whole life cycle costs.
Maintenance costs are based on the WERF BMP and LID Whole Life Cycle Cost Model. The model allows the user to input the square footage of facility and estimate the number of hours needed to complete maintenance tasks. The costs are broken down annually even though the frequency of some maintenance tasks is greater than once per year. The table below outlines the maintenance task and hours needed per year.
REGULAR MAINTENANCE ACTIVITIES Months
Between
Events
Hours per Event*
Crew Size
Inspection, Reporting & Information Management 24 2 1
Vegetation Management with Trash & Minor Debris
Removal 6 2 2
CORRECTIVE AND INFREQUENT MAINTENANCE
ACTIVITIES (Unplanned and/or >3yrs. betw. events)
Years
between
Events
Hours per Event*
Crew Size
Till Soil 4 2 2
Unclog Drain 2 2 1
Replace Mulch 2 2 2
*Based on 2,500 sq. ft. facility
Labor rates were estimated using RS Means for landscape and general labor. The value for landscape maintenance, inspection and reporting is $65/hour and for general labor is $31/hour. As sensitivity analysis was performed using King County labor rates (highest in range) for a Senior Gardner ($29/hour) and a Wastewater Utility worker ($22/hour) along with an overhead rate of 60.7% for WTD according to King County Finance. The analysis showed that in-house labor was comparable to the RS Means values.
Included in the WERF Cost Model and additional $50 per hour was added for equipment use. This includes transportation and general landscape equipment.
Incentive Programs
The incentive programs do not have a corollary O&M cost calculation. However, according to analysis by SPU, a certain amount of money is required to implement the programs and replace

Page 5 of 5
a certain number of facilities each year. The assumption is that approximately 2% of the facilities will fail each year. Failure would include a property owner removing the facility.
This loss is compensated for by additional incentives for 2% additional rain gardens per year being replaced by new ones. For example in year 1, if there are 100 rain gardens installed, then by year two it is assumed that only 98 of the original 100 rain gardens remains. In order to keep this stock at 100, SPU will provide additional incentives to add back 2 rain gardens to additional residents in the same basin every year. In year three, 96.04% of the original 100 rain gardens will remain, 1.96% of the second year, and two more will be added in year three to keep the total stock at 100 rain gardens (SPU, 2011).

This page left blank intentionally.
Technical Memorandum 620, Cost Estimating Methodology for CSO Control Facilities (May 2011) C-1
APPENDIX C. REAL ESTATE DATA
COLLECTED FOR PROPERTY COST
EVALUATION

This page left blank intentionally.

Technical Memorandum 620, Cost Estimating Methodology for CSO Control Facilities (May 2011) C-2
Table C-1. Industrial Property Values for Land & Building
Cost per SF, Jan 2007 to Aug 2010
DSN Uncontrolled CSO Basin
Location of Project
Address Used for Search
# of Sales
Sales Range (per Quarter) Average Comments
028 King Street Regulator
Sodo/ Central Waterfront
499 Alaskan Way S., Seattle
15 $95.66 - $245.66
$121.71 12 out of 27 sales were not good comparable sales (See Note A)
029 Connecticut St. Regulator (King Dome)
Sodo/ Central Waterfront
1199 Alaskan Way S., Seattle
10 $95.66 - $166.67
$118.02 22 out of 32 sales were not good comparable sales (See Note B)
030 Lander Street Duwamish 2401 Utah Ave, Seattle
15 $95.66 - $166.67
$115.46 26 out of 41 sales were not good comparable sales (See Note C)
031 Hanford @ Rainier (Hanford #1)
Duwamish 4501 E. Marginal Way S., Seattle
21 $47.82 - $179.78
$103.22 29 out of 50 sales were not good comparable sales (See Note D)
032 Hanford @ Rainier (Hanford #2)
Duwamish 2999 E. Marginal Way S., Seattle
18 $47.82 - $166.67
$105.60 27 out of 45 sales were not good comparable sales (See Note E)
036 Chelan Avenue Regulator
Duwamish 3455 Chelan Ave SW, Seattle
18 $47.82 - $179.01
$106.94 24 out of 42 sales were not good comparable sales (See Note F)
038 Terminal #115 Overflow
Duwamish 6700 W. Marginal Way SW, Seattle
22 $47.82 - $395.24
$107.77 26 out of 48 sales were not good comparable sales (See Note G)
039 South Michigan Regulator
Duwamish 159 S. Michigan, Seattle
25 $47.82 - $395.24
$111.86 27 out of 52 sales were not good comparable sales (See Note H)
041 Brandon Street Regulator
Duwamish 5241 E. Marginal Way S., Seattle
28 $47.82 - $395.24
$114.18 29 out of 57 sales were not good comparable sales (See Note I)
042 West Michigan Regulator
Duwamish 6769 W. Marginal Way SW, Seattle
23 $47.82 - $395.24
$111.67 25 out of 48 sales were not good comparable sales (See Note J)
004 11th Avenue West
Ship Canal 5110 Shilshole Ave NW, Seattle
4 $110.68 - $245.55
$149.89 6 out of 10 sales were not good comparable sales (See Note K)
008 3rd Avenue NW Ship Canal 5110 Shilshole Ave NW, Seattle
4 $110.68 - $245.55
$149.89 6 out of 10 sales were not good comparable sales (See Note K)
009 Dexter Avenue Regulator
Ship Canal 1419 Dexter Ave N., Seattle
4 $110.68 - $245.55
$164.03 10 out of 14 sales were not good comparable sales (See Note L)
014 Montlake Regulator
Ship Canal 2910 Montlake Blvd E., Seattle
2 $169.81 - $186.26
$175.83 2 out of 4 sales were not good comparable sales (See Note M)
015 University Regulator
Ship Canal 1901 NE Pacific Place, Seattle
2 $169.81 - $186.26
$175.83 2 out of 4 sales were not good comparable sales (See Note M)
Technical Memorandum 620, Cost Estimating Methodology for CSO Control Facilities (May 2011) C-3
Note A: 7 properties changed title vesting only – no actual market sales occurred; 1 property was a leasehold sale (3480 W. Marginal Way S.); 2 properties were easements granted to BNSF for $.44/SF and non-market conditions of sale are unclear; 1 property was a direct transfer from King County to State of WA and did not involve any monetary transactions; 1 property was sold to WSDOT under threat of eminent domain at $486.94/SF.
Note B: 17 properties changed title vesting only – no actual market sales occurred; 1 property was a leasehold sale (3480 W. Marginal Way S.); 2 properties were easements granted to BNSF for $.44/SF and non-market conditions of sale are unclear; 1 property was a direct transfer from King County to State of WA and did not involve any monetary transactions; 1 property was sold to WSDOT under threat of eminent domain at $486.94/SF.
Note C: 19 properties changed title vesting only – no actual market sales occurred; 3 properties were leasehold sales (3480 W. Marginal Way S. & 6501 – 6505 Perimeter Road S); 2 properties were easements granted to BNSF for $.44/SF and non-market conditions of sale are unclear; 1 property was a direct transfer from King County to State of WA and did not involve any monetary transactions; 1 property was sold to WSDOT under threat of eminent domain at $486.94/SF.
Note D: 21 properties changed title vesting only – no actual market sales occurred; 3 properties were leasehold sales (3480 W. Marginal Way S. & 6501 – 6505 Perimeter Road S); 2 properties were easements granted to BNSF for $.44/SF and non-market conditions of sale are unclear; 1 property was a direct transfer from King County to State of WA and did not involve any monetary transactions; 1 property was sold to WSDOT under threat of eminent domain at $486.94/SF; 1 property sold for $496/SF, but the sale could not be confirmed.
Note E: 21 properties changed title vesting only – no actual market sales occurred; 3 properties were leasehold sales (3480 W. Marginal Way S. & 6501 – 6505 Perimeter Road S); 2 properties were easements granted to BNSF for $.44/SF and non-market conditions of sale are unclear; 1 property was a direct transfer from King County to State of WA and did not involve any monetary transactions; 1 property was sold to WSDOT under threat of eminent domain at $486.94/SF; 1 property sold for $496/SF, but the sale could not be confirmed.
Note F: 19 properties changed title vesting only – no actual market sales occurred; 1 property was a leasehold sale (3480 W. Marginal Way S.); 2 properties were easements granted to BNSF for $.44/SF and non-market conditions of sale are unclear; 1 property was a direct transfer from King County to State of WA and did not involve any monetary transactions; 1 property was sold to WSDOT under threat of eminent domain at $486.94/SF.
Note G: 20 properties changed title vesting only – no actual market sales occurred; 3 properties were leasehold sales (3480 W. Marginal Way S. & 6501 – 6505 Perimeter Road S); 2 properties were easements granted to BNSF for $.44/SF and non-market conditions of sale are unclear; 1 property sold for $496/SF, but the sale could not be confirmed.
Note H: 21 properties changed title vesting only – no actual market sales occurred; 3 properties were leasehold sales (3480 W. Marginal Way S. & 6501 – 6505 Perimeter Road S); 2 properties were easements granted to BNSF for $.44/SF and non-market conditions of sale are unclear; 1 property sold for $496/SF, but the sale could not be confirmed.
Note I: 23 properties changed title vesting only – no actual market sales occurred; 1 was a business sale only; 1 property sold w/ a dated sale price at $37.33/SF; 1 property was a direct transfer from King County to State of WA and did not involve any monetary transactions; 2 properties were easements granted to BNSF for $.44/SF and non-market conditions of sale are unclear; 1 property was sold to WSDOT under threat of eminent domain at $486.94/SF.
Note J: 21 properties changed title vesting only – no actual market sales occurred; 1 was a business sale only; 1 property sold w/ a dated sale price at $37.33/SF; 2 properties were easements granted to BNSF for $.44/SF and non-market conditions of sale are unclear.
Note K: 5 properties changed title vesting only – no actual market sales occurred; 1 property is an easement acquired by Puget Sound Energy for $.12/SF.

Technical Memorandum 620, Cost Estimating Methodology for CSO Control Facilities (May 2011) C-4
Note L: 5 properties changed title vesting only – no actual market sales occurred; 1 property is an easement acquired by Puget Sound Energy for $.12/SF; 1 property was a direct transfer from King County to State of WA and did not involve any monetary transactions; 1 property was a direct transfer from the US Govt to State of WA and did not involve any monetary transactions.
Note M: 2 properties changed title vesting only – no actual market sales occurred.

This page left blank intentionally.
Technical Memorandum 620, Cost Estimating Methodology for CSO Control Facilities (May 2011) C-5
Table C-2. Industrial Property Values for Land Only
Cost per SF, Jan 2007 to Aug 2010
DSN Uncontrolled CSO Basin
Location of Project
Address Used for Search
# of Sales
Sales Range (per Quarter) Average Comments
028 King Street Regulator
Sodo/ Central Waterfront
499 Alaskan Way S., Seattle
1 $24.12 $24.12 4 out of 5 sales were not good comparable sales (See Note A )
029 Connecticut St. Regulator (King Dome)
Sodo/ Central Waterfront
1199 Alaskan Way S., Seattle
1 $24.12 $24.12 4 out of 5 sales were not good comparable sales (See Note A )
030 Lander Street Duwamish 2401 Utah Ave, Seattle
1 $24.12 $24.12 4 out of 5 sales were not good comparable sales (See Note A )
031 Hanford @ Rainier (Hanford #1)
Duwamish 4501 E. Marginal Way S., Seattle
3 $19.99 - $24.12
$22.12 5 out of 8 sales were not good comparable sales (See Note B )
032 Hanford @ Rainier (Hanford #2)
Duwamish 2999 E. Marginal Way S., Seattle
1 $24.12 $24.12 5 out of 6 sales were not good comparable sales (See Note C )
036 Chelan Avenue Regulator
Duwamish 3455 Chelan Ave SW, Seattle
1 $24.12 $24.12 4 out of 5 sales were not good comparable sales (See Note D)
038 Terminal #115 Overflow
Duwamish 6700 W. Marginal Way SW, Seattle
3 $19.99 - $24.84
$23.19 3 out of 7 sales were not good comparable sales (See Note E )
039 South Michigan Regulator
Duwamish 159 S. Michigan, Seattle
5 $19.99 - $24.84
$22.44 3 out of 8 sales were not good comparable sales (See Note E)
041 Brandon Street Regulator
Duwamish 5241 E. Marginal Way S., Seattle
3 $19.99 - $24.12
$22.12 4 out of 7 sales were not good comparable sales (See Note D)
042 West Michigan Regulator
Duwamish 6769 W. Marginal Way SW, Seattle
4 $19.99 - $24.84
$23.19 3 out of 7 sales were not good comparable sales (See Note E)
004 11th Avenue West
Ship Canal 5110 Shilshole Ave NW, Seattle
1 $21.91 $21.91 1 out of 2 sales were not good comparable sales (See Note F )
008 3rd Avenue NW Ship Canal 5110 Shilshole Ave NW, Seattle
1 $21.91 $21.91 1 out of 2 sales were not good comparable sales (See Note F)
009 Dexter Avenue Regulator
Ship Canal 1419 Dexter Ave N., Seattle
1 $21.91 $21.91 3 out of 4 sales were not good comparable sales (See Note G)
014 Montlake Regulator
Ship Canal 2910 Montlake Blvd E., Seattle
0 -0- -0- See Note H
015 University Regulator
Ship Canal 1901 NE Pacific Place, Seattle
0 -0- -0- See Note H

Technical Memorandum 620, Cost Estimating Methodology for CSO Control Facilities (May 2011) C-6
Note A: 1 property sold as a leasehold estate and was never on the market (3480 – 3490 W. Marginal Way SW); 2 properties sold w/ large buildings (1313 E. Columbia & 1200 S. Dearborn); 1 property sold w/ related principles involved (1531 Utah Ave S).
Note B: 1 property sold outside the market (9311 4th Ave S); 1 property sold w/ a large building (1200 S.
Dearborn); 1 property sold as a leasehold estate and was never on the market (3480 – 3490 W. Marginal Way SW); 2 properties sold w/ related principles involved (1531 Utah Ave S & 5600 – 5610 Marginal Way SW).
Note C: 1 property sold as a leasehold estate and was never on the market (3480 – 3490 W. Marginal Way SW); 2 properties sold w/ large buildings (1313 E. Columbia & 1200 S. Dearborn); 2 properties sold w/ related principles involved (1531 Utah Ave S & 5600 – 5610 Marginal Way SW).
Note D: 1 property sold w/ a large building (1200 S. Dearborn); 1 property sold as a leasehold estate and was never on the market (3480 – 3490 W. Marginal Way SW); 2 properties sold w/ related principles involved (1531 Utah Ave S & 5600 – 5610 Marginal Way SW).
Note E: 1 property sold outside the market (9311 4th Ave S); 1 property sold as a leasehold estate and
was never on the market (3480 – 3490 W. Marginal Way SW); 1 property sold w/ related principles involved (5600 – 5610 Marginal Way SW).
Note F: 1 property was purchased by the City of Seattle for future development. However, no sales information was readily available. Will need further investigation to find market sales price.
Note G: 2 properties sold w/ large buildings (1313 E. Columbia & 1200 S. Dearborn); 1 property sold w/ related principles involved (1531 Utah Ave S).
Note H: No sales of land only during this period. Only one property sale sold w/in 3-mile radius. Property was bought by Seattle Univ for future expansion. Property sold w/ a 2-story building on it for $168.16/SF. There are currently no Land Only “For Sale” Listings at all w/in a 3-mile radius of this address.
Technical Memorandum 620, Cost Estimating Methodology for CSO Control Facilities (May 2011) D-1
APPENDIX D.PRISM MODEL FOR
ESTIMATING ALLIED COSTS

This page left blank intentionally.

Allied Cost Calculation for Construction Costs $1 million - $5 million (Example Project Construction Cost = $2 million)
Special Logic
Misc. Capital Costs 0.28% 5,600 0.28% 5,600 0.28% 5,600 0.28% 5,600 0.28% 5,600 0.28% 5,600
Engineering Design Services 25.00% 500,000 23.00% 460,000 30.00% 600,000 0 0 0
Engineering Svcs During Const 2.00% 40,000 2.00% 40,000 2.00% 40,000 0 0 0
Construction Mgmt Svcs 12.00% 240,000 15.00% 300,000 18.00% 360,000 0 0 0
Other Technical Services 0 0 0 0.00% 0 0.00% 0 0.00% 0
Permits & Licenses 1.00% 20,000 1.00% 20,000 1.00% 20,000 1.00% 20,000 1.00% 20,000 1.00% 20,000
Local Agency Project Costs 0.25% 5,000 0.25% 5,000 0.25% 5,000 0.25% 5,000 0.25% 5,000 0.25% 5,000
Office & Transportation Costs 0.60% 12,000 0.60% 12,000 0.60% 12,000 0.60% 12,000 0.60% 12,000 0.60% 12,000
Misc. Equipment, Supplies & Safety 0.40% 8,000 0.40% 8,000 0.40% 8,000 0.40% 8,000 0.40% 8,000 0.40% 8,000
Professional Development/Travel 0.05% 1,000 0.05% 1,000 0.05% 1,000 0.05% 1,000 0.05% 1,000 0.05% 1,000
Printing, Courier & Media Services 0.25% 5,000 0.25% 5,000 0.25% 5,000 0.25% 5,000 0.25% 5,000 0.25% 5,000
Misc. Services & Premiums 0.50% 10,000 0.50% 10,000 0.50% 10,000 0.50% 10,000 0.50% 10,000 0.50% 10,000
Central Services 1.25% 25,000 1.25% 25,000 1.25% 25,000 1.25% 25,000 1.25% 25,000 1.25% 25,000
Legal Services 0.65% 13,000 0.65% 13,000 0.65% 13,000 0.65% 13,000 0.65% 13,000 0.65% 13,000 User Choice
WLRD 0.75% 15,000 0.75% 15,000 0.75% 15,000 0.75% 15,000 0.75% 15,000 0.75% 15,000 User Choice
DNRP 0.02% 400 0.02% 400 0.02% 400 0.02% 400 0.02% 400 0.02% 400
Other 0.15% 3,000 0.15% 3,000 0.15% 3,000 0.15% 3,000 0.15% 3,000 0.15% 3,000
4100 WTD Manager's Office 0.04% 800 0.04% 800 0.04% 800 0.04% 800 0.04% 800 0.04% 800
4200 Finance & Administrative Services 0.04% 800 0.04% 800 0.04% 800 0.04% 800 0.04% 800 0.04% 800
4400 East Operations 0 0 0 0.00% 0 0.00% 0 0.00% 0 User Choice (0.50% Total)
4500 West Operations 0.50% 10,000 0.25% 5,000 0.35% 7,000 0.50% 10,000 0.25% 5,000 0.35% 7,000 User Choice (0.50% Total)
4600 Resource Recovery Programs & Mgt 0.01% 200 0.01% 200 0.01% 200 0.01% 200 0.01% 200 0.01% 200
4751 Community Svcs Planning 0.05% 1,000 0.20% 4,000 0.15% 3,000 0.05% 1,000 0.20% 4,000 0.15% 3,000
4752 Environmental Planning & Mgt 0.20% 4,000 0.20% 4,000 0.20% 4,000 0.20% 4,000 0.20% 4,000 0.20% 4,000
4761/62 Permitting, Right of Way & Monitoring 0.23% 4,600 0.23% 4,600 0.23% 4,600 0.23% 4,600 0.23% 4,600 0.23% 4,600
4803 Project Planning & Delivery Mgt 0.15% 3,000 0.15% 3,000 0.15% 3,000 0.15% 3,000 0.15% 3,000 0.15% 3,000
4805 Technical Resources Mgt 1.00% 20,000 1.00% 20,000 1.00% 20,000 1.00% 20,000 1.00% 20,000 1.00% 20,000 Use if Section = AM Else 0.10%
4806 Modeling & GIS Support 0.00% 0 0.00% 0 0.00% 0 0.00% 0 0.00% 0 0.00% 0
4850 Project Engineering 1.00% 20,000 1.00% 20,000 1.00% 20,000 28.00% 560,000 26.00% 520,000 33.00% 660,000
4808/09/16 Planning, Asset Mgmt & Mgmt 0.10% 2,000 0.10% 2,000 0.10% 2,000 0.10% 2,000 0.10% 2,000 0.10% 2,000 Use if Section = AM or Planning
4840 Facilities Inspection 0.40% 8,000 0.30% 6,000 0.30% 6,000 0.40% 8,000 0.30% 6,000 0.30% 6,000 Use if Section = AM Else 0.05%
4830 Construction Management 2.00% 40,000 2.00% 40,000 2.00% 40,000 14.00% 280,000 17.00% 340,000 20.00% 400,000
4880 Project Management 2.25% 45,000 2.25% 45,000 2.25% 45,000 2.25% 45,000 2.25% 45,000 2.25% 45,000
4990 Project Controls 1.00% 20,000 1.00% 20,000 1.00% 20,000 1.00% 20,000 1.00% 20,000 1.00% 20,000
Subtotal WTD Support 8.97% 179,400 8.77% 175,400 8.82% 176,400 47.97% 959,400 48.77% 975,400 58.82% 1,176,400
Total 54.12% 1,082,400 54.92% 1,098,400 64.97% 1,299,400 54.12% 1,082,400 54.92% 1,098,400 64.97% 1,299,400
Consultant In-House
Treatment Conveyance Pump Station Treatment Conveyance Pump Station

This page is left blank intentionally.

Allied Cost Calculation for Construction Costs $5 million - $10 million (Example Project Construction Cost = $6 million)
Special Logic
Misc. Capital Costs 0.28% 16,800 0.28% 16,800 0.28% 16,800 0.28% 16,800 0.28% 16,800 0.28% 16,800
Engineering Design Services 22.00% 1,320,000 21.00% 1,260,000 28.00% 1,680,000 0 0 0
Engineering Svcs During Const 3.00% 180,000 3.00% 180,000 3.00% 180,000 0 0 0
Construction Mgmt Svcs 12.00% 720,000 12.00% 720,000 12.00% 720,000 0 0 0
Other Technical Services 0 0 0 0.00% 0 0.00% 0 0.00% 0
Permits & Licenses 1.00% 60,000 1.00% 60,000 1.00% 60,000 1.00% 60,000 1.00% 60,000 1.00% 60,000
Local Agency Project Costs 0.25% 15,000 0.25% 15,000 0.25% 15,000 0.25% 15,000 0.25% 15,000 0.25% 15,000
Office & Transportation Costs 0.50% 30,000 0.50% 30,000 0.50% 30,000 0.50% 30,000 0.50% 30,000 0.50% 30,000
Misc. Equipment, Supplies & Safety 0.40% 24,000 0.40% 24,000 0.40% 24,000 0.40% 24,000 0.40% 24,000 0.40% 24,000
Professional Development/Travel 0.05% 3,000 0.05% 3,000 0.05% 3,000 0.05% 3,000 0.05% 3,000 0.05% 3,000
Printing, Courier & Media Services 0.25% 15,000 0.25% 15,000 0.25% 15,000 0.25% 15,000 0.25% 15,000 0.25% 15,000
Misc. Services & Premiums 0.50% 30,000 0.50% 30,000 0.50% 30,000 0.50% 30,000 0.50% 30,000 0.50% 30,000
Central Services 1.50% 90,000 1.50% 90,000 1.50% 90,000 1.50% 90,000 1.50% 90,000 1.50% 90,000
Legal Services 0.65% 39,000 0.65% 39,000 0.65% 39,000 0.65% 39,000 0.65% 39,000 0.65% 39,000 User Choice
WLRD 0.75% 45,000 0.75% 45,000 0.75% 45,000 0.75% 45,000 0.75% 45,000 0.75% 45,000 User Choice
DNRP 0.02% 1,200 0.02% 1,200 0.02% 1,200 0.02% 1,200 0.02% 1,200 0.02% 1,200
Other 0.15% 9,000 0.15% 9,000 0.15% 9,000 0.15% 9,000 0.15% 9,000 0.15% 9,000
4100 WTD Manager's Office 0.04% 2,400 0.04% 2,400 0.04% 2,400 0.04% 2,400 0.04% 2,400 0.04% 2,400
4200 Finance & Administrative Services 0.04% 2,400 0.04% 2,400 0.04% 2,400 0.04% 2,400 0.04% 2,400 0.04% 2,400
4400 East Operations 0 0 0 0.00% 0 0.00% 0 0.00% 0 User Choice (0.50% Total)
4500 West Operations 0.50% 30,000 0.25% 15,000 0.35% 21,000 0.50% 30,000 0.25% 15,000 0.35% 21,000 User Choice (0.50% Total)
4600 Resource Recovery Programs & Mgt 0.01% 600 0.01% 600 0.01% 600 0.01% 600 0.01% 600 0.01% 600
4751 Community Svcs Planning 0.05% 3,000 0.25% 15,000 0.15% 9,000 0.05% 3,000 0.25% 15,000 0.15% 9,000
4752 Environmental Planning & Mgt 0.25% 15,000 0.25% 15,000 0.25% 15,000 0.25% 15,000 0.25% 15,000 0.25% 15,000
4761/62 Permitting, Right of Way & Monitoring 0.23% 13,800 0.23% 13,800 0.23% 13,800 0.23% 13,800 0.23% 13,800 0.23% 13,800
4803 Project Planning & Delivery Mgt 0.15% 9,000 0.15% 9,000 0.15% 9,000 0.15% 9,000 0.15% 9,000 0.15% 9,000
4805 Technical Resources Mgt 1.00% 60,000 1.00% 60,000 1.00% 60,000 1.00% 60,000 1.00% 60,000 1.00% 60,000 Use if Section = AM Else 0.10%
4806 Modeling & GIS Support 0.00% 0 0.00% 0 0.00% 0 0.00% 0 0.00% 0 0.00% 0
4850 Project Engineering 1.00% 60,000 1.00% 60,000 1.00% 60,000 26.00% 1,560,000 25.00% 1,500,000 32.00% 1,920,000
4808/09/16 Planning, Asset Mgmt & Mgmt 0.10% 6,000 0.10% 6,000 0.10% 6,000 0.10% 6,000 0.10% 6,000 0.10% 6,000 Use if Section = AM or Planning
4840 Facilities Inspection 0.35% 21,000 0.25% 15,000 0.25% 15,000 0.35% 21,000 0.25% 15,000 0.25% 15,000 Use if Section = AM Else 0.05%
4830 Construction Management 2.00% 120,000 2.00% 120,000 2.00% 120,000 14.00% 840,000 14.00% 840,000 14.00% 840,000
4880 Project Management 2.00% 120,000 2.00% 120,000 2.00% 120,000 2.00% 120,000 2.00% 120,000 2.00% 120,000
4990 Project Controls 1.10% 66,000 1.10% 66,000 1.10% 66,000 1.10% 66,000 1.10% 66,000 1.10% 66,000
Subtotal WTD Support 8.82% 529,200 8.67% 520,200 8.67% 520,200 45.82% 2,749,200 44.67% 2,680,200 51.67% 3,100,200
Total 52.12% 3,127,200 50.97% 3,058,200 57.97% 3,478,200 52.12% 3,127,200 50.97% 3,058,200 57.97% 3,478,200
Consultant In-House
Treatment Conveyance Pump Station Treatment Conveyance Pump Station

This page is left blank intentionally.
Allied Cost Calculation for Construction Costs > $10 million (Example Project Construction Cost = $12 million)
Special Logic
Misc. Capital Costs 0.28% 33,600 0.28% 33,600 0.28% 33,600 0.28% 33,600 0.28% 33,600 0.28% 280
Engineering Design Services 18.00% 2,160,000 18.00% 2,160,000 18.00% 2,160,000 0 0 0
Engineering Svcs During Const 4.00% 480,000 4.00% 480,000 4.00% 480,000 0 0 0
Construction Mgmt Svcs 9.00% 1,080,000 9.00% 1,080,000 9.00% 1,080,000 0 0 0
Other Technical Services 0 0 0 0.00% 0 0.00% 0 0.00% 0
Permits & Licenses 1.00% 120,000 1.00% 120,000 1.00% 120,000 1.00% 120,000 1.00% 120,000 1.00% 1,000
Local Agency Project Costs 0.25% 30,000 0.25% 30,000 0.25% 30,000 0.25% 30,000 0.25% 30,000 0.25% 250
Office & Transportation Costs 0.50% 60,000 0.50% 60,000 0.50% 60,000 0.50% 60,000 0.50% 60,000 0.50% 500
Misc. Equipment, Supplies & Safety 0.40% 48,000 0.40% 48,000 0.40% 48,000 0.40% 48,000 0.40% 48,000 0.40% 400
Professional Development/Travel 0.05% 6,000 0.05% 6,000 0.05% 6,000 0.05% 6,000 0.05% 6,000 0.05% 50
Printing, Courier & Media Services 0.20% 24,000 0.20% 24,000 0.20% 24,000 0.20% 24,000 0.20% 24,000 0.20% 200
Misc. Services & Premiums 0.50% 60,000 0.50% 60,000 0.50% 60,000 0.50% 60,000 0.50% 60,000 0.50% 500
Central Services 1.75% 210,000 1.75% 210,000 1.75% 210,000 1.75% 210,000 1.75% 210,000 1.75% 1,750
Legal Services 0.65% 78,000 0.65% 78,000 0.65% 78,000 0.65% 78,000 0.65% 78,000 0.65% 650 User Choice
WLRD 0.75% 90,000 0.75% 90,000 0.75% 90,000 0.75% 90,000 0.75% 90,000 0.75% 750 User Choice
DNRP 0.02% 2,400 0.02% 2,400 0.02% 2,400 0.02% 2,400 0.02% 2,400 0.02% 20
Other 0.15% 18,000 0.15% 18,000 0.15% 18,000 0.15% 18,000 0.15% 18,000 0.15% 150
4100 WTD Manager's Office 0.04% 4,800 0.04% 4,800 0.04% 4,800 0.04% 4,800 0.04% 4,800 0.04% 40
4200 Finance & Administrative Services 0.04% 4,800 0.04% 4,800 0.04% 4,800 0.04% 4,800 0.04% 4,800 0.04% 40
4400 East Operations 0 0 0 0.00% 0 0.00% 0 0.00% 0 User Choice (0.50% Total)
4500 West Operations 0.50% 60,000 0.25% 30,000 0.35% 42,000 0.50% 60,000 0.25% 30,000 0.35% 350 User Choice (0.50% Total)
4600 Resource Recovery Programs & Mgt 0.01% 1,200 0.01% 1,200 0.01% 1,200 0.01% 1,200 0.01% 1,200 0.01% 10
4751 Community Svcs Planning 0.10% 12,000 0.30% 36,000 0.20% 24,000 0.10% 12,000 0.30% 36,000 0.20% 200
4752 Environmental Planning & Mgt 0.30% 36,000 0.30% 36,000 0.30% 36,000 0.30% 36,000 0.30% 36,000 0.30% 300
4761/62 Permitting, Right of Way & Monitoring 0.23% 27,600 0.23% 27,600 0.23% 27,600 0.23% 27,600 0.23% 27,600 0.23% 230
4803 Project Planning & Delivery Mgt 0.15% 18,000 0.15% 18,000 0.15% 18,000 0.15% 18,000 0.15% 18,000 0.15% 150
4805 Technical Resources Mgt 1.00% 120,000 1.00% 120,000 1.00% 120,000 1.00% 120,000 1.00% 120,000 1.00% 1,000 Use if Section = AM Else 0.10%
4806 Modeling & GIS Support 0.00% 0 0.00% 0 0.00% 0 0.00% 0 0.00% 0 0.00% 0
4850 Project Engineering 1.00% 120,000 1.00% 120,000 1.00% 120,000 23.00% 2,760,000 23.00% 2,760,000 23.00% 23,000
4808/09/16 Planning, Asset Mgmt & Mgmt 0.10% 12,000 0.10% 12,000 0.10% 12,000 0.10% 12,000 0.10% 12,000 0.10% 100 Use if Section = AM or Planning
4840 Facilities Inspection 0.30% 36,000 0.20% 24,000 0.20% 24,000 0.30% 36,000 0.20% 24,000 0.20% 200 Use if Section = AM Else 0.05%
4830 Construction Management 2.00% 240,000 2.00% 240,000 2.00% 240,000 11.00% 1,320,000 11.00% 1,320,000 11.00% 11,000
4880 Project Management 1.75% 210,000 1.75% 210,000 1.75% 210,000 1.75% 210,000 1.75% 210,000 1.75% 1,750
4990 Project Controls 1.20% 144,000 1.20% 144,000 1.20% 144,000 1.20% 144,000 1.20% 144,000 1.20% 1,200
Subtotal WTD Support 8.72% 1,046,400 8.57% 1,028,400 8.57% 1,028,400 39.72% 4,766,400 39.57% 4,748,400 39.57% 39,570
Total 46.22% 5,546,400 46.07% 5,528,400 46.07% 5,528,400 46.22% 5,546,400 46.07% 5,528,400 46.07% 46,070
Consultant In-House
Treatment Conveyance Pump Station Treatment Conveyance Pump Station

This page is left blank intentionally.

Technical Memorandum 620, Cost Estimating Methodology for CSO Control Facilities (May 2011) E-1
APPENDIX E.METHODOLOGY AND
ASSUMPTIONS TO DEVELOP OPERATIONS
AND MAINTENANCE COSTS OF CSO
CONTROL FACILITIES

This page left blank intentionally.
-
MEMORANDUM
DATE: FEBRUARY 21, 2011 FROM: KAREN HUBER, CSO CONTROL PLANNING SUBJECT: 2012 CSO CONTROL ALTERNATIVE O&M COST ESTIMATING
O&M Cost Estimate
This methodology is based on the spreadsheet used to develop O&M storage facility costs for the 1995 King County CSO update report and an update done to it in 2002. For this 2012 CSO Control Program Review cost estimates were updated by Offsite and Facilities Inspection input. Included in this memo are descriptions of the methodology and assumptions used in the O&M cost estimating spreadsheet, 2012 O&M Cost Template.xls.
O&M COST ESTIMATE METHODOLOGY AND ASSUMPTIONS
ENR: 8645.35 (CCI City of Seattle Jan. 2010)
Compared to base memo ENR of 5747 (Seattle - May 1994) Operation and Maintenance Labor Rates: $51.17 /Hr.(fully loaded)
1. GRAVITY SEWER/COMBINED SEWER PIPELINES A. Maintenance: Item: Maintenance and inspection expenditures Methodology: Metro currently spends approximately $1.5 million per year on sewer inspection, maintenance, repairs, T.V. inspection, and cleaning, The current estimate is that Metro has jurisdiction over 270 miles of sewer. This computes to an O&M estimate of approximately $1.05/LF of pipe. Ch Now have 375 miles, recommended escalating the cost to 2010, which results in a cost of $1.51/LF. Conclusion: Use $1.51/LF for total annual maintenance costs for combined sewer and dedicated sewer lines.
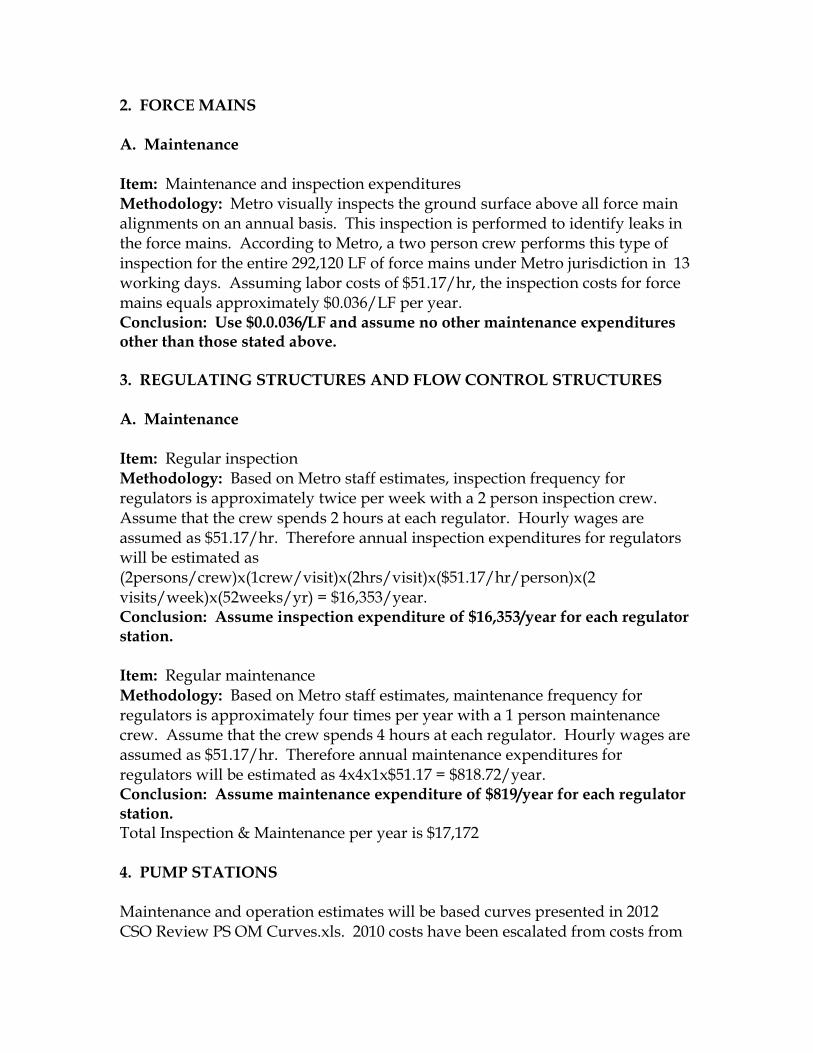
2. FORCE MAINS A. Maintenance Item: Maintenance and inspection expenditures Methodology: Metro visually inspects the ground surface above all force main alignments on an annual basis. This inspection is performed to identify leaks in the force mains. According to Metro, a two person crew performs this type of inspection for the entire 292,120 LF of force mains under Metro jurisdiction in 13 working days. Assuming labor costs of $51.17/hr, the inspection costs for force mains equals approximately $0.036/LF per year. Conclusion: Use $0.0.036/LF and assume no other maintenance expenditures other than those stated above. 3. REGULATING STRUCTURES AND FLOW CONTROL STRUCTURES A. Maintenance Item: Regular inspection Methodology: Based on Metro staff estimates, inspection frequency for regulators is approximately twice per week with a 2 person inspection crew. Assume that the crew spends 2 hours at each regulator. Hourly wages are assumed as $51.17/hr. Therefore annual inspection expenditures for regulators will be estimated as (2persons/crew)x(1crew/visit)x(2hrs/visit)x($51.17/hr/person)x(2 visits/week)x(52weeks/yr) = $16,353/year. Conclusion: Assume inspection expenditure of $16,353/year for each regulator station. Item: Regular maintenance Methodology: Based on Metro staff estimates, maintenance frequency for regulators is approximately four times per year with a 1 person maintenance crew. Assume that the crew spends 4 hours at each regulator. Hourly wages are assumed as $51.17/hr. Therefore annual maintenance expenditures for regulators will be estimated as 4x4x1x$51.17 = $818.72/year. Conclusion: Assume maintenance expenditure of $819/year for each regulator station. Total Inspection & Maintenance per year is $17,172 4. PUMP STATIONS Maintenance and operation estimates will be based curves presented in 2012 CSO Review PS OM Curves.xls. 2010 costs have been escalated from costs from

the March 1985 "Operations and Maintenance Cost Curves" document, as well as upon detailed County pump station data developed in 2001 as presented in the spreadsheet. The curves are based not on peak capacity of the pump stations but instead on peak capacity multiplied by the head of the pump station (therefore expressed in terms of mgd-ft). Therefore an estimate of the total dynamic head will be made for each of our pump stations. The formulas behind the curves have been used in the O&M Template. A determination will have to be made as to the number of days per year each pump station will be operating. This assumption will not have to be made for pump stations built as part of a storage facility since this frequency assumption will have to be made for the storage facility itself 12 hrs or 0.5 days to pump out the storage tank). Based upon an estimate of 2 days per operating event, a factor of (2*ev/Y)/365 will be applied to the costs obtained from the above curves which will account for the intermittent operation of the pump station. Odor Control for pump stations: Carbon, energy and spent carbon disposal costs are included in the cost curve equations. 5. HIGH-RATE SEDIMENTATION FACILITIES – BALLASTED For CEPC WITH LAMELLA PLATES delete costs for sand. Item: Equalization Storage. Most treatment facilities will include equalization storage. Methodology: O&M costs for rectangular storage should be used. Item: Influent Pump Station. Most treatment facilities will include an influent pump station. Methodology: O&M costs for pump station should be used. Item: Operation and Maintenance and Energy Expenditures Methodology: Actual data from the 4 existing County CSO plants was assessed for years 2006-09. Hypochlorite and Bisulfite for disinfection and dechlorination was pulled out. No correlation was seen in spending against volume or events. Maintenance was sees to occur year round – corrective and preventative maintenance was seen to be occurring during non-operating periods. A level of activity occurs regularly to ensure the plant is ready for operation on short notice – equipment must be tested and calibrated, chemicals must be restocked, etc. Annual costs for staffing and non-chemical costs fell out into 3 groups – simple applied to facilities that functioned more as storage (e.g. Henderson/MLK

facility), medium (similar to Carkeek w/o pumping and Alki), and complex (Elliott West). Review of this information and discussion with O&M staff indicated that supervisory, compliance related hours (reporting, strategizing, negotiating), and many I&C activities were charged to single work orders, and so were not accounted for in facility specific IBIS data. It was recommended that the FTEs be increased by 1.0/y at complex facilities, 0.5/y at the medium and simple facilities. This resulted in the following: Basic Facility (staff,
HVAC, Facility
Readiness)
Vol
Managed/Y
Op days/Y $/Y FTE
Minimum/Simple <25 <10 $ 80,000 0.9
Medium Facility 25-50 10-20 $ 135,000 1.1
Complex Single Site >100 20-50 $ 290,600 1.8
Complex Consolidated Site >100 20-50 $ 380,400 2.7
Start-up for 3+ Years $1-2 M Capital/Y
1.0 FTE O&M
It is also recommended that O&M staffing be formally identified for the capital project development and implementation stages due to the significant time required to participate in teams, communicate with other O&M staff about proposals, and review/comment on documents. Treatment projects will need to have 2.0 additional FTE of O&M staff assigned during all project phases. Storage and conveyance projects will need about 0.5 FTE of O&M staff assigned during all project phases. After the first 1-2 of these projects protocols and equipment needs may be established as a template for later projects – staffing may be reduced for later projects. This will be coordinated with the WTD allied cost model. Item: Chemical Costs (Ballast Sand and Polymers) Methodology: Coagulant: Coagulant is assumed to be PAX or ACH, dosed at 12 mg/l based on King County’s CSO pilot study. ACH coagulant is estimated at $5/gal based on information provided by the City of Bremerton. Assume use of coagulant at 12 mg/l, 1.33 kg/l, 10% Al by weight. Gallons of coagulant required is then calculated as: Coagulant (gal/year) = (Volume, MG/yr) *12/1.33/0.1

Polymer: Polymer cost is estimated at $4/lb based on information provided by the City of Bremerton. Assume polymer is dosed at 2 mg/l, then pounds of polymer required is calculated as: Polymer (lbs/year) = (Volume, MG/yr) * 2 * (2.2*3.78) Sand: Only added if ballasted treatment is selected. Sand usage is estimated at 4 lbs/MG treated. Sand costs are estimated at $0.07/lb plus $0.24/lb shipping based on information provided by the City of Bremerton. The sand required is calculated as: Sand (lbs/year) = (Volume, MG/yr) * 4 Bioxide: Bioxide may be used to reduce sulfate formation in the separated solids prior to their return to the collection system. Bioxide cost is estimated at $2.23/gal based on King County’s existing purchase price. Bioxide use is estimated at 1000gal/MG of solids, based on an application rate of 0.7 gal/lb H2S potential and a 2 day detention time. The solids concentration is estimated at 2%. The volume of solids is calculated as: Solids (MG/year) = (Volume, MG/yr) * TSS (mg/l) * 10-6/0.02 The amount of bioxide required is calculated as: Bioxide (gal/year) = (Solids, MG/yr) * 1000 Item: Disinfection costs (UV or chlorination) Methodology: Disinfection is provided either by UV or chlorination using hypochlorite. UV: Medium pressure lamps are assumed. Energy usage is assumed to be 500 kWH/MG, and is calculated as:
Energy (kWh/year) = (Volume, MG/yr) * 500 Bulb replacement is estimated at 10%/year based on City of Bremerton experience. Number of bulbs is estimated assuming a 2.5 kW bulb and a power requirement of 11.2 kW/MGD. The number of replacement bulbs is calculated as: Bulbs (number/year) = (Capacity, MGD)*(11.2/2.5)*0.1 Chlorination: Chlorine costs will be estimated based on a dosing rate of 15 mg/l hypochlorite for the annual estimated overflow volume. Assume use of hypochlorite @ $0.73/gal, 10.35 lb./gal and 12.5% solution (King County 2010 costs). Gallons of NaOCl required is then calculated as: NaOCl (gal/year) = (Volume, MG/yr) * 8.34 * 15.0/(0.125*10.35) Dechlorination: Add Sodium Bisulfite for dechlorination. Assume Sodium Bisulfite at 38% solution and $1.85/gal. Gallons of Sodium Bisulfite required is then calculated as: (gal/year) = (NaOCl gal/year)/(38%/12.5%)
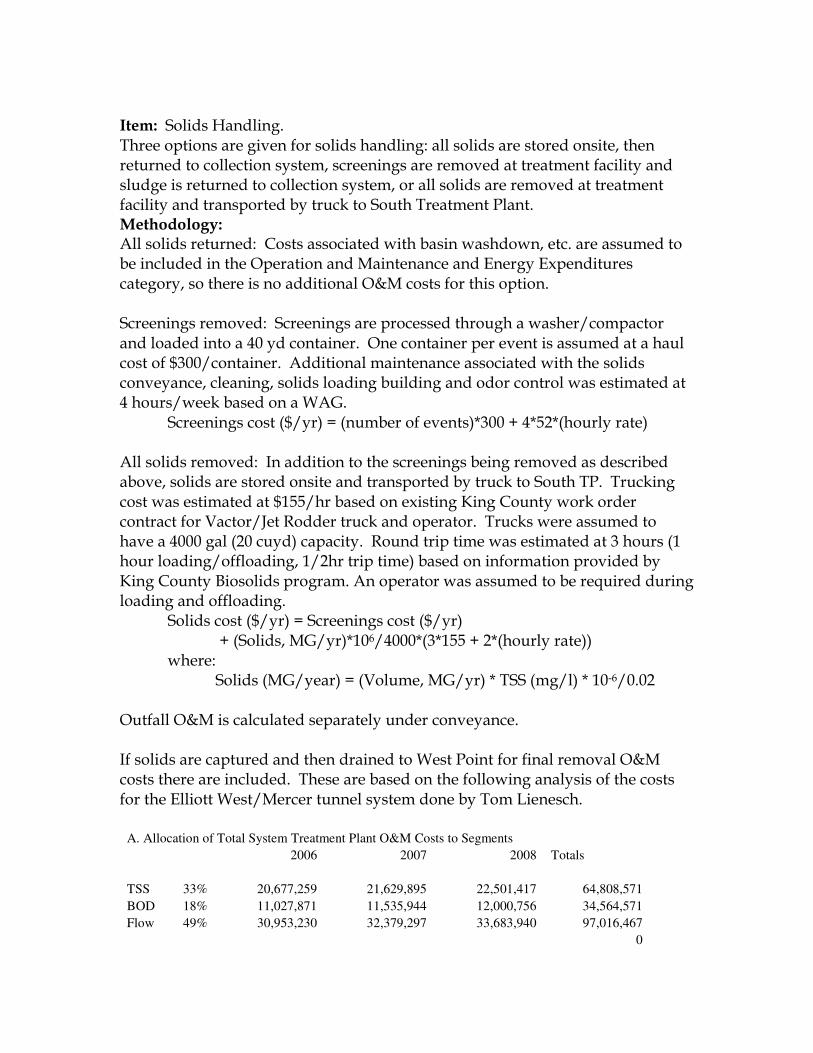
Item: Solids Handling. Three options are given for solids handling: all solids are stored onsite, then returned to collection system, screenings are removed at treatment facility and sludge is returned to collection system, or all solids are removed at treatment facility and transported by truck to South Treatment Plant. Methodology: All solids returned: Costs associated with basin washdown, etc. are assumed to be included in the Operation and Maintenance and Energy Expenditures category, so there is no additional O&M costs for this option. Screenings removed: Screenings are processed through a washer/compactor and loaded into a 40 yd container. One container per event is assumed at a haul cost of $300/container. Additional maintenance associated with the solids conveyance, cleaning, solids loading building and odor control was estimated at 4 hours/week based on a WAG. Screenings cost ($/yr) = (number of events)*300 + 4*52*(hourly rate) All solids removed: In addition to the screenings being removed as described above, solids are stored onsite and transported by truck to South TP. Trucking cost was estimated at $155/hr based on existing King County work order contract for Vactor/Jet Rodder truck and operator. Trucks were assumed to have a 4000 gal (20 cuyd) capacity. Round trip time was estimated at 3 hours (1 hour loading/offloading, 1/2hr trip time) based on information provided by King County Biosolids program. An operator was assumed to be required during loading and offloading. Solids cost ($/yr) = Screenings cost ($/yr)
+ (Solids, MG/yr)*106/4000*(3*155 + 2*(hourly rate)) where:
Solids (MG/year) = (Volume, MG/yr) * TSS (mg/l) * 10-6/0.02 Outfall O&M is calculated separately under conveyance. If solids are captured and then drained to West Point for final removal O&M costs there are included. These are based on the following analysis of the costs for the Elliott West/Mercer tunnel system done by Tom Lienesch.
A. Allocation of Total System Treatment Plant O&M Costs to Segments
2006 2007 2008 Totals
TSS 33% 20,677,259 21,629,895 22,501,417 64,808,571
BOD 18% 11,027,871 11,535,944 12,000,756 34,564,571
Flow 49% 30,953,230 32,379,297 33,683,940 97,016,467
0

Totals 1 $62,658,360 $65,545,137 $68,186,113 $196,389,610
B. Cost Per Unit (total costs per physical units)
2006 2007 2008
TSS lb $0.1823 $0.1753 $0.1835
BOD lb $0.1193 $0.1037 $0.1026
Flow mg $429.8194 $498.3171 $522.8406
Total pounds BOD and TSS, and volume of flow are calculated with the unit costs to identify annual costs to treat stored solids and flows from the CSO facility at West Point. 7. TUNNELS Item: Regular inspection Methodology: Metro conducts T.V. inspection of concrete tunnels on a 10-15 year rotation and T.V. inspections of brick lined tunnels on a 5 year rotation. All inspection work is done by outside contract. A 2009 inspection contract for the ESI Tunnels was for $11/LF, or escalated to 2010 at 3% is $11.33/LF. Conclusion: Assume that new tunnels will be inspected on a 10 year rotation and the unit cost for the tunnel inspection will be assumed to be $1.13/LF/Y 9. RECTANGULAR STORAGE TANKS A. Operation Item: Annual operating costs associated with energy consumption for pumps. Methodology: For the most part, each storage facility is located in the vicinity of one of Metro's overflow regulator stations, and thus will be receiving and storing the overflow volume from each regulator station. Overflow events occur throughout the year, and the number of overflow events that occur differ amongst all of the regulator stations. Estimate the number of hours per year that the pump stations within these storage facilities will be operating on an annual basis, from current hydraulic modeling. An assumption is then made that one overflow event will require 12 hrs or 0.5 days to be pumped out. Smaller overflow events will of course overflow smaller volumes and will therefore require less time to pump out.) For example, if at a particular regulator station, overflow frequency was determined to be 20 times per year, then it is assumed that the pumps will be operating for 10 days per year, at peak flow rate. Horsepower is calculated as Hp= ((Q) x (H) x (Specific Gravity of Water))/(550 * Pump Efficiency)

where, Q = Peak design rate of pump station (MGD) H = Total dynamic head of pump station (ft) Specific Gravity = 62.4 lb/cubic feet Pump Efficiency = 0.70 550 ft lbs/sec = 1 hp KW requirements are assumed to equal (Pump Hp x(0.746 KW/Hp))/Motor Efficiency Annual usage of pump station equals 12 times the number of overflow events per year, in hours (as described above) Annual power costs = KW x Usage (hours) x (cost per KWH) Conclusion: Use the above equations to compute $/year for energy consumption for pump stations located in storage facilities. Item: Annual operating costs associated with energy consumption for aeration Methodology: Assume 10 Hp per MG for aeration and mixing in storage facility. Assume that aeration and mixing will operate throughout the rainy season (assume 1/2 year = 4383 hours) Conclusion: Use the following equation to develop annual energy costs for aeration and mixing:
Total Hp= (Volume of Tank MG)x(10 hp/MG)x(.065 $/kwh)x (4383 hrs/year)
2010 Seattle City Light cost per kwh is $0.065 Item: Annual operating costs associated with energy consumption and chemical consumption for odor control. Methodology: Operating costs were estimated assuming forced air systems providing one air change per hour and activated carbon control facilities. Annual costs to change the carbon at 1 year intervals and power to operate the systems were estimated on the basis of unit storage volume. Conclusion: Use the following equation to develop annual operating costs for odor control Total horsepower = 10*storage volume in MG B. Maintenance: Item: Cleaning of storage facilities. Methodology: City of Seattle maintains (2) 1.5 MG circular storage facilities. Annual cleaning of these facilities require 5 crew days each with a crew size of 5 people. Therefore, we will assume 200 Hours/1.5 MG/Year which equals 133
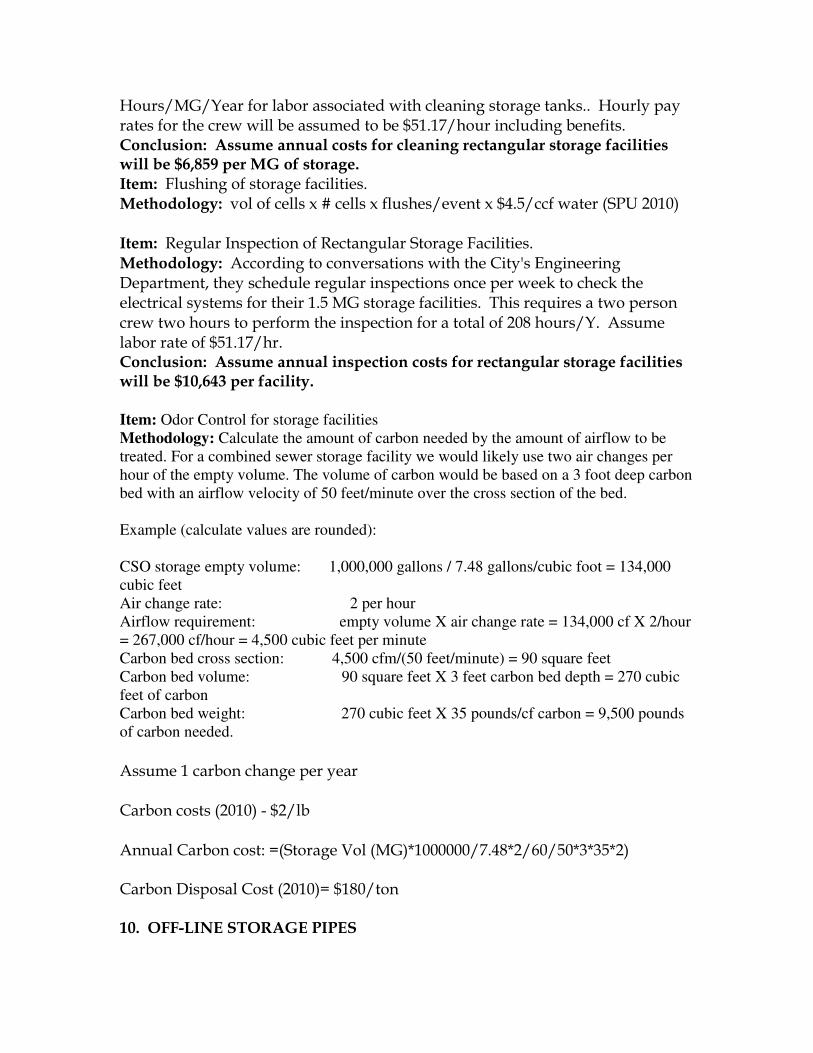
Hours/MG/Year for labor associated with cleaning storage tanks.. Hourly pay rates for the crew will be assumed to be $51.17/hour including benefits. Conclusion: Assume annual costs for cleaning rectangular storage facilities will be $6,859 per MG of storage. Item: Flushing of storage facilities. Methodology: vol of cells x # cells x flushes/event x $4.5/ccf water (SPU 2010) Item: Regular Inspection of Rectangular Storage Facilities. Methodology: According to conversations with the City's Engineering Department, they schedule regular inspections once per week to check the electrical systems for their 1.5 MG storage facilities. This requires a two person crew two hours to perform the inspection for a total of 208 hours/Y. Assume labor rate of $51.17/hr. Conclusion: Assume annual inspection costs for rectangular storage facilities will be $10,643 per facility. Item: Odor Control for storage facilities Methodology: Calculate the amount of carbon needed by the amount of airflow to be treated. For a combined sewer storage facility we would likely use two air changes per hour of the empty volume. The volume of carbon would be based on a 3 foot deep carbon bed with an airflow velocity of 50 feet/minute over the cross section of the bed. Example (calculate values are rounded): CSO storage empty volume: 1,000,000 gallons / 7.48 gallons/cubic foot = 134,000 cubic feet Air change rate: 2 per hour Airflow requirement: empty volume X air change rate = 134,000 cf X 2/hour = 267,000 cf/hour = 4,500 cubic feet per minute Carbon bed cross section: 4,500 cfm/(50 feet/minute) = 90 square feet Carbon bed volume: 90 square feet X 3 feet carbon bed depth = 270 cubic feet of carbon Carbon bed weight: 270 cubic feet X 35 pounds/cf carbon = 9,500 pounds of carbon needed.
Assume 1 carbon change per year Carbon costs (2010) - $2/lb Annual Carbon cost: =(Storage Vol (MG)*1000000/7.48*2/60/50*3*35*2) Carbon Disposal Cost (2010)= $180/ton 10. OFF-LINE STORAGE PIPES

A. Maintenance: Item: Cleaning of storage facilities. Methodology: City of Seattle maintains (36) in-line pipe storage facilities. These facilities require 1-3 crew days each with a crew size of 3 people on an annual basis. Hourly pay rates for the crew will be assumed to be $51.17/hour including benefits. Conclusion: Assume 3 crew days per cleaning. Therefore, annual cleaning costs equal (3 days/visit)x(1 visit/year)x(3 people/day)x(8 hrs/day)x(51.17 $/hr) = $3,684/year.
Item: Regular Inspection of Pipe Storage Facilities. Methodology: According to conversations with the City's Engineering Department, they schedule regular inspections once per month for their pipe storage facilities. This requires a two person crew one hour to perform the inspection. Hourly pay rates for the crew will be assumed to be $51.17/hour including benefits. Conclusion: Annual inspection costs equal (1 hour/visit)x(12 visit/year)x(2 people/hour)x(51.17 $/hour) or $1,228 per year. Total Maint & Insp = $4,912/Y 13. OUTFALLS A. Operation and Maintenance Item: Total operation and Maintenance expenditures including labor plus other direct costs Methodology: O&M cost curves, developed by Brown and Caldwell in March 1985 were based on actual Metro expenditures in 1984. Based on the information presented in these cost curves, annual expenditures for O&M for the Michigan, Brandon, and Hanford outfalls (ENR 4550) was $3877, $3947, and $3485 respectively. In terms of 1994 dollars, these costs would be $4896, $4985, and $4402 (ENR 5747) respectively. Upon further review of these cost curves, Metro staff felt that $1,100 (1656 in 2010) per year per outfall would be a better estimate for each of the Michigan, Brandon, and Hanford outfalls. Conclusion: Assume all outfalls will be inspected on a 5 year rotation. For river outfalls, assume annual O&M expenditures of $1,656