technical note large-scale interface shear testing of ...geoeng.ca/directory/bathurst/krahn et al gi...
TRANSCRIPT

Technical Note
Large-scale interface shear testing of sandbag dykematerials
T. Krahn1, J. Blatz2, M. Alfaro3 and R. J. Bathurst4
1Engineer, Built Alternatives Inc., P.O. Box 22, Anola, Manitoba, Canada, Telephone: +1 204 866 3521,
Telefax: +1 204 866 3287, E-mail: [email protected] Professor, Department of Civil Engineering, University of Manitoba, Winnipeg,
Manitoba R3T 5V6, Canada, Telephone: +1 204 474 9816, Telefax: +1 204 474 7513,
E-mail: [email protected] Professor, Department of Civil Engineering, University of Manitoba, Winnipeg,
Manitoba R3T 5V6, Canada, Telephone: +1 204 474 8155, Telefax: +1 204 474 7513,
E-mail: [email protected] and Research Director, GeoEngineering Centre at Queen’s-RMC, Civil Engineering
Department, Royal Military College of Canada, Kingston, Ontario K7K 7B4, Canada,
Telephone: +1 613 541 6000 ext 6479/6347/6391, Telefax: +1 613 545–8336,
E-mail: [email protected]
Received 23 October 2006, revised 12 January 2007, accepted 16 January 2007
ABSTRACT: This paper presents results of large-scale direct shear testing of six interfaces with
materials used to construct sandbag dykes for flood protection structures. Two additional test series
using intact sandbags were also conducted to examine the influence of sandbag-to-sandbag
interaction in typical stacked sandbag dyke construction and sandbag-to-sod (grass) contact
representing the interface condition at the dyke foundation. The interface test results are
summarised using Mohr–Coulomb shear strength parameters and interface shear stiffness
parameters. The data presented in this paper are necessary for stability analyses of instrumented
and monitored sandbag dyke structures that are currently under way as part of the development of
a new guidance document for the design of sandbag dykes for temporary flood protection works in
Canada.
KEYWORDS: Geosynthetics, Direct shear, Testing, Sandbags, Dykes, Flood protection
REFERENCE: Krahn, T., Blatz, J., Alfaro, M. & Bathurst, R. J. (2007). Large-scale interface shear
testing of sandbag dyke materials. Geosynthetics International, 14, No. 2, 119–126
[doi: 10.1680/gein.2007.14.2.119]
1. INTRODUCTION
Temporary secondary dykes are an integral component of
the flood control system for the City of Winnipeg, located
in the province of Manitoba, Canada. In 1997 a 90-year
flood of the Red River that flows through the city
seriously challenged the integrity of clay dykes con-
structed immediately prior to the floods and temporary
sandbag dykes constructed by volunteers. This event
prompted a review of the design template used by the city
for temporary sandbag dykes and investigation of strate-
gies to improve the stability of these systems, particularly
if anticipated larger floods occur in the future.
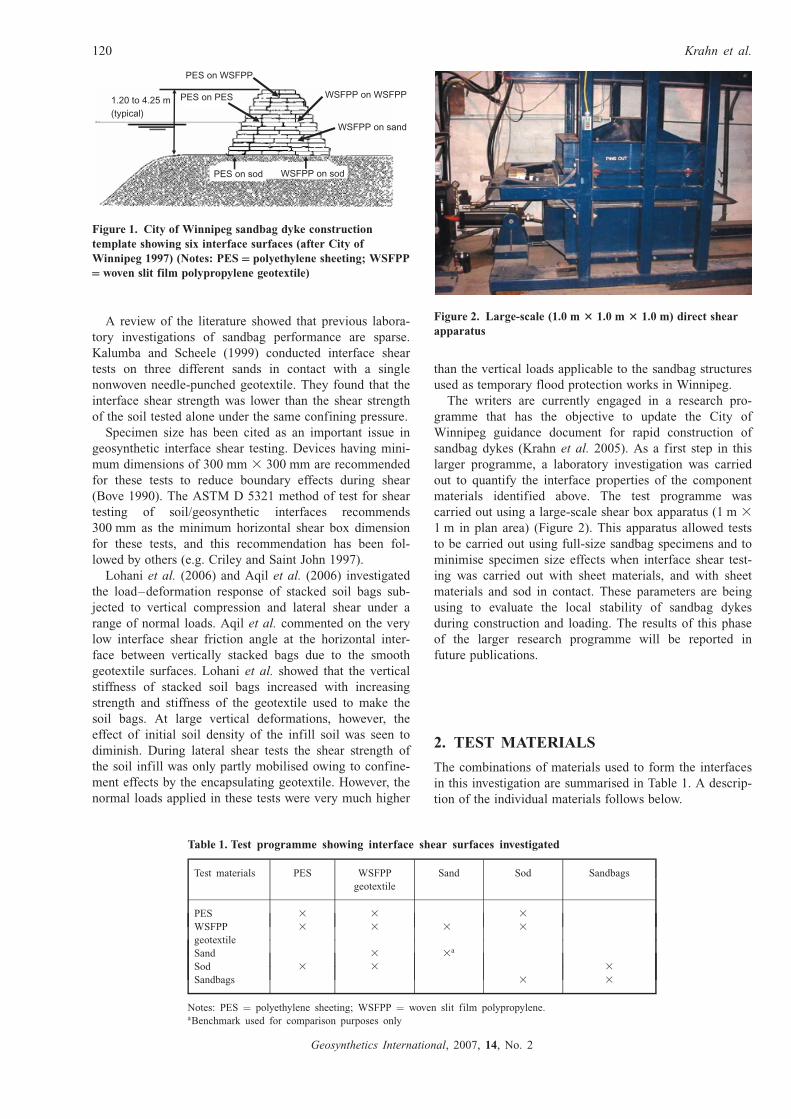
A cross-section of the standard sandbag dyke design for
temporary flood control is illustrated in Figure 1. The
stability of these structures can be related to six different
interface types constructed with four different materials.
The materials include sandbags manufactured from woven
slit film polypropylene (WSFPP) geotextile, polyethylene
sheeting (PES) used as an internal water flow cut-off, a
clean pit run sand used to fill the bags, and grass (sod) at
the base of the dyke. The base material is generally
variable, and during typical flood periods can be frozen
and include snow and ice. It can be argued that the
interface identified as WSFPP on sand is not a potential
slip interface. However, during dyke construction sandbags
may be damaged, and this interface condition could
develop.
Geosynthetics International, 2007, 14, No. 2
1191072-6349 # 2007 Thomas Telford Ltd
A review of the literature showed that previous labora-
tory investigations of sandbag performance are sparse.
Kalumba and Scheele (1999) conducted interface shear
tests on three different sands in contact with a single
nonwoven needle-punched geotextile. They found that the
interface shear strength was lower than the shear strength
of the soil tested alone under the same confining pressure.
Specimen size has been cited as an important issue in
geosynthetic interface shear testing. Devices having mini-
mum dimensions of 300 mm 3 300 mm are recommended
for these tests to reduce boundary effects during shear
(Bove 1990). The ASTM D 5321 method of test for shear
testing of soil/geosynthetic interfaces recommends
300 mm as the minimum horizontal shear box dimension
for these tests, and this recommendation has been fol-
lowed by others (e.g. Criley and Saint John 1997).
Lohani et al. (2006) and Aqil et al. (2006) investigated
the load–deformation response of stacked soil bags sub-
jected to vertical compression and lateral shear under a
range of normal loads. Aqil et al. commented on the very
low interface shear friction angle at the horizontal inter-
face between vertically stacked bags due to the smooth
geotextile surfaces. Lohani et al. showed that the vertical
stiffness of stacked soil bags increased with increasing
strength and stiffness of the geotextile used to make the
soil bags. At large vertical deformations, however, the
effect of initial soil density of the infill soil was seen to
diminish. During lateral shear tests the shear strength of
the soil infill was only partly mobilised owing to confine-
ment effects by the encapsulating geotextile. However, the
normal loads applied in these tests were very much higher
than the vertical loads applicable to the sandbag structures
used as temporary flood protection works in Winnipeg.
The writers are currently engaged in a research pro-
gramme that has the objective to update the City of
Winnipeg guidance document for rapid construction of
sandbag dykes (Krahn et al. 2005). As a first step in this
larger programme, a laboratory investigation was carried
out to quantify the interface properties of the component
materials identified above. The test programme was
carried out using a large-scale shear box apparatus (1 m 3
1 m in plan area) (Figure 2). This apparatus allowed tests
to be carried out using full-size sandbag specimens and to
minimise specimen size effects when interface shear test-
ing was carried out with sheet materials, and with sheet
materials and sod in contact. These parameters are being
using to evaluate the local stability of sandbag dykes
during construction and loading. The results of this phase
of the larger research programme will be reported in
future publications.
2. TEST MATERIALS
The combinations of materials used to form the interfaces
in this investigation are summarised in Table 1. A descrip-
tion of the individual materials follows below.
PES on sod WSFPP on sod
PES on PES
WSFPP on sand
PES on WSFPP
WSFPP on WSFPP1.20 to 4.25 m(typical)
Figure 1. City of Winnipeg sandbag dyke construction
template showing six interface surfaces (after City of
Winnipeg 1997) (Notes: PES polyethylene sheeting; WSFPP
woven slit film polypropylene geotextile)
Figure 2. Large-scale (1.0 m 3 1.0 m 3 1.0 m) direct shear
apparatus
Table 1. Test programme showing interface shear surfaces investigated
Test materials PES WSFPP
geotextile
Sand Sod Sandbags
PES 3 3 3
WSFPP
geotextile
3 3 3 3
Sand 3 3a
Sod 3 3 3
Sandbags 3 3
Notes: PES ¼ polyethylene sheeting; WSFPP ¼ woven slit film polypropylene.aBenchmark used for comparison purposes only
120 Krahn et al.
Geosynthetics International, 2007, 14, No. 2

2.1. Polyethylene sheeting (PES)
The PES material is a readily available 0.15 mm thick
(0.006 in) vapour barrier polyethylene sheeting material
that meets the Canada General Standards Board specifica-
tion for this class of material (CAN/CGSB 51.34-M86).
2.2. Woven slit film polypropylene (WSFPP)
geotextile
The WSFPP geotextile bags used by the City of Winnipeg
for sandbag dykes are purchased in bulk, usually in
bundles of 1000. The current suppliers of these products
are located in China, and use several manufacturing
plants. The bags are generally made from ends and scraps
left over from larger, more valuable textile products. This
means that there is limited information available on the
material properties of the bag material, and product
consistency is likely to be poor.
Specimen sheets used for the large-scale tests were
obtained from WSFPP samples used to bundle the bags
for shipping. The local distributor for the City of Winni-
peg Public Works department indicated that it was com-
mon practice for the manufacturer to use the same
materials for packaging as that used to manufacture
cheaper products such as the sandbags. All the specimens
tested in this programme were taken from the same stock.
Visual inspection of WSFPP samples taken from the bags
and the packing material did not reveal any visual
differences aside from overall dimensions. A single test on
a representative specimen of geotextile gave a mass per
unit area of 100 g/m2 (ASTM D 5261) and a wide-width
strip tensile strength of 5 kN/m (ASTM D 4595).
It is also common practice for the manufacturers to treat
the WSFPP with a surfactant to reduce static electricity
produced by rubbing that occurs during shipping and
handling. In all cases the surfactant was still present on
the material used in this test programme.
2.3. Granular material (sand)
A washed pit run sand from a local quarry near Kingston
was selected because it has a gradation that is similar to
the washed pit run sand materials used in the Winnipeg
area. The soil used in this investigation is classified as SP
according to the Unified Soil Classification System and
has the following particle sizes: D10 ¼ 0.09 mm, D30 ¼0.4 mm, D50 ¼ 1 mm and D60 ¼ 1.3 mm. The soil was
placed at low moisture content (approximately 3%). In
practice, the water content at the time of filling of the
sandbags during a flood event will vary, because the sand
is typically stockpiled at city public works yards. The
effect of moisture content and soil density was not
examined in this investigation. Direct shear tests were
carried out in the large-scale direct shear box on 1 m3
specimens of this sand compacted to an initial density of
about 1800 kg/m3 (relative density of 60%). The cohesion
and friction angle at large deformations were 10 kPa and
308, respectively (Table 2). These numbers are useful as a
benchmark for comparison with the interface shear
strength values discussed later. Table2.Summary
ofMohr–Coulombstrength
parameters
Testseries
Interface
Peakat
<30mm
displacement
150mm
displacement
(post-peak)
Residual
displacement
Ranka
(Norm
alstress
� n¼
24–85kPa)
c(kPa)
�(deg)
R2
c(kPa)
�(deg)
R2
c(kPa)
�(deg)
R2
Peak
150mm
displacement
Residual
1PES
onPES
613
0.88
416
1.00
514
1.00
6–8
7–8
7–8
2PES
onWSFPP
415
0.99
413
1.00
313
1.00
7–9
99
3WSFPPonWSFPP
419
1.00
417
1.00
219
1.00
6–8
6–7
6–8
4WSFPPonsand
725
1.00
10
24
1.00
825
0.99
3–4
44
5Sandonsandb
10
34
1.00
10
31
1.00
10
30
1.00
12
2
6PES
onsod
712
0.95
713
0.95
713
0.95
7–9
6–8
6–7
7WSFPPonsod
623
1.00
725
0.99
923
1.00
55
5
8Sandbagsonsod
822
0.99
929
1.00
827
1.00
3–4
33
9Sandbagsonsandbags
14
24
0.97
13
39
1.00
12
43
1.00
21
1
Notes:
a1¼
highestshearstrength;
bbenchmarkusedforcomparisonpurposesonly;R2¼
coefficientofdetermination;PES
¼polyethylenesheeting;WSFPP¼
woven
slit
film
polypropylenegeotextile.
Large-scale interface shear testing of sandbag dyke materials 121
Geosynthetics International, 2007, 14, No. 2

2.4. Grass sod
There are a large variety of plants and grasses present
along the riverbanks where sandbag dykes are built in the
Red River valley. For simplicity, Kentucky blue grass sod
was chosen for the large-scale direct shear tests conducted
for this project. Kentucky blue grass is a common variety
used in the Winnipeg area, and this provided a known
baseline that can be compared against other grass varieties
in future work, should that be necessary.
3. EXPERIMENTAL PROGRAMME
3.1. General
The large size of the direct shear apparatus used in this
investigation allows interface properties to be quantified
for systems that exhibit discrete block behaviour, in this
case filled sandbags and filled sandbags in contact with
sod. It is not possible to capture field-scale interface
performance using conventional bench-scale direct shear
equipment (i.e. typically 50 mm 3 50 mm or 100 mm 3
100 mm in plan area). An additional limitation of a
traditional bench-scale direct shear apparatus is the influ-
ence of boundary effects on measured behaviour. Bound-
ary effects are due to local distortion of the sheet products
based on how the specimen materials are attached to the
test device. In the large-scale device used here, the inter-
face area is large enough that local distortions near the
specimen edges that would otherwise influence macro-
scale response are reduced. Finally, it should be noted that
the shear tests were carried out in general accordance with
the ASTM D 5321 method of test.
3.2. Large-scale direct shear test apparatus
The large-scale direct shear test apparatus used in this
testing programme is a custom-built device with a shear
box 1 m 3 1 m 3 1 m in size. The box comprises equal
top and bottom halves constructed from 250 mm high
steel C-sections. The 1 m 3 1 m shear plane is located at
the mid-height of the shear box. Steel plates at the sliding
interface surface between the top and bottom boxes are
treated with a specially formulated industrial coating to
minimise friction and abrasion. Horizontal load and stroke
are provided by a 222 kN capacity hydraulic actuator. A
stiffened rigid steel loading plate is used to apply a
vertical load to the specimen using a 222 kN capacity
hydraulic actuator. The bottom box is seated on a set of
rollers. The apparatus is instrumented to record displace-
ment (horizontal shear) of the lower box while the top box
is restrained horizontally. Vertical and horizontal loads are
recorded using load cells, one mounted at the end of the
vertical actuator piston, and the other opposite the top box
in line with the horizontal connection with the test frame.
Displacement transducers located at the corners of the
vertical loading plate are used to record vertical movement
of the test specimens. The apparatus configuration and
loading are identical to those found in a conventional
shear box apparatus but at a larger scale. Actuator control
and data acquisition are carried out using a personal
computer and ancillary control cards and custom-designed
software.
3.3. Specimen preparation
Sheets of 16 mm and 24 mm thick plywood were used to
secure the sheet specimens during testing. The bottom
plywood sheets were seated on a timber crib that was used
to fill the lower half of the shear box. Plywood sheets
were cut to 1 m square size to fit snugly into the shear
box. A minimum of three plywood sheets was used above
and below the interface surfaces to support the test speci-
mens and to ensure that the shear interfaces remained flat
and continuous during testing. Sheet metal flashing (1 mm
nominal thickness) was used as a shim material between
the plywood sheets to adjust the interface location so that
it was level and parallel with the shear plane of the test
apparatus.
The sheet materials tested (PES and WSFPP types)
were cut into 1.2 m square pieces that were then trimmed
at the corners and folded over the plywood sheet support.
They were then attached to the plywood sheet by stapling
the sheet on the reverse side of the plywood. This ensured
that the specimen sheets were taut over the shear surface.
For sandbag/sod interface shear testing, the sod was
affixed to a sheet of plywood using deck screws placed on
a 100 mm square grid pattern. The top 6 mm of the screw
head was left protruding from the plywood to engage and
hold the soil at the base of the sod layer. This arrangement
minimised slippage between the sod and the plywood
interface without interfering with the interface surface at
the top of the sod layer. Figure 3 shows the sod in the
bottom half of the direct shear apparatus before a test.
Figure 4 shows filled sandbags placed over the sod layer
with the top half of the shear box removed following
shearing.
3.4. Normal load and shear displacement rate
The normal loads used for this research were selected to
match the range of sandbag dyke heights used in typical
flood protection efforts in the Red River Valley (Figure 1).
Dykes smaller than 1.20 m are generally stable, and hence
Figure 3. Sod layer ready for interface testing in large-scale
direct shear apparatus
122 Krahn et al.
Geosynthetics International, 2007, 14, No. 2

1.20 m was taken as the minimum dyke height in this
investigation. The maximum dyke height selected was
4.25 m, although there were cases during the 1997 flood
where higher dykes were constructed to protect some
residential homes. This value has been suggested as the
maximum temporary sandbag height for future flood
protection works in Winnipeg, with the expectation that,
where higher structures are required, engineered clay
dykes will be built. The pressure at the base of the dyke
was calculated at the centre of the structure using an
estimated saturated unit weight for sandbags of 20 kN/m3,
which gives a range of foundation pressure from 24 to
85 kPa. Based on these calculations, each shear test
configuration in the laboratory test programme was car-
ried out at normal pressures of 25, 75 and 125 kPa.
A shear rate of 5 mm/min was used in the large-scale
direct shear testing, which resulted in a test duration of
1 h to achieve 300 mm of horizontal displacement. The
ASTM D 3080 method of test states that this rate is
sufficiently slow to ensure that excess porewater pressures
for the worst case of fully saturated sand specimens are
dissipated during shear. None of the materials was fully
saturated in this investigation; however, as a precaution
and to employ a consistent test methodology the value of
5 mm/min was used for all tests.
4. TEST RESULTS
4.1. General
For brevity, only plots from selected interface shear test
results are presented here (Figures 5 to 8). The peak shear
stress, shear stress at 15 cm displacement and residual
stress values are indicated by the solid symbols in each
plot. Some of the stress–displacement plots show stick–
slip behaviour (e.g. at about 3 cm displacement for the test
at 75 kPa normal stress in Figure 6 and at 5–10 cm
displacement in Figure 7). This behaviour did not influ-
ence the interpretation of the results, because target
strength values were taken from the trace of the backbone
curve in each test. The frequency of stick–slip events
during shear testing was observed to be very much higher
for smaller specimen tests using a 60 mm 3 60 mm shear
box apparatus (Krahn 2005). This is further evidence that
larger shear box equipment is required for the type of
interface shear testing reported here.
The peak shear strength values were taken over the 0 to
3 cm displacement range in each curve. In some cases the
maximum value occurred at larger deformations. The
3 cm displacement criterion was selected because it was
Figure 4. Filled sandbags on sod after shearing in large-scale
direct shear apparatusHorizontal shear deformation (cm)
She
ar s
tres
s (k
Pa)
0
10
20
30
40
50
25 kPa
75 kPa
σn 125 kPa�
0 5 10 15 20 25 303
Figure 5. WSFPP geotextile/geotextile interface shear stress–
displacement curves
Horizontal shear deformation (cm)
She
ar s
tres
s (k
Pa)
0
10
20
30
40
50
60
70
80
25 kPa
75 kPa
3
σn 125 kPa�
0 5 10 15 20 25 30
Figure 6. WSFPP geotextile/sod interface shear stress–
displacement curves
Horizontal shear deformation (cm)
She
ar s
tres
s (k
Pa)
0
10
20
30
40
50
60
70
80
25 kPa
75 kPa
3
σn 125 kPa�
0 5 10 15 20 25 30
Figure 7. Sandbag/sod interface shear stress–displacement
curves
Large-scale interface shear testing of sandbag dyke materials 123
Geosynthetics International, 2007, 14, No. 2

observed that under operational conditions the accumula-
tion of 3 cm of lateral displacement at each layer in the
dyke could result in excessive leakage and structure
distortion, resulting in a breach of the sandbag dyke
(Krahn et al. 2005).
Post-peak strength values are of interest to designers
because it is possible that critical mechanisms with a
stepped geometry can develop in a sandbag dyke. Both
peak and large-deformation shear strengths can be mobi-
lised along the shear paths defining these critical mechan-
isms. Furthermore, the critical failure mechanism may
change as the dyke deforms.
In order to characterise the post-peak response, strength
values at 15 cm displacement and at the end of the tests
were extracted from the stress–displacement curves. The
value of 15 cm displacement is arbitrary. The shear
strengths at the end of each test (typically at 25 to 30 cm
displacement) are identified as residual shear strength
values in this paper.
The strength values at each normal load using the
criteria described above were used to generate Mohr–
Coulomb (M-C) strength parameters for each interface
type. These data are summarised in Table 2. The regres-
sion coefficients varied from 0.88 to 1.00, with most
datasets corresponding to values of 1.00. Hence linear
M-C interface shear envelopes corresponding to the range
of normal stresses applied are accurate models for the
interfaces investigated.
4.2. Mohr–Coulomb interface shear strength
The following observations can be noted from the data in
Table 2.
The peak apparent cohesion value (4 kPa) and peak
friction angle (198) for the sandbag geotextile-to-geotextile
interface shear tests were less than values measured for
the sandbag-to-sandbag interface (14 kPa and 248). Hence
there was greater interface shear strength recorded for the
sandbag-to-sandbag test configuration than for the geotex-
tile material alone. The difference in shear strength is
much larger when Coulomb strength values at 15 cm
displacement and at residual values are compared. The
difference is due to the test configuration for the sandbag-
to-sandbag tests, which results in system dilation as the
top row of sandbags moves up and over the lower row of
sandbags. This discrete block mechanism does not develop
when the geotextile sheet material is tested in isolation.
Also included in the table are shear strength rankings
for the range of normal stresses at the bottom of a sandbag
dyke based on the City of Winnipeg design template (i.e.
24 to 85 kPa). The ranking of interface shear strength
values is very consistent once the 15 cm displacement
criterion is achieved.
The results of all interface shear tests showed that the
benchmark peak shear strength for the sand/sand interface
was the largest (series 5) of all (initial) peak strength
values. The influence of sand and geotextile materials on
interface shear strength can be seen by comparing results
of test series 3, 4 and 5. These tests reveal increasing
shear strength in the same order, indicating that, when
continuous planar interfaces are tested, the presence of the
geotextile reduces sliding resistance. However, after large
deformations between 3 and 15 cm displacement, the
shear strength for the sandbag/sandbag tests (series 9) was
greater than for the sand alone (series 5) in the present
investigation. The explanation for this relative behaviour
is that the sand within the sandbags cannot be placed in a
compacted (dense) state compared with the initial com-
pacted density of the sand in the benchmark sand/sand
tests. However, after large sandbag-to-sandbag shear de-
formations the strength and stiffness of the encapsulating
geotextile more than compensates for the initial lower
density of the sand, and increasing shear capacity of the
sandbags is mobilised at least up to about 30 cm horizon-
tal displacement (see Figure 8).
The interface shear strength for the sandbag/sod inter-
face is always less than for the sandbag/sandbag interface
(compare series 8 and 9). However, the differences be-
tween the sandbag/sod and WSFPP geotextile/sod strength
values are not as great. This relative trend is ascribed to
the amount of specimen dilation that occurs during a test.
The greatest dilation occurs when the interface is com-
posed of sandbags alone (i.e. the bags roll over each other
after large horizontal deformation). In contrast, the inter-
face shear surface with a planar geotextile in contact with
a layer of sod is non-dilatant.
The lowest shear strength values are recorded for those
interfaces that include PES. This may not be unexpected
but, to the best of the writers’ knowledge, interface shear
data for these materials have not been reported in the
literature. For sandbag dykes that are routinely constructed
with PES as a water barrier, these materials may control
dyke stability. PES materials are hydrophobic, so that even
in the presence of water in a field case, the interface
properties determined from the dry tests reported here are
applicable.
The interface shear strength data points from all tests
are summarised in Figures 9–11. To prevent visual clutter,
the M-C envelopes for each dataset are not plotted.
Lower-bound envelopes have been identified in the figures
that can be used as a preliminary (conservative) estimate
of interface shear strength for limit equilibrium-based
stability analyses of sandbag dykes. It can be noted that
Horizontal shear deformation (cm)
She
ar s
tres
s (k
Pa)
0102030405060708090
100110120130140
25 kPa
75 kPa
σn 125 kPa�
30 5 10 15 20 25 30
Figure 8. Sandbag/sandbag interface shear stress–displace-
ment curves
124 Krahn et al.
Geosynthetics International, 2007, 14, No. 2
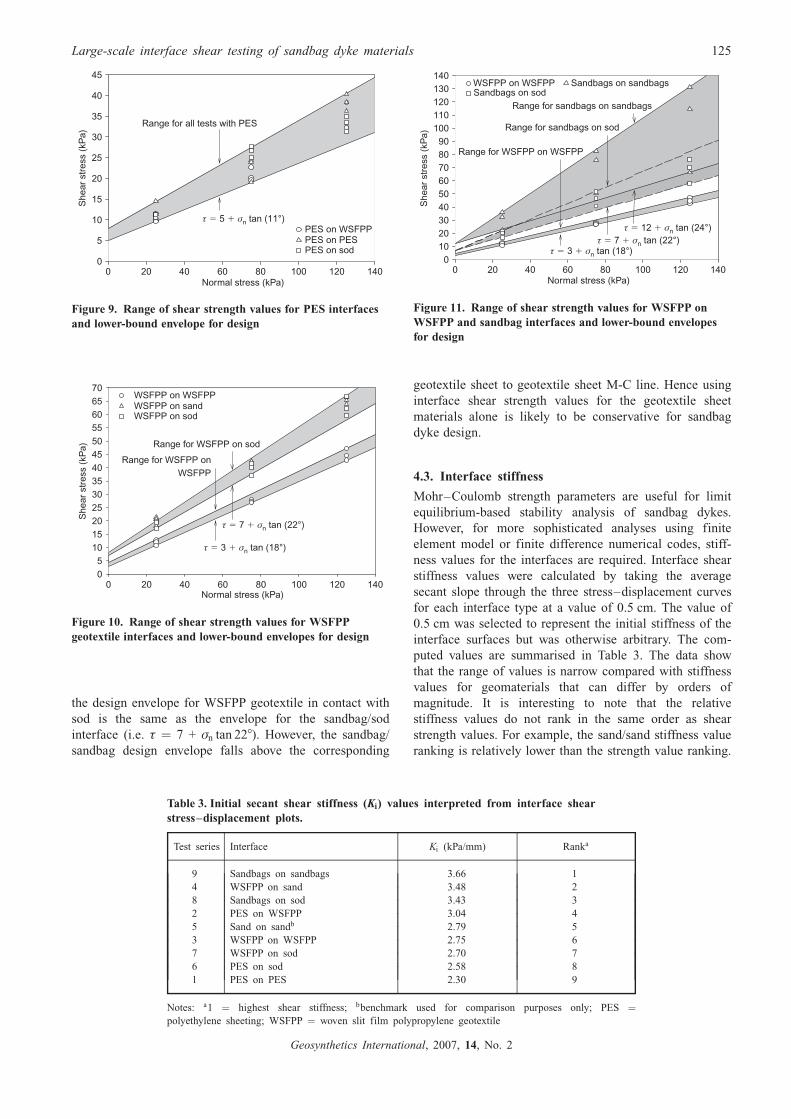
the design envelope for WSFPP geotextile in contact with
sod is the same as the envelope for the sandbag/sod
interface (i.e. � ¼ 7 + �n tan 228). However, the sandbag/
sandbag design envelope falls above the corresponding
geotextile sheet to geotextile sheet M-C line. Hence using
interface shear strength values for the geotextile sheet
materials alone is likely to be conservative for sandbag
dyke design.
4.3. Interface stiffness
Mohr–Coulomb strength parameters are useful for limit
equilibrium-based stability analysis of sandbag dykes.
However, for more sophisticated analyses using finite
element model or finite difference numerical codes, stiff-
ness values for the interfaces are required. Interface shear
stiffness values were calculated by taking the average
secant slope through the three stress–displacement curves
for each interface type at a value of 0.5 cm. The value of
0.5 cm was selected to represent the initial stiffness of the
interface surfaces but was otherwise arbitrary. The com-
puted values are summarised in Table 3. The data show
that the range of values is narrow compared with stiffness
values for geomaterials that can differ by orders of
magnitude. It is interesting to note that the relative
stiffness values do not rank in the same order as shear
strength values. For example, the sand/sand stiffness value
ranking is relatively lower than the strength value ranking.
Normal stress (kPa)
She
ar s
tres
s (k
Pa)
0
5
10
15
20
25
30
35
40
45
PES on WSFPPPES on PESPES on sod
Range for all tests with PES
0 20 40 60 80 100 120 140
τ σ5 tan (11°)� � n
Figure 9. Range of shear strength values for PES interfaces
and lower-bound envelope for design
Normal stress (kPa)
She
ar s
tres
s (k
Pa)
0
5
10
15
20
25
30
35
40
45
50
55
60
65
70WSFPP on WSFPPWSFPP on sandWSFPP on sod
Range for WSFPP on sod
Range for WSFPP onWSFPP
0 20 40 60 80 100 120 140
τ σ7 tan (22°)� � n
τ σ3 tan (18°)� � n
Figure 10. Range of shear strength values for WSFPP
geotextile interfaces and lower-bound envelopes for design
Normal stress (kPa)
She
ar s
tres
s (k
Pa)
0102030405060708090
100110120130140
WSFPP on WSFPP Sandbags on sandbagsSandbags on sod
Range for sandbags on sod
Range for WSFPP on WSFPP
Range for sandbags on sandbags
0 20 40 60 80 100 120 140
τ σ12 tan (24°)� � n
τ σ7 tan (22°)� � nτ σ3 tan (18°)� � n
Figure 11. Range of shear strength values for WSFPP on
WSFPP and sandbag interfaces and lower-bound envelopes
for design
Table 3. Initial secant shear stiffness (Ki) values interpreted from interface shear
stress–displacement plots.
Test series Interface Ki (kPa/mm) Ranka
9 Sandbags on sandbags 3.66 1
4 WSFPP on sand 3.48 2
8 Sandbags on sod 3.43 3
2 PES on WSFPP 3.04 4
5 Sand on sandb 2.79 5
3 WSFPP on WSFPP 2.75 6
7 WSFPP on sod 2.70 7
6 PES on sod 2.58 8
1 PES on PES 2.30 9
Notes: a1 ¼ highest shear stiffness; bbenchmark used for comparison purposes only; PES ¼polyethylene sheeting; WSFPP ¼ woven slit film polypropylene geotextile
Large-scale interface shear testing of sandbag dyke materials 125
Geosynthetics International, 2007, 14, No. 2

Not unexpectedly, the stiffness values corresponding to
two of the interfaces with PES materials are the lowest.
5. CONCLUSIONS
A large-scale direct shear apparatus was used to quantify
the shear behaviour of sandbag dyke interface surfaces.
The test results showed that the interface shear strength of
sandbags in contact with sandbags is very much larger
than that deduced from interface shear testing on sandbag
geotextile sheets. The difference is ascribed to the dilatant
behaviour that occurs as the sandbags move over each
other during large shear deformations.
In terms of shear response, the weakest and least stiff
interfaces for sandbag dykes built according to the City of
Winnipeg 1997 template are those including a PES layer.
Clearly, seating a sandbag dyke directly on a layer of PES
may lead to base sliding of the structure. In current
practice, this arrangement is avoided. Provided that a
horizontal planar surface with PES is not present within
the sandbag structure, then internal failure from the loaded
wet side to the dry side of the sandbag dyke is likely to be
preventable because of the multi-step internal shear me-
chanism that must develop because of the staggered
construction of these systems. Nevertheless, the margin of
safety of temporary sandbag dykes using the current City
of Winnipeg design template has not been established.
This is the topic of ongoing work by the writers.
ACKNOWLEDGEMENTS
The authors are grateful for the financial support from the
Natural Sciences and Engineering Research Council of
Canada and the Secondary Diking Enhancements Program
administered by the Government of Canada, the Province
of Manitoba and the City of Winnipeg. The authors would
also like to thank the staff at Bathurst, Clarabut Geotech-
nical Testing Ltd (BCGT) for providing both technical
assistance and the large-scale direct shear apparatus that
was used for the testing reported here.
REFERENCES
Aqil, U., Matsushima, K., Mohri, Y., Yamazaki, S. & Tatsuoka, F. (2006).
Lateral shearing tests on geosynthetic soil bags. Proceedings of the
8th International Conference on Geosynthetics, Yokohama, Japan,
Millpress, Rotterdam, Vol. 4, pp. 1703–1706.
ASTM D 3080. Standard Test Method for Direct Shear Test of Soils
Under Consolidated Drained Conditions. ASTM International, West
Conshohocken, PA, USA.
ASTM D 4595. Standard Test Method for Tensile Properties of
Geotextiles by the Wide-Width Strip Method. ASTM International,
West Conshohocken, PA, USA.
ASTM D 5261. Standard Test Method for Measuring Mass per Unit Area
of Geotextiles. ASTM International, West Conshohocken, PA, USA.
ASTM D 5321. Standard Test Method for Determining the Coefficient of
Soil and Geosynthetic Friction by the Direct Shear Method. ASTM
International, West Conshohocken, PA, USA.
Bove, J. A. (1990). Direct shear friction testing for geosynthetics in waste
containment. Geosynthetic Testing for Waste Containment Applica-
tions, STP 1081, Koerner, R. M., Editor, ASTM International, West
Conshohocken, PA, USA, pp. 241–256.
CAN/CGSB 51.34-M86. (1996) Vapour Barrier, Polyethylene Sheet for
Use in Building Construction. Canadian General Standards Board,
Gatineau, Canada K1A 1G6.
City of Winnipeg (1997). Building a dike. http://www.winnipeg.ca/
Services/CityLife/HistoryOfWinnipeg/flood/flood_dike_construc-
tion.stm
Criley, K. R. & Saint John, D. (1997). Variability analysis of soil versus
geosynthetic interface friction characteristics by multiple direct
shear testing. Proceedings of Geosynthetics ’97, Long Beach, CA,
Industrial Fabrics Association International, Vol. 2, pp. 885–897.
Kalumba, D. & Scheele, F. (1999). Friction characteristics of sand/
geotextile interfaces for three selected sand materials. Proceedings
of the Regional Conference for Africa: Soil Mechanics and
Foundation Engineering, G. R. Wardle, G. E. Blight and A. B.
Fourie, Editors, A.A. Balkema, Rotterdam, Vol. 12, pp. 201–206.
Krahn, T. J. (2005). Assessment of sandbag dike performance. MSc
thesis, Department of Civil Engineering, University of Manitoba,
Winnipeg, Manitoba, Canada, 298 pp.
Krahn, T., Blatz, J., Alfaro, M. & Bathurst, R.J. (2005). Evaluation of
sandbag dike performance using a full-scale test facility. Proceed-
ings of 58th Canadian Geotechnical Conference, Quebec City,
Saskatoon. Canadian Geotechnical Society, Alliston, Ontario, 8pp
(CD).
Lohani, T. N., Matsushima, K., Aqil, U., Mohri, Y. & Tatsuoka, F. (2006).
Evaluating the strength and deformation characteristics of a soil bag
pile from full-scale laboratory tests. Geosynthetics International,
13, No. 6, 246–264.
The Editors welcome discussion on all papers published in Geosynthetics International. Please email your contribution to
[email protected] by 15 October 2007.
126 Krahn et al.
Geosynthetics International, 2007, 14, No. 2