technical notes on water quality testing for e.coli
TRANSCRIPT
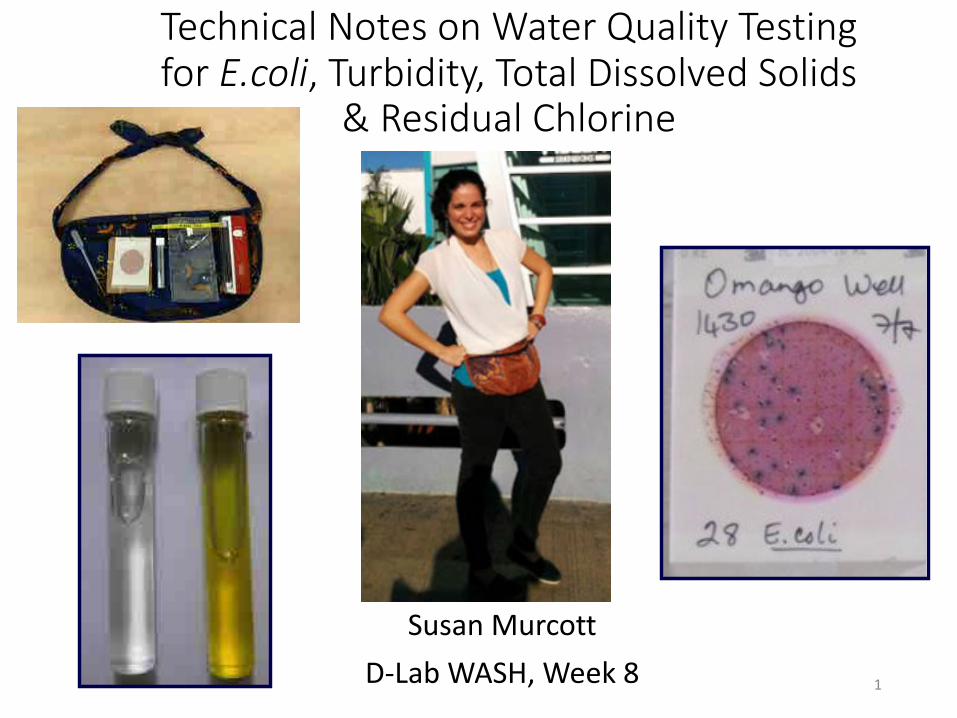
Technical Notes on Water Quality Testing for E.coli, Turbidity, Total Dissolved Solids
& Residual Chlorine
Susan Murcott D-Lab WASH, Week 8 1
E.coli Definition
• Escherichia coli (including E. coli 0157:H7 and non-0157 serotypes, all members of the Enterobacteriaceae family) are gram-negative bacteria that are rod-shaped, have the ability to survive in aerobic and anerobic environments (termed a facultative anaerobe), and may or may not produce flagella and pili (thin hair-like projections) depending on their environmental needs.• E. coli strains are found worldwide and live in significant
numbers in human and other warm-blooded animals as part of the normal bacterial population of the large intestine
2
Gram Negative Bacteria
• Microbiologist to classify bacteria into two groups (gram-positive or gram-negative). • Gram-negative bacteria are bacteria that do not retain
the crystal violet stain used in the gram-stainingmethod of bacterial differentiation. • Gram-negative bacteria are found everywhere, in
virtually all environments on Earth that support life. • The gram-negative bacteria include the model
organism Escherichia coli, as well as many pathogenicbacteria, such as Pseudomonas aeruginosa, Neisseriagonorrhoeae, Chlamydia trachomatis, and Yersiniapestis.
3
WHO - Guideline for Microbial Water Quality (4th Ed. GDWQ )
“E.coli or thermotolerant coliform bacteria must not be detected in any 100 millilitersample for all water directly intended for: • Drinking; • Treated water entering the distribution
system; • Treated water in the distribution system.”
From Table 7.7 p. 143. See also Table 5.2. p. 97
4
Criteria of an“Ideal” Fecal Contamination Indicator
• Applicable to all types of water (and other relevantsamples).
• Present in feces, sewage and fecally contaminated sampleswhen pathogens are present; numbers correlate with amount of fecal contamination; outnumber pathogens.
• No "aftergrowth" or "regrowth" in the environment. • Survive/persist > than or = to pathogens. • Easily detected/quantified by simple lab tests in a short
time. • Constant characteristics. • Harmless to humans and other animals. • Numbers in water (food, etc..) are associated with risks of
enteric illness in consumers (dose-response relationship).
(From Mark Sobsey’s lecture 4, slide 82/89 – see Week 7, Oct. 16, 2019 LMOD folder)
5
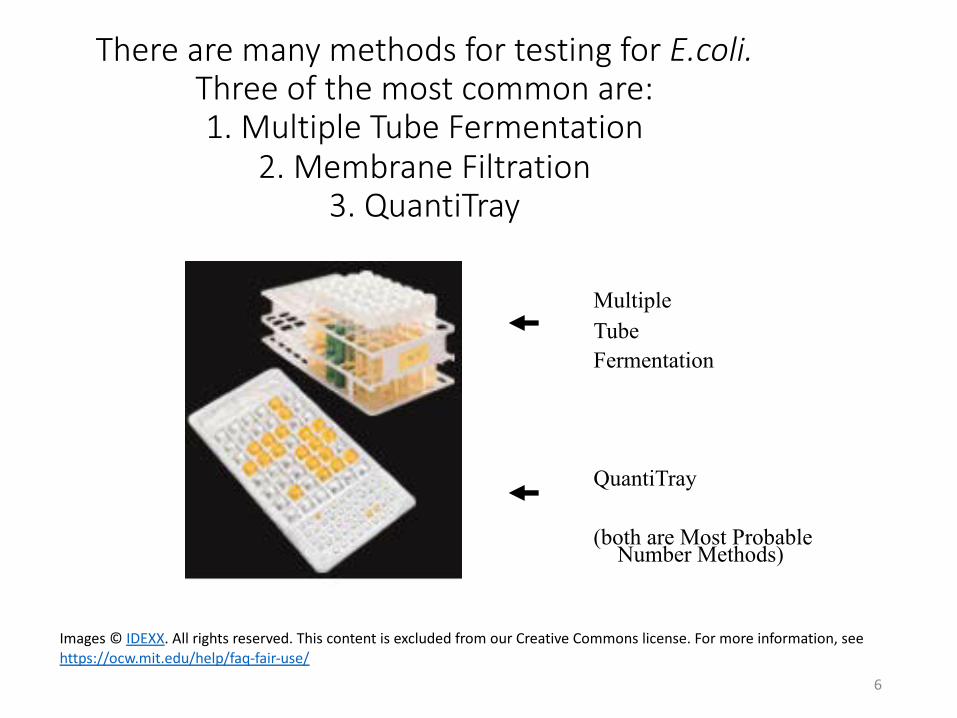
There are many methods for testing for E.coli. Three of the most common are: 1. Multiple Tube Fermentation
2. Membrane Filtration 3. QuantiTray
Multiple Tube Fermentation
QuantiTray
(both are Most ProbableNumber Methods)
Images © IDEXX. All rights reserved. This content is excluded from our Creative Commons license. For more information, see https://ocw.mit.edu/help/faq-fair-use/
6
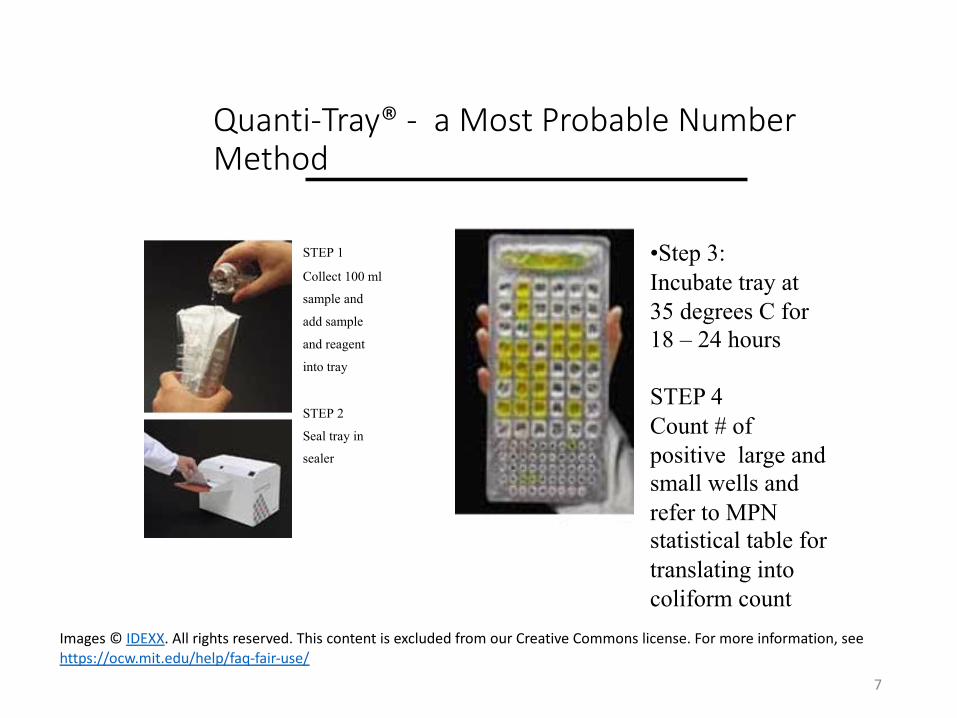
Quanti-Tray® -Method
STEP 1
Collect 100 ml
sample and
add sample
and reagent
into tray
STEP 2
Seal tray in
sealer
a Most Probable Number
•Step 3: Incubate tray at 35 degrees C for 18 – 24 hours
STEP 4 Count # of positive large and small wells and refer to MPN statistical table for translating into coliform count
Images © IDEXX. All rights reserved. This content is excluded from our Creative Commons license. For more information, see https://ocw.mit.edu/help/faq-fair-use/
7
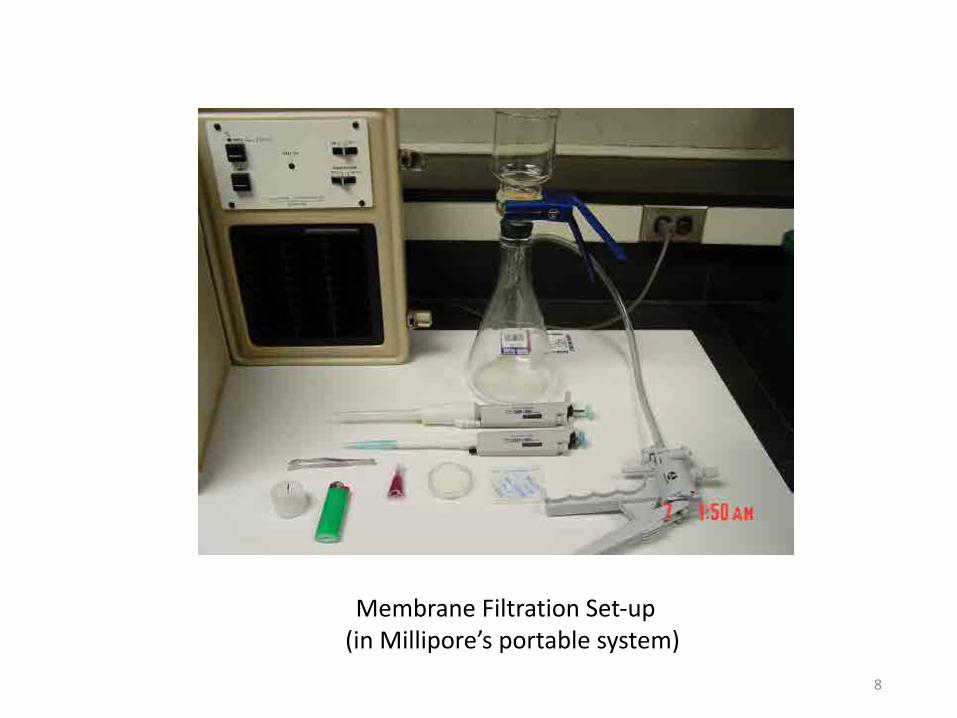
Membrane Filtration Set-up (in Millipore’s portable system)
8
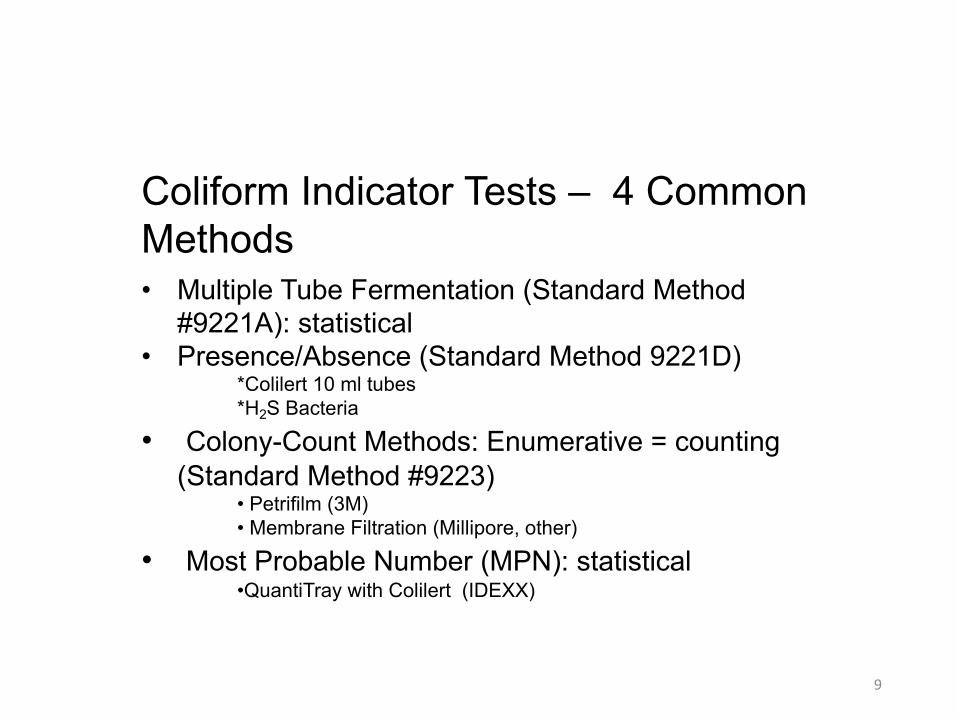
Coliform Indicator Tests – 4 Common Methods • Multiple Tube Fermentation (Standard Method
#9221A): statistical • Presence/Absence (Standard Method 9221D)
*Colilert 10 ml tubes *H2S Bacteria
• Colony-Count Methods: Enumerative = counting (Standard Method #9223)
• Petrifilm (3M) • Membrane Filtration (Millipore, other)
• Most Probable Number (MPN): statistical •QuantiTray with Colilert (IDEXX)
9
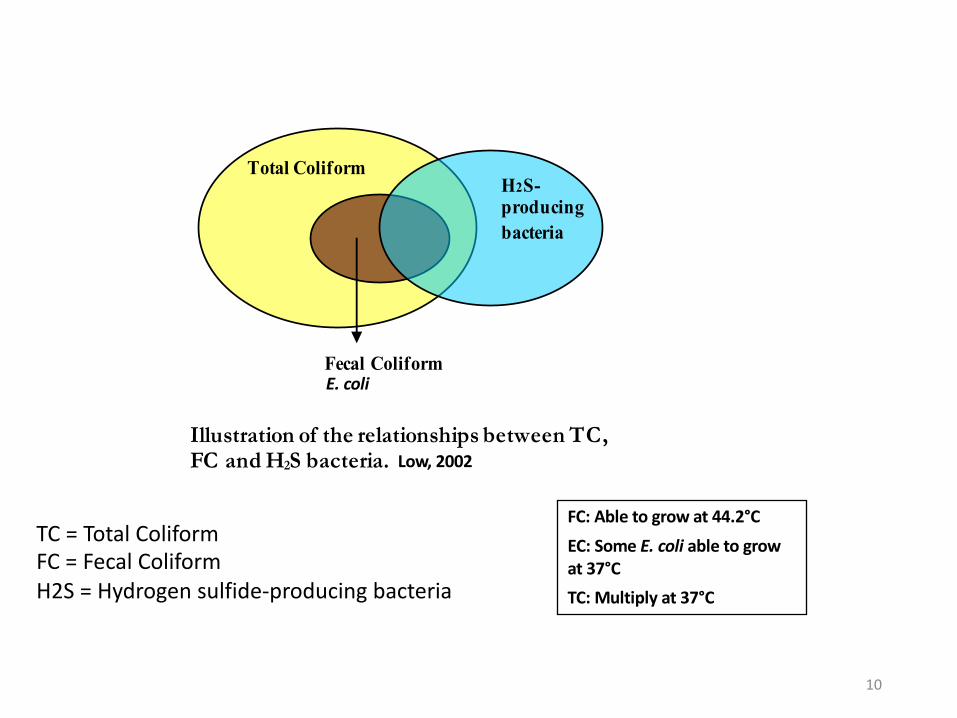
H2S-producing bacteria
Total Coliform
Fecal Coliform E. coli
Illustration of the relationships between TC,FC and H2S bacteria. Low, 2002
FC: Able to grow at 44.2°C TC = Total Coliform EC: Some E. coli able to grow FC = Fecal Coliform at 37°C H2S = Hydrogen sulfide-producing bacteria TC: Multiply at 37°C
10
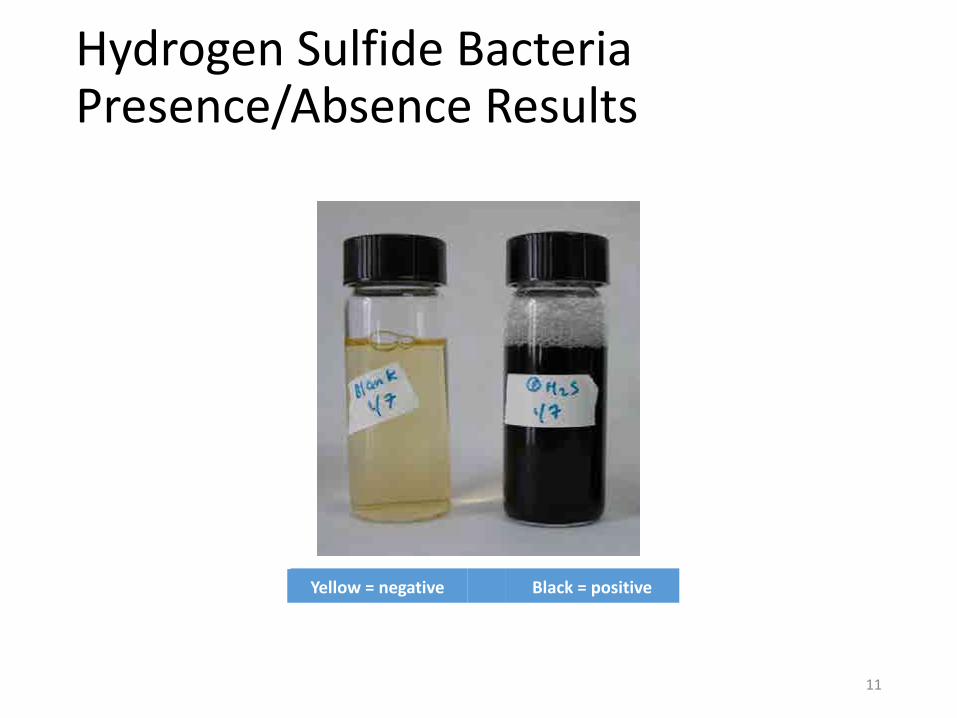
Hydrogen Sulfide BacteriaPresence/Absence Results
Yellow = negative Black = positive
11
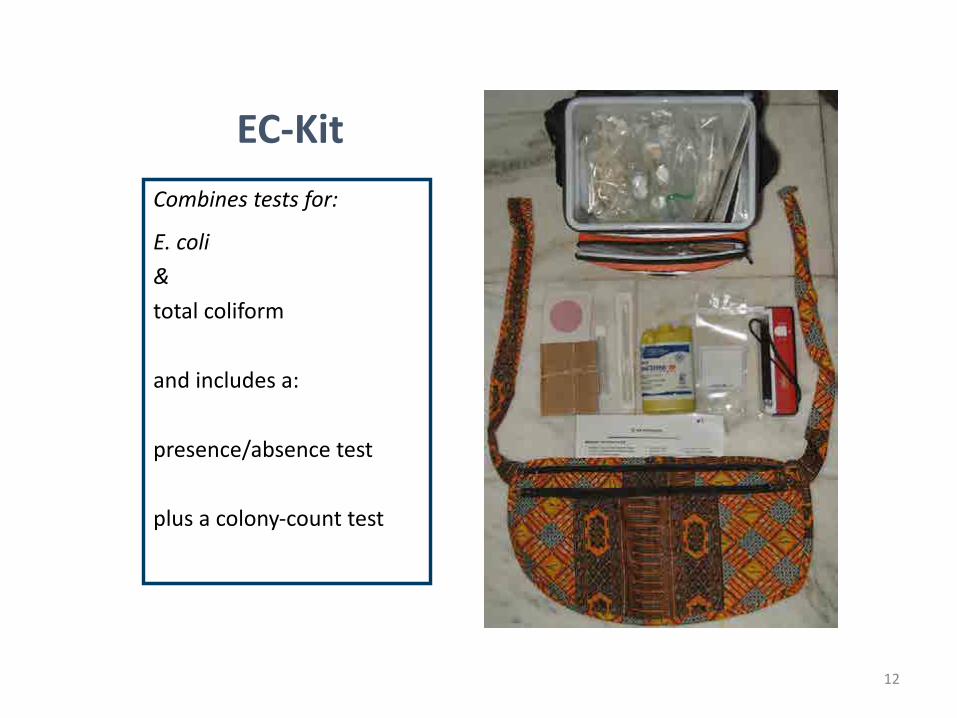
EC-Kit Combines tests for:
E. coli & total coliform
and includes a:
presence/absence test
plus a colony-count test
12
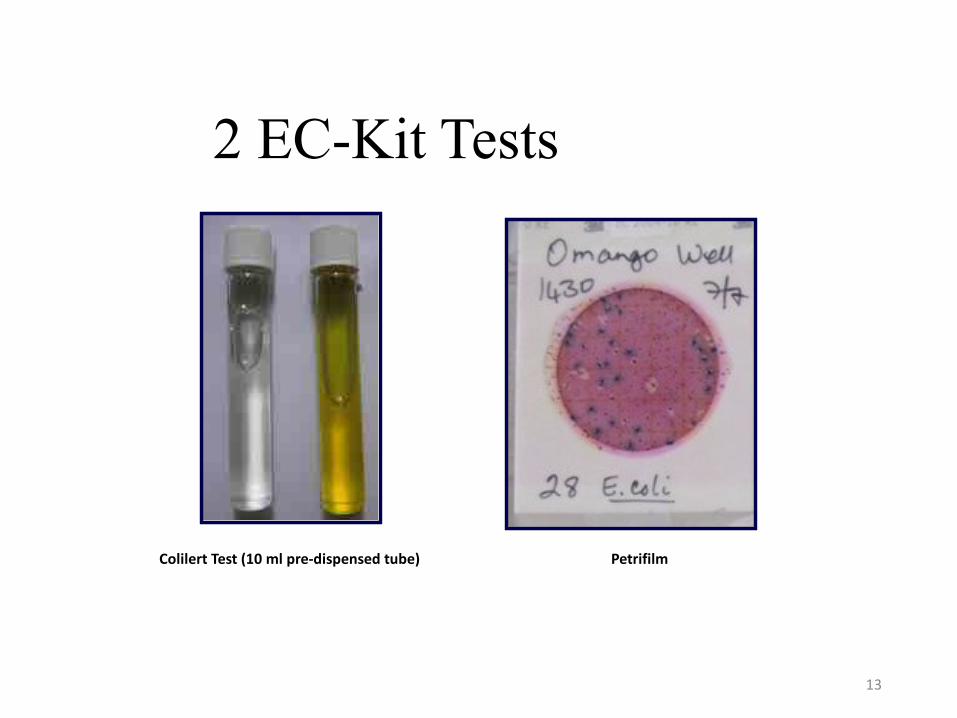
2 EC-Kit Tests
Colilert Test (10 ml pre-dispensed tube) Petrifilm
13
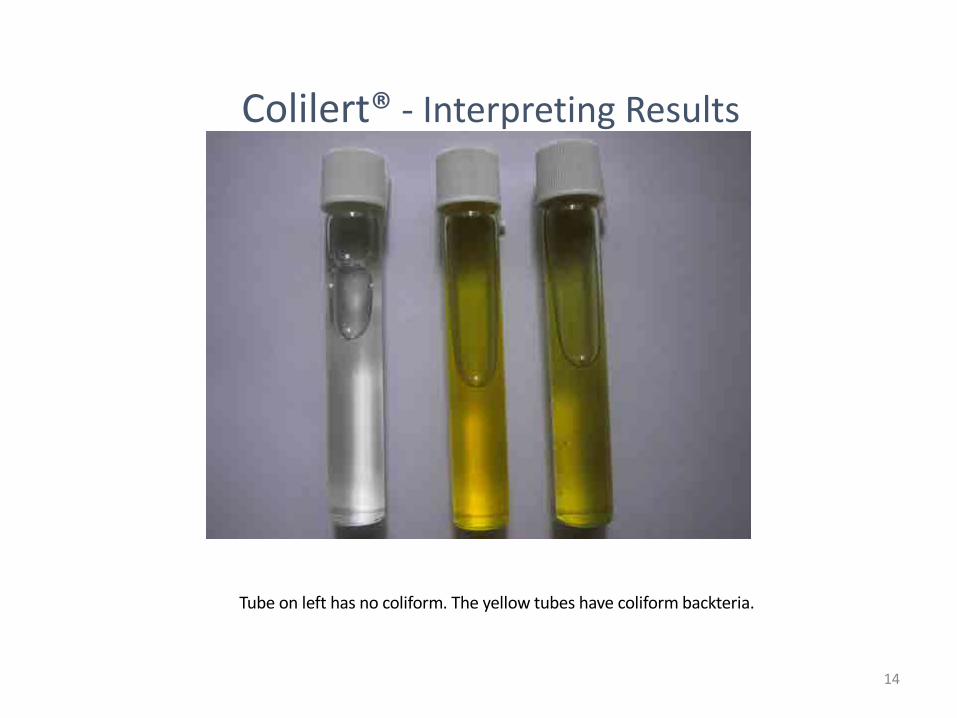
Photo Credit: Robert Metcalf
Colilert® - Interpreting Results
Tube on left has no coliform. The yellow tubes have coliform backteria.
14
Enzyme Substrate Coliform Method
• Enzymes are proteins that catalyze (i.e., increase the rates of) chemical reactions. • The enzyme substrate coliform method
uses hydrolyzable chromogenic substrates for detection of the enzymes of total coliform and E.coli bacteria.
15
Enzyme Substrate Coliform Test
• When the enzyme substrate coliform technique isused, the total coliform group definition is based onsystematic bacteriology (not on method)• All bacteria possessing the enzyme β-D-
galactosidase, which cleaves the chromogenicsubstrate, resulting in the release of thechromogen.• E.coli are defined as bacteria giving a positive total
coliform response and possessing the enzyme β-D-galactosidase, which cleaves a fluorogenicsubstrate, resulting in the release of the fluorogen.
• From: SM 9223 (22nd Edition)
• http://www.standardmethods.org/store/ProductView.cfm?ProductID=313
16
Colilert®
• Colilert® uses the Defined Substrate Technology (DST®)
• DST® contains two carbon sources:
• ONPG (ortho-nitro-phenol-beta D-
galactopyranoside) - for total coliform detection
• MUG (4-methyl-umbelliferone-beta-glucuronidase)
- for E.coli detection
• DST® does not contain any organic sources of nitrogen
• The test can be used in either a multiple-tube or a
presence-absence (100-mL sample) format.
• The Colilert 10 milliliter pre-dispensed
Presence/Absence test detects E.coli down to 10
coliform forming units (CFU) per 100ml, below which is
considered low risk.
17
Colilert®
• Total coliform produces the enzyme beta-galactosidase, which hydrolyzes the substrate ortho-nitrophenol-beta D-galactopyranoside (ONPG) toyellow nitrophenol. • This gives a yellow color change to the sample if the
test is positive. • E.coli can be detected at the same time by
incorporating a fluorogenic substrate, (4-methyl-umbelliferone-beta-glucuronide (MUG), whichproduces a fluorescent end product after interactionwith the enzyme beta-glucurnidase found in E.coli, but not in other coliforms. • Blue fluorescence is detected with a long-wave
ultraviolet light. 18
Glucoronidase- based Tests
• MUG in Colilert (-> E.coli fluoresces blue)
• BCIG in the Petrifilm (-> blue colonies with gas bubbles are E.coli)
19
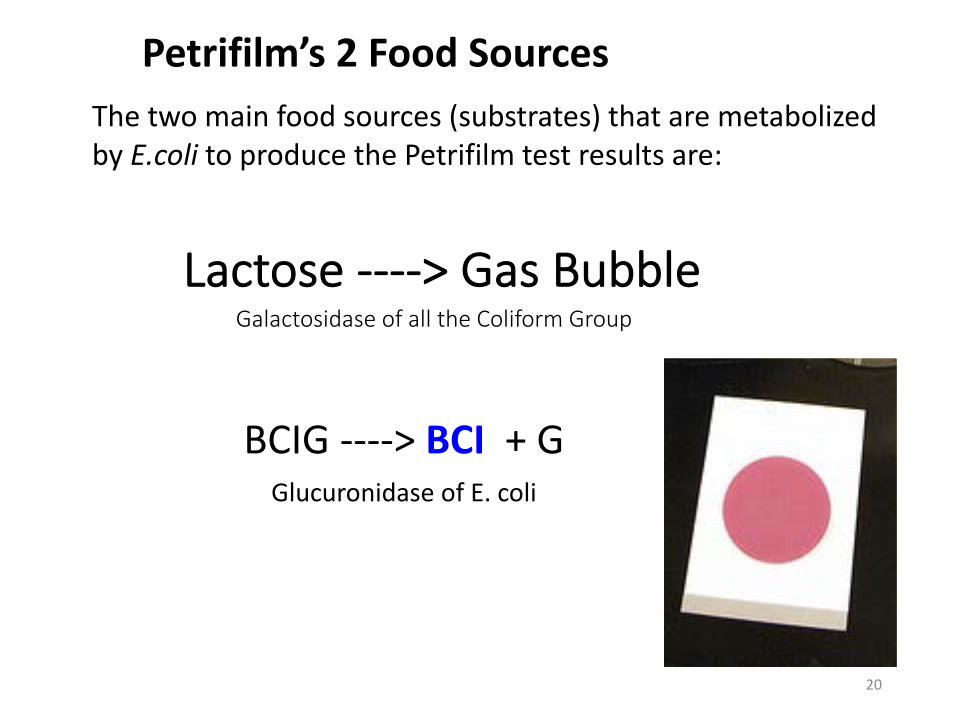
Petrifilm’s 2 Food Sources The two main food sources (substrates) that are metabolized by E.coli to produce the Petrifilm test results are:
Lactose ----> Gas Bubble Galactosidase of all the Coliform Group
BCIG ----> BCI + G Glucuronidase of E. coli
20
Petrifilm™:
• Petrifilm uses sample-ready plates to quantifythe level of E. coli and total coliform • Produced by the 3MTM Company. • Simple, only requires 1 mL of sample • Developed for detection of coliform in food
products (e.g. meats, dairy and juice products). • Regulated in the U.S. by the Association of
Official Analytical Chemist (AOAC), APHA, US Grade A Pasteurized Milk Ordinance (NCIMS) andthe Canada Health Protection Branch • It has not been approved for use in drinking
water treatment
21
Petrifilm™ contains
• Violet Red Bile (VRB) nutrients (a cold water-soluble gelling agent coating), • BCIG (5-bromo-4-chloro-3 indolyl-beta D
Glucuronide), an indicator of glucuronidaseactivity (the same enzyme that hydrolyzes MUGin the Colilert test and which is produced byE.coli, but not by other coliform bacteria), • Tetrazolium: an indicator that facilitates colony
enumeration (gram negative bacteria reducetetrazolium to a red color to enhance colonyvisualization), • A top film on the grid plate that traps gas
produced by lactose fermenting E.coli and coliforms
22
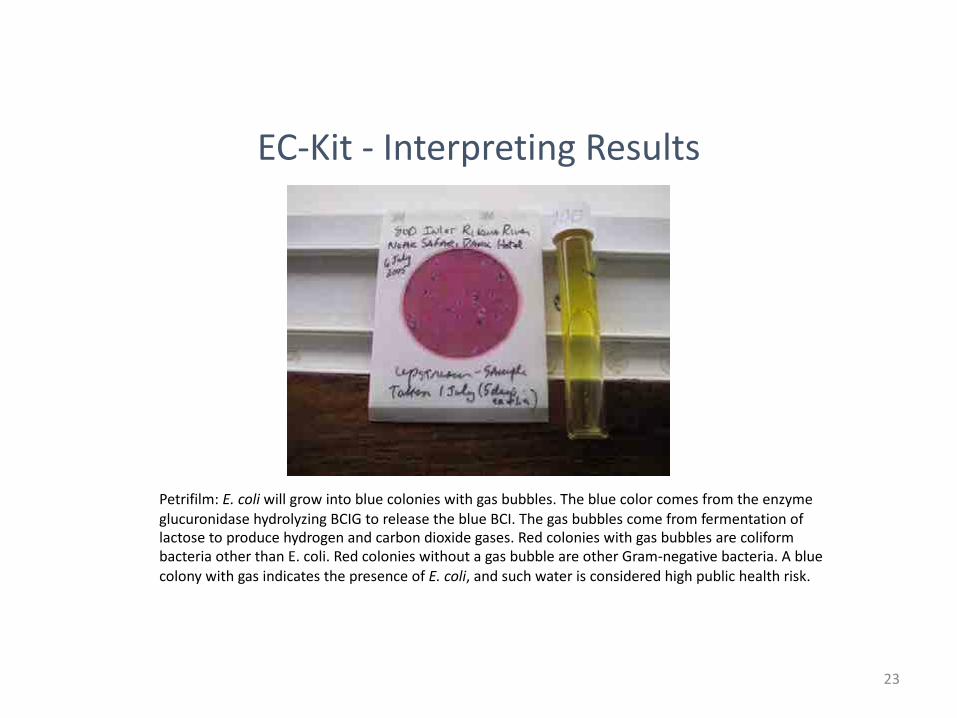
Photo Credit: Robert Metcalf
EC-Kit - Interpreting Results
Petrifilm: E. coli will grow into blue colonies with gas bubbles. The blue color comes from the enzyme glucuronidase hydrolyzing BCIG to release the blue BCI. The gas bubbles come from fermentation of lactose to produce hydrogen and carbon dioxide gases. Red colonies with gas bubbles are coliform bacteria other than E. coli. Red colonies without a gas bubble are other Gram-negative bacteria. A blue colony with gas indicates the presence of E. coli, and such water is considered high public health risk.
23
Determining Risk Levels – E.coli
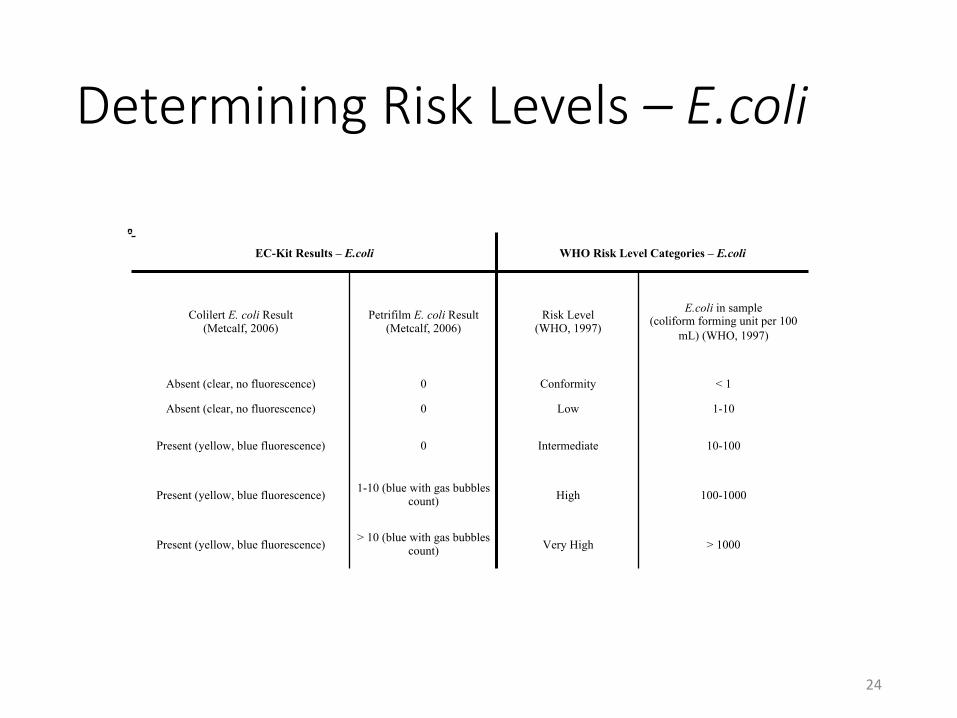
EC-Kit Results – E.coli WHO Risk Level Categories – E.coli
E.coli in sample Colilert E. coli Result Petrifilm E. coli Result Risk Level (coliform forming unit per 100 (Metcalf, 2006) (Metcalf, 2006) (WHO, 1997) mL) (WHO, 1997)
Absent (clear, no fluorescence) 0 Conformity < 1
Absent (clear, no fluorescence) 0 Low 1-10
Present (yellow, blue fluorescence) 0 Intermediate 10-100
1-10 (blue with gas bubbles Present (yellow, blue fluorescence) High 100-1000 count)
> 10 (blue with gas bubbles Present (yellow, blue fluorescence) Very High > 1000 count)
24
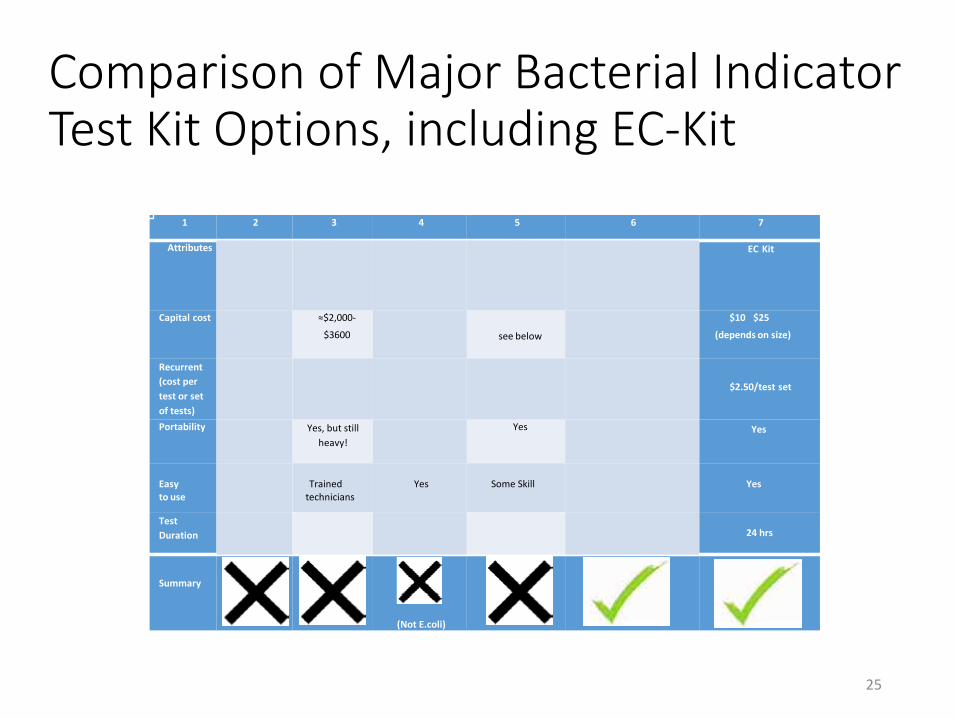
Comparison of Major Bacterial Indicator Test Kit Options, including EC-Kit
1 2 3 4 5 6 7
Attributes Lab (Membrane Filtration
Method)
DelAgua Kit (Standard
of UNICEF/ WHO)
ENPHO P/A
Hydrogen
sulfide (H2S) bacteria test
AquaGenX Oasis
(Water Innovation Prize in
2018)
EC Kit
Capital cost ≈ $ 5000 ≈$2,000-
$3600 see below see below see below
$10 $25
(depends on size)
Recurrent (cost per test or set of tests)
$5/test
$1.70(broth) or $3.50
(ampule)/test $1/test $10/test $3/test $2.50/test set
Portability No Yes, but still heavy!
Yes Yes Yes Yes
Easy to use
Trained technicians
Trained technicians
Yes Some Skill Yes Yes
Test Duration 24 hrs 24 hrs 48 hrs 24 hrs 24 hrs 24 hrs
Summary
(Not E.coli)
-
-
25
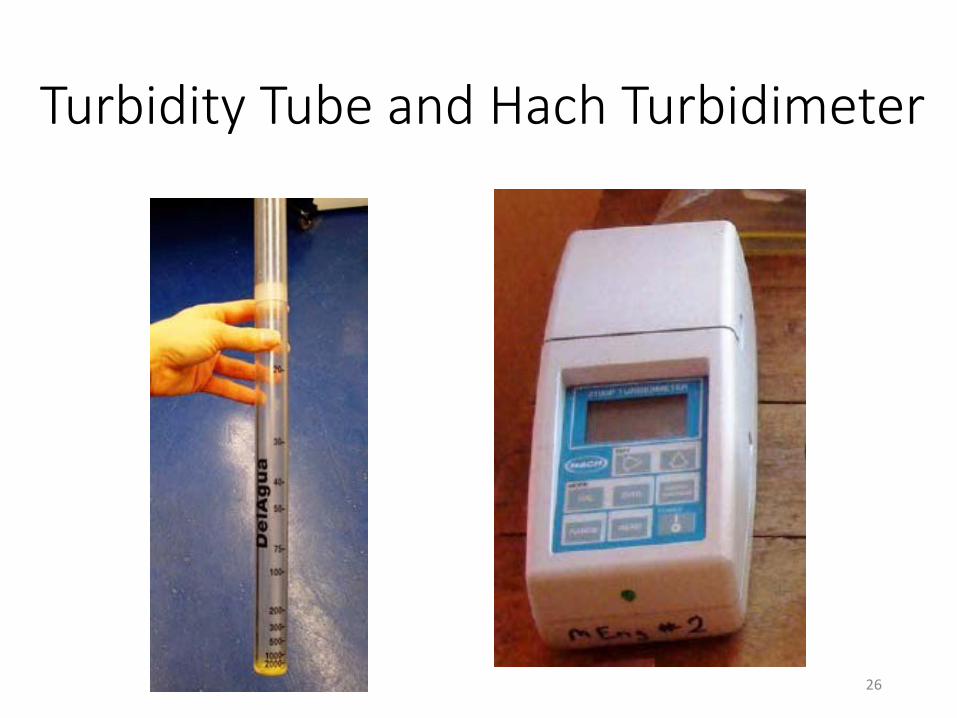
Turbidity Tube and Hach Turbidimeter
26
Turbidity
• Suspended and colloidal particles of clay, silt, organic and inorganic matter, minerals, plankton and microscopic organisms which impede thepassage of light through water. • Turbidity > 5 NTU is noticeable to the consumer • Effective coagulation or filtration should remove
turbidity
27
Turbidity Measurement & Units Turbidity Measurement
• Jackson Candle Units – an historic method, however the lowest valuemeasured was 25 Jackson Turbidity Units (JTU), whereas treated waterusually falls in the range 0 – 1 JTU, so it couldn’t detect pure water.
• Nephrelometers are turbidimeters which measure intensity of lightscattered at 90° to the incident beam. Commonly used today. • Because there is no standard type of turbidity, an arbitrary standard is used in electronic nephrelometers, composed of an aqueous suspension offormazin polymer.
• Unit of measurement = nephrelometric turbidity unit (NTU)
• A simpler, field-research option: Turbidity Tube = a method of turbidity measure using a visual observation, recorded as “turbidity units (TU).
• Turbidity Tube (units = Turbidity Units (TU)
• Portable Turbidimeter (Hach 2100P) units = Nephrelometric Turbidity
• Units (NTU)
28
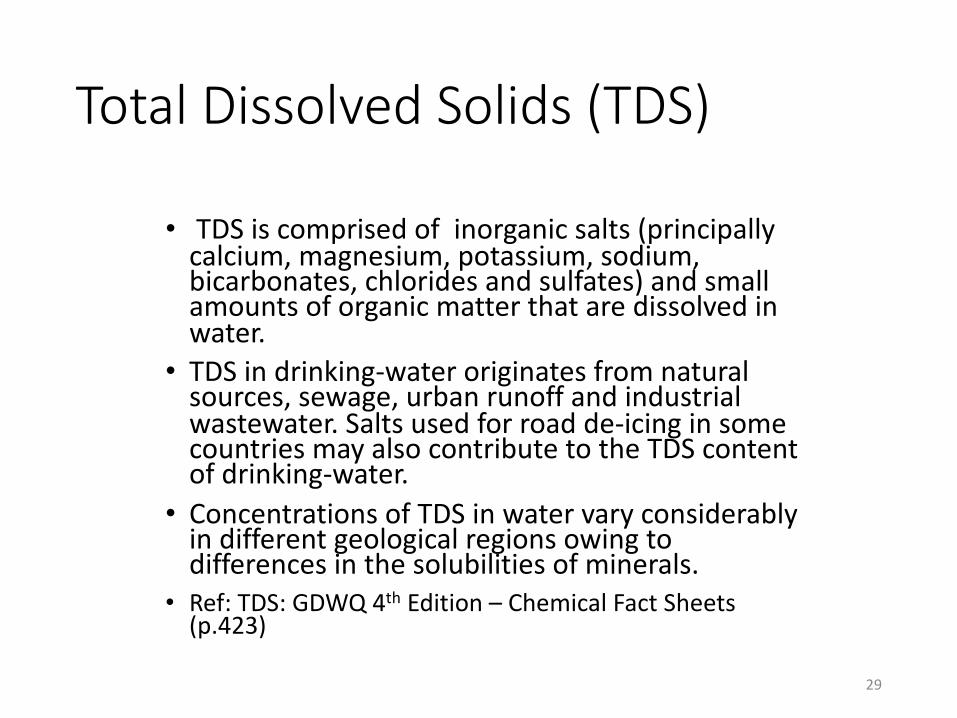
Total Dissolved Solids (TDS)
• TDS is comprised of inorganic salts (principallycalcium, magnesium, potassium, sodium, bicarbonates, chlorides and sulfates) and smallamounts of organic matter that are dissolved inwater.
• TDS in drinking-water originates from naturalsources, sewage, urban runoff and industrialwastewater. Salts used for road de-icing in somecountries may also contribute to the TDS contentof drinking-water.
• Concentrations of TDS in water vary considerablyin different geological regions owing todifferences in the solubilities of minerals.
• Ref: TDS: GDWQ 4th Edition – Chemical Fact Sheets (p.423)
29
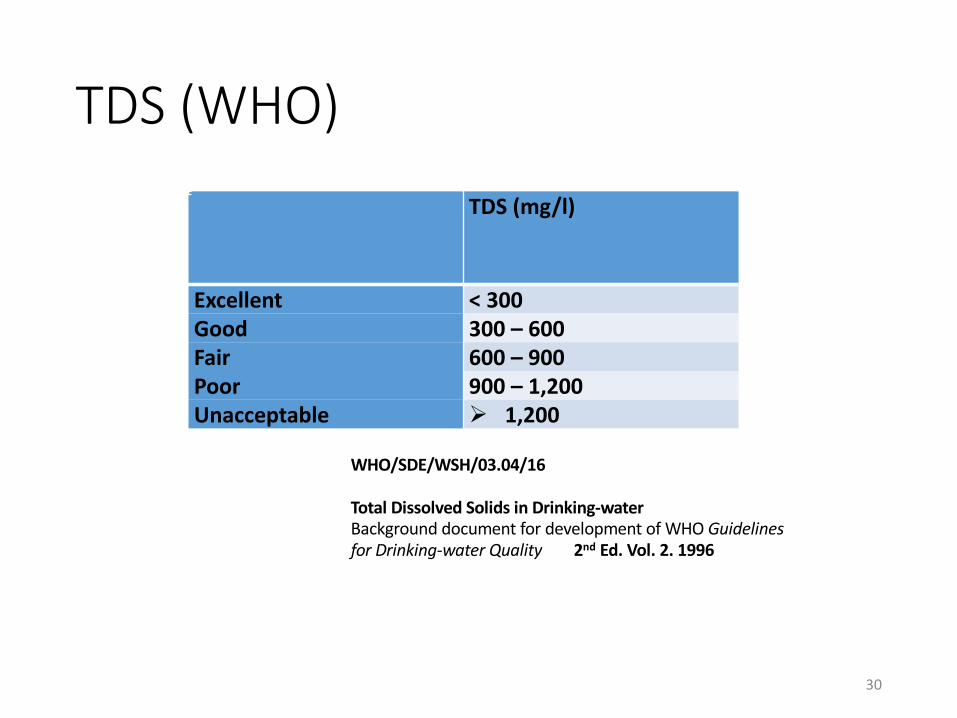
TDS (WHO)
TDS (mg/l)
Excellent < 300
Good 300 – 600
Fair 600 – 900
Poor 900 – 1,200
Unacceptable • 1,200
WHO/SDE/WSH/03.04/16
Total Dissolved Solids in Drinking-water
Background document for development of WHO Guidelines for Drinking-water Quality 2nd Ed. Vol. 2. 1996
30
Common Forms of Chlorine
• Most common forms of chlorine:
• Dry (calcium hypochlorite – [Ca(OCl2)]
• Liquid (sodium hypochlorite – (NaOCl)=bleach
• Chlorine gas (Cl2)
31
Chlorination Chemistry
• When chlorine is added to water, it disinfects the water by damaging the cell structure of bacteria, thereby destroying them. The amount of chlorine needed to do this is the chlorine demand. • Chlorine demand varies with the amount of
impurities in the water. • The purpose of chlorination is to satisfy the
chlorine demand, with some excess left over. The excess chlorine is residual chlorine.
32
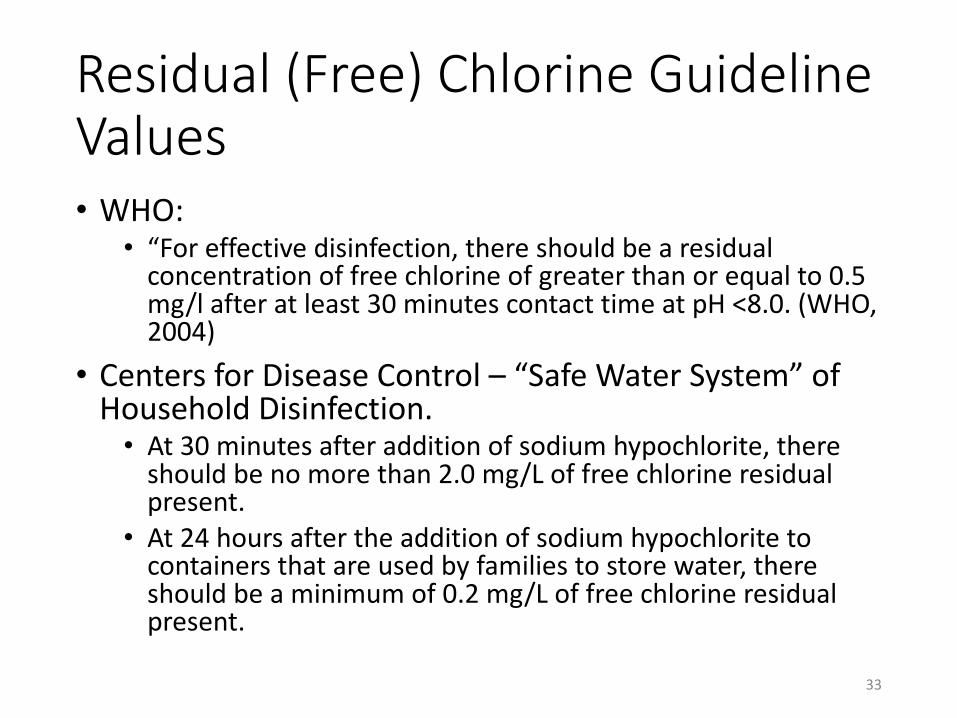
Residual (Free) Chlorine Guideline Values • WHO:
• “For effective disinfection, there should be a residualconcentration of free chlorine of greater than or equal to 0.5mg/l after at least 30 minutes contact time at pH <8.0. (WHO, 2004)
• Centers for Disease Control – “Safe Water System” of Household Disinfection. • At 30 minutes after addition of sodium hypochlorite, there
should be no more than 2.0 mg/L of free chlorine residualpresent.
• At 24 hours after the addition of sodium hypochlorite tocontainers that are used by families to store water, thereshould be a minimum of 0.2 mg/L of free chlorine residualpresent.
33
Summary Residual Chlorine Guidelines
• ≥0.5 mg/L and ≤ 2.0 mg/L after 30 minutes • ≥0.2 mg/L after 24 hours
• More than this will taste bad • Less will not guarantee that the supply is
adequately protected.
34
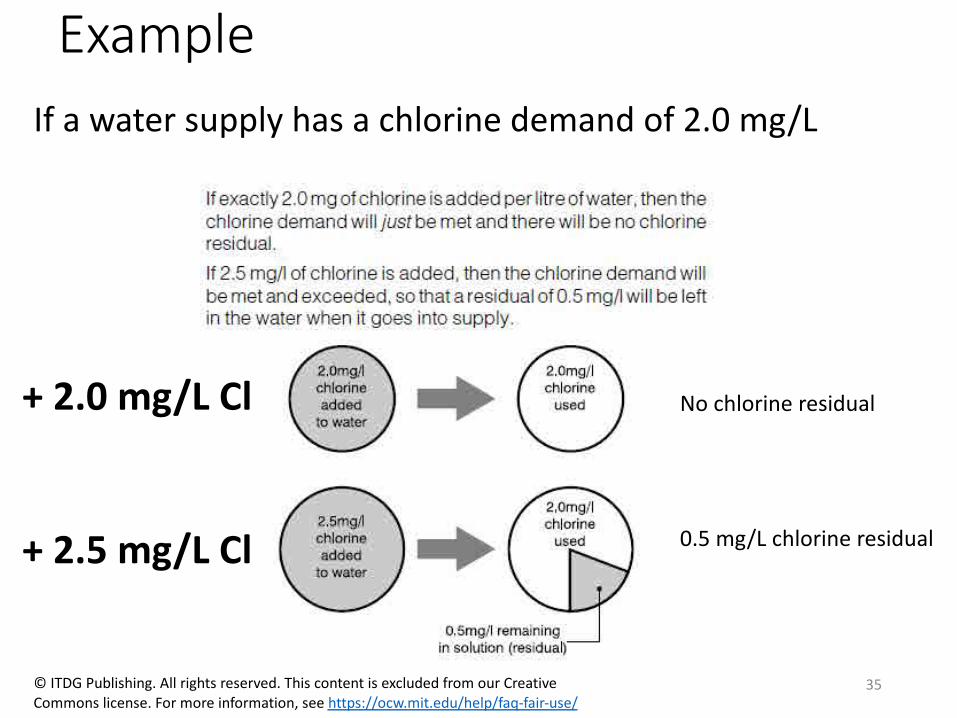
Example If a water supply has a chlorine demand of 2.0 mg/L
+ 2.0 mg/L Cl No chlorine residual
0.5 mg/L chlorine residual + 2.5 mg/L Cl
© ITDG Publishing. All rights reserved. This content is excluded from our Creative 35
Commons license. For more information, see https://ocw.mit.edu/help/faq-fair-use/

Chlorination Chemistry
• Free residual chlorine (a.k.a. free available chlorine) = quantity of hypochlorous acid (HOCl) and hypochloriteion (OCl-) in the water. The relative distribution of these two species is very important, because the efficacy ofHOCl is about 40 – 80 x greater than OCl- .
• Ammonia, commonly present in natural waters, willreact with HOCl or OCl- to form monochloramine, dichloramine and trichloramine, depending on factorssuch as temperature and pH.
36

Chlorination Chemistry
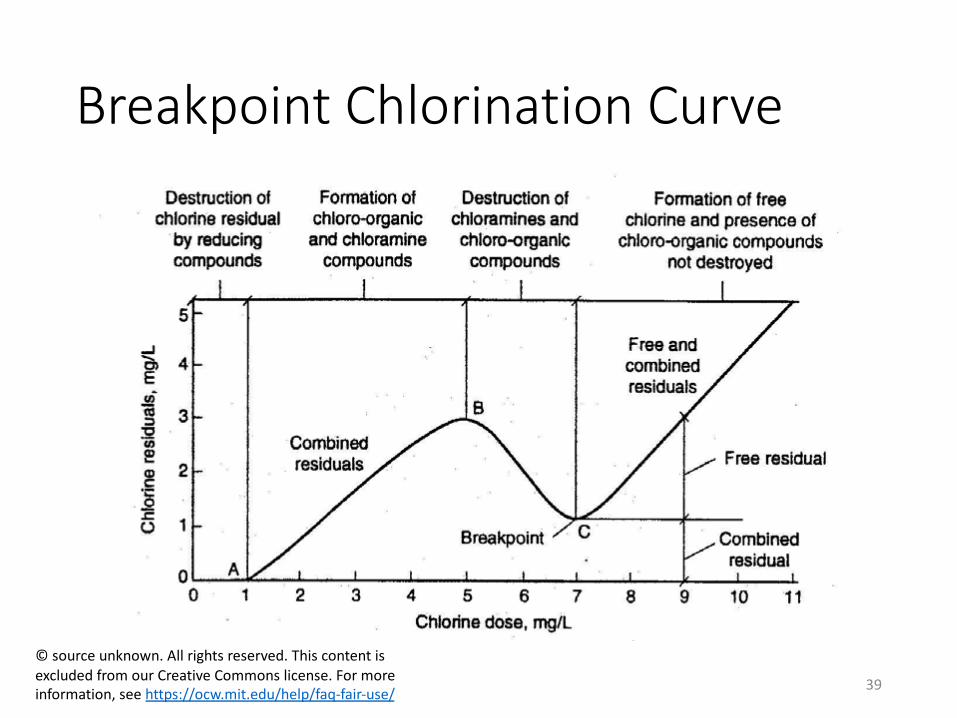
• Chlorination of water to the extent that all ammonia is converted to either trichloramine or oxidized to nitrate or other gases is referred to as “breakpoint chlorination.”
• Before breakpoint, “combined” chlorine predominates(monochloramine + dichloramine)
• After breakpoint, free residual chlorine predominates(hypochlorous acid + hypochlorite)
• Combined Residual Chlorine (ppm) + Free Residual Chlorine = Total Residual Chlorine
37
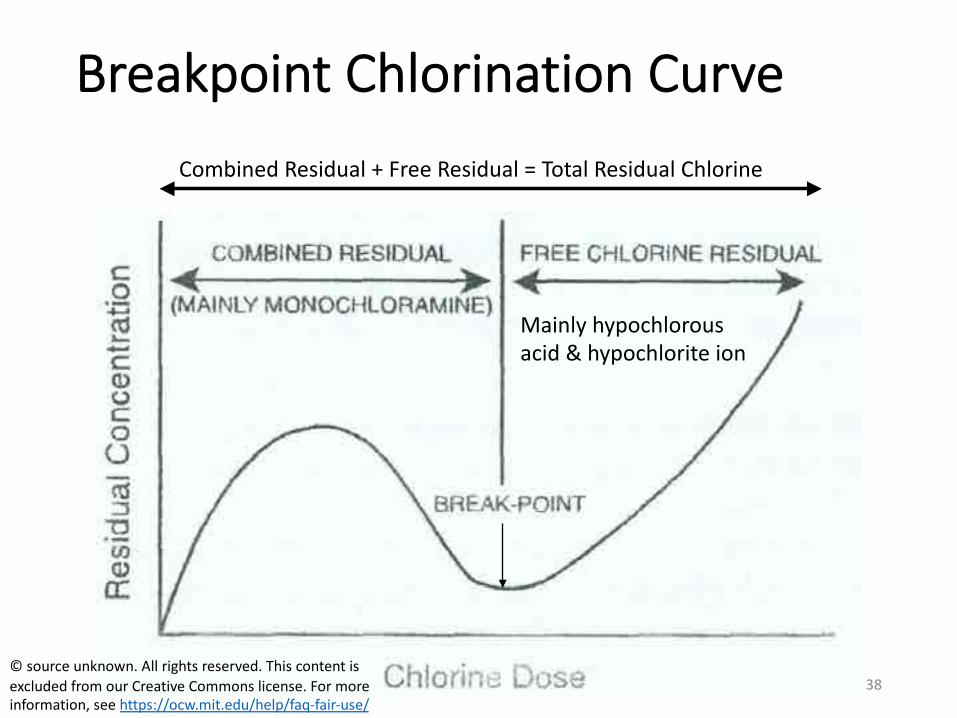
Breakpoint Chlorination Curve Combined Residual + Free Residual = Total Residual Chlorine
Mainly hypochlorous
acid & hypochlorite ion
© source unknown. All rights reserved. This content is
excluded from our Creative Commons license. For more
information, see https://ocw.mit.edu/help/faq-fair-use/
38
Breakpoint Chlorination Curve
© source unknown. All rights reserved. This content is excluded from our Creative Commons license. For more information, see https://ocw.mit.edu/help/faq-fair-use/ 39
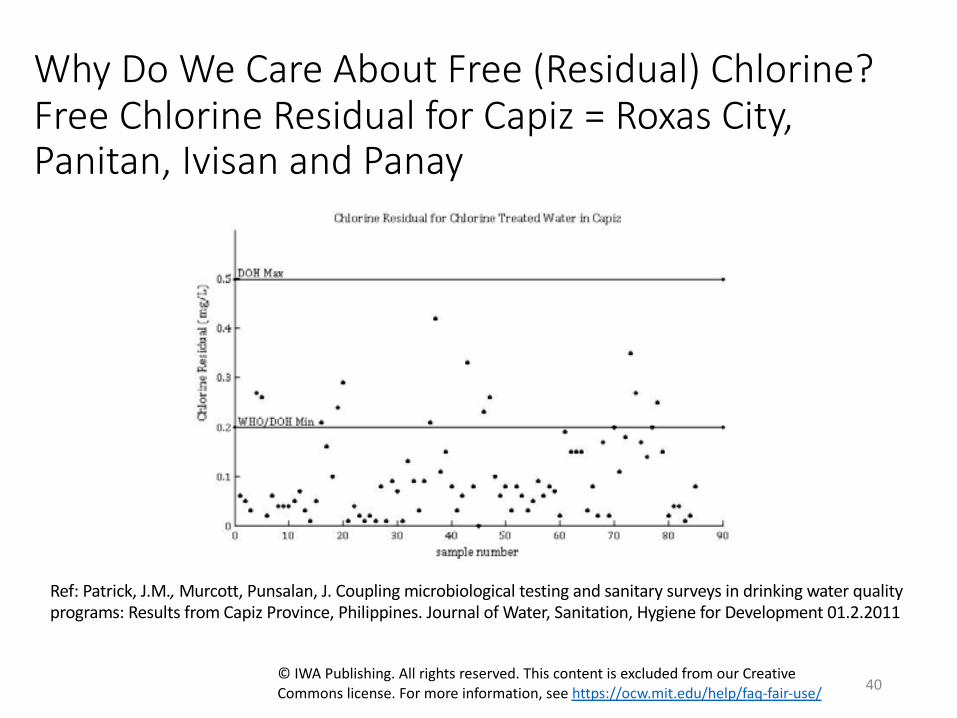
Why Do We Care About Free (Residual) Chlorine? Free Chlorine Residual for Capiz = Roxas City, Panitan, Ivisan and Panay
Ref: Patrick, J.M., Murcott, Punsalan, J. Coupling microbiological testing and sanitary surveys in drinking water quality programs: Results from Capiz Province, Philippines. Journal of Water, Sanitation, Hygiene for Development 01.2.2011
© IWA Publishing. All rights reserved. This content is excluded from our Creative Commons license. For more information, see https://ocw.mit.edu/help/faq-fair-use/ 40
Chlorine Residual Results - Philippines Figure shows the results of the 85 free chlorine residual tests completed in January2010 for Roxas City, Panitan, Ivisan and Panay
Two horizontal lines at the 0.2 and 0.5mg/L chlorine residual concentration levelsshowing the WHO/DOH minimum level and DOH maximum level for chlorine residual after 30min of contact time, at any point in the distribution system.
Only 17.6% of the samples met the WHO and DOH standards
Results show that, of the 50 samples collected in Roxas City, only 10 (20%) of thesemet the WHO and DOH standards.
Five of the 15 samples (33%) collected in Panitan met the standards.
None of the samples collected in Ivisan and Panay met the standards.
Ref: Water Quality Testing and Water Use Assessment in Capiz Province, Philippines. By: Patty ChuangJohnMillspaugh, Jessica Molly Patrick,Stephanie Trottier, Master of Engineering Report, Civil and EnvironmentalEngineering, MIT, June 2010. 41
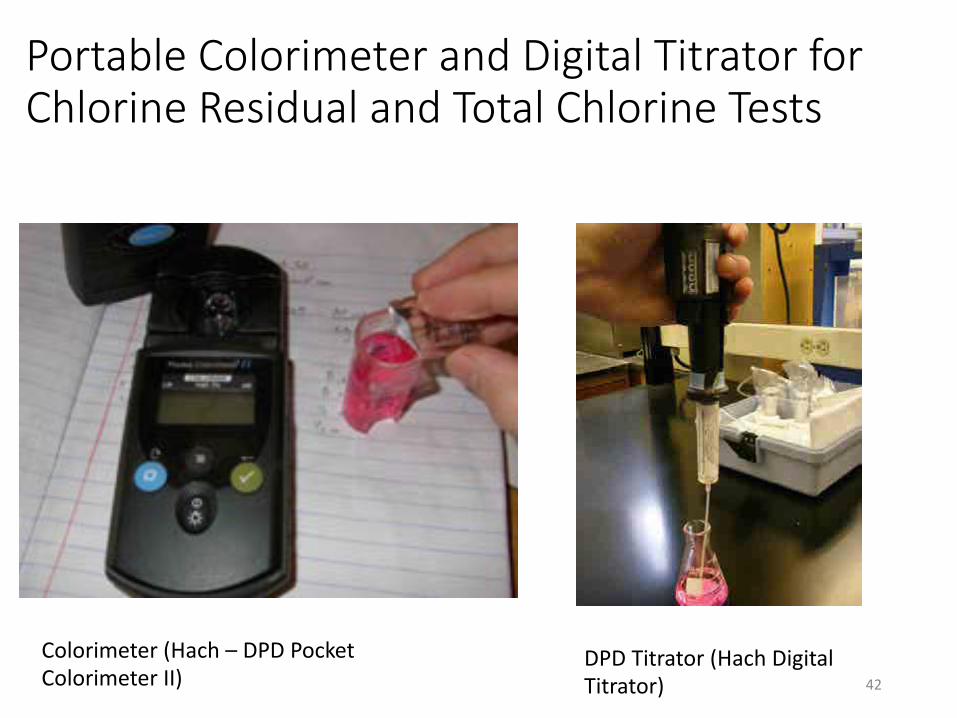
Portable Colorimeter and Digital Titrator for Chlorine Residual and Total Chlorine Tests
Colorimeter (Hach – DPD Pocket DPD Titrator (Hach Digital Colorimeter II) Titrator) 42
PROBLEMS SOLUTIONS
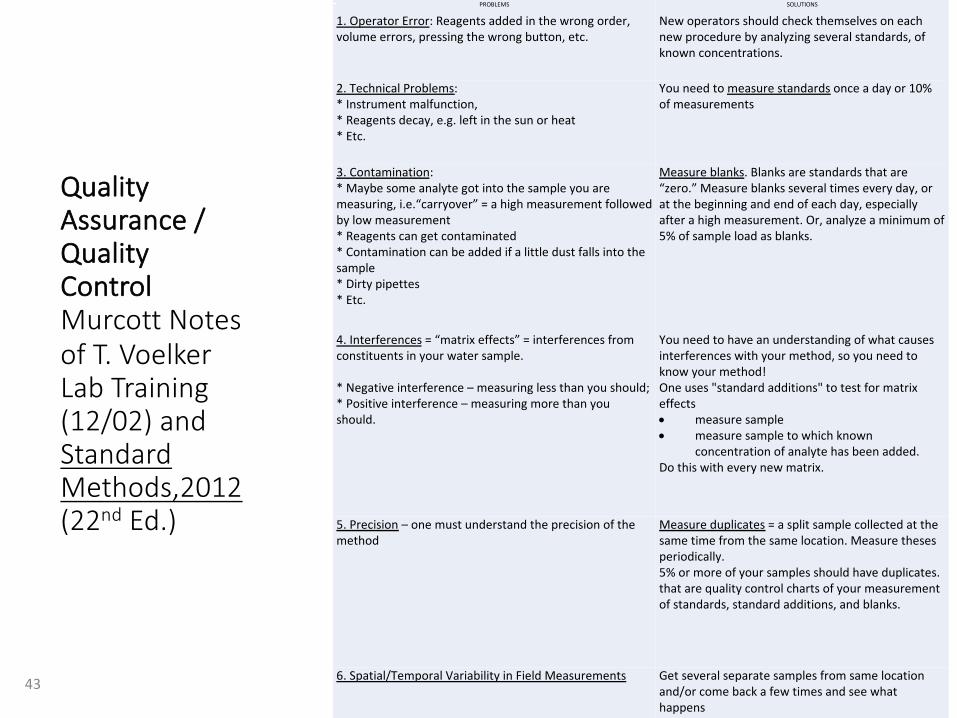
1. Operator Error: Reagents added in the wrong order, New operators should check themselves on each volume errors, pressing the wrong button, etc. new procedure by analyzing several standards, of
known concentrations.
Quality Assurance / Quality Control Murcott Notes of T. Voelker Lab Training (12/02) and Standard Methods,2012 (22nd Ed.)
2. Technical Problems: * Instrument malfunction, * Reagents decay, e.g. left in the sun or heat * Etc.
3. Contamination: * Maybe some analyte got into the sample you are measuring, i.e.“carryover” = a high measurement followed by low measurement * Reagents can get contaminated * Contamination can be added if a little dust falls into the sample * Dirty pipettes * Etc.
4. Interferences = “matrix effects” = interferences from constituents in your water sample.
* Negative interference – measuring less than you should; * Positive interference – measuring more than you should.
5. Precision – one must understand the precision of the method
You need to measure standards once a day or 10% of measurements
Measure blanks. Blanks are standards that are “zero.” Measure blanks several times every day, or at the beginning and end of each day, especially after a high measurement. Or, analyze a minimum of 5% of sample load as blanks.
You need to have an understanding of what causes interferences with your method, so you need to know your method! One uses "standard additions" to test for matrix effects • measure sample • measure sample to which known
concentration of analyte has been added. Do this with every new matrix.
Measure duplicates = a split sample collected at the same time from the same location. Measure theses periodically. 5% or more of your samples should have duplicates. that are quality control charts of your measurement of standards, standard additions, and blanks.
6. Spatial/Temporal Variability in Field Measurements Get several separate samples from same location and/or come back a few times and see what happens
43
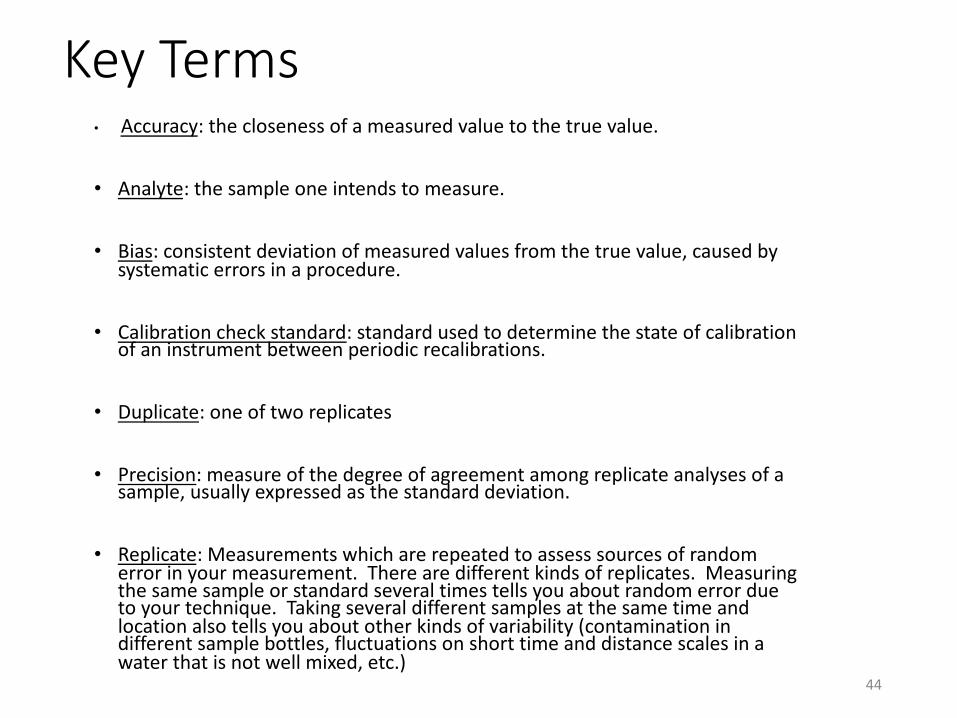
Key Terms • Accuracy: the closeness of a measured value to the true value.
• Analyte: the sample one intends to measure.
• Bias: consistent deviation of measured values from the true value, caused bysystematic errors in a procedure.
• Calibration check standard: standard used to determine the state of calibration of an instrument between periodic recalibrations.
• Duplicate: one of two replicates
• Precision: measure of the degree of agreement among replicate analyses of a sample, usually expressed as the standard deviation.
• Replicate: Measurements which are repeated to assess sources of random error in your measurement. There are different kinds of replicates. Measuringthe same sample or standard several times tells you about random error dueto your technique. Taking several different samples at the same time andlocation also tells you about other kinds of variability (contamination indifferent sample bottles, fluctuations on short time and distance scales in awater that is not well mixed, etc.)
44
MIT OpenCourseWare https://ocw.mit.edu
EC.715 / 11.474 D-Lab: Water, Sanitation, and Hygiene Fall 2019
For information about citing these materials or our Terms of Use, visit: https://ocw.mit.edu/terms.