technical report netapp e series and splunk · technical report netapp e-series and splunk stephen...
TRANSCRIPT
Technical Report
NetApp E-Series and Splunk Stephen Carl, NetApp
April 2016 | TR-4460
Abstract
This technical report describes the integrated architecture of the NetApp® E-Series and Splunk
design. Optimized for node storage balance, reliability, performance, storage capacity, and
density, this design employs the Splunk clustered index node model, with higher scalability
and lower TCO. This document summarizes the performance test results obtained from a
Splunk machine log event simulation tool.
2 NetApp E-Series and Splunk © 2016 NetApp, Inc. All rights reserved.
TABLE OF CONTENTS
1 Introduction ........................................................................................................................................... 4
2 Splunk Use Cases................................................................................................................................. 4
2.1 Use Cases ......................................................................................................................................................4
2.2 Architecture .....................................................................................................................................................5
3 NetApp E-Series Overview .................................................................................................................. 8
3.1 E-Series Hardware Overview ..........................................................................................................................8
3.2 SANtricity ........................................................................................................................................................9
3.3 Performance ................................................................................................................................................. 12
4 NetApp and E-Series Testing ............................................................................................................ 13
4.1 Overview of Splunk Cluster Testing Used for E-Series Compared to Commodity Server DAS .................... 14
4.2 Eventgen Data .............................................................................................................................................. 14
4.3 Cluster Replication and Searchable Copies Factor ....................................................................................... 15
4.4 Commodity Server with Internal DAS Baseline Test Setup ........................................................................... 15
4.5 E-Series with DDP Baseline Test Setup ....................................................................................................... 16
4.6 Baseline Test Results for E-Series Compared to Those of the Commodity Server with Internal DAS .......... 17
4.7 Search Results for Baseline Tests ................................................................................................................ 18
5 Summary ............................................................................................................................................. 21
6 Appendixes ......................................................................................................................................... 22
SANtricity 11.25 Update Test ................................................................................................................................ 22
Splunk Apps for NetApp ........................................................................................................................................ 29
Additional E-Series Information, Configurations, and Tests .................................................................................. 32
Splunk Cluster Server Information ......................................................................................................................... 37
References ................................................................................................................................................. 38
Version History ......................................................................................................................................... 39
LIST OF TABLES
Table 1) Splunk cluster server hardware. ..................................................................................................................... 14
Table 2) SANtricity 11.25 update whitebox SSD hot–SAS cold searches .................................................................... 25
Table 3) SANtricity 11.25 update E-Series SSD hot–SAS cold searches..................................................................... 26
Table 4) SANtricity 11.25 update E-Series SSD read cache and SAS hot–NL-SAS cold searches ............................. 27
Table 5) SANtricity 11.25 update E-Series SSD hot–NL-SAS cold searches ............................................................... 27
Table 6) SANtricity 11.25 update E-Series SAS hot–NL-SAS cold searches ............................................................... 28
3 NetApp E-Series and Splunk © 2016 NetApp, Inc. All rights reserved.
Table 7) E-Series 24-SSD hot bucket, 60 4TB NL-SAS cold bucket. ........................................................................... 33
Table 8) E-Series 24-SSD hot bucket, 60 4TB NL-SAS cold bucket searches. ............................................................ 33
Table 9) E-Series 1.2TB SAS hot bucket, 60 4TB NL-SAS cold bucket. ...................................................................... 34
Table 10) E-Series 1.2TB SAS hot bucket, 60 4TB NL-SAS cold bucket searches. .................................................... 34
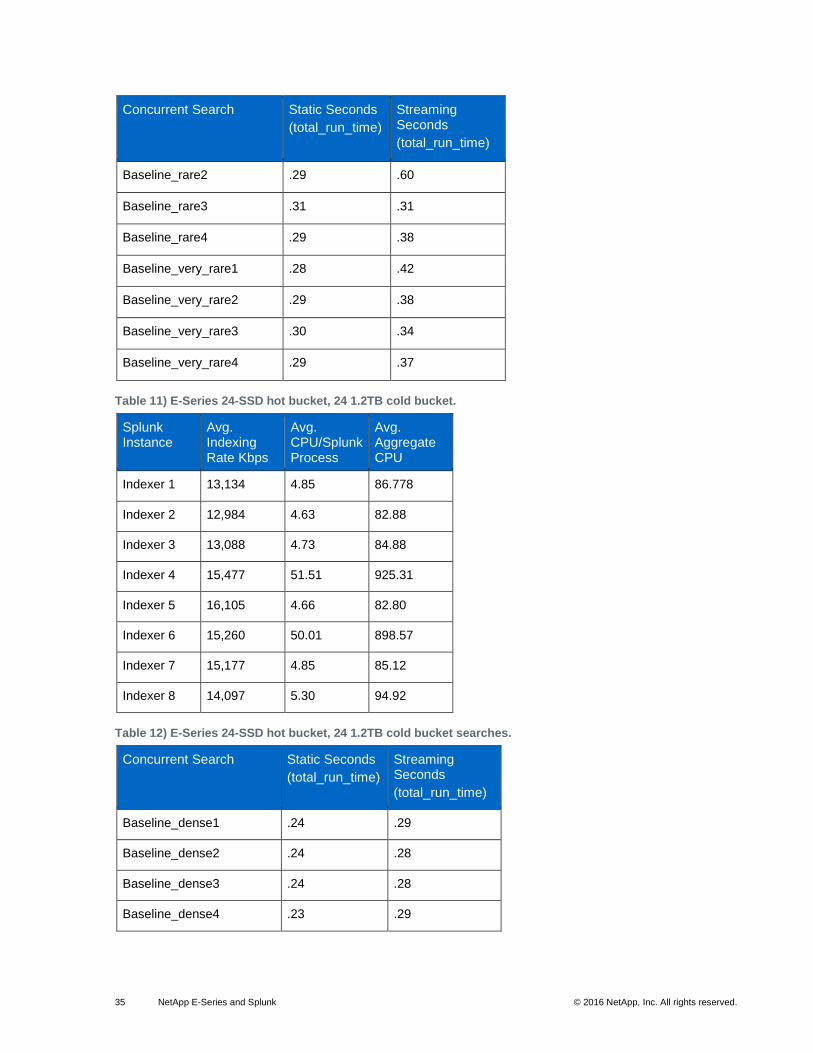
Table 11) E-Series 24-SSD hot bucket, 24 1.2TB cold bucket. .................................................................................... 35
Table 12) E-Series 24-SSD hot bucket, 24 1.2TB cold bucket searches. .................................................................... 35
Table 13) Index peer node mounted LUNs................................................................................................................... 37
Table 14) Index peer Linux multipath configuration. ..................................................................................................... 38
LIST OF FIGURES
Figure 1) Splunk cluster server components. .................................................................................................................6
Figure 2) Basic Splunk cluster configuration. .................................................................................................................7
Figure 3) Distribution of data in a five-node Splunk cluster. ...........................................................................................8
Figure 4) NetApp E-Series hardware. ............................................................................................................................9
Figure 5) SANtricity Array Management Window Summary tab. .................................................................................. 10
Figure 6) Dynamic Disk Pools components. ................................................................................................................. 11
Figure 7) Dynamic Disk Pools drive failure. .................................................................................................................. 12
Figure 8) Performance of the E5600 with all SSDs. ..................................................................................................... 13
Figure 9) Commodity server Splunk cluster with DAS. ................................................................................................. 15
Figure 10) Splunk cluster with E-Series DDP. .............................................................................................................. 17
Figure 11) Index peer node ingest rates. ...................................................................................................................... 18
Figure 12) Static searching comparison. ...................................................................................................................... 19
Figure 13) Streaming searches comparison. ................................................................................................................ 19
Figure 14) E-Series controller failure. ........................................................................................................................... 20
Figure 15) E-Series controller failure static search test. ............................................................................................... 20
Figure 16) E-Series controller failure streaming search test. ........................................................................................ 21
Figure 17) Baseline index ingest rates ......................................................................................................................... 23
Figure 18) Baseline static and streaming dense searches average ............................................................................. 24
Figure 19) Baseline static and streaming rare searches average ................................................................................. 24
Figure 20) E-Series index rates .................................................................................................................................... 25
Figure 21) Splunk app NetApp SANtricity Performance App for Splunk Enterprise. .................................................... 30
Figure 22) Splunk app for NetApp StorageGrid. ........................................................................................................... 31
Figure 23) Splunk app for Data ONTAP. ...................................................................................................................... 32
Figure 24) Splunk on Splunk app (S.O.S.) E-Series indexing rate. .............................................................................. 32
Figure 25) E-Series systems index rate average. ......................................................................................................... 36
Figure 26) E-Series static search average. .................................................................................................................. 37
Figure 27) E-Series streaming search average. ........................................................................................................... 37
4 NetApp E-Series and Splunk © 2016 NetApp, Inc. All rights reserved.
1 Introduction
NetApp E-Series enables Splunk environments to maintain the highest levels of performance and uptime
for Splunk workloads by providing advanced fault recovery features and easy in-service growth
capabilities to meet ever-changing business requirements. The E-Series is designed to handle the most
extreme application workloads with very low latency. Typical use cases include application acceleration;
improving the response time of latency-sensitive applications; and improving the power, environmental,
and capacity efficiency of overprovisioned environments. E-Series storage systems leverage the latest
solid-state-disk (SSD) and SAS drive technologies and are built on a long heritage of serving diverse
workloads to provide superior business value and enterprise-class reliability.
Splunk is the leading operational intelligence software that enables you to monitor, report, and analyze
live streaming and historical machine-generated data, whether it is on located on premise or in the cloud.
An organization’s IT data is a definitive source of intelligence because it is a categorical record of activity
and behavior, including user transactions, customer behavior, machine behavior, security threats, and
fraudulent activity. Splunk helps users gain visibility into this machine data to improve service levels,
reduce IT operations costs, mitigate security risks, enable compliance, and create new product and
service offerings. Splunk offers solutions for IT operations, applications management, security and
compliance, business analytics, and industrial data.
Since the initial release of this TR, NetApp has continued to innovate on the E-Series storage systems.
NetApp has also released a new version of the NetApp SANtricity® OS, version 11.25. More information
on SANtricity release 11.25 can be found here. All of our original testing was redone on the new version
of SANtricity as well as on the new version of Splunk, version 6.3.3. More information on Splunk version
6.3.3 is available here.
The retesting also enabled us to test the SSD read cache SANtricity E-Series feature. This feature has
additional benefits for Splunk-specific workloads. Information and the results of the testing are in
Appendix 0, SANtricity 11.25 Update Test.
2 Splunk Use Cases
All of your IT applications, systems, and technology infrastructure generate data every millisecond of
every day. This machine data is one of the fastest growing and most complex areas of big data. Splunk
collects all of your data sources—streaming and historical—by using a technology called universal
indexing. Splunk is scalable enough to work across all of your data centers and it is powerful enough to
deliver real-time dashboard views to any level of the organization. However, using this data can be a
challenge for traditional data analysis, monitoring, and management solutions that are not designed for
large-volume, high-velocity diverse data.
Splunk offers a unique way to sift, distill, and understand these immense amounts of machine data that
can change how IT organizations manage, analyze, secure, and audit IT. Splunk enables users to
develop valuable insights into how to innovate and offer new services as well as into trends and customer
behaviors.
2.1 Use Cases
Splunk can be deployed for use in a wide variety of use cases and it provides creative ways for users to
gain intelligence from data.
Application Delivery
Gain end-to-end visibility across distributed infrastructures, troubleshoot application environments,
monitor performance for degradation, and monitor transactions across distributed systems and
infrastructure.
5 NetApp E-Series and Splunk © 2016 NetApp, Inc. All rights reserved.
Security, Compliance, and Fraud
Enable rapid incident response, real-time correlation, and in-depth monitoring across data sources.
Conduct statistical analysis for advanced pattern detection and threat defense.
Infrastructure and Operations Management
Proactively monitor across IT silos to enable uptime, rapidly pinpoint and resolve problems, identify
infrastructure service relationships, establish baselines, and create analytics to report on SLAs or track
service provider SLAs.
Business Analytics
Provide visibility and intelligence related to customers, services, and transactions. Recognize trends and
patterns in real time and provide valuable understanding of new product features’ impact on back-end
services. Gain valuable understanding of the user experience for greater user satisfaction and prevent
drop-offs, improve conversions, and boost online revenues.
2.2 Architecture
Splunk’s architecture provides linear scalability for indexing and distributed search. Splunk’s
implementation of MapReduce allows large-scale search, reporting, and alerting. Splunk takes a single
search and enables you to query many indexers in massive parallel clusters. With the addition of index
replication, you can specify how many copies of the data you want to make available to meet your
availability requirements.
The Splunk platform is open and has SDKs and APIs, including a REST API and SDKs for Python, Java,
JavaScript, PHP, Ruby, and C#. This capability enables developers to programmatically interface with the
Splunk platform. With Splunk you can develop your own applications or templates to deploy on your
infrastructure.
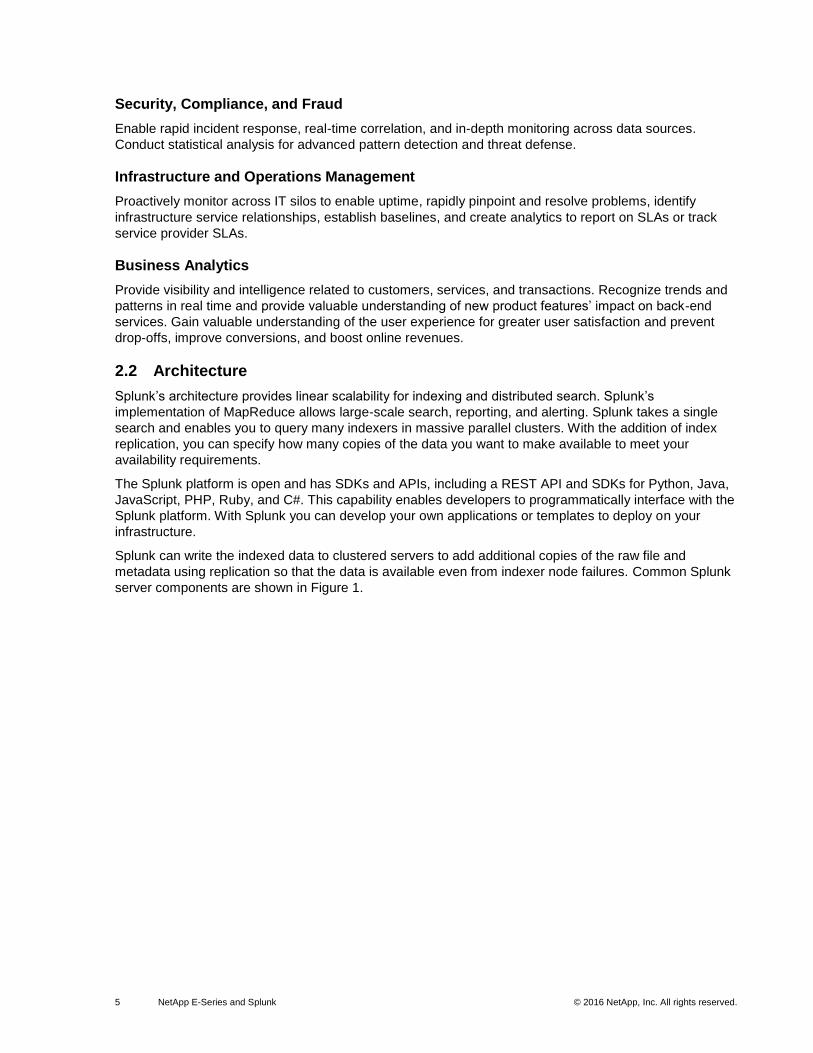
Splunk can write the indexed data to clustered servers to add additional copies of the raw file and
metadata using replication so that the data is available even from indexer node failures. Common Splunk
server components are shown in Figure 1.
6 NetApp E-Series and Splunk © 2016 NetApp, Inc. All rights reserved.
Figure 1) Splunk cluster server components.
The common and recommended replication factor for Splunk running internal direct-attached storage
(DAS) is three. In this scenario, the minimum number of needed Splunk index servers is also three.
Figure 2 shows the basic Splunk cluster configuration.

7 NetApp E-Series and Splunk © 2016 NetApp, Inc. All rights reserved.
Figure 2) Basic Splunk cluster configuration.
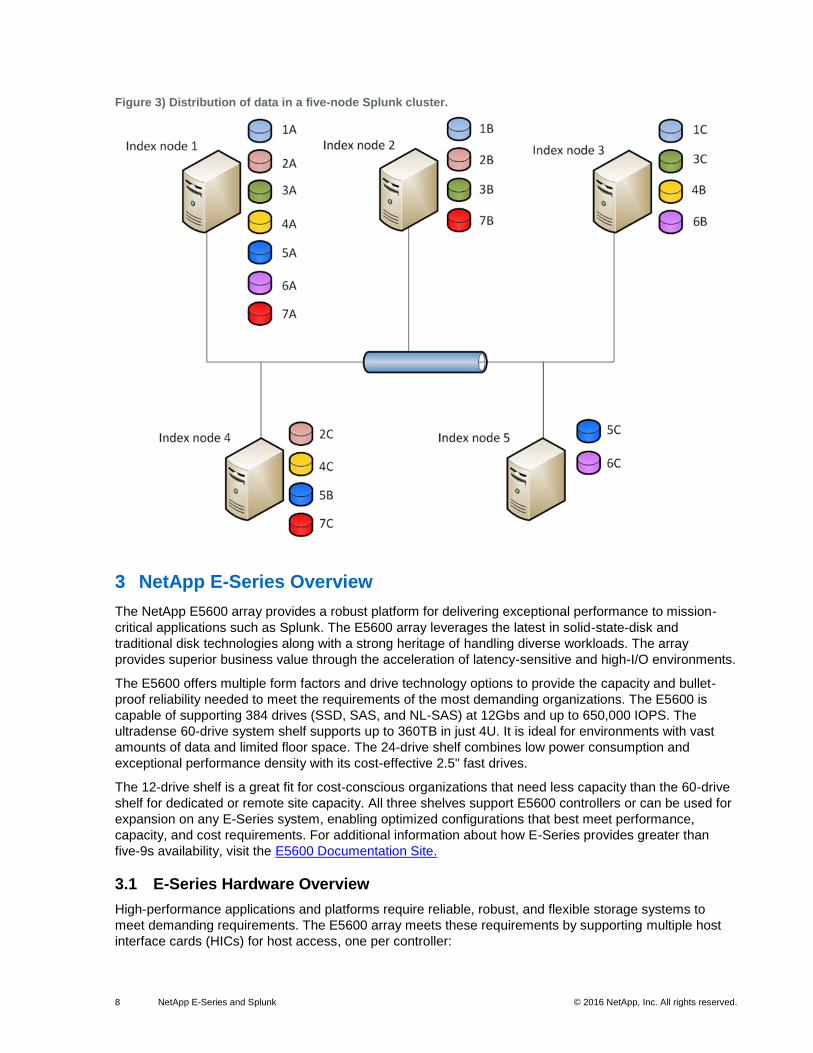
The machine log data from the Splunk forwarders sent to the indexer peer nodes uses the recommended
data replication factor of three, which makes available three copies of data. The ingested data is
compressed and indexed as raw data files and metadata that is then distributed among the indexer peer
nodes for redundancy. Figure 3 depicts the way that Splunk replicates data in a five-indexer cluster.
8 NetApp E-Series and Splunk © 2016 NetApp, Inc. All rights reserved.
Figure 3) Distribution of data in a five-node Splunk cluster.
3 NetApp E-Series Overview
The NetApp E5600 array provides a robust platform for delivering exceptional performance to mission-
critical applications such as Splunk. The E5600 array leverages the latest in solid-state-disk and
traditional disk technologies along with a strong heritage of handling diverse workloads. The array
provides superior business value through the acceleration of latency-sensitive and high-I/O environments.
The E5600 offers multiple form factors and drive technology options to provide the capacity and bullet-
proof reliability needed to meet the requirements of the most demanding organizations. The E5600 is
capable of supporting 384 drives (SSD, SAS, and NL-SAS) at 12Gbs and up to 650,000 IOPS. The
ultradense 60-drive system shelf supports up to 360TB in just 4U. It is ideal for environments with vast
amounts of data and limited floor space. The 24-drive shelf combines low power consumption and
exceptional performance density with its cost-effective 2.5" fast drives.
The 12-drive shelf is a great fit for cost-conscious organizations that need less capacity than the 60-drive
shelf for dedicated or remote site capacity. All three shelves support E5600 controllers or can be used for
expansion on any E-Series system, enabling optimized configurations that best meet performance,
capacity, and cost requirements. For additional information about how E-Series provides greater than
five-9s availability, visit the E5600 Documentation Site.
3.1 E-Series Hardware Overview
High-performance applications and platforms require reliable, robust, and flexible storage systems to
meet demanding requirements. The E5600 array meets these requirements by supporting multiple host
interface cards (HICs) for host access, one per controller:
9 NetApp E-Series and Splunk © 2016 NetApp, Inc. All rights reserved.
Four-port 16Gb FC
Two-port 56Gb IB (currently the E5600 supports only iSER and the 56Gb HIC)
Four-port 10Gb iSCSI
Four-port 12Gb SAS
Up to 120 SSDs per storage system
Up to 384 disks per storage system
Multiple RAID levels (0, 1, 10, 3, 5, and 6) as well as support for Dynamic Disk Pools (DDP)
Optional data assurance capabilities (T10PI data integrity checking)
Media parity check and correction capability
Extensive event logging
Recovery Guru on-board system diagnostics and recovery capability
Hardware redundancy
12GB cache memory per controller to maximize read/write performance
NVSRAM and on-board USB drive to preserve the system configuration during power outages
Figure 4) NetApp E-Series hardware.
3.2 SANtricity
NetApp SANtricity management software is based on the Java framework and is the GUI used to manage
E-Series storage arrays. SANtricity can be installed on Windows or Linux operating systems, but the
application should be installed on a management node that does not participate in production data
delivery. The software is available in 64-bit versions, and the installation process detects whether
installation of the package was performed on the incorrect OS version.
10 NetApp E-Series and Splunk © 2016 NetApp, Inc. All rights reserved.
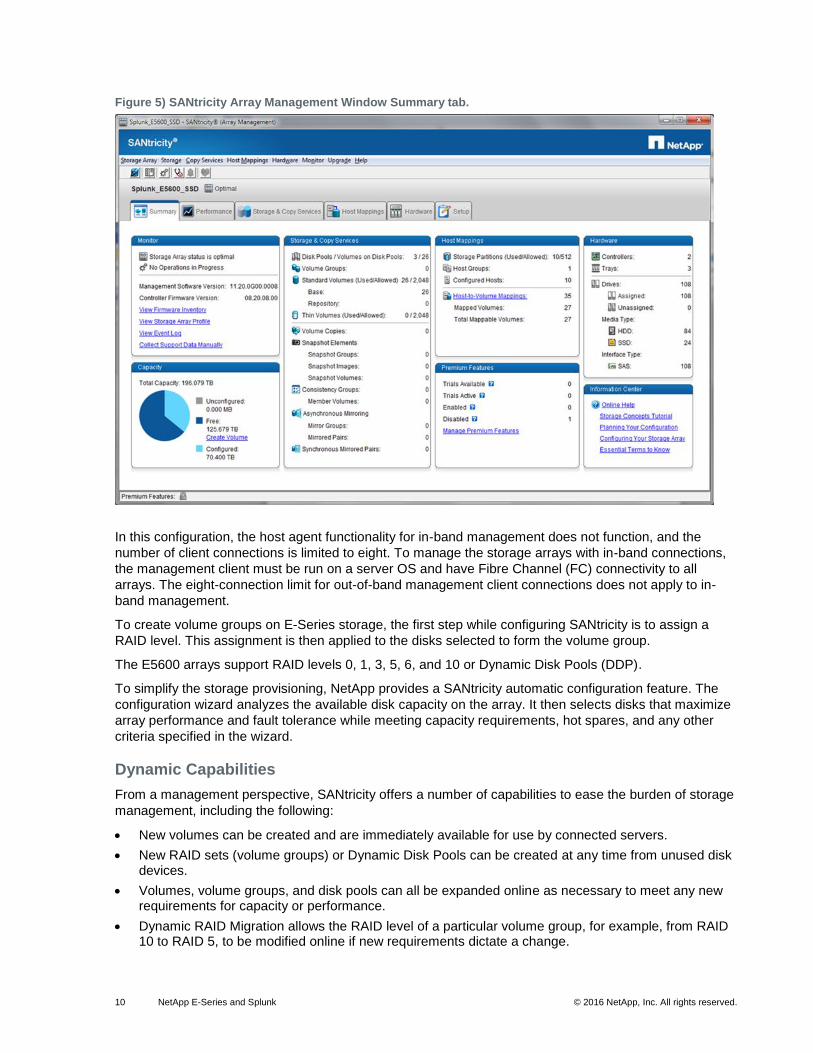
Figure 5) SANtricity Array Management Window Summary tab.
In this configuration, the host agent functionality for in-band management does not function, and the
number of client connections is limited to eight. To manage the storage arrays with in-band connections,
the management client must be run on a server OS and have Fibre Channel (FC) connectivity to all
arrays. The eight-connection limit for out-of-band management client connections does not apply to in-
band management.
To create volume groups on E-Series storage, the first step while configuring SANtricity is to assign a
RAID level. This assignment is then applied to the disks selected to form the volume group.
The E5600 arrays support RAID levels 0, 1, 3, 5, 6, and 10 or Dynamic Disk Pools (DDP).
To simplify the storage provisioning, NetApp provides a SANtricity automatic configuration feature. The
configuration wizard analyzes the available disk capacity on the array. It then selects disks that maximize
array performance and fault tolerance while meeting capacity requirements, hot spares, and any other
criteria specified in the wizard.
Dynamic Capabilities
From a management perspective, SANtricity offers a number of capabilities to ease the burden of storage
management, including the following:
New volumes can be created and are immediately available for use by connected servers.
New RAID sets (volume groups) or Dynamic Disk Pools can be created at any time from unused disk devices.
Volumes, volume groups, and disk pools can all be expanded online as necessary to meet any new requirements for capacity or performance.
Dynamic RAID Migration allows the RAID level of a particular volume group, for example, from RAID 10 to RAID 5, to be modified online if new requirements dictate a change.
11 NetApp E-Series and Splunk © 2016 NetApp, Inc. All rights reserved.
Flexible cache block and segment sizes allow optimized performance tuning based on a particular workload. Both items can also be modified online.
There is built-in performance monitoring of all major storage components, including controllers, volumes, volume groups, pools, and individual disk drives.
Automated remote connection to the NetApp AutoSupport™
function provides “phone home” capabilities and automated parts dispatch if a component fails.
The E5600 has path failover and load-balancing (if applicable) between host and the redundant storage controllers.
You gain the ability to manage and monitor multiple E-Series and/or EF-Series storage systems from the same management interface.
Dynamic Disk Pools
With seven patents pending, the DDP feature dynamically distributes data, spare capacity, and protection
information across a pool of disk drives. These pools can range in number from a minimum of 11 drives to
all the drives in an E5600 or EF560 storage system. In addition to creating a single DDP, storage
administrators can opt to create traditional volume groups in conjunction with a single DDP or even
multiple DDPs, which offers an unprecedented level of flexibility.
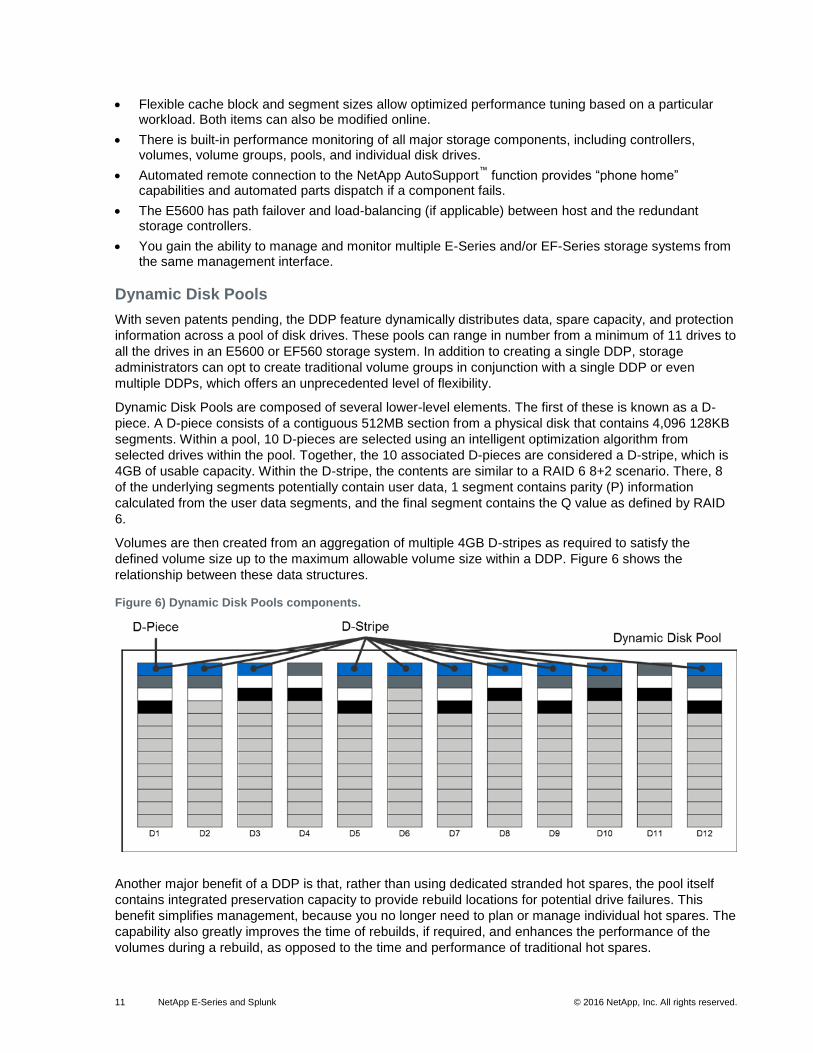
Dynamic Disk Pools are composed of several lower-level elements. The first of these is known as a D-
piece. A D-piece consists of a contiguous 512MB section from a physical disk that contains 4,096 128KB
segments. Within a pool, 10 D-pieces are selected using an intelligent optimization algorithm from
selected drives within the pool. Together, the 10 associated D-pieces are considered a D-stripe, which is
4GB of usable capacity. Within the D-stripe, the contents are similar to a RAID 6 8+2 scenario. There, 8
of the underlying segments potentially contain user data, 1 segment contains parity (P) information
calculated from the user data segments, and the final segment contains the Q value as defined by RAID
6.
Volumes are then created from an aggregation of multiple 4GB D-stripes as required to satisfy the
defined volume size up to the maximum allowable volume size within a DDP. Figure 6 shows the
relationship between these data structures.
Figure 6) Dynamic Disk Pools components.
Another major benefit of a DDP is that, rather than using dedicated stranded hot spares, the pool itself
contains integrated preservation capacity to provide rebuild locations for potential drive failures. This
benefit simplifies management, because you no longer need to plan or manage individual hot spares. The
capability also greatly improves the time of rebuilds, if required, and enhances the performance of the
volumes during a rebuild, as opposed to the time and performance of traditional hot spares.

12 NetApp E-Series and Splunk © 2016 NetApp, Inc. All rights reserved.
When a drive in a DDP fails, the D-pieces from the failed drive are reconstructed to potentially all other
drives in the pool using the same mechanism normally used by RAID 6. During this process, an algorithm
internal to the controller framework verifies that no single drive contains two D-pieces from the same D-
stripe. The individual D-pieces are reconstructed at the lowest available LBA range on the selected disk
drive.
Figure 7) Dynamic Disk Pools drive failure.
In Figure 7, above, disk drive 6 (D6) is shown to have failed. Later, the D-pieces that previously resided
on that disk are recreated simultaneously across several other drives in the pool. Because there are
multiple disks participating in the effort, the overall performance impact of this situation is lessened and
the length of time needed to complete the operation is dramatically reduced.
In the event of multiple disk failures within a DDP, priority reconstruction is given to any D-stripes that are
missing two D-pieces to minimize any data availability risk. After those critically affected D-stripes are
reconstructed, the remainder of the necessary data continues to be reconstructed.
From a controller resource allocation perspective, there are two reconstruction priorities within a DDP that
the user can modify:
The degraded reconstruction priority is assigned for instances in which only a single D-piece must be rebuilt for the affected D-stripes; the default for this is high.
The critical reconstruction priority is assigned for instances in which a D-stripe has two missing D-pieces that need to be rebuilt; the default for this is highest.
For very large disk pools with two simultaneous disk failures, only a relatively small number of D-stripes
are likely to encounter the critical situation in which two D-pieces must be reconstructed. As discussed
previously, these critical D-pieces are identified and reconstructed initially at the highest priority. This
process returns the DDP to a degraded state very quickly so that further drive failures can be tolerated.
In addition to the improvement in rebuild times and superior data protection, DDP can also greatly
improve the performance of the base volume when under a failure condition compared with the
performance of traditional volume groups.
3.3 Performance
An E5600 configured with all SSD or HDD drives is capable of performing at very high levels, both in
input/output per second (IOPS) and throughput, while still providing extremely low latency. The E5600,
through its ease of management, high degree of reliability, and exceptional performance, can be
leveraged to meet the extreme performance requirements expected in a Splunk server cluster
deployment.
13 NetApp E-Series and Splunk © 2016 NetApp, Inc. All rights reserved.
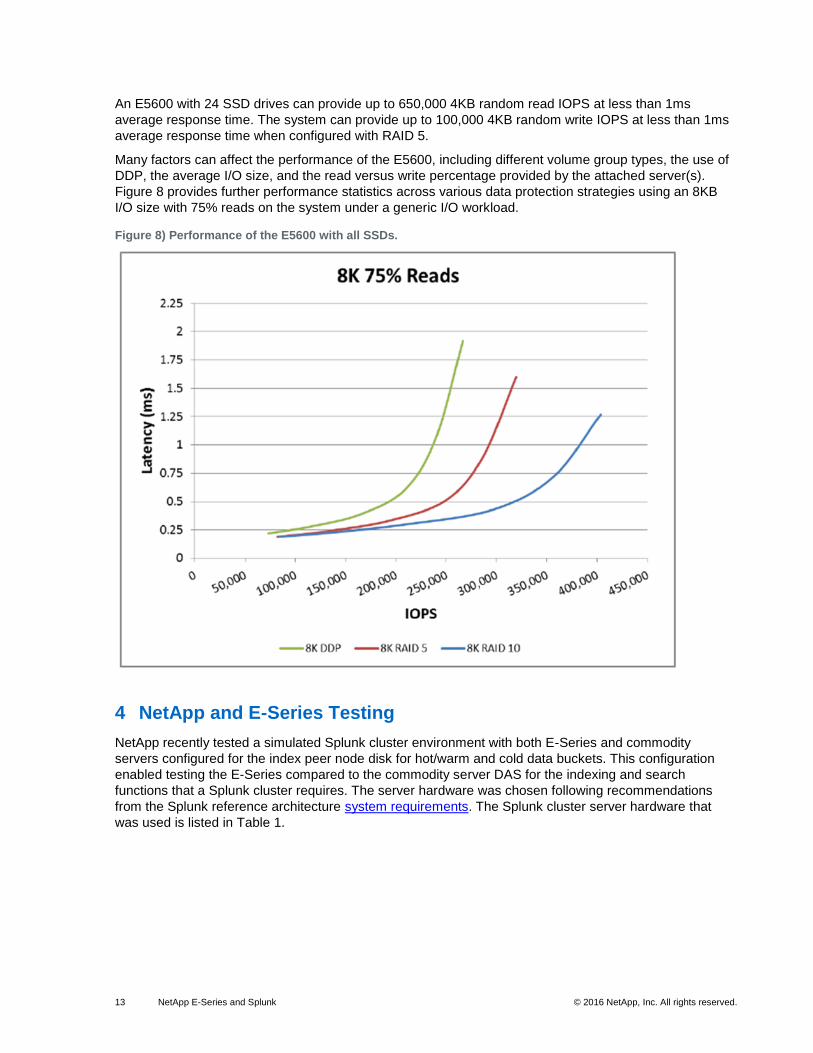
An E5600 with 24 SSD drives can provide up to 650,000 4KB random read IOPS at less than 1ms
average response time. The system can provide up to 100,000 4KB random write IOPS at less than 1ms
average response time when configured with RAID 5.
Many factors can affect the performance of the E5600, including different volume group types, the use of
DDP, the average I/O size, and the read versus write percentage provided by the attached server(s).
Figure 8 provides further performance statistics across various data protection strategies using an 8KB
I/O size with 75% reads on the system under a generic I/O workload.
Figure 8) Performance of the E5600 with all SSDs.
4 NetApp and E-Series Testing
NetApp recently tested a simulated Splunk cluster environment with both E-Series and commodity
servers configured for the index peer node disk for hot/warm and cold data buckets. This configuration
enabled testing the E-Series compared to the commodity server DAS for the indexing and search
functions that a Splunk cluster requires. The server hardware was chosen following recommendations
from the Splunk reference architecture system requirements. The Splunk cluster server hardware that
was used is listed in Table 1.
14 NetApp E-Series and Splunk © 2016 NetApp, Inc. All rights reserved.
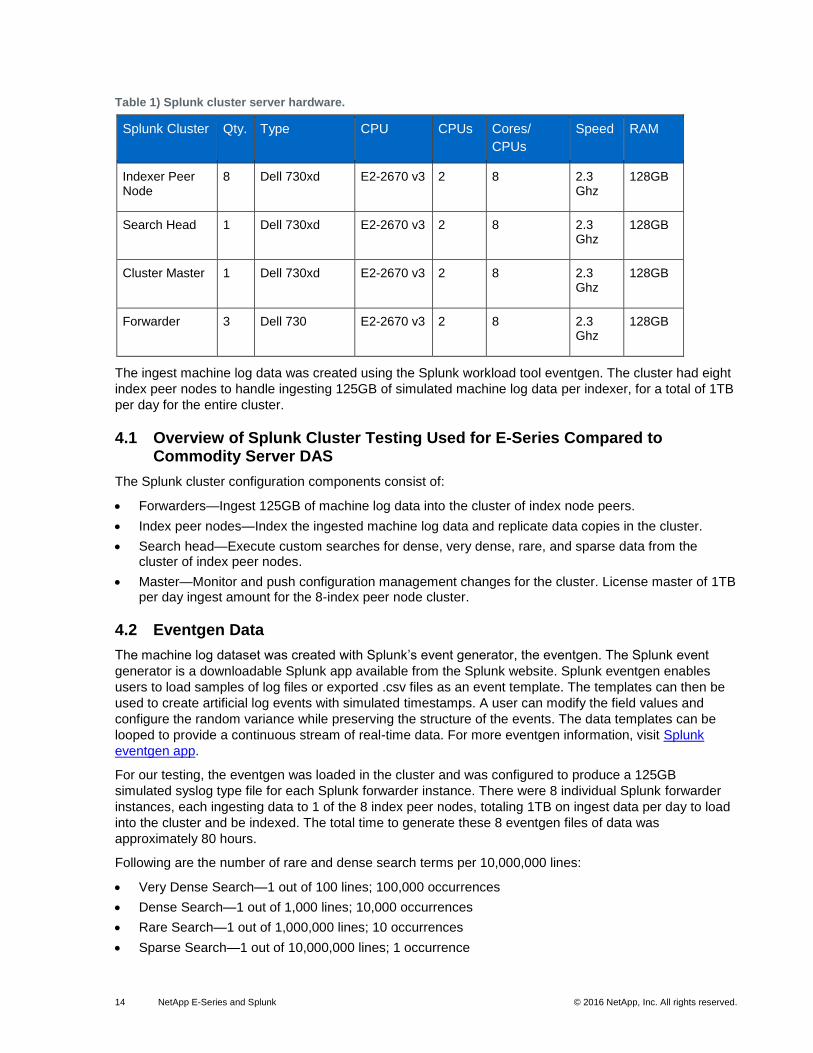
Table 1) Splunk cluster server hardware.
Splunk Cluster Qty. Type CPU CPUs Cores/
CPUs
Speed RAM
Indexer Peer Node
8 Dell 730xd E2-2670 v3 2 8 2.3 Ghz
128GB
Search Head 1 Dell 730xd E2-2670 v3 2 8 2.3 Ghz
128GB
Cluster Master 1 Dell 730xd E2-2670 v3 2 8 2.3 Ghz
128GB
Forwarder 3 Dell 730 E2-2670 v3 2 8 2.3 Ghz
128GB
The ingest machine log data was created using the Splunk workload tool eventgen. The cluster had eight
index peer nodes to handle ingesting 125GB of simulated machine log data per indexer, for a total of 1TB
per day for the entire cluster.
4.1 Overview of Splunk Cluster Testing Used for E-Series Compared to Commodity Server DAS
The Splunk cluster configuration components consist of:
Forwarders—Ingest 125GB of machine log data into the cluster of index node peers.
Index peer nodes—Index the ingested machine log data and replicate data copies in the cluster.
Search head—Execute custom searches for dense, very dense, rare, and sparse data from the cluster of index peer nodes.
Master—Monitor and push configuration management changes for the cluster. License master of 1TB per day ingest amount for the 8-index peer node cluster.
4.2 Eventgen Data
The machine log dataset was created with Splunk’s event generator, the eventgen. The Splunk event
generator is a downloadable Splunk app available from the Splunk website. Splunk eventgen enables
users to load samples of log files or exported .csv files as an event template. The templates can then be
used to create artificial log events with simulated timestamps. A user can modify the field values and
configure the random variance while preserving the structure of the events. The data templates can be
looped to provide a continuous stream of real-time data. For more eventgen information, visit Splunk
eventgen app.
For our testing, the eventgen was loaded in the cluster and was configured to produce a 125GB
simulated syslog type file for each Splunk forwarder instance. There were 8 individual Splunk forwarder
instances, each ingesting data to 1 of the 8 index peer nodes, totaling 1TB on ingest data per day to load
into the cluster and be indexed. The total time to generate these 8 eventgen files of data was
approximately 80 hours.
Following are the number of rare and dense search terms per 10,000,000 lines:
Very Dense Search—1 out of 100 lines; 100,000 occurrences
Dense Search—1 out of 1,000 lines; 10,000 occurrences
Rare Search—1 out of 1,000,000 lines; 10 occurrences
Sparse Search—1 out of 10,000,000 lines; 1 occurrence
15 NetApp E-Series and Splunk © 2016 NetApp, Inc. All rights reserved.
4.3 Cluster Replication and Searchable Copies Factor
The commodity server Splunk cluster was configured with a replication factor of 3 and searchable copies
with a factor of 2. The searchable copies are buckets with excess copies of indexed data. There is one
primary copy of indexed data in a cluster. Extra copies add more indexing space and are used when
indexer nodes are removed in the cluster. The fewer searchable copies, the better performance there is
for searches.
The E-Series test was configured with a replication factor of 2 and searchable copies with a factor of 1.
The E-Series provides another level of redundancy with additional copies of indexed data located in the
DDP volumes. This additional redundancy enables the replication factor of 2 to seamlessly provide fewer
copies of index data in the Splunk cluster for performance benefits.
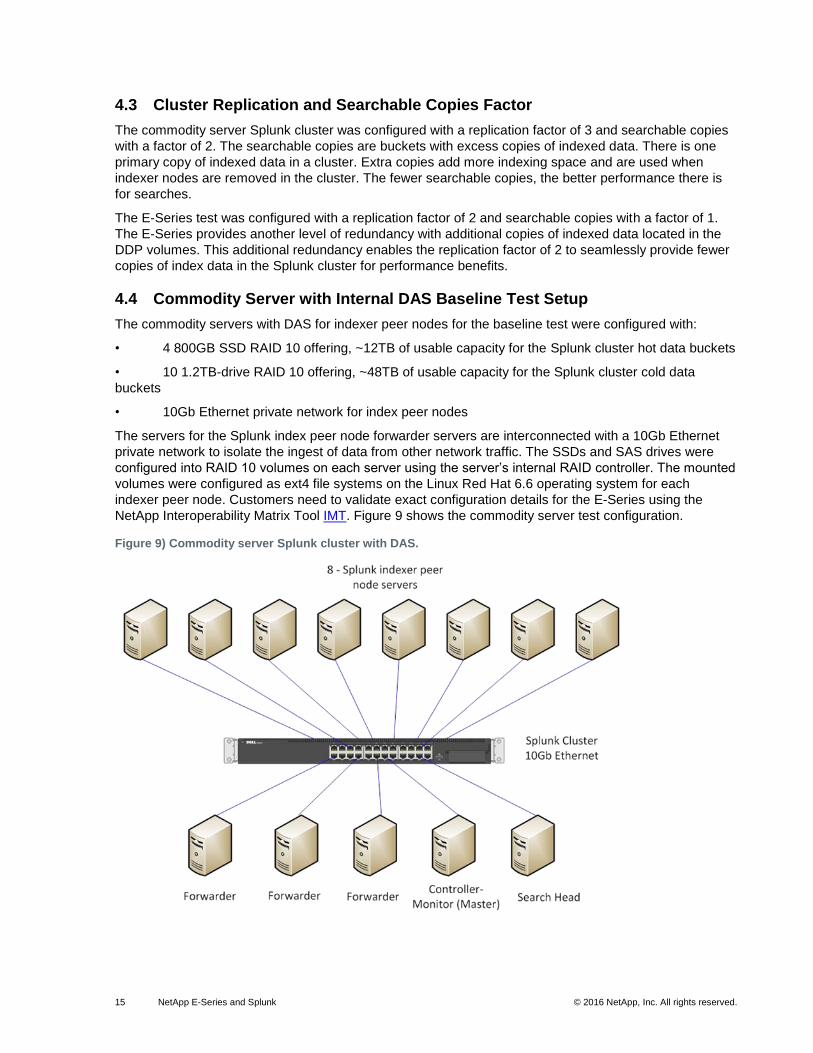
4.4 Commodity Server with Internal DAS Baseline Test Setup
The commodity servers with DAS for indexer peer nodes for the baseline test were configured with:
• 4 800GB SSD RAID 10 offering, ~12TB of usable capacity for the Splunk cluster hot data buckets
• 10 1.2TB-drive RAID 10 offering, ~48TB of usable capacity for the Splunk cluster cold data
buckets
• 10Gb Ethernet private network for index peer nodes
The servers for the Splunk index peer node forwarder servers are interconnected with a 10Gb Ethernet
private network to isolate the ingest of data from other network traffic. The SSDs and SAS drives were
configured into RAID 10 volumes on each server using the server’s internal RAID controller. The mounted
volumes were configured as ext4 file systems on the Linux Red Hat 6.6 operating system for each
indexer peer node. Customers need to validate exact configuration details for the E-Series using the
NetApp Interoperability Matrix Tool IMT. Figure 9 shows the commodity server test configuration.
Figure 9) Commodity server Splunk cluster with DAS.

16 NetApp E-Series and Splunk © 2016 NetApp, Inc. All rights reserved.
4.5 E-Series with DDP Baseline Test Setup
The E-5600 configuration for the baseline test was configured with DDP LUNs using:
24 x 800GB SSDs with a pool preservation capacity of 2 drives, offering ~12TB of usable capacity for the Splunk cluster hot data buckets
An additional DE5624 expansion tray was added with a single DDP using:
24 x 1.2TB drives with a pool preservation capacity of 2 drives, offering ~18TB of usable capacity for the Splunk cluster cold data buckets
60 x 4TB drives with a pool preservation capacity of 3 drives, offering ~168TB of usable capacity for the Splunk cluster cold data buckets
Additional baseline testing replacing 1.2TB SAS drives:
10Gb Ethernet private network for index peer nodes
16Gb Fibre Channel SAN for E-Series and index peer nodes
The DDP LUNs were configured into eight volumes: one each of the eight index peer node hosts. The
mounted volumes were configured as ext4 file systems on the Linux Red Hat 6.6 OS each indexer runs.
The same server hardware is used for the E-Series configuration as for the commodity test configuration.
This setup provides a baseline comparison level to eliminate any hardware differences between the E-
Series and the commodity test configurations except for the local internal disks (DAS). See Figure 10 for
the E-Series baseline configuration.
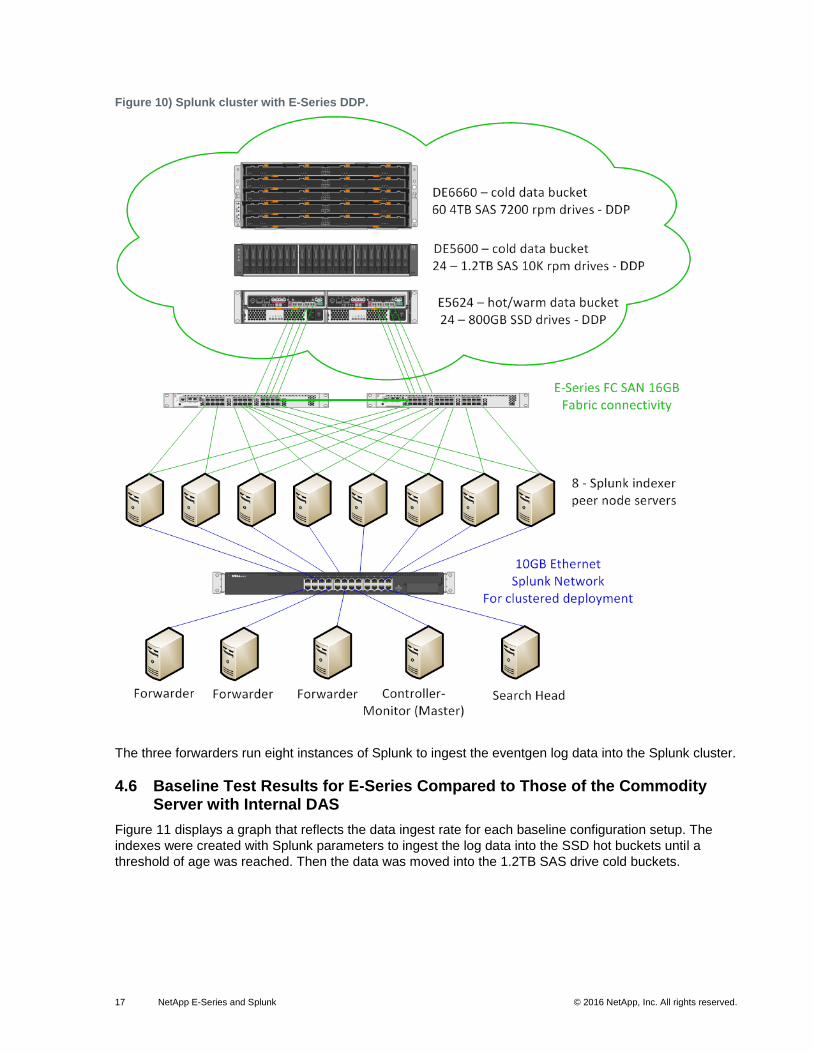
17 NetApp E-Series and Splunk © 2016 NetApp, Inc. All rights reserved.
Figure 10) Splunk cluster with E-Series DDP.
The three forwarders run eight instances of Splunk to ingest the eventgen log data into the Splunk cluster.
4.6 Baseline Test Results for E-Series Compared to Those of the Commodity Server with Internal DAS
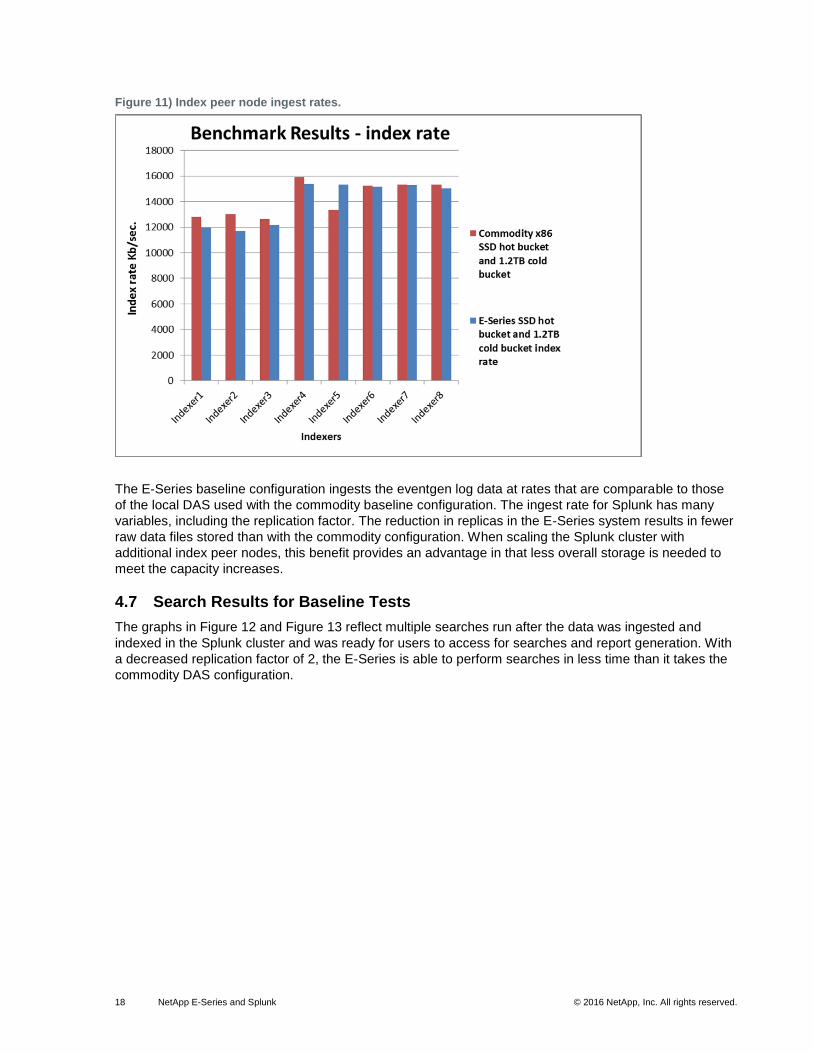
Figure 11 displays a graph that reflects the data ingest rate for each baseline configuration setup. The
indexes were created with Splunk parameters to ingest the log data into the SSD hot buckets until a
threshold of age was reached. Then the data was moved into the 1.2TB SAS drive cold buckets.
18 NetApp E-Series and Splunk © 2016 NetApp, Inc. All rights reserved.
Figure 11) Index peer node ingest rates.
The E-Series baseline configuration ingests the eventgen log data at rates that are comparable to those
of the local DAS used with the commodity baseline configuration. The ingest rate for Splunk has many
variables, including the replication factor. The reduction in replicas in the E-Series system results in fewer
raw data files stored than with the commodity configuration. When scaling the Splunk cluster with
additional index peer nodes, this benefit provides an advantage in that less overall storage is needed to
meet the capacity increases.
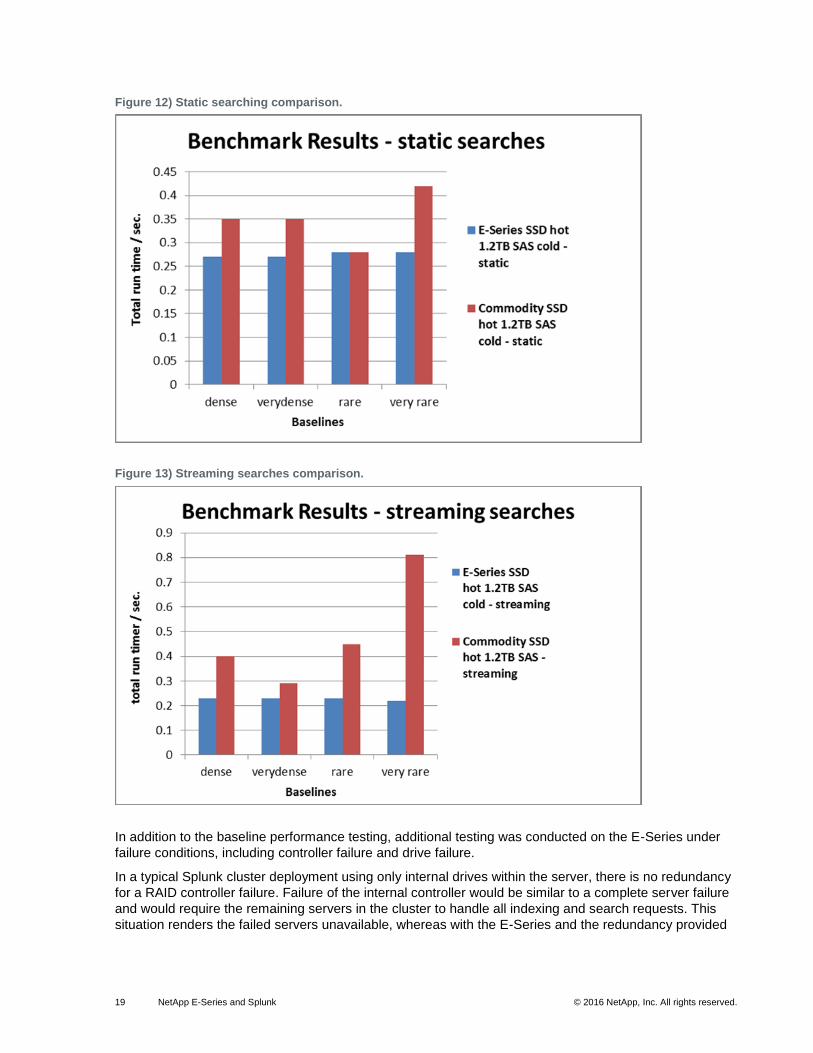
4.7 Search Results for Baseline Tests
The graphs in Figure 12 and Figure 13 reflect multiple searches run after the data was ingested and
indexed in the Splunk cluster and was ready for users to access for searches and report generation. With
a decreased replication factor of 2, the E-Series is able to perform searches in less time than it takes the
commodity DAS configuration.
19 NetApp E-Series and Splunk © 2016 NetApp, Inc. All rights reserved.
Figure 12) Static searching comparison.
Figure 13) Streaming searches comparison.
In addition to the baseline performance testing, additional testing was conducted on the E-Series under
failure conditions, including controller failure and drive failure.
In a typical Splunk cluster deployment using only internal drives within the server, there is no redundancy
for a RAID controller failure. Failure of the internal controller would be similar to a complete server failure
and would require the remaining servers in the cluster to handle all indexing and search requests. This
situation renders the failed servers unavailable, whereas with the E-Series and the redundancy provided
20 NetApp E-Series and Splunk © 2016 NetApp, Inc. All rights reserved.
through the dual-redundant-controller design, all data is available because all LUNs simply transition to
the remaining controller.
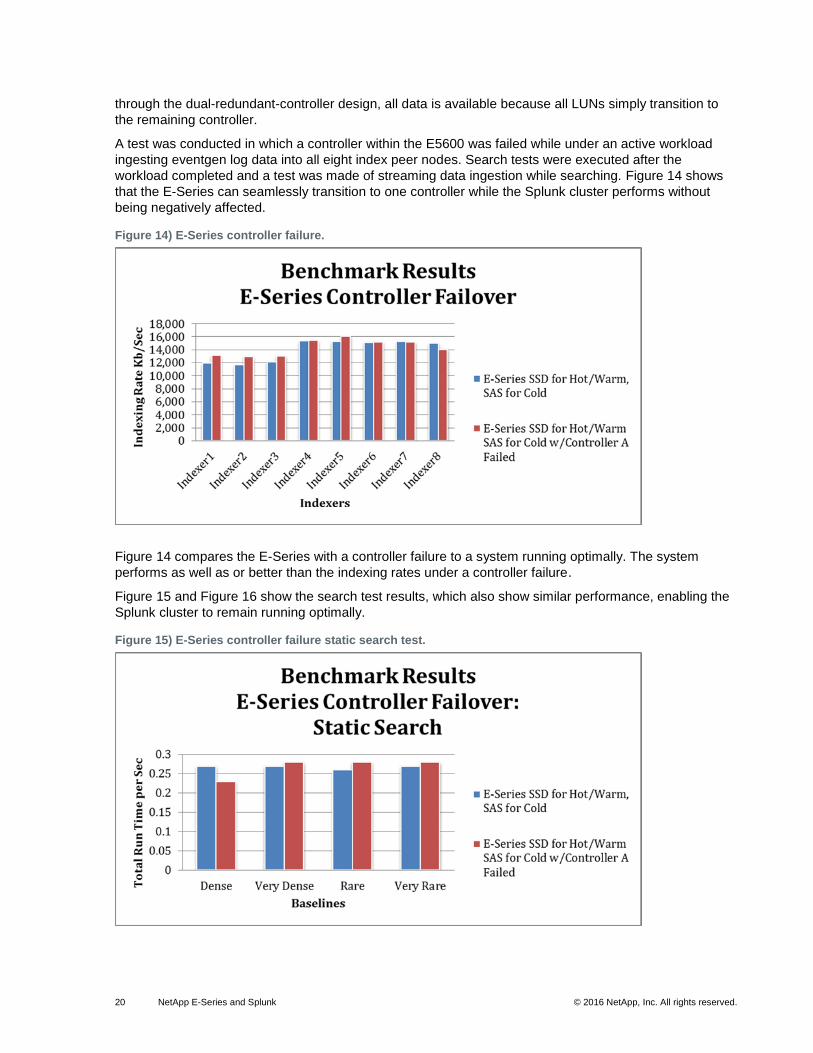
A test was conducted in which a controller within the E5600 was failed while under an active workload
ingesting eventgen log data into all eight index peer nodes. Search tests were executed after the
workload completed and a test was made of streaming data ingestion while searching. Figure 14 shows
that the E-Series can seamlessly transition to one controller while the Splunk cluster performs without
being negatively affected.
Figure 14) E-Series controller failure.
Figure 14 compares the E-Series with a controller failure to a system running optimally. The system
performs as well as or better than the indexing rates under a controller failure.
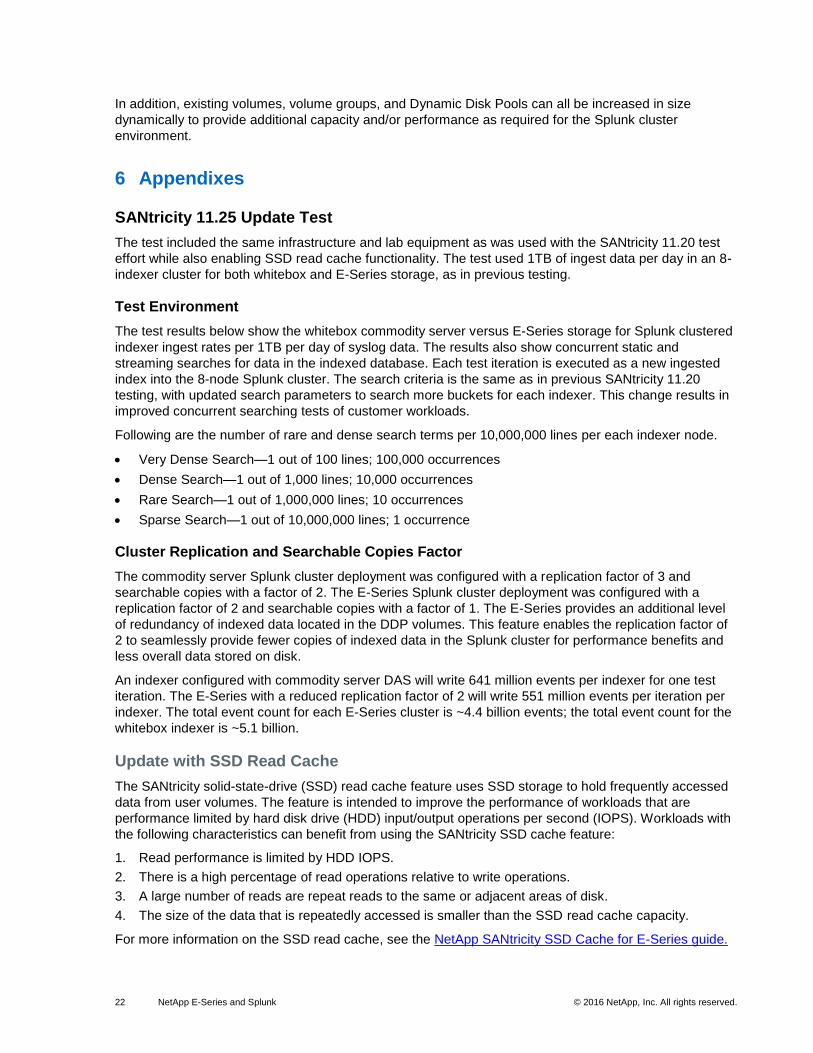
Figure 15 and Figure 16 show the search test results, which also show similar performance, enabling the
Splunk cluster to remain running optimally.
Figure 15) E-Series controller failure static search test.
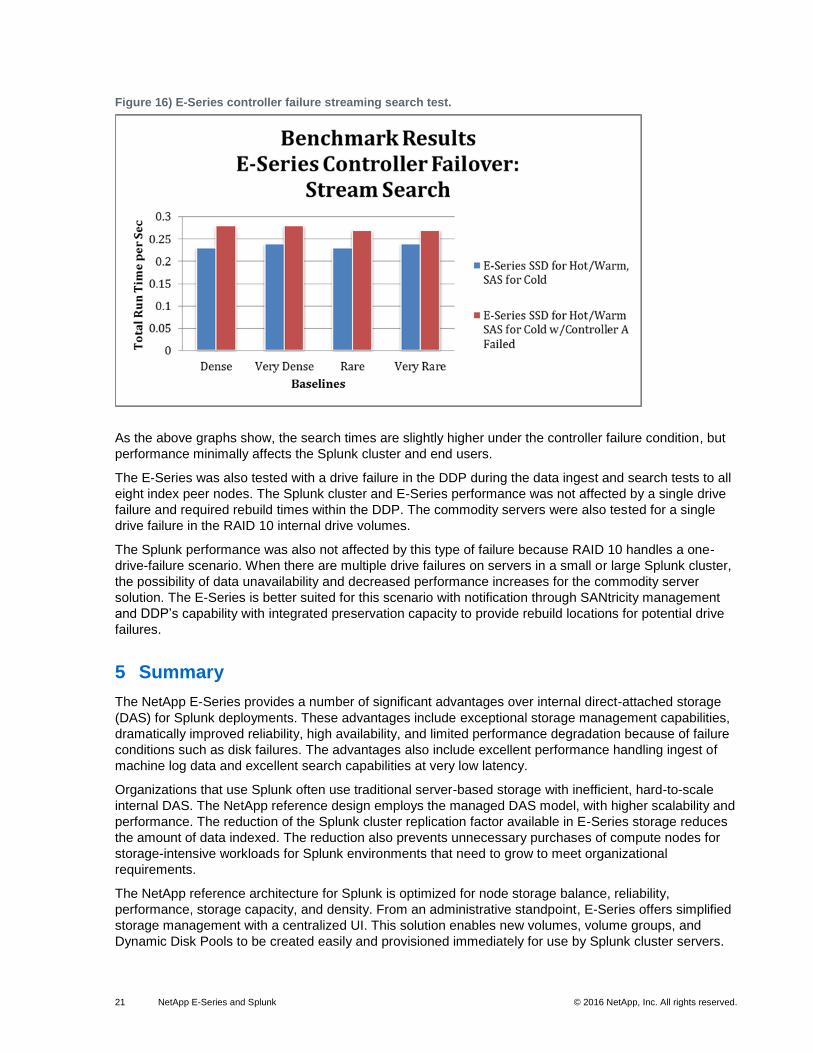
21 NetApp E-Series and Splunk © 2016 NetApp, Inc. All rights reserved.
Figure 16) E-Series controller failure streaming search test.
As the above graphs show, the search times are slightly higher under the controller failure condition, but
performance minimally affects the Splunk cluster and end users.
The E-Series was also tested with a drive failure in the DDP during the data ingest and search tests to all
eight index peer nodes. The Splunk cluster and E-Series performance was not affected by a single drive
failure and required rebuild times within the DDP. The commodity servers were also tested for a single
drive failure in the RAID 10 internal drive volumes.
The Splunk performance was also not affected by this type of failure because RAID 10 handles a one-
drive-failure scenario. When there are multiple drive failures on servers in a small or large Splunk cluster,
the possibility of data unavailability and decreased performance increases for the commodity server
solution. The E-Series is better suited for this scenario with notification through SANtricity management
and DDP’s capability with integrated preservation capacity to provide rebuild locations for potential drive
failures.
5 Summary
The NetApp E-Series provides a number of significant advantages over internal direct-attached storage
(DAS) for Splunk deployments. These advantages include exceptional storage management capabilities,
dramatically improved reliability, high availability, and limited performance degradation because of failure
conditions such as disk failures. The advantages also include excellent performance handling ingest of
machine log data and excellent search capabilities at very low latency.
Organizations that use Splunk often use traditional server-based storage with inefficient, hard-to-scale
internal DAS. The NetApp reference design employs the managed DAS model, with higher scalability and
performance. The reduction of the Splunk cluster replication factor available in E-Series storage reduces
the amount of data indexed. The reduction also prevents unnecessary purchases of compute nodes for
storage-intensive workloads for Splunk environments that need to grow to meet organizational
requirements.
The NetApp reference architecture for Splunk is optimized for node storage balance, reliability,
performance, storage capacity, and density. From an administrative standpoint, E-Series offers simplified
storage management with a centralized UI. This solution enables new volumes, volume groups, and
Dynamic Disk Pools to be created easily and provisioned immediately for use by Splunk cluster servers.
22 NetApp E-Series and Splunk © 2016 NetApp, Inc. All rights reserved.
In addition, existing volumes, volume groups, and Dynamic Disk Pools can all be increased in size
dynamically to provide additional capacity and/or performance as required for the Splunk cluster
environment.
6 Appendixes
SANtricity 11.25 Update Test
The test included the same infrastructure and lab equipment as was used with the SANtricity 11.20 test
effort while also enabling SSD read cache functionality. The test used 1TB of ingest data per day in an 8-
indexer cluster for both whitebox and E-Series storage, as in previous testing.
Test Environment
The test results below show the whitebox commodity server versus E-Series storage for Splunk clustered
indexer ingest rates per 1TB per day of syslog data. The results also show concurrent static and
streaming searches for data in the indexed database. Each test iteration is executed as a new ingested
index into the 8-node Splunk cluster. The search criteria is the same as in previous SANtricity 11.20
testing, with updated search parameters to search more buckets for each indexer. This change results in
improved concurrent searching tests of customer workloads.
Following are the number of rare and dense search terms per 10,000,000 lines per each indexer node.
Very Dense Search—1 out of 100 lines; 100,000 occurrences
Dense Search—1 out of 1,000 lines; 10,000 occurrences
Rare Search—1 out of 1,000,000 lines; 10 occurrences
Sparse Search—1 out of 10,000,000 lines; 1 occurrence
Cluster Replication and Searchable Copies Factor
The commodity server Splunk cluster deployment was configured with a replication factor of 3 and
searchable copies with a factor of 2. The E-Series Splunk cluster deployment was configured with a
replication factor of 2 and searchable copies with a factor of 1. The E-Series provides an additional level
of redundancy of indexed data located in the DDP volumes. This feature enables the replication factor of
2 to seamlessly provide fewer copies of indexed data in the Splunk cluster for performance benefits and
less overall data stored on disk.
An indexer configured with commodity server DAS will write 641 million events per indexer for one test
iteration. The E-Series with a reduced replication factor of 2 will write 551 million events per iteration per
indexer. The total event count for each E-Series cluster is ~4.4 billion events; the total event count for the
whitebox indexer is ~5.1 billion.
Update with SSD Read Cache
The SANtricity solid-state-drive (SSD) read cache feature uses SSD storage to hold frequently accessed
data from user volumes. The feature is intended to improve the performance of workloads that are
performance limited by hard disk drive (HDD) input/output operations per second (IOPS). Workloads with
the following characteristics can benefit from using the SANtricity SSD cache feature:
1. Read performance is limited by HDD IOPS.
2. There is a high percentage of read operations relative to write operations.
3. A large number of reads are repeat reads to the same or adjacent areas of disk.
4. The size of the data that is repeatedly accessed is smaller than the SSD read cache capacity.
For more information on the SSD read cache, see the NetApp SANtricity SSD Cache for E-Series guide.
23 NetApp E-Series and Splunk © 2016 NetApp, Inc. All rights reserved.
The latest testing uses an E5600 with 20 SAS HDD drives configured as a Dynamic Disk Pool (DDP) with
4 800GB SSD drives configured as SSD read cache. Each of the 8 Splunk indexers hot/warm bucket
volumes use SSD read cache and the 20 SAS drives. The E-Series DE5660 expansion tray with 60 4TB
NL-SAS drives configured as a DDP was used for the Splunk cold bucket.
Update Test Results
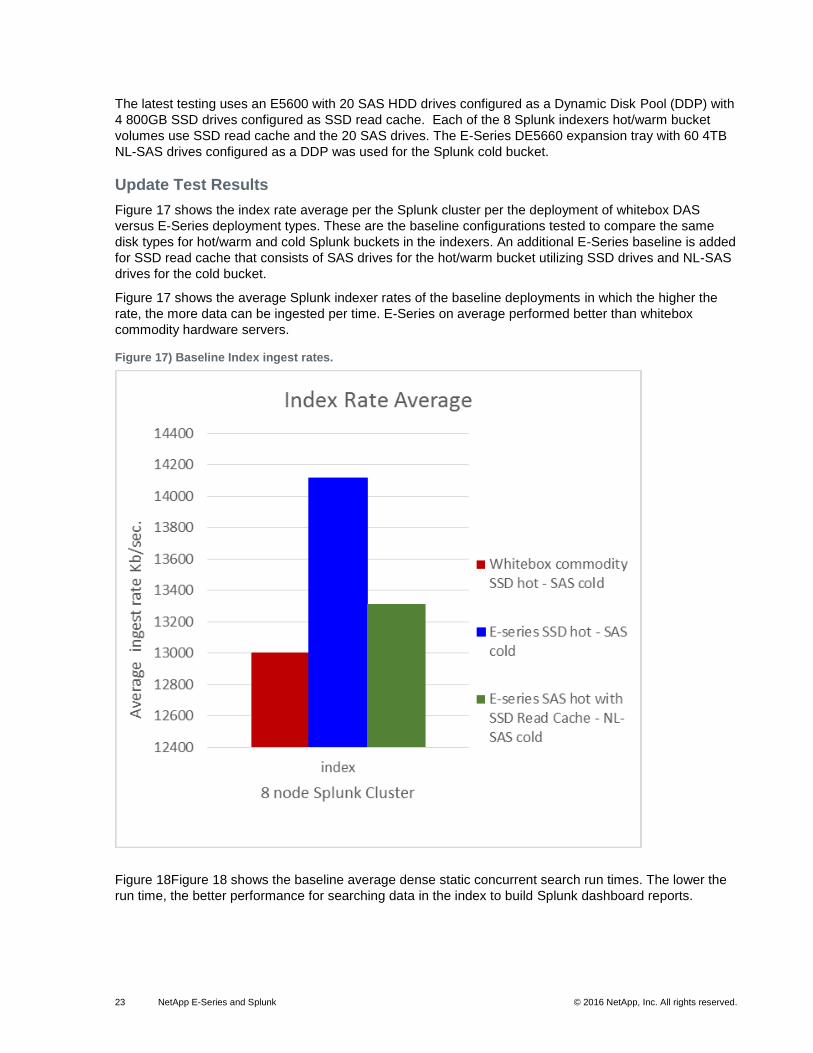
Figure 17 shows the index rate average per the Splunk cluster per the deployment of whitebox DAS
versus E-Series deployment types. These are the baseline configurations tested to compare the same
disk types for hot/warm and cold Splunk buckets in the indexers. An additional E-Series baseline is added
for SSD read cache that consists of SAS drives for the hot/warm bucket utilizing SSD drives and NL-SAS
drives for the cold bucket.
Figure 17 shows the average Splunk indexer rates of the baseline deployments in which the higher the
rate, the more data can be ingested per time. E-Series on average performed better than whitebox
commodity hardware servers.
Figure 17) Baseline Index ingest rates.
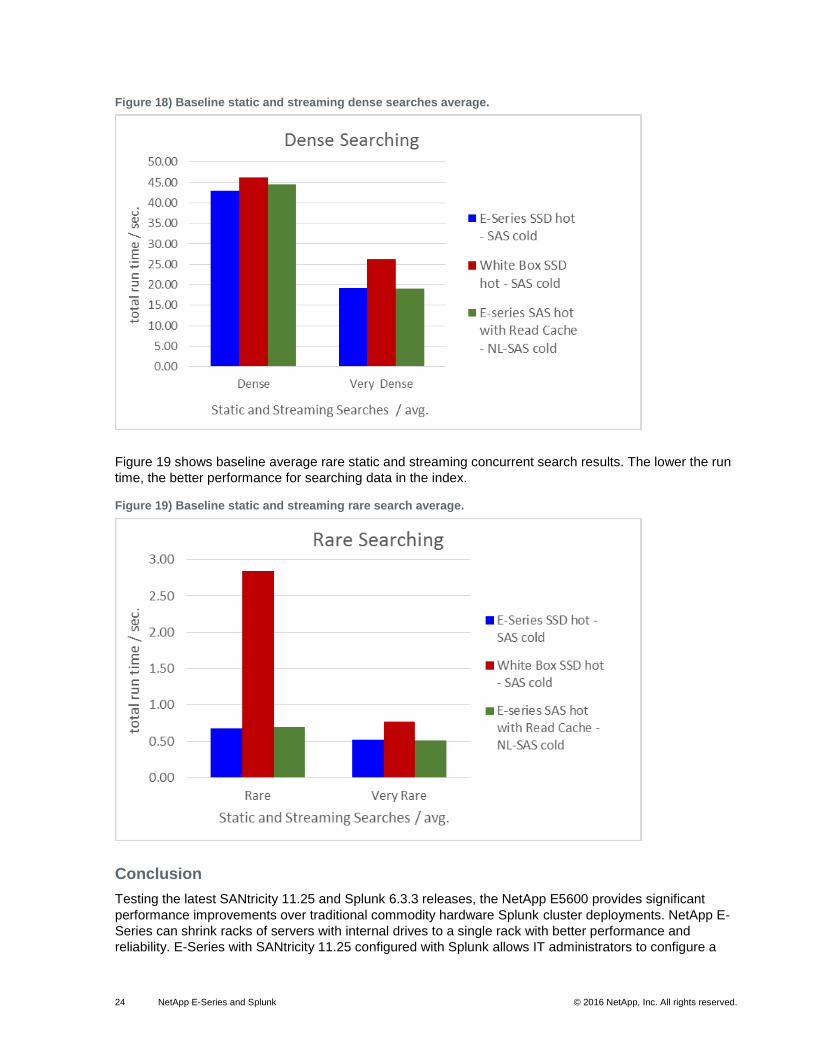
Figure 18Figure 18 shows the baseline average dense static concurrent search run times. The lower the
run time, the better performance for searching data in the index to build Splunk dashboard reports.
24 NetApp E-Series and Splunk © 2016 NetApp, Inc. All rights reserved.
Figure 18) Baseline static and streaming dense searches average.
Figure 19 shows baseline average rare static and streaming concurrent search results. The lower the run
time, the better performance for searching data in the index.
Figure 19) Baseline static and streaming rare search average.
Conclusion
Testing the latest SANtricity 11.25 and Splunk 6.3.3 releases, the NetApp E5600 provides significant
performance improvements over traditional commodity hardware Splunk cluster deployments. NetApp E-
Series can shrink racks of servers with internal drives to a single rack with better performance and
reliability. E-Series with SANtricity 11.25 configured with Splunk allows IT administrators to configure a

25 NetApp E-Series and Splunk © 2016 NetApp, Inc. All rights reserved.
hot, warm, and cold storage system capable of outperforming commodity servers with SSD drives. E-
Series scalability and density provide an efficient Splunk deployment for various ingest per day Splunk
requirements and search query rates that put the architecture at the top of the most demanding customer
requirements.
The SANtricity SSD read cache feature offers an additional option for a Splunk cluster deployment using
a mix of SSD and HDD drives for a balanced, cost-effective approach. The SSD read cache deployment
for the hot and warm Splunk data bucket delivers performance on par with the all-SSD E-Series E5600
solution.
Additional Configurations and Test Results
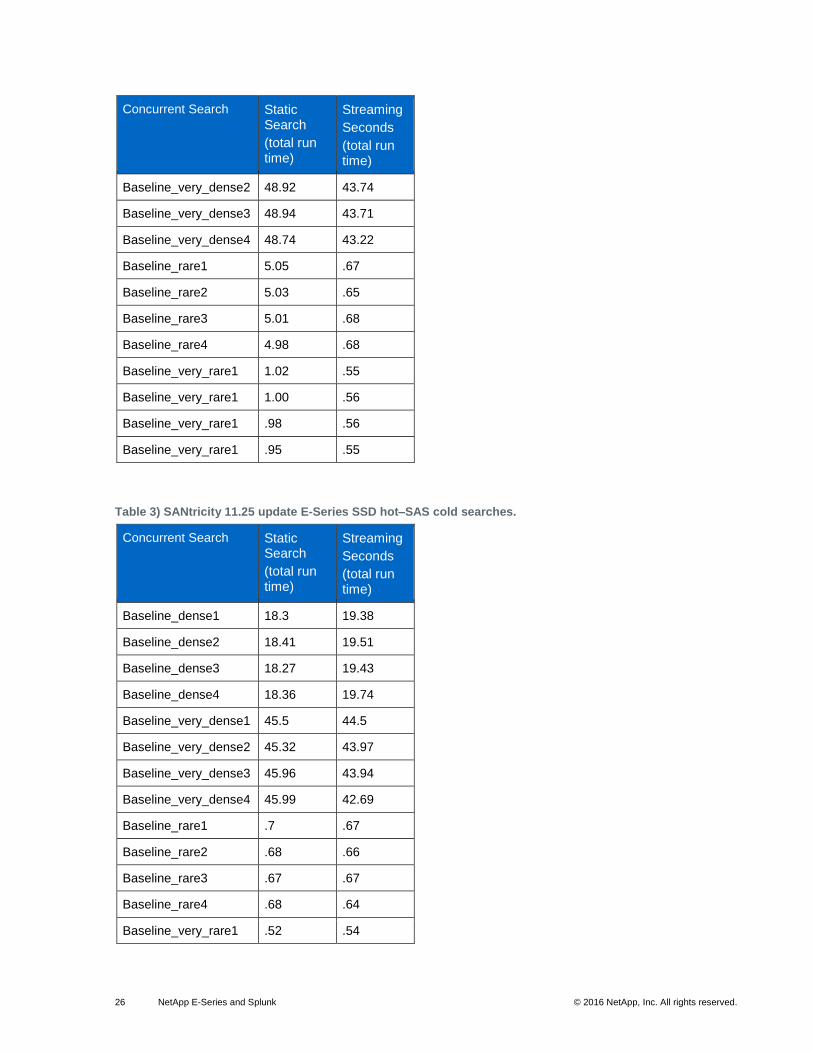
Figure 20 shows the E-Series average index rate for Splunk deployments. Table 2 through Table 6 show
concurrent search run times for the baseline and various E-Series Splunk deployments.
Figure 20) E-Series index rates.
Table 2) SANtricity 11.25 update whitebox SSD hot–SAS cold searches.
Concurrent Search Static Search
(total run time)
Streaming
Seconds
(total run time)
Baseline_dense1 32.81 19.23
Baseline_dense2 32.75 20.45
Baseline_dense3 32.65 20.36
Baseline_dense4 32.57 19.12
Baseline_very_dense1 49.98 42.74
26 NetApp E-Series and Splunk © 2016 NetApp, Inc. All rights reserved.
Concurrent Search Static Search
(total run time)
Streaming
Seconds
(total run time)
Baseline_very_dense2 48.92 43.74
Baseline_very_dense3 48.94 43.71
Baseline_very_dense4 48.74 43.22
Baseline_rare1 5.05 .67
Baseline_rare2 5.03 .65
Baseline_rare3 5.01 .68
Baseline_rare4 4.98 .68
Baseline_very_rare1 1.02 .55
Baseline_very_rare1 1.00 .56
Baseline_very_rare1 .98 .56
Baseline_very_rare1 .95 .55
Table 3) SANtricity 11.25 update E-Series SSD hot–SAS cold searches.
Concurrent Search Static Search
(total run time)
Streaming
Seconds
(total run time)
Baseline_dense1 18.3 19.38
Baseline_dense2 18.41 19.51
Baseline_dense3 18.27 19.43
Baseline_dense4 18.36 19.74
Baseline_very_dense1 45.5 44.5
Baseline_very_dense2 45.32 43.97
Baseline_very_dense3 45.96 43.94
Baseline_very_dense4 45.99 42.69
Baseline_rare1 .7 .67
Baseline_rare2 .68 .66
Baseline_rare3 .67 .67
Baseline_rare4 .68 .64
Baseline_very_rare1 .52 .54
27 NetApp E-Series and Splunk © 2016 NetApp, Inc. All rights reserved.
Concurrent Search Static Search
(total run time)
Streaming
Seconds
(total run time)
Baseline_very_rare1 .51 .51
Baseline_very_rare1 .51 .51
Baseline_very_rare1 .51 .52
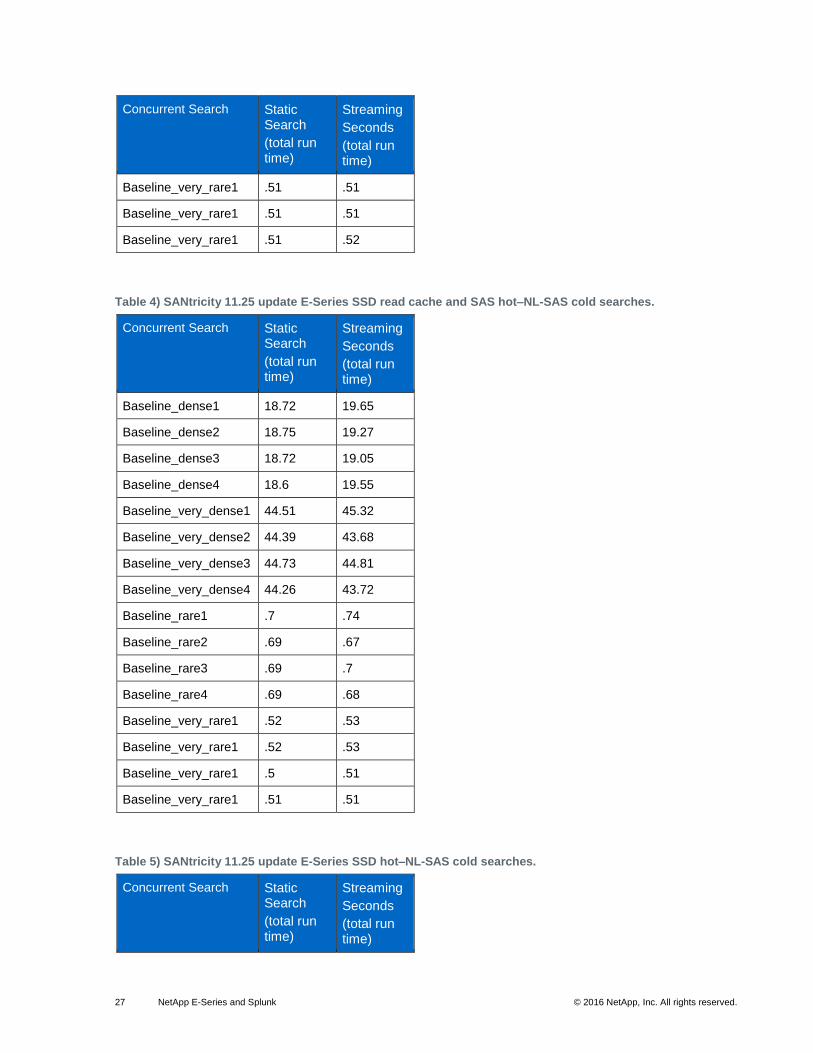
Table 4) SANtricity 11.25 update E-Series SSD read cache and SAS hot–NL-SAS cold searches.
Concurrent Search Static Search
(total run time)
Streaming
Seconds
(total run time)
Baseline_dense1 18.72 19.65
Baseline_dense2 18.75 19.27
Baseline_dense3 18.72 19.05
Baseline_dense4 18.6 19.55
Baseline_very_dense1 44.51 45.32
Baseline_very_dense2 44.39 43.68
Baseline_very_dense3 44.73 44.81
Baseline_very_dense4 44.26 43.72
Baseline_rare1 .7 .74
Baseline_rare2 .69 .67
Baseline_rare3 .69 .7
Baseline_rare4 .69 .68
Baseline_very_rare1 .52 .53
Baseline_very_rare1 .52 .53
Baseline_very_rare1 .5 .51
Baseline_very_rare1 .51 .51
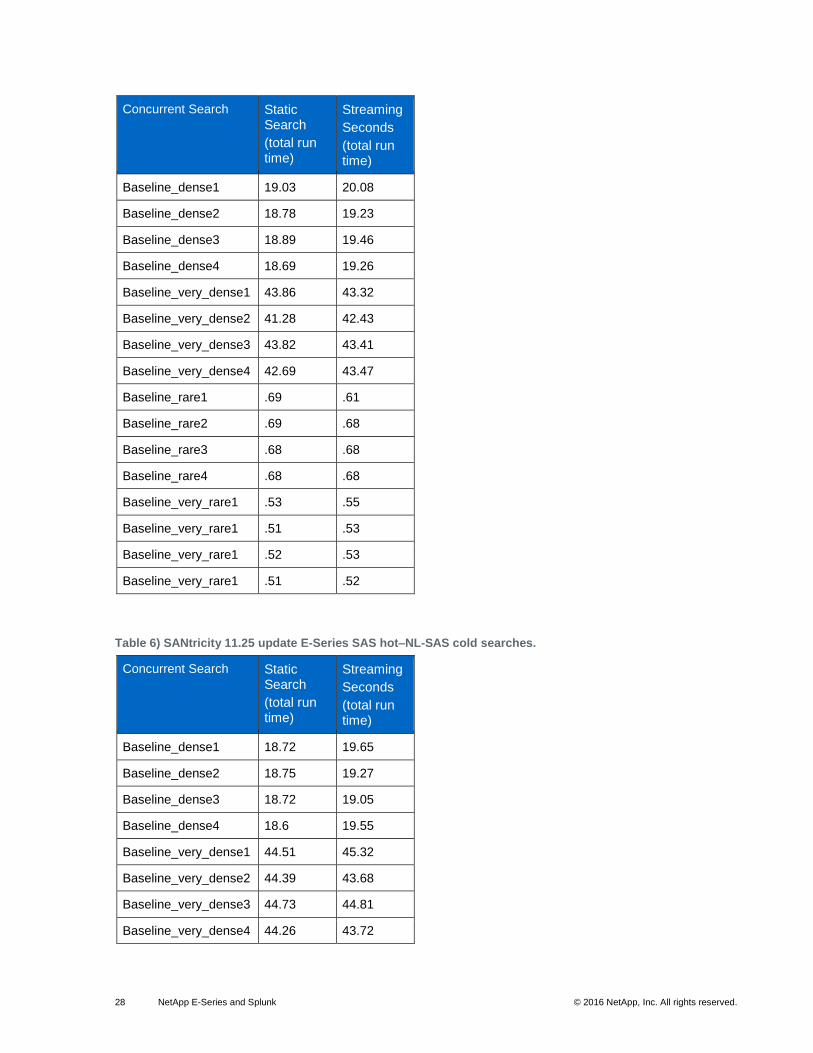
Table 5) SANtricity 11.25 update E-Series SSD hot–NL-SAS cold searches.
Concurrent Search Static Search
(total run time)
Streaming
Seconds
(total run time)
28 NetApp E-Series and Splunk © 2016 NetApp, Inc. All rights reserved.
Concurrent Search Static Search
(total run time)
Streaming
Seconds
(total run time)
Baseline_dense1 19.03 20.08
Baseline_dense2 18.78 19.23
Baseline_dense3 18.89 19.46
Baseline_dense4 18.69 19.26
Baseline_very_dense1 43.86 43.32
Baseline_very_dense2 41.28 42.43
Baseline_very_dense3 43.82 43.41
Baseline_very_dense4 42.69 43.47
Baseline_rare1 .69 .61
Baseline_rare2 .69 .68
Baseline_rare3 .68 .68
Baseline_rare4 .68 .68
Baseline_very_rare1 .53 .55
Baseline_very_rare1 .51 .53
Baseline_very_rare1 .52 .53
Baseline_very_rare1 .51 .52
Table 6) SANtricity 11.25 update E-Series SAS hot–NL-SAS cold searches.
Concurrent Search Static Search
(total run time)
Streaming
Seconds
(total run time)
Baseline_dense1 18.72 19.65
Baseline_dense2 18.75 19.27
Baseline_dense3 18.72 19.05
Baseline_dense4 18.6 19.55
Baseline_very_dense1 44.51 45.32
Baseline_very_dense2 44.39 43.68
Baseline_very_dense3 44.73 44.81
Baseline_very_dense4 44.26 43.72

29 NetApp E-Series and Splunk © 2016 NetApp, Inc. All rights reserved.
Concurrent Search Static Search
(total run time)
Streaming
Seconds
(total run time)
Baseline_rare1 .7 .74
Baseline_rare2 .69 .67
Baseline_rare3 .69 .7
Baseline_rare4 .69 .68
Baseline_very_rare1 .52 .53
Baseline_very_rare1 .52 .53
Baseline_very_rare1 .5 .51
Baseline_very_rare1 .51 .51
Splunk Apps for NetApp
The relationship between NetApp and Splunk includes developing apps for the range of NetApp products.
Current products supported with Splunk apps include SANtricity, with E-Series; NetApp StorageGrid®
technology; and the NetApp Data ONTAP® operating system (both clustered and 7-Mode).
These apps are available on the Splunk base portal: http://apps.splunk.com/.
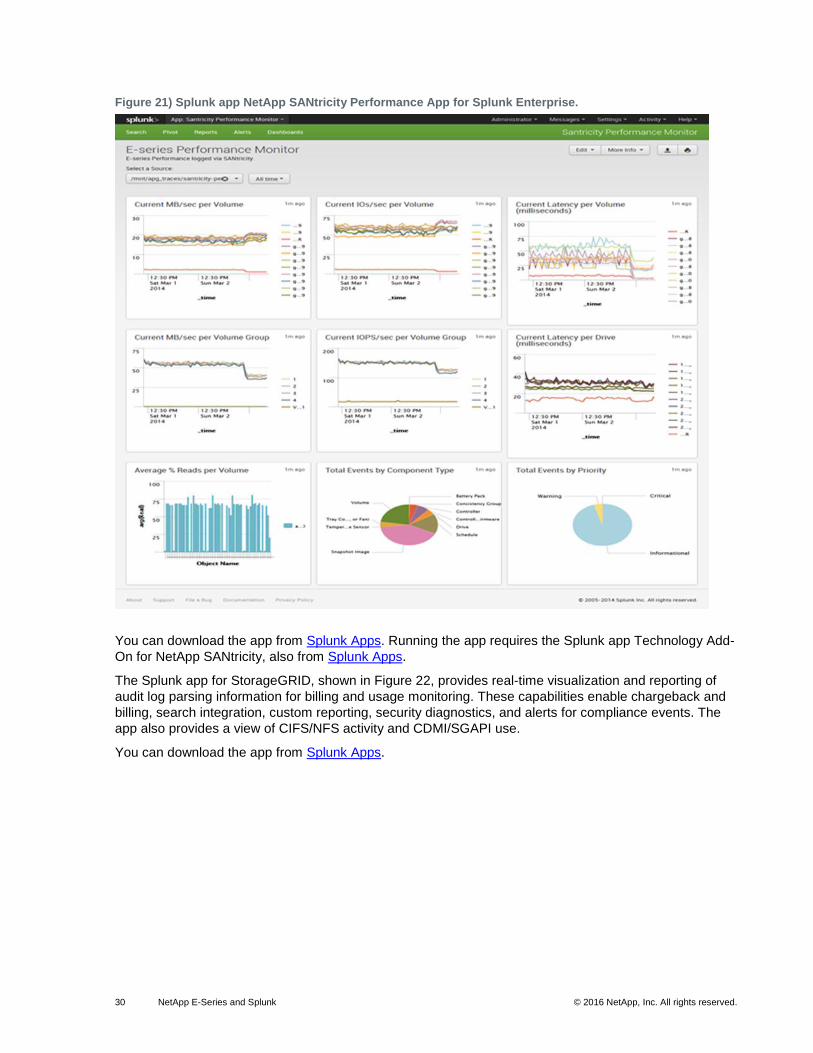
The NetApp SANtricity Performance App for Splunk Enterprise provides visibility into the health and
performance of NetApp E-Series and EF-Series storage systems. Figure 21 displays the configuration
information using a dashboard view for multiple E-Series storage systems. This view makes it easy to drill
down to specific configuration information for each array, such as IOPS, MBps, and latency, and
information about the controller, DDP, pools, volume groups, volume, and drives. The view also displays
Major Event Log information.
30 NetApp E-Series and Splunk © 2016 NetApp, Inc. All rights reserved.
Figure 21) Splunk app NetApp SANtricity Performance App for Splunk Enterprise.
You can download the app from Splunk Apps. Running the app requires the Splunk app Technology Add-
On for NetApp SANtricity, also from Splunk Apps.
The Splunk app for StorageGRID, shown in Figure 22, provides real-time visualization and reporting of
audit log parsing information for billing and usage monitoring. These capabilities enable chargeback and
billing, search integration, custom reporting, security diagnostics, and alerts for compliance events. The
app also provides a view of CIFS/NFS activity and CDMI/SGAPI use.
You can download the app from Splunk Apps.

31 NetApp E-Series and Splunk © 2016 NetApp, Inc. All rights reserved.
Figure 22) Splunk app for NetApp StorageGrid.
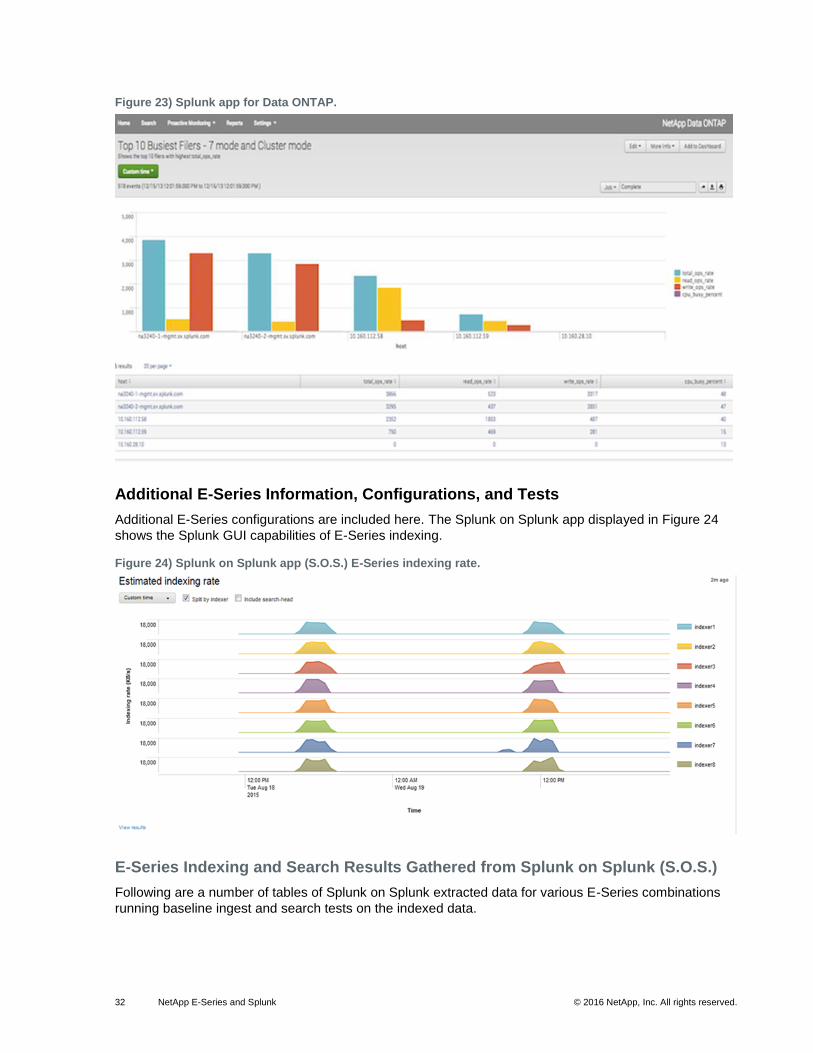
The Splunk app for Data ONTAP, shown in Figure 23, is a single solution that provides instant operational
visibility into the health of your Data ONTAP storage systems. The app enables you to quickly visualize
configuration, logs, and performance in both clustered Data ONTAP and Data ONTAP operating in 7-
Mode. You get quick drill-downs into specific subsystems, including storage system, aggregate, volume,
disk, and other events.
The Splunk app for Data ONTAP is compatible with Data ONTAP 8.x and above. You can download the
app from Splunk Apps.
32 NetApp E-Series and Splunk © 2016 NetApp, Inc. All rights reserved.
Figure 23) Splunk app for Data ONTAP.
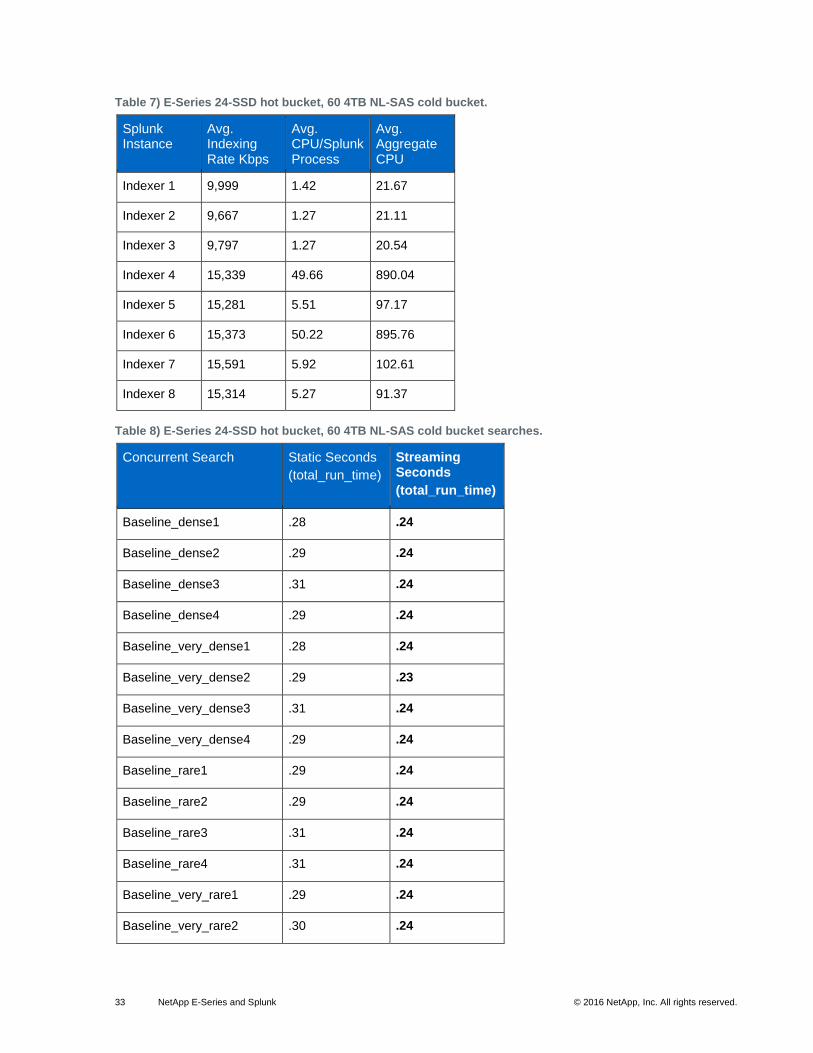
Additional E-Series Information, Configurations, and Tests
Additional E-Series configurations are included here. The Splunk on Splunk app displayed in Figure 24
shows the Splunk GUI capabilities of E-Series indexing.
Figure 24) Splunk on Splunk app (S.O.S.) E-Series indexing rate.
E-Series Indexing and Search Results Gathered from Splunk on Splunk (S.O.S.)
Following are a number of tables of Splunk on Splunk extracted data for various E-Series combinations
running baseline ingest and search tests on the indexed data.
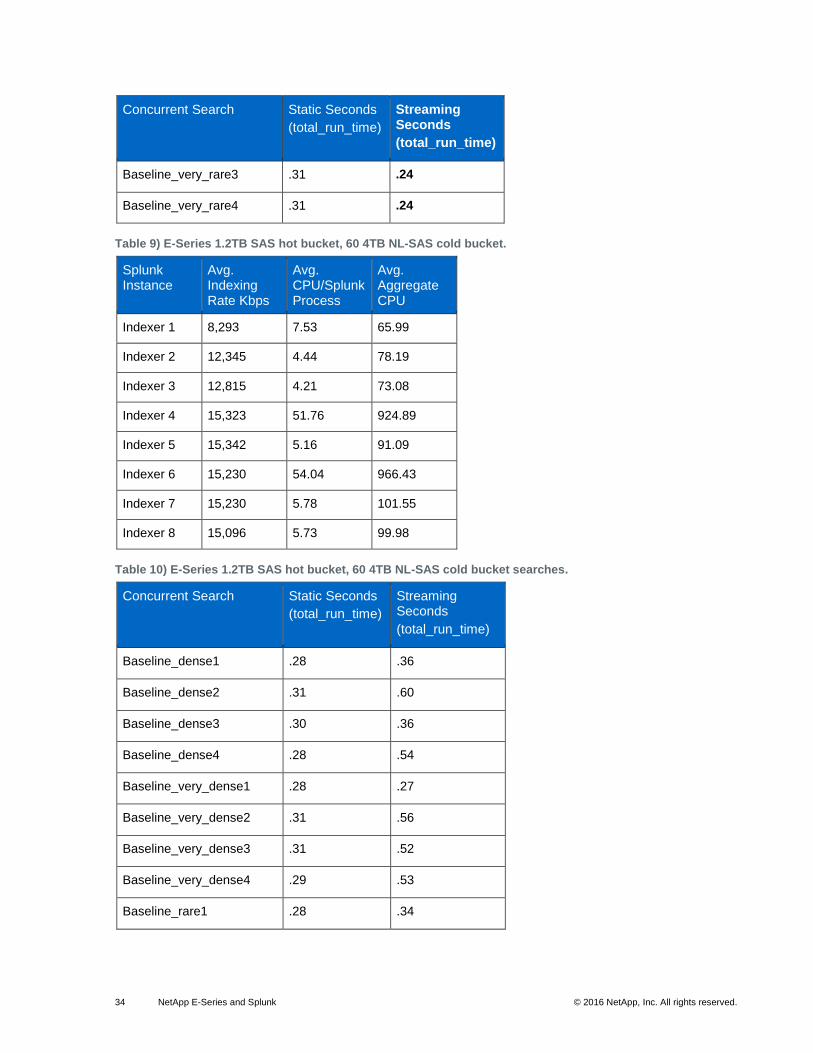
33 NetApp E-Series and Splunk © 2016 NetApp, Inc. All rights reserved.
Table 7) E-Series 24-SSD hot bucket, 60 4TB NL-SAS cold bucket.
Splunk Instance
Avg. Indexing Rate Kbps
Avg. CPU/Splunk Process
Avg. Aggregate CPU
Indexer 1 9,999 1.42 21.67
Indexer 2 9,667 1.27 21.11
Indexer 3 9,797 1.27 20.54
Indexer 4 15,339 49.66 890.04
Indexer 5 15,281 5.51 97.17
Indexer 6 15,373 50.22 895.76
Indexer 7 15,591 5.92 102.61
Indexer 8 15,314 5.27 91.37
Table 8) E-Series 24-SSD hot bucket, 60 4TB NL-SAS cold bucket searches.
Concurrent Search Static Seconds
(total_run_time)
Streaming Seconds
(total_run_time)
Baseline_dense1 .28 .24
Baseline_dense2 .29 .24
Baseline_dense3 .31 .24
Baseline_dense4 .29 .24
Baseline_very_dense1 .28 .24
Baseline_very_dense2 .29 .23
Baseline_very_dense3 .31 .24
Baseline_very_dense4 .29 .24
Baseline_rare1 .29 .24
Baseline_rare2 .29 .24
Baseline_rare3 .31 .24
Baseline_rare4 .31 .24
Baseline_very_rare1 .29 .24
Baseline_very_rare2 .30 .24
34 NetApp E-Series and Splunk © 2016 NetApp, Inc. All rights reserved.
Concurrent Search Static Seconds
(total_run_time)
Streaming Seconds
(total_run_time)
Baseline_very_rare3 .31 .24
Baseline_very_rare4 .31 .24
Table 9) E-Series 1.2TB SAS hot bucket, 60 4TB NL-SAS cold bucket.
Splunk Instance
Avg. Indexing Rate Kbps
Avg. CPU/Splunk Process
Avg. Aggregate CPU
Indexer 1 8,293 7.53 65.99
Indexer 2 12,345 4.44 78.19
Indexer 3 12,815 4.21 73.08
Indexer 4 15,323 51.76 924.89
Indexer 5 15,342 5.16 91.09
Indexer 6 15,230 54.04 966.43
Indexer 7 15,230 5.78 101.55
Indexer 8 15,096 5.73 99.98
Table 10) E-Series 1.2TB SAS hot bucket, 60 4TB NL-SAS cold bucket searches.
Concurrent Search Static Seconds
(total_run_time)
Streaming Seconds
(total_run_time)
Baseline_dense1 .28 .36
Baseline_dense2 .31 .60
Baseline_dense3 .30 .36
Baseline_dense4 .28 .54
Baseline_very_dense1 .28 .27
Baseline_very_dense2 .31 .56
Baseline_very_dense3 .31 .52
Baseline_very_dense4 .29 .53
Baseline_rare1 .28 .34
35 NetApp E-Series and Splunk © 2016 NetApp, Inc. All rights reserved.
Concurrent Search Static Seconds
(total_run_time)
Streaming Seconds
(total_run_time)
Baseline_rare2 .29 .60
Baseline_rare3 .31 .31
Baseline_rare4 .29 .38
Baseline_very_rare1 .28 .42
Baseline_very_rare2 .29 .38
Baseline_very_rare3 .30 .34
Baseline_very_rare4 .29 .37
Table 11) E-Series 24-SSD hot bucket, 24 1.2TB cold bucket.
Splunk Instance
Avg. Indexing Rate Kbps
Avg. CPU/Splunk Process
Avg. Aggregate CPU
Indexer 1 13,134 4.85 86.778
Indexer 2 12,984 4.63 82.88
Indexer 3 13,088 4.73 84.88
Indexer 4 15,477 51.51 925.31
Indexer 5 16,105 4.66 82.80
Indexer 6 15,260 50.01 898.57
Indexer 7 15,177 4.85 85.12
Indexer 8 14,097 5.30 94.92
Table 12) E-Series 24-SSD hot bucket, 24 1.2TB cold bucket searches.
Concurrent Search Static Seconds
(total_run_time)
Streaming Seconds
(total_run_time)
Baseline_dense1 .24 .29
Baseline_dense2 .24 .28
Baseline_dense3 .24 .28
Baseline_dense4 .23 .29
36 NetApp E-Series and Splunk © 2016 NetApp, Inc. All rights reserved.
Concurrent Search Static Seconds
(total_run_time)
Streaming Seconds
(total_run_time)
Baseline_very_dense1 .28 .28
Baseline_very_dense2 .29 .28
Baseline_very_dense3 .29 .28
Baseline_very_dense4 .28 .28
Baseline_rare1 .28 .28
Baseline_rare2 .29 .28
Baseline_rare3 .30 .27
Baseline_rare4 .29 .28
Baseline_very_rare1 .28 .28
Baseline_very_rare2 .29 .28
Baseline_very_rare3 .30 .27
Baseline_very_rare4 .30 .27
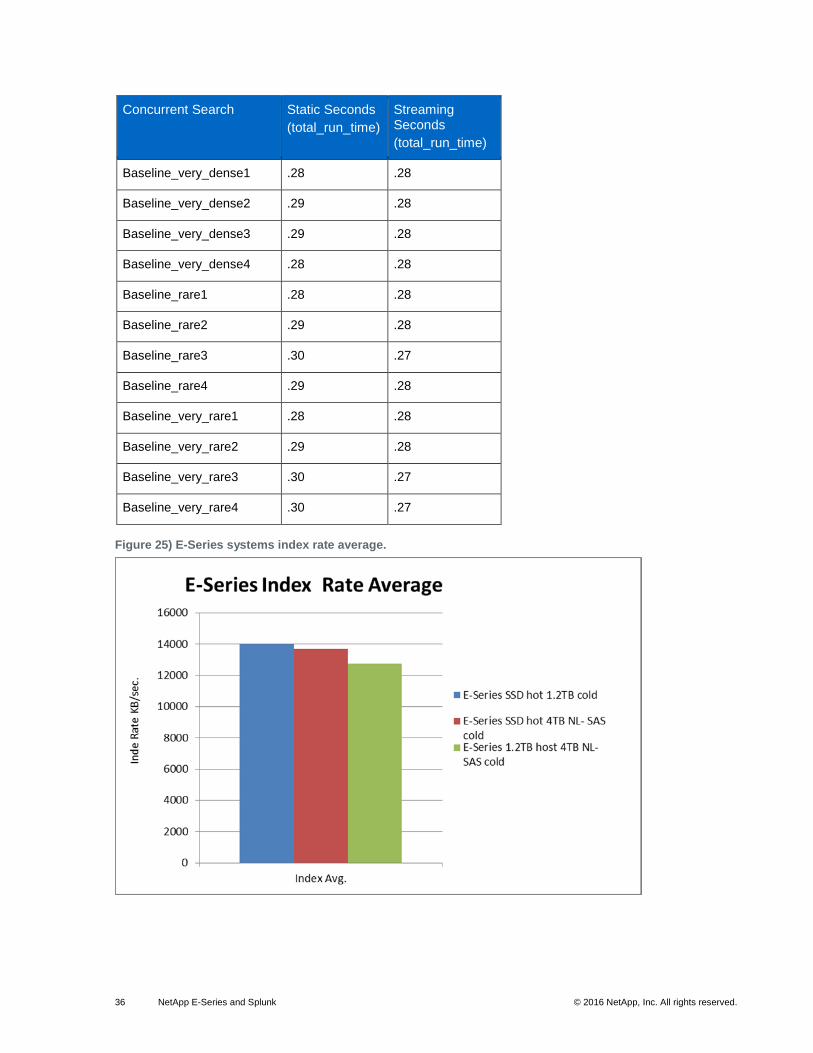
Figure 25) E-Series systems index rate average.
37 NetApp E-Series and Splunk © 2016 NetApp, Inc. All rights reserved.
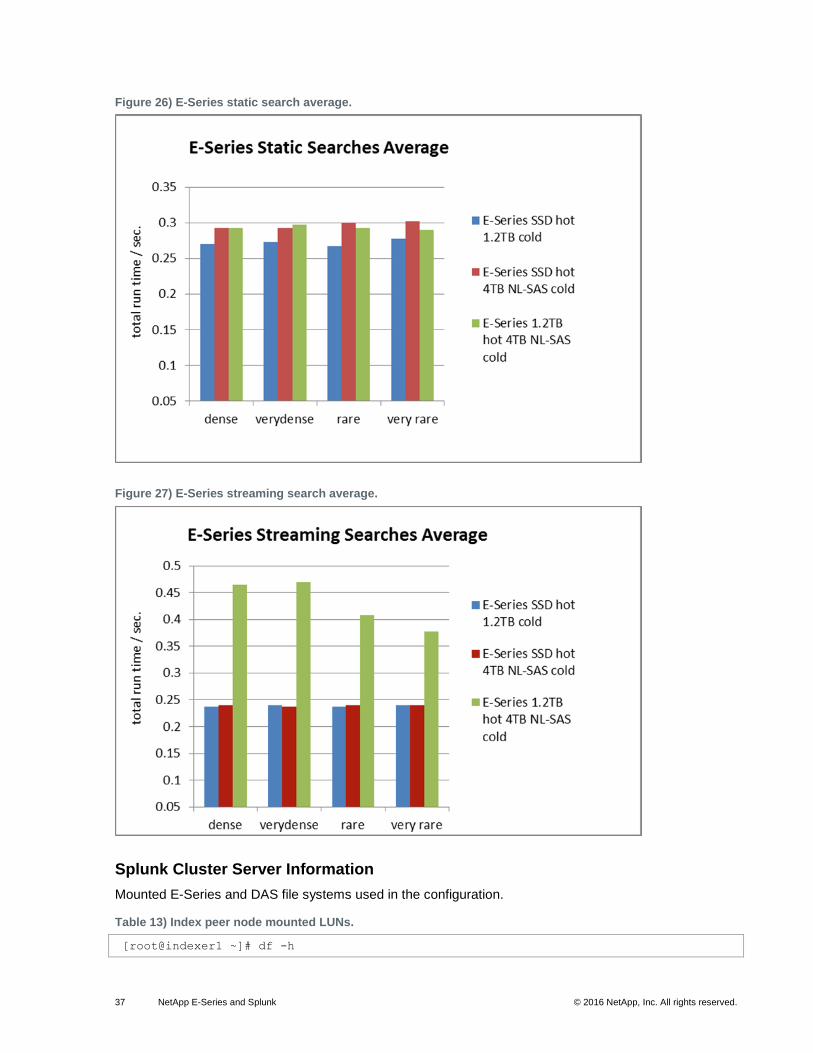
Figure 26) E-Series static search average.
Figure 27) E-Series streaming search average.
Splunk Cluster Server Information
Mounted E-Series and DAS file systems used in the configuration.
Table 13) Index peer node mounted LUNs.
[root@indexer1 ~]# df -h
38 NetApp E-Series and Splunk © 2016 NetApp, Inc. All rights reserved.
Filesystem Size Used Avail Use% Mounted on
/dev/mapper/rootvg-root
546G 50G 469G 10% /
tmpfs 63G 156K 63G 1% /dev/shm
/dev/sda1 190M 36M 144M 20% /boot
/dev/sdb 1.5T 154G 1.3T 12% /opt/splunk/var/lib/splunk/whiteboxHot
/dev/sdd 6.5T 123G 6.0T 2% /opt/splunk/var/lib/splunk/whiteboxCold
/dev/mapper/mpathe 1.5T 147G 1.3T 11% /opt/splunk/var/lib/splunk/eseriesHot
/dev/mapper/mpathi 2.3T 72M 2.2T 1% /opt/splunk/var/lib/splunk/eseriesCold
/dev/mapper/mpathm 12T 25M 12T 1% /opt/splunk/var/lib/splunk/eseriesWSAS
Table 14) Index peer Linux multipath configuration.
[root@indexer1 ~]# multipath -ll
Sep 10 14:17:55 | ignoring extra data starting with 'FreeAgent' on line 8 of config
file
mpathe (360080e5000432088000005f755525093) dm-2 NETAPP,INF-01-00
size=1.5T features='3 queue_if_no_path pg_init_retries 50' hwhandler='1 rdac' wp=rw
|-+- policy='service-time 0' prio=14 status=active
| |- 1:0:0:0 sde 8:64 active ready running
| `- 2:0:1:0 sdq 65:0 active ready running
`-+- policy='service-time 0' prio=9 status=enabled
|- 2:0:0:0 sdm 8:192 active ready running
`- 1:0:1:0 sdi 8:128 active ready running
mpathm (360080e500043208800000e1e55c46d9c) dm-4 NETAPP,INF-01-00
size=12T features='3 queue_if_no_path pg_init_retries 50' hwhandler='1 rdac' wp=rw
|-+- policy='service-time 0' prio=14 status=active
| |- 1:0:0:2 sdg 8:96 active ready running
| `- 2:0:1:2 sds 65:32 active ready running
`-+- policy='service-time 0' prio=9 status=enabled
|- 1:0:1:2 sdk 8:160 active ready running
`- 2:0:0:2 sdo 8:224 active ready running
mpathi (360080e50004320880000073f55648fef) dm-3 NETAPP,INF-01-00
size=2.3T features='3 queue_if_no_path pg_init_retries 50' hwhandler='1 rdac' wp=rw
|-+- policy='service-time 0' prio=14 status=active
| |- 1:0:0:1 sdf 8:80 active ready running
| `- 2:0:1:1 sdr 65:16 active ready running
`-+- policy='service-time 0' prio=9 status=enabled
|- 1:0:1:1 sdj 8:144 active ready running
`- 2:0:0:1 sdn 8:208 active ready running
References
NetApp Documentation
NetApp Architecture for Splunk
http://www.netapp.com/us/media/TR-4260_NetApp_Architecture_for_Splunk.pdf
NetApp E5600 Product Information
www.netapp.com/us/products/storage-systems/e5600/index.aspx
SANtricity 11.25 release
SANtricity Release 11.25
NetApp SANtricity SSD Cache for E-Series
TR-4099
Splunk Documentation
Splunk>docs
39 NetApp E-Series and Splunk © 2016 NetApp, Inc. All rights reserved.
http://docs.splunk.com/Documentation
Installation Manual
http://docs.splunk.com/Documentation/Splunk/latest/Installation/Whatsinthismanual
Hardware Capacity Planning
http://docs.splunk.com/Documentation/Splunk/latest/Installation/CapacityplanningforalargerSplunkdeployment
Managing Index Sizes in Splunk—Blog
http://blogs.splunk.com/2011/01/03/managing-index-sizes-in-splunk/
Splunk Apps
http://apps.splunk.com/
Splunk Answers
http://answers.splunk.com/
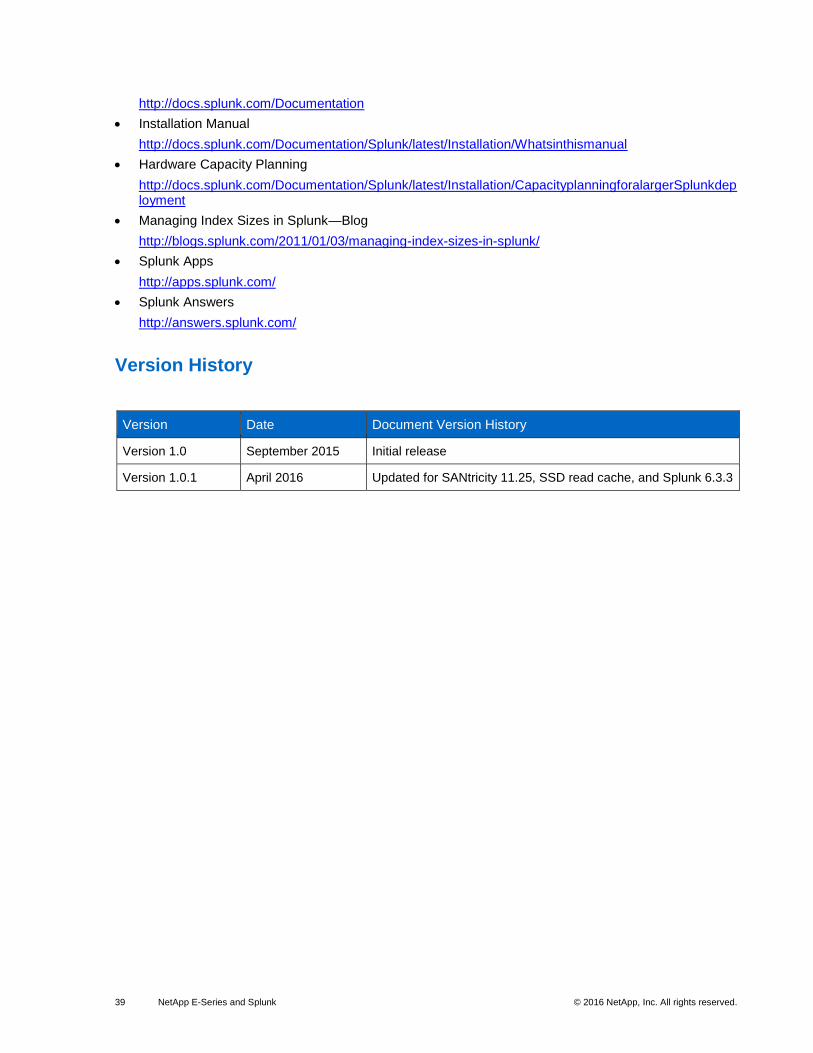
Version History
Version Date Document Version History
Version 1.0 September 2015 Initial release
Version 1.0.1 April 2016 Updated for SANtricity 11.25, SSD read cache, and Splunk 6.3.3

40 NetApp E-Series and Splunk © 2016 NetApp, Inc. All rights reserved.
Refer to the Interoperability Matrix Tool (IMT) on the NetApp Support site to validate that the exact product and feature versions described in this document are supported for your specific environment. The NetApp IMT defines the product components and versions that can be used to construct configurations that are supported by NetApp. Specific results depend on each customer's installation in accordance with published specifications.
Trademark Information
NetApp, the NetApp logo, Go Further, Faster, AltaVault, ASUP, AutoSupport, Campaign Express, Cloud
ONTAP, Clustered Data ONTAP, Customer Fitness, Data ONTAP, DataMotion, Fitness, Flash Accel,
Flash Cache, Flash Pool, FlashRay, FlexArray, FlexCache, FlexClone, FlexPod, FlexScale, FlexShare,
FlexVol, FPolicy, GetSuccessful, LockVault, Manage ONTAP, Mars, MetroCluster, MultiStore, NetApp
Insight, OnCommand, ONTAP, ONTAPI, RAID DP, RAID-TEC, SANtricity, SecureShare, Simplicity,
Simulate ONTAP, SnapCenter, Snap Creator, SnapCopy, SnapDrive, SnapIntegrator, SnapLock,
SnapManager, SnapMirror, SnapMover, SnapProtect, SnapRestore, Snapshot, SnapValidator,
SnapVault, StorageGRID, Tech OnTap, Unbound Cloud, WAFL, and other names are trademarks or
registered trademarks of NetApp Inc., in the United States and/or other countries. All other brands or
products are trademarks or registered trademarks of their respective holders and should be treated as
such. A current list of NetApp trademarks is available on the web at
http://www.netapp.com/us/legal/netapptmlist.aspx. TR-4460-0416
Copyright Information
Copyright © 1994–2016 NetApp, Inc. All rights reserved. Printed in the U.S. No part of this document covered by copyright may be reproduced in any form or by any means—graphic, electronic, or mechanical, including photocopying, recording, taping, or storage in an electronic retrieval system—without prior written permission of the copyright owner.
Software derived from copyrighted NetApp material is subject to the following license and disclaimer:
THIS SOFTWARE IS PROVIDED BY NETAPP "AS IS" AND WITHOUT ANY EXPRESS OR IMPLIED WARRANTIES, INCLUDING, BUT NOT LIMITED TO, THE IMPLIED WARRANTIES OF MERCHANTABILITY AND FITNESS FOR A PARTICULAR PURPOSE, WHICH ARE HEREBY DISCLAIMED. IN NO EVENT SHALL NETAPP BE LIABLE FOR ANY DIRECT, INDIRECT, INCIDENTAL, SPECIAL, EXEMPLARY, OR CONSEQUENTIAL DAMAGES (INCLUDING, BUT NOT LIMITED TO, PROCUREMENT OF SUBSTITUTE GOODS OR SERVICES; LOSS OF USE, DATA, OR PROFITS; OR BUSINESS INTERRUPTION) HOWEVER CAUSED AND ON ANY THEORY OF LIABILITY, WHETHER IN CONTRACT, STRICT LIABILITY, OR TORT (INCLUDING NEGLIGENCE OR OTHERWISE) ARISING IN ANY WAY OUT OF THE USE OF THIS SOFTWARE, EVEN IF ADVISED OF THE POSSIBILITY OF SUCH DAMAGE.
NetApp reserves the right to change any products described herein at any time, and without notice. NetApp assumes no responsibility or liability arising from the use of products described herein, except as expressly agreed to in writing by NetApp. The use or purchase of this product does not convey a license under any patent rights, trademark rights, or any other intellectual property rights of NetApp.
The product described in this manual may be protected by one or more U.S. patents, foreign patents, or pending applications.
RESTRICTED RIGHTS LEGEND: Use, duplication, or disclosure by the government is subject to restrictions as set forth in subparagraph (c)(1)(ii) of the Rights in Technical Data and Computer Software clause at DFARS 252.277-7103 (October 1988) and FAR 52-227-19 (June 1987).