technical report on design and execution of desalination plants · pdf file ·...
TRANSCRIPT

Technical Report on Design and Execution of Desalination Plants
in Minicoy and Agatti, UT Lakshadweep
Sea water desalination is attaining increasing attention of present day policy makers,
especially with the growing demands that urbanization, population explosion, irregular
rainfall and ground water contamination on the fragile natural resources. ‘Low Temperature
Thermal Desalination’ (LTTD) is one process that uses the availability of a temperature
gradient between two water bodies, such as the Ocean Thermal Gradient that describes
temperature variation across the depth of the oceans, to obtain fresh water. The available
thermal gradient between warmer surface water and colder deep seawater is utilized by flash
evaporating the warm water at low temperatures and condensing the resultant vapour with
cold water.
Earth System Science Organization, Ministry of Earth Sciences, Government of India,
Through National Institute of Ocean Technology (ESSO-NIOT), India, has successfully
demonstrated the 100 m3/day capacity land based desalination plant in the remote islands of
Agatti and Minicoy of UT Lakshadweep in 2011 following the initial success of similar
capacity plant at Kavaratti island.
Fig. 1 Schematic Diagram of LTTD working principle (left) and the Ocean Thermal Gradient
in coastal waters (NIO, Goa, 2000)
The bathymetry around the islands allows availability of 350-380m water depth within 400-
1000m from the shore, for drawing water at 10-12oC. The temperature gradient of 16
oC
between the deep sea cold water at 12oC and the warm surface sea water at about 28
oC is
utilized in the LTTD process as shown Fig. 1. The plant consisted of the design and
integration of three distinct components, namely, Process Equipment; Cold Water Pipeline;
and, Marine Structures.
Process Equipment
The main components that are required for LTTD plant are the flash chamber, the condenser,
pumps and pipelines to draw warm and cold water, a vacuum pump to maintain the plant at
sub-atmospheric pressures and a control system as shown in Fig. 2. A flash chamber of 2.8m
diameter and about 5.2m height made of SS 304L with vertical spouts and S-type demister
pads are used for the flash evaporation. A 1.2m section of the flash chamber is used as a
deaerator to separate part of the non-condensable gases and leakage air before entering the
flashing area. A shell and tube condenser, made of SS 304L shell of 1.2m diameter and 1120
-450
-400
-350
-300
-250
-200
-150
-100
-50
0
0 10 20 30 40
Temperature (oC)
Dep
th (
m)

2
(Cu Ni 90/10) tubes of 0.019m outer diameter is used for the condensing the resultant vapour.
The condenser was designed in HTRI with a TEMA BHM configuration. Major part of the
plant piping was completed with HDPE. The vacuum system is to facilitate the evaporation in
the flash chamber and liquefaction in the condenser by maintaining them at sub-atmospheric
pressure.
Fig. 2 Major plant components
The sea water pumps were selected based on the minimum power consumption by optimal
choice of operation. The flash chamber was placed above 10m from the sea level to optimize
the pumping losses for the warm water to the flash chamber. Siphon was employed to
minimize the head requirement for the cold water pump. Detailed parametric analysis was
performed to arrive at the operating point of the plant, with sufficient margin for the pumps to
cater to the varying water levels due to the tides. Simulations on flow features inside the
Flash chamber and structural analysis of the flash chamber is shown in Fig. 3.
Fig. 3 A schematic of the vapour and liquid flow within the flash chamber (left) obtained
from OpenFoam analysis (left) and Stress analysis of the Flash chamber in ANSYS
Flash Chamber
Shell and tube Condenser
Control Panel
Vacuum pumps
Fresh water
pumps Sea water pumps

3
The power requirement of the process was reduced to 9 kWhr / m3. The factors that
contributed include optimal selection of design point for operation, designing of the
equipment, selection and placement of the equipment.
The distance of the demister pads from the spout pipes in the flash chamber was
found to be one of the controlling parameters for maintaining the desired production
quality. A TDS of below 50 ppm was achieved at Agatti with the modifications.
Operational experience from the plants suggested that with the modifications in the
inlet piping for Agatti, it may be possible to increase the production capacity of the
plant with the same equipment. Similarly, with an optimal design of the discharge
system, the production capacity at Minicoy could also be improved.
Table 1 Quality of Water Produced at Agatti and Minicoy Plants
Sl
No Parameter Units
Desirable Limit
/ (Permissible Limit)
(as per IS 10500:1991)
Agatti Plant
Water Quality
Minicoy Plant
Water Quality
1 Colour - Un objectionable OK OK
2 Odour - Un objectionable OK OK
3 Turbidity NTU 5 (10) Not Detected Not Detected
4 pH - 6.5-8.5 8.03 8.2
5 Total Dissolved
Solids ppm 500 (2000) 30 88
6 Total Coliform MPN Nil Nil Nil
7 Faecal Coliform MPN Nil Nil Nil
The quality of water produced at Agatti and Minicoy plants as shown in Table 1, indicates
that the Total Dissolved Solids of the product water could be maintained well below the
desirable limits of 500 ppm.
Submarine Pipeline
The Submarine Pipeline draws the coolant water at about 12oC from 350-400m depth, it
comprises rigid steel pipe in the shallow water region and High Density Poly Ethylene
(HDPE) pipe in inverse catenary configuration as shown in Fig. 4. Inverse catenary pattern
had the advantage of the natural buoyancy of the pipe to traverse very rugged and often very
steep bottom terrain with no physical contact. This configuration was found to be more
suitable for Lakshadweep coral Islands. Detailed route surveys of the sea bed were not
necessary to implement the technique, except at the two ends of the catenary. The catenary
mostly detached from the seafloor it was not susceptible to earthquake damage. The
configuration is not suitable for shallow water applications or those with gentle slope where
its topmost point approached the ocean surface. A catenary design had been successfully
employed by MoES-NIOT in the island based LTTD plant at Kavaratti (Kathiroli, 2008).
Plastic pipe, available in large diameters, had advantages over steel pipe such as corrosion
resistance for seawater and better insulation and hence High Density Polyethylene (HDPE)
pipe was employed in the Islands. For desalination plant in Agatti, HDPE combined with
steel pipe was employed.

4
Fig. 4 A View of Deployed Configuration of HDPE pipe
The selection of site for LTTD plant is governed by the proximity from the coast to the 400m
depth contour that contains about 10-12oC water, local bathymetry and wave climate at the
site for the sump, and the bathymetry from the sump location to the shore. Typical
bathymetry profiles for different Islands are shown in the Fig. 5 indicate that the distance
from shore to the required depth of 400m was site specific.
Fig. 5 Bathymetry profile for different Islands
Analysis and design of cold water pipe
Numerical simulation was carried out for operational / extreme loads using OrcaFlex to arrive
at suitable mooring configuration. The pipe was analysed as a line element subjected to
environmental loads. The environmental conditions required for the analysis were obtained
from the long term averages of local measurements. The analysis was carried out in two
stages that estimate tensile forces, bending moments, shear forces, torsion moments and
finally total load acting on the CWP and its resultant profile configuration. The analysis was
carried out for different wave and current combinations. It was evident from the results that
the configuration was stable even at extreme environmental conditions.
0
100
200
300
400
500
0 500 1000 1500
Dep
th (
m)
Distance from Shore (m)
Agatti Minicoy

5
Deployment of cold water pipe
The geometrical and flow characteristics of the pipe are given in Table 2 . Agatti island had a
complex sea bed topography, with the sump location about 220m from shore, 30m contour
about 170m from sump. The length of the cold water pipe in Agatti Island was 970m of
which 220m was in shallow water and 750m in deep water (inverse catenary portion).
Fig. 6 Assembly and deployment of Cold water pipe
Table 2 Geometrical and flow characteristics of Cold Water Pipe
Length 970m
Steel pipe L=120m,ODΦ570m, t=10mm
HDPE pipe L=750m PE100, PN6, ODΦ630m, SDR21
Flow rate 150 kg/s
Flow Velocity 0.6 m/s
A flexible hose was attached in the intermediate region between the CWP and the sump. The
front and rear end of the HDPE pipe were attached with friction grip components that transfer
the loads from the HDPE pipe. Various dead weights, anchors, supports, chains and flexible
elements such as flexible hoses, shock cells, clamps were used Chains and redundancy ropes
were used at various points of the pipeline to secure it and thus reduce the risk of loss under
different scenarios. HDPE pipes were welded in 12m sections to form continuous pipe of
required length and the components required as per the design were attached on the lagoon
side. After pulling the pipe into lagoon water, the required buoyancy pontoons were attached
HDPE
Welding Full length pipe
Steel clamps attached Mooring components
Load out of HDPE pipe Towing of HDPE pipe to
deployment site
Attaching
clumps Under water connection Concrete block
To sump To deep sea

6
and pipe was towed from lagoon to the site using tug/barge. The front end was first connected
and secured to shore and the rear end was then lowered after attaching the mooring weights
as shown in Fig. 6.
Shallow Water Region
If HDPE pipe were used in shallow water, it needs to be buried in soil or weighed with
concrete blocks. Since, it was not possible to bury the pipeline in coral bed without much
damage to environment, the pipe needs to be weighed with concrete blocks. The pipeline can
be stable only if the forces acting in place were greater than the forces that would tend to
move the pipe. The shallow water pipeline that extended from 5m to 30m depth was a
combination of steel pipe for 120m from the sump and HDPE pipe for the remaining length.
Steel pipes were subjected to corrosion and posed problems to maintain cold water
temperature. Hence protective coatings were required for steel pipes. Concrete blocks may
not be required in case of steel pipe because of its self-weight that may provide resistance to
wave and current loads. Since HDPE was buoyant, it will not give enough resistance to the
wave and current loads, it was necessary to weigh it down to provide stability. In order to
ensure stability of pipeline in shallow water, an analysis was carried out using static
equilibrium between loads due to possible environmental conditions (waves and currents) and
resistance offered by the concrete blocks.
Deep Water Region
After the pipe at Agatti was deployed during pre-monsoon, the catenary pipe section in the
deep water region was exposed to surface due to reversal of coastal currents as shown in Fig.
7. The analysis was revised with ground conditions and additional weights were added to
ensure the pipeline 50m below the water surface.
Fig. 7 Pipe surfacing
Numerical simulations were carried out with 7x200kg clamps for varied spacing and the
depth of submergence of pipeline was estimated based on the final converged position. An
optimal 65m depth of submergence was finally selected for implementation at site. The
pipeline was inspected two seasons through under water diving and the inspection results
indicated that the motions of the pipe were minimal and that the pipe configurations remained
continuously below the sea-surface. The final configuration in submerged is shown in Fig. 8.

7
Fig. 8 Final configuration of CWP
Marine Structures
All the marine structures required for the plant were designed and executed with minimal
infrastructure, and implemented in an environmentally protected area. A sump, as shown in
Fig. 9, with a completed weight of 5000 kN was erected in 5m water depth to house the
pumps; with dimensions of 8mx12mx8m. A 3m wide bridge connected the sump in 5m water
depth with the shore. A plant building that extends up to 19m above the chart datum, was
constructed in the intertidal zone, as shown in Fig. 10.
Fig. 9 Views of Sump during its Tow (left) and the towing route of Sump (right)

8
Fig. 10 Views of Agatti Plant showing the Plant Building, Bridge and the Sump
The selection of site, design and execution of marine structure for desalination plant is critical
for the timely completion of the project. The marine structure consists of the major
components, viz,
Sump / intake structure to cold and warm water
Approach trestle from sump to plant building/land to carry cold/warm water pipe
Plant structure to support process equipment.
The general layout of marine structures based on hydrodynamic survey at Agatti and Minicoy
Islands is shown in Figures 11 to 14. The configuration of the island indicated its North East
section to be ideal for location of the plant considering the following requirements:
Proximity of the 5m depth contour from the shore to place the intake structure; and,
Proximity of the 400m depth contour from the shore / intake structure for deploying
the cold water pipeline to draw cold water (10° to 12° C).
Lakshadweep islands experience typical climate with temperature 35oC in April/May with a
humidity of 70 to 75%. The average wind speed is around 5-6m/s with maximum of 39m/s
during monsoon. The eastern side of island experiences high waves of 5m height during Pre-
monsoon as well as monsoon and the underwater current could be around 0.5m/s.
Fig. 11 Layout of marine structure: Agatti
Fig. 12 Layout of marine structures Minicoy

9
JIB CRANE
(-)4.0m CD
SUMP
PLANT BUILDING
BRIDGE+9.05m CDCULVERT
RAMP
(+)22.0m CD
110.0m
Fig. 13 Marine structures and Plant Building, Minicoy
Fig. 14 Marine structures and Plant Building, Agatti
Sump
A concrete structure was installed at about 5m water depth (with respect to Chart Datum, CD)
to house the sea water pumps. The dimensions of the sump were obtained considering the
necessary clearances for the pumps and also the requirements for draft, towing, floating and
stability at various stages of its construction and installation. The 12.17m x 8.3m x 9.1m
sump accommodated two sets of pumps, two warm water and two cold water pumps along
with the piping with necessary clearances. The structure was to be designed for prevailing
wave, current and wind conditions. Considering the draft and freeboard required for the total
as-built weight of the completed structure and the actual available depth in the lagoon, the
sump was partially constructed in the lagoon, pushed in steps into lagoon to carry out 2 more
stages of construction as per the draft and free board requirements for the operation and then
towed about 7-10 km across the island. Two more stages of construction were carried out,
one before and the other after its lowering to cater to the clearance and over topping
requirements of the structure.
The warm water was drawn at the sump location from 3m below the mean sea level while the
deep sea cold water pipe connected horizontally to the sump at its bottom. As the sump was
located in wave breaker area, it was designed for loads as indicated in Table 3. The location
for sump placement was prepared to remove the partial undulations.
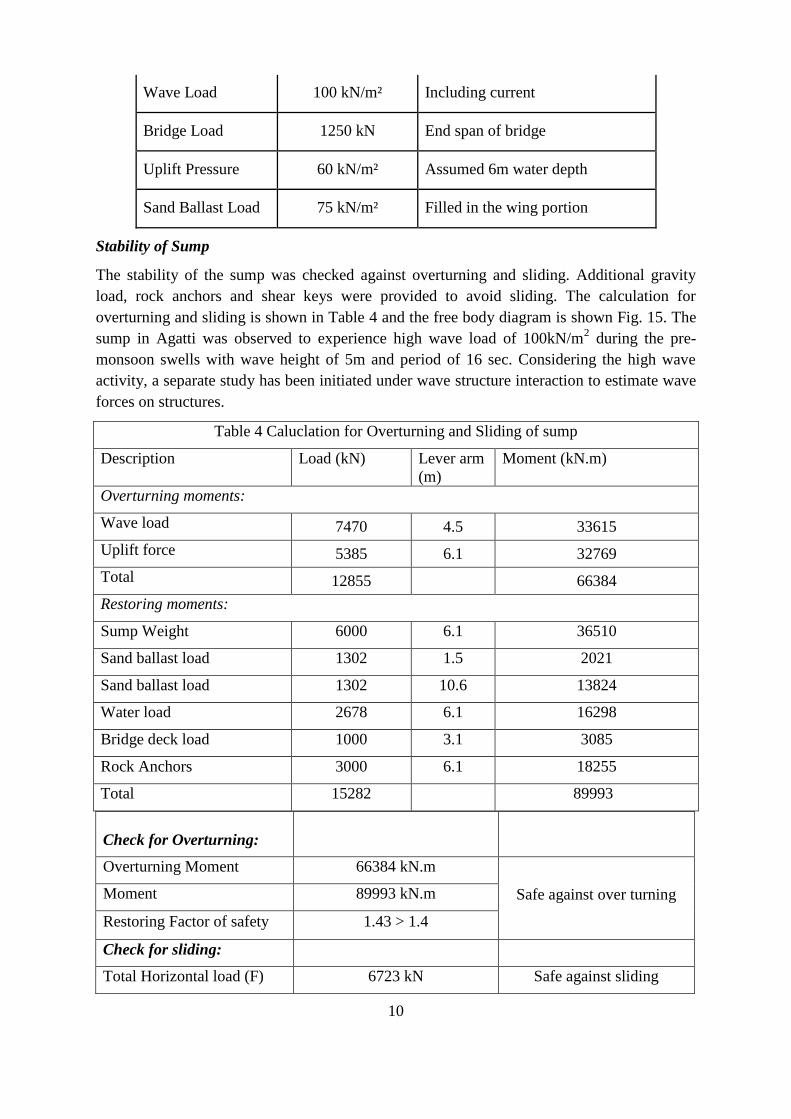
Table 3 Loads considered for the design of sump at 5m water depth
Type of load Intensity Remarks
Dead Load − Based on Density of Material
10
Wave Load 100 kN/m² Including current
Bridge Load 1250 kN End span of bridge
Uplift Pressure 60 kN/m² Assumed 6m water depth
Sand Ballast Load 75 kN/m² Filled in the wing portion
Stability of Sump
The stability of the sump was checked against overturning and sliding. Additional gravity
load, rock anchors and shear keys were provided to avoid sliding. The calculation for
overturning and sliding is shown in Table 4 and the free body diagram is shown Fig. 15. The
sump in Agatti was observed to experience high wave load of 100kN/m2 during the pre-
monsoon swells with wave height of 5m and period of 16 sec. Considering the high wave
activity, a separate study has been initiated under wave structure interaction to estimate wave
forces on structures.
Table 4 Caluclation for Overturning and Sliding of sump
Description Load (kN) Lever arm
(m)
Moment (kN.m)
Overturning moments:
Wave load 7470 4.5 33615
Uplift force 5385 6.1 32769
Total 12855 66384
Restoring moments:
Sump Weight 6000 6.1 36510
Sand ballast load 1302 1.5 2021
Sand ballast load 1302 10.6 13824
Water load 2678 6.1 16298
Bridge deck load 1000 3.1 3085
Rock Anchors 3000 6.1 18255
Total 15282 89993
Check for Overturning:
Overturning Moment 66384 kN.m
Safe against over turning Moment 89993 kN.m
Restoring Factor of safety 1.43 > 1.4
Check for sliding:
Total Horizontal load (F) 6723 kN Safe against sliding

11
Total Vertical load [R] 15282 kN
Co-efficient of friction (µ) 0.3
µ x R 4585 kN
Shear key and rock anchors
capacity 6000 kN
Factor of safety 1.57 > 1.4
Fig. 15 Free body diagram of sump for stability check
Statics and Dynamics of Floating Sump
Statics and dynamics of sump were calculated for floating and towing the sump from lagoon
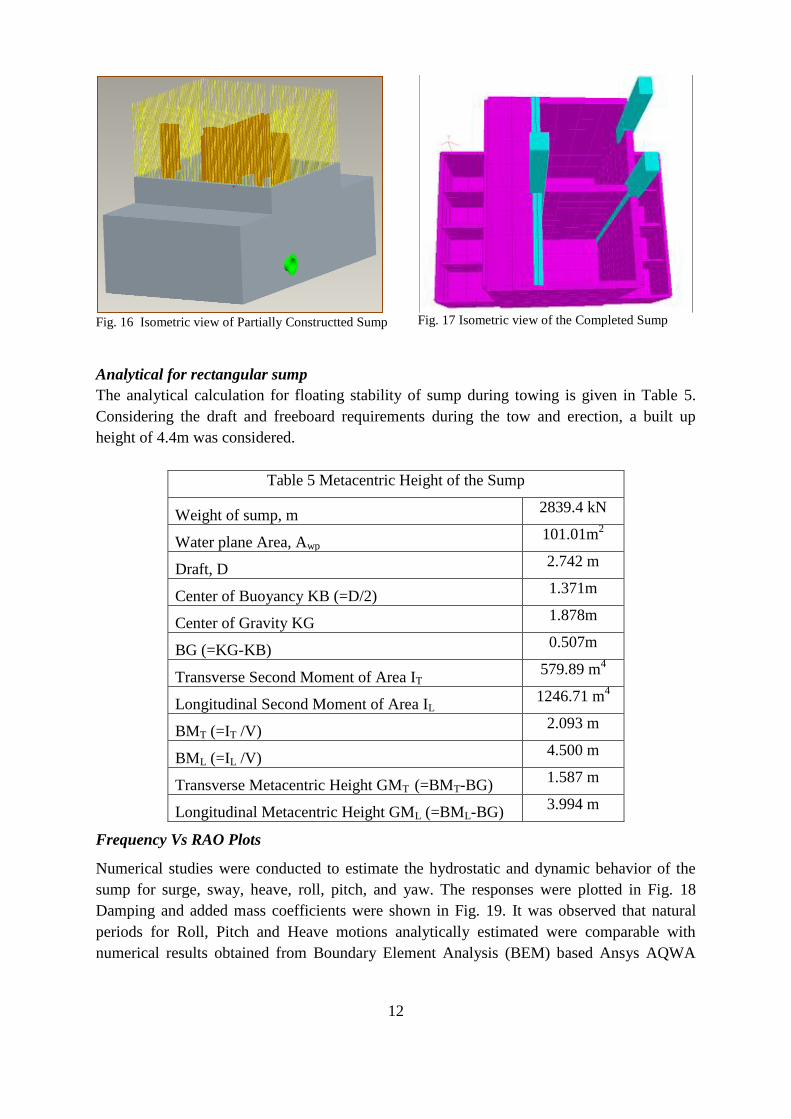
to the site in 5m water depth. The isometric view of partly constructed sump considered for
towing is shown in Fig. 16 and overall isometric view of sump is shown in Fig. 17.
SEA SIDE SHORE SIDE
Ref.Pt
12
Fig. 16 Isometric view of Partially Constructted Sump
Fig. 17 Isometric view of the Completed Sump
Analytical for rectangular sump
The analytical calculation for floating stability of sump during towing is given in Table 5.
Considering the draft and freeboard requirements during the tow and erection, a built up
height of 4.4m was considered.
Table 5 Metacentric Height of the Sump
Weight of sump, m 2839.4 kN
Water plane Area, Awp 101.01m
2
Draft, D 2.742 m
Center of Buoyancy KB (=D/2) 1.371m
Center of Gravity KG 1.878m
BG (=KG-KB) 0.507m
Transverse Second Moment of Area IT 579.89 m
4
Longitudinal Second Moment of Area IL 1246.71 m
4
BMT (=IT /V) 2.093 m
BML (=IL /V) 4.500 m
Transverse Metacentric Height GMT (=BMT-BG) 1.587 m
Longitudinal Metacentric Height GML (=BML-BG) 3.994 m
Frequency Vs RAO Plots
Numerical studies were conducted to estimate the hydrostatic and dynamic behavior of the
sump for surge, sway, heave, roll, pitch, and yaw. The responses were plotted in Fig. 18
Damping and added mass coefficients were shown in Fig. 19. It was observed that natural
periods for Roll, Pitch and Heave motions analytically estimated were comparable with
numerical results obtained from Boundary Element Analysis (BEM) based Ansys AQWA

13
software. The typical periods for heave, pitch, roll were 1.18 rad/s, 1.37 rad/s, and 1.07 rad/s
respectively.
Fig. 18 Frequency Vs RAO Plots of sump
Fig. 19 Damping and Added mass Plots of sump

14
Casting, Towing and Installation of Sump
Considering the requirement to draw cold and warm water separately, 2 water tight
compartments each with 4m x 8m cross section were provided. Two RCC sections of 8m x
3m were also built on either sides of sump in order to increase the stability during towing and
for filling additional weight to increase the gravity load after positioning at site as indicated
in Figures 20 and 21. RCC sump was constrcuted initially in the lagoon shore with bed
preparations such as sand bags, levelling for base slab concreting as shown in Fig. 22.
Fig. 20 Plan of sump
Fig. 21 Cross Section of sump (1-1)
Sump weight was limited to 1900kN to facilitate its launch from shore into the lagoon. Steel
sections were used with rollers below the sump for sliding the sump. Two 1000kN Hydraulic
jacks were used to launch the sump as shown in Fig. 23. Considering the minimal
C1 C2
SE
A S
IDE
SH
OR
E S
IDE
1 1

15
infrastructure available in the island such as manual winches, boats and hydraulic jacks, the
sump was launched within just 15 days as shown in Fig. 24.
After launching, the sump was further cast in lagoon in floating condition up to a draft of
1.8m considering the available depth to cross the lagoon channnel. It was then towed out of
lagoon for about 10 km to the eastern side of the island as indicated in Fig. 25 for its final
installation at the site. The towing route was selected based on draft of the sump, available
water depth in lagoon and location of coral boulders within the channel. The sump was towed
in open sea and brought to final location as shown in Figures 26 and 27. It was then ballasted,
lowered and positioned at the required location in about 5m water depth. The whole operation
could be achieved through careful assessment of draft catering to the site requirements at
various stages of construction, towing, lowering and positioning.
Fig. 22 Bed preparations for sump at lagoon beach
Fig. 23 Hydraulic jack for pushing sump
Fig. 24 Sump after pushing in to lagoon
Fig. 25 Towing route of the sump
Fig. 26 Towing of Sump in open ocean at Agatti
Fig. 27 Towing of Sump in open ocean at Minicoy

16
Bridge
Bridge was constructed to carry cold and warm water pipelines from sump located at 5m
depth to the shore and also to facilitate the necessary maintenance, connecting the sump to
shore and plant building. It was supported by gravity based concrete piers. The length of the
bridge may vary from 100m to 250m depending on island. The total length of the bridge at
Minicoy was about 110m with four major spans of 22m each, as shown in Fig. 28.
Fig. 28 Elevation of approach trestle (one span)
Bridge at Agatti
The 240m long Agatti bridge consisted 15 spans, each of 15m in the intertidal region and of
25m within and beyond the breaker region. About 130m span was in the intertidal region and
110m span was in active breaker region.
Out of 14 piers that were cast for the bridge, the 11 piers in intertidal region were partially
cast on steel staging until they clear the local water depth on lowering. They were then
lowered with chain pulleys of 100 kN capacity. The piers beyond the breaker region were
cast in the lagoon, encased in water tight pontoons to be floated to the site and lowered at
appropriate position, secured by suitable anchors. The bridge deck in intertidal area was of
concrete cast-in-situ and in breaker area was of steel plate girder deck encased in a coating.
The loads considered for the design of bridge are shown in Table 6.
Table 6 Loads considered for the design of the bridge Type of load Intensity Remarks
Dead Load − Based on Density of Material
Live Load Live load = 3 kN/m²
Pipe Load = 3.21 KN/m −
Wind Load 1.6 kN/m² Basic wind speed is 39 m/sec
Wave Load 30 kN/m At 3m depth in breaker zone and it will vary based
on water depth, wave period and height
Earthquake Load
Zone III
Importance factor :1.5
Response Reduction factor :5
As per IS:1893-2002

17
Construction and installation of bridge piers beyond breaker zone (P13, P14)
The construction of piers in and beyond the breaker zone was a challenging task. These piers
witnessed 3 m to 4 m high waves with periods ranging from 10-16 seconds. The marine
structure at Agatti had to be redesigned to withstand extreme waves. Accordingly, the
construction methodology was modified to suit local conditions. The sump in 5m water depth
was located 90m away from the breaker zone. Hence the spans of the bridge to the sump were
adjusted to limit only one pier in the breaker zone and two piers beyond breaker zone with a
span of 25m. The dimensions of the pier are shown in Figures 29 and 30. The pier footing
was cast in a steel caisson in the lagoon area as shown in Figures 31 and 32 and then floated
using buoyancy of the caisson, towed and installed in its final location as per bridge
alignment. The total weight of the partially cast RCC footing with steel pontoon was limited
to around 200kN during its floating and towing. One more stage of construction was carried
out up to the pier cap level after its lowering at the required location.
Fig. 29 Dimensions of P13 and P14 footing.
Fig. 30 Side elevation of P13 and P14 column
Fig. 31 Elevation details of caisson for P12 and P13.
Fig. 32 Assembled steel caisson for P12 and 13
Construction and installation of bridge pier (P12) in the breaker zone
The pier in breaker zone (P12) was initially installed in the same manner as the piers P13 and
P14 beyond the breaker zone. However, high breaking waves were prevalent in the region as
shown in Fig. 33. Due to high wave action P12 was damaged during its partial construction

18
stage as shown in Fig. 34. Detailed analysis with revised design in the wave breaking zone
was carried out. A circular pier with rectangular footing and provisions for rock anchoring
was designed for P12. In order to cast and lower the P12, a steel frame stage was designed,
fabricated and erected at the required location as shown in Fig. 35.
Fig. 33 Breaking waves in P12
Fig. 34 Damaged pier 12 due to high waves
Fig. 35 Revised Pier 12 with steel frame stage
Reinforcement and concreting work for P12 on steel staging is shown in Figures 36 and 37.
The footing and column weighing of about 1000 kN was lowered into the water using chain
pulley blocks. A view of P12 after it was lowered is shown in Fig. 38. Fully concreted P12
till pier cap level is shown in Fig. 39. The construction of Agatti plant was delayed due to
rough weather conditions and lack of equipment to install the foundation. A major
achivemdnt of the project was pier (P12) in the wave breaking area and installation at site,
where wave height was 2m.

19
Fig. 36 Reinforcement work for P12 footing on stage
Fig. 37 Concreting work of P12 on steel stage
Fig. 38 Footing of P12 lowered in water
Fig. 39 Completed Section of P12with pier cap
Launching and erection of plate girder bridge at Agatti
To avoid construction difficulties in the erection of the deck beyond the breaker at Agatti
plant, 60m long structural steel plate girder bridge was designed for the section between the
sump and P12. The structural steel for the plate girder was fabricated at main land to form 16
sections, each about 7m long with necessary splice plates, bolts etc., and transported to Agatti
island. After completing the final in-situ stage of the construction of piers beyond the breaker,
the I sections were assembled, bolted, welded and placed on the deck of RCC bridge as
shown in Fig. 40. Rollers were kept at about 20m intervals on the bridge and were locked to
bridge. A derrick system was erected on the pier 12 to hold the front end of plate girder
during launching as shown in Fig. 41. The plate girder during its launch is shown in Fig. 42.
After launching the plate girder, it was lowered on the RCC bearing blocks cast on the pier
caps, bolted and welded through the plates inserted on the bearing blocks as shown in Fig. 43.
In-situ concreting was carried out between piers P11 and P12 and then a coat of micro
concreting was applied to the exposed steel of the plate girder as shown in Fig. 44. The final
view of the completed plate girder is shown in Fig. 45.

20
Fig. 40 Assembled plate girder on the bridge
Fig. 41 Derick for plate girder launching
Fig. 42 Launching of plate girder
Fig. 43 Plate girder welded with bearing blocks
Fig. 44 Micro concreting work
Fig. 45 View of the plate girder after completion
Plant Building
The plant building housed the plant equipment such as Flash chamber (dry weight: 80 kN,
approx.) and the condenser (dry weight: 120 kN, approx.) along with the associated ducting,
piping, vacuum system, electrical control panel, a store room for spares, control room and
miscellaneous. The flash chamber and the condenser were designed for an internal pressure
of 2.7 kPa. The plant building at Agatti is shown in Fig. 46.
In order to utilize the gravimetric ceiling, the floor of the flash chamber with warm water
opening was placed at a height of about 10.8 (C.D). The shell and tube condenser that also

21
operated at 2.7 kPa was placed at approximately the same level as bridge to optimize the
support structure necessary for condenser on one hand and ducting losses for vapour that
flows in vacuum conditions on the other hand. The fresh water generated in the condenser
was pumped with centrifugal pumps.
Fig. 46 Plant Building at intertidal zone in Agatti
Project Team
Dr.M.A.Atmanand, Director, NIOT
Dr.M.V.Ramana Murthy, Project Director
Dr. S.V.S Phani Kumar, Scientist E
Civil/ Structural Team
Mr. R. Saravanan, Mr. K. Mullaivendhan, Mrs. Sareena, Mr. Irsad, Mr. A.S.
Kiran, Mr. Ramesh Mr. Malik P.M.C, Mr. Antony Johnson, Mrs. V.Gajalakshmi
Mechanical, Electrical and Instrumentation Team
Mr. D. Balaji, Mr. Srinivasulu Reddy Pilli, Dr. G. Dhinesh, Mr. K. Jayaraj,
Mr. A. Jyothi Prakash, Mr. G. Chandrashekar, Mr. A. Naveen, Mr. Lawerance,
Mr. R Elavarasan, Mr. R Kumaradevan
Dr. Purnima Jalihal, Head EFW group and Team
Dr. K.M.Sivakholundu, Head CE group and Team