technical report on the enhanced water conservation ... report on the enhanced water conservation...
TRANSCRIPT
Technical Report on the Enhanced Water Conservation Alternative for the Yakima River Basin Water Storage
Feasibility Study
In support of the Yakima River Basin Water Storage Feasibility Study Draft Planning Report/Environmental Impact Statement Ecology Publication Number 07-11-044
December 2007 Washington State Department of Ecology

Technical Report on the Enhanced Water Conservation Alternative for the Yakima River Basin Water Storage
Feasibility Study
In support of the Yakima River Basin Water Storage Feasibility Study Draft Planning Report/Environmental Impact Statement Ecology Publication Number 07-11-044
Prepared by:
Anchor Environmental, L.L.C. 811 Kirkland Avenue, Suite 200
P.O. Box 2517 Kirkland, WA 98083-2517
Robert A. Montgomery, P.E. Adam Hill
December 2007

TABLE OF CONTENTS TABLE OF CONTENTS ........................................................................................................................................... I INTRODUCTION .....................................................................................................................................................1 DESCRIPTION OF MEASURES ............................................................................................................................3
PROJECTS FROM WATER CONSERVATION PLANS ...................................................................................3 Lining Projects .....................................................................................................................................................3 Piping Projects .....................................................................................................................................................4 Re‐regulation Reservoir Projects ..........................................................................................................................5 On‐farm Conservation Projects............................................................................................................................6 Pump Exchange Projects ......................................................................................................................................6 Water Management Projects ................................................................................................................................7
CONSERVATION DISTRICT PROJECTS...........................................................................................................7 Lining Projects .....................................................................................................................................................8 Piping Projects .....................................................................................................................................................8 On‐farm Conservation Projects............................................................................................................................9 Other Conservation Projects ..............................................................................................................................10
COST ESTIMATES .................................................................................................................................................11 ITEMIZED COST ESTIMATES...........................................................................................................................12 Itemized Pay Items .............................................................................................................................................12 Mobilization Costs..............................................................................................................................................12 Unlisted Items ....................................................................................................................................................12 Contingencies .....................................................................................................................................................12 Noncontract Costs ..............................................................................................................................................12
NON‐ITEMIZED COST ESTIMATES................................................................................................................13 WATER SAVINGS..................................................................................................................................................15 EFFECTS ON FLOW ...............................................................................................................................................17 MUNICIPAL CONSERVATION..........................................................................................................................19
WATER SYSTEM PLANS ...................................................................................................................................19 City of Yakima ....................................................................................................................................................19 City of Ellensburg...............................................................................................................................................21 City of Sunnyside ...............................................................................................................................................23 City of Grandview ..............................................................................................................................................25
OTHER WATER CONSERVATION PROGRAMS ..........................................................................................26 Southern Nevada Water Authority ....................................................................................................................27 Seattle Public Utilities........................................................................................................................................29 Contra Costa Water District ..............................................................................................................................31 West Basin Municipal Water District................................................................................................................32
SUMMARY OF MUNICIPAL CONSERVATION POTENTIAL AND COSTS ...........................................34 REFERENCES ...........................................................................................................................................................37
Technical Report on the Enhanced Water Conservation Alternative Yakima River Basin Water Storage Feasibility Study December 2007 i
List of Tables Table 1 Irrigation Districts with Projects in the Enhanced Water Conservation Alternative............3 Table 2 Conservation Plan Lining Projects Included in the Enhanced Water Conservation
Alternative ......................................................................................................................................4 Table 3 Conservation Plan Piping Projects Included in the Enhanced Water Conservation
Alternative ......................................................................................................................................5 Table 4 Conservation Plan Re‐regulation Reservoir Projects Included in the Enhanced Water
Conservation Alternative ..............................................................................................................6 Table 5 Conservation Plan On‐farm Conservation Projects Included in the Enhanced Water
Conservation Alternative ..............................................................................................................6 Table 6 Conservation Plan Pump Exchange Projects Included in the Enhanced Water
Conservation Alternative ..............................................................................................................7 Table 7 Conservation Plan Water Management Projects Included in the Enhanced Water
Conservation Alternative ..............................................................................................................7 Table 8 Conservation District Lining Projects Included in the Enhanced Water Conservation
Alternative ......................................................................................................................................8 Table 9 Conservation District Piping Projects Included in the Enhanced Water Conservation
Alternative ......................................................................................................................................9 Table 10 Conservation District On‐farm Conservation Projects Included in the Enhanced Water
Conservation Alternative ..............................................................................................................9 Table 11 Conservation District Other Conservation Projects Included in the Enhanced Water
Conservation Alternative ............................................................................................................10 Table 12 USBR Composite Trend Construction Cost Index, 1994 to 2007 ..........................................11 Table 13 Cost Estimates of Projects in the Enhanced Water Conservation Alternative with Itemized
Cost Estimates ..............................................................................................................................13 Table 14 Cost Estimates of Projects in the Enhanced Water Conservation Alternative with Non‐
itemized Cost Estimates ..............................................................................................................14 Table 15 City of Yakima Water Use Estimates.........................................................................................20 Table 16 City of Yakima Water Conservation Measures........................................................................20 Table 17 City of Yakima Future Water Use Comparison .......................................................................21 Table 18 City of Ellensburg Water Use Estimates ...................................................................................21 Table 19 City of Ellensburg Capital Improvement Plan.........................................................................22 Table 20 City of Ellensburg Future Water Use Comparison..................................................................23 Table 21 City of Sunnyside Water Use Estimates....................................................................................23 Table 22 City of Sunnyside Planned Water Conservation Measures ...................................................24 Table 23 City of Sunnyside Future Water Use Comparison ..................................................................24 Table 24 City of Grandview Water Use Estimates ..................................................................................25 Table 25 City of Grandview Planned Water Conservation Measures ..................................................26 Table 26 City of Grandview Future Water Use Comparison.................................................................26 Table 27 SNWA Water Use Comparison ..................................................................................................27 Table 28 SPU Water Use .............................................................................................................................29 Table 29 SPU 1 Percent Program Sectors, Savings, Measures, and Strategies.....................................30 Table 30 Summary of CPA Measure Names, Savings, and Utility Cost ..............................................30 Table 31 Annual Water Demand for CCWD............................................................................................31 Table 32 CCWD Water Conservation Programs and 2004 Estimated Savings ...................................32 Table 33 CCWD Water Conservation Budget..........................................................................................32 Table 34 West Basin Annual Water Use ...................................................................................................33
Technical Report on the Enhanced Water Conservation Alternative Yakima River Basin Water Storage Feasibility Study December 2007 ii

Table 35 West Basin Water Conservation Programs and Estimated Annual Savings .......................33 Table 36 West Basin Water Conservation and Groundwater Monitoring Expenditures ..................34
List of Appendices Appendix A Yakima River Basin Water Conservation Projects Appendix B Conservation Project Cost Details
Technical Report on the Enhanced Water Conservation Alternative Yakima River Basin Water Storage Feasibility Study December 2007 iii

Technical Report on the Enhanced Water Conservation Alternative Yakima River Basin Water Storage Feasibility Study December 2007 iv
INTRODUCTION This report describes the components of the Enhanced Water Conservation Alternative, an aggressive program implementing water conservation measures in the Yakima River basin to improve basin water supply without constructing additional large water storage reservoirs. The report will describe how the projects were determined, how the cost estimates for the projects were established, how much water savings is expected from the projects, and how the effects the projects have on Yakima River basin flow were calculated. The report will also discuss municipal projects not included in this alternative but that can be considered as possibilities for additional water conservation efforts. This report supplements the water conservation analyses performed in the Yakima River Basin Water Storage Feasibility Study Draft Planning Report/Environmental Impact Statement (Reclamation 2008).
Technical Report on the Enhanced Water Conservation Alternative Yakima River Basin Water Storage Feasibility Study December 2007 1

Technical Report on the Enhanced Water Conservation Alternative Yakima River Basin Water Storage Feasibility Study December 2007 2

DESCRIPTION OF MEASURES Measures for the Enhanced Water Conservation Alternative are varied in cost and type. Measures are mostly agriculture-related projects that will be implemented by irrigation districts and individual landowners. These projects were established from irrigation districts’ published water conservation plans and communication with conservation district representatives who have knowledge of planned conservation efforts within their district. Descriptions of projects from these sources follow. A summary table of the conservation projects is contained in Appendix A.
PROJECTS FROM WATER CONSERVATION PLANS
Projects to be implemented by irrigation districts improve basin water supply by reducing the amount of water required to be diverted from the Yakima River or one of its tributaries. Thirty projects included in the alternative were found in water conservation plans from seven irrigation districts in the Yakima River basin. The irrigation districts, the number of projects for each district, and their plan reference is shown in Table 1.
Table 1 Irrigation Districts with Projects in the Enhanced Water Conservation Alternative
Irrigation District Number of Projects Source
Wapato Irrigation Project
16 Natural Resources Consulting Engineers (NRCE). 1999. Irrigation Water Conservation and Management Plan for the Wapato Irrigation Project. May.
Sunnyside Valley Irrigation District
1 CH2M Hill. 1995. Outlook Irrigation District Comprehensive Water Conservation Plan.
Kiona Irrigation District
1 CH2M Hill. 1996. Kiona Irrigation District Comprehensive Water Conservation Plan. February.
Columbia Irrigation District
3 SCM Consultants. 2001. Facsimile; Subject:: Yakima River Basin Watershed Plan. August 15.
Kennewick Irrigation District
1 SCM Consultants. 1999. Kennewick Irrigation District Water Conservation Plan. June.
Naches-Selah Irrigation District
7 CH2M Hill. 1995. Naches-Selah Irrigation District Comprehensive Water Conservation Plan.
Harter, Justin. 2006. Personal correspondence. Naches-Selah Irrigation District. South Naches
Irrigation District 1 CH2M Hill. 1994. South Naches Irrigation District Comprehensive Water Conservation
Plan. February.
These projects from the water conservation plans consist of several different types of projects that improve basin water supply. These types include lining projects, piping projects, re-regulation reservoir projects, on-farm conservation projects, pump exchange projects, and water management projects. A short description of each project type follows.
Lining Projects Lining projects involve installing concrete or cement lining on major distribution canals that either do not currently have lining (earth ditch) or replacing lining that is leaking or in need of repair. These projects will save water by reducing losses through infiltration. Lining projects from conservation plans, along with their estimated water savings, are described in Table 2.
Technical Report on the Enhanced Water Conservation Alternative Yakima River Basin Water Storage Feasibility Study December 2007 3

Table 2 Conservation Plan Lining Projects Included in the Enhanced Water Conservation Alternative
Alternative Project Number Entity
Estimated Water Savings
(acre-feet per year) Description 17 Wapato Irrigation
Project 4,600 Line Satus East and Satus West Canals with concrete
18 Wapato Irrigation Project
3,400 Concrete line Lateral 4 Extension and line or pipe corresponding sublaterals
19 Wapato Irrigation Project
5,100 Cement line Track Lateral and replace or repair water structures
21 Wapato Irrigation Project
5,900 Line Unit 1 Canal in Bench Unit with concrete
22 Wapato Irrigation Project
5,200 Line Unit 2 Pump Canal in Bench Unit with concrete
33 Columbia Irrigation District
26,000 Concrete line Main Canal (also includes pump exchange, see Table 6)
38 Naches-Selah Irrigation District
8,675 Line and rehabilitate Main Canal and tunnels from Mile 9 to Mile 15
41 Naches-Selah Irrigation District
a Line existing unlined Main Canal from Mile 0 to Mile 9, replace failing wood flumes, rehabilitate structures, and automate canal
Note: a = Water savings combined with Project No. 38
Sources: NRCE 1999 SCM Consultants 2001 CH2M Hill 1995a Harter, personal communication 2006
Piping Projects Piping projects will install pipe to replace open ditches or currently piped systems that are leaking. These projects may also replace gravity-flow pipes to pipes that will operate as a pressurized system. These projects will reduce losses through infiltration and evaporation for water savings. In the case of pipe replacement to install a pressurized system, the projects will reduce diversions because of a more efficient conveyance system, which will reduce operational spills. Piping projects from conservation plans, along with their estimated water savings, are described in Table 3.
Technical Report on the Enhanced Water Conservation Alternative Yakima River Basin Water Storage Feasibility Study December 2007 4
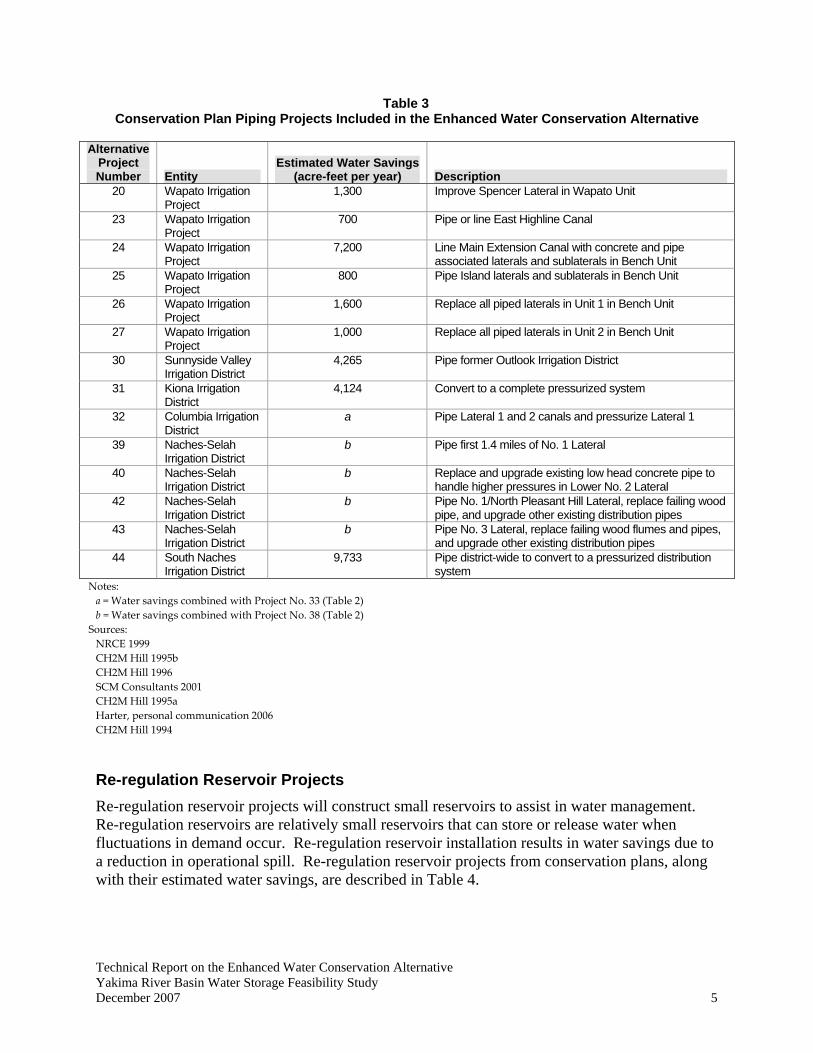
Table 3 Conservation Plan Piping Projects Included in the Enhanced Water Conservation Alternative
Alternative Project Number Entity
Estimated Water Savings (acre-feet per year) Description
20 Wapato Irrigation Project
1,300 Improve Spencer Lateral in Wapato Unit
23 Wapato Irrigation Project
700 Pipe or line East Highline Canal
24 Wapato Irrigation Project
7,200 Line Main Extension Canal with concrete and pipe associated laterals and sublaterals in Bench Unit
25 Wapato Irrigation Project
800 Pipe Island laterals and sublaterals in Bench Unit
26 Wapato Irrigation Project
1,600 Replace all piped laterals in Unit 1 in Bench Unit
27 Wapato Irrigation Project
1,000 Replace all piped laterals in Unit 2 in Bench Unit
30 Sunnyside Valley Irrigation District
4,265 Pipe former Outlook Irrigation District
31 Kiona Irrigation District
4,124 Convert to a complete pressurized system
32 Columbia Irrigation District
a Pipe Lateral 1 and 2 canals and pressurize Lateral 1
39 Naches-Selah Irrigation District
b Pipe first 1.4 miles of No. 1 Lateral
40 Naches-Selah Irrigation District
b Replace and upgrade existing low head concrete pipe to handle higher pressures in Lower No. 2 Lateral
42 Naches-Selah Irrigation District
b Pipe No. 1/North Pleasant Hill Lateral, replace failing wood pipe, and upgrade other existing distribution pipes
43 Naches-Selah Irrigation District
b Pipe No. 3 Lateral, replace failing wood flumes and pipes, and upgrade other existing distribution pipes
44 South Naches Irrigation District
9,733 Pipe district-wide to convert to a pressurized distribution system
Notes: a = Water savings combined with Project No. 33 (Table 2) b = Water savings combined with Project No. 38 (Table 2)
Sources: NRCE 1999 CH2M Hill 1995b CH2M Hill 1996 SCM Consultants 2001 CH2M Hill 1995a Harter, personal communication 2006 CH2M Hill 1994
Re-regulation Reservoir Projects Re-regulation reservoir projects will construct small reservoirs to assist in water management. Re-regulation reservoirs are relatively small reservoirs that can store or release water when fluctuations in demand occur. Re-regulation reservoir installation results in water savings due to a reduction in operational spill. Re-regulation reservoir projects from conservation plans, along with their estimated water savings, are described in Table 4.
Technical Report on the Enhanced Water Conservation Alternative Yakima River Basin Water Storage Feasibility Study December 2007 5

Table 4 Conservation Plan Re-regulation Reservoir Projects Included in the Enhanced Water Conservation
Alternative
Alternative Project Number Entity
Estimated Water Savings
(acre-feet per year) Description 15 Wapato Irrigation
Project 700 Construct a 370 acre-foot capacity reservoir in Bench Unit
37 Naches-Selah a Construct a lined 55 acre-foot reservoir to buffer flows Irrigation District coming from Main Canal at Mile 15 into piped laterals
Note: a = Water savings combined with Project No. 38 (Table 2)
Sources: NRCE 1999 CH2M Hill 1995a Harter, personal communication 2006
On-farm Conservation Projects On-farm conservation projects in the water conservation plans are incentive-based programs that provide assistance to landowners to improve irrigation systems and land. Water savings is based on the amount of participation in the conservation effort. The typical on-farm conservation effort relies on converting less efficient watering methods (such as rill irrigation) into more efficient watering methods (such as sprinkler irrigation). On-farm conservation projects from conservation plans, along with their estimated water savings, are described in Table 5.
Table 5 Conservation Plan On-farm Conservation Projects Included in the Enhanced Water Conservation
Alternative
Alternative Project Number Entity
Estimated Water Savings
(acre-feet per year) Description 16 Wapato Irrigation
Project 32,500 Voluntary incentive-based program to provide assistance to
growers for improvements to irrigation systems and land Source: NRCE 1999
Pump Exchange Projects Pump exchange projects involve constructing a revised conveyance system that pumps water from a different source as a replacement to diverting water from the current source. In the pump exchange projects reviewed, water would be pumped from the Columbia River to replace water that is originally diverted from the Yakima River. As a result, the Yakima River would have additional water downstream of the point of diversion. These projects do not conserve water on a whole but do reduce the amount of water being used in the Yakima River basin. Potential pump exchange projects, along with their estimated water savings, are described in Table 6.
Technical Report on the Enhanced Water Conservation Alternative Yakima River Basin Water Storage Feasibility Study December 2007 6
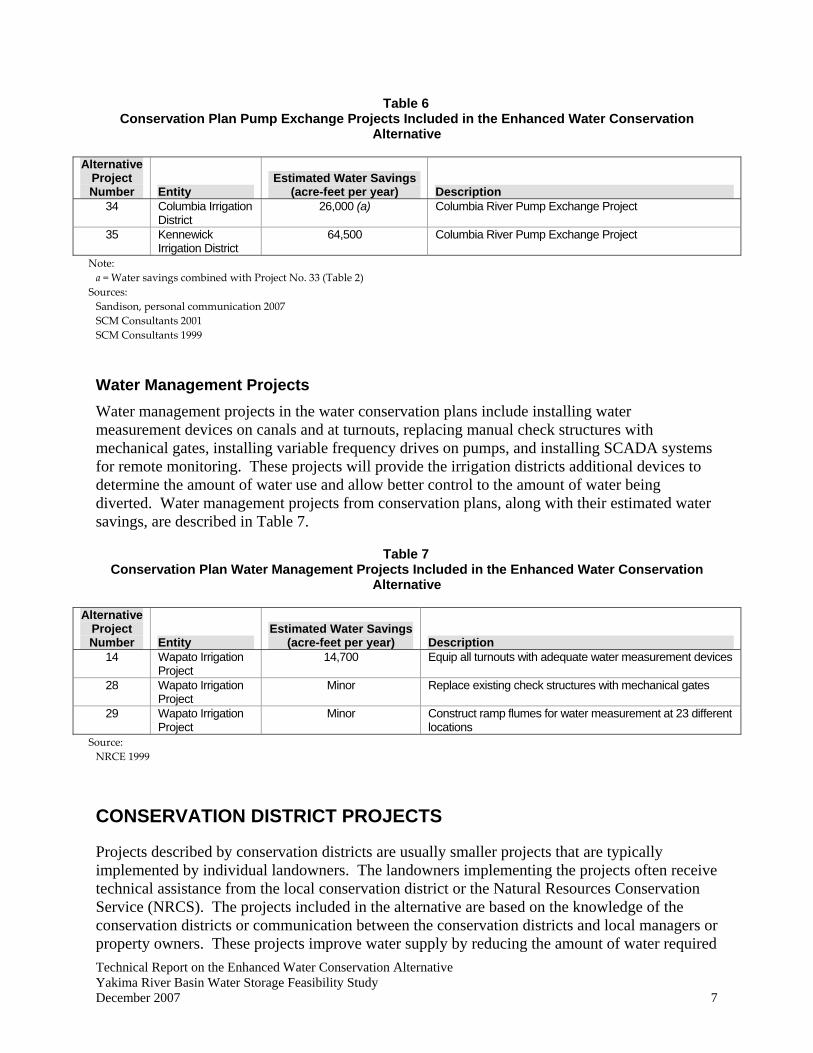
Table 6 Conservation Plan Pump Exchange Projects Included in the Enhanced Water Conservation
Alternative
Alternative Project Number Entity
Estimated Water Savings (acre-feet per year) Description
34 Columbia Irrigation District
26,000 (a) Columbia River Pump Exchange Project
35 Kennewick Irrigation District
64,500 Columbia River Pump Exchange Project
Note: a = Water savings combined with Project No. 33 (Table 2)
Sources: Sandison, personal communication 2007 SCM Consultants 2001 SCM Consultants 1999
Water Management Projects Water management projects in the water conservation plans include installing water measurement devices on canals and at turnouts, replacing manual check structures with mechanical gates, installing variable frequency drives on pumps, and installing SCADA systems for remote monitoring. These projects will provide the irrigation districts additional devices to determine the amount of water use and allow better control to the amount of water being diverted. Water management projects from conservation plans, along with their estimated water savings, are described in Table 7.
Table 7 Conservation Plan Water Management Projects Included in the Enhanced Water Conservation
Alternative
Alternative Project Number Entity
Estimated Water Savings (acre-feet per year) Description
14 Wapato Irrigation Project
14,700 Equip all turnouts with adequate water measurement devices
28 Wapato Irrigation Project
Minor Replace existing check structures with mechanical gates
29 Wapato Irrigation Project
Minor Construct ramp flumes for water measurement at 23 different locations
Source: NRCE 1999
CONSERVATION DISTRICT PROJECTS
Projects described by conservation districts are usually smaller projects that are typically implemented by individual landowners. The landowners implementing the projects often receive technical assistance from the local conservation district or the Natural Resources Conservation Service (NRCS). The projects included in the alternative are based on the knowledge of the conservation districts or communication between the conservation districts and local managers or property owners. These projects improve water supply by reducing the amount of water required Technical Report on the Enhanced Water Conservation Alternative Yakima River Basin Water Storage Feasibility Study December 2007 7

to be diverted from the Yakima River or one of its tributaries. Seventeen projects included in the alternative came from information obtained from one of two conservation districts, the Kittitas County Conservation District (12 projects) and the North Yakima Conservation District (five projects).
These projects from the conservation districts consist of several different types of projects that could improve basin water supply. These types include lining projects, piping projects, on-farm conservation projects, and other conservation projects. A short description of each project type follows.
Lining Projects Lining projects involve replacing concrete lining in areas that are leaking. These projects will save water by reducing losses through infiltration. Lining projects from conservation districts, along with their estimated water savings, are described in Table 8.
Table 8 Conservation District Lining Projects Included in the Enhanced Water Conservation Alternative
Alternative Project Number Entity
Conservation District
Estimated Water Savings
(acre-feet per year) Description 1 Kittitas Reclamation
District Kittitas County Conservation
District
2,000 Replace leaking areas of Main Canal with new concrete liner
Source: Crowley, personal communication 2006
Piping Projects Piping projects will install pipe to replace open ditches or currently piped systems that are leaking. These projects will reduce losses through infiltration and evaporation for water savings. Lining projects from conservation districts, along with their estimated water savings, are described in Table 9.
Technical Report on the Enhanced Water Conservation Alternative Yakima River Basin Water Storage Feasibility Study December 2007 8
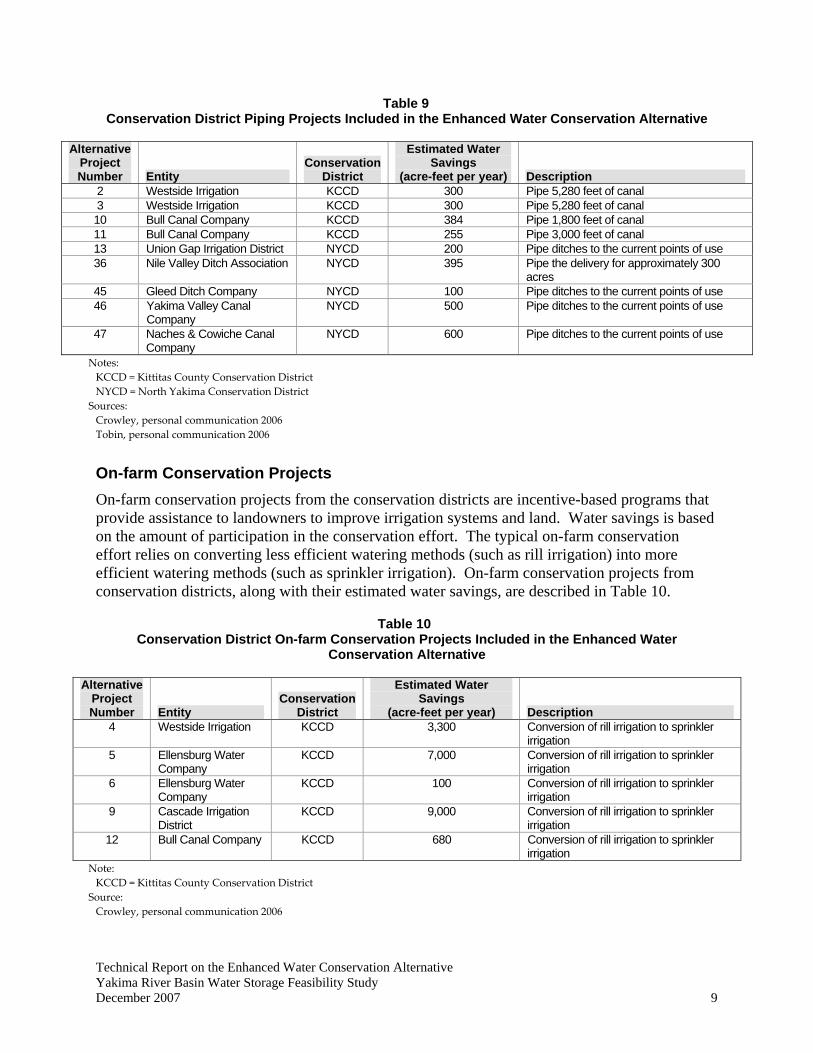
Table 9 Conservation District Piping Projects Included in the Enhanced Water Conservation Alternative
Alternative Project Number Entity
Conservation District
Estimated Water Savings
(acre-feet per year) Description 2 Westside Irrigation KCCD 300 Pipe 5,280 feet of canal 3 Westside Irrigation KCCD 300 Pipe 5,280 feet of canal 10 Bull Canal Company KCCD 384 Pipe 1,800 feet of canal 11 Bull Canal Company KCCD 255 Pipe 3,000 feet of canal 13 Union Gap Irrigation District NYCD 200 Pipe ditches to the current points of use 36 Nile Valley Ditch Association NYCD 395 Pipe the delivery for approximately 300
acres 45 Gleed Ditch Company NYCD 100 Pipe ditches to the current points of use 46 Yakima Valley Canal
Company NYCD 500 Pipe ditches to the current points of use
47 Naches & Cowiche Canal Company
NYCD 600 Pipe ditches to the current points of use
Notes: KCCD = Kittitas County Conservation District NYCD = North Yakima Conservation District
Sources: Crowley, personal communication 2006 Tobin, personal communication 2006
On-farm Conservation Projects On-farm conservation projects from the conservation districts are incentive-based programs that provide assistance to landowners to improve irrigation systems and land. Water savings is based on the amount of participation in the conservation effort. The typical on-farm conservation effort relies on converting less efficient watering methods (such as rill irrigation) into more efficient watering methods (such as sprinkler irrigation). On-farm conservation projects from conservation districts, along with their estimated water savings, are described in Table 10.
Table 10 Conservation District On-farm Conservation Projects Included in the Enhanced Water
Conservation Alternative
Alternative Project Number Entity
Conservation District
Estimated Water Savings
(acre-feet per year) Description 4 Westside Irrigation KCCD 3,300 Conversion of rill irrigation to sprinkler
irrigation 5 Ellensburg Water
Company KCCD 7,000 Conversion of rill irrigation to sprinkler
irrigation 6 Ellensburg Water
Company KCCD 100 Conversion of rill irrigation to sprinkler
irrigation 9 Cascade Irrigation
District KCCD 9,000 Conversion of rill irrigation to sprinkler
irrigation 12 Bull Canal Company KCCD 680 Conversion of rill irrigation to sprinkler
irrigation Note: KCCD = Kittitas County Conservation District
Source: Crowley, personal communication 2006
Technical Report on the Enhanced Water Conservation Alternative Yakima River Basin Water Storage Feasibility Study December 2007 9

Other Conservation Projects Other conservation projects from the conservation districts include installing a pump to return used water into the canal for reuse, installing variable frequency drives on pumps, or increasing local storage within an irrigation area. The projects will assist to give better control to the amount of water being diverted and reduce waste flows. These other projects from conservation districts, along with their estimated water savings, are described in Table 11.
Table 11 Conservation District Other Conservation Projects Included in the Enhanced Water Conservation
Alternative
Alternative Project Number Entity
Conservation District
Estimated Water Savings
(acre-feet per year) Description 7 Cascade Irrigation District KCCD 2,088 Pump return flows from Johnson Drain back
into the canal for reuse 8 Cascade Irrigation District KCCD a Install a variable frequency drive on two
pumps at the head end of the canal system Notes: KCCD = Kittitas County Conservation District a = Water savings combined with Project No. 7
Source: Crowley, personal communication 2006
Technical Report on the Enhanced Water Conservation Alternative Yakima River Basin Water Storage Feasibility Study December 2007 10
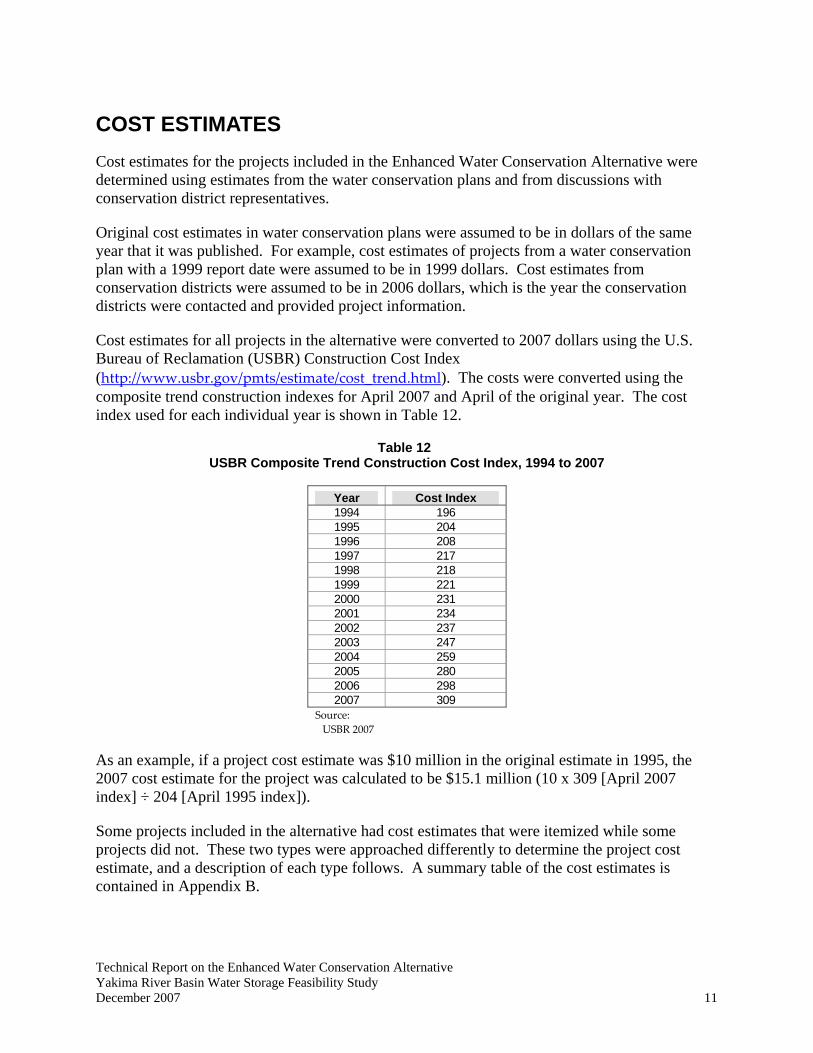
COST ESTIMATES Cost estimates for the projects included in the Enhanced Water Conservation Alternative were determined using estimates from the water conservation plans and from discussions with conservation district representatives.
Original cost estimates in water conservation plans were assumed to be in dollars of the same year that it was published. For example, cost estimates of projects from a water conservation plan with a 1999 report date were assumed to be in 1999 dollars. Cost estimates from conservation districts were assumed to be in 2006 dollars, which is the year the conservation districts were contacted and provided project information.
Cost estimates for all projects in the alternative were converted to 2007 dollars using the U.S. Bureau of Reclamation (USBR) Construction Cost Index (http://www.usbr.gov/pmts/estimate/cost_trend.html). The costs were converted using the composite trend construction indexes for April 2007 and April of the original year. The cost index used for each individual year is shown in Table 12.
Table 12 USBR Composite Trend Construction Cost Index, 1994 to 2007
Year Cost Index 1994 196 1995 204 1996 208 1997 217 1998 218 1999 221 2000 231 2001 234 2002 237 2003 247 2004 259 2005 280 2006 298 2007 309
Source: USBR 2007
As an example, if a project cost estimate was $10 million in the original estimate in 1995, the 2007 cost estimate for the project was calculated to be $15.1 million (10 x 309 [April 2007 index] ÷ 204 [April 1995 index]).
Some projects included in the alternative had cost estimates that were itemized while some projects did not. These two types were approached differently to determine the project cost estimate, and a description of each type follows. A summary table of the cost estimates is contained in Appendix B.
Technical Report on the Enhanced Water Conservation Alternative Yakima River Basin Water Storage Feasibility Study December 2007 11

ITEMIZED COST ESTIMATES
Projects that had an itemized cost estimate in their initial form had different values for items such as mobilization, contingencies, and noncontract costs. In order to maintain consistency for projects obtained from different sources, a specific formula was followed. The formula breaks the costs into itemized pay items, mobilization costs, unlisted items, contingencies, and noncontract costs. For these projects, the itemized pay items were placed in the formula and converted to 2007 dollars (described in Section 3). A description of each cost follows.
Itemized Pay Items Itemized pay items are the major features of the project listed in the cost estimate. For consistency of projects from different sources, itemized pay items were the only values taken from the original estimate for those projects that had itemized cost estimates.
Mobilization Costs Mobilization costs are incurred during assembly of contractor personnel and equipment to the project site during the initial project startup. These costs were assumed to be 5 percent of the itemized pay item total.
Unlisted Items Unlisted items identify the confidence level in estimates and can be used for minor design changes or minor pay items that have not been itemized. These items were assumed to total 10 percent of the itemized pay item total.
Contingencies Contingencies account for uncertainties in cost estimating and for funds to be used after construction starts. Those funds can pay contractors for overruns of quantities, changed site conditions, change orders, and other construction-related costs beyond the design costs. Contingencies were assumed to equal 25 percent of the sum of the itemized pay items, mobilization costs, and unlisted items.
Noncontract Costs Noncontract costs include all costs that are not directly construction costs but are required for the project itself. These costs include final engineering design and specifications; regulatory compliance and permitting; environmental mitigation and monitoring; contract administration and management; and land acquisition, relocation, and right-of-way costs. Noncontract costs were assumed to be 35 percent of the sum of all previous costs (itemized pay items, mobilization costs, unlisted items, and contingencies).
Projects with itemized cost estimates, their original itemized cost and corresponding additional costs, and the updated total project cost in 2007 dollars are listed in Table 13.
Technical Report on the Enhanced Water Conservation Alternative Yakima River Basin Water Storage Feasibility Study December 2007 12

Table 13 Cost Estimates of Projects in the Enhanced Water Conservation Alternative with Itemized Cost
Estimates
Alternative Project Number
Itemized Pay Items ($)
Total Project Cost (All Costs; $)
Year of Cost Estimate
2007 Total Project Cost ($)
15 209,513 408,400 1999 571,021 17 2,317,345 4,516,700 1999 6,315,205 18 2,264,473 4,413,600 1999 6,171,052 19 3,453,850 6,731,800 1999 9,412,236 20 958,397 1,868,000 1999 2,611,819 21 6,172,953 12,031,500 1999 16,822,324 22 5,967,078 11,630,200 1999 16,261,230 23 958,397 1,868,000 1999 2,611,819 24 15,000,163 29,236,300 1999 40,877,904 25 1,753,097 3,416,900 1999 4,777,476 26 3,818,262 7,442,000 1999 10,405,330 27 4,268,948 8,320,500 1999 11,633,640 28 581,800 1,134,000 1999 1,585,548 29 581,800 1,134,000 1999 1,585,548 30 474,526 924,900 1995 1,400,951 31 1,610,230 3,138,400 1995 4,753,753 32 5,878,171 11,456,900 2001 15,128,983 33 5,762,015 11,230,500 2001 14,830,019 34 2,648,700 5,162,500 2001 6,817,147 35 19,768,800 38,530,600 1999 53,873,101 44 3,264,000 6,361,700 1994 10,029,415
Sources: NRCE 1999 CH2M Hill 1995b CH2M Hill 1996 SCM Consultants 2001 SCM Consultants 1999 CH2M Hill 1994
NON-ITEMIZED COST ESTIMATES
Projects that did not have an itemized cost estimate were unable to follow this formula as the costs of the pay items were unknown. For these projects, the cost estimate given in the source was simply converted to 2007 dollars, as described in Section 3. Projects with non-itemized cost estimates, their original cost estimate, and the updated total project cost in 2007 dollars are listed in Table 14.
Technical Report on the Enhanced Water Conservation Alternative Yakima River Basin Water Storage Feasibility Study December 2007 13

Table 14 Cost Estimates of Projects in the Enhanced Water Conservation Alternative with Non-itemized
Cost Estimates
Alternative Project Number
Total Project Cost ($)
Year of Cost Estimate
2007 Total Project Cost ($)
1 3,000,000 2006 3,110,738 2 220,000 2006 228,121 3 220,000 2006 228,121 4 8,250,000 2006 8,554,530 5 17,500,000 2006 18,145,973 6 250,000 2006 259,228 7 200,000 2006 207,383 8 130,000 2006 134,799 9 22,500,000 2006 23,330,537 10 315,000 2006 326,628 11 225,000 2006 233,305 12 1,700,000 2006 1,762,752 13 500,000 2006 518,456 14 5,200,000 2006 7,270,588 16 16,730,000 1999 23,391,719 36 500,000 2006 518,456 37 3,000,000 2006 3,110,738 38 2,500,000 1995 3,786,765 39 1,960,000 2006 2,032,349 40 509,000 2006 527,789 41 13,700,000 2005 15,118,929 42 2,810,000 2006 2,913,725 43 4,710,000 2006 4,883,859 45 5,000,000 2006 5,184,564 46 25,000,000 2006 25,922,819 47 15,000,000 2006 15,553,691
Sources: Crowley, personal communication 2006 Tobin, personal communication 2006 NRCE 1999 CH2M Hill 1995a Harter, personal communication 2006
The total estimated costs for the two groups of projects listed in Tables 13 and 14 are $405,700,000. A summary of the project costs is contained in Appendix B.
Technical Report on the Enhanced Water Conservation Alternative Yakima River Basin Water Storage Feasibility Study December 2007 14
WATER SAVINGS Water savings for the projects included in the Enhanced Water Conservation Alternative were determined using information available from water conservation plans and experience of representatives from the local conservation districts. The water conservation plans typically had a calculated value of water savings listed for each individual project; these values were used directly from the water conservation plan. For on-farm conservation projects that did not have a specific water savings published in a water conservation plan, a savings of 1 acre-foot of water was assumed for each acre that is to be converted from rill irrigation to sprinkler irrigation. Other water savings values supplied by water conservation representatives were unchanged. The water savings for each included project were shown in Tables 2 through 11. The total water savings in the Yakima River basin for all projects in the alternative is estimated to be 229,199 acre-feet per year. However those water savings do not result in a corresponding increase in water supply. The effects on water supply are discussed in the following section and in the Yakima River Basin Water Storage Feasibility Study Draft Planning Report/EIS (Reclamation 2008). With a total estimated cost in 2007 dollars of $405.7 million, the cost per acre-foot saved is $1,770.
Technical Report on the Enhanced Water Conservation Alternative Yakima River Basin Water Storage Feasibility Study December 2007 15

Technical Report on the Enhanced Water Conservation Alternative Yakima River Basin Water Storage Feasibility Study December 2007 16

EFFECTS ON FLOW Water savings from the projects included in the Enhanced Water Conservation Alternative were used in the Yakima Project RiverWare (Yak-RW) model to determine the effects on flow and water supply in the Yakima River basin. Each project was categorized into one of three water savings categories (canal seepage, canal spill, or on-farm seepage) and placed in the Yak-RW model to assess the effect of reducing diversions and return flow. The model results are not repeated in this report; refer to the Yakima River Basin Water Storage Feasibility Study Draft Planning Report/EIS (Reclamation 2008) for detail on the modeling procedure and the results.
Technical Report on the Enhanced Water Conservation Alternative Yakima River Basin Water Storage Feasibility Study December 2007 17

Technical Report on the Enhanced Water Conservation Alternative Yakima River Basin Water Storage Feasibility Study December 2007 18

MUNICIPAL CONSERVATION Municipal conservation projects involve improvements to infrastructure for delivering municipal water supplies and/or demand management to reduce household water consumption.
The Washington State Department of Health has water use efficiency requirements, which include water conservation, that are to be included in Water System Plans. These requirements are located in their Publication No. 331-375, Water Use Efficiency Guidebook (July 2007). These requirements include production (source) and consumption (service) meters, a plan to control leakage, and education programs for customers about water use efficiency practices (DOH 2007).
The purpose of this review of municipal conservation is to estimate the potential effect of conservation on the projected municipal needs for the Yakima River Basin. Those projected needs are described in Yakima River Basin Storage Alternatives Appraisal Assessment a component of Yakima River Basin Water Storage Feasibility Study, Washington Technical Series No TS-YSS-8 (Reclamation 2006). The projected additional municipal and domestic demand in that report for 2050 is 82,000 acre-feet per year. The demands are based upon projections without accounting for the effects of conservation. Since the water supply in the Yakima River basin is fully appropriated, future water supplies will need to be derived from either new storage, conservation or buying water from existing water right holders. A significant cost will be incurred for any of those alternatives, potentially increasing the price of water obtained for new growth. Those increased costs will increase the desire for conserving water that is already used to allow growth to occur at lower costs.
WATER SYSTEM PLANS
Water system plans from four of the largest municipal suppliers of water in the Yakima River basin (Cities of Yakima, Ellensburg, Grandview, and Sunnyside) were reviewed to determine current water use, conservation efforts, and future water use with the conservation efforts in place. Details for each municipality follow.
City of Yakima The City of Yakima is the largest municipal supplier of water in the Yakima River basin, serving a population of more than 65,000. Their main source of water is surface water diversion from the Naches River. During non-drought years, the City of Yakima can divert up to 25 million gallons per day (MGD). During drought years, their allowed diversion is based on proratable rationing. In 2001, their worst case on record, the diversion allowed was 10 cubic feet per second (cfs) plus 29 percent of 29 cfs, which equals 11.9 MGD. Groundwater wells are also a source for the City of Yakima; however, the wells are currently used in emergencies only (Thomas E. Coleman, P.E. Consulting Services 2004).
Water Use Estimates Water use estimates are based on previous (1994 to 2000) average water use and current and future projections for land use, customer class (single family, multi-family, commercial, industrial, and irrigation), and population. The intermediate series from the Office of Financial
Technical Report on the Enhanced Water Conservation Alternative Yakima River Basin Water Storage Feasibility Study December 2007 19

Management Yakima County projections was assumed for the population trend. Table 15 presents the estimates for the current and future population, total water use, and water use per capita. Water use estimates assume that the average use will not significantly change (Thomas E. Coleman, P.E. Consulting Services 2004). It is assumed the estimates do not include any conservation measures described in Section 6.1.1.2.
Table 15 City of Yakima Water Use Estimates
Estimated Estimated
Year Total
Population
Total Average Daily Demand
(MGD)
Number of Residential
Connections
Residential Average Daily
Use (MGD) ERU Demand
(gpd/ERU)
Per Capita Demand
(gpd/person) 2000 65,038 13.06 17,088 4.87 285 201 2010 69,378 13.80 18,246 5.20 285 199 2025 82,951 16.10 21,825 6.22 285 194
Notes: ERU = Equivalent residential units gpd = gallons per day
Source: Thomas E. Coleman, P.E. Consulting Services 2004
The estimated demands are lower than the forecast contained in the Yakima River Basin Storage Alternatives Appraisal Assessment (Reclamation 2006). Reclamation’s forecast for the City of Yakima in 2020 is 17.4 MGD, compared to 16.1 MGD in Table 15 for 2025.
Conservation Measures In 1995, a list of potential conservation measures was developed for consideration. Many of these measures were not determined to be cost-effective and were not recommended for implementation (Thomas E. Coleman, P.E. Consulting Services 2004). From the list, five conservation measures were recommended for the City of Yakima. Table 16 lists the project, its cost, and the expected water savings of the recommended measures implemented by the City of Yakima.
Table 16 City of Yakima Water Conservation Measures
Measure Cost ($) Water Savings Program promotion/public education 22,000 per year 1 percent reduction in
residential water use Meter replacement program 35,000 per year Not listed Leak detection program 32,000 every 4 years Not listed
New plumbing code None 1.4 MGD by 2008 4.5 MGD by 2022
Irrigation efficiency measures 6,000 per year 0.2 to 0.5 MGD by 2008 Source: Thomas E. Coleman, P.E. Consulting Services 2004
Technical Report on the Enhanced Water Conservation Alternative Yakima River Basin Water Storage Feasibility Study December 2007 20

Conservation Effects on Future Water Use The conservation measures will result in water savings that can allow for additional service using the same amount of water. Table 17 compares the estimated future water use and equivalent residential unit (ERU) demand with and without conservation.
Table 17 City of Yakima Future Water Use Comparison
Year
Average Demand ERU Demand Per Capita Demand
No Conservation
(MGD)
With Conservation
(MGD)
No Conservation
(gpd/ERU)
With Conservation
(gpd/ERU)
No Conservation (gpd/person)
With Conservation (gpd/person)
2010 13.80 12.15 285 251 199 175 2025 16.10 11.04 285 195 194 133 Note: gpd = gallons per day
The estimated reduction in water use with conservation measures is 5 MGD, or approximately 5,600 acre-feet/year (31% reduction). The difference between the estimate in Table 17 and the Reclamation forecast is greater (6.3 MGD or 7,100 acre-feet/year for 2025.
City of Ellensburg The City of Ellensburg is the third-largest municipal supplier of water in the Yakima River basin, serving a population of approximately 16,700. They also have two major users of water: Central Washington University (207 million gallons per year) and Twin City Foods (112 million gallons per year). Their source of water comes from groundwater wells (Gray & Osborne 2007).
Water Use Estimates Water use estimates are based on previous average water use (2000 to 2005) and population. The projected population is assumed to equal 45 percent of the Office of Financial Management projections for Kittitas County. Table 18 presents the estimates for the current and future population, total water use, and water use per capita. Water use estimates assume that the per capita usages will not significantly change (Gray & Osborne 2007). It is assumed the estimates do not include any conservation measures described in Section 6.1.2.2.
Table 18 City of Ellensburg Water Use Estimates
Year Total
Population
Total Average Daily Demand
(MGD)
Estimated Number of Total
ERUs ERU Demand
(gpd/ERU)
Per Capita Demand
(gpd/person) 2005 16,700 3.61 8,535 423 216 2010 18,466 4.92 11,631 423 266 2025 23,765 6.33 14,965 423 266
Note: gpd = gallons per day
Source: Gray & Osborne 2007
Technical Report on the Enhanced Water Conservation Alternative Yakima River Basin Water Storage Feasibility Study December 2007 21

The estimated demands are slightly lower than the forecast contained in the Yakima River Basin Storage Alternatives Appraisal Assessment (Reclamation 2006). Their forecast for the City of Ellensburg in 2020 is 6.32 MGD, compared to 6.33 MGD in Table 18 for 2025 (5 years later than the Reclamation forecast).
Conservation Measures The City of Ellensburg has 15 improvements listed on their capital improvement schedule. These improvements are listed as the current water conservation plan. Improvements will conserve water by reducing leaks and unaccounted for water. Water savings and cost estimates are not provided for individual measures; instead, the conservation measures have an overall estimated water savings of 1 percent per year over 10 years (Gray & Osborne 2007). Table 19 presents each improvement, the estimated cost, and the year the project is planned to be implemented.
Table 19 City of Ellensburg Capital Improvement Plan
Project Cost ($) Year of Implementation New well no. 1 1,000,000 2007 New well no. 2 1,000,000 2008 New well no. 3 1,000,000 2008 New well no. 4 1,000,000 2009 Phenning Road water main construction 650,000 2007 Walnut Street water main replacement 254,000 2010 Seattle/Manitoba Avenue water main replacement
306,000 2011
John Wayne Trail water main construction
65,000 2008
Wenas Road water main replacement 110,000 2012 or later Bull/Berry Road water main construction 1,000,000 2012 or later Transmission main inspection 25,000 2007 Transmission main valve rehabilitation 100,000 2009 Oversizing pipe fund 50,000 per year Every year Pipe replacement program 100,000 per year Every year Bulk water fill stations (4) 30,000 each 2008 to 2011 (1 each year) Source: Gray & Osborne 2007
Conservation Effects on Future Water Use The conservation measures will result in water savings that can allow for additional service using the same amount of water. Table 20 compares the estimated future water use and ERU demand with and without conservation.
Technical Report on the Enhanced Water Conservation Alternative Yakima River Basin Water Storage Feasibility Study December 2007 22

Table 20 City of Ellensburg Future Water Use Comparison
Year
Average Demand ERU Demand Per Capita Demand
No Conservation
(MGD)
With Conservation
(MGD)
No Conservation
(gpd/ERU)
With Conservation
(gpd/ERU)
No Conservation (gpd/person)
With Conservation (gpd/person)
2010 4.92 4.72 423 406 266 256 2025 6.33 5.79 423 387 266 244
Note: gpd = gallons per day
The estimated reduction in water use with conservation measures is 0.54 MGD, or approximately 600 acre-feet/year (8.5% reduction).
City of Sunnyside The City of Sunnyside is the fifth-largest municipal supplier of water in the Yakima River basin, serving a population of approximately 15,000. They also have two major users of water: Westfarm Foods (96 million gallons per year) and Independent Food Processors (43 million gallons per year). Their source of water comes from groundwater wells (HDR-EES 2005).
Water Use Estimates Water use estimates are based on previous average water use (1997 to 2002) and population. The projected population is assumed to grow at a rate of 2.5 percent annually. ERUs were calculated based on meter counts and the Washington State Department of Health Water System Design Manual. The ERUs were assumed to increase by 2.5 percent annually. Table 21 presents the estimates for the current and future population, total water use, and water use per capita. Water use estimates assume that the per capita usages will not significantly change (HDR-EES 2005). It is assumed the estimates do not include any conservation measures described in Section 6.1.3.2.
Table 21 City of Sunnyside Water Use Estimates
Year Total
Population
Total Average Daily Demand
(MGD)
Estimated Number of Total
ERUs ERU Demand
(gpd/ERU)
Per Capita Demand
(gpd/person) 2005 15,024 3.00 4,966 604 200 2010 16,998 3.40 5,618 605 200 2024 24,018 4.80 7,938 605 200
Note: gpd = gallons per day
Source: HDR‐EES 2005
The estimated demands are higher than the forecast contained in the Yakima River Basin Storage Alternatives Appraisal Assessment (Reclamation 2006). Reclamation’s forecast for the City of Sunnyside in 2020 is 3.8 MGD, compared to 4.8 MGD in Table 21 for 2024 (4 years later than the Reclamation forecast).
Technical Report on the Enhanced Water Conservation Alternative Yakima River Basin Water Storage Feasibility Study December 2007 23
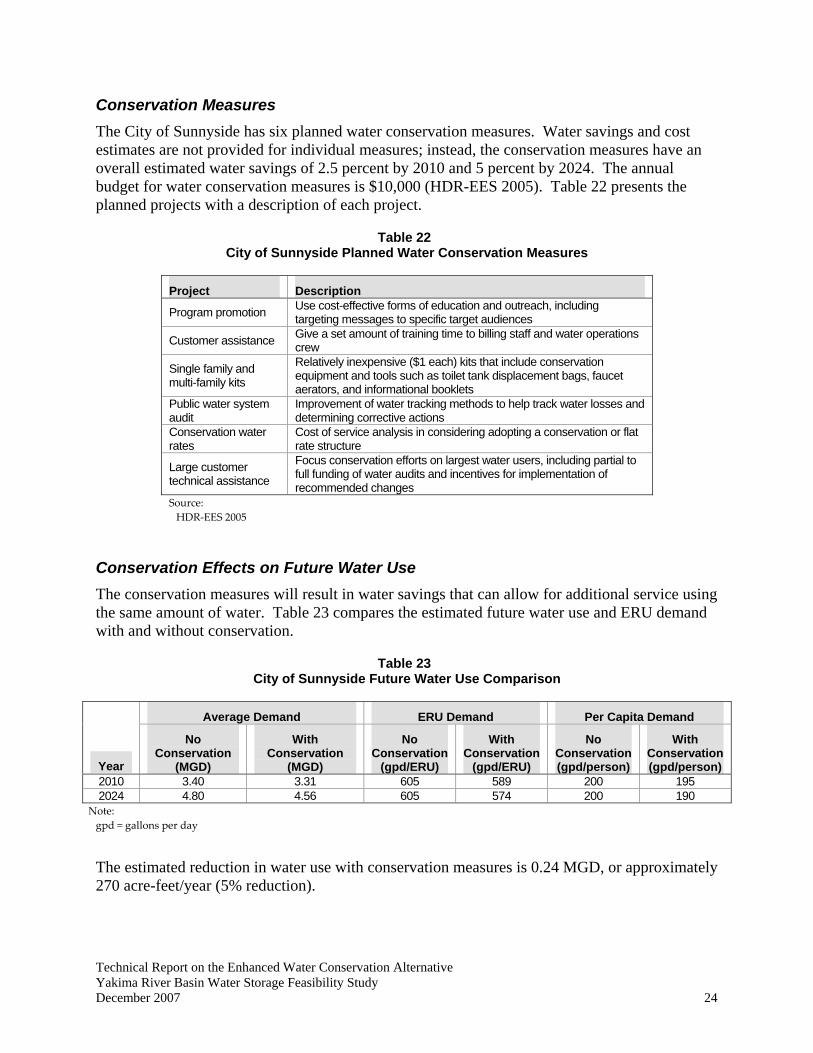
Conservation Measures The City of Sunnyside has six planned water conservation measures. Water savings and cost estimates are not provided for individual measures; instead, the conservation measures have an overall estimated water savings of 2.5 percent by 2010 and 5 percent by 2024. The annual budget for water conservation measures is $10,000 (HDR-EES 2005). Table 22 presents the planned projects with a description of each project.
Table 22 City of Sunnyside Planned Water Conservation Measures
Project Description
Program promotion Use cost-effective forms of education and outreach, including targeting messages to specific target audiences
Customer assistance Give a set amount of training time to billing staff and water operations crew
Single family and multi-family kits
Relatively inexpensive ($1 each) kits that include conservation equipment and tools such as toilet tank displacement bags, faucet aerators, and informational booklets
Public water system audit
Improvement of water tracking methods to help track water losses and determining corrective actions
Conservation water rates
Cost of service analysis in considering adopting a conservation or flat rate structure
Large customer technical assistance
Focus conservation efforts on largest water users, including partial to full funding of water audits and incentives for implementation of recommended changes
Source: HDR‐EES 2005
Conservation Effects on Future Water Use The conservation measures will result in water savings that can allow for additional service using the same amount of water. Table 23 compares the estimated future water use and ERU demand with and without conservation.
Table 23 City of Sunnyside Future Water Use Comparison
Year
Average Demand ERU Demand Per Capita Demand
No Conservation
(MGD)
With Conservation
(MGD)
No Conservation
(gpd/ERU)
With Conservation
(gpd/ERU)
No Conservation (gpd/person)
With Conservation (gpd/person)
2010 3.40 3.31 605 589 200 195 2024 4.80 4.56 605 574 200 190
Note: gpd = gallons per day
The estimated reduction in water use with conservation measures is 0.24 MGD, or approximately 270 acre-feet/year (5% reduction).
Technical Report on the Enhanced Water Conservation Alternative Yakima River Basin Water Storage Feasibility Study December 2007 24

City of Grandview The City of Grandview is the sixth-largest municipal supplier of water in the Yakima River basin, serving a population of approximately 8,100. They also have several major industrial users of water, including J.M. Smucker Co.; Stimson Lane; Shonan (USA), Inc.; Snokist Growers; and Welch Foods. The City of Grandview’s source of water comes from groundwater wells (HLA 2002).
Water Use Estimates Water use estimates are based on previous average water use (1995 to 1999), the number of services, and population. The projected population is assumed to grow at a rate of 2.5 percent annually. Table 24 presents the estimates for the current and future population, total water use, and water use per capita. Water use estimates assume that the usages per service will not significantly change (HLA 2002). It is assumed the estimates do not include any conservation measures described in Section 6.1.4.2.
Table 24 City of Grandview Water Use Estimates
Year Total
Population
Total Average Daily Demand
(MGD)
Estimated Number of Total
ERUs ERU Demand
(gpd/ERU)
Per Capita Demand
(gpd/person) 1998 8,120 1.77 5,068 349 218 2011 10,241 2.61 7,484 349 255 2024 12,314 3.08 8,820 349 250
Note: gpd = gallons per day
Source: HLA 2002
The estimated demands are lower than the forecast contained in the Yakima River Basin Storage Alternatives Appraisal Assessment (Reclamation 2006). Reclamation’s forecast for the City of Grandview in 2020 is 4.8 MGD, compared to 3.1 MGD in Table 24 for 2024 (4 years later than the Reclamation forecast).
Conservation Measures The City of Grandview has eight planned water conservation measures. Water savings and cost estimates are not provided for individual measures; instead, the conservation measures have an estimated water savings in residential use of 5 percent (HLA 2002). Table 25 presents the planned projects with a description of each project.
Technical Report on the Enhanced Water Conservation Alternative Yakima River Basin Water Storage Feasibility Study December 2007 25
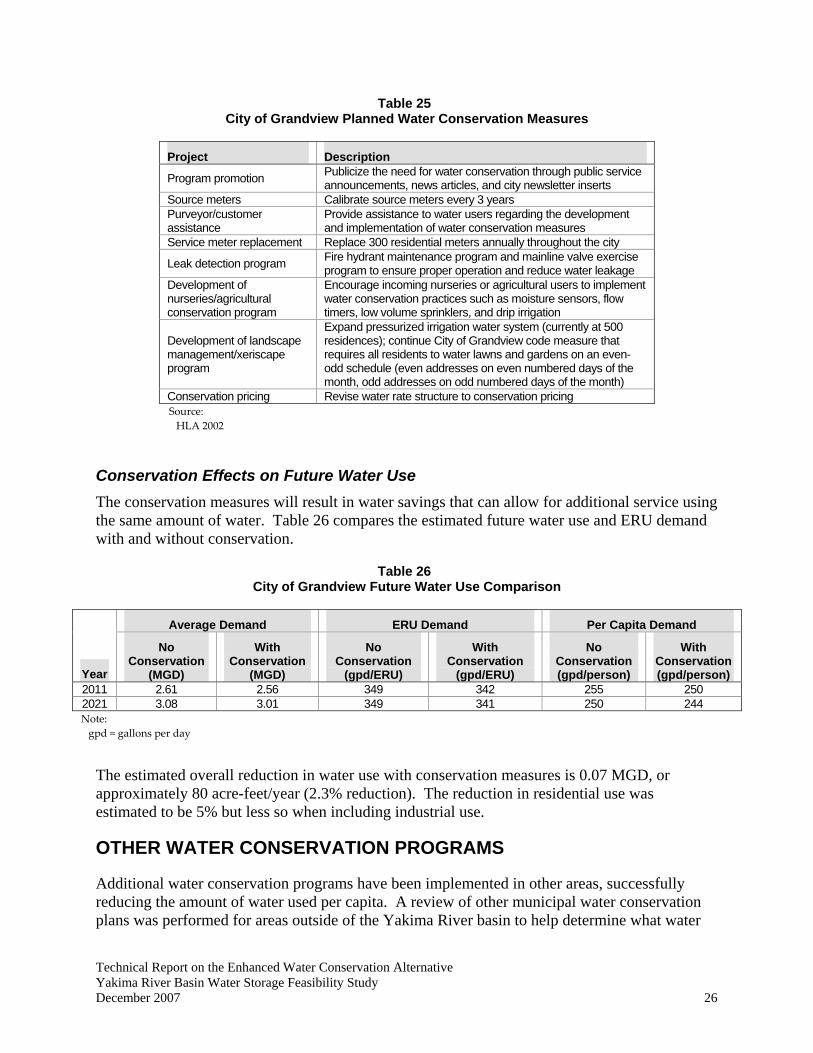
Table 25 City of Grandview Planned Water Conservation Measures
Project Description
Program promotion Publicize the need for water conservation through public service announcements, news articles, and city newsletter inserts
Source meters Calibrate source meters every 3 years Purveyor/customer assistance
Provide assistance to water users regarding the development and implementation of water conservation measures
Service meter replacement Replace 300 residential meters annually throughout the city
Leak detection program Fire hydrant maintenance program and mainline valve exercise program to ensure proper operation and reduce water leakage
Development of nurseries/agricultural conservation program
Encourage incoming nurseries or agricultural users to implement water conservation practices such as moisture sensors, flow timers, low volume sprinklers, and drip irrigation
Development of landscape management/xeriscape program
Expand pressurized irrigation water system (currently at 500 residences); continue City of Grandview code measure that requires all residents to water lawns and gardens on an even-odd schedule (even addresses on even numbered days of the month, odd addresses on odd numbered days of the month)
Conservation pricing Revise water rate structure to conservation pricing Source: HLA 2002
Conservation Effects on Future Water Use The conservation measures will result in water savings that can allow for additional service using the same amount of water. Table 26 compares the estimated future water use and ERU demand with and without conservation.
Table 26 City of Grandview Future Water Use Comparison
Year
Average Demand ERU Demand Per Capita Demand
No Conservation
(MGD)
With Conservation
(MGD)
No Conservation
(gpd/ERU)
With Conservation
(gpd/ERU)
No Conservation (gpd/person)
With Conservation (gpd/person)
2011 2.61 2.56 349 342 255 250 2021 3.08 3.01 349 341 250 244 Note: gpd = gallons per day
The estimated overall reduction in water use with conservation measures is 0.07 MGD, or approximately 80 acre-feet/year (2.3% reduction). The reduction in residential use was estimated to be 5% but less so when including industrial use.
OTHER WATER CONSERVATION PROGRAMS
Additional water conservation programs have been implemented in other areas, successfully reducing the amount of water used per capita. A review of other municipal water conservation plans was performed for areas outside of the Yakima River basin to help determine what water
Technical Report on the Enhanced Water Conservation Alternative Yakima River Basin Water Storage Feasibility Study December 2007 26

savings may be possible. Several water districts in California and Nevada were reviewed because of their similar climates to the Yakima River basin.
Southern Nevada Water Authority The Southern Nevada Water Authority (SNWA) is an entity formed by an agreement between seven water and wastewater agencies in Southern Nevada. Combined, they provide water and wastewater services to approximately 1.6 million people. Several water conservation efforts were implemented in order to achieve a goal of 25 percent conservation by 2010 compared to a baseline usage in 1990 (SNWA 2004).
Annual Water Use Water use in a given year is most significantly related to population, weather, and economic indicators in the Southern Nevada valley. From 1999 to 2003, the actual annual water use in the SNWA was found (with conservation). The corresponding conservation percentage and estimated use without conservation was then determined. The results are presented in Table 27.
Table 27 SNWA Water Use Comparison
Year
Average Demand Water Savings
(%) Estimated Per Capita Demand
(1990 Baseline: 375 gpd/person) With Conservation
(MGD) No Conservation
(MGD) 1999 383 460 16.8 312 2000 410 490 16.5 313 2001 428 495 13.5 324 2002 446 534 16.4 314 2003 426 554 23.1 288 Note: gpd = gallons per day
Source: SNWA 2004
Conservation Measures The Five-year Conservation Plan 2004-2009 (SNWA 2004) listed several conservation programs that were implemented to achieve this level of water savings and will continue. The goal of the SNWA is an additional 13% decrease in water use by 2010 and a per capita water demand reduction to 250 gpd/person. A description of each measure follows.
Water Rate Setting Purveyors in SNWA all use a multi-tier increasing block rate structure. These structures give the heaviest water users incentive to reduce water use.
Water Smart Landscapes Program This program offers a rebate to residents that convert turf grass to xeric and/or drought-tolerant plant material. A water smart landscape is expected to save 55.8 gallons per square foot annually compared with a turf lawn. The current rebate offered is $1.00 per square foot of conversion. In 2004, $21 million was available for the program. In 2005, the appropriation for this program Technical Report on the Enhanced Water Conservation Alternative Yakima River Basin Water Storage Feasibility Study December 2007 27
was $31.93 million. Overall, the program’s estimated savings is 3.8 billion gallons per year (average 10.4 MGD).
Irrigation Clock Rebate Program This program offers a rebate to residents that upgrade landscape irrigation controllers to models that can increase water efficiency. These technologies are found to have the potential of reducing water use by 10 to 20 percent through efficient scheduling with minimal user oversight. Specific costs and water savings are not described.
Water Efficient Technologies Program This program pays incentives to fund capital improvement projects that permanently increase water efficiency. In order to be cost effective, a minimum of 1 million gallons of use annually has to be reduced. This program can be used for consumptive or non-consumptive use; double the incentive is paid for consumptive use to promote this type of use reduction. Since its inception, the program has paid $258,000 for projects estimated to conserve 130 million gallons per year (0.36 MGD).
Water Waste Regulations This policy prohibits the waste of water by setting a fee structure that increases depending on meter size, number of violations, and drought conditions. Watering days are also assigned depending on the season and customer location. In the winter, only one watering day is allowed per week. In the spring and fall, three watering days are allowed weekly. In the summer, people are allowed to water any day, but watering is not allowed from 11 a.m. to 7 p.m.
Water Budgets Large water use customers (currently only golf courses) are given water budgets instead of watering days. Currently golf courses are given a budget of 6.5 acre-feet per irrigated acre (average 5,800 gallons per day per irrigated acre). If they exceed the budget, the rate jumps to 300 to 900 percent of the highest cost of water used within the budget. This policy expects to conserve approximately 10 percent of the total golf industry’s water use.
Development Codes and Policies Additional policies are set for new developments in order to limit landscape water demand. Some examples include not allowing ornamental turfgrass for any new commercial, industrial, or institutional landscape; limiting size and placement of turf at new residential homes; and requiring a water efficiency plan for all new resorts for approval.
Education and Public Outreach This program is a campaign to educate water users on the need for conservation, provide tips on how to conserve, and give customers access to experts that can help with water reduction at the customers’ properties. Some efforts include water-efficient demonstration gardens, conservation publications sent to all customers, youth education programs, conservation videos, and descriptions of sample water-efficient landscape designs.
Technical Report on the Enhanced Water Conservation Alternative Yakima River Basin Water Storage Feasibility Study December 2007 28
Seattle Public Utilities Seattle Public Utilities (SPU) serves more than 1 million customers in their retail and wholesale service area and has installed several conservation measures. They have also done detailed studies on individual measures relating to cost and savings. SPU currently has the 1 Percent Program, a water conservation program implemented in 2000 that strives to reduce per capita demand by 1 percent each year through 2010. This goal, in combination with new codes, price impacts, and system savings, will result in a decrease in total water demand despite having a projected population increase of 10 percent through 2010 (SPU 2006). A description of water use compared with population, as well as conservation measures, follows.
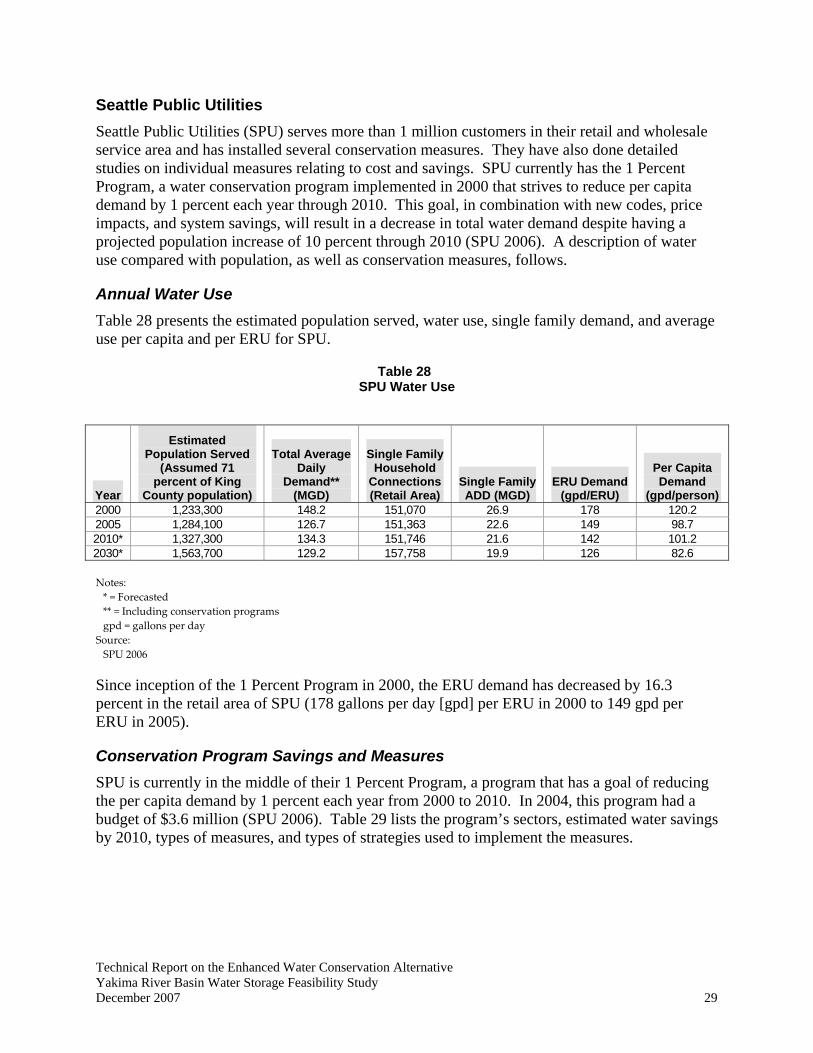
Annual Water Use Table 28 presents the estimated population served, water use, single family demand, and average use per capita and per ERU for SPU.
Table 28 SPU Water Use
Year
Estimated Population Served
(Assumed 71 percent of King
County population)
Total Average Daily
Demand** (MGD)
Single Family Household
Connections (Retail Area)
Single Family ADD (MGD)
ERU Demand (gpd/ERU)
Per Capita Demand
(gpd/person) 2000 1,233,300 148.2 151,070 26.9 178 120.2 2005 1,284,100 126.7 151,363 22.6 149 98.7 2010* 1,327,300 134.3 151,746 21.6 142 101.2 2030* 1,563,700 129.2 157,758 19.9 126 82.6
Notes: * = Forecasted ** = Including conservation programs gpd = gallons per day
Source: SPU 2006
Since inception of the 1 Percent Program in 2000, the ERU demand has decreased by 16.3 percent in the retail area of SPU (178 gallons per day [gpd] per ERU in 2000 to 149 gpd per ERU in 2005).
Conservation Program Savings and Measures SPU is currently in the middle of their 1 Percent Program, a program that has a goal of reducing the per capita demand by 1 percent each year from 2000 to 2010. In 2004, this program had a budget of $3.6 million (SPU 2006). Table 29 lists the program’s sectors, estimated water savings by 2010, types of measures, and types of strategies used to implement the measures.
Technical Report on the Enhanced Water Conservation Alternative Yakima River Basin Water Storage Feasibility Study December 2007 29

Table 29 SPU 1 Percent Program Sectors, Savings, Measures, and Strategies
Sector
Annual Average
Savings by 2010 (MGD) Types of Measures Types of Strategies
Residential indoor 6.90 Replace toilets, faucets, and showers;
fix leaks; and change behaviors Incentives and promotion to accelerate replacement; and behavior messaging
Residential landscape 0.93
Reduce lawn watering; improve irrigation performance; and change lawn and garden practices
Media outreach; technical materials; irrigation efficiency incentives; and landscape industry partnerships
Commercial/ Process/ Domestic
3.04 Upgrade toilets and equipment for cooling; and improve cooling performance
Technical assistance and financial incentives
Commercial landscape 0.13 Upgrade equipment and improve
scheduling and maintenance Assessments and technical assistance; and financial incentives
Source: SPU 2006
Conservation Potential Assessment Analysis In 2006, SPU had a water conservation potential assessment (CPA) completed for water conservation commitments made through their 1 Percent Program. The CPA estimated the cost to the utility and the annual savings for individual measures through 2010. For this analysis, it was assumed that the SPU would pay 50 percent of the total cost, since the 1 Percent Program generally pays a portion of the direct cost. The other portion is expected to be paid by the customer (SPU 2006). Table 30 is a summarized list of measure names, the number of measures, annual savings, and the utility average annual cost.
Table 30 Summary of CPA Measure Names, Savings, and Utility Cost
Measure Name Number of Measures
Annual Savings (MGD)
Utility Average Annual Cost ($)
Air cooling 1 0.1083 58,400 Car wash 3 0.0565 45,781 Clothes washers 7 1.0273 830,285 Cooling tower 1 0.0117 12,000 Dishwashers 4 0.2957 179,916 Disposal use 3 0.3076 49,000 Faucet aerator 3 0.2747 91,688 Faucet flow 1 0.0300 15,900 Faucet use 7 0.2721 71,711 Food preparation 1 0.2770 10.833 Laundry wash 1 0.0122 20,500 Lawn dormant 5 0.6552 117,499 Leak reduction 4 0.4329 165,703 Process water 2 0.0432 45,000 Shower use 2 0.4936 57,500 Showerheads 6 0.4319 184,565 Sidewalk cleaning 1 0.0081 13,500 Swimming pool use 2 0.0696 28,500 Toilet 5 1.9477 2,043,676 Urinal 3 0.1063 108,345 Source: SPU 2006
Technical Report on the Enhanced Water Conservation Alternative Yakima River Basin Water Storage Feasibility Study December 2007 30

The total water savings for these 62 measures is estimated to be 6.81 MGD by 2010. At a 50 percent cost-share by SPU, these measures are expected to cost $4,150,303 annually. Utility costs include overhead, marketing, and rebates. When comparing indoor and outdoor water savings, 88 percent of the water savings realized from the measures listed is from a reduction in indoor use. When comparing residential and non-residential water savings, 77 percent of the water savings from the listed measures are due to a reduction in residential use (SPU 2006).
In addition, the CPA presented additional savings measures for when the 1 Percent Program ends in 2010. The CPA listed a total of 115 potential measures. These measures that run from 2011 to 2030 have an estimated annual water savings of 34.17 MGD by 2030. The measures have an estimated average cost of $16,315,798 annually. This cost assumed all of the costs (overhead, marketing, and rebates) are paid by SPU (SPU 2006).
Contra Costa Water District The Contra Costa Water District (CCWD) serves water to approximately 510,000 people; 46 industries; and 50 agricultural users in north, central, and east Contra Costa County, California. Climate within the CCWD usually has hot, dry summers and cool, wet winters. Average precipitation ranges from 13 to 22 inches. CCWD has implemented water conservation programs since 1988. Even though the population has increased by 37 percent since 1985, the total current water use within the district is below mid-1980s (pre-drought) levels (CCWD 2005). This district is presented as an example of successful past conservation efforts. A description of past and current water use, conservation projects, and cost estimates follows.
Annual Water Use Table 31 presents the annual water use, total number of equivalent residential units, and average demand per ERU for past and present years for the CCWD.
Table 31 Annual Water Demand for CCWD
Year Estimated Population
Total Daily Average
Deliveries (MGD)
Single Family Average Demand
(MGD)
Single Family Household
Connections
Per Capita Demand
(gpd/person) 1990 367,131 125.31 17.42 48,360 341 1995 403,776 101.52 15.23 49,722 251 2000 429,760 119.33 17.41 50,400 278 2004 500,000 128.33 20.03 52,313 257
Sources: CCWD 2005 CCWD 2000 CCWD 1995
Conservation Program and Costs Eighteen programs are have been implemented by CCWD since 1988. Table 32 lists these programs and their 2004 savings in million gallons per day. The programs have helped the district reduce per capita
Technical Report on the Enhanced Water Conservation Alternative Yakima River Basin Water Storage Feasibility Study December 2007 31

Table 32 CCWD Water Conservation Programs and 2004 Estimated Savings
Program Name 2004 Estimated Savings (MGD)
Single family (SF) surveys 0.19 Multi-family (MF) surveys 0.22 Commercial and institutional (CII) surveys 0.41
Landscape surveys 0.35 SF showerheads 0.05 MF showerheads 0.02 Residential free ultra low flow toilets (ULFTs) 0.89
CII ULFTs 0.05 SF washers 0.15 CII washers 0.02 Pre-rinse nozzles 0.09 CII low flow urinals 0.002 CII low flow faucets 0.001 “Smart” sprinkler timers 0.02 Standard sprinkler timers 0.01 Drip retrofit 0.004 Rain sensors 0.002 Sprinklers replaced 0.002
Total 2.49 Source: CCWD 2005
Budgets for water conservation for the CCWD from 1999-2003 are presented in Table 33.
Table 33 CCWD Water Conservation Budget
Year Budget ($) 1999 1,021,134 2000 1,034,247 2001 1,096,302 2002 1,090,453 2003 1,094,568
Sources: CCWD 2000 CCWD 2002 CCWD 2003
West Basin Municipal Water District The West Basin Municipal Water District (West Basin) serves over 850,000 people in 17 cities and several unincorporated areas of Los Angeles County, California. This area has an average rainfall of 12.13 inches. In the past 25 years, the population has increased by 21 percent, but the water demand has only increased by 13.1 percent (West Basin 2005b). A description of past and current water use and conservation projects follows.
Technical Report on the Enhanced Water Conservation Alternative Yakima River Basin Water Storage Feasibility Study December 2007 32

Annual Water Use Table 34 presents the annual water use, total number of equivalent residential units, and average demand per ERU for past and present years for West Basin.
Table 34 West Basin Annual Water Use
Estimated Total Average
Demand Per Capita Demand
Year Population (MGD) (gpd/person) 1980 707,500 145.1 205 2005 852,800 164.1 192 Source: West Basin 2005b
Conservation Program and Costs Since 1990, West Basin has implemented 14 programs for water conservation. These programs and estimated annual water savings (if stated) are presented in Table 35.
Table 35 West Basin Water Conservation Programs and Estimated Annual Savings
Program Name
Estimated Annual Savings
(MGD) Water survey programs Not stated Residential plumbing retrofit 0.939 System water audits Not stated Metering with commodity rates Not stated Large landscape conservation Not stated High-efficiency washing machine rebates 0.010
Public information programs Not stated School education programs Not stated CII conservation programs Not stated Wholesale agency programs Not stated Conservation pricing Not stated Water conservation coordinator Not stated
Water waste prohibition Not stated Residential ULFT replacement 0.410 Source: West Basin 2005b
Although many of the programs do not have specific savings stated, the overall annual savings due to conservation is estimated to be 12.9 MGD in 2005 (West Basin 2005b).
Water conservation is combined with groundwater monitoring in the expense list of West Basin (West Basin 2005a). These expenditures for 1996-2005 are listed in Table 36.
Technical Report on the Enhanced Water Conservation Alternative Yakima River Basin Water Storage Feasibility Study December 2007 33

Table 36 West Basin Water Conservation and Groundwater Monitoring Expenditures
Year Budget ($) 1996 330,000 1997 266,000 1998 666,000 1999 841,000 2000 1,072,000 2001 960,000 2002 1,367,000 2003 1,743,000 2004 1,794,000 2005 2,145,000
Source: West Basin 2005a
SUMMARY OF MUNICIPAL CONSERVATION POTENTIAL AND COSTS
Potential water savings from current municipal water conservation activities for the cities of Yakima, Ellensburg, Sunnyside, and Grandview in the Yakima River basin were reviewed. The estimates of potential water savings range from 2.3% to 31% of total demand and average over 10% of total demand. Those potential water savings were not accounted for in Reclamation’s estimate of future municipal and domestic water needs. It was also found that the future demand estimates for the cities of Yakima, Ellensburg and Grandview is less than shown in Reclamation’s estimates, most likely because the Water System Plans the demands were obtained from were more up-to-date than the information used to develop Reclamation’s estimates. However, the estimate of future demand for the City of Sunnyside was greater than Reclamation’s estimate. The difference between the estimates for all four cities (including future conservation savings) and Reclamation’s estimate is approximately 7,400 acre-feet/year for 2020. Reclamation’s estimate of increased demand in 2020 for the Yakima River basin is 38,000 acre-feet/year, the revised estimates of demands for the four cities would reduce that to 30,600 acre-feet/year.
Additional water conservation savings is possible within other community water systems and for single-family domestic water users. Experience with conservation plans from Washington State (City of Seattle) and from other water systems in the arid Southwest U.S. show that significant water savings can result with investments in conservation activities. The water conservation programs reviewed have achieved a 10-20% reduction in water use and have plans to save more. The costs of the programs vary, with the more expensive and aggressive programs replacing lawns and plumbing fixtures. The City of Seattle’s water conservation program that has a goal of achieving a 1% reduction in water use every year costs about $3 per person served per year. That cost covers one-half of the costs of the program. A second program that will start in 2011 also has a goal of achieving a 1% reduction in water use but will be paid in total by the City. The estimated costs for that program are about $10 per person served per year.
An aggressive program of water conservation would reduce the municipal and domestic demands in the Yakima River basin. It is our opinion that overall water savings of 20% is possible. If a 20% water savings were applied to both the existing and future estimated demands published by Reclamation, the total additional demand for the year 2050 would be reduced to from 82,000 Technical Report on the Enhanced Water Conservation Alternative Yakima River Basin Water Storage Feasibility Study December 2007 34

acre-feet/year to 45,300 acre-feet/year. That estimate was obtained by taking 80% of Reclamation’s estimated 2050 demand (186,000 acre-feet/year) and subtracting the 2000 demands of 103,465 acre-feet/year.
The estimated costs for that program, using a range of $6-10 per person/year, would be $3-5 million/year. That estimate is based upon an estimated 2050 population of over 500,000 people in the Yakima River basin. A comprehensive and coordinated program on the scale of the City of Seattle’s would be needed to reach all water users in the basin and effect the large savings described above.
Technical Report on the Enhanced Water Conservation Alternative Yakima River Basin Water Storage Feasibility Study December 2007 35

Technical Report on the Enhanced Water Conservation Alternative Yakima River Basin Water Storage Feasibility Study December 2007 36
REFERENCES CH2M Hill. 1994. South Naches Irrigation District Comprehensive Water Conservation Plan.
February.
CH2M Hill. 1995a. Naches-Selah Irrigation District Comprehensive Water Conservation Plan.
CH2M Hill. 1995b. Outlook Irrigation District Comprehensive Water Conservation Plan. November.
CH2M Hill. 1996. Kiona Irrigation District Comprehensive Water Conservation Plan. February.
Contra Costa Water District (CCWD). 1995. Urban Water Management Plan. December.
CCWD. 2000. Urban Water Management Plan. December.
CCWD. 2002. Conservation Annual Report ’02.
CCWD. 2003. Conservation Annual Report ’03.
CCWD. 2005. Urban Water Management Plan. December.
Crowley, Mark. 2006. Personal correspondence over email. Kittitas County Conservation District.
DOH – See Washington State Department of Health
Gray & Osborne, Inc., Consulting Engineers (Gray & Osborne). 2007. City of Ellensburg Water System Comprehensive Plan. February.
Harter, Justin. 2006. Personal correspondence over email. Naches-Selah Irrigation District.
HDR-EES. 2005. City of Sunnyside Comprehensive Water System Plan Update. January.
Huibregtse Louman Associates, Inc (HLA). 2002. City of Grandview Water Comprehensive Plan. April.
Montgomery Water Group (MWG). 2000. Yakima-Tieton Irrigation Project Water Conservation Plan. June.
Montgomery Watson Harza (MWH). 2002. Water Conservation Study for Manastash Creek Water Users. December.
Natural Resources Consulting Engineers (NRCE). 1999. Irrigation Water Conservation and Management Plan for the Wapato Irrigation Project. May.
Technical Report on the Enhanced Water Conservation Alternative Yakima River Basin Water Storage Feasibility Study December 2007 37
SCM Consultants. 1999. Kennewick Irrigation District Water Conservation Plan. June.
SCM Consultants. 2001. Facsimile; Subject: Yakima River Basin Watershed Plan. August 15.
Seattle Public Utilities (SPU). 2006. 2007 Water System Plan. November.
Southern Nevada Water Authority (SNWA). 2004. Five-year Conservation Plan 2004-2009. August.
SNWA. 2006. 2006 Water Resource Plan.
SNWA. 2007. Drought Plan. April.
Thomas E. Coleman, P.E. Consulting Services. 2004. City of Yakima Water System Plan Update. March.
Tobin, Mike. 2006. Personal correspondence over email. North Yakima Conservation District.
U.S. Bureau of Reclamation (USBR). 2006.Yakim a River Basin Storage Alternatives Appraisal Assessment A component of Yakima River Basin Water Storage Feasibility Study, Washington, Technical Series No TS-YSS-8. May.
U.S. Bureau of Reclamation. 2007. Construction Cost Trends. http://www.usbr.gov/pmts/estimate/cost_trend.html. Accessed December 7, 2007.
U.S. Bureau of Reclamation, 2008. Yakima River Basin Water Storage Feasibility Study Draft Planning Report/Environmental Impact Statement. January.
Washington State Department of Health (DOH). 2007. Water Use Efficiency Guidebook. Publication No. 331-375. July.
West Basin Municipal Water District (West Basin). 2005a. Comprehensive Annual Financial Report. June.
West Basin. 2005b. Urban Water Management Plan.
Technical Report on the Enhanced Water Conservation Alternative Yakima River Basin Water Storage Feasibility Study December 2007 38
APPENDIX A
YAKIMA RIVER BASIN WATER CONSERVATION PROJECTS


Yakima River Basin Water Conservation Projects
Project Number Entity Project Type River or Creek Yakima or
Naches River Mile Diversion
Estimated Water Savings (ac-ft/yr)
Total Project Cost (2007 $)
Cost per Acre-foot
Saved Project Description Source
1 Kittitas
Reclamation District
Lining/Piping Yakima 202.5
2,000
$ 3,110,738 $ 1,555 Replace leaking areas of Main Canal with new concrete liner.
Crowley, Mark. 2006. Personal correspondence. Kittitas County Conservation District.
2 Westside Irrigation Lining/Piping Yakima 166.1
300
$ 228,121 $ 760 Project will pipe 5,280 feet of canal. Crowley, personal correspondence 2006
3 Westside Irrigation Lining/Piping Yakima 166.1
300
$ 228,121 $ 760 Project will pipe 5,280 feet of canal. Crowley, personal correspondence 2006
4 Westside Irrigation On-farm Conservation Yakima 166.1
3,300
$ 8,554,530 $ 2,592 Conversion of 3,300 acres of rill irrgation to sprinkler irrigation. Crowley, personal correspondence 2006
5 Ellensburg Water Company On-farm Conservation Yakima 161.3
7,000
$ 18,145,973 $ 2,592 Conversion of 7,000 acres of rill irrgation to sprinkler irrigation. Crowley, personal correspondence 2006
6 Ellensburg Water Company On-farm Conservation Yakima 161.3
100
$ 259,228 $ 2,592 This project would convert 100 acres of rill irrigated hay and crop land to sprinkler irrigation. Crowley, personal correspondence 2006
7 Cascade Irrigation District Tailwater Reuse Yakima 160.3
2,088
$ 207,383 $ 164 Project would pump return flows from Johnson Drain back into the canal for reuse. Crowley, personal correspondence 2006
8 Cascade Irrigation District Other Yakima 160.3 combined with
Project #7 $ 134,799 Project would install a VFD on two of the eight pumps at the head end of the canal system. Crowley, personal correspondence 2006
9 Cascade Irrigation District On-farm Conservation Yakima 160.3
9,000
$ 23,330,537 $ 2,592 Conversion of 9,000 acres of rill irrgation to sprinkler irrigation. Crowley, personal correspondence 2006
10 Bull Canal Company Lining/Piping Yakima 153
384
$ 326,628 $ 851 Project will pipe 1,800 feet of canal. Crowley, personal correspondence 2006
11 Bull Canal Company Lining/Piping Yakima 153
255
$ 233,305 $ 915 Project will pipe 3,000 feet of canal. Crowley, personal correspondence 2006
12 Bull Canal Company On-farm Conservation Yakima 153
680
$ 1,762,752 $ 2,592 Conversion of 680 acres of rill irrgation to sprinkler irrigation. Crowley, personal correspondence 2006
13 Union Gap Irrigation District Lining/Piping Yakima 105
200
$ 518,456 $ 2,592 Piping a ditch Co to the current points of use (approx 4 miles).
Tobin, Mike. 2006. Personal correspondence. North Yakima Conservation District.
14 Wapato Irrigation Project
Automation/Irrigation Water Mgmt Yakima 106.7
14,700
$ 7,270,588 $ 495
Equip all turnouts with adequate water measurement devices; water savings due to reduced deliveries;
approximately 3,500 water measuring devices to be installed.
Natural Resources Consulting Engineers (NRCE). 1999. Irrigation Water Conservation and Management Plan for
the Wapato Irrigation Project. May.
15 Wapato Irrigation Project Storage/Re-reg Reservoirs Yakima 106.7
700
$ 571,021 $ 816 Construct 370 ac-ft capacity reservoir in Bench Unit; water savings due to water recapture. NRCE 1999
16 Wapato Irrigation Project On-farm Conservation Yakima 106.7
32,500
$ 23,391,719 $ 720 Voluntary incentive-based program to provide assistance
to growers for improvements to irrigation systems and land.
NRCE 1999
17 Wapato Irrigation Project Lining/Piping Yakima 66.7
4,600
$ 6,315,205 $ 1,373 Line Satus East and Satus West Canals with concrete; water savings due to decrease in seepage. NRCE 1999
18 Wapato Irrigation Project Lining/Piping Yakima 106.7
3,400
$ 6,171,052 $ 1,815 Concrete line Lateral 4 Extension and line or pipe corresponding sub-laterals; water savings due to
decrease in seepage. NRCE 1999
19 Wapato Irrigation Project Lining/Piping Yakima 106.7
5,100
$ 9,412,336 $ 1,846 Cement line Track Lateral and replace or repair water structures; water savings due to decrease in seepage. NRCE 1999
20 Wapato Irrigation Project Lining/Piping Yakima 106.7
1,300
$ 2,611,819 $ 2,009 Improve Spencer Lateral in Wapato Unit; 10.5 miles. NRCE 1999
21 Wapato Irrigation Project Lining/Piping Yakima 106.7
5,900
$ 16,822,324 $ 2,851 Line Unit 1 (West Highline) Canal in Bench Unit with concrete; water savings due to reduction in seepage;
24.5 miles of lining. NRCE 1999
22 Wapato Irrigation Project Lining/Piping Yakima 106.7
5,200
$ 16,261,230 $ 3,127 Line Unit 2 Pump Canal in Bench Unit with concrete;
water savings due to reduction in seepage; approximately 15 miles of lining.
NRCE 1999
23 Wapato Irrigation Project Lining/Piping Yakima 106.7
700
$ 2,611,819 $ 3,731 Pipe or line East Highline (Unit 1) Canal; water savings
due to decrease in seepage and spills; estimated 12,000 feet of pipe.
NRCE 1999
24 Wapato Irrigation Project Lining/Piping Yakima 106.7
7,200
$ 40,877,904 $ 5,677
Line Main Extension Canal with concrete and pipe associated laterals and sublaterals in Bench Unit; water
savings due to reduction in seepage; 73 miles of lining/piping.
NRCE 1999
25 Wapato Irrigation Project Lining/Piping Yakima 106.7
800
$ 4,777,476 $ 5,972 Pipe Island laterals and sub-laterals in Bench Unit; water savings due to reduction in seepage; approximately 10
miles of piping. NRCE 1999
26 Wapato Irrigation Project Lining/Piping Yakima 106.7
1,600
$ 10,405,330 $ 6,503
Replace all piped laterals in Unit 1 in Bench Unit; laterals and concrete pipe that are leaking after 50 years of
operation; replace with PVC pipe; water savings due to reduction in spills and seepage; approximately 32 miles of
piping.
NRCE 1999
Page A-1

Yakima River Basin Water Conservation Projects
Project Number Entity Project Type River or Creek Yakima or
Naches River Mile Diversion
Estimated Water Savings (ac-ft/yr)
Total Project Cost (2007 $)
Cost per Acre-foot
Saved Project Description Source
27 Wapato Irrigation Project Lining/Piping Yakima 106.7
1,000
$ 11,633,640 $ 11,634
Replace all piped laterals in Unit 2 in Bench Unit; laterals are concrete pipe that are leaking after 40 years of
operation; replace with PVC pipe; water savings due to reduction in spills and seepage; approximately 32 miles of
piping.
NRCE 1999
28 Wapato Irrigation Project
Automation/Irrigation Water Mgmt Yakima 106.7 minor $ 1,585,548 Replace existing check structures with mechanical gates. NRCE 1999
29 Wapato Irrigation Project
Automation/Irrigation Water Mgmt Yakima 106.7 minor $ 1,585,548 Construct water measurement structures at several
locations; 23 ramp flumes to be constructed. NRCE 1999
30 Sunnyside Valley Irrigation District Lining/Piping Yakima 103.8
4,265
$ 1,400,951 $ 328 Piping of former Outlook Irrigation District; various sub-
laterals; water savings due to decrease in seepage; approximately 5 miles of sub-laterals to be piped.
CH2M Hill. 1995b. Outlook Irrigation District Comprehensive Water Conservation Plan. November.
31 Kiona Irrigation District Lining/Piping Yakima 34.9
4,124
$ 4,753,753 $ 1,153 Complete pressurized system conversion. CH2M Hill. 1996. Kiona Irrigation District Comprehensive Water Conservation Plan. February.
32 Columbia Irrigation District Lining/Piping Yakima 18
26,000
$ 15,128,983 $ 1,414 Piping Lateral 1 and 2 canals and pressurizing Lateral 1; water savings due to decreasing seepage, evaporation,
and operational spill.
SCM Consultants. 2001. Facsimile; Subject: Yakima River basin Watershed Plan. August 15.
33 Columbia Irrigation District Lining/Piping Yakima 18 combined with
Project #32 $ 14,830,019 Concrete line Main Canal; water savings due to decrease in seepage losses; approximately 16 miles of lining. SCM Consultants 2001
34 Columbia Irrigation District Lining/Piping Yakima 18 combined with
Project #32 $ 6,817,147 Columbia River Pump Exchange Project SCM Consultants 2001
35 Kennewick Irrigation District Lining/Piping Yakima 47.1
64,500
$ 53,873,101 $ 835 Columbia River Pump Exchange Project SCM Consultants. 1999. Kennewick Irrigation District Water Conservation Plan. June.
36 Nile Valley Ditch Association Lining/Piping Naches 27.8
395
$ 518,456 $ 1,313 This Project would pipe the delivery for apprx 300 acres. Tobin, personal correspondence 2006
37 Naches-Selah Irrigation District Storage/Re-reg Reservoirs Naches 18
8,675
$ 3,110,738 $ 3,732
Re-Regulation Reservoir. Lined 55 Ac-Ft reservoir to buffer flows coming from the Main Canal at Mile 15 into the piped laterals. Reservoir required to eliminate spills from the ends of the laterals. On demand service would
be possible for all district
CH2M Hill. 1995a. Naches-Selah Irrigation District Comprehensive Water Conservation Plan. Harter, Justin.
2006. Personal correspondence. Naches-Selah Irrigation District.
38 Naches-Selah Irrigation District Lining/Piping Naches 18 Combined with
Project #37 $ 3,786,765 Main Canal Mile 9 to Mile 15. Line and rehabilitate canal and tunnels. CH2M Hill 1995a
39 Naches-Selah Irrigation District Lining/Piping Naches 18 Combined with
Project #37 $ 2,032,349 No. 1 Lateral. Pipe first 1.4 miles of No.1 Lateral that serves 4500 acres. CH2M Hill 1995a; Harter, personal correspondence 2006
40 Naches-Selah Irrigation District Lining/Piping Naches 18 Combined with
Project #37 $ 527,789
Lower No. 2 Lateral. Replace and upgrade 9,000ft of existing low head concrete pipe to handle gravity head of
40-100 PSI. 1500 acres would benefit from 40 PSI or greater at delivery points.
CH2M Hill 1995a; Harter, personal correspondence 2006
41 Naches-Selah Irrigation District Lining/Piping Naches 18 Combined with
Project #37 $ 15,118,929
Main Canal Mile 0 to Mile 9. Replace 2 miles of failing wood flumes with large diameter low head pipe. Line 3 miles of existing unlined main canal. Rehabilitation of
structures and canal automation.
CH2M Hill 1995a; Harter, personal correspondence 2006
42 Naches-Selah Irrigation District Lining/Piping Naches 18 Combined with
Project #37 $ 2,913,725 No. 1/NPH Lateral. Pipe 5 miles of open canal. Replace
2 miles of failing wood pipe. Upgrade other existing distribution pipes.
CH2M Hill 1995a; Harter, personal correspondence 2006
43 Naches-Selah Irrigation District Lining/Piping Naches 18 Combined with
Project #37 $ 4,883,859
No. 3 Lateral. Replace 1.1 miles of failing wood flumes with pipe. Pipe 1.7 miles of open canal. Replace 1.1 miles of failing wood pipes. Upgrade other existing
distribution pipes.
CH2M Hill 1995a; Harter, personal correspondence 2006
44 South Naches Irrigation District Lining/Piping Naches 14.5
9,733
$ 10,029,415 $ 1,030 Piping district-wide in conversion to pressurized distribution system; includes installation of pump station.
CH2M Hill. 1994. South Naches Irrigation District Comprehensive Water Conservation Plan. February.
45 Gleed Ditch Company Lining/Piping Naches 9
100
$ 5,184,564 $ 51,846 Piping a ditch Co to the current points of use (1280 acres, approx. 6.5 miles of ditch). Tobin, personal correspondence 2006
46 Yakima Valley Canal Company Lining/Piping Naches 9
500
$ 25,922,819 $ 51,846 Piping a ditch Co to the current points of use (4300 acres approx 15 miles of ditch). Tobin, personal correspondence 2006
47 Naches and
Cowiche Canal Company
Lining/Piping Naches 3.6
600
$ 15,553,691 $ 25,923 Piping a ditch Co to the current points of use (serving 2400 acres 5.5 mile of ditch). Tobin, personal correspondence 2006
Total
229,199
$ 405,732,181 $ 1,770
Page A-2

APPENDIX B
CONSERVATION PROJECT COST DETAILS


Conservation Project Costs
Project Number Entity Project Type
Itemized Pay Items Mobilization Unlisted Items Construction
Contract Cost Contingencies Field Cost Noncontract Costs
Total Project Cost Year of Cost
Estimate
USBR Construction Cost Index 2007 Total Project Cost
5% of Pay Items
10% of Pay + Mobilization
Pay + Mobilization + Unlisted
25% of Construction
Construction + Contingencies
35% of Field Cost
Field + Noncontract
April of Composite Trend (http://www.usbr.gov/pmts/estiamte/cost_trend.html)
USBR Construction Cost Index = 309
1 Kittitas
Reclamation District
Lining/Piping $ 3,000,000 2006 298 $ 3,110,738
2 Westside Irrigation Lining/Piping $ 220,000 2006 298 $ 228,121
3 Westside Irrigation Lining/Piping $ 220,000 2006 298 $ 228,121
4 Westside Irrigation
On-farm Conservation $ 8,250,000 2006 298 $ 8,554,530
5 Ellensburg Water Company
On-farm Conservation $17,500,000 2006 298 $ 18,145,973
6 Ellensburg Water Company
On-farm Conservation $ 250,000 2006 298 $ 259,228
7 Cascade Irrigation District Tailwater Reuse $ 200,000 2006 298 $ 207,383
8 Cascade Irrigation District Other $ 130,000 2006 298 $ 134,799
9 Cascade Irrigation District
On-farm Conservation $22,500,000 2006 298 $ 23,330,537
10 Bull Canal Company Lining/Piping $ 315,000 2006 298 $ 326,628
11 Bull Canal Company Lining/Piping $ 225,000 2006 298 $ 233,305
12 Bull Canal Company
On-farm Conservation $ 1,700,000 2006 298 $ 1,762,752
13 Union Gap Irrigation District Lining/Piping $ 500,000 2006 298 $ 518,456
14 Wapato Irrigation Project
Automation/Irrigation Water Mgmt $ 5,200,000 1999 221 $ 7,270,588
15 Wapato Irrigation Project
Storage/Re-reg Reservoirs $ 209,513 $ 10,480 $ 22,000 $ 241,990 $ 60,500 $ 302,490 $ 105,870 $ 408,400 1999 221 $ 571,021
16 Wapato Irrigation Project
On-farm Conservation $16,730,000 1999 221 $ 23,391,719
17 Wapato Irrigation Project Lining/Piping $ 2,317,345 $ 115,870 $ 243,320 $ 2,676,540 $ 669,140 $ 3,345,680 $ 1,170,990 $ 4,516,700 1999 221 $ 6,315,205
18 Wapato Irrigation Project Lining/Piping $ 2,264,473 $ 113,220 $ 237,770 $ 2,615,460 $ 653,870 $ 3,269,330 $ 1,144,270 $ 4,413,600 1999 221 $ 6,171,052
19 Wapato Irrigation Project Lining/Piping $ 3,453,850 $ 172,690 $ 362,650 $ 3,989,190 $ 997,300 $ 4,986,490 $ 1,745,270 $ 6,731,800 1999 221 $ 9,412,336
20 Wapato Irrigation Project Lining/Piping $ 958,397 $ 47,920 $ 100,630 $ 1,106,950 $ 276,740 $ 1,383,690 $ 484,290 $ 1,868,000 1999 221 $ 2,611,819
21 Wapato Irrigation Project Lining/Piping $ 6,172,953 $ 308,650 $ 648,160 $ 7,129,760 $ 1,782,440 $ 8,912,200 $ 3,119,270 $12,031,500 1999 221 $ 16,822,324
22 Wapato Irrigation Project Lining/Piping $ 5,967,078 $ 298,350 $ 626,540 $ 6,891,970 $ 1,722,990 $ 8,614,960 $ 3,015,240 $11,630,200 1999 221 $ 16,261,230
23 Wapato Irrigation Project Lining/Piping $ 958,397 $ 47,920 $ 100,630 $ 1,106,950 $ 276,740 $ 1,383,690 $ 484,290 $ 1,868,000 1999 221 $ 2,611,819
Page B-1
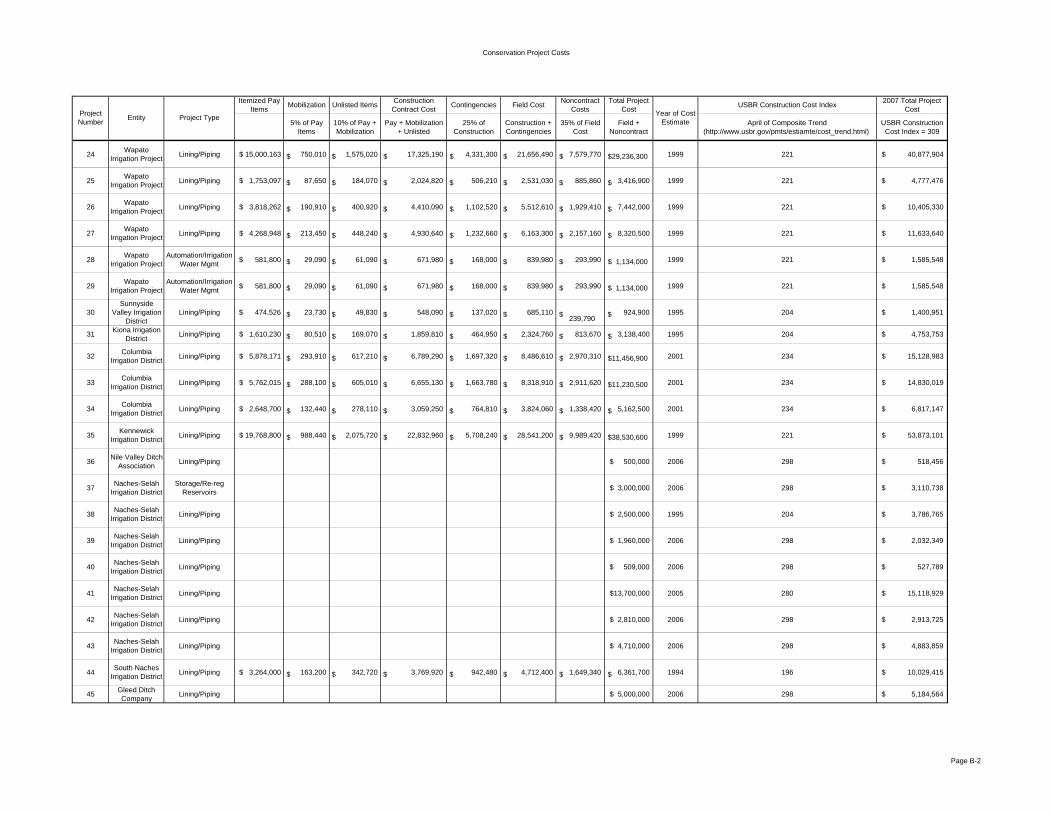
Conservation Project Costs
Project Number Entity Project Type
Itemized Pay Items Mobilization Unlisted Items Construction
Contract Cost Contingencies Field Cost Noncontract Costs
Total Project Cost Year of Cost
Estimate
USBR Construction Cost Index 2007 Total Project Cost
5% of Pay Items
10% of Pay + Mobilization
Pay + Mobilization + Unlisted
25% of Construction
Construction + Contingencies
35% of Field Cost
Field + Noncontract
April of Composite Trend (http://www.usbr.gov/pmts/estiamte/cost_trend.html)
USBR Construction Cost Index = 309
24 Wapato Irrigation Project Lining/Piping $ 15,000,163 $ 750,010 $ 1,575,020 $ 17,325,190 $ 4,331,300 $ 21,656,490 $ 7,579,770 $29,236,300 1999 221 $ 40,877,904
25 Wapato Irrigation Project Lining/Piping $ 1,753,097 $ 87,650 $ 184,070 $ 2,024,820 $ 506,210 $ 2,531,030 $ 885,860 $ 3,416,900 1999 221 $ 4,777,476
26 Wapato Irrigation Project Lining/Piping $ 3,818,262 $ 190,910 $ 400,920 $ 4,410,090 $ 1,102,520 $ 5,512,610 $ 1,929,410 $ 7,442,000 1999 221 $ 10,405,330
27 Wapato Irrigation Project Lining/Piping $ 4,268,948 $ 213,450 $ 448,240 $ 4,930,640 $ 1,232,660 $ 6,163,300 $ 2,157,160 $ 8,320,500 1999 221 $ 11,633,640
28 Wapato Irrigation Project
Automation/Irrigation Water Mgmt $ 581,800 $ 29,090 $ 61,090 $ 671,980 $ 168,000 $ 839,980 $ 293,990 $ 1,134,000 1999 221 $ 1,585,548
29 Wapato Irrigation Project
Automation/Irrigation Water Mgmt $ 581,800 $ 29,090 $ 61,090 $ 671,980 $ 168,000 $ 839,980 $ 293,990 $ 1,134,000 1999 221 $ 1,585,548
30 Sunnyside
Valley Irrigation District
Lining/Piping $ 474,526 $ 23,730 $ 49,830 $ 548,090 $ 137,020 $ 685,110 $ 239,790 $ 924,900 1995 204 $ 1,400,951
31 Kiona Irrigation District Lining/Piping $ 1,610,230 $ 80,510 $ 169,070 $ 1,859,810 $ 464,950 $ 2,324,760 $ 813,670 $ 3,138,400 1995 204 $ 4,753,753
32 Columbia Irrigation District Lining/Piping $ 5,878,171 $ 293,910 $ 617,210 $ 6,789,290 $ 1,697,320 $ 8,486,610 $ 2,970,310 $11,456,900 2001 234 $ 15,128,983
33 Columbia Irrigation District Lining/Piping $ 5,762,015 $ 288,100 $ 605,010 $ 6,655,130 $ 1,663,780 $ 8,318,910 $ 2,911,620 $11,230,500 2001 234 $ 14,830,019
34 Columbia Irrigation District Lining/Piping $ 2,648,700 $ 132,440 $ 278,110 $ 3,059,250 $ 764,810 $ 3,824,060 $ 1,338,420 $ 5,162,500 2001 234 $ 6,817,147
35 Kennewick Irrigation District Lining/Piping $ 19,768,800 $ 988,440 $ 2,075,720 $ 22,832,960 $ 5,708,240 $ 28,541,200 $ 9,989,420 $38,530,600 1999 221 $ 53,873,101
36 Nile Valley Ditch Association Lining/Piping $ 500,000 2006 298 $ 518,456
37 Naches-Selah Irrigation District
Storage/Re-reg Reservoirs $ 3,000,000 2006 298 $ 3,110,738
38 Naches-Selah Irrigation District Lining/Piping $ 2,500,000 1995 204 $ 3,786,765
39 Naches-Selah Irrigation District Lining/Piping $ 1,960,000 2006 298 $ 2,032,349
40 Naches-Selah Irrigation District Lining/Piping $ 509,000 2006 298 $ 527,789
41 Naches-Selah Irrigation District Lining/Piping $13,700,000 2005 280 $ 15,118,929
42 Naches-Selah Irrigation District Lining/Piping $ 2,810,000 2006 298 $ 2,913,725
43 Naches-Selah Irrigation District Lining/Piping $ 4,710,000 2006 298 $ 4,883,859
44 South Naches Irrigation District Lining/Piping $ 3,264,000 $ 163,200 $ 342,720 $ 3,769,920 $ 942,480 $ 4,712,400 $ 1,649,340 $ 6,361,700 1994 196 $ 10,029,415
45 Gleed Ditch Company Lining/Piping $ 5,000,000 2006 298 $ 5,184,564
Page B-2

Conservation Project Costs
Project Number Entity Project Type
Itemized Pay Items Mobilization Unlisted Items Construction
Contract Cost Contingencies Field Cost Noncontract Costs
Total Project Cost Year of Cost
Estimate
USBR Construction Cost Index 2007 Total Project Cost
5% of Pay Items
10% of Pay + Mobilization
Pay + Mobilization + Unlisted
25% of Construction
Construction + Contingencies
35% of Field Cost
Field + Noncontract
April of Composite Trend (http://www.usbr.gov/pmts/estiamte/cost_trend.html)
USBR Construction Cost Index = 309
46 Yakima Valley Canal Company Lining/Piping $25,000,000 2006 298 $ 25,922,819
47 Naches and
Cowiche Canal Company
Lining/Piping $15,000,000 2006 298 $ 15,553,691
Total $ 405,732,181
Page B-3

Yakima River Basin Water Conservation Projects
Project Number Entity Project Type River or Creek Yakima or
Naches River Mile Diversion
Estimated Water Savings (ac-ft/yr)
Total Project Cost (2007 $)
Cost per Acre-foot
Saved Project Description Source
1 Kittitas
Reclamation District
Lining/Piping Yakima 202.5
2,000
$ 3,110,738 $ 1,555 Replace leaking areas of Main Canal with new concrete liner.
Crowley, Mark. 2006. Personal correspondence. Kittitas County Conservation District.
2 Westside Irrigation Lining/Piping Yakima 166.1
300
$ 228,121 $ 760 Project will pipe 5,280 feet of canal. Crowley, personal correspondence 2006
3 Westside Irrigation Lining/Piping Yakima 166.1
300
$ 228,121 $ 760 Project will pipe 5,280 feet of canal. Crowley, personal correspondence 2006
4 Westside Irrigation On-farm Conservation Yakima 166.1
3,300
$ 8,554,530 $ 2,592 Conversion of 3,300 acres of rill irrgation to sprinkler irrigation. Crowley, personal correspondence 2006
5 Ellensburg Water Company On-farm Conservation Yakima 161.3
7,000
$ 18,145,973 $ 2,592 Conversion of 7,000 acres of rill irrgation to sprinkler irrigation. Crowley, personal correspondence 2006
6 Ellensburg Water Company On-farm Conservation Yakima 161.3
100
$ 259,228 $ 2,592 This project would convert 100 acres of rill irrigated hay and crop land to sprinkler irrigation. Crowley, personal correspondence 2006
7 Cascade Irrigation District Tailwater Reuse Yakima 160.3
2,088
$ 207,383 $ 164 Project would pump return flows from Johnson Drain back into the canal for reuse. Crowley, personal correspondence 2006
8 Cascade Irrigation District Other Yakima 160.3 combined with
Project #7 $ 134,799 Project would install a VFD on two of the eight pumps at the head end of the canal system. Crowley, personal correspondence 2006
9 Cascade Irrigation District On-farm Conservation Yakima 160.3
9,000
$ 23,330,537 $ 2,592 Conversion of 9,000 acres of rill irrgation to sprinkler irrigation. Crowley, personal correspondence 2006
10 Bull Canal Company Lining/Piping Yakima 153
384
$ 326,628 $ 851 Project will pipe 1,800 feet of canal. Crowley, personal correspondence 2006
11 Bull Canal Company Lining/Piping Yakima 153
255
$ 233,305 $ 915 Project will pipe 3,000 feet of canal. Crowley, personal correspondence 2006
12 Bull Canal Company On-farm Conservation Yakima 153
680
$ 1,762,752 $ 2,592 Conversion of 680 acres of rill irrgation to sprinkler irrigation. Crowley, personal correspondence 2006
13 Union Gap Irrigation District Lining/Piping Yakima 105
200
$ 518,456 $ 2,592 Piping a ditch Co to the current points of use (approx 4 miles).
Tobin, Mike. 2006. Personal correspondence. North Yakima Conservation District.
14 Wapato Irrigation Project
Automation/Irrigation Water Mgmt Yakima 106.7
14,700
$ 7,270,588 $ 495
Equip all turnouts with adequate water measurement devices; water savings due to reduced deliveries;
approximately 3,500 water measuring devices to be installed.
Natural Resources Consulting Engineers (NRCE). 1999. Irrigation Water Conservation and Management Plan for
the Wapato Irrigation Project. May.
15 Wapato Irrigation Project Storage/Re-reg Reservoirs Yakima 106.7
700
$ 571,021 $ 816 Construct 370 ac-ft capacity reservoir in Bench Unit; water savings due to water recapture. NRCE 1999
16 Wapato Irrigation Project On-farm Conservation Yakima 106.7
32,500
$ 23,391,719 $ 720 Voluntary incentive-based program to provide assistance
to growers for improvements to irrigation systems and land.
NRCE 1999
17 Wapato Irrigation Project Lining/Piping Yakima 66.7
4,600
$ 6,315,205 $ 1,373 Line Satus East and Satus West Canals with concrete; water savings due to decrease in seepage. NRCE 1999
18 Wapato Irrigation Project Lining/Piping Yakima 106.7
3,400
$ 6,171,052 $ 1,815 Concrete line Lateral 4 Extension and line or pipe corresponding sub-laterals; water savings due to
decrease in seepage. NRCE 1999
19 Wapato Irrigation Project Lining/Piping Yakima 106.7
5,100
$ 9,412,336 $ 1,846 Cement line Track Lateral and replace or repair water structures; water savings due to decrease in seepage. NRCE 1999
20 Wapato Irrigation Project Lining/Piping Yakima 106.7
1,300
$ 2,611,819 $ 2,009 Improve Spencer Lateral in Wapato Unit; 10.5 miles. NRCE 1999
21 Wapato Irrigation Project Lining/Piping Yakima 106.7
5,900
$ 16,822,324 $ 2,851 Line Unit 1 (West Highline) Canal in Bench Unit with concrete; water savings due to reduction in seepage;
24.5 miles of lining. NRCE 1999
22 Wapato Irrigation Project Lining/Piping Yakima 106.7
5,200
$ 16,261,230 $ 3,127 Line Unit 2 Pump Canal in Bench Unit with concrete;
water savings due to reduction in seepage; approximately 15 miles of lining.
NRCE 1999
23 Wapato Irrigation Project Lining/Piping Yakima 106.7
700
$ 2,611,819 $ 3,731 Pipe or line East Highline (Unit 1) Canal; water savings
due to decrease in seepage and spills; estimated 12,000 feet of pipe.
NRCE 1999
24 Wapato Irrigation Project Lining/Piping Yakima 106.7
7,200
$ 40,877,904 $ 5,677
Line Main Extension Canal with concrete and pipe associated laterals and sublaterals in Bench Unit; water
savings due to reduction in seepage; 73 miles of lining/piping.
NRCE 1999
25 Wapato Irrigation Project Lining/Piping Yakima 106.7
800
$ 4,777,476 $ 5,972 Pipe Island laterals and sub-laterals in Bench Unit; water savings due to reduction in seepage; approximately 10
miles of piping. NRCE 1999
26 Wapato Irrigation Project Lining/Piping Yakima 106.7
1,600
$ 10,405,330 $ 6,503
Replace all piped laterals in Unit 1 in Bench Unit; laterals and concrete pipe that are leaking after 50 years of
operation; replace with PVC pipe; water savings due to reduction in spills and seepage; approximately 32 miles of
piping.
NRCE 1999
Page A-1
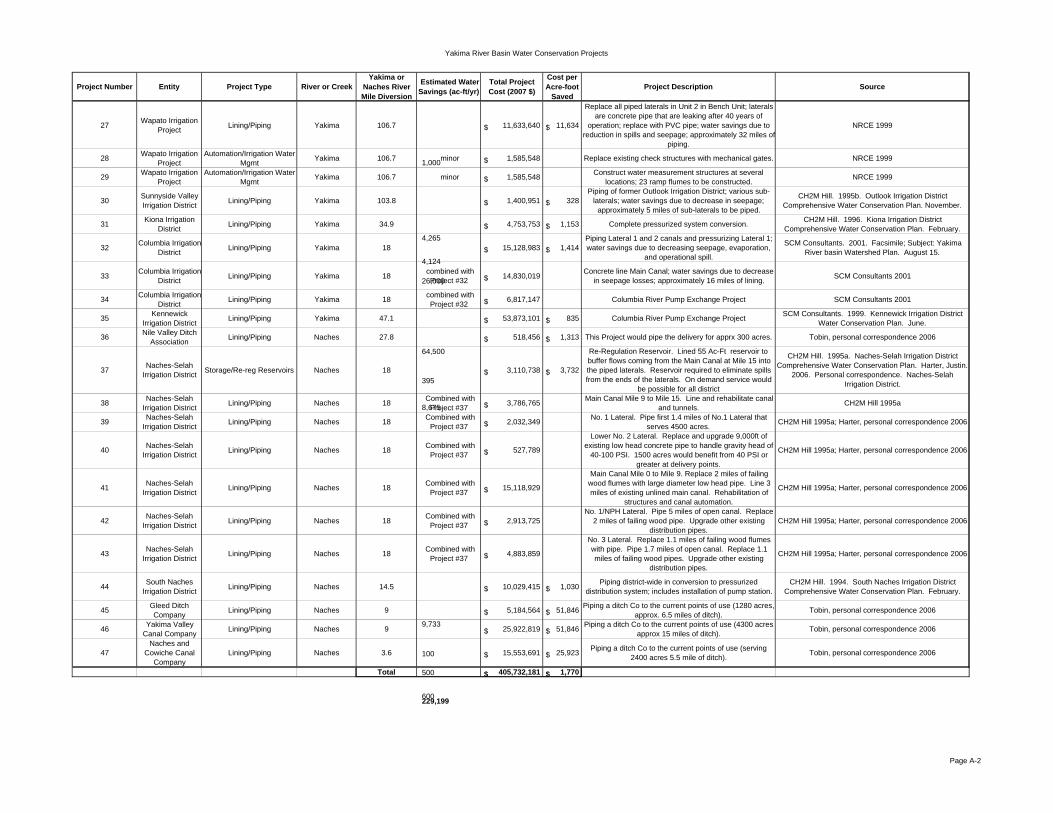
Yakima River Basin Water Conservation Projects
Project Number Entity Project Type River or Creek Yakima or
Naches River Mile Diversion
Estimated Water Savings (ac-ft/yr)
Total Project Cost (2007 $)
Cost per Acre-foot
Saved Project Description Source
27 Wapato Irrigation Project Lining/Piping Yakima 106.7
1,000
$ 11,633,640 $ 11,634
Replace all piped laterals in Unit 2 in Bench Unit; laterals are concrete pipe that are leaking after 40 years of
operation; replace with PVC pipe; water savings due to reduction in spills and seepage; approximately 32 miles of
piping.
NRCE 1999
28 Wapato Irrigation Project
Automation/Irrigation Water Mgmt Yakima 106.7 minor $ 1,585,548 Replace existing check structures with mechanical gates. NRCE 1999
29 Wapato Irrigation Project
Automation/Irrigation Water Mgmt Yakima 106.7 minor $ 1,585,548 Construct water measurement structures at several
locations; 23 ramp flumes to be constructed. NRCE 1999
30 Sunnyside Valley Irrigation District Lining/Piping Yakima 103.8
4,265
$ 1,400,951 $ 328 Piping of former Outlook Irrigation District; various sub-
laterals; water savings due to decrease in seepage; approximately 5 miles of sub-laterals to be piped.
CH2M Hill. 1995b. Outlook Irrigation District Comprehensive Water Conservation Plan. November.
31 Kiona Irrigation District Lining/Piping Yakima 34.9
4,124
$ 4,753,753 $ 1,153 Complete pressurized system conversion. CH2M Hill. 1996. Kiona Irrigation District Comprehensive Water Conservation Plan. February.
32 Columbia Irrigation District Lining/Piping Yakima 18
26,000
$ 15,128,983 $ 1,414 Piping Lateral 1 and 2 canals and pressurizing Lateral 1; water savings due to decreasing seepage, evaporation,
and operational spill.
SCM Consultants. 2001. Facsimile; Subject: Yakima River basin Watershed Plan. August 15.
33 Columbia Irrigation District Lining/Piping Yakima 18 combined with
Project #32 $ 14,830,019 Concrete line Main Canal; water savings due to decrease in seepage losses; approximately 16 miles of lining. SCM Consultants 2001
34 Columbia Irrigation District Lining/Piping Yakima 18 combined with
Project #32 $ 6,817,147 Columbia River Pump Exchange Project SCM Consultants 2001
35 Kennewick Irrigation District Lining/Piping Yakima 47.1
64,500
$ 53,873,101 $ 835 Columbia River Pump Exchange Project SCM Consultants. 1999. Kennewick Irrigation District Water Conservation Plan. June.
36 Nile Valley Ditch Association Lining/Piping Naches 27.8
395
$ 518,456 $ 1,313 This Project would pipe the delivery for apprx 300 acres. Tobin, personal correspondence 2006
37 Naches-Selah Irrigation District Storage/Re-reg Reservoirs Naches 18
8,675
$ 3,110,738 $ 3,732
Re-Regulation Reservoir. Lined 55 Ac-Ft reservoir to buffer flows coming from the Main Canal at Mile 15 into the piped laterals. Reservoir required to eliminate spills from the ends of the laterals. On demand service would
be possible for all district
CH2M Hill. 1995a. Naches-Selah Irrigation District Comprehensive Water Conservation Plan. Harter, Justin.
2006. Personal correspondence. Naches-Selah Irrigation District.
38 Naches-Selah Irrigation District Lining/Piping Naches 18 Combined with
Project #37 $ 3,786,765 Main Canal Mile 9 to Mile 15. Line and rehabilitate canal and tunnels. CH2M Hill 1995a
39 Naches-Selah Irrigation District Lining/Piping Naches 18 Combined with
Project #37 $ 2,032,349 No. 1 Lateral. Pipe first 1.4 miles of No.1 Lateral that serves 4500 acres. CH2M Hill 1995a; Harter, personal correspondence 2006
40 Naches-Selah Irrigation District Lining/Piping Naches 18 Combined with
Project #37 $ 527,789
Lower No. 2 Lateral. Replace and upgrade 9,000ft of existing low head concrete pipe to handle gravity head of
40-100 PSI. 1500 acres would benefit from 40 PSI or greater at delivery points.
CH2M Hill 1995a; Harter, personal correspondence 2006
41 Naches-Selah Irrigation District Lining/Piping Naches 18 Combined with
Project #37 $ 15,118,929
Main Canal Mile 0 to Mile 9. Replace 2 miles of failing wood flumes with large diameter low head pipe. Line 3 miles of existing unlined main canal. Rehabilitation of
structures and canal automation.
CH2M Hill 1995a; Harter, personal correspondence 2006
42 Naches-Selah Irrigation District Lining/Piping Naches 18 Combined with
Project #37 $ 2,913,725 No. 1/NPH Lateral. Pipe 5 miles of open canal. Replace
2 miles of failing wood pipe. Upgrade other existing distribution pipes.
CH2M Hill 1995a; Harter, personal correspondence 2006
43 Naches-Selah Irrigation District Lining/Piping Naches 18 Combined with
Project #37 $ 4,883,859
No. 3 Lateral. Replace 1.1 miles of failing wood flumes with pipe. Pipe 1.7 miles of open canal. Replace 1.1 miles of failing wood pipes. Upgrade other existing
distribution pipes.
CH2M Hill 1995a; Harter, personal correspondence 2006
44 South Naches Irrigation District Lining/Piping Naches 14.5
9,733
$ 10,029,415 $ 1,030 Piping district-wide in conversion to pressurized distribution system; includes installation of pump station.
CH2M Hill. 1994. South Naches Irrigation District Comprehensive Water Conservation Plan. February.
45 Gleed Ditch Company Lining/Piping Naches 9
100
$ 5,184,564 $ 51,846 Piping a ditch Co to the current points of use (1280 acres, approx. 6.5 miles of ditch). Tobin, personal correspondence 2006
46 Yakima Valley Canal Company Lining/Piping Naches 9
500
$ 25,922,819 $ 51,846 Piping a ditch Co to the current points of use (4300 acres approx 15 miles of ditch). Tobin, personal correspondence 2006
47 Naches and
Cowiche Canal Company
Lining/Piping Naches 3.6
600
$ 15,553,691 $ 25,923 Piping a ditch Co to the current points of use (serving 2400 acres 5.5 mile of ditch). Tobin, personal correspondence 2006
Total
229,199
$ 405,732,181 $ 1,770
Page A-2
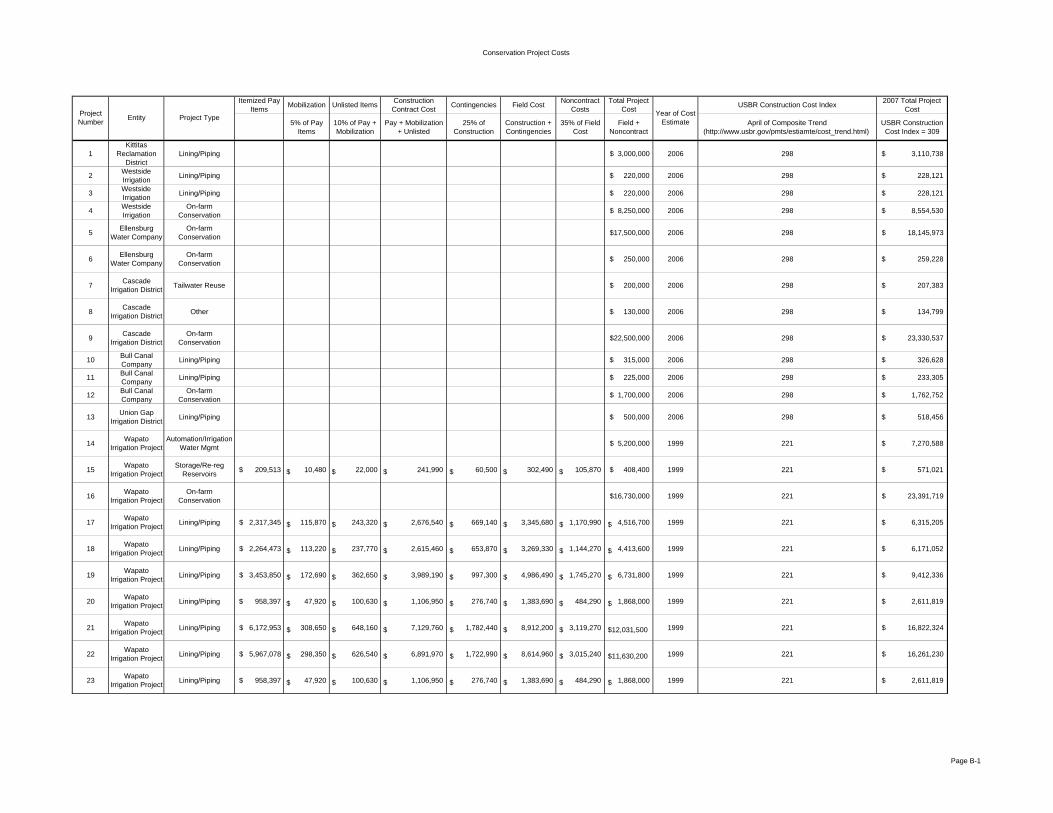
Conservation Project Costs
Project Number Entity Project Type
Itemized Pay Items Mobilization Unlisted Items Construction
Contract Cost Contingencies Field Cost Noncontract Costs
Total Project Cost Year of Cost
Estimate
USBR Construction Cost Index 2007 Total Project Cost
5% of Pay Items
10% of Pay + Mobilization
Pay + Mobilization + Unlisted
25% of Construction
Construction + Contingencies
35% of Field Cost
Field + Noncontract
April of Composite Trend (http://www.usbr.gov/pmts/estiamte/cost_trend.html)
USBR Construction Cost Index = 309
1 Kittitas
Reclamation District
Lining/Piping $ 3,000,000 2006 298 $ 3,110,738
2 Westside Irrigation Lining/Piping $ 220,000 2006 298 $ 228,121
3 Westside Irrigation Lining/Piping $ 220,000 2006 298 $ 228,121
4 Westside Irrigation
On-farm Conservation $ 8,250,000 2006 298 $ 8,554,530
5 Ellensburg Water Company
On-farm Conservation $17,500,000 2006 298 $ 18,145,973
6 Ellensburg Water Company
On-farm Conservation $ 250,000 2006 298 $ 259,228
7 Cascade Irrigation District Tailwater Reuse $ 200,000 2006 298 $ 207,383
8 Cascade Irrigation District Other $ 130,000 2006 298 $ 134,799
9 Cascade Irrigation District
On-farm Conservation $22,500,000 2006 298 $ 23,330,537
10 Bull Canal Company Lining/Piping $ 315,000 2006 298 $ 326,628
11 Bull Canal Company Lining/Piping $ 225,000 2006 298 $ 233,305
12 Bull Canal Company
On-farm Conservation $ 1,700,000 2006 298 $ 1,762,752
13 Union Gap Irrigation District Lining/Piping $ 500,000 2006 298 $ 518,456
14 Wapato Irrigation Project
Automation/Irrigation Water Mgmt $ 5,200,000 1999 221 $ 7,270,588
15 Wapato Irrigation Project
Storage/Re-reg Reservoirs $ 209,513 $ 10,480 $ 22,000 $ 241,990 $ 60,500 $ 302,490 $ 105,870 $ 408,400 1999 221 $ 571,021
16 Wapato Irrigation Project
On-farm Conservation $16,730,000 1999 221 $ 23,391,719
17 Wapato Irrigation Project Lining/Piping $ 2,317,345 $ 115,870 $ 243,320 $ 2,676,540 $ 669,140 $ 3,345,680 $ 1,170,990 $ 4,516,700 1999 221 $ 6,315,205
18 Wapato Irrigation Project Lining/Piping $ 2,264,473 $ 113,220 $ 237,770 $ 2,615,460 $ 653,870 $ 3,269,330 $ 1,144,270 $ 4,413,600 1999 221 $ 6,171,052
19 Wapato Irrigation Project Lining/Piping $ 3,453,850 $ 172,690 $ 362,650 $ 3,989,190 $ 997,300 $ 4,986,490 $ 1,745,270 $ 6,731,800 1999 221 $ 9,412,336
20 Wapato Irrigation Project Lining/Piping $ 958,397 $ 47,920 $ 100,630 $ 1,106,950 $ 276,740 $ 1,383,690 $ 484,290 $ 1,868,000 1999 221 $ 2,611,819
21 Wapato Irrigation Project Lining/Piping $ 6,172,953 $ 308,650 $ 648,160 $ 7,129,760 $ 1,782,440 $ 8,912,200 $ 3,119,270 $12,031,500 1999 221 $ 16,822,324
22 Wapato Irrigation Project Lining/Piping $ 5,967,078 $ 298,350 $ 626,540 $ 6,891,970 $ 1,722,990 $ 8,614,960 $ 3,015,240 $11,630,200 1999 221 $ 16,261,230
23 Wapato Irrigation Project Lining/Piping $ 958,397 $ 47,920 $ 100,630 $ 1,106,950 $ 276,740 $ 1,383,690 $ 484,290 $ 1,868,000 1999 221 $ 2,611,819
Page B-1

Conservation Project Costs
Project Number Entity Project Type
Itemized Pay Items Mobilization Unlisted Items Construction
Contract Cost Contingencies Field Cost Noncontract Costs
Total Project Cost Year of Cost
Estimate
USBR Construction Cost Index 2007 Total Project Cost
5% of Pay Items
10% of Pay + Mobilization
Pay + Mobilization + Unlisted
25% of Construction
Construction + Contingencies
35% of Field Cost
Field + Noncontract
April of Composite Trend (http://www.usbr.gov/pmts/estiamte/cost_trend.html)
USBR Construction Cost Index = 309
24 Wapato Irrigation Project Lining/Piping $ 15,000,163 $ 750,010 $ 1,575,020 $ 17,325,190 $ 4,331,300 $ 21,656,490 $ 7,579,770 $29,236,300 1999 221 $ 40,877,904
25 Wapato Irrigation Project Lining/Piping $ 1,753,097 $ 87,650 $ 184,070 $ 2,024,820 $ 506,210 $ 2,531,030 $ 885,860 $ 3,416,900 1999 221 $ 4,777,476
26 Wapato Irrigation Project Lining/Piping $ 3,818,262 $ 190,910 $ 400,920 $ 4,410,090 $ 1,102,520 $ 5,512,610 $ 1,929,410 $ 7,442,000 1999 221 $ 10,405,330
27 Wapato Irrigation Project Lining/Piping $ 4,268,948 $ 213,450 $ 448,240 $ 4,930,640 $ 1,232,660 $ 6,163,300 $ 2,157,160 $ 8,320,500 1999 221 $ 11,633,640
28 Wapato Irrigation Project
Automation/Irrigation Water Mgmt $ 581,800 $ 29,090 $ 61,090 $ 671,980 $ 168,000 $ 839,980 $ 293,990 $ 1,134,000 1999 221 $ 1,585,548
29 Wapato Irrigation Project
Automation/Irrigation Water Mgmt $ 581,800 $ 29,090 $ 61,090 $ 671,980 $ 168,000 $ 839,980 $ 293,990 $ 1,134,000 1999 221 $ 1,585,548
30 Sunnyside
Valley Irrigation District
Lining/Piping $ 474,526 $ 23,730 $ 49,830 $ 548,090 $ 137,020 $ 685,110 $ 239,790 $ 924,900 1995 204 $ 1,400,951
31 Kiona Irrigation District Lining/Piping $ 1,610,230 $ 80,510 $ 169,070 $ 1,859,810 $ 464,950 $ 2,324,760 $ 813,670 $ 3,138,400 1995 204 $ 4,753,753
32 Columbia Irrigation District Lining/Piping $ 5,878,171 $ 293,910 $ 617,210 $ 6,789,290 $ 1,697,320 $ 8,486,610 $ 2,970,310 $11,456,900 2001 234 $ 15,128,983
33 Columbia Irrigation District Lining/Piping $ 5,762,015 $ 288,100 $ 605,010 $ 6,655,130 $ 1,663,780 $ 8,318,910 $ 2,911,620 $11,230,500 2001 234 $ 14,830,019
34 Columbia Irrigation District Lining/Piping $ 2,648,700 $ 132,440 $ 278,110 $ 3,059,250 $ 764,810 $ 3,824,060 $ 1,338,420 $ 5,162,500 2001 234 $ 6,817,147
35 Kennewick Irrigation District Lining/Piping $ 19,768,800 $ 988,440 $ 2,075,720 $ 22,832,960 $ 5,708,240 $ 28,541,200 $ 9,989,420 $38,530,600 1999 221 $ 53,873,101
36 Nile Valley Ditch Association Lining/Piping $ 500,000 2006 298 $ 518,456
37 Naches-Selah Irrigation District
Storage/Re-reg Reservoirs $ 3,000,000 2006 298 $ 3,110,738
38 Naches-Selah Irrigation District Lining/Piping $ 2,500,000 1995 204 $ 3,786,765
39 Naches-Selah Irrigation District Lining/Piping $ 1,960,000 2006 298 $ 2,032,349
40 Naches-Selah Irrigation District Lining/Piping $ 509,000 2006 298 $ 527,789
41 Naches-Selah Irrigation District Lining/Piping $13,700,000 2005 280 $ 15,118,929
42 Naches-Selah Irrigation District Lining/Piping $ 2,810,000 2006 298 $ 2,913,725
43 Naches-Selah Irrigation District Lining/Piping $ 4,710,000 2006 298 $ 4,883,859
44 South Naches Irrigation District Lining/Piping $ 3,264,000 $ 163,200 $ 342,720 $ 3,769,920 $ 942,480 $ 4,712,400 $ 1,649,340 $ 6,361,700 1994 196 $ 10,029,415
45 Gleed Ditch Company Lining/Piping $ 5,000,000 2006 298 $ 5,184,564
Page B-2

Conservation Project Costs
Project Number Entity Project Type
Itemized Pay Items Mobilization Unlisted Items Construction
Contract Cost Contingencies Field Cost Noncontract Costs
Total Project Cost Year of Cost
Estimate
USBR Construction Cost Index 2007 Total Project Cost
5% of Pay Items
10% of Pay + Mobilization
Pay + Mobilization + Unlisted
25% of Construction
Construction + Contingencies
35% of Field Cost
Field + Noncontract
April of Composite Trend (http://www.usbr.gov/pmts/estiamte/cost_trend.html)
USBR Construction Cost Index = 309
46 Yakima Valley Canal Company Lining/Piping $25,000,000 2006 298 $ 25,922,819
47 Naches and
Cowiche Canal Company
Lining/Piping $15,000,000 2006 298 $ 15,553,691
Total $ 405,732,181
Page B-3