technical report standard title page 1. … this report presents guidelines for use by the texas...
TRANSCRIPT
TECHNICAL REPORT STANDARD TITLE PAGE
1. Report No. 2. Government Accession No. FHWA/TX-90/1225-2F
4. Title and Subtitle Guidelines for Planning, Designing, and Operating BusRelated Street Improvements
7. Author(s) Kay Fitzpatrick, Thomas Urbanik II and Robert W. Stokes
9. Performing Organization Name and Address Texas Transportation Institute The Texas A&M University System College Station, Texas 77843
12. Sponsoring Agency Name and Address Texas State Department of Highways and Public Transportation; Transportation Planning Division P.O. Box 5051 Austin, Texas 77863
15. Supplementary Notes Research performed in cooperation with FHWA and DOT.
3. Recipient's Catalog No.
5. Report Date August 1990
6. Performing Organization Code
8. Performing Organization Report No. Research Report 1225-2F
10. Work Unit No.
11. Contract or Grant No. Study No. 2-18-89-1225
13. Type of Report and Period Covered
F. 1 September 1988 ma - August 1990
14. Sponsoring Agency Code
Research Study Title: Guidelines for Planning, Designing, and Operating Transit-Related Street Improvements
16. Abstract
This report presents guidelines for use by the Texas State Department of Highways and Public Transportation (SDHPT) in incorporating provisions for buses into the Department's street planning, design, and operation processes. The guidelines presented in this report were derived from a nationwide survey of transit/transportation agencies and address the following aspects of bus-related street improvements: 1) bus service planning; 2) bus facility design; and 3) bus service operations. The guidelines presented in this report should be useful to SDHPT and other state and local transportation agencies in developing a cooperative bus planning process in Texas.
17. Key Words 18. Distribution Statement No restrictions. This document is available to the public through the
See ABSTRACT page National Technical Information Service 5285 Port Royal Road
19. Security Classif. (of this report) Unclassified
Form DOT F 1700.7 (8-69)
Springfield, Virginia 22161
20. Security Classif. (of this page) Unclassified
21. No. of Pages
53 22. Price

GUIDELINES FOR PLANNING, DESIGNING, AND OPERATING
BUS-RELATED STREET IMPROVEMENTS
by
Kay Fitzpatrick
Assistant Research Engineer
Thomas Urbanik II
Research Engineer and Study Supervisor
and
Robert W. Stokes
Associate Research Planner
Research Report 1225-2F
Research Study Number 2-18-89-1225
Sponsored By
Texas State Department of Highways and Public Transportation
in cooperation with the
U.S. Department of Transportation
Federal Highway Administration
Texas Transportation Institute
The Texas A&M University System
College Station, Texas 77843
August 1990

METRIC (SI*) CONVERSION FACTORS
APPROXIMATE CONVERSIONS TO SI UNITS APPROXIMATE CONVERSIONS TO SI UNITS
Symbol Wh11n You Know Multlply 8y To And Symbol Symbol When You Know Multiply By To And Syrnbol
LENGTH LENGTH
mm millimetres 0.039 inches in In millimetres Inches 2.54 mm metres 3.28 feet ft ft - m
feet 0.3048 metres m - metres 1.09 yards yd yd - m
yards 0.914 metres m km kilometres 0.621 miles mi mi miles 1.61 kilometres km
. -
. - AREA -. AREA ... -. mm2 millimetres squared 0.0016 square inches in'
in• square inches 645.2 millimetres squared mm• -- mt metres squared 10.764 square feet ft2 -
tt• square feet 0.0929 metres squared m• - km2 kilometres squared 0.39 square miles mi2 -yd' square yards 0.836 metres squared m• "'
ha hectores (10 000 m2) 2.53 acres ac -ml2 square miles 2.59 kilometres squared km2 --ac acres 0.395 hectares ha - MASS (weight) ---
- g grams 0.0353 ounces oz
MASS (weight) - kg kilograms 2.205 pounds lb -- Mg megagrams (1 000 kg) 1.103 short tons T -oz ounces 28.35 grams g -
lb pounds 0.454 kilograms kg - VOLUME T short tons (2000 lb) 0.907 megagrams Mg --- ml millilitres 0.034 fluid ounces fl oz -- l litres 0.264 gallons gal VOLUME - m• 35.315 - metres cubed cubic feet ft' - m• metres cubed 1.308 cubic yards yd• -
fl oz fluid ounces 29.57 millilitres ml --gal gallons 3.785 litres l -ft• cubic feet 0.0328 metres cubed m•
.. - TEMPERATURE (exact) -yd• cubic yards 0.0765 metres cubed mi -
- oc Celsius 9/5 (then Fahrenheit OF NOTE: Volumes greater than 1000 L shall be shown in m•. - temperature add 32) temperature
- OF - Of 32 98.8 212 -TEMPERATURE (exact) :; - -fl I I? I I II~. I I ~I r. . 1~. I I
1~. I I 2?0J ~ I i I
I 100 -40 -20 0 i I I I I i
20 40 60 80 .. - oC 37 oC Of Fahrenheit 5/9 (after Celsius °C temperature subtracting 32) temperature These factors conform to the requirement of FHWA Order 5190.1A.
• St Is the symbol for the International System of Measurements

ABSTRACT
This report presents guidelines for use by the Texas State Department of Highways
and Public Transportation (SDHPT) in incorporating provisions for buses into the
Department's street planning, design, and operation processes. The guidelines presented
in this report were derived from a nationwide survey of transit/transportation agencies and
address the following aspects of bus-related street improvements: 1) bus service planning;
2) bus facility design; and 3) bus service operations. The guidelines presented in this report
should be useful to SDHPT and other state and local transportation agencies in developing
a cooperative bus planning process in Texas.
Keywords: Bus-related street improvements; Bus service planning guidelines; Bus facility
design guidelines; Bus service operations guidelines; Transit planning;
Interagency cooperation/ coordination; Geometric design; Traffic control; ,
Surface streets; Urban streets .
... 111

IMPLEMENTATION STATEMENT
This report presents guidelines for use by the Texas State Department of Highways
and Public Transportation (SDHPT) in incorporating provisions for buses into the
Department's street planning, design, and operation processes. The guidelines presented
in this report should be useful to SDHPT and other state and local transportation agencies
in developing a cooperative bus planning process in Texas.
DISCLAIMER
The contents of this report reflect the views of the authors who are responsible for
the facts and accuracy of the data presented herein. The contents do not necessarily reflect
the official views or policies of the Texas State Department of Highways and Public
Transportation or the Federal Highway Administration. This report does not constitute a
standard, specification, or regulation.
v

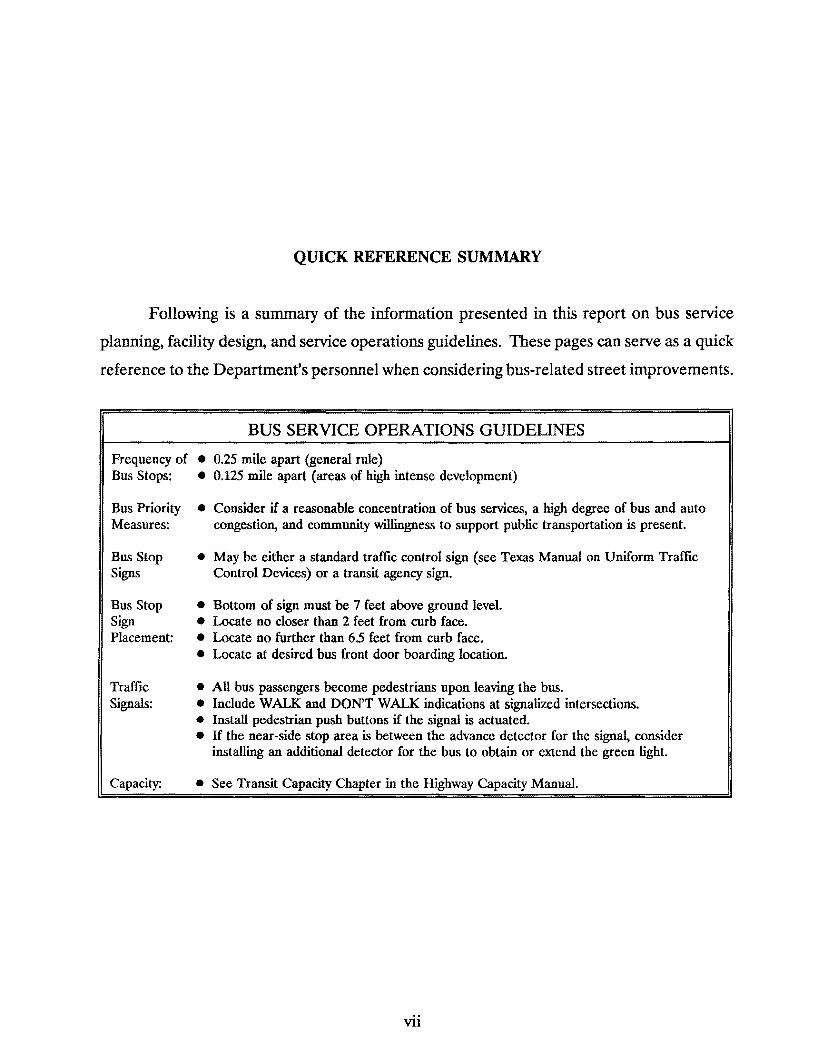
QUICK REFERENCE SUMMARY
Following is a summary of the information presented in this report on bus service
planning, facility desi~ and service operations guidelines. These pages can serve as a quick
reference to the Department's personnel when considering bus-related street improvements.
BUS SERVICE OPERATIONS GUIDELINES
Frequency of • 0.25 mile apart (general rule) Bus Stops: • 0.125 mile apart (areas of high intense development)
Bus Priority Measures:
Bus Stop Signs
Bus Stop Sign Placement:
Traffic Signals:
Capacity:
• Consider if a reasonable concentration of bus services, a high degree of bus and auto congestion, and community willingness to support public transportation is present.
• May be either a standard traffic control sign (see Texas Manual on Uniform Traffic Control Devices) or a transit agency sign.
• Bottom of sign must be 7 feet above ground level. • Locate no closer than 2 feet from curb face. • Locate no further than 6.5 feet from curb face. • Locate at desired bus front door boarding location.
• All bus passengers become pedestrians upon leaving the bus. • Include WALK and DON'T WALK indications at signalized intersections. • Install pedestrian push buttons if the signal is actuated. • If the near-side stop area is between the advance detector for the signal, consider
installing an additional detector for the bus to obtain or extend the green light.
• See Transit Capacity Chapter in the Highway Capacity Manual.
vii
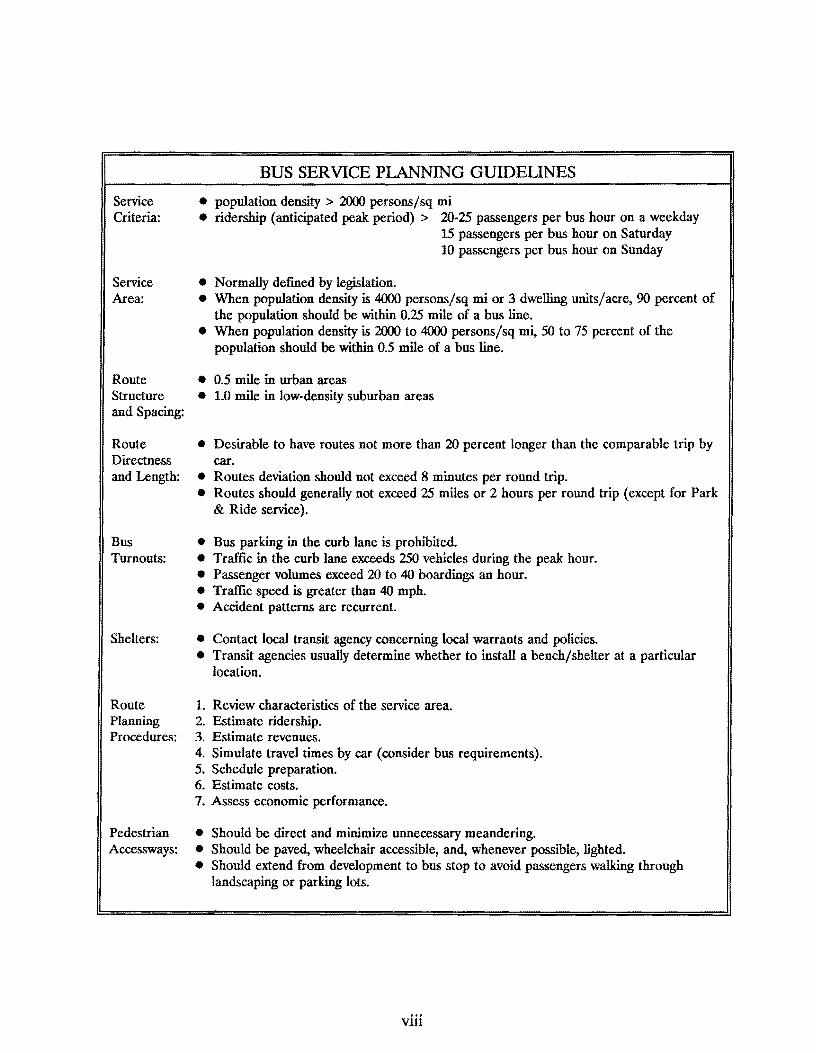
Service Criteria:
Service Area:
Route Structure and Spacing:
Route Directness and Length:
Bus Turnouts:
Shelters:
Route Planning Procedures:
BUS SERVICE PLANNING GUIDELINES
• population density > 2000 persons/sq mi • ridership (anticipated peak period) > 20-25 passengers per bus hour on a weekday
15 passengers per bus hour on Saturday 10 passengers per bus hour on Sunday
• Normally defmed by legislation. • When population density is 4000 persons/sq mi or 3 dwelling units/acre, 90 percent of
the population should be within 0.25 mile of a bus line. • When population density is 2000 to 4000 persons/sq m~ 50 to 75 percent of the
population should be within 0.5 mile of a bus line.
• 0.5 mile in urban areas • 1.0 mile in low-density suburban areas
• Desirable to have routes not more than 20 percent longer than the comparable trip by car.
• Routes deviation should not exceed 8 minutes per round trip. • Routes should generally not exceed 25 miles or 2 hours per round trip (except for Park
& Ride service).
• Bus parking in the curb lane is prohibited. • Traffic in the curb lane exceeds 250 vehicles during the peak hour. • Passenger volumes exceed 20 to 40 boardings an hour. • Traffic speed is greater than 40 mph. • Accident patterns are recurrent.
• Contact local transit agency concerning local warrants and policies. • Transit agencies usually determine whether to install a bench/shelter at a particular
location.
1. Review characteristics of the service area. 2. Estimate ridership. 3. Estimate revenues. 4. Simulate travel times by car (consider bus requirements). 5. Schedule preparation. 6. Estimate costs. 7. Assess economic performance.
Pedestrian • Should be direct and minimize unnecessary meandering. Accessways: • Should be paved, wheelchair accessible, and, whenever possible, lighted.
• Should extend from development to bus stop to avoid passengers walking through landscaping or parking lots.
viii
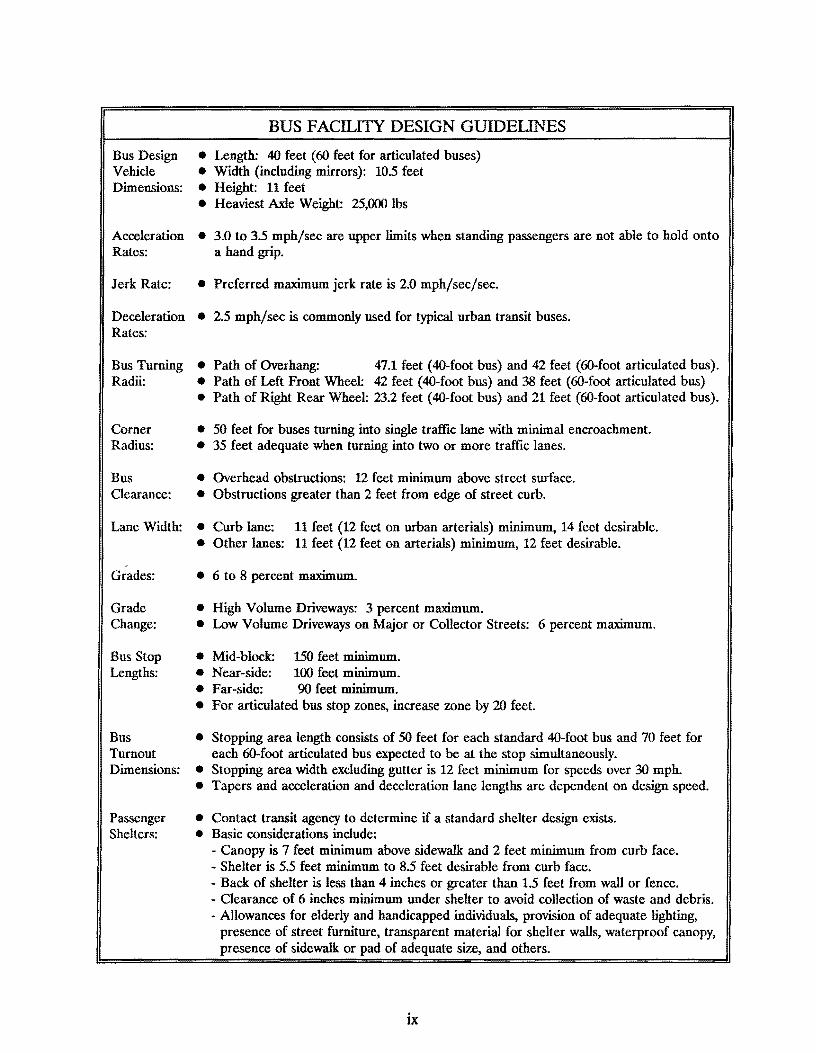
Bus Design Vehicle Dimensions:
BUS FACILITY DESIGN GUIDELINES
• Length: 40 feet ( 60 feet for articulated buses) • Width (including mirrors): 10.5 feet • Height: 11 feet • Heaviest Axle Weight: 25,000 lbs
Acceleration • 3.0 to 3.5 mph/sec are upper limits when standing passengers are not able to hold onto Rates: a hand grip.
Jerk Rate: • Preferred maximum jerk rate is 2.0 mph/sec/sec.
Deceleration • 2.5 mph/sec is commonly used for typical urban transit buses. Rates:
Bus Turning • Path of Overhang: 47.1 feet (40-foot bus) and 42 feet (60-foot articulated bus). Radii: • Path of Left Front Wheel: 42 feet (40-foot bus) and 38 feet (60-foot articulated bus)
Corner Radius:
Bus Clearance:
• Path of Right Rear Wheel: 23.2 feet (40-foot bus) and 21 feet (60-foot articulated bus).
• 50 feet for buses turning into single traffic lane with minimal encroachment. • 35 feet adequate when turning into two or more traffic lanes.
• Overhead obstructions: 12 feet minimum above street surface. • Obstructions greater than 2 feet from edge of street curb.
Lane Width: • Curb lane: 11 feet (12 feet on urban arterials) minimum, 14 feet desirable. • Other lanes: 11 feet (12 feet on arterials) minimum, 12 feet desirable.
Grades:
Grade Change:
Bus Stop Lengths:
Bus Turnout Dimensions:
Passenger Shelters:
• 6 to 8 percent maximum.
• High Volume Driveways: 3 percent maximum. • Low Volume Driveways on Major or Collector Streets: 6 percent maximum.
• Mid-block: 150 feet minimum. • Near-side: 100 feet minimum. • Far-side: 90 feet minimum. • For articulated bus stop zones, increase zone by 20 feet.
• Stopping area length consists of 50 feet for each standard 40-foot bus and 70 feet for each 60-foot articulated bus expected to be at the stop simultaneously.
• Stopping area width excluding gutter is 12 feet minimum for speeds over 30 mph. • Tapers and acceleration and deceleration lane lengths are dependent on design speed.
• Contact transit agency to determine if a standard shelter design exists. • Basic considerations include:
- Canopy is 7 feet minimum above sidewalk and 2 feet minimum from curb face. - Shelter is 5.5 feet minimum to 8.5 feet desirable from curb face. - Back of shelter is less than 4 inches or greater than 1.5 feet from wall or fence. - Clearance of 6 inches minimum under shelter to avoid collection of waste and debris. - Allowances for elderly and handicapped individuals, provision of adequate lighting,
presence of street furniture, transparent material for shelter walls, waterproof canopy, presence of sidewalk or pad of adequate size, and others.
ix

TABLE OF CONTENTS
ABSTRACT iii
IMPLEMENTATION STATEMENT . . . . . . . . . . . . . . . . . . . . . . . . . . . . . . . . . . . v
DISCLAIMER . . . . . . . . . . . . . . . . . . . . . . . . . . . . . . . . . . . . . . . . . . . . . . . . . . . v
QUICK REFERENCE SUMMARY . . . . . . . . . . . . . . . . . . . . . . . . . . . . . . . . . . . . vu
CHAPTER 1 - INTRODUCTION . . . . . . . . . . . . . . . . . . . . . . . . . . . . . . . . . . . . . 1
1.1 Background . . . . . . . . . . . . . . . . . . . . . . . . . . . . . . . . . . . . . . . . . . . . . 1
1.2 Organization of this Report . . . . . . . . . . . . . . . . . . . . . . . . . . . . . . . . . 2
1.3 Incorporating Bus Service Considerations Into The Street
Planning, Design, and Operation Processes . . . . . . . . . . . . . . . . . . . . . .
CHAPTER 2 · BUS SERVICE PLANNING GUIDELINES ................. .
2.1 General . . . . . . . . . . . . . . . . . . . . . . . . . . . . . . . . . . . . . . . . . . . . . . . .
2.2 Bus Service and Route Planning ............................. .
2.3 Bus Stops and Turnouts ................................... .
2.4 Waiting Areas and Shelters ................................. .
2.5 Pedestrian Access ........................................ .
CHAPTER 3 ·BUS FACILITY DESIGN GUIDELINES ................... .
3.1 General ............................................... .
3.2 Vehicle Characteristics
3.3 Clearances, Lane Widths, and Grades ......................... .
3.4 Intersection Design ....................................... .
Xl
3
5
5
5
6
9
10
11
11
11
16
19
TABLE OF CONTENTS (Cont.)
3.5 Pavement Design
Page
21
3.6 Bus Stops, Turnouts, and Turnarounds . . . . . . . . . . . . . . . . . . . . . . . . . 21
3.7 Shelter Area Design . . . . . . . . . . . . . . . . . . . . . . . . . . . . . . . . . . . . . . . 27
CHAPTER 4 - BUS SERVICE OPERATIONS GUIDELINES . . . . . . . . . . . . . . . . 31
4.1 General
4.2 Capacity
4.3 Bus Priority Measures ..................................... .
4.4 Signs and Pavement Markings ............................... .
4.5 Traffic Signals .......................................... .
4.6 Maintenance ........................................... .
REFERENCES .................................................. .
XU
31
31
33
36
37
38
41
1.1 BacN:round
CHAPTER 1
INTRODUCTION
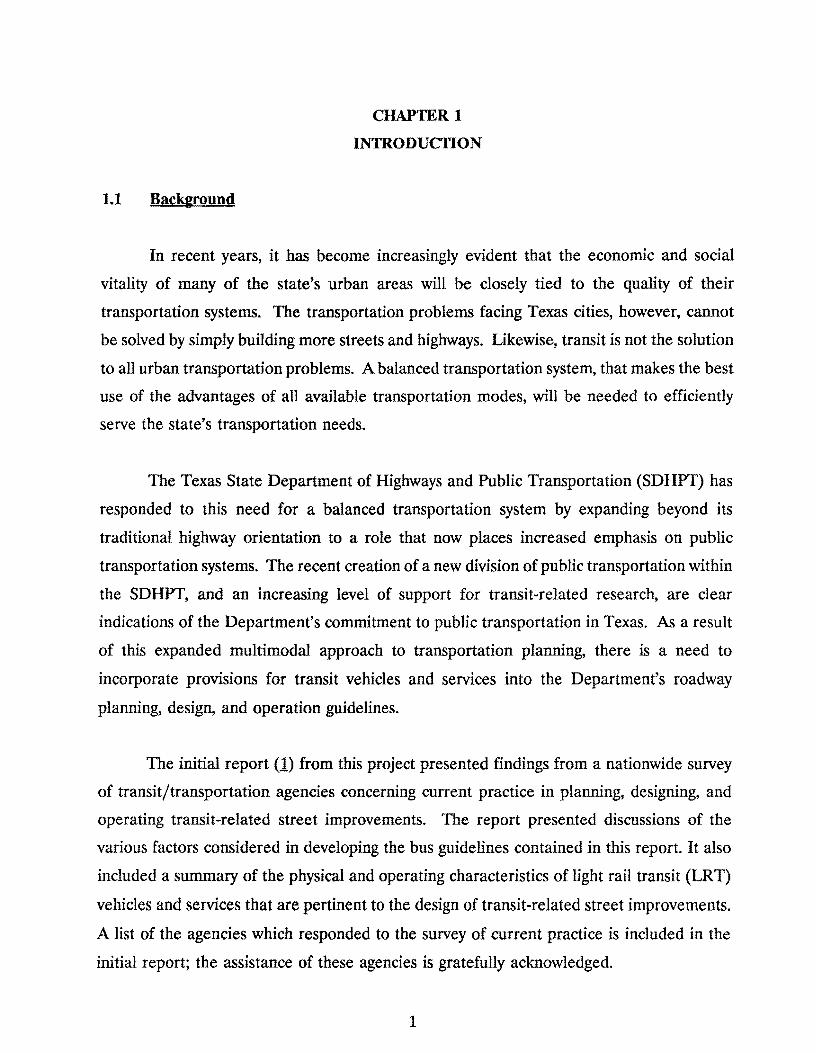
In recent years, it has become increasingly evident that the economic and social
vitality of many of the state's urban areas will be closely tied to the quality of their
transportation systems. The transportation problems facing Texas cities, however, cannot
be solved by simply building more streets and highways. Likewise, transit is not the solution
to all urban transportation problems. A balanced transportation system, that makes the best
use of the advantages of all available transportation modes, will be needed to efficiently
serve the state's transportation needs.
The Texas State Department of Highways and Public Transportation (SDHPT) has
responded to this need for a balanced transportation system by expanding beyond its
traditional highway orientation to a role that now places increased emphasis on public
transportation systems. The recent creation of a new division of public transportation within
the SDHPT, and an increasing level of support for transit-related research, are clear
indications of the Department's commitment to public transportation in Texas. As a result
of this expanded multimodal approach to transportation planning, there is a need to
incorporate provisions for transit vehicles and services into the Department's roadway
planning, design, and operation guidelines.
The initial report (1) from this project presented findings from a nationwide survey
of transit/transportation agencies concerning current practice in planning, designing, and
operating transit-related street improvements. The report presented discussions of the
various factors considered in developing the bus guidelines contained in this report. It also
included a summary of the physical and operating characteristics of light rail transit (LRT)
vehicles and services that are pertinent to the design of transit-related street improvements.
A list of the agencies which responded to the survey of current practice is included in the
initial report; the assistance of these agencies is gratefully acknowledged.
1
This report is intended to facilitate the development of a cooperative bus service
planning process in Texas by 1) outlining a general procedure for incorporating bus
considerations into the Department's street planning, design, and operation processes, and
2) providing guidelines for use by Department personnel in planning, designing, and
operating street improvements that incorporate provisions for bus operations.
1.2 Oa:anization of this Report
Bus guidelines in this report are presented in the following three chapters:
• Chapter 2 - Bus Service Planning Guidelines
• Chapter 3 - Bus Facility Design Guidelines
• Chapter 4 - Bus Service Operations Guidelines
The planning guidelines (Chapter 2) focus on bus route and service planning
considerations, and guidelines for locating bus service support facilities. The review of
planning guidelines is intended to acquaint SDHPT personnel with current bus service
planning practices. These guidelines should be of use to the Department in identifying
roadway segments and travel corridors where street and highway designs should include
provisions for bus services. The bus facility design guidelines (Chapter 3) address geometric
and structural issues that should be considered in the design of roadways and support
facilities to insure safe and efficient bus operations on surface streets. The chapter on bus
service operations guidelines (Chapter 4) summarizes information regarding capacity, signs,
traffic signals, bus priority measures, and maintenance for bus-related street improvements.
Preceding this report is a Quick Reference Summary. It contains a summary of the
information presented in Chapters 2, 3, and 4. A designer can use this "quick reference"
when selecting bus-related street improvements.
2
1.3 Incorporatin& Bus Service Considerations Into the Street Plannin&, Desi&n, and
Operation Processes
Several large cities in Texas are currently implementing major transit improvement
programs and it appears that transit will become increasingly important in serving the state's
transportation needs. However, there is more to good transit services than choosing the
appropriate technology and providing high levels of service frequency and reliability. While
the responsibility for providing safe, comfortable, and reliable transit vehicles rests with the
local transit agency, the means for assuring that transit vehicles can easily access major
service areas and that patrons can safely walk to stops and wait comfortably for transit
vehicles is generally beyond the control of the transit agency. The provision of quality
transit services, then, requires a cooperative effort involving local transit service providers,
local and state highway agencies, and private developers.
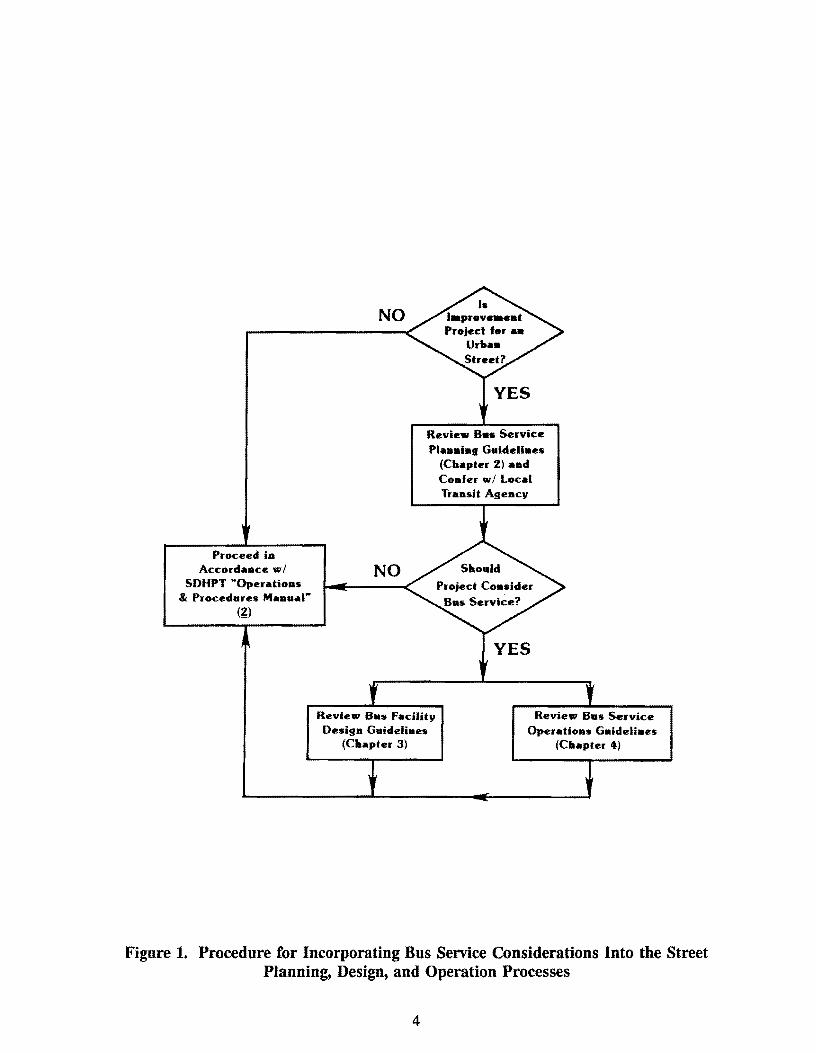
Figure 1 illustrates a general procedure for incorporating bus service considerations
into the Department's street planning, design, and operation processes. As indicated in
Figure 1, the guidelines presented in this report apply to urban streets. If a roadway project
is not an urban street project, then the planning, design, and operation process should
proceed in accordance with the Department's Operations and Procedures Manual (2). If
the improvement project is for an urban street, the Department's design staff should consult
the local transit agency (if one exists) and review the general planning guidelines in Chapter
2 to determine if the project should include provisions for bus services. If the street project
should include provisions for bus services, the guidelines presented in Chapters 3 and 4
should be reviewed to insure that the planning, design, and operation process considers the
needs of buses and bus service support facilities. The Texas Public Transit Reference
Manual GD can provide information on the planning, designing, and implementation of
public transit systems if the information is desired.
3
Proceed in Accordance w/
SDHPT "Operations & Procedures Manuar
(g)
NO
NO
YES
Review B•• Sel"vice Plaaaiag Guideli•es
(Chaptel" %} and Confe.- w/ Local T.-aasit Agency
YES
Review Bas Facility Design Guidelines
(Chapter 3)
Review Bus Sel"vice Operations Guidelines
(Chapter 4)
Figure 1. Procedure for Incorporating Bus Service Considerations Into the Street Planning, Design, and Operation Processes
4
CHAPTER2
BUS SERVICE PLANNING GUIDELINES
2.1 General
Most transit agencies have developed guidelines and policies for use in assessing
whether a transit market exists and whether that market can be served by existing or
proposed transit services. Population densities, trip generation potentials (i.e., land uses)
and characteristics of the street network are the primary factors considered by transit
agencies in planning new or improved services. This chapter presents a brief overview of
these basic service planning factors for buses. These factors should be useful in identifying
roadway segments and travel corridors where street designs should include provisions for
buses and bus service support facilities.
While the basic factors outlined in this chapter are commonly used by transit agencies
in planning transit services, specific factors and threshold values may vary from city to city.
Therefore, it is recommended that the local transit agency be consulted concerning specific
local service planning guidelines.
2.2 Bus Service and Route Planning
The following service and route planning guidelines are representative of practice in
the United States (~):
• Service Criteria. Bus service should be considered where 1) population density
exceeds 2000 persons/sq. mile and 2) anticipated peak period ridership exceeds
20 to 25 passengers per bus hour on weekdays, 15 on Saturdays, and 10 on
Sundays. Route continuity and transfer requirements may lower these factors.
• Service Area. The transit service area is normally defined by legislation. Where
population density within this area exceeds 4000 persons/sq. mile, or 3 dwelling
5
units per acre, 90 percent of the residences should be within 0.25 mile of a bus
line. Where population density ranges from 2000 to 4000 persons/sq. mile, 50 to
75 percent of the population should be within 0.5 mile of a bus line.
• Route Structure and Spacing. Bus routes should fit major street patterns. Basic
grid systems are appropriate where streets are in a grid pattern; radial or radial
circumferential systems are applicable where radial or irregular street patterns
exist. Bus routes should be spaced at approximately 0.5 mile in urban areas and
1 mile in low-density suburban areas. Closer spacing should be provided where
terrain inhibits walking.
• Route Directness and Length. Circuitous or "off-route" routings (deviations from
a direct and simple route) should be avoided. A route not more than 20 percent
longer than the comparable trip by car is desirable. Route deviation should not
exceed 8 minutes per round trip (based on at least 10 additional customers per
round trip). Routes should be as short as possible to serve their markets, and
generally should not exceed 25 miles or 2 hours per round trip (except for Park
& Ride service).
• Route Planning Procedures. Key steps in planning route changes include: 1) a
review of characteristics of the service area, including physical feasibility for bus
operations; 2) an estimate of ridership (often by comparison with similar areas);
3) an estimate of revenues; 4) a simulation of travel times by car, considering bus
requirements; 5) schedule preparation; 6) an estimate of costs; and 7) an
assessment of economic performance.
2.3 Bus Stops and Turnouts
In transit service planning it is generally assumed that most patrons will not walk
more than 0.25 mile to a transit stop. As a result, bus stops should be placed no more than
6
0.25 mile apart, as a general rule. In areas of high density development, transit stops may
be necessary as frequently as every two blocks (0.125 mile apart).
The determination of the proper location of transit stops involves choosing between
far-side, near-side, and mid-block stops. Advantages and disadvantages of each bus stop
type are compared in Table 1. The following factors should also be considered when
selecting the type of bus stop:
• potential patronage
• passenger origins and destinations
• pedestrian access including accessibility for handicap /wheelchair patrons
• adjacent land use and activities
• intersection geometrics
• parking restrictions and requirements
• traffic control devices
• physical roadside constraints (trees, poles, driveways, etc.)
• intersecting transit routes
A turnout is a specialized bus stop where the transit vehicle can pick up and
discharge passengers in an area separated from the main lanes. A turnout allows through
traffic to flow freely without being impeded by stopped buses. Many transit planners and
engineers believe the most appropriate use for bus turnouts is on roadways that experience
high volumes of traffic. Although this appears to be an accurate assessment, frequently a
bus turnout can be counter-productive in high volume situations if inadequate acceleration
and deceleration distance is provided. Many times, high traffic volumes will not allow
sufficient gaps for the bus operator to safely and comfortably return the vehicle to the main
lanes. The provision of an acceleration lane in a turnout design enables a bus to obtain a
speed that is within an acceptable range of the through traffic speed and to more
comfortably merge with the through traffic. The presence of a deceleration lane enables
buses to decelerate without inhibiting through traffic. Turnouts without acceleration or
deceleration lanes should be considered only at locations where buses may be stopped for
long periods of time.
7
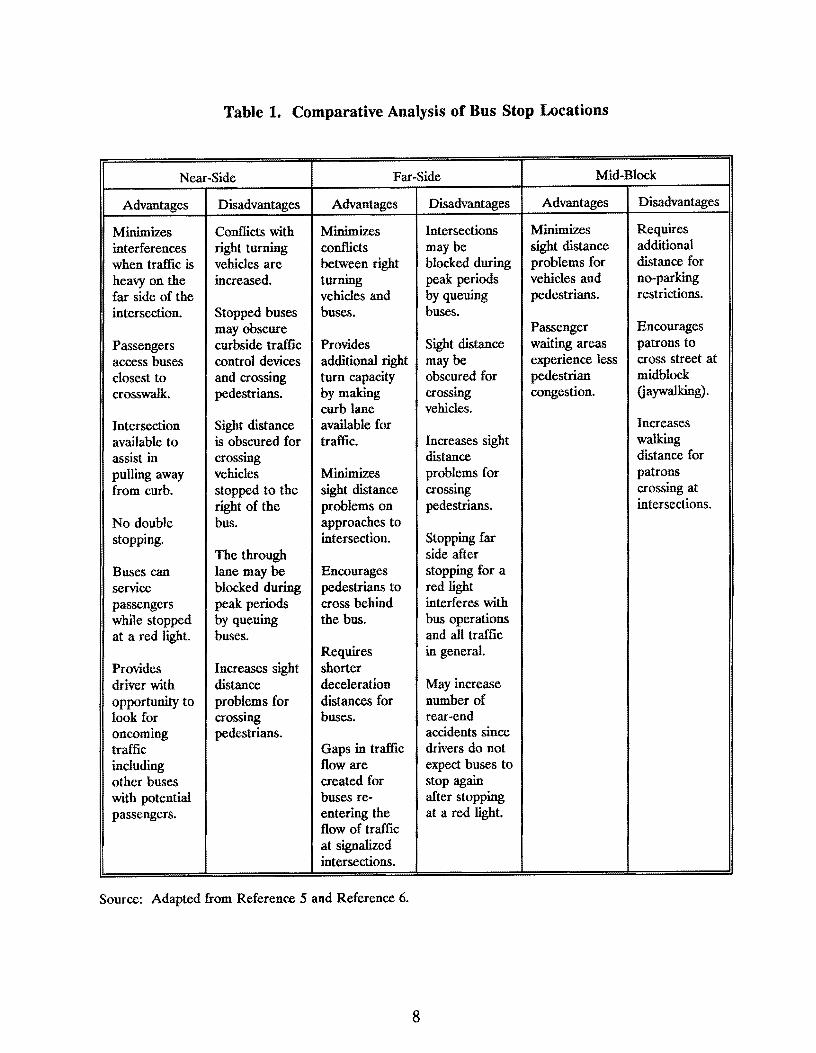
Table 1. Comparative Analysis of Bus Stop Locations
Near-Side Far-Side Mid-Block
Advantages Disadvantages Advantages Disadvantages Advantages Disadvantages
Minimizes Conflicts with Minimizes Intersections Minimizes Requires
interferences right turning conflicts maybe sight distance additional
when traffic is vehicles are between right blocked during problems for distance for
heavy on the increased. turning peak periods vehicles and no-parking far side of the vehicles and by queuing pedestrians. restrictions.
intersection. Stopped buses buses. buses. may obscure Passenger Encourages
Passengers curbside traffic Provides Sight distance waiting areas patrons to
access buses control devices additional right maybe experience less cross street at
closest to and crossing turn capacity obscured for pedestrian mi db lock crosswalk. pedestrians. by making crossing congestion. (jaywalking).
curb lane vehicles. Intersection Sight distance available for Increases
available to is obscured for traffic. Increases sight walking assist in crossing distance distance for
pulling away vehicles Minimizes problems for patrons from curb. stopped to the sight distance crossing crossing at
right of the problems on pedestrians. intersections. No double bus. approaches to stopping. intersection. Stopping far
The through side after Buses can lane may be Encourages stopping for a service blocked during pedestrians to red light passengers peak periods cross behind interferes with while stopped by queuing the bus. bus operations at a red light. buses. and all traffic
Requires in general. Provides Increases sight shorter driver with distance deceleration May increase opportunity to problems for distances for number of look for crossing buses. rear-end oncoming pedestrians. accidents since traffic Gaps in traffic drivers do not including flow are expect buses to other buses created for stop again with potential buses re- after stopping passengers. entering the at a red light.
flow of traffic at signalized intersections.
Source: Adapted from Reference 5 and Reference 6.
8
Generally, bus turnouts should be considered when at least one of the following conditions
is met:
• Bus parking in the curb lane is prohibited.
• Traffic in the curb lane exceeds 250 vehicles during the peak hour.
• Passenger volumes exceed 20 to 40 boardings an hour.
• Traffic speed is greater than 40 mph.
• Accident patterns are recurrent.
Where appropriate, the right-of-way for a future turnout should be obtained or
reserved to satisfy projected needs.
2.4 Waitint: Areas and Shelters
Comfortable and secure passenger waiting areas need to be provided at transit stops.
These consist of spaces apart from the normal sidewalk for passengers to congregate, sit,
and be protected from the weather. A paved landing area located immediately adjacent to
the stopped bus for boarding and alighting passengers is also very important. Generally, bus
stops should work efficiently and provide passenger comfort, safety, and personal security.
In the central business district area where buildings are near sidewalks, a shelter may
be created by attaching a canopy to the building. In addition to requiring less space than
a stand-alone shelter, the canopies may increase pedestrian traffic for the businesses.
A sheltered waiting area is important to the transit patron because it provides relief
from adverse weather. However, resources may not exist to provide a shelter at every bus
stop. Therefore, many transit agencies have established guidelines to determine which bus
stops should include shelters. These guidelines are generally based on the number of
boarding and/ or transferring passengers at each stop and the frequency of service at each
stop. It is suggested that the roadway designer contact the local transit agency concerning
local warrants and policies for waiting areas and shelters.
9
2.5 Pedestrian Access
One of the factors affecting transit use is accessibility. Land use activities should be
arranged to facilitate the movement of people from their origins (residence) to local transit
services and back again. This can be achieved through pedestrian walkways ( accessways)
between transit stops and adjacent land uses.
The primary considerations relative to maximizing accessibility to transit services are:
• Accessways should be direct, and should minimize unnecessary meandering.
• Accessways should be paved, wheelchair accessible and, whenever possible,
lighted.
• Accessways should extend from the development to the bus stop, to avoid bus
passengers walking through landscaping or parking lots to access buses.
While it is recognized that the Department has little direct control over these factors,
the designer should be sensitive to these factors in dealing with local transportation agencies
and property owners/ developers.
10
CHAPTER3
BUS FACILI1Y DESIGN GUIDELINES
3.1 General
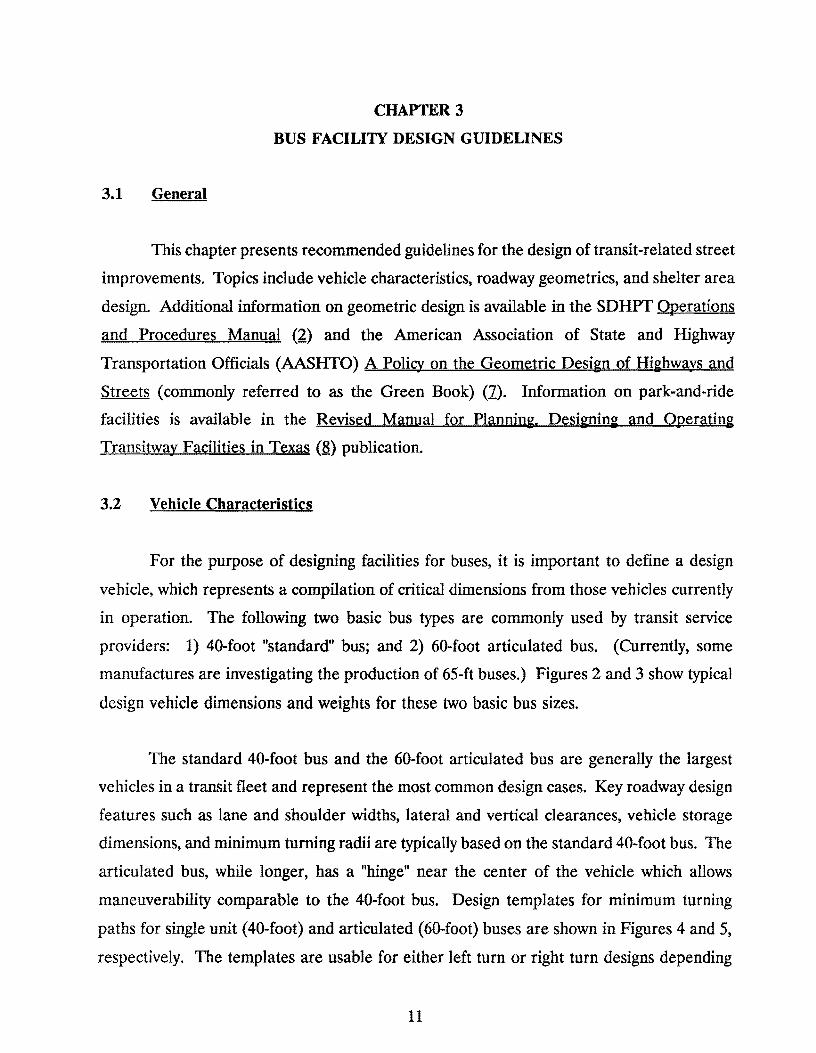
This chapter presents recommended guidelines for the design of transit-related street
improvements. Topics include vehicle characteristics, roadway geometrics, and shelter area
design. Additional information on geometric design is available in the SDHPT Operations
and Procedures Manual (2) and the American Association of State and Highway
Transportation Officials (AASHTO) A Policy on the Geometric Design of Highways and
Streets (commonly referred to as the Green Book) (1). Information on park-and-ride
facilities is available in the Revised Manual for Planning. Desifming and Operating
Transitway Facilities in Texas (H) publication.
3.2 Vehicle Characteristics
For the purpose of designing facilities for buses, it is important to define a design
vehicle, which represents a compilation of critical dimensions from those vehicles currently
in operation. The following two basic bus types are commonly used by transit service
providers: 1) 40-foot "standard" bus; and 2) 60-foot articulated bus. (Currently, some
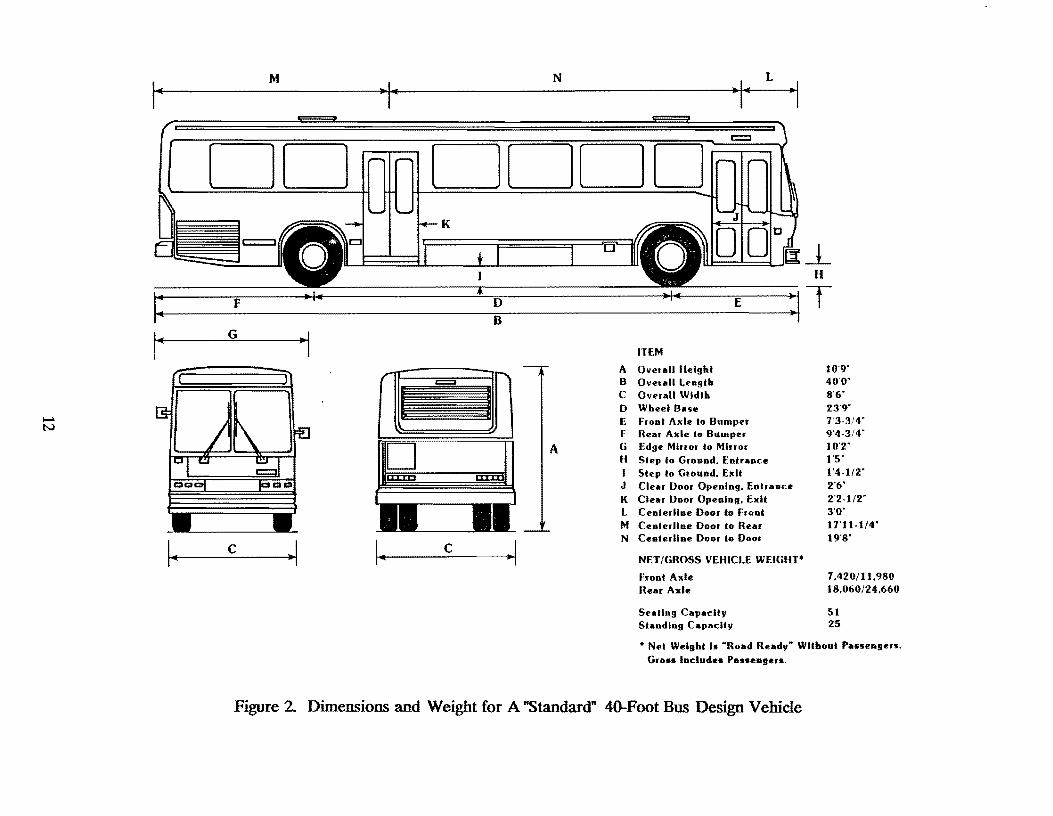
manufactures are investigating the production of 65-ft buses.) Figures 2 and 3 show typical
design vehicle dimensions and weights for these two basic bus sizes.
The standard 40-foot bus and the 60-foot articulated bus are generally the largest
vehicles in a transit fleet and represent the most common design cases. Key roadway design
features such as lane and shoulder widths, lateral and vertical clearances, vehicle storage
dimensions, and minimum turning radii are typically based on the standard 40-foot bus. The
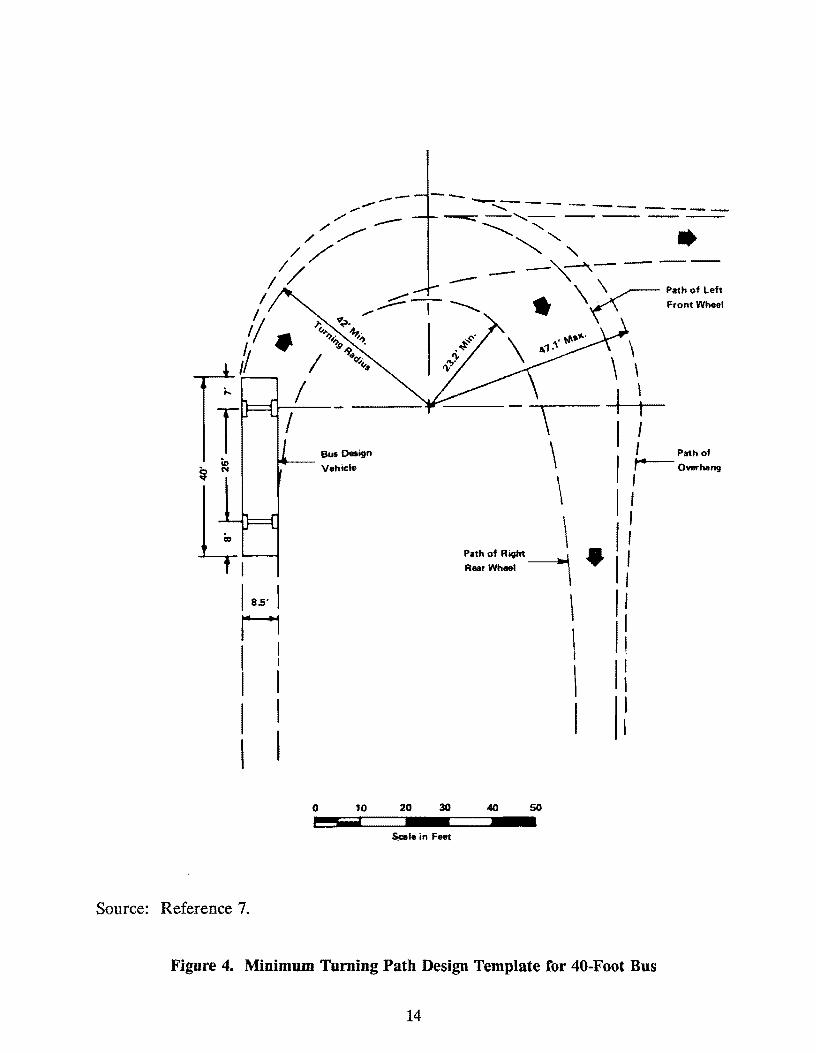
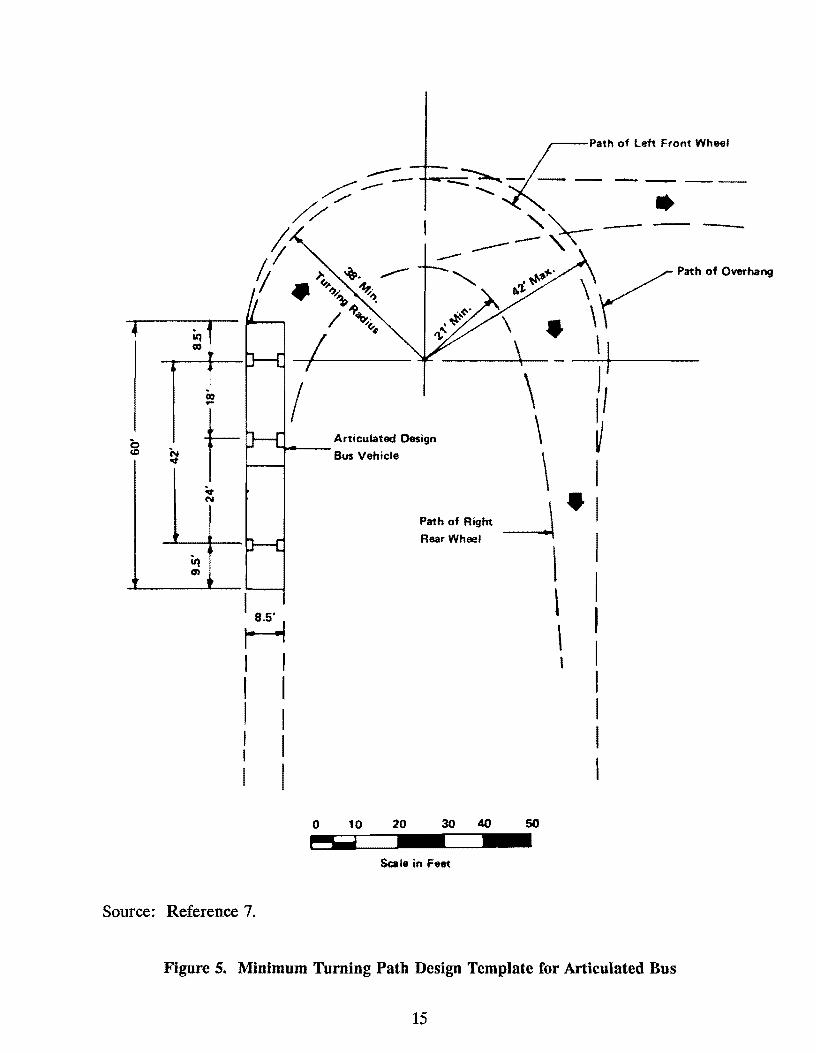
articulated bus, while longer, has a "hinge" near the center of the vehicle which allows
maneuverability comparable to the 40-foot bus. Design templates for minimum turning
paths for single unit (40-foot) and articulated (60-foot) buses are shown in Figures 4 and 5,
respectively. The templates are usable for either left turn or right turn designs depending
11
1~ M N L
DD DODD K
0
H
-1:~-F~~~~~~~~~~~~~E--:1T ,. G ~1 ITEM
A Overall Height 10·9·
I B Overall length 40·0·
c Overall Width 8'6" D Wheel Base 23·9·
E Front Axle to Bumper 7'3-3/4" F Rear Axle to Bumper 9'4-3/4"
A G Edge Mirror to Mirror 10'2" H Slep to Ground. Entrance I'S"
I Step to Ground, Exit 1'4-1/2" J Clear Door Opening, Entrance 2'6"
K Clear Door Opening, Exit 2'2-112" L Cenlerllne Door to Front 3·0·
M Centerline Door to Rear 17'11-1/4' N Centerline Door lo Door 19'8"
NET/GROSS VEHICLE WEIGHT*
Front Axle 7,420/11,980 Rear Axle 18.060/24.660
Sealing Capacity 51 Standing Capacity 25
• Net Weight Is •Road Ready" Without Passengers. Gross Includes Passengers.
Figure 2. Dimensions and Weight for A "Standard" 40-Foot Bus Design Vehicle

1~ M
I:
·1· N
( JOO( J( Q
D
01
* Net Weight is uRoad Ready~ Without Passengers. Gross Includes Passengers.
•1-t L •1
.1"" E :l~H
ITEM
A Overall Height B Overall Length C Overall Width D Wheel Base (Dl/D2) E Front Axle to Bumper F Rear Axle to Bumper G Edge Mirror to Mirror H Step to Ground, Entrance I Step to Ground, Exit
J Clear Door Opening, Entrance K Clear Door Opening, Exit L Centerline Door to Front M Centerline Door to Rear N Centerline Door to Door
NET/GROSS VEHICLE WEIGHT*
Front Axle Rear Axle Center Axle
MAXIMUM BEND ANGLE
Horizontal Vertical
Seating Capacity
Figure 3. Dimensions and Weight For An Articulated Bus Design Vehicle
10'4" 59'10' 8'6' 18'7" /24'0" 5·5· 8'8" 10'6" 1'2' 1'2" 3'8" 3'6' 3'6' 21'4' 35'0"
11,800/16,420 12,130/16,420
14,970/24,250
± 36 deg ± 11 deg
70
I
I a5· I Ii I I I I I I l I
Source: Reference 7.
0
-- ....._""'_ - - - - -~ _,_ - --==-=-=-
-......... ' "''" •
--""'~------ \ ~ Path of Left
,,,.,. _::::::I --......_ • \ , \ Front Wheel
Bus Design Vehicle
10 20 30
\ \ \ \
Path of Right -------;
Rear Wheel \
40 50
\
\
I I
\ \ I ' t I I
I / Path of
r--oYl!l'hang
I I I ' •'I I 1
11
11
I l I I
--- -Sc::ale in Feet
Figure 4. Minimum Turning Path Design Template for 40-Foot Bus
14
Cl) ...
I
. ' iq en . ,
/Path of Left Front Wheel
~ :::::-- -+--=-~~ - -- - -.- -- --
// I "-"'- ----{ -- ----- ,~
iJ )'; ~- ,,.-/ • ""'~,~ 4,;~
~ I ~G., I ~ I
I
\ • \
Articulated Design
\ \
~-
I s .
~ I I I I I I I I I I
Bus Vehicle
\ Path of Right _j Rear Wheel
\ \ \
0 10 20 30 40 50
Sea le in Feet
\ y Path of o .......
\ J
Source: Reference 7.
Figure 5. Minimum Turning Path Design Template for Articulated Bus
15

on how the template is oriented (i.e., either face-up for right turn design or face-down for
left turn design).
The maximum rate of acceleration, deceleration, and rate of change of acceleration
and deceleration (jerk) is related to the tolerance of a standing passenger who is not able
to hold onto a hand grip. This condition occurs when passengers have both hands full (e.g.,
with bundles), when they cannot reach a hand grip, or when a hand grip is not available.
The jerk rate is more critical to passenger comfort, however, the rates of acceleration and
deceleration are also important. Acceleration and deceleration rates from 3.0 to 3.5
mph/sec are usually considered appropriate upper limits for the conditions described above.
A deceleration rate of 2.5 mph/sec is commonly used for typical urban transit buses. A
preferred maximum jerk rate is 2.0 mph/sec/sec; an allowable maximum jerk rate is about
50 percent above this value (2).
3.3 Clearances, Lane Widths, and Grades
Because of the need to make frequent stops, buses generally travel on the traffic lane
closest to the curb. Therefore, it is important to consider bus clearance requirements in
roadway design. Obstructions should be located greater than 2 feet from the street curb to
avoid being struck by a bus mirror. Because the maximum bus width (including mirrors)
is about 10.5 feet, a traffic lane used by buses should be no narrower than 12 feet in width.
These lane widths are consistent with the preferred lane widths recommended by AASHTO
for various urban street classifications (see Table 2). Desirably the curb lane width
(including the gutter) should be 14 feet to allow buses freedom of movement and to avoid
sideswipe accidents. Overhead obstructions should be a minimum of 12 feet above the
street surface.
Grades should be selected to provide uniform operation throughout the roadway
segment. Selection of the roadway grade is related to topography and the potential to
balance quantities of cut and fill material, while still providing a roadway that can be
traversed safely and economically. Table 3 shows recommended maximum roadway grades
16
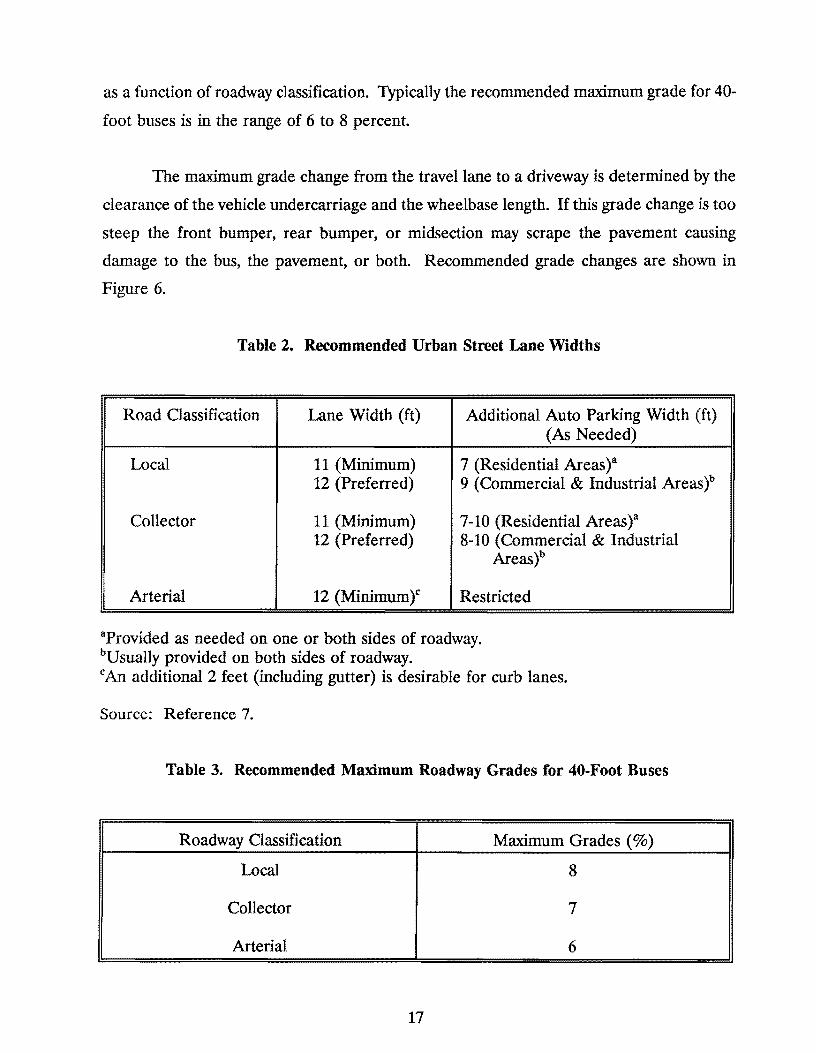
as a function of roadway classification. Typically the recommended maximum grade for 40-
foot buses is in the range of 6 to 8 percent.
The maximum grade change from the travel lane to a driveway is determined by the
clearance of the vehicle undercarriage and the wheelbase length. If this grade change is too
steep the front bumper, rear bumper, or midsection may scrape the pavement causing
damage to the bus, the pavement, or both. Recommended grade changes are shown in
Figure 6.
Table 2. Recommended Urban Street Lane Widths
Road Classification Lane Width (ft) Additional Auto Parking Width (ft) (As Needed)
Local 11 (Minimum) 7 (Residential Areas )a 12 (Preferred) 9 (Commercial & Industrial Areas )b
Collector 11 (Minimum) 7-10 (Residential Areast 12 (Preferred) 8-10 (Commercial & Industrial
Areas)b
Arterial 12 (Minimum)c Restricted
aProvided as needed on one or both sides of roadway. bUsually provided on both sides of roadway. cAn additional 2 feet (including gutter) is desirable for curb lanes.
Source: Reference 7.
Table 3. Recommended Maximum Roadway Grades for 40-Foot Buses
Roadway Classification Maximum Grades ( % )
Local 8
Collector 7
Arterial 6
17

LEGEND
Edge of Pavement or Shoulder \
Gd= Driveway Grade
CS = Cross Slope on Road or Shoulder, Typically 2.0 Percent
I I I
D Grade Change
cs I
Street or Shoulder Driveway
High Volume Driveway
Low Volume Driveway on Major
or Collector Streets
Low Volume Driveway on Local
Streets
D -
Recommended Grade Change (D)
Desirable Maximum*
0% +3%
0 to +3% +6%
0 to +6% Controlled by Vehicle Clearance
* Grade changes greater than the maximum should use a vertical curve to transition from the street to the driveway
Source: Adapted from Reference 10.
Figure 6. Recommended Grade Changes for Driveways
18
3.4 Intersection Desiam
Corner curb radii at street intersections are a common bus-related design problem.
Some of the advantages of a properly designed corner curb radius are:
• Less bus/auto conflict at heavily used intersections
• Higher bus operating speeds and reduced travel time
• Improved bus rider comfort
The design of intersection radii should be based on the following elements:
• Design vehicle characteristics
• Width and number of lanes on the intersecting street
• Allowable bus encroachment into other traffic lanes
• Bus turning radius
• On street parking
• Right-of-way /building restrictions
• Angle of intersection
• Operating speed and speed reductions
• Pedestrians
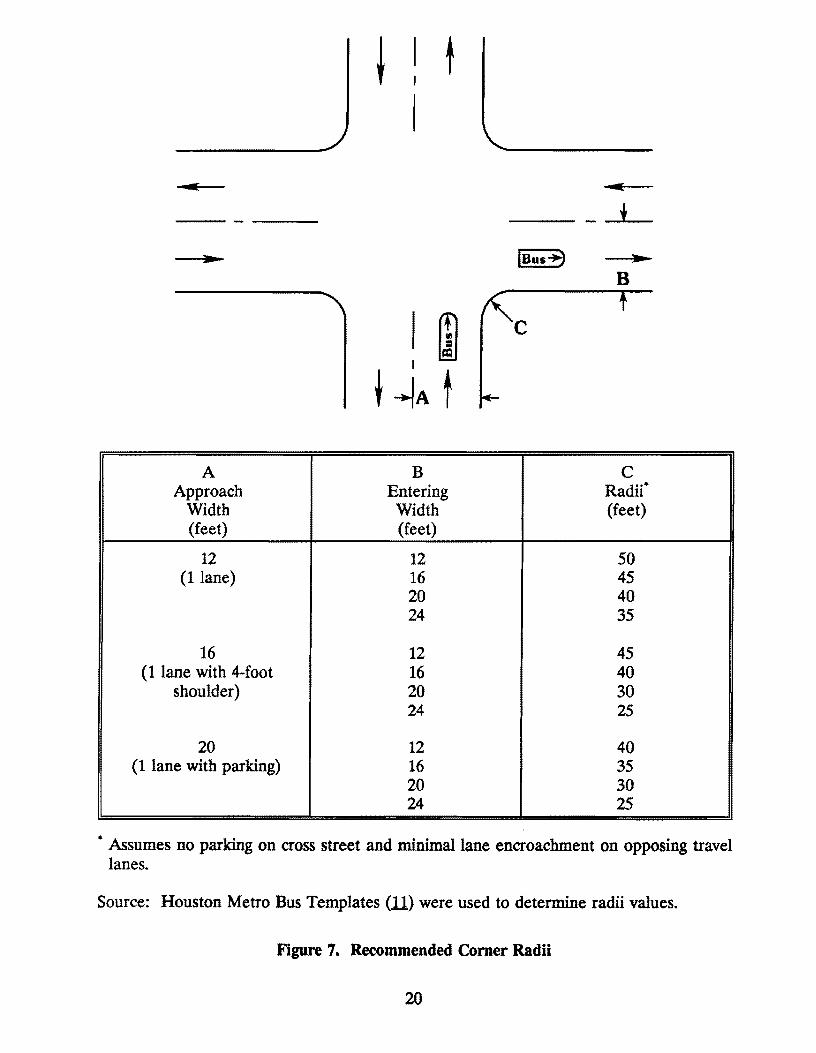
Figure 7 shows appropriate corner radii for transit vehicles and various combinations
of lane widths. This figure should be used as a starting point; the radii values should be
checked with an appropriate turning radius template before being incorporated into a final
design.
If parking is allowed on either the approach street or the cross street, parking
restrictions should be enforced to avoid conflicts and facilitate bus turning movements. On
the approach, parking should be prohibited a minimum of 15 feet prior to the point of curve
of the radius. On the cross street, parking should be prohibited a minimum of 40 feet from
the point of tangent of the curb radius (5.).
19
t
* B
c
A B c Approach Entering Radii*
Width Width (feet) (feet) (feet)
12 12 50 (1 lane) 16 45
20 40 24 35
16 12 45 ( 1 lane with 4-foot 16 40
shoulder) 20 30 24 25
20 12 40 (1 lane with parking) 16 35
20 30 24 25
• Assumes no parking on cross street and minimal lane encroachment on opposing travel lanes.
Source: Houston Metro Bus Templates (.ll) were used to determine radii values.
Figure 7. Recommended Comer Radii
20
Sight distance at intersections should consider vehicles that utilize the facility with
reasonable frequency. When significant bus traffic exists, intersection sight distance design
should consider their characteristics, for example, their slower acceleration rates and longer
vehicle lengths. Intersection sight distance procedures are discussed in the Green Book (1).
3.5 Pavement Desim
The pavement design for roadways used by buses is similar to normal pavement
design. The following factors are important in designing an adequate pavement structural
section:
• Bus axle weights
• Projected bus volumes
• Pavement material strengths
• Subgrade soil conditions
Roadway pavements used by buses need to be of sufficient depth to accommodate
bus axle loads approaching 25,000 pounds. The detailed design of pavement sections will
depend upon site specific soil conditions and should follow local pavement design practices.
Pavements in bus stop areas and layover locations, especially in areas of high bus
volumes, should be given special consideration. While pavements at bus stop areas or
layover locations can be either asphalt or concrete, a concrete pad has the advantage of
resistance to shoving, rutting, and petroleum deterioration.
3.6 Bus Stops, Turnouts, and Turnarounds
Bus stops should consider passenger loading and unloading that is occurring adjacent
to the street curb. Sidewalks and wheelchair access ramps should be provided at all stops.
21
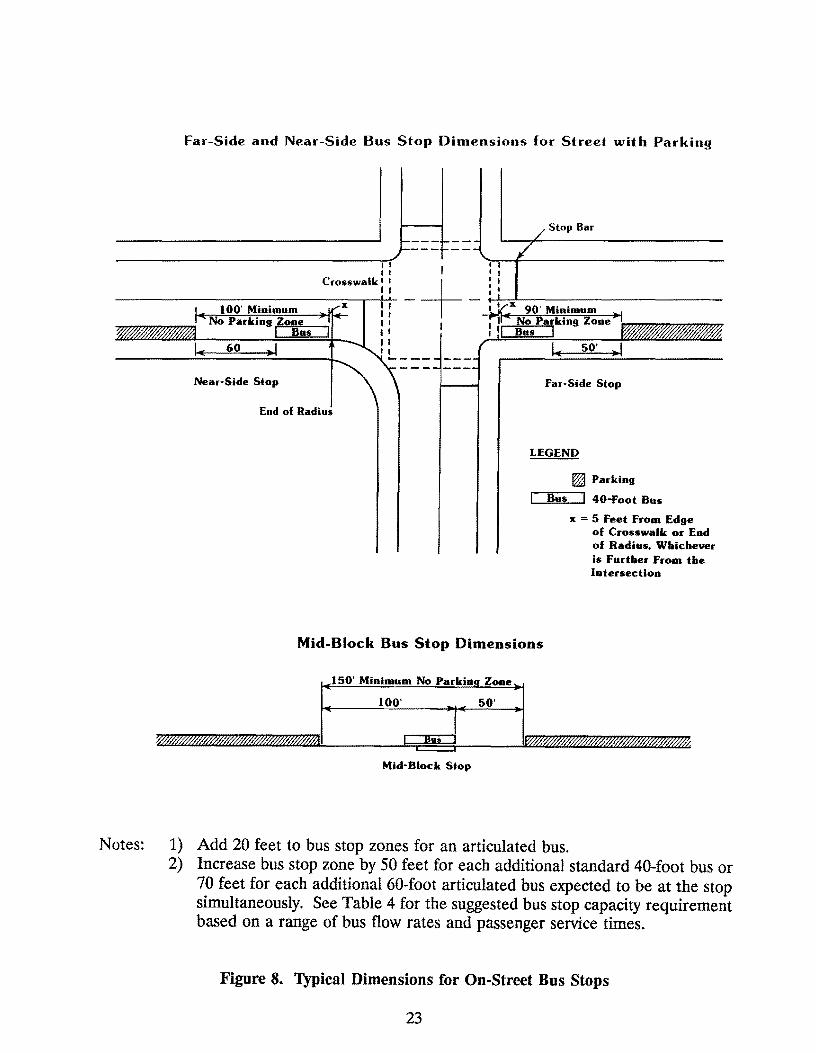
Bus stop zones for near-side and far-side stops should be a minimum of 100 and 90
feet, respectively, and mid-block stops should be a minimum of 150 feet. When articulated
buses are used, the zone should be increased by 20 feet. Additional length should be
provided for multiple buses as indicated in the following paragraph. Representative
dimensions for bus stop zones are illustrated in Figure 8.
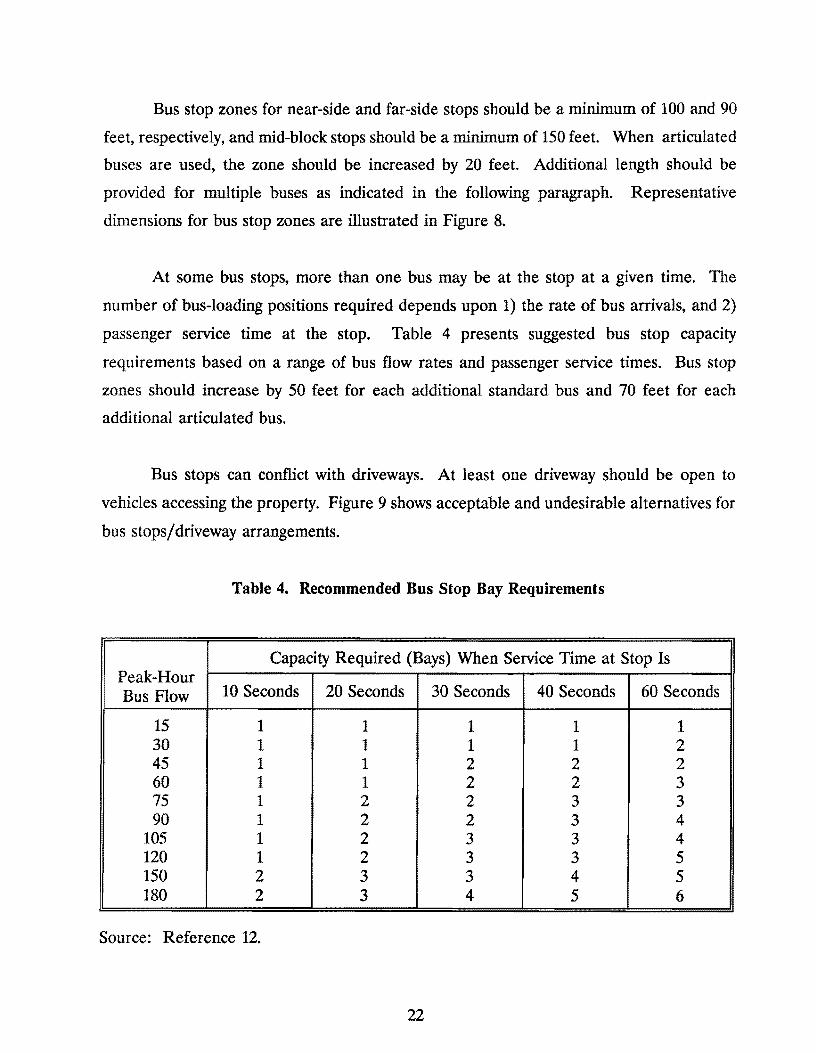
At some bus stops, more than one bus may be at the stop at a given time. The
number of bus-loading positions required depends upon 1) the rate of bus arrivals, and 2)
passenger service time at the stop. Table 4 presents suggested bus stop capacity
requirements based on a range of bus flow rates and passenger service times. Bus stop
zones should increase by 50 feet for each additional standard bus and 70 feet for each
additional articulated bus.
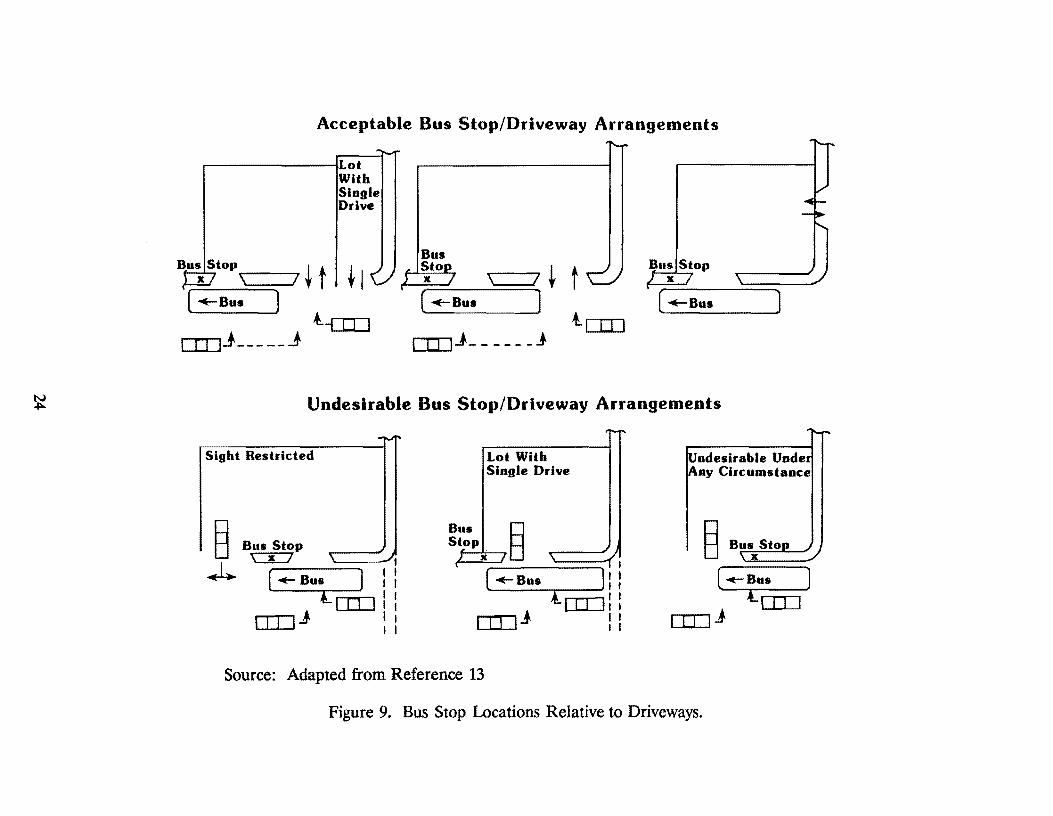
Bus stops can conflict with driveways. At least one driveway should be open to
vehicles accessing the property. Figure 9 shows acceptable and undesirable alternatives for
bus stops/driveway arrangements.
Table 4. Recommended Bus Stop Bay Requirements
Capacity Required (Bays) When Service Time at Stop Is Peak-Hour
10 Seconds 20 Sec 1 30 Seconds 4(1 ~PCOnds 60 Seconds Bus Flow
15 1 1 1 1 1 30 1 1 1 1 2 45 1 1 2 2 2 60 1 1 2 2 3 75 1 2 2 3 3 90 1 2 2 3 4
105 1 2 3 3 4 120 1 2 3 3 5 150 2 3 3 4 5 180 2 3 4 5 6
Source: Reference 12.
22
Notes:
Far-Side and Near-Side Bus Stop Dimensions for Street with Parking
60
Near-Side Stop
I I I I
Crosswalk I I , ,
End of Radius
--- ------ --- ...
/Stop Bar
7
1..- so· ... I
Far-Side Stop
LEGEND
~Parking
~B-u_s_I 40-Foot Bus
x = 5 Feet From Edge of Crosswalk or End of Radius, Whichever is Further From the Intersection
Mid-Block Bus Stop Dimensions
1
:150' Mta1~;m No Pa•k~•·.:~••:i
~ ,;J ~ Mid-Block Stop
1) Add 20 feet to bus stop zones for an articulated bus. 2) Increase bus stop zone by 50 feet for each additional standard 40-foot bus or
70 feet for each additional 60-foot articulated bus expected to be at the stop simultaneously. See Table 4 for the suggested bus stop capacity requirement based on a range of bus flow rates and passenger service times.
Figure 8. Typical Dimensions for On-Street Bus Stops
23
~
Acceptable Bus Stop/Driveway Arrangements
~~~~~~~-JLot
With Single Drive
B,usl~top 1
[ :_Bu: J d t J +I l
OIJj _____ _j -aIJ [IIJ.l ______ j
BusjStop , . x
l[Il] c..;=B~H =1
Undesirable Bus Stop/Driveway Arrangements
Sight Restricted
o:o.J
Lot With Single Drive
...,...,...
e::"'I R s~t1 /
[-Bu• {: { 11
CilJ j rn::J I : I I I I
.
ndesirable Unde ny Circumstance
Source: Adapted from Reference 13
Figure 9. Bus Stop Locations Relative to Driveways.
A bus turnout is a specially constructed area off the normal roadway section to
provide for bus loading and unloading. Turnouts are provided primarily on high volume or
high speed roadways. Additionally, bus turnouts are frequently constructed in heavily
congested downtown and shopping areas where large numbers of passengers may board and
disembark. General planning guidelines for assessing the need for bus turnouts were
presented in Section 2.3.
Desirably, the total length of the bus turnout should consist of entering and exiting
tapers, acceleration and deceleration lanes, and a stopping area. Common practice,
however, is to accept deceleration and acceleration in the through lanes and to only build
the tapers and the stopping area. Provision for deceleration and acceleration clear of the
through-traffic lanes is a desirable objective on arterial roads and should be incorporated
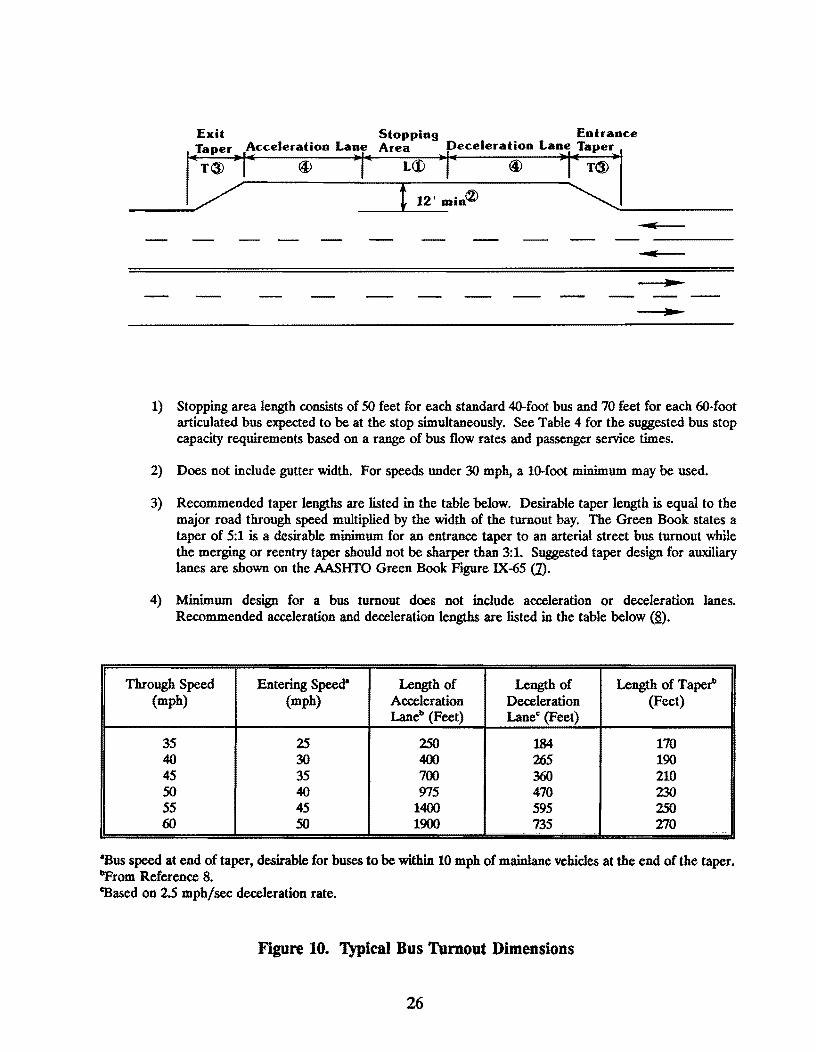
in design wherever feasible. Typical bus turnout dimensions (minimum and recommended)
are shown in Figure 10.
A turnaround is a roadway designed for use as a bus layover area, and to allow buses
to reverse direction (turn around) at the end of a route. The following are situations where
turnarounds should be considered.
• On-street layovers cannot be tolerated because the roadway does not allow for
vehicle parking.
• The intersecting minor streets cannot accommodate the axle weights of a bus.
• The neighboring environment is sensitive to bus operations.
• The on-street routing necessary for the bus to reverse directions would require an
unacceptable amount of unproductive mileage.
25
Exit Stopping Entrance Taper Acceleration Lane Area Deceleration Lane Taper I I• T® •1• @
11111: L()) •1• @ •1• T® •·
__ / t 12' min® ~-----
..
1) Stopping area length consists of 50 feet for each standard 40-foot bus and 70 feet for each 60-foot articulated bus expected to be at the stop simultaneously. See Table 4 for the suggested bus stop capacity requirements based on a range of bus flow rates and passenger service times.
2) Does not include gutter width. For speeds under 30 mph, a 10-foot minimum may be used.
3) Recommended taper lengths are listed in the table below. Desirable taper length is equal to the major road through speed multiplied by the width of the turnout bay. The Green Book states a taper of 5:1 is a desirable minimum for an entrance taper to an arterial street bus turnout while the merging or reentry taper should not be sharper than 3:1. Suggested taper design for auxiliary lanes are shown on the AASHTO Green Book Figure IX-65 (1).
4) Minimum design for a bus turnout does not include acceleration or deceleration lanes. Recommended acceleration and deceleration lengths are listed in the table below (B).
Through Speed Entering Speed" Length of Length of Length of Taper'> (mph) (mph) Acceleration Deceleration (Feet)
Laneb (Feet) Lanec (Feet)
35 25 250 184 170 40 30 400 265 190 45 35 700 360 210 50 40 975 470 230 55 45 1400 595 250 60 50 1900 735 270 ...
•Bus speed at end of taper, desirable for buses to be within 10 mph of mainlane vehicles at the end of the taper. bFrom Reference 8. CSased on 2.5 mph/sec deceleration rate.
Figure 10. Typical Bus Turnout Dimensions
26
• The current layover or route reversal maneuver, though once acceptable, has
become hazardous due to increases in traffic or due to other changes which have
been made in the roadway system.
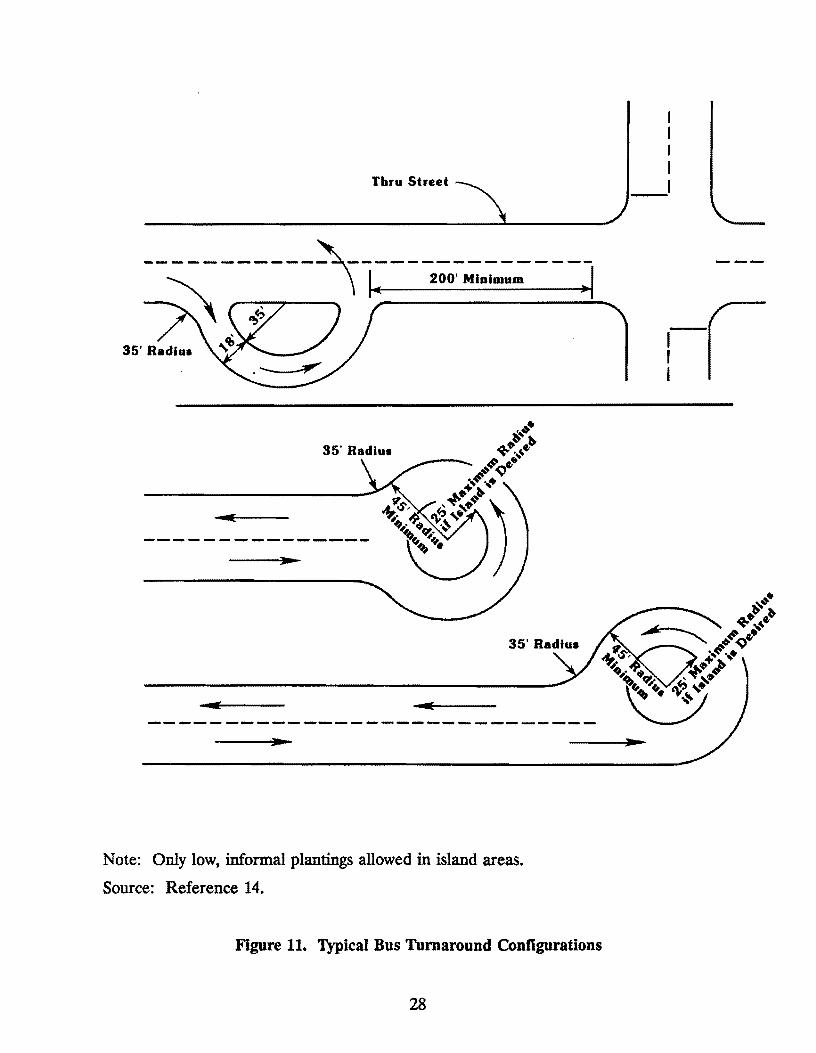
Bus turnarounds should be designed to discourage use by non-transit vehicles.
Typical bus turnaround configurations are shown in Figure 11.
3. 7 Shelter Area Desip
Each transit agency may have its own shelter design. Certain basic design dimensions
are shown in Figure 12 for assistance in designing the street area surrounding the shelter.
Other basic considerations at a shelter include:
• user's safety and security
• presence of sidewalk or concrete pad of adequate size
• allowances for elderly and handicapped individuals
• provision of seating areas
• transparent material for shelter walls
• waterproof canopy
• presence of other street furniture, such as waste receptacles, information kiosks,
newspaper dispensers, telephones, and postal boxes
• landscaping that provides good visibility of the shelter and llllmnnzes the
possibility of a person hiding in the shelter or surrounding area
27
Tbru Street
-----------~----------------~ \ j,. 200' Minimum •I
35' Radius
35' Radius
I I I I
_I
• 'S-4
35' Ra~luo ~ ~#~,.~ ~'$', ~ ,. ~ '!t...•> '.« '""'''!!!..• -_-_-_-_-.. -_-_-_-_-_-_-_-_-_-_-_-_-_-_-.. -_-_-_-_-_-_-_-_-___ ~
Note: Only low, informal plantings allowed in island areas.
Source: Reference 14.
Figure 11. Typical Bus Turnaround Configurations
28

Wall or Fence
:! 1.5' 6" Clearance-------""' Minimum
Source: Reference 13
Canopy
8.5' Desirable 5.5' Minimum
II I ·a i (....
2' Minimum
Sidewalk
Figure 12. Suggested Dimensions of Passenger Shelters
29
Face of Curb

• provision of adequate lighting
• location that does not interfere with driver sightlines (see Green Book (1) for discussion on intersection sight distance procedures)
• locate a reasonable distance from storm sewer inlets
• provision for adequate drainage especially in areas of heavy boarding/ alighting activities
• orient doorway away from prevailing winds
• orient at least one entrance/exit toward street
30
CHAPTER4
BUS SERVICE OPERATIONS GUIDELINES
4.1 General
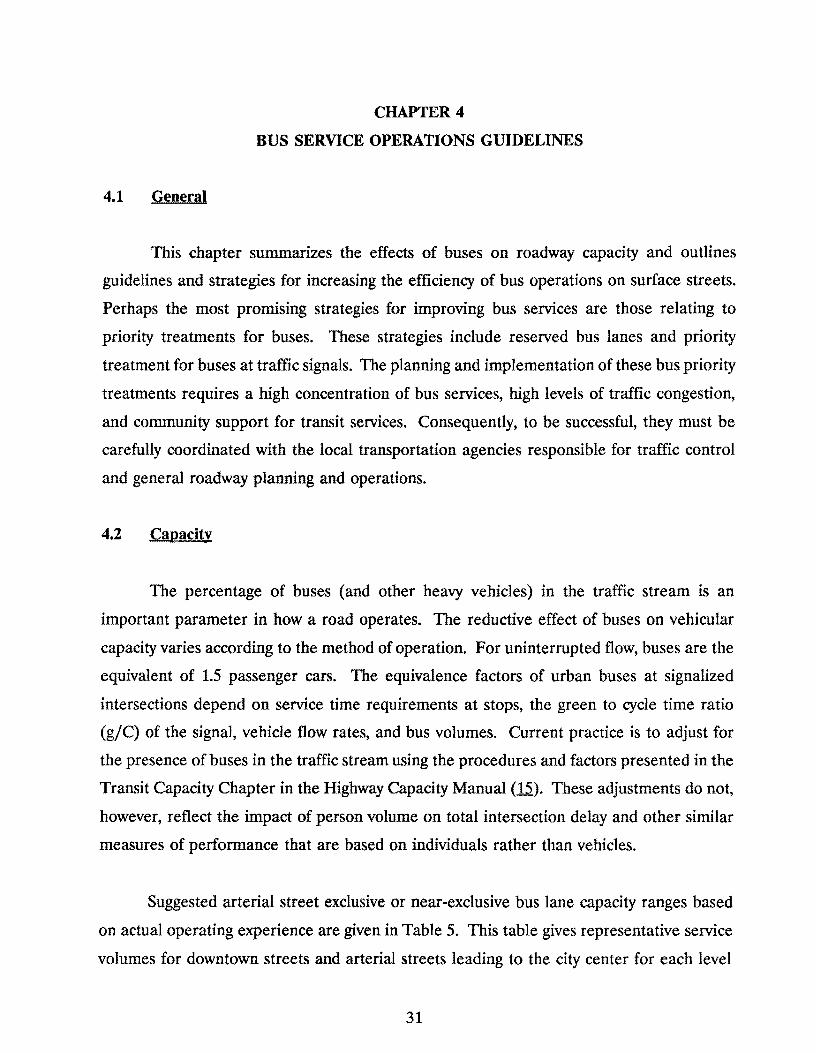
This chapter summarizes the effects of buses on roadway capacity and outlines
guidelines and strategies for increasing the efficiency of bus operations on surface streets.
Perhaps the most promising strategies for improving bus services are those relating to
priority treatments for buses. These strategies include reserved bus lanes and priority
treatment for buses at traffic signals. The planning and implementation of these bus priority
treatments requires a high concentration of bus services, high levels of traffic congestion,
and community support for transit services. Consequently, to be successful, they must be
carefully coordinated with the local transportation agencies responsible for traffic control
and general roadway planning and operations.
4.2 Capacity
The percentage of buses (and other heavy vehicles) in the traffic stream is an
important parameter in how a road operates. The reductive effect of buses on vehicular
capacity varies according to the method of operation. For uninterrupted flow, buses are the
equivalent of 1.5 passenger cars. The equivalence factors of urban buses at signalized
intersections depend on service time requirements at stops, the green to cycle time ratio
(g/C) of the signal, vehicle flow rates, and bus volumes. Current practice is to adjust for
the presence of buses in the traffic stream using the procedures and factors presented in the
Transit Capacity Chapter in the Highway Capacity Manual (15). These adjustments do not,
however, reflect the impact of person volume on total intersection delay and other similar
measures of performance that are based on individuals rather than vehicles.
Suggested arterial street exclusive or near-exclusive bus lane capacity ranges based
on actual operating experience are given in Table 5. This table gives representative service
volumes for downtown streets and arterial streets leading to the city center for each level
31

Table 5. Suggested Bus Flow Service Volumes for Planning Purposesa (Flow Rates for Exclusive or Near-Exclusive Lane)
Arterial Streets
Level of Service Description Buses/Lane/llour MidValue
A Free Flow 25 or less 15
B Stable Flow, 26 to 45 35 Unconstrained
c Stable Flow, 46 to 75 60 Interference
D Stable Flow, 76 to 105 90 Some Platooning
E Unstable Flow, 106 to 135 120 Queuing
F> Forced Flow, over 135c 150C Poor Operation
Main CBD Street
A Free Flow 20 or less 15
B Stable Flow, 21to40 30 Unconstrained
c Stable Flow, 41to60 50 Interference
D Stable Flow, 61 to 80 70 Some Platooning
E Unstable Flow, 81to100 90 Queuing
F> Forced Flow, over lOOC HOC Poor Operation
8These service volumes may be used for planning purposes. More precise values for operations and design purposes should be computed from the capacity relationships and procedures set forth in Chapter 12 of the llighway Capacity Manual.
'7he values for level of service F should not be used for planning or design. They are merely given for comparative purposes.
"Results in more than one-lane operation.
Source: Reference 15.
32

of service. Where stops are not heavily patronized, as along outlying arterial streets,
volumes could be increased by about 25 percent (15).
4.3 Bus Priority Measures
Planning and implementing bus priority measures require a reasonable concentration
of bus services, a high degree of bus and car congestion, and community willingness to
support public transport. Measures should be applied that:
• alleviate existing bus service deficiencies
• achieve attractive and reliable bus service
• serve demonstrated existing demands
• provide reserve capacity for future growth in bus trips
• attract auto drivers
• relate to long-range transit improvements and downtown development programs
General planning guidelines for assessing the applicability of various bus priority measures
for arterial streets are outlined in Table 6. The guidelines generally specify that the number
of bus riders in the exclusive lane be at least equal to the number of auto occupants in the
adjoining lane for the period that the priority measures would apply. They are expressed
in terms of peak-hour buses and passengers and should be based on future design year
corridor demands to allow for generated traffic. However, approximately 75 percent of the
warrants should apply to base-year (existing) conditions. This approach allows flexibility for
the future, and it safeguards against unrealistic demand forecasts (i).
Bus priority measures for arterial streets include reserved lanes and streets (i.e.,
contraflow, concurrent flow, and reversible lanes), priority at traffic signals (i.e., bus signal
preemption and special signalization), and special turn permission (i.e., "No Left Turn, Buses
Excepted"). Most bus priority measures are reserved bus lanes on city streets, usually in
the direction of traffic flow. Following is a brief discussion of each type of bus priority
measures (16).
33
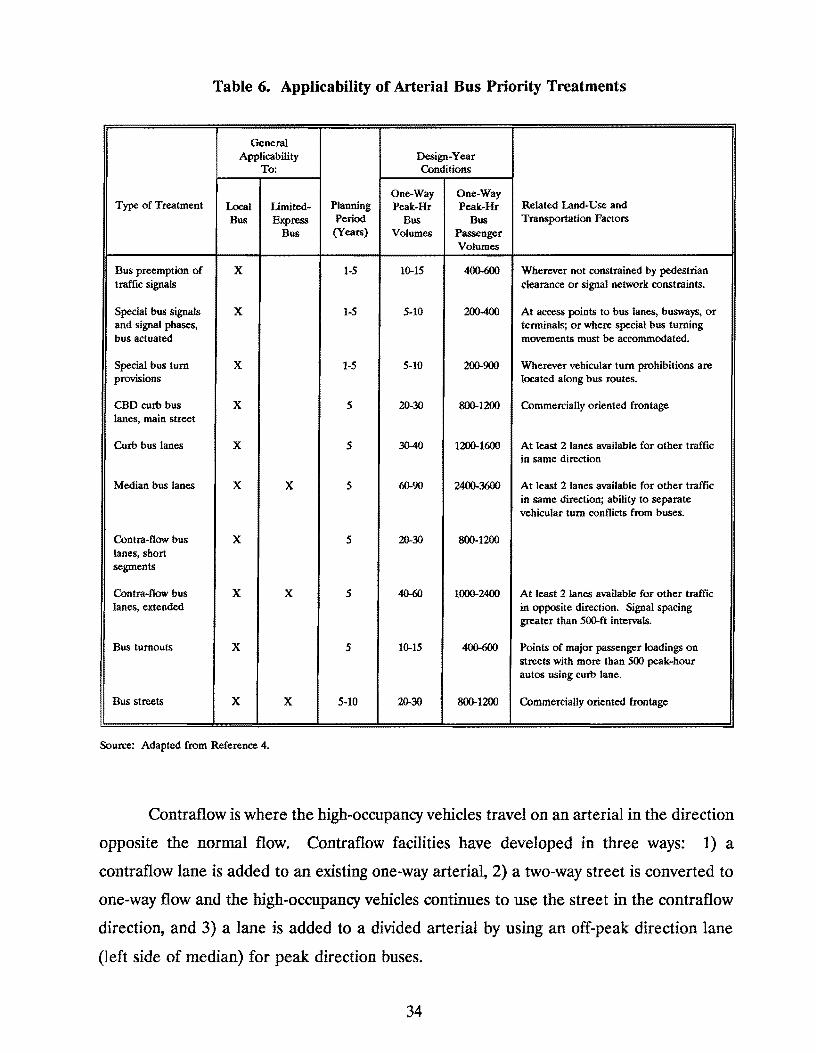
Table 6. Applicability of Arterial Bus Priority Treatments
General Applicability Design-Year
To: Conditions
One-Way One-Way Type of Treatment Local Limited- Planning Peak-Hr Peak-Hr Related Land-Use and
Bus Express Period Bus Bus Transportation Factors Bus (Years) Volumes Passenger
Volumes
Bus preemption of x 1-5 10-15 400-600 Wherever not constrained by pedestrian traffic signals clearance or signal network constraints.
Special bus signals x 1-5 5-10 200-400 At access points to bus lanes, busways, or and signal phases, terminals; or where special bus turning bus actuated movements must be accommodated.
Special bus tum x 1-5 5-10 200-900 Wherever vehicular tum prohibitions are provisions located along bus routes.
CBD curb bus x 5 20-30 800-1200 Commercially oriented frontage lanes, main street
Curb bus lanes x 5 30-40 1200-1600 At least 2 lanes available for other traffic in same direction
Median bus lanes x x 5 60-90 2400-3600 At least 2 lanes available for other traffic in same direction; ability to separate vehicular tum conflicts from buses.
Contra-flow bus x 5 20-30 800-1200 lanes, short segments
Contra-flow bus x x 5 4()..()() 1000-2400 At least 2 lanes available for other traffic lanes, extended in opposite direction. Signal spacing
greater than 500-ft intervals.
Bus turnouts x 5 10-15 400-600 Points of major passenger loadings on streets with more than 500 peak-hour autos using curb lane.
Bus streets x x 5-10 20-30 800-1200 Commercially oriented frontage
Source: Adapted from Reference 4.
Contraflow is where the high-occupancy vehicles travel on an arterial in the direction
opposite the normal flow. Contraflow facilities have developed in three ways: 1) a
contraflow lane is added to an existing one-way arterial, 2) a two-way street is converted to
one-way flow and the high-occupancy vehicles continues to use the street in the contraflow
direction, and 3) a lane is added to a divided arterial by using an off-peak direction lane
(left side of median) for peak direction buses.
34
Concurrent flow lanes are traffic lanes reserved for high-occupancy vehicles in the
same direction as the normal traffic flow and are also the most common form of priority
lanes. Although the curb lane is normally used, lanes adjacent to the median or in the area
previously used by streetcars are sometimes used. By far the most common form of
concurrent flow lanes are reserved curb lanes in central business districts. Concurrent flow
lanes allow high-occupancy vehicles to bypass waiting vehicles at traffic signals or other
bottlenecks resulting in an improved level of service for the passengers in the high
occupancy vehicles. The use of the lanes for concurrent flow can be restricted to peak
periods and can revert to mixed flow traffic or to parking or loading. Continual
enforcement is required for success since the lane is subject to frequent violations by both
moving and parked vehicles. When other than the curb lane is used as the reserved lane,
it is difficult to load and unload passengers.
Reversible lanes utilize the same lane for both the AM. and P.M. peak periods. This
type of facility could conceptually be considered a form of concurrent flow or a combination
of concurrent flow and contraflow, depending on the configuration. An advantage of the
reversible center lane configuration is that it can revert to a continuous center lane for left
turns during off-peak periods. The reversible lane concept is disruptive to normal traffic
flows because it requires the prohibition of left turns if a reversible center lane is used. If
the reversible lane is located to the left of the left-turn lane, the signal phasing is
constrained by the need to avoid conflicts between the left-turn lane and the reserved lane.
Two types of priority at traffic signals are passive and active. Passive priority only
acknowledges the presence of a bus in terms of the timing pattern; the predetermined timing
pattern is not affected by the presence or absence of buses. The signal is typically timed to
reflect the lowest total person-hours of delay. Active priority or preemption of traffic signals
occurs when a signal from a bus overrides the existing pattern and substitutes a new signal
pattern to benefit buses. Preemption can be further divided into two subsets, unconditional
and conditional preemption. Unconditional preemption results if preemption is granted
whenever a bus requests it, subject only to clearance intervals (pedestrian and vehicle)
required for safety. Conditional preemption results if other factors (e.g., progression, or
35
time since last preemption) are also considered to determine when or if a preemption will
be granted.
Special bus turn provisions are used when vehicular turn prohibitions are located
along a bus route.
4.4 Siams and Pavement Markings
Proper signs at transit facilities are an important element of good transit service.
Signs serve as a source of information to the patrons and operators regarding the location
of bus stops, park-and-ride lots, and other facilities, and are an excellent marketing tool to
promote transit use.
A bus stop sign may either be a standard traffic control sign (e.g., see Texas Manual
on Uniform Traffic Control Devices (17)), or a transit agency sign which identifies the bus
stop location and displays the name and number of the bus route(s) using the stop. The
transit agency's information telephone number is also frequently displayed on the bus stop
sign.
Bus stop signs should be placed at the location where people will board the front
door of the bus. The bus stop sign indicates the area where passengers should stand while
waiting for the bus and serves as a guide for the bus operator in positioning the vehicle at
the stop. Double sided signs for visibility from both directions and reflectorized signs for
night time visibility are preferred.
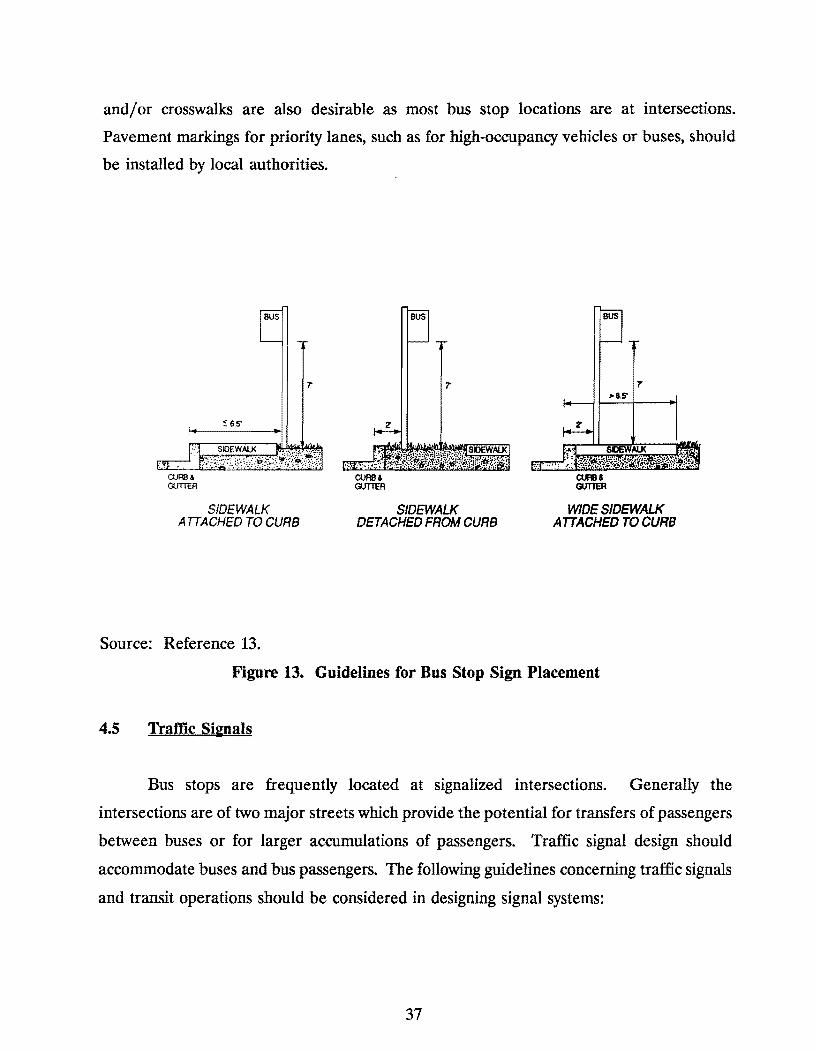
Bus stop signs should be installed with their own sign post and should not be
obstructed by trees, buildings, or other signs. The bottom of the sign should be at least 7
feet above ground level and should not be located closer than 2 feet from the curb face.
Figure 13 shows typical bus stop sign placement standards.
Pavement markings associated with bus stops are generally installed and maintained
by local authorities. The most common is the yellow painted curb at bus stops. Stop lines
36
and/ or crosswalks are also desirable as most bus stop locations are at intersections.
Pavement markings for priority lanes, such as for high-occupancy vehicles or buses, should
be installed by local authorities.
CU~& GUmR
SID£WALK ATTACHED TO CURB
Source: Reference 13.
z
CUAB& GUmR
7'
SID£WALK D£TACHED FROM CURB
CUFll& GUTTER
>&.5'
.,.
WIDE SIDEWALK ATTACHED TO CURB
Figure 13. Guidelines for Bus Stop Sign Placement
4.5 Trame Simals
Bus stops are frequently located at signalized intersections. Generally the
intersections are of two major streets which provide the potential for transfers of passengers
between buses or for larger accumulations of passengers. Traffic signal design should
accommodate buses and bus passengers. The following guidelines concerning traffic signals
and transit operations should be considered in designing signal systems:
37
• Location of bus stops should be coordinated with traffic signal pole and head
location. Bus stops should be located so that buses do not totally restrict visibility
of traffic signals from other vehicles. (These problems can be effectively
addressed by using far-side bus stops.)
• All bus passengers become pedestrians upon leaving the bus. It is very desirable
that WALK and DON'T WALK indications be in place at signalized intersections
at bus stops.
• When traffic actuated signals are installed, pedestrian push buttons should also be
installed to activate the WALK and DON'T WALK indications.
• Near-side stop areas often are between the advance detectors for a traffic signal
and the crosswalk. Location of a detector at the bus stop will enable the bus to
actuate the detector and the signal controller to obtain or extend the green light.
Lack of a detector will force a bus to wait until other traffic approaching from the
same direction actuates the signal controller.
• Timing of traffic signals should also reflect the specific needs of buses. Longer
clearance intervals may be required on higher speed roadways with significant bus
traffic. Vehicle passage times must provide adequate time for a bus to accelerate
from the bus stop into the intersection. Intersections adjacent to railroad tracks
should have timing and detection that reflect the need for buses to stop at the
railroad crossings.
4.6 Maintenance
Maintenance for bus-related street improvements generally consists of the following:
• Maintenance of pavement surfaces
• Repainting stop areas
38
• Snow removal/sanding of roadway and bus turnouts
• Cleaning, repair, and replacement of parking control signs
• Cleaning, repair, and replacement of bus stop signs
The majority of bus stops are at sidewalk areas within the public roadway section.
Maintenance of these areas is generally the responsibility of the agency responsible for the
roadway unless a separate maintenance agreement between the transit and highway agencies
is instituted. Maintenance for those areas on private property, such as shopping centers,
hospitals, and schools, would be the responsibility of the property owner unless a separate
maintenance agreement between the property owner and the transit agency is arranged prior
to initiation of transit service. Maintenance of passenger shelters is generally the
responsibility of the agency that owns the shelter.
In general, the agency responsible for maintenance at bus stop areas is as indicated
below:
Item Responsible Aaency
• Roadway maintenance or • Local roadway jurisdiction
pavement repair
• Bus stop signs • Transit agency
• Repainting of painted surfaces • Local roadway jurisdiction
• Passenger shelter and pad • Transit agency (or property owner)
• Landscaped areas • Property owner
39

REFERENCES
1. Stokes, R.W., P. Luedtke and T. Urbanik, II. Guidelines for Planning. Designing and Operating Transit-Related Street Improvements: Survey of Current Practice. Research Report 1225-1. Texas Transportation Institute, College Station, TX. September 1989.
2. Texas State Department of Highways and Public Transportation. Operations and Procedures Manual. Highway Design Division, Austin, TX. 1981 (Revised 1985).
3. Bullard, D.L. and L.G. Nungesser. Texas Public Transit Reference Manual. Report 1082-lF. Texas Transportation Institute, College Station, TX. November 1985.
4. Transportation Research Board. Bus Route and Schedule Planning Guidelines. NCHRP Synthesis of Highway Practice 69. Washington DC. May 1980.
5. Maryland Department of Transportation, Mass Transit Administration. Access by Design: Transit's Role in Land Development. Baltimore, MD. September 1988.
6. Houston Metropolitan Transit Authority of Harris County. "Principles of Stop Positioning." Effective May 1988. Revised January 1990.
7. American Association of State Highway and Transportation Officials. A Policy on the Geometric Design of Highways and Streets. Washington, DC. 1984.
8. Mounce, J.M., H.G. Hawkins, H.S. Payne, R.W. Stokes. Revised Manual for Planning, Designing. and Operating Transitway Facilities in Texas. Research Report 339-14. Texas Transportation Institute, College Station, TX. August 1988.
9. Institute of Transportation Engineers. Transportation and Traffic Engineering Handbook. Washington DC. 1982.
10. Institute of Transportation Engineers Committee SN-S. "Guidelines for Driveway Design and Location." Institute of Transportation Engineers Journal. Washington, DC. February 1973.
11. Houston Metropolitan Transit Authority of Harris County. "Bus Templates." 1990.
12. Alameda-Contra Costa Transit District. Transit Facilities Standards Manual. Oakland, CA. March 1983.
13. Regional Public Transportation Authority. Bus Passenger Facilities: Street Improvement Guidelines. Phoenix, AZ. March 1989 (Draft).
14. Tri-Met Planning and Development Division. Transit Facilities Design and Maintenance Standards. Portland, OR. 1980.
41
15. Transportation Research Board. Highway Capacity Manual. TRB Special Report 209. Washington, DC. 1985.
16. Urbanik, T., R.W. Holder, and AV. Fitzgerald. Evaluation of Priority Techniques for High-Occupancy Vehicles on Arterial Streets. Report 205-5. Texas Transportation Institute, College Station, TX. July 1977.
17. Texas State Department of Highways and Public Transportation. Texas Manual on Uniform Traffic Control Devices for Streets and Highways. Austin, TX. 1980.
42