technical sentiment analysis: measuring advantages and...
TRANSCRIPT
Technical Sentiment Analysis: Measuring Advantages and
Drawbacks of New Products Using Social Media
Chiarello, Filippoa ; Bonaccorsi, Andrea
a ; Fantoni, Gualtiero
a;Ossola, Giacomo
a;
Cimino, Andreab and Dell’Orletta, Felice
b
aDepartment of Energy, Systems, Territory, and Construction Engineering, University of
Pisa, Italy. bInstitute for Computational Linguistics of the Italian National Research Council
(ILC- CNR)
Abstract
In recent years, social media have become ubiquitous and important for
social networking and content sharing. Moreover, the content generated by
these websites remains largely untapped. Some researchers proved that
social media have been a valuable source to predict the future outcomes of
some events such as box-office movie revenues or political elections. Social
media are also used by companies to measure the sentiment of customers
about their brand and products.
This work proposes a new social media based model to measure how users
perceive new products from a technical point of view. This model relies on
the analysis of advantages and drawbacks of products, which are both
important aspects evaluated by consumers during the buying decision
process. This model is based on a lexicon developed in a related work
(Chiarello et. al, 2017) to analyse patents and detect advantages and
drawbacks connected to a certain technology.
The results show that when a product has a certain technological complexity
and fuels a more technical debate, advantages and drawbacks analysis is
more efficient than sentiment analysis in producing technical-functional
judgements.
Keywords: Social media; Twitter; Sentiment analysis; Product Success
2nd International Conference on Advanced Research Methods and Analytics (CARMA2018)Universitat Politecnica de Valencia, Valencia, 2018
DOI: http://dx.doi.org/10.4995/CARMA2018.2018.8336
This work is licensed under a Creative Commons License CC BY-NC-ND 4.0Editorial Universitat Politecnica de Valencia 145
Technical Sentiment Analysis: Predicting the Success of New Products Using Social Media
1. Introduction
Nowadays, social media have become an inseparable part of modern life, providing a vast
record of mankind’s everyday thoughts, feelings and actions. For this reason, there has been
an increasing interest in research of exploiting social media as information source of
knowledge although extracting a valuable signal is not a trivial task since social media data
is noisy and must be filtered before proceeding with the analysis. In this domain, sentiment
analysis, which aims to determine the sentiment content of a text unit, is considered one of
the best data mining method. It relies on different approaches (Collomb et al. 2013) and it
has been used to answer research questions in a variety of fields comprised the measure of
customers perception of new products (Mirtalaie et al. 2018).
In this work, we try to understand if sentiment analysis is really the best available method
to analyse consumer’s perception of products, expecialy when we want to measure the
perception of the technical content of the product. Thus we compare State of the art
sentiment analysis techniques with a lexicon of advantages and drawbacks related to
products. This tool relies on a lexicon developed by Chiarello (2017) to extract advantages
and drawbacks of inventions from patents.
Our work started with the selection of an event able to polarise Twitter users’ attention and
products to analyse. In particular, we chose a premiere tradeshow for the video game
industry, and two video game consoles disclosed during the event. We collected about 7
milions tweets about products published before, during and after the tradeshow. Since
social media data is noisy (for example it may contains spam and advertising), before
proceeding with the analyses, we filtered our dataset. In particular, after removing too short
and non-English tweets, we manually classified a randomly extracted subset of posts to
train a classifier which provide us the cleansed dataset. Then we conducted a sentiment
analysis of the tweets using state of the art machine learning techniques. We classified each
tweet as positive, negative or neutral. At this point we applied our lexicon identifying
advantages tweets and drawbacks tweets. Finally we compared the outputs of the two
analyses for the two product-related clusters of tweets.
We found consistent differences between the extractions. The results shows that when a
product has a certain technological complexity and fuels a more technical debate,
advantages and drawbacks analysis is more able than sentiment in producing technical-
functional judgements. For this reason we think that the proposed methodology peforms
better then standard sentiment analysis techniques when a product has a certain
technological complexity and fuels a more technical social media discourse.
146
Chiarello, F.; Bonaccorsi, A.; Fantoni, G.;Ossola, G.; Cimino, A.; Dell’Orletta, F.
2. State of the art
We provide an overview of the studies about social media forecasting (Table 1, 2).
Researchers especially focused on economics (stock market, marketing, sales) and politics
(elections outcomes). In economics, predicting fluctuations in the stock market has been the
most studied by far. Early work focused largely on predicting whether aggregate stock
measures such as the Dow Jones Industrial Average (DJIA) would rise or fall on the next
day, but forecasting can also involve making more detailed predictions, e.g., forecasting
market returns or making predictions for individual stocks. The simplest task for stock
market prediction is deciding whether the following day will see a rise or fall in stock
prices. Comparison between studies is complicated by the fact that stock market volatility,
and thereby the difficulty of prediction, may vary over time periods. High accuracy (87,6%)
on this task was reported by Bollen (2012). However, slight deviations away from their
methodology have seen much less success indicating that the method itself may be
unreliable (Xu, 2014). A very good result is achieved by Cakra (2015) who use linear
regression to build a prediction model based on the output of sentiment analysis and
previous stock price dataset.
Social media has also been used to study the ability of online projects to successfully
crowdfund their projects through websites like Kickstarter. Li (2016) predicts whether a
project will eventually succeed by making use of features relevant to the project itself (e.g.,
the fundraising goal), as well as social activity features (e.g., number of tweets related to
the project), and social graph measures (e.g., average number of followers for project
promoters). Using all of these features for only the first 5% of the project duration achieved
an AUC of 0.90, reflecting very high classification performance.
Many studies analysed the predictive power of social media to improve or replace
traditional and expensive polling methods. The simplest technique is measuring tweet
volume (tweet mentioning a political party = votes). Chung (2010) and Tumasjan (2010)
employed this method obtaining mixed results. Razzaq (2014), Skoric (2012) and Prasetyo
(2015) improved this method taking into account the mood of the posts, considering if a
candidate or a party is mentioned in a positive or negative manner.
147

Technical Sentiment Analysis: Predicting the Success of New Products Using Social Media
Table 1: Summary of studies in economics. Data source: T = Twitter, F = Facebook,
K = Kickstarter, O = blogs, other. Task: MDA = Mean Directional Accuracy, MAPE = Mean
Absolute Percentage Error.
Article Topic Data source Data size Observation time Success rate
Xu (2014) Stock market T 100K tweets 42 days
Crone (2014) Exchange rates T, F, O N/A N/A
Kordonis (2016) Stock market T N/A N/A
Cakra (2015) Stock market T N/A 2 weeks
Bollen (2015) Stock market T 9.8M 10 months
Brow (2012) Stock market T 13K 9 days
Rao (2012) Stock market T 4M 14 months (DJIA);
(NASDAQ).
Kim (2014) Hit songs T 31.6M 68 days
Korolov (2015) Donations T 15M 10 days
Le (2015) Sports book T 1.2M 30 days
Tuarob (2013) Smartphone sales T 800M 19 months
Asur (2010) Movie revenues T 2.8M 3 months
Ahn (2014) Car sales T, F, O 26K posts N/A
(Sedan A);
(Sedan B).
Chen (2015) Advertising T 5.9K users N/A 66% gain (click rate);
87% gain (follow rate).
Li (2016) Crowdfunding success
rate T, F, K 106K tweets 6 months
Researchers employ different tools and methods for social media mining, varying from easy
to somewhat more complex. The most employed tool is sentiment analysis (with its various
approaches: knowledge-based techniques, statistical methods, and hybrid approach) which
usually achieves good results. Other researchers use more complex tools such as neural
networks or a combination of techniques. At end of the analysis of the state of the art we
are able to identify some best practices: (i) implementing suitable techniques to deal with
noisy data, (ii) evaluating statistical biases in social media data, (iii) collecting data from
heterogeneous sources, (iv) incorporating domain-specific knowledge to improve statistical
model.
148

Chiarello, F.; Bonaccorsi, A.; Fantoni, G.;Ossola, G.; Cimino, A.; Dell’Orletta, F.
Table 2: Summary of studies in politics. Data source: T = Twitter. Task: Acc. = Accuracy,
MDA = Mean Directional Accuracy, MAPE = Mean Absolute Percentage Error.
Article Topic Data source Data size Observation time Success rate
Chung (2010) Renewal of US senate T 235K tweets 7 days Acc. 41% - 47%
Tumasjan (2010) German federal election T 104K tweets 36 days MAE 1.65%
Razzaq (2014) Pakistani election T 613K tweets N/A Acc. 50%
Skoric (2012) Political election T 7M tweets 36 days MAE 6.1%
Prasetyo (2015) Indonesian political election T 7M tweets 83 days MAE 0.62% (State level)
3.Methodology
3.1 Selection of a triggering event and products
We chose the Electronic Entertainment Expo as event able to polarise users’ attention.
Commonly referred to as E3, it is a premier trade event for the video game industry,
presented by the Entertainment Software Association (ESA). We chose two new video
game consoles, disclosed at E3 2017, as products of which predicting the success or failure.
The first is Xbox One X, a new high-end version of Xbox One with upgraded hardware and
the other product is New Nintendo 2DS XL, a streamlined version of the handheld console
New Nintendo 3DS XL.
3.2 Data collection
Twitter provides two possible ways to gather tweets: the Streaming Application
Programming Interface (API) and the Search API. The first one allows user to obtain real-
time access to tweets from an input query. The user first requests a connection to a stream
of tweets from the server. Then, the server opens a streaming connections and tweets are
streamed in as they occur, to the user. However, there are a few limitations of the
Streaming API. First, language is not specifiable, resulting in a stream that contains tweets
of all languages, including a few non-Latin-based alphabets, that complicates further
analysis. Instead, Twitter Search API is a Representational State Transfer API which allows
users to request specific queries of recent tweets. It allows filtering based on language,
region, geolocation, and time. Unfortunately, using the Search API is expensive and there is
a rate limit associated with the query. Because of these issues, we decided to go with the
Twitter Streaming API instead. For each product, we detected related hashtags and
keywords an constructed a query to download relevant tweets.
We chose to collect tweets not only after the tradeshow, but also before. For these reason,
we initially identified some products keywords with their provisional names and we
updated them at a later stage. Tweets have been downloaded from CNR (Consiglio
149

Technical Sentiment Analysis: Predicting the Success of New Products Using Social Media
Nazionale delle Ricerche, Istituto di Informatica e Telematica, Area di Pisa) since 11th June
2017 h. 10:00 to 31th July 2017 h. 15:00.
3.3 Data filtering
The initial dataset resulted to be very noisy, containing tweets written in different
languages, advertising and posts related to different products or subjects. We chose to keep
into account only English tweets because sentiment and advantages/drawbacks lexicon is in
this language. The data set is filtered removing tweets with less than five words and non-
English posts with a language classifier. We obtained 7.165.216 of filtered tweets.
At this point we created a golden set of relevant tweet to train a Supported Vector Machine
classifier able to recognize relevant and unrelevant tweets. We defined characteristics that
make a tweet: (i) relevant (posted by users or containing words or opinions related to our
products of interests and their functionalities), (ii) irrelevant (tweets containing
advertisings, links to e-commerce websites or messages related to other products or
subjects). A researcher manually classified a subset made up of randomly extracted tweets.
In particular, we exctract a subset composed of 6.500 finding 105 positive results and 6.395
negative. SVM model was then trained using this dataset, and computed a probability for
each tweet to be relevant or irrelevant. A threshold of 0.7 has been chosen to label a tweet
as relevant. The final dataset of filtered tweets, made up of 66.796 posts. We clustered
tweets using product-related keywords. Clustering posts allowed us to further filter the final
dataset which contained a small number of irrelevant tweets (Table 3).
Table 3. Clusters of tweets
N° of tweets % of tweets
Xbox One X 64.885 97,14 %
New N2DS 1.706 2,55 %
Irrelevant tweets
198 0,30 %
Table 4. Sentiment analysis classification
Positive Negative Neutral
Xbox One X 35,99% 4,65% 59,37%
New N2DS 52,99% 1,58% 45,43%
Overall 36,42% 4,57% 59,01%
3.4 Sentiment analysis
Table 4 presents the results of the sentiment analysis. We classified each tweet according to
its sentiment into positive, negative, or neutral. We used an established methodology
150
Chiarello, F.; Bonaccorsi, A.; Fantoni, G.;Ossola, G.; Cimino, A.; Dell’Orletta, F.
developed by Cimino (2016). We pre-processed the tweets by removing mentions (@
character), URLs, product hashtags, emoticons and single characters. As a result, for each
tweet we obtained a probability of belonging to a mood class. After a manual analysis, we
used a class prediction probability threshold of 0.6 to filter out low confidence prediction,
i.e. tweets that cannot be classified as positive or negative with a high confidence are
classified as neutral instead.
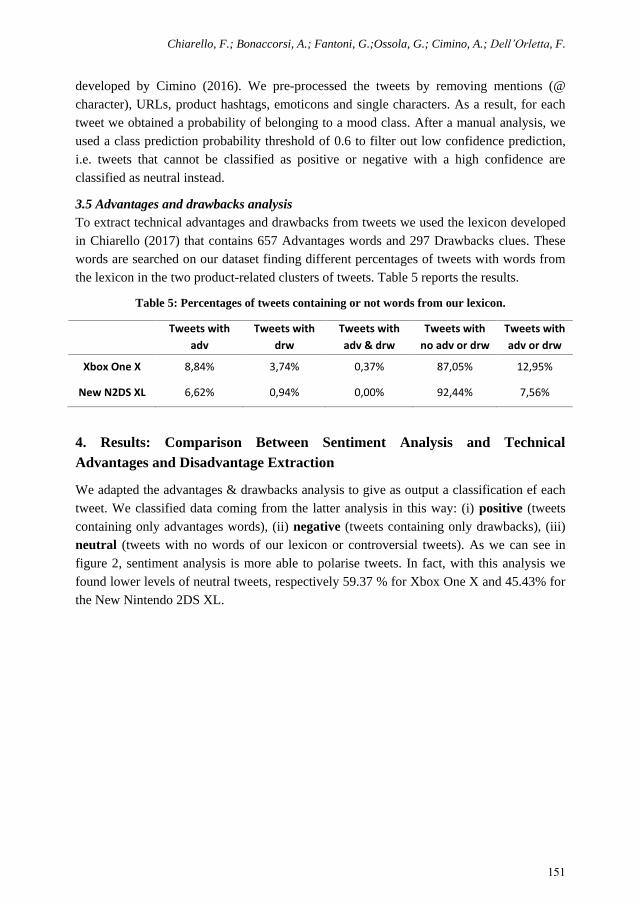
3.5 Advantages and drawbacks analysis
To extract technical advantages and drawbacks from tweets we used the lexicon developed
in Chiarello (2017) that contains 657 Advantages words and 297 Drawbacks clues. These
words are searched on our dataset finding different percentages of tweets with words from
the lexicon in the two product-related clusters of tweets. Table 5 reports the results.
Table 5: Percentages of tweets containing or not words from our lexicon.
Tweets with
adv
Tweets with
drw
Tweets with
adv & drw
Tweets with
no adv or drw
Tweets with
adv or drw
Xbox One X 8,84% 3,74% 0,37% 87,05% 12,95%
New N2DS XL 6,62% 0,94% 0,00% 92,44% 7,56%
4. Results: Comparison Between Sentiment Analysis and Technical
Advantages and Disadvantage Extraction
We adapted the advantages & drawbacks analysis to give as output a classification ef each
tweet. We classified data coming from the latter analysis in this way: (i) positive (tweets
containing only advantages words), (ii) negative (tweets containing only drawbacks), (iii)
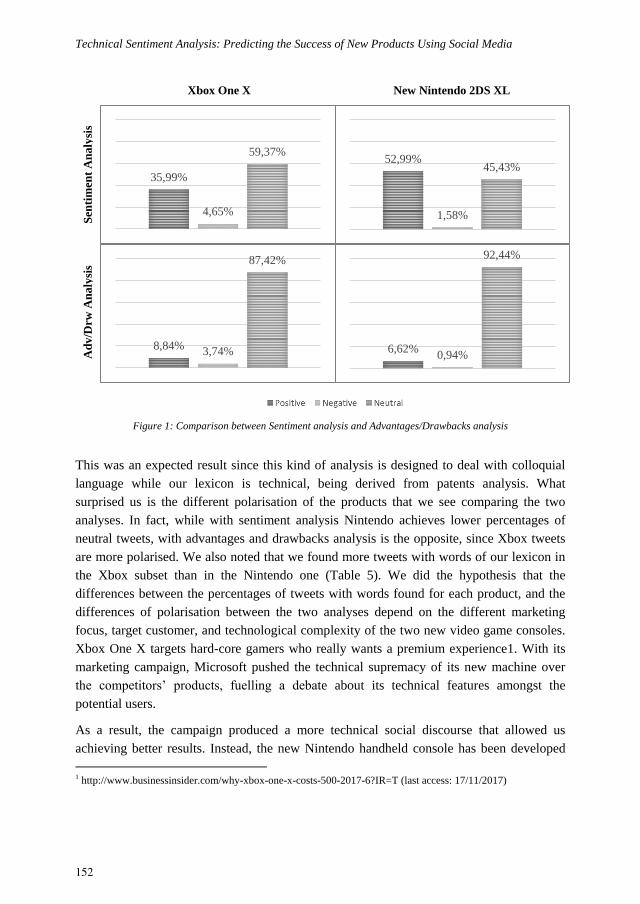
neutral (tweets with no words of our lexicon or controversial tweets). As we can see in
figure 2, sentiment analysis is more able to polarise tweets. In fact, with this analysis we
found lower levels of neutral tweets, respectively 59.37 % for Xbox One X and 45.43% for
the New Nintendo 2DS XL.
151
Technical Sentiment Analysis: Predicting the Success of New Products Using Social Media
Figure 1: Comparison between Sentiment analysis and Advantages/Drawbacks analysis
This was an expected result since this kind of analysis is designed to deal with colloquial
language while our lexicon is technical, being derived from patents analysis. What
surprised us is the different polarisation of the products that we see comparing the two
analyses. In fact, while with sentiment analysis Nintendo achieves lower percentages of
neutral tweets, with advantages and drawbacks analysis is the opposite, since Xbox tweets
are more polarised. We also noted that we found more tweets with words of our lexicon in
the Xbox subset than in the Nintendo one (Table 5). We did the hypothesis that the
differences between the percentages of tweets with words found for each product, and the
differences of polarisation between the two analyses depend on the different marketing
focus, target customer, and technological complexity of the two new video game consoles.
Xbox One X targets hard-core gamers who really wants a premium experience1. With its
marketing campaign, Microsoft pushed the technical supremacy of its new machine over
the competitors’ products, fuelling a debate about its technical features amongst the
potential users.
As a result, the campaign produced a more technical social discourse that allowed us
achieving better results. Instead, the new Nintendo handheld console has been developed
1 http://www.businessinsider.com/why-xbox-one-x-costs-500-2017-6?IR=T (last access: 17/11/2017)
Sen
tim
ent
An
aly
sis
Ad
v/D
rw A
na
lysi
s
35,99%
4,65%
59,37%
8,84% 3,74%
87,42%
6,62% 0,94%
92,44%
52,99%
1,58%
45,43%
Xbox One X New Nintendo 2DS XL
152

Chiarello, F.; Bonaccorsi, A.; Fantoni, G.;Ossola, G.; Cimino, A.; Dell’Orletta, F.
targeting children and families providing a model that falls somewhere in the middle of the
line of 3DS consoles2.
We initially checked our hypothesis using Google Trend to compare users’ search interest
about technical review of the two products during the data collection period (Figure 2).
Then, we analysed the number of technical articles related to the new products published by
the 25 most popular video games and technology websites in the U.S, according to the
ranking of SimilarWeb, a digital marketing intelligence company which publishes insights
about websites. We entered queries reported in Table 6 into Google search engine to
retrieve technical article within the web domains previously identified: we obtained 1.117
articles about Xbox and only 52 about Nintendo, proving that technical debate concerning
Xbox is greater. This is and evidence of the fact that when a product has a certain
technological complexity and fuels a more technical debate, advantages and drawbacks
analysis is more able than sentiment in producing technical-functional judgements. The
greater number of neutral tweets found with advantages and drawbacks analysis can also be
explained with the Means-end chain model (Reynolds, 1995). Consumers express
themselves basing on personal consequences linked with product use or basing on personal
values satisfied by the product itself. For these reasons, tweets contain a more colloquial
language which sentiment analysis is more able to interpret than the latter tool.
Figure 2: Google Trends comparison of search-terms “Xbox One X review” and “New Nintendo 2DS XL review”
during the data collection period, since 11th June 2017 to 31st July 2017. Values on the vertical axis depict search
interest compared to the highest point in the graph during the observation time. A value of 100 is the peak
popularity for the term. On average, users searched for Xbox reviews with an approximately five times higher
frequency.
2 http://www.nintendolife.com/news/2017/05/reggie_explains_the_reasoning_behind_the_new_2ds_xl (last
access: 17/11/2017)
0
20
40
60
80
100
11/06/2017 21/06/2017 01/07/2017 11/07/2017 21/07/2017 31/07/2017
Se
arch
inte
rest
Xbox One X review
New N2DS XL review
153
Technical Sentiment Analysis: Predicting the Success of New Products Using Social Media
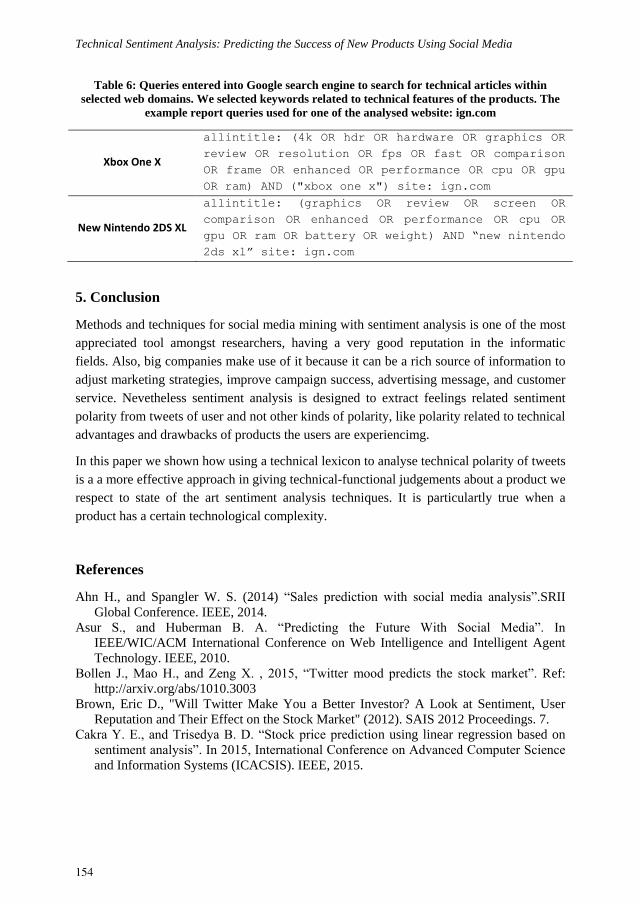
Table 6: Queries entered into Google search engine to search for technical articles within
selected web domains. We selected keywords related to technical features of the products. The
example report queries used for one of the analysed website: ign.com
Xbox One X
allintitle: (4k OR hdr OR hardware OR graphics OR
review OR resolution OR fps OR fast OR comparison
OR frame OR enhanced OR performance OR cpu OR gpu
OR ram) AND ("xbox one x") site: ign.com
New Nintendo 2DS XL
allintitle: (graphics OR review OR screen OR
comparison OR enhanced OR performance OR cpu OR
gpu OR ram OR battery OR weight) AND “new nintendo
2ds xl” site: ign.com
5. Conclusion
Methods and techniques for social media mining with sentiment analysis is one of the most
appreciated tool amongst researchers, having a very good reputation in the informatic
fields. Also, big companies make use of it because it can be a rich source of information to
adjust marketing strategies, improve campaign success, advertising message, and customer
service. Nevetheless sentiment analysis is designed to extract feelings related sentiment
polarity from tweets of user and not other kinds of polarity, like polarity related to technical
advantages and drawbacks of products the users are experiencimg.
In this paper we shown how using a technical lexicon to analyse technical polarity of tweets
is a a more effective approach in giving technical-functional judgements about a product we
respect to state of the art sentiment analysis techniques. It is particulartly true when a
product has a certain technological complexity.
References
Ahn H., and Spangler W. S. (2014) “Sales prediction with social media analysis”.SRII
Global Conference. IEEE, 2014.
Asur S., and Huberman B. A. “Predicting the Future With Social Media”. In
IEEE/WIC/ACM International Conference on Web Intelligence and Intelligent Agent
Technology. IEEE, 2010.
Bollen J., Mao H., and Zeng X. , 2015, “Twitter mood predicts the stock market”. Ref:
http://arxiv.org/abs/1010.3003
Brown, Eric D., "Will Twitter Make You a Better Investor? A Look at Sentiment, User
Reputation and Their Effect on the Stock Market" (2012). SAIS 2012 Proceedings. 7.
Cakra Y. E., and Trisedya B. D. “Stock price prediction using linear regression based on
sentiment analysis”. In 2015, International Conference on Advanced Computer Science
and Information Systems (ICACSIS). IEEE, 2015.
154

Chiarello, F.; Bonaccorsi, A.; Fantoni, G.;Ossola, G.; Cimino, A.; Dell’Orletta, F.
Chen J., Haber E., Kang R., Hsieh G., and Mahmud J. “Making use of derived personality:
The case of social media ad targeting”. In Proceedings of the International AAAI
Conference on Web and Social Media (ICWSM), 2015.
Chiarello F., Fantoni G., Bonaccorsi A. (2017) Product description in terms of advantages
and drawbacks: Exploiting patent information in novel ways. ICED 2017
Chung J., and Mustafaraj E. “Can collective sentiment expressed on twitter predict political
elections?”. In Twenty-Fifth AAAI Conference on Artificial Intelligence. AAAI, 2010.
Cimino A., Dell’Orletta F. (2016) “Tandem LSTM-SVM Approach for Sentiment
Analysis“. In Proceedings of EVALITA ’16, Evaluation of NLP and Speech Tools for
Italian, 7 December, Napoli, Italy.
Collomb A. ,Costea C.,Brunie L. (2013). A Study and Comparison of Sentiment Analysis
Methods for Reputation Evaluation.
Crone S. F., and Koeppel C. “Predicting exchange rates with sentiment indicators”. In
2014, IEEE conference on computational intelligence for financial engineering &
economics (CIFEr). IEEE, 2014.
Kim Y., Suh B., and Lee K. “#nowplaying the future billboard: mining music listening
behaviors of twitter users for hit song prediction”. In Proceedings of the first
international workshop on social media retrieval and analysis, pages 51-56. ACM, 2014.
Kordonis J., Symeonidis S., and Arampatzis A. “Stock price forecasting via sentiment
analysis on Twitter”. In Proceedings of the 20th Pan-Hellenic Conference on
Informatics, article no. 36. ACM, 2016.
Korolov R., Peabody J., Lavoie A., Das S., Magdon-Ismail M., and Wallace W. “Actions
are louder than words in social media”. In IEEE/ACM International Conference on
Advances in Social Network Analysis and Mining. IEEE, 2015.
Le L., Ferrara E., and Flammini A. “On predictability of rare events leveraging social
media: a machine learning perspective”. In Proceedings of the 2015 ACM on
Conference on Online Social Networks. ACM, 2015.
Li Y., Rakesh V., and Reddy C. K. “Project success prediction in crowdfunding
environments”. In Proceedings of the Ninth ACM International Conference on Web
Search and Data Mining, pages 247–256. ACM, 2016.
Mirtalaie M.A., Hussain O.K., Chang E., Hussain F.K. (2018) Sentiment Analysis of
Specific Product’s Features Using Product Tree for Application in New Product
Development. Lecture Notes on Data Engineering and Communications Technologies
Prasetyo N. D., and Hauff C. “Twitter-based election prediction in the developing world”.
In Proceedings of the 26th ACM Conference on Hypertext & Social Media, pages 149-
158. ACM, 2015.
Rao T., and Srivastava S. “Analyzing stock market movements using twitter sentiment
analysis. In Proceedings of the 2012 International Conference on Advances in Social
Networks Analysis and Mining (ASONAM 2012), pages 119–123. IEEE Computer
Society, 2012.
Razzaq M. A., Qamar A. M., and Bilal H. S. M. “Prediction and Analysis of Pakistan
Election 2013 based on Sentiment Analysis”. In IEEE/ACM International Conference
on Advances in Social Networks Analysis and Mining (ASONAM 2014). IEEE, 2014.
Reynolds T. J., Gengler C. E. e Howard D. J (1995). . A Means-End Analysis of Brand
Persuasion through Advertising, “International Journal of Research in Marketing”, Vol.
12, No. 3, October, pp. 257–266.
155

Technical Sentiment Analysis: Predicting the Success of New Products Using Social Media
Sang E. T. K., and Bos J.. Predicting the 2011 Dutch senate election results with Twitter. In
Proceedings of the Workshop on Semantic Analysis in Social Media, pages 53-60.
ACM, 2012.
Skoric M, and Poor N. “Tweets and Votes: A Study of the 2011 Singapore General
Election”. IEEE, 2012.
Tuarob S., and Tucker C. S. “Fad or here to stay: predicting product market adoption and
longevity using large scale, social media data”. In ASME 2013 International Design
Engineering Technical Conferences and Computers and Information in Engineering
Conference, Volume 2B: 33rd Computers and Information in Engineering Conference
Portland, Oregon, USA, August 4–7, 2013.
Tumasjan A., Sprenger T. O., Sandner P. G., and Welpe I. M. “Predicting elections with
twitter: what 140 characters reveal about political sentiment”. In Proceedings of the
Fourth International AAAI Conference on Weblogs and Social Media. AAAI, 2010.
Xu F., and Keselj V. “Collective sentiment mining of microblogs in 24-hour stock price
movement prediction”. In IEEE 16th conference on Business Informatics. IEEE, 2014.
156