technical support document for the powder river basin oil and … · 2015-12-29 · project sources...
TRANSCRIPT
Technical Support Document
Air Quality Impact Assessment forthe Montana Final Statewide Oil and Gas EIS and
Proposed Amendment of thePowder River and Billings Resource Management Plans
andthe Wyoming Final EIS and Planning Amendment
for the Powder River Basin Oil and Gas Development Project
Prepared for
U.S. Department of the InteriorBureau of Land Management
Montana and Wyoming State Offices
Prepared by
Environmental Assessment DivisionArgonne National Laboratory
Argonne, Illinois 60439
December 2002

iii
CONTENTS
NOTATION ............................................................................................................................. x
1 INTRODUCTION.............................................................................................................. 1-11.1 Project Description.................................................................................................... 1-4
1.1.1 Montana Project ............................................................................................ 1-41.1.2 Wyoming Project........................................................................................... 1-5
1.2 Alternatives Evaluated .............................................................................................. 1-61.2.1 Montana EIS.................................................................................................. 1-61.2.2 Wyoming EIS................................................................................................ 1-11
1.3 Study Tasks ............................................................................................................... 1-13
2 OVERVIEW OF ASSESSMENT APPROACH ............................................................... 2-1
3 AIR QUALITY MODELING SYSTEM AND MODELING DOMAIN.......................... 3-1
4 MODEL INPUT DATA..................................................................................................... 4-14.1 Meteorological Data.................................................................................................. 4-14.2 Receptor Data............................................................................................................ 4-34.3 Ambient Air Quality and AQRV Data...................................................................... 4-7
4.3.1 Criteria Pollutants.......................................................................................... 4-74.3.2 Chemical Species .......................................................................................... 4-104.3.3 Visibility........................................................................................................ 4-104.3.4 Acid Deposition............................................................................................. 4-14
4.4 Emissions Inventory Data ......................................................................................... 4-154.4.1 Non-Project Emission Sources...................................................................... 4-164.4.2 Project Emission Sources .............................................................................. 4-23
5 AIR QUALITY MODELING AND POSTPROCESSING............................................... 5-1
6 CRITERIA USED IN ASSESSING POTENTIAL AIR QUALITYAND AQRV IMPACTS..................................................................................................... 6-16.1 Significant Deterioration of Air Quality ................................................................... 6-16.2 Ambient Air Quality.................................................................................................. 6-2
6.2.1 Criteria Pollutants.......................................................................................... 6-26.2.2 Hazardous Air Pollutants .............................................................................. 6-2
6.3 Air-Quality-Related Values....................................................................................... 6-46.3.1 Visibility........................................................................................................ 6-46.3.2 Acid Deposition............................................................................................. 6-5
7 ASSESSMENT OF POTENTIAL AIR QUALITY AND AQRV IMPACTS .................. 7-17.1 Non-Project Sources.................................................................................................. 7-17.2 Montana Project Sources........................................................................................... 7-2
7.2.1 Near-Field Impacts........................................................................................ 7-2
iv
CONTENTS
7.2.2 Far-Field Impacts .......................................................................................... 7-87.3 Wyoming Project Sources......................................................................................... 7-32
7.3.1 Near-Field Impacts........................................................................................ 7-327.3.2 Far-Field Impacts .......................................................................................... 7-40
8 REFERENCES................................................................................................................... 8-1
APPENDIX A: Procedures for Predicting Maximum and Daily Visibility Impairment ......... A-1
APPENDIX B: Emissions Inventories..................................................................................... B-1
APPENDIX C: Estimated Impacts on Criteria Air Pollutants ................................................. C-1
APPENDIX D: Estimated Visibility Impacts at Sensitive Receptors –FLAG and Wyoming Screening Analysis...................................................... D-1
APPENDIX E: Estimated Visibility Impacts at Sensitive Receptors – Refined Analysis....... E-1
APPENDIX F: Estimated Acid Deposition Impacts at Sensitive Lakes.................................. F-1
FIGURES
1.1 Modeling Domain, Project Areas, Population Centers, and SensitiveReceptors for the Montana and Wyoming Projects....................................................... 1-2
2.1 Topography of the Modeling Domain, Population Centers, andSensitive Receptors ....................................................................................................... 2-3
4.1 Weather Stations with Surface Data.............................................................................. 4-2
4.2 Weather Stations with Precipitation Data...................................................................... 4-4
4.3 Annual Wind Roses at the 10-m Level in 1996 at Selected Locationswithin the Modeling Domain Based on CALMET Output Data................................... 4-5
4.4 Near-Field and Far-Field Receptor Locations Selected for CALPUFF Modeling........ 4-6
4.5 Montana and Wyoming Project Emission Sources under Proposed Actions................ 4-17
4.6 Non-Project Emission Sources ...................................................................................... 4-18
v
FIGURES
4.7 Estimated Annual Criteria Pollutant and VOC Emissions from MontanaCBM-Related Activities under the Preferred Alternative during the20-Year Project Period .................................................................................................. 4-32
4.8 Estimated Annual Criteria Pollutants and VOC Emissions from MontanaConventional Oil- and Gas-Related Activities under the PreferredAlternative during the 20-Year Project Period.............................................................. 4-33
4.9 Estimated Annual Criteria Pollutant and VOC Emissions from WyomingCBM-Related Activities under the Proposed Action during the10-Year Project Period .................................................................................................. 4-42
4.10 Estimated Annual Criteria Pollutant and VOC Emissions from WyomingConventional Oil- and Gas-Related Activities under the Proposed Actionduring the 10-Year Project Period ................................................................................ 4-43
TABLES
1.1 New CBM Wells and Ancillary Facilities under Various MontanaEIS Alternatives............................................................................................................. 1-8
1.2 Development Plan for CBM Wells and Compressors and ProjectedAnnual Gas Production under Various Montana EIS Alternatives ............................... 1-9
1.3 Alternative Combinations Evaluated for Air Quality and AQRV Impacts................... 1-10
1.4 New CBM Wells and Ancillary Facilities under Various WyomingEIS Alternatives............................................................................................................. 1-12
1.5 Development Plan for CBM Wells and Compressors and ProjectedAnnual Gas Production under Various Wyoming EIS Alternatives ............................. 1-13
4.1 Regional Ambient Air Quality Levels for the Montana Project Area........................... 4-8
4.2 Regional Ambient Air Quality Levels for the Wyoming Project Area ......................... 4-9
4.3 PSD Class I Areas and PSD Class II Areas of Concern within theModeling Domain of the Montana and Wyoming Projects........................................... 4-11
4.4 Estimated Seasonal Natural Background Visibility Reference Levels ......................... 4-12
vi
TABLES
4.5 Acid Neutralizing Capacities of Sensitive Lakes within theModeling Domain of the Montana and Wyoming Projects........................................... 4-15
4.6 Criteria Pollutant and VOC Emissions from Coal Mineswithin the Modeling Domain......................................................................................... 4-19
4.7 Annual Criteria Pollutant and VOC Emissions from New andRFFA Sources within the Modeling Domain................................................................ 4-24
4.8 Estimated Total Criteria Pollutant and VOC Emissions from CBM-RelatedActivities of the Montana Project under the Preferred Alternative duringthe 20-Year Project Period ............................................................................................ 4-26
4.9 Estimated Total Criteria Pollutant and VOC Emissions from ConventionalOil- and Gas-Related Activities of the Montana Project under thePreferred Alternative during the 20-Year Project Period .............................................. 4-28
4.10 Estimated Total Criteria Pollutant and VOC Emissions from the MontanaCBM- and Conventional Oil- and Gas-Related Activities under thePreferred Alternative during the 20-Year Project Period .............................................. 4-29
4.11 Estimated Annual Criteria Pollutant and VOC Emissions from the MontanaCBM- and Conventional Oil- and Gas-Related Activities under thePreferred Alternative during the 20-Year Project Period .............................................. 4-31
4.12 Estimated Total Criteria Pollutant and VOC Emissions from CBM-RelatedActivities of the Wyoming Project under the Proposed Action duringthe 10-Year Project Period ............................................................................................ 4-35
4.13 Estimated Total Criteria Pollutant and VOC Emissions from ConventionalOil- and Gas-Related Activities of the Wyoming Project under theProposed Action during the 10-Year Project Period ..................................................... 4-37
4.14 Estimated Total Criteria Pollutant and VOC Emissions from WyomingCBM- and Conventional Oil- and Gas-Related Activities under theProposed Action during the 10-Year Project Period ..................................................... 4-40
4.15 Estimated Annual Criteria Pollutant and VOC Emissions from CBM- andConventional Oil- and Gas-Related Activities under the Proposed Actionduring the 10-Year Project Period................................................................................. 4-41
vii
TABLES
6.1 Maximum Allowable PSD Increments for PSD Class I and Class II Areas ................. 6-1
6.2 Applicable Ambient Air Quality Standards .................................................................. 6-3
6.3 Range of State AACLs for Selected Hazardous Air Pollutants .................................... 6-4
7.1 Estimated Potential Maximum Near-Field Air Quality Impacts Due toEmissions from Montana Project Sources, Non-Montana ProjectSources, and Cumulative Sources under VariousAlternative Combinations.............................................................................................. 7-3
7.2 Estimated Potential Maximum Near-Field Total Air Quality Concentrations,Including Contributions from Montana Project Sources and Non-MontanaProject Sources under Various Alternative Combinations............................................ 7-5
7.3 Estimated Potential Maximum Near-Field Air Quality Impacts Due toEmissions from the 6-Unit Field and Sales Compressor Station .................................. 7-7
7.4 Estimated Potential Maximum Near-Field HAP Impacts Due to Emissionsfrom the 6-Unit Sales Compressor Station.................................................................... 7-9
7.5 Estimated Potential Maximum Far-Field Air Quality Impacts at Class I AreasDue to Emissions from Montana Project Sources, Non-Montana ProjectSources, and Cumulative Sources under Various Alternative Combinations ............... 7-10
7.6 Estimated Potential Maximum Far-Field Air Quality Impacts at Class II AreasDue to Emissions from Montana Project Sources, Non-Montana ProjectSources, and Cumulative Sources under Various Alternative Combinations ............... 7-13
7.7 Estimated Potential Maximum Far-Field Total Air Quality Concentrations,Including Contributions from Montana Project Sources, Non-Montana ProjectSources, and Cumulative Sources under Various Alternative Combinations ............... 7-15
7.8 Estimated Potential Visibility Impairment (∆dv ≥ 0.5) Due to Emissionsfrom Montana Project Sources, Non-Montana Project Sources, andCumulative Sources Predicted by Screening Procedures under VariousAlternative Combinations.............................................................................................. 7-18
7.9 Estimated Potential Visibility Impairment (∆dv ≥ 1.0) Due to Emissionsfrom Montana Project Sources, Non-Montana Project Sources, andCumulative Sources Predicted by Screening Procedures under VariousAlternative Combinations.............................................................................................. 7-22
viii
TABLES
7.10 Estimated Potential Visibility Impairment (∆dv ≥ 1.0) Due to Emissionsfrom Montana Project Sources, Non-Montana Project Sources, andCumulative Sources Predicted by Refined Procedures under VariousAlternative Combinations.............................................................................................. 7-27
7.11 Estimated Potential Changes in ANC at Sensitive Lakes Due to Emissionsfrom Montana Project Sources, Non-Montana Project Sources, andCumulative Sources under Various Alternative Combinations..................................... 7-33
7.12 Estimated Potential Maximum Near-Field Air Quality Impacts Due toEmissions from Wyoming Project Sources, Non-Wyoming ProjectSources, and Cumulative Sources under Various Alternative Combinations ............... 7-35
7.13 Estimated Potential Maximum Near-Field Total Air Quality Concentrations,Including Contributions from Wyoming Project Sources and Non-WyomingProject Sources under Various Alternative Combinations............................................ 7-38
7.14 Estimated Potential Maximum Near-Field Air Quality Impacts Due toEmissions from the 6-Unit Booster and Reciprocating Compressor Station ................ 7-40
7.15 Estimated Potential Maximum Near-Field HAP Impacts Due toEmissions from the 6-Unit Reciprocating Compressor Station .................................... 7-43
7.16 Estimated Potential Maximum Far-Field Air Quality Impacts at Class I AreasDue to Emissions from Wyoming Project Sources, Non-Wyoming ProjectSources, and Cumulative Sources under Various Alternative Combinations ............... 7-44
7.17 Estimated Potential Maximum Far-Field Air Quality Impacts at Class II AreasDue to Emissions from Wyoming Project Sources, Non-Wyoming ProjectSources, and Cumulative Sources under Various Alternative Combinations ............... 7-47
7.18 Estimated Potential Maximum Far-Field Total Air Quality Concentrations,Including Contributions from Wyoming Project Sources, Non-WyomingProject Sources, and Cumulative Sources under VariousAlternative Combinations.............................................................................................. 7-49
7.19 Estimated Potential Visibility Impairment (∆dv ≥ 0.5) Due to Emissionsfrom Wyoming Project Sources, Non-Wyoming Project Sources, andCumulative Sources Predicted by Screening Procedures under VariousAlternative Combinations.............................................................................................. 7-52
ix
TABLES
7.20 Estimated Potential Visibility Impairment (∆dv ≥ 1.0) Due to Emissionsfrom Wyoming Project Sources, Non-Wyoming Project Sources, andCumulative Sources Predicted by Screening Procedures under VariousAlternative Combinations.............................................................................................. 7-56
7.21 Estimated Potential Visibility Impairment (∆dv ≥ 1.0) Due to Emissionsfrom Wyoming Project Sources, Non-Wyoming Project Sources, andCumulative Sources Predicted by Refined Procedures under VariousAlternative Combinations.............................................................................................. 7-61
7.22 Estimated Potential Changes in ANC at Sensitive Lakes Due to Emissionsfrom Wyoming Project Sources, Non-Wyoming Project Sources, andCumulative Sources under Various Alternative Combinations..................................... 7-66
x
NOTATION
The following is a list of the acronyms, initialisms, and abbreviations (including units ofmeasure) used in this document.
ACRONYMS, INITIALISMS, AND ABBREVIATIONS
AACL acceptable ambient concentration levelAB Absaroka-Beartooth WAAF Agate Fossil Beds NMANC acid neutralizing capacityANL Argonne National LaboratoryAPD application for permit to drillAQRV air-quality-related valueAWDN Automated Weather Data Network
BACT best available control technologyBC Bighorn Canyon NRABE Black Elk WAbext total extinctionBG Bridger WABL Badlands WABLM Bureau of Land Management
CBM coal-bed methaneCI Crow IRCO carbon monoxideCP Cloud Peak WA
DEQ Department of Environmental QualityDM&E Dakota, Minnesota, and Eastern Railway CorporationDOI U.S. Department of the InteriorDT Devils Tower NM
EC elemental carbonEIC ENVIRON International CorporationEIS environmental impact statementEPA U.S. Environmental Protection Agency
FB Fort Belknap IRFL Fort Laramie NHSFLAG Federal Land Managers’ Air-Quality-Related Values WorkgroupFLM Federal Land ManagerFP Fort Peck IR

xi
FS Forest ServiceFWS U.S. Fish and Wildlife ServiceFZ Fitzpatrick WA
GM Gates of the Mountains WAGT Grand Teton NP
HAP hazardous air pollutantHNO3 nitric acid
IMPROVE Interagency Monitoring of Protected Visual EnvironmentsIR Indian ReservationIWAQM Interagency Workgroup on Air Quality Modeling
JC Jewel Cave NM
LAC limit of acceptable changeLCP Lambert Conformal Projection
MAAQS Montana Ambient Air Quality StandardsMDEQ Montana Department of Environmental QualityMEI maximally exposed individualMLE most likely exposureMM4 mesoscale meteorological model version 4MM5 mesoscale meteorological model version 5MR Mount Rushmore National MemorialMT Montana
NA North Absaroka WANAAQS National Ambient Air Quality StandardsNC Northern Cheyenne IRNCAR National Center for Atmospheric ResearchNEPA National Environmental Policy ActNHS National Historic SiteNH4NO3 ammonium nitrate(NH4)2SO4 ammonium sulfateNM National MonumentNO2 nitrogen dioxideNO3- nitrate ionNOx nitrogen oxidesNP National ParkNPS National Park ServiceNRA National Recreational AreaNWS National Weather Service
xii
O&G oil and gasO3 ozoneOC organic carbon
PA Popo Agie WAPb leadPM particulate matterPM2.5 particulate matter with an aerodynamic diameter equal to or less than 2.5 µm;
fine particulate matterPM10 particulate matter with an aerodynamic diameter equal to or less than 10 µm;
inhalable particulate matterPRB Powder River BasinPSD Prevention of Significant Deterioration
RAWS Remote Automated Weather StationRFD reasonably foreseeable developmentRFFA reasonably foreseeable future actionRR Red Rock Lakes WA
SAAQS State Ambient Air Quality StandardsSC Soldier Creek WASG Scapegoat WASO2 sulfur dioxideSO4= sulfate ion
TN Theodore Roosevelt NP-NorthTS Theodore Roosevelt NP-SouthTT Teton WA
UB UL Bend WA USDA U.S. Department of AgricultureUSGS U.S. Geological SurveyUTM universal transverse Mercator
VOC volatile organic compound
WA Wilderness AreaWAAQS Wyoming Ambient Air Quality StandardsWAQS&R Wyoming Air Quality Standards and RegulationsWC Wind Cave NPWDEQ Wyoming Department of Environmental QualityWK Washakie WAWY Wyoming
YS Yellowstone NP

xiii
UNITS OF MEASURE
bhp brake horsepowerBtu British thermal unit
d day(s)dv deciview(s)
ft foot (feet)ft3 cubic foot (feet)
g gram(s)
h hour(s)ha hectare(s)hp horsepower
in. inch(es)
kg kilogram(s)km kilometer(s)kW kilowatt(s)
L liter(s)
m meter(s)m3 cubic meter(s)mi mile(s)mi2 square mile(s)Mm-1 inverse megameter(s)MMCFD million cubic feet per dayMMTPY million tons per year
ppb part(s) per billion
s second(s)
TPY tons per year
µeq microequivalentµg microgram(s)
yr year(s)

xiv
1-1
1 INTRODUCTION
Development of coal-bed methane (CBM) in the Powder River Basin (PRB) in Wyomingand Montana has been occurring over the last few years, and is expected to accelerate andcontinue in the next 10 to 20 years. Two Bureau of Land Management (BLM) offices, that is, theWyoming State Office (Wyoming BLM) and the Miles Field Office in Montana (Montana BLM)separately identified the need to prepare an environmental impact statement (EIS) for futureCBM and conventional oil and gas (O&G) development activities in the portions of the PRBwithin the respective states of Wyoming and Montana.
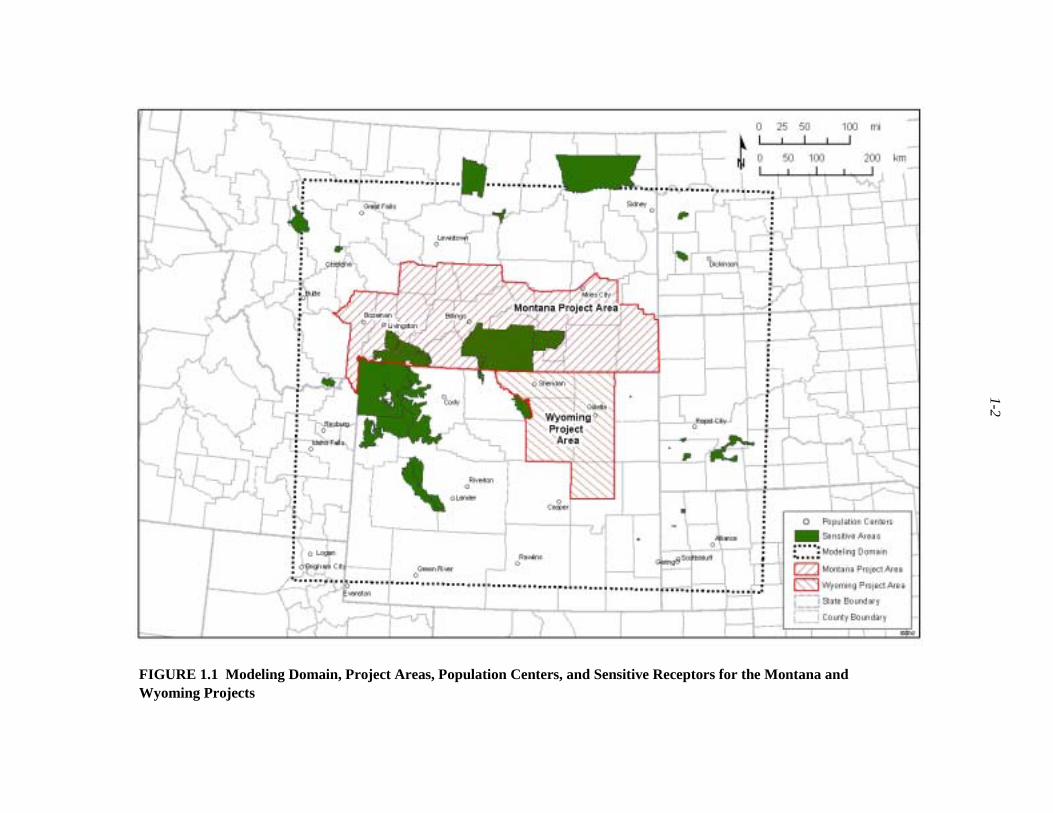
In July 2000, the Wyoming BLM requested that Argonne National Laboratory (ANL)conduct an assessment of potential impacts on ambient air quality and air-quality-related values(AQRVs) associated with CBM and conventional O&G development in the Wyoming portion ofthe PRB by using the CALPUFF modeling system (Scire et al. 1999a) (Wyoming Project Study).The modeling domain selected for the assessment included northeastern Wyoming and portionsof adjacent Montana, South Dakota, and Nebraska. In the Wyoming Project Study, emissionsfrom potential CBM and conventional O&G development in the Montana portion of the PRBwere not considered. The Wyoming BLM used the results of the Wyoming Project Studycompleted in November 2001 (ANL 2002) as input to the Draft Environmental Impact Statementand Draft Planning Amendment for the Powder River Basin Oil and Gas Project (BLM 2002).
In April 2001, the Montana BLM requested that Argonne conduct an assessment ofpotential impacts on ambient air quality and AQRVs associated with the CBM and conventionalO&G development in the Montana portion of the PRB by using the CALPUFF modeling system(Montana Project Study). For this assessment, a larger modeling domain was selected thatincluded most of Wyoming and Montana and portions of adjacent North Dakota, South Dakota,and Nebraska (Figure 1.1); also, more recent and detailed meteorological data over the newmodeling domain were developed and used. In the Montana Project Study, emissions from theWyoming Project were considered. The air quality and AQRV impact assessments for theMontana Project were completed in April 2002, and the results were submitted to the MontanaBLM in tabular form.
In July 2002, the Montana BLM and the Wyoming BLM jointly requested that ANLconduct an assessment of potential impacts on ambient air quality and AQRVs, thatsimultaneously considers both the Montana and Wyoming Projects (CombinedMontana/Wyoming Project Study). Additional requirements for this combined study included thefollowing: (1) conduct CALPUFF modeling for the Wyoming Project by using the modelingdomain and meteorological data developed for the Montana Project Study; (2) update theemissions inventories for the new and reasonably foreseeable future actions (RFFAs) orreasonably foreseeable development (RFD) sources within the modeling domain; and(3) consider various combinations of alternatives considered for each of the Montana andWyoming Projects for evaluation of a range of potential cumulative impacts. The air quality andAQRV impact assessment for the Montana and Wyoming Projects was completed in
1-2
FIGURE 1.1 Modeling Domain, Project Areas, Population Centers, and Sensitive Receptors for the Montana andWyoming Projects
1-3
September 2002, and the results were submitted to the Montana BLM and the Wyoming BLM intabular form.
In October 2002, the Montana BLM requested that ANL conduct separate assessments ofthe potential impacts on ambient air quality and AQRVs associated with the potential emissionsfrom CBM and conventional O&G development and operational activities forecast in (1) theCrow Indian Reservation (IR); (2) Northern Cheyenne IR; (3) Custer Forest Service (FS) land;and (4) Montana and Wyoming Project Areas, including the emissions from the Crow IR,Northern Cheyenne IR, and Custer FS lands as RFFAs (i.e., part of the non-project emissionsources). The air quality and AQRV impact assessments for these cases were completed inNovember 2002, and the results were submitted to the Montana BLM and the Wyoming BLM intabular form.
This document describes the methodologies used in assessing potential impacts on airquality and AQRVs due to the emissions from the Montana and Wyoming Projects; other newand RFFA sources in the surrounding area (non-project sources), and cumulative sources(Montana and Wyoming Project sources and other new and RFFA sources combined); and theresults of that assessment. The methodologies used in the assessment are based primarily on theair quality modeling guidelines of the U.S. Environmental Protection Agency (EPA); guidelinesof the U.S. Department of the Interior (DOI), National Park Service (NPS), the U.S. Fish andWildlife Service (FWS); and the U.S. Department of Agriculture (USDA), Forest Service (FS);and guidance documents of the Wyoming Department of Environmental Quality (WDEQ) andthe Montana Department of Environmental Quality (MDEQ).
Before ANL initiated the Wyoming and Montana Project Studies, Air QualityAssessment Protocol documents that describe Argonne’s plans for conducting the studies wereprepared with input from stakeholders (ANL 2001a,b). The stakeholders include the BLM;Federal Land Managers (FLMs) of affected areas; the EPA; Departments of EnvironmentalQuality (DEQs) of affected states; industries proposing new development; and environmentalgroups, including the Wyoming Outdoor Council; and the Crow Tribal Council and the NorthernCheyenne Tribal Council.
In work conducted for several recent EISs for various development projects within themodeling domain, detailed emission inventories for new and RFFA projects were developed. Theair quality modeling conducted for the Dakota, Minnesota, and Eastern Railway Corporation(DM&E) New Railway Retrofit Project EIS, one of the most recent of these EISs, used theCALPUFF modeling system for both near-field and far-field impact analyses (EIC 2000). ANLevaluated appropriate data from these efforts and used them in the Montana and WyomingProject Studies to achieve consistency and to minimize duplication of efforts. In addition,detailed meteorological data for the Montana Project modeling domain were prepared by usingthe MM5 and CALMET (Scire et al. 1999b) meteorological models.
The remainder of this document describes the Montana and Wyoming Projects in furtherdetail and provides a list of tasks performed for the combined study. Section 2 presents anoverview of the assessment approach. Descriptions of the air quality modeling system andmodeling domain used in the study are provided in Section 3. Section 4 describes model input
1-4
data, including meteorological, receptor, baseline ambient air quality, AQRV, and emissionsinventory data. Section 5 describes how air quality modeling and postprocessing of model outputdata were performed. Section 6 presents the criteria used in the assessments of estimated airquality and AQRV impacts. Section 7 presents the results of CALPUFF modeling and providesassessments of potential impacts on ambient air quality and AQRVs on the basis of the modelingresults.
1.1 PROJECT DESCRIPTION
1.1.1 Montana Project
The proposed Montana Project would include the potential development of CBM wells,conventional O&G wells, and ancillary facilities within the Montana Project Area, whichencompasses all of Big Horn, Carbon, Gallatin, Golden Valley, Musselshell, Park, Powder River,Stillwater, Sweet Grass, Treasure, Wheatland, and Yellowstone Counties and portions of Carter,Custer, and Rosebud Counties (Figure 1.1). New CBM and oil well locations are proposed fordevelopment on the basis of an 80-acre spacing per coal seam and a 40-acre well spacing(minimum acres per well) pattern, respectively. The exact well locations would be determined ata later date during the environmental assessment to be conducted for each well’s Application forPermit to Drill (APD), which would be reviewed and approved on a case-by-case basis. TheAPD process allows Conditions of Approval to be developed for each well on the basis of site-specific monitoring requirements and environmental constraints. In addition to well sites, otherfacilities, such as access roads, tanks and/or pipelines for gas gathering and water transport,electric utilities, and compressors and other associated facilities/equipment, would be developedor installed to facilitate O&G production and transportation.
The proposed Montana Project Area totals approximately 39,000 mi2 (25,000,000 acres).Well density, combined with a preferred approach to locating wells, tends to result in groupingsof wells into “pods,” depending on the structure of the coal seam and oil-bearing strata.Developed areas may have up to 24 CBM wells per square mile based on 80-acre spacing and3 coal seams, and 16 oil wells per square mile based on 40-acre spacing within productiveportions of the project area. The projected number of oil wells in the project area are based onhistorical drilling activity in the area. The remaining less productive portions of the project areamay never have any activity. As a result, if the total number of anticipated wells were drilled, theaverage density of new wells would be approximately 1 CBM well and 1 oil well per squaremile.
The forecast wells are projected to be drilled over the next 20-year period. The rate ofdevelopment would depend on the productivity of the wells and the ability to transport andmarket the products. The Montana Project would include well development and production onprivate, state, and federal lands. However, well development would likely continue on private,state, and IR mineral estates, even if development were not to occur on federal lands.
1-5
The Montana Project facilities would be designed to use appropriate control technologieson emissions sources such as compressor engines. The specific systems would be determinedthrough a New Source Review analysis conducted as a part of the Montana permitting process(Administrative Rules of Montana, Title 17, Chapter 8, Sub-Chapter 7).
1.1.2 Wyoming Project
The proposed Wyoming Project would include the development of CBM wells,conventional O&G wells, and ancillary facilities within the Wyoming Project Area, whichencompasses all of Campbell, Johnson, and Sheridan Counties and a major portion of northernConverse County (Figure 1.1). New CBM and oil well locations are proposed for developmenton the basis of an 80-acre and 40-acre well spacing pattern, respectively. The exact welllocations would be determined at a later date during the environmental assessment to beconducted for each well’s APD, which would be reviewed and approved on a case-by-case basis.The APD process allows Conditions of Approval to be developed for each well on the basis ofsite-specific monitoring requirements and environmental constraints. In addition to well sites,other facilities, such as access roads, tanks and/or pipelines for gas gathering and water transport,electric utilities, and compressors and other associated facilities/equipment, would be developedor installed to facilitate O&G production and transportation.
The proposed Wyoming Project Area totals approximately 13,500 mi2 (8,636,000 acres).Well density, combined with a preferred approach to locating wells, tends to result in groupingsof wells into “pods,” depending on the structure of the coal seam and oil-bearing strata.Developed areas may have up to 8 CBM wells per square mile based on 80-acre spacing, and16 oil wells per square mile based on 40-acre spacing within productive portions of the projectarea. The remaining less productive portions of the project area may never have any activity. Asa result, if the total number of anticipated wells were drilled, the average density of new wellswould be approximately 3.3 CBM wells and 0.4 oil well per square mile.
A group of O&G companies is planning to drill these wells over the next 10-year period.The rate of development would depend on the productivity of the wells and the ability totransport and market the products. The Wyoming Project would include well development andproduction from private, state, and federal O&G properties. However, CBM and oil welldevelopment would likely continue on private and state mineral estates, even if the BLM deniesdevelopment of federal mineral estates.
The Wyoming Project facilities would be designed to use appropriate controltechnologies on emissions sources such as compressor engines. The specific systems would bedetermined through a New Source Review analysis conducted as a part of the Wyomingpermitting process (Wyoming Air Quality Standards and Regulations [WAQS&R], Chapter 6,Section 2). Preliminary information indicates that the emissions control systems for compressorengines might include the use of lean-burn natural gas reciprocating engines with catalyticcontrol and/or catalytic-controlled rich-burn engines with an air-fuel ratio controller to limitemissions of nitrogen oxides (NOx), carbon monoxide (CO), and formaldehyde.
1-6
1.2 ALTERNATIVES EVALUATED
1.2.1 Montana EIS
Five alternatives were considered in the Montana EIS:
1. Alternative A: no action (existing management);
2. Alternative B: emphasize soil, water, air, vegetation, wildlife, and culturalresources;
3. Alternative C: emphasize CBM development;
4. Alternative D: encourage exploration and development while maintainingexisting land uses; and
5. Alternative E: preferred alternative.
Under Alternative A (No Action), about 250 new CBM wells would be drilled and tested.Ninety percent of CBM wells on State land would go into production, but no CBM wells onBLM land would go into production. Well pads and roads would be constructed for all wellsdrilled, and other ancillary facilities, such as pipelines, power lines, and compressors would beinstalled for production wells. During the period of well completion, testing, and initial operationprior to installation of a commercial power line, temporary field generators would be operatedfor the purpose of lighting and water pumping. For CBM production, about 10 field (booster)compressors and a single sales (reciprocating) compressor would be installed, all of which wouldbe gas-fired. The number of wells connected to each compressor would depend on the operator’scircumstances. During construction, compressors and generators could be powered by diesel,electric, or gas-fired engines. About 600 to 2,000 conventional O&G wells would also be drilledunder this alternative. Thirty percent of conventional O&G wells on both State and BLM landswould go into production.
Under Alternative B (Gas-fired Engines), the numbers of CBM wells drilled would rangebetween 9,000 and 18,265. Well pads and roads would be constructed for all wells drilled, andother ancillary facilities, such as pipelines, power lines, and compressors would be installed forproduction wells. During the period of well completion, testing, and initial operation prior toinstallation of a commercial power line, temporary field generators would be operated for thepurpose of lighting and water pumping. Ninety percent of CBM wells on both State and BLMlands would go into production. The number of wells connected to each compressor would bemaximized, with the number of field (booster) compressors ranging between 350 to 1,000, andthe number of sales (reciprocating) compressors ranging between 50 to 100. All generators andfield (booster) and sales (reciprocating) compressors would be gas-fired. The number ofconventional O&G wells would be identical to that of Alternative A.
1-7
Alternative C (Diesel Generator) is identical to Alternative B, except that there would beno minimum number of CBM wells connected to a field (booster) compressor, nor would thenumber of compressors be limited, and operators could use diesel generators with best availablecontrol technology (BACT) emission devices.
Alternative D (Electric Field Compressors) is identical to Alternative B, except that allfield (booster) compressor engines would be required to be powered by electricity.
Alternative E (Preferred Alternative) is also identical to Alternative B, except that theinstallation of electrical field (booster) compressor engines may be required in areas withsensitive resources, including people, where noise is an issue.
Alternative A (No Action) is distinctly different from all other alternatives because of itssmaller number of CBM wells (250 versus 9,000 to 18,265). Alternative D (Electric FieldCompressors) is also quite different from the others because all of its field compressor engineswould be powered by electricity. However, Alternatives B (Gas-Fired Engines), C (Gas-FiredEngines with Diesel Generator Option), and E (Preferred Alternative - Gas-Fired Engines withthe Possibility of Some Electrical Field Compressors) are quite similar to one another with onlyminor differences. Potential air quality and AQRV impacts of Alternatives B and E would beonly slightly smaller than those of Alternative C. Therefore, only Alternatives A, D, and E (alsorepresenting B and C) were selected for air quality and AQRV impact analysis.
For Alternatives D and E, another set of air quality and AQRV impact analyses wasconducted that included potential impacts of well development on the Crow and NorthernCheyenne IR and Custer National Forest (FS) lands. (These two cases are designated asAlternatives Da and Ea, respectively.) The number of CBM wells forecast on the IR and FSlands are 4,000, 4,000, and 200, respectively, representing approximately 22, 22, and 1%,respectively, of the CBM wells forecast under Alternative D or E. The number of conventionalO&G wells forecast on the IR and FS lands is 55, representing approximately 3% of theconventional O&G wells forecast under Alternative D or E.
Table 1.1 provides information on the new wells and ancillary facilities (well pads, roads,pipelines, power lines, compressors, and temporary field generators) to be developed/installedduring the 20-year period under the three Montana Project Alternatives. Similar information isalso provided for Alternatives Da and Ea (i.e., Alternatives D and E plus well development onthe IR and FS lands). The year-by-year development plan for CBM wells and compressors andprojected annual gas production volumes under various alternatives are presented in Table 1.2.
For each of the three Montana Project Alternatives and two additional cases of Da and Ea(Alternatives D and E plus well development on the IR and FS lands), the high- and low-emissions Wyoming alternatives, that is, Alternative 1 (Proposed Action) and Alternative 3(No Action) of the Wyoming Project, respectively, were considered to evaluate a range ofcumulative impacts. This resulted in six Montana-Wyoming Alternative combinations and fourMontana Alternative plus well development on IR &FS lands-Wyoming Alternativecombinations for impact assessment (Table 1.3).
1-8
TABLE 1.1 New CBM Wells and Ancillary Facilities under Various Montana EISAlternativesa
Alternativeb
Wells/Facilities Unit A D (Da) Ec (Eac)
CBM wells each 897d 18,266 (26,466) 18,266 (26,466)
Well pads each 299 6,089 (8,822) 6,089 (8,822)
Roadse mi 75 1,522 (2,206) 1,522 (2,206)
2−3 in. mi 598 12,177 (17,644) 12,177 (17,644)Poly pipeline12 in. mi 40 1,482 (2,098) 1,482 (2,098)
Steel pipeline 12 in. mi 11 434 (600) 434 (600)
Electric line Overhead mi 60 1,218 (1,764) 1,218 (1,764)
Field (booster) each 20 741 (1,049) 741 (1,049)Compressorsf
Sales (reciprocating) each 2 76 (105) 76 (105)
Field generatorsg each 112 2,278 (3,308) 2,278 (3,308)
a Data for Blaine County are not included because it is located outside the modeling domain.
b Data for Alternatives Da and Ea, respectively, represent those for Alternatives D and E plusthe data for development on IR and FS lands.
c Assumed to represent Alternatives B and C. Diesel generators with BACT would beallowed under Alternative C.
d Of the 897 wells drilled, only 515 would be operated as producing wells. All others wouldbe shut down after testing.
e For both improved and two-track roads.
f Field compressors (400 hp each) and sales compressors (1,731 hp each) would be gas-firedunder all alternatives, except that field compressors would be operated by electricity underAlternatives D and Da.
g Field generators (125 kW each) for lighting and water pumping purposes are temporaryunits assumed to operate for an average of 120 days during the period of well completion,testing, and initial operation prior to installation of a commercial power line. Each fieldgenerator is assumed to serve an average of eight wells.
1-9
TABLE 1.2 Development Plan for CBM Wells and Compressors and Projected Annual Gas Productionunder Various Montana EIS Alternatives
Compressors
CBM Wellsa Field SalesAnnual Gas Volume
(MMCFD)b
Year Alt. A Alt. D Alt. Ec Alt. A Alt. D Alt. Ec Alt. A Alt. D Alt. Ec Alt. A Alt. D Alt. Ec
1 67 710 710 2 37 37 1 8 8 8 142 1422 102 1,058 1,058 2 38 38 0 11 11 19 354 3543 124 1,408 1,408 3 49 49 0 11 11 33 635 6354 160 1,731 1,731 3 61 61 1 8 8 52 981 9815 110 1,374 1,374 7 94 94 0 3 3 64 1,256 1,2566 94 1,237 1,237 1 49 49 0 2 2 75 1,504 1,5047 59 1,291 1,291 1 51 51 0 4 4 82 1,762 1,7628 26 1,231 1,231 1 49 49 0 2 2 85 2,008 2,0089 25 1,230 1,230 0 32 32 0 2 2 88 2,254 2,254
10 27 998 998 0 14 14 0 2 2 91 2,454 2,45411 17 801 801 0 7 7 0 3 3 93 2,614 2,61412 16 831 831 0 39 39 0 4 4 95 2,780 2,78013 18 812 812 0 30 30 0 3 3 97 2,942 2,94214 14 798 798 0 28 28 0 3 3 99 3,102 3,10215 12 744 744 0 42 42 0 5 5 100 3,251 3,25116 10 615 615 0 28 28 0 2 2 101 3,374 3,37417 6 514 514 0 31 31 0 1 1 102 3,477 3,47718 4 431 431 0 25 25 0 0 0 102 3,563 3,56319 4 302 302 0 23 23 0 0 0 103 3,623 3,62320 2 150 150 0 16 16 0 0 0 103 3,653 3,653
Total 897 18,266 18,266 20 741 741 2 76 76 1,593 45,728 45,728
a It is assumed that three wells would be drilled at one well pad.
b MMCFD = million cubic feet per day.
c Also represents Alternatives B and C.
1-10
TABLE 1.3 Alternative Combinations Evaluated for Air Quality and AQRV Impacts
AlternativeCombinationa
Montana ProjectAlternative
Wyoming ProjectAlternative
1 Proposed Action (Alt. 1)2
Alt. E(Preferred Alternative) No Action (Alt. 3)
Montana EIS 3 Proposed Action (Alt. 1)
4
Alt. Ewith Development on IR and FS
Lands (Ea)No Action (Alt. 3)
5 Proposed Action (Alt. 1)6
Alt. D(with Electric Field Compressors) No Action (Alt. 3)
7 Proposed Action (Alt. 1)
8
Alt. Dwith Development on IR and FS
Lands (Da)No Action (Alt. 3)
9 Proposed Action (Alt. 1)10
Alt. A(No Action) No Action (Alt. 3)
AlternativeCombinationa
Wyoming ProjectAlternative
Montana ProjectAlternative
11 Preferred Alternative (Alt. E)
12
Alt. 1(Proposed Action)
No Action (Alt. A)
13 Preferred Alternative (Alt. E)
Wyoming EIS 14
Alt. 2a(50% Electric Booster
Compressors)No Action (Alt. A)
15 Preferred Alternative (Alt. E)
16
Alt. 2b(100% Electric Booster
Compressors)No Action (Alt. A)
17 Preferred Alternative (Alt. E)18
Alt. 3(No Action) No Action (Alt. A)
a Cumulative impacts for the following alternative combinations are identical: 1 and 11, 2 and 17, 9and 12, and 10 and 18.
1-11
1.2.2 Wyoming EIS
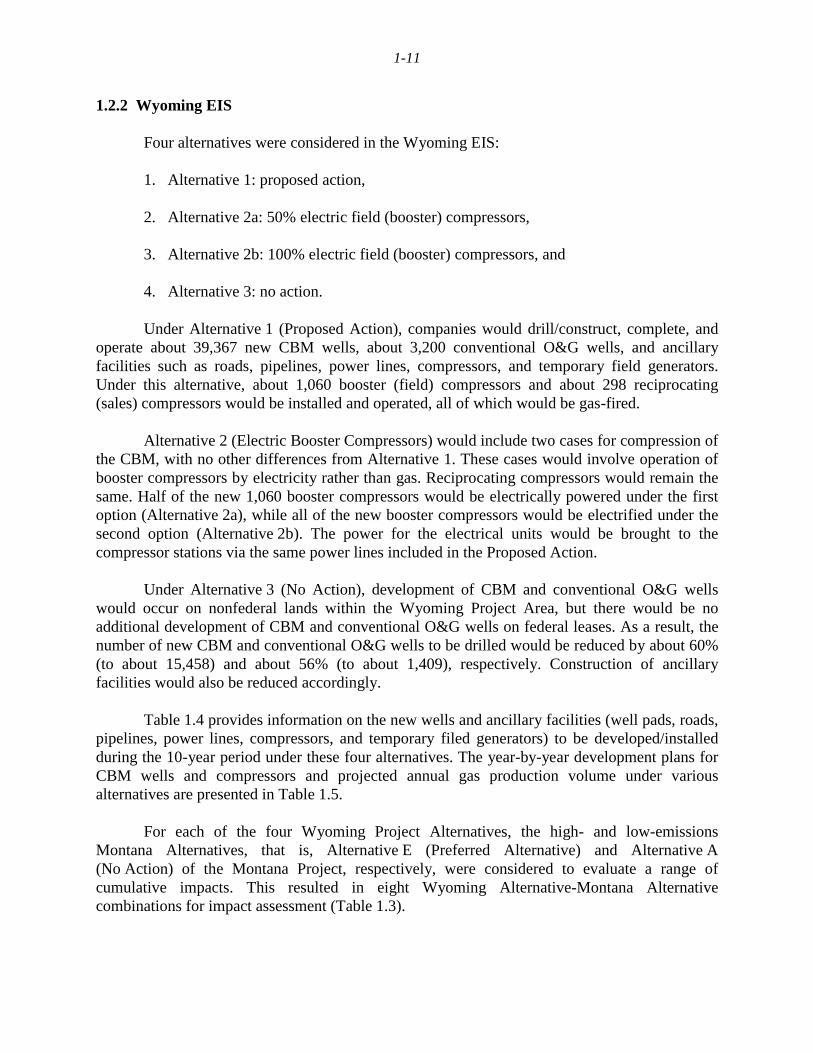
Four alternatives were considered in the Wyoming EIS:
1. Alternative 1: proposed action,
2. Alternative 2a: 50% electric field (booster) compressors,
3. Alternative 2b: 100% electric field (booster) compressors, and
4. Alternative 3: no action.
Under Alternative 1 (Proposed Action), companies would drill/construct, complete, andoperate about 39,367 new CBM wells, about 3,200 conventional O&G wells, and ancillaryfacilities such as roads, pipelines, power lines, compressors, and temporary field generators.Under this alternative, about 1,060 booster (field) compressors and about 298 reciprocating(sales) compressors would be installed and operated, all of which would be gas-fired.
Alternative 2 (Electric Booster Compressors) would include two cases for compression ofthe CBM, with no other differences from Alternative 1. These cases would involve operation ofbooster compressors by electricity rather than gas. Reciprocating compressors would remain thesame. Half of the new 1,060 booster compressors would be electrically powered under the firstoption (Alternative 2a), while all of the new booster compressors would be electrified under thesecond option (Alternative 2b). The power for the electrical units would be brought to thecompressor stations via the same power lines included in the Proposed Action.
Under Alternative 3 (No Action), development of CBM and conventional O&G wellswould occur on nonfederal lands within the Wyoming Project Area, but there would be noadditional development of CBM and conventional O&G wells on federal leases. As a result, thenumber of new CBM and conventional O&G wells to be drilled would be reduced by about 60%(to about 15,458) and about 56% (to about 1,409), respectively. Construction of ancillaryfacilities would also be reduced accordingly.
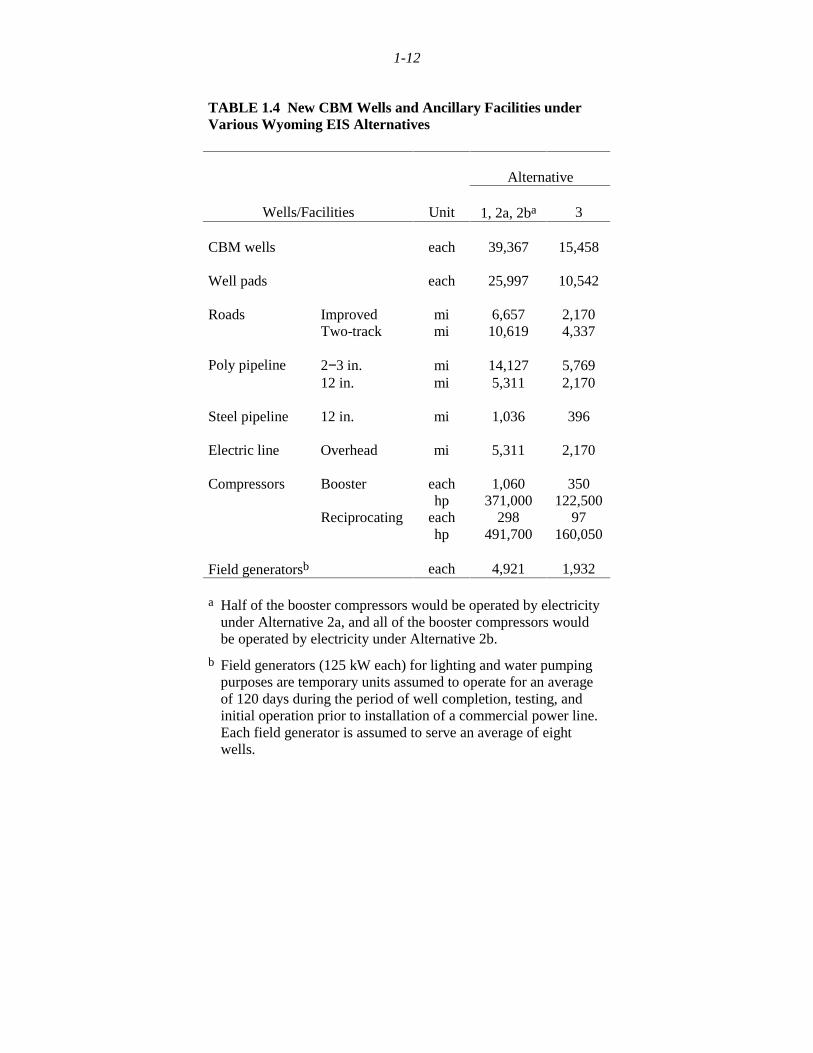
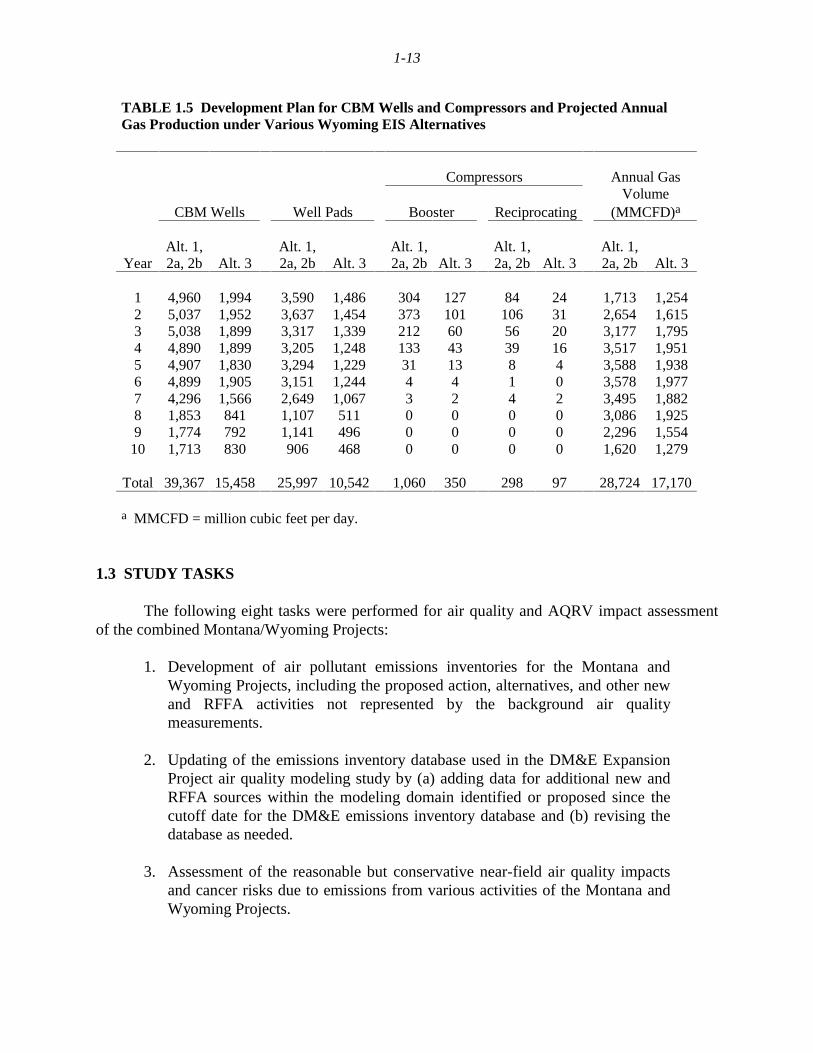
Table 1.4 provides information on the new wells and ancillary facilities (well pads, roads,pipelines, power lines, compressors, and temporary filed generators) to be developed/installedduring the 10-year period under these four alternatives. The year-by-year development plans forCBM wells and compressors and projected annual gas production volume under variousalternatives are presented in Table 1.5.
For each of the four Wyoming Project Alternatives, the high- and low-emissionsMontana Alternatives, that is, Alternative E (Preferred Alternative) and Alternative A(No Action) of the Montana Project, respectively, were considered to evaluate a range ofcumulative impacts. This resulted in eight Wyoming Alternative-Montana Alternativecombinations for impact assessment (Table 1.3).
1-12
TABLE 1.4 New CBM Wells and Ancillary Facilities underVarious Wyoming EIS Alternatives
Alternative
Wells/Facilities Unit 1, 2a, 2ba 3
CBM wells each 39,367 15,458
Well pads each 25,997 10,542
Improved mi 6,657 2,170RoadsTwo-track mi 10,619 4,337
2−3 in. mi 14,127 5,769Poly pipeline12 in. mi 5,311 2,170
Steel pipeline 12 in. mi 1,036 396
Electric line Overhead mi 5,311 2,170
each 1,060 350Boosterhp 371,000 122,500
each 298 97
Compressors
Reciprocatinghp 491,700 160,050
Field generatorsb each 4,921 1,932
a Half of the booster compressors would be operated by electricityunder Alternative 2a, and all of the booster compressors wouldbe operated by electricity under Alternative 2b.
b Field generators (125 kW each) for lighting and water pumpingpurposes are temporary units assumed to operate for an averageof 120 days during the period of well completion, testing, andinitial operation prior to installation of a commercial power line.Each field generator is assumed to serve an average of eightwells.
1-13
TABLE 1.5 Development Plan for CBM Wells and Compressors and Projected AnnualGas Production under Various Wyoming EIS Alternatives
Compressors
CBM Wells Well Pads Booster Reciprocating
Annual GasVolume
(MMCFD)a
YearAlt. 1,2a, 2b Alt. 3
Alt. 1,2a, 2b Alt. 3
Alt. 1,2a, 2b Alt. 3
Alt. 1,2a, 2b Alt. 3
Alt. 1,2a, 2b Alt. 3
1 4,960 1,994 3,590 1,486 304 127 84 24 1,713 1,2542 5,037 1,952 3,637 1,454 373 101 106 31 2,654 1,6153 5,038 1,899 3,317 1,339 212 60 56 20 3,177 1,7954 4,890 1,899 3,205 1,248 133 43 39 16 3,517 1,9515 4,907 1,830 3,294 1,229 31 13 8 4 3,588 1,9386 4,899 1,905 3,151 1,244 4 4 1 0 3,578 1,9777 4,296 1,566 2,649 1,067 3 2 4 2 3,495 1,8828 1,853 841 1,107 511 0 0 0 0 3,086 1,9259 1,774 792 1,141 496 0 0 0 0 2,296 1,554
10 1,713 830 906 468 0 0 0 0 1,620 1,279
Total 39,367 15,458 25,997 10,542 1,060 350 298 97 28,724 17,170
a MMCFD = million cubic feet per day.
1.3 STUDY TASKS
The following eight tasks were performed for air quality and AQRV impact assessmentof the combined Montana/Wyoming Projects:
1. Development of air pollutant emissions inventories for the Montana andWyoming Projects, including the proposed action, alternatives, and other newand RFFA activities not represented by the background air qualitymeasurements.
2. Updating of the emissions inventory database used in the DM&E ExpansionProject air quality modeling study by (a) adding data for additional new andRFFA sources within the modeling domain identified or proposed since thecutoff date for the DM&E emissions inventory database and (b) revising thedatabase as needed.
3. Assessment of the reasonable but conservative near-field air quality impactsand cancer risks due to emissions from various activities of the Montana andWyoming Projects.
1-14
4. Assessment of the reasonably foreseeable near-field cumulative air qualityimpacts due to emissions from the Montana and Wyoming Projects and othernew and RFFA sources.
5. Assessment of the far-field air quality impacts due to emissions from theMontana and Wyoming Projects at Class I areas and specified Class II areasof concern within the modeling domain.
6. Assessment of the far-field cumulative air quality impacts due to emissionsfrom the Montana and Wyoming Projects and other new and RFFA sources.
7. Assessment of the impacts due to emissions from the Montana and WyomingProjects on visibility and acid deposition at the Class I areas and specifiedClass II areas of concern.
8. Assessment of the cumulative impacts due to emissions from the Montana andWyoming Projects and other new and RFFA sources on visibility and aciddeposition at the Class I areas and specified Class II areas of concern.
2-1
2 OVERVIEW OF ASSESSMENT APPROACH
As requested by the Montana BLM and the Wyoming BLM, Argonne estimated andassessed the potential impacts of air pollutant emissions from the Montana Project and WyomingProject (current project) sources, other new and RFFA sources in the surrounding area, andcumulative sources (Montana Project and Wyoming Project sources and other new and RFFAsources combined) under the 18 alternative combinations of the two projects. Potential impactsassessed included near-field impacts on criteria and hazardous air pollutants and far-field impactson criteria air pollutants and AQRVs (visibility and acid deposition).
Argonne used the latest version of the CALPUFF modeling system (Version 5) to predictpotential impacts on air quality and AQRVs. For the CALPUFF modeling domain for thecombined Montana/Wyoming Project Study (current study), ANL defined a modeling domainthat includes most of Montana and Wyoming, and portions of adjacent North Dakota, SouthDakota, and Nebraska (Figure 1.1). Near-field receptor locations were arranged to identify themaximum concentrations due to the emissions under various alternative combinations. Receptorswere located along the boundaries and within each of the Class I areas and specified Class IIareas of concern within the modeling domain (e.g., National Parks [NPs] and NationalMonuments [NMs], Wilderness Areas [WAs], and IRs).
The DM&E CALPUFF cumulative emissions inventory database was updated and usedin air quality modeling for the current study with a few exceptions, including (1) emissions datafor the proposed sources of the current project; (2) emissions data for additional new sourcessince the DM&E emission inventory database cutoff date, identified by the state DEQs; and(3) selected DM&E emission inventory database revisions, reviewed by the state DEQs, revisedby Argonne, and approved by the BLM, as needed.
The meteorological database used in the CALPUFF modeling for the current study wasthe output from the CALMET modeling based on the 1996 MM5 prognostic meteorologicalmodel output and the 1996 surface wind and precipitation data from selected National WeatherService (NWS) and other meteorological stations located in the area slightly larger than themodeling domain.
The outputs from the air quality modeling were used to assess potential impacts on near-field and far-field air quality and far-field AQRVs. Air quality impact assessments wereconducted (1) by comparing potential air quality impacts predicted to result from the projectemissions under each of the various alternatives alone, all other new and RFFA sourcesemissions alone, and all sources emissions combined (cumulative) with the applicable Preventionof Significant Deterioration (PSD) increments (Class I or Class II depending on receptorlocation); and (2) by comparing the potential total concentrations (direct cumulative air qualityimpacts plus the existing background concentration) with the applicable National Ambient AirQuality Standards (NAAQS) and applicable State Ambient Air Quality Standards (SAAQS).
Near-field impacts of emissions from construction sites, including fugitive dust emissionsand operational emissions from compressor stations, were assessed by comparing them with
2-2
NAAQS and SAAQS. Near-field impacts of hazardous air pollutants (HAPs) from compressorstations were evaluated by comparing them with acceptable ambient concentration levels(AACLs) identified by states and by calculating the distances from the source beyond whichpotential cancer risks for a maximally exposed individual (MEI) and most likely exposure(MLE) condition would decrease to the levels of 1 × 10⁻⁴ and 1 × 10⁻⁶.
AQRVs evaluated included visibility and acid deposition. Potential visibility impactswere assessed at the far-field receptors located in sensitive receptor areas by using the screeningprocedure drafted by the FLMs’ Air-Quality-Related Values Workgroup (FLAG). Thisprocedure uses an assumed natural background visibility reference level and visibilitydegradation parameter equations recommended by FLAG. Estimated potential visibilitydegradations were compared with the limit of acceptable change (LAC) thresholds. Assessmentsof potential visibility impairment were also made on the basis of background reference levels(visibility conditions) provided by the State of Wyoming. For those receptors for which thepotential visibility impairment predicted by using the FLAG screening procedure was equal to orexceeded the LAC thresholds, a refined assessment of daily visibility impairment was made onthe basis of available hourly optical visibility data in order to determine the magnitude,frequency, and duration of such a potential impairment. The locations of sensitive receptors forwhich potential visibility impairment was assessed are shown in Figure 2.1.
Acid deposition impacts were assessed by comparing predicted annual total aciddeposition fluxes (wet and dry) with existing deposition LACs (Fox et al. 1989), as well as withsensitive lakes in terms of their acid neutralizing capacity (ANC) and the LAC thresholdestablished on the basis of FS-recommended prediction methods (FS Rocky Mountain Region2000). These include Black Joe, Deep, Hobbs, and Upper Frozen Lakes in the Class I BridgerWA, Ross Lake in the Class I Fitzpatrick WA, Stepping Stone and Twin Island Lakes in theClass II Absaroka-Beartooth WA, Emerald Lake and Florence Lake in the Class II Cloud PeakWA, and Lower Saddlebag Lake in the Class II Popo Agie WA.
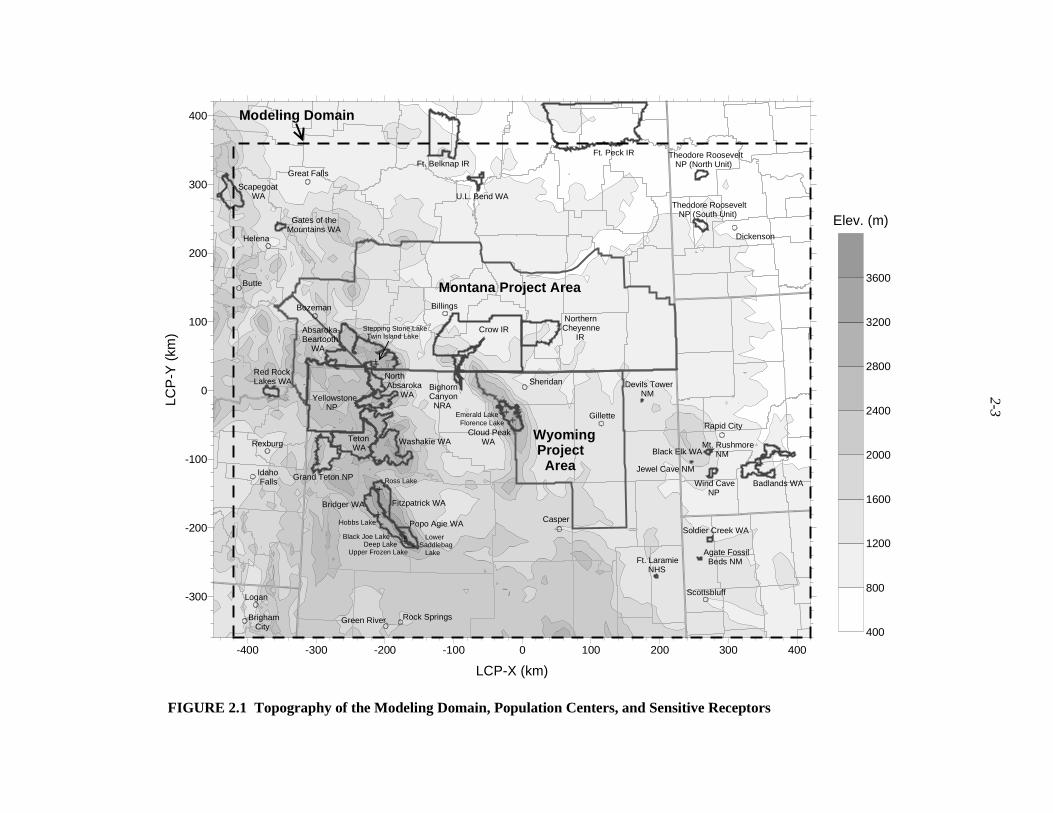
2-3
-400 -300 -200 -100 0 100 200 300 400
LCP-X (km)
-300
-200
-100
0
100
200
300
400
LCP
-Y (
km)
400
800
1200
1600
2000
2400
2800
3200
3600
Badlands WA
Rapid City
Wind Cave NP
Jewel Cave NM
Black Elk WAMt. Rushmore NM
Scottsbluff
Soldier Creek WA
Agate Fossil Beds NMFt. Laramie
NHS
Devils Tower NM
Sheridan
Gillette
Casper
Rock SpringsGreen RiverBrigham City
Logan
Idaho Falls
Rexburg
Bozeman
Butte
Helena
Great Falls
Billings
Dickenson
Cloud Peak WA
Crow IR NorthernCheyenne IR
Yellowstone NP
Teton WA
Grand Teton NP
North Absaroka WA
Washakie WA
Bridger WA Fitzpatrick WA
Popo Agie WA
BighornCanyon NRA
Red RockLakes WA
Gates of theMountains WA
Scapegoat WA
Ft. Peck IRFt. Belknap IR
U.L. Bend WA
Theodore Roosevelt NP (North Unit)
Theodore Roosevelt NP (South Unit)
Absaroka-Beartooth WA
Emerald LakeFlorence Lake
Ross Lake
Hobbs Lake
LowerSaddlebag Lake
Black Joe Lake Deep Lake Upper Frozen Lake
Stepping Stone Lake Twin Island Lake
Elev. (m)
Modeling Domain
Montana Project Area
Wyoming Project Area
FIGURE 2.1 Topography of the Modeling Domain, Population Centers, and Sensitive Receptors

2-4
3-1
3 AIR QUALITY MODELING SYSTEM AND MODELING DOMAIN
An air quality modeling analysis was conducted for the Montana and Wyoming Projects(current study) to assess potential impacts on ambient air quality and AQRVs due to the Montanaand Wyoming Projects and other new and RFFA sources in the modeling domain. TheCALPUFF modeling system (Scire et al. 1999a) recommended by the Interagency Workgroupon Air Quality Modeling (IWAQM) was used as the basis of the modeling analysis for both near-and far-field impact assessments. The CALPUFF modeling system is recommended for a refinedmodeling analysis (as opposed to a screening-type analysis) to address the air quality impacts ofpollutants transported over relatively long distances (EPA 1998).
The CALPUFF modeling system has three main components: CALMET (a diagnosticthree-dimensional meteorological model), CALPUFF (the transport and dispersion model), andCALPOST (a postprocessing analysis package). The CALPUFF modeling system is designed to(1) treat time-varying point and area sources, (2) model domains from tens of meters to hundredsof kilometers from a source, (3) predict averaging times ranging from one hour to one year,(4) be applied to inert pollutants and those subject to linear removal and chemical conversionmechanisms, and (5) be applied to rough or complex terrain situations. CALPUFF is aLagrangian puff model with the capability to simulate regional-scale, long-range dispersion aswell as local-scale, short-range dispersion (Scire et al. 1999a).
The CALPUFF model not only enables the prediction of direct concentrations that mayresult from new and RFFA sources but also the prediction of total cumulative ambientconcentrations by summing up the observed background concentrations (due to existing sources)and the direct impact due to new and RFFA sources.
To be able to easily evaluate impacts due to a specific source category or categories, theair quality modeling program for the current project was designed so that impact contributionsfrom various source category(ies) could be readily separated from overall impacts due to allsource categories. Source categories were defined at two hierarchical levels. At the first level,emission sources were divided into three groups: (1) emission sources for the proposed actions(or alternatives); (2) sources with permits to construct or operate; and (3) all other potential newsources, reasonably foreseeable but without permits to construct. At the second level, each first-level source category was classified into subgroups by industry category (power plant, surfacecoal mine, locomotive, gas/oil production site, compressor station, petroleum refinery, petroleumstorage tank, gas processing plant, etc.). The program was also designed to allow emissioninventory information for specific emission sources to be easily added or removed, so thatadditional model runs could be performed with minimal effort.
3-2
The modeling domain proposed for the current study includes most of Wyoming andMontana and portions of adjacent North Dakota, South Dakota, and Nebraska (Figure 1.1). Themodeling domain is defined in the Lambert Conformal Projection (LCP) grid system as follows:
• Central reference LCP point (longitude, latitude) = (-107.0°, 44.75°),
• Standard latitude parallels at 30° and 60°, and
• Grid origin offset from central reference point = (-420 km, -360 km).
For the near-field impact assessment, the air quality modeling was limited to an areaextending approximately 30 km in all directions beyond the locations of stationary emissionssources of the Montana and Wyoming Projects that are closest to the boundaries of the respectiveproject area.
4-1
4 MODEL INPUT DATA
4.1 METEOROLOGICAL DATA
Hourly three-dimensional meteorological data fields for 1996 were developed for themodeling domain selected for the current study by ENVIRON International Corporation (EIC)by using Version 5.2 of the CALMET meteorological model (Scire et al. 1999b), a diagnosticmeteorological model (EIC 2001). The meteorological database with local wind variations at a4-km by 4-km resolution was used as input to the CALPUFF model for the current study.
CALMET, one of the three main components of the CALPUFF modeling system,includes a diagnostic wind model that combines surface and upper-air meteorological data withdiagnostic effects of terrain and other factors in order to generate three-dimensional wind fields(Scire et al. 1999b). It also includes other interpolation algorithms that generate three-dimensional temperature, pressure, and other meteorological variables, and two-dimensionalprecipitation fields. For areas with complex terrain and sparse wind observations, a diagnosticwind model cannot accurately depict the complex flow fields by using surface observation dataalone. In those situations, CALMET defines the synoptic-scale flow features by using the outputfrom a coarse grid (e.g., 36 km) resolution simulation of a prognostic meteorological model(e.g., Pennsylvania State University/National Center for Atmospheric Research [NCAR]mesoscale meteorological model [MM5]) and then better characterizes the local wind variationsat a finer scale (e.g., 4 km) by using its diagnostic wind algorithms and local surfaceobservations. The MM5 simulation was performed by using four-dimensional data assimilationof analysis fields generated by interpolation of the standard NWS upper-air meteorological data.Thus, the three-dimensional MM5 meteorological fields implicitly contain the effects of theNWS upper-air meteorological observations.
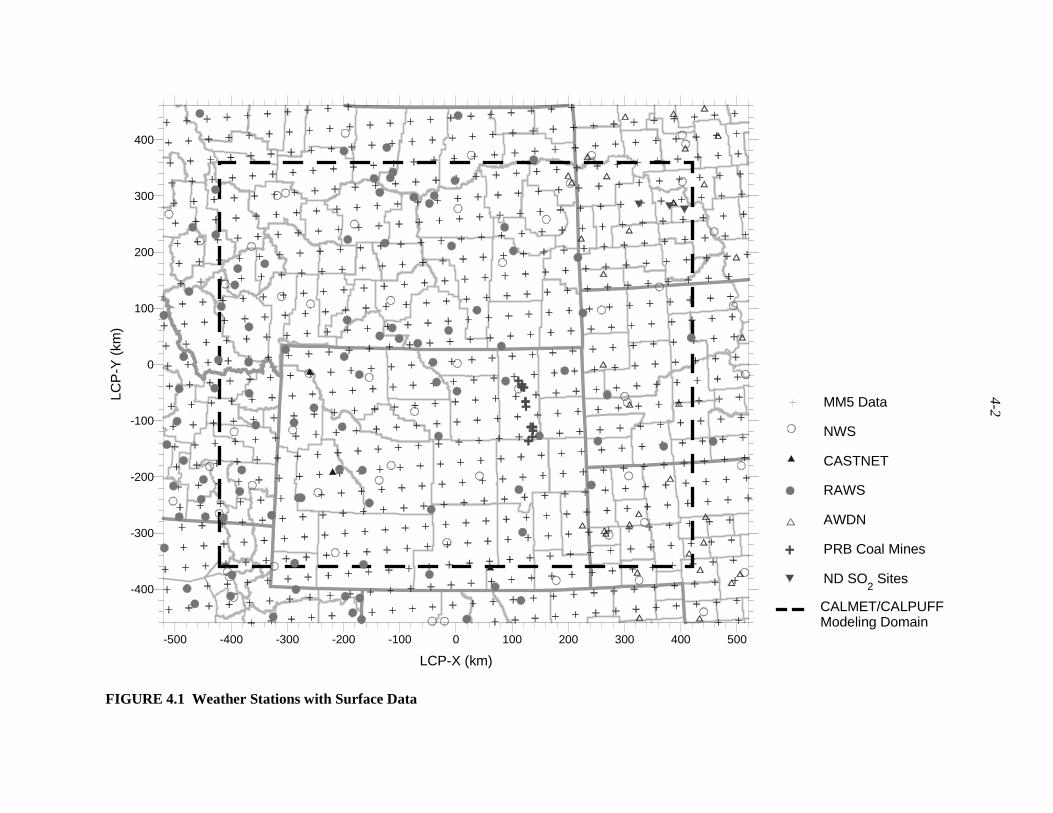
The detailed meteorological database for the project domain was developed by usingsurface meteorological data from a total of 240 surface stations from the following networkswithin areas somewhat larger than the modeling domain (Figure 4.1):
• NWS sites (64),
• Automated Weather Data Network (AWDN) (40),
• Remote Automated Weather Stations (RAWSs) (118),
• North Dakota Sulfur Dioxide (SO2) Monitoring Sites (3),
• CASTNET sites (3), and
• Powder River Basin (PRB) Industrial sites (12).
4-2
-500 -400 -300 -200 -100 0 100 200 300 400 500
LCP-X (km)
-400
-300
-200
-100
0
100
200
300
400
LCP
-Y (
km)
MM5 Data
NWS
CASTNET
RAWS
AWDN
PRB Coal Mines
ND SO2 Sites
CALMET/CALPUFFModeling Domain
FIGURE 4.1 Weather Stations with Surface Data
4-3
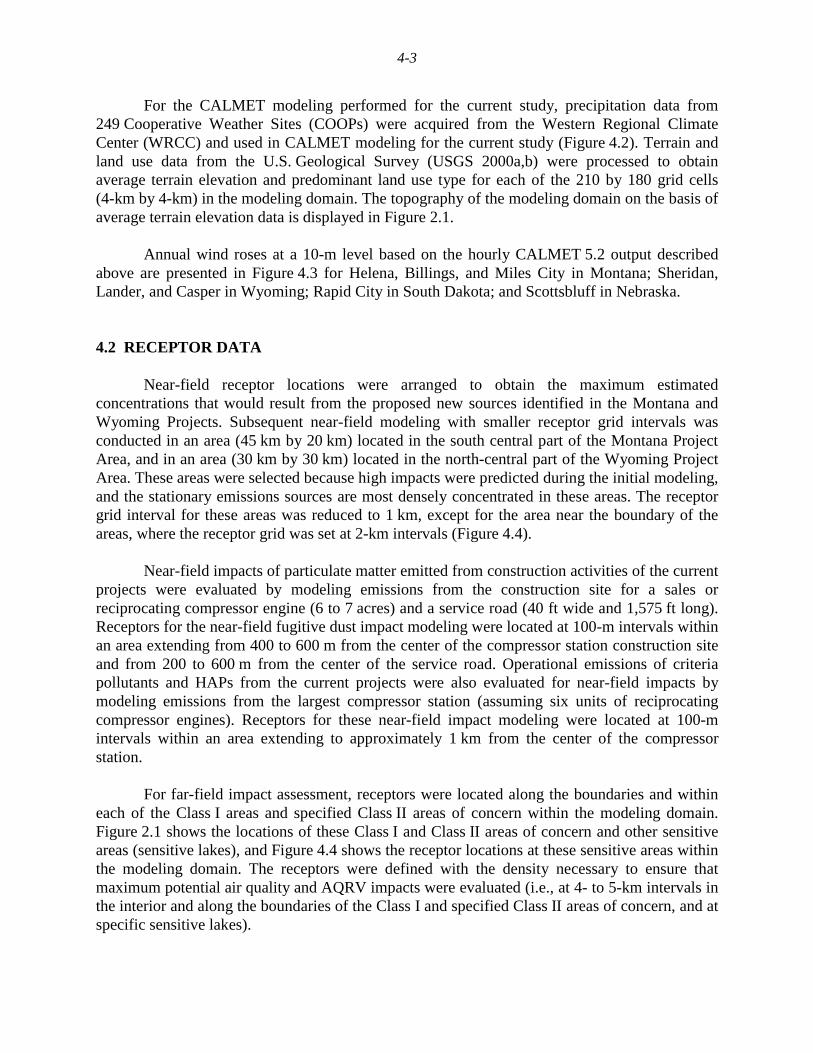
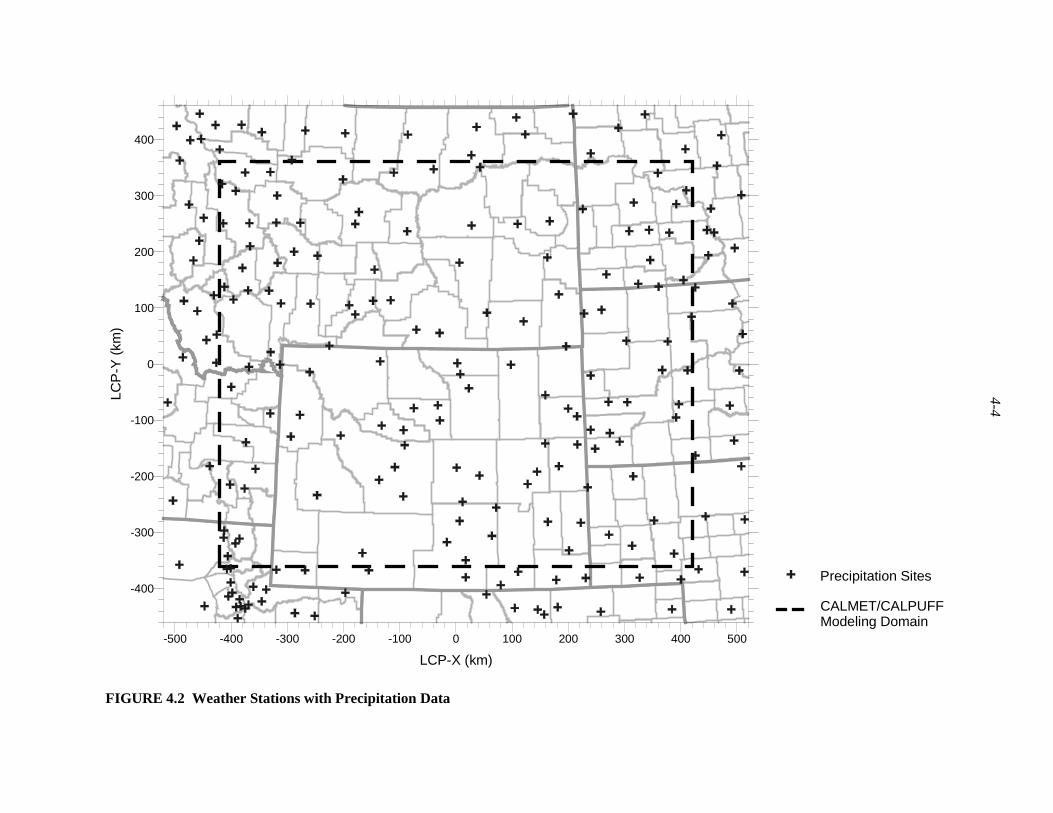
For the CALMET modeling performed for the current study, precipitation data from249 Cooperative Weather Sites (COOPs) were acquired from the Western Regional ClimateCenter (WRCC) and used in CALMET modeling for the current study (Figure 4.2). Terrain andland use data from the U.S. Geological Survey (USGS 2000a,b) were processed to obtainaverage terrain elevation and predominant land use type for each of the 210 by 180 grid cells(4-km by 4-km) in the modeling domain. The topography of the modeling domain on the basis ofaverage terrain elevation data is displayed in Figure 2.1.
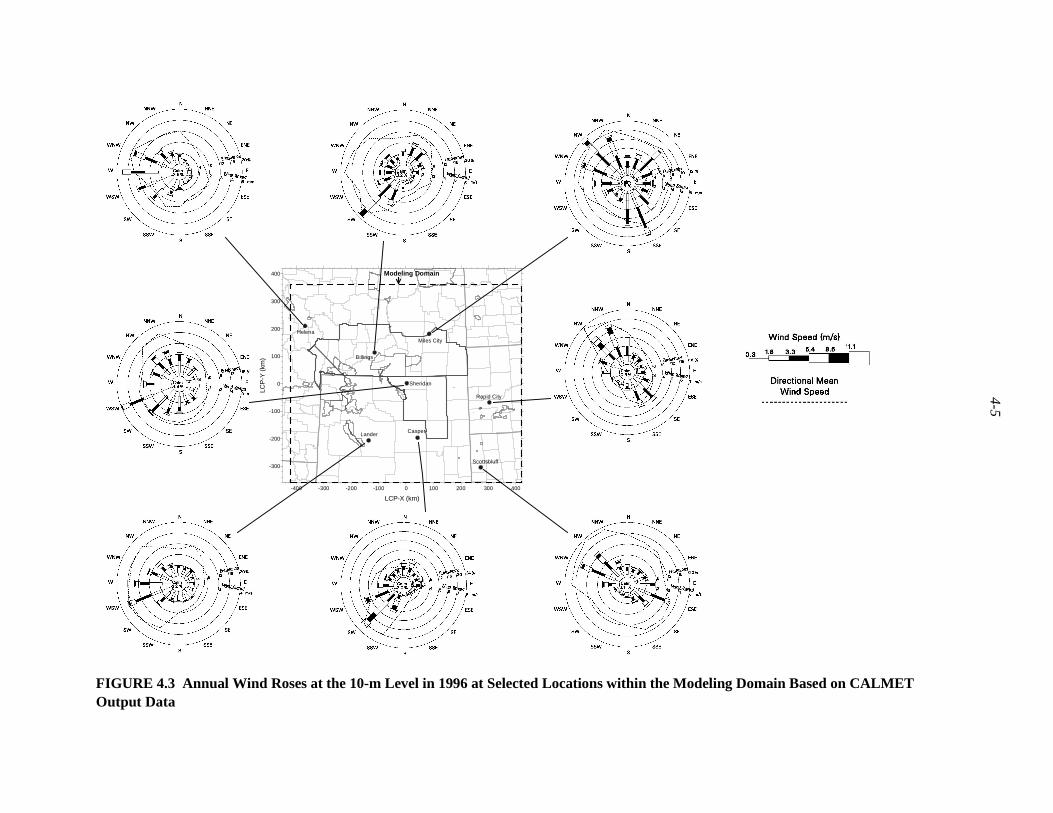
Annual wind roses at a 10-m level based on the hourly CALMET 5.2 output describedabove are presented in Figure 4.3 for Helena, Billings, and Miles City in Montana; Sheridan,Lander, and Casper in Wyoming; Rapid City in South Dakota; and Scottsbluff in Nebraska.
4.2 RECEPTOR DATA
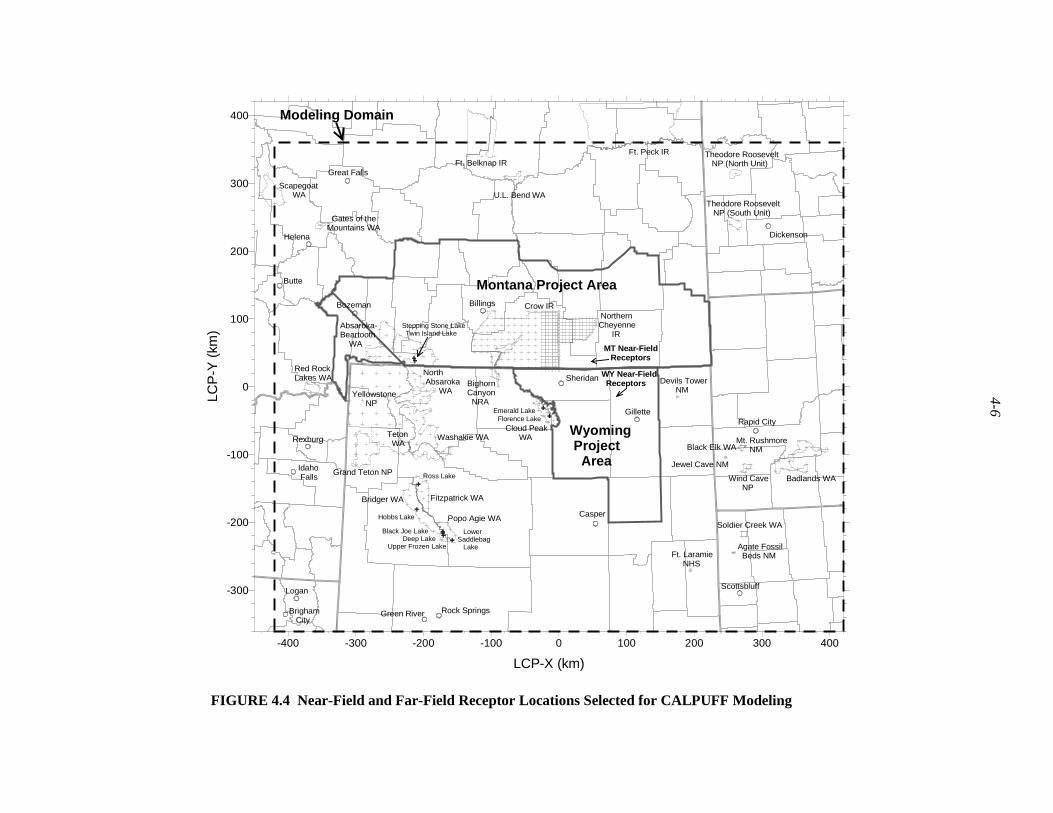
Near-field receptor locations were arranged to obtain the maximum estimatedconcentrations that would result from the proposed new sources identified in the Montana andWyoming Projects. Subsequent near-field modeling with smaller receptor grid intervals wasconducted in an area (45 km by 20 km) located in the south central part of the Montana ProjectArea, and in an area (30 km by 30 km) located in the north-central part of the Wyoming ProjectArea. These areas were selected because high impacts were predicted during the initial modeling,and the stationary emissions sources are most densely concentrated in these areas. The receptorgrid interval for these areas was reduced to 1 km, except for the area near the boundary of theareas, where the receptor grid was set at 2-km intervals (Figure 4.4).
Near-field impacts of particulate matter emitted from construction activities of the currentprojects were evaluated by modeling emissions from the construction site for a sales orreciprocating compressor engine (6 to 7 acres) and a service road (40 ft wide and 1,575 ft long).Receptors for the near-field fugitive dust impact modeling were located at 100-m intervals withinan area extending from 400 to 600 m from the center of the compressor station construction siteand from 200 to 600 m from the center of the service road. Operational emissions of criteriapollutants and HAPs from the current projects were also evaluated for near-field impacts bymodeling emissions from the largest compressor station (assuming six units of reciprocatingcompressor engines). Receptors for these near-field impact modeling were located at 100-mintervals within an area extending to approximately 1 km from the center of the compressorstation.
For far-field impact assessment, receptors were located along the boundaries and withineach of the Class I areas and specified Class II areas of concern within the modeling domain.Figure 2.1 shows the locations of these Class I and Class II areas of concern and other sensitiveareas (sensitive lakes), and Figure 4.4 shows the receptor locations at these sensitive areas withinthe modeling domain. The receptors were defined with the density necessary to ensure thatmaximum potential air quality and AQRV impacts were evaluated (i.e., at 4- to 5-km intervals inthe interior and along the boundaries of the Class I and specified Class II areas of concern, and atspecific sensitive lakes).
4-4
-500 -400 -300 -200 -100 0 100 200 300 400 500
LCP-X (km)
-400
-300
-200
-100
0
100
200
300
400
LCP
-Y (
km)
Precipitation Sites
CALMET/CALPUFFModeling Domain
FIGURE 4.2 Weather Stations with Precipitation Data
4-5
FIGURE 4.3 Annual Wind Roses at the 10-m Level in 1996 at Selected Locations within the Modeling Domain Based on CALMETOutput Data
-400 -300 -200 -100 0 100 200 300 400
LCP-X (km)
-300
-200
-100
0
100
200
300
400
LCP
-Y (
km)
Modeling Domain
Helena
Billings
Miles City
Sheridan
LanderCasper
Scottsbluff
Rapid City
4-6
-400 -300 -200 -100 0 100 200 300 400
LCP-X (km)
-300
-200
-100
0
100
200
300
400
LCP
-Y (
km)
Badlands WA
Rapid City
Wind Cave NP
Jewel Cave NM
Black Elk WAMt. Rushmore NM
Scottsbluff
Soldier Creek WA
Agate Fossil Beds NMFt. Laramie
NHS
Devils Tower NM
Sheridan
Gillette
Casper
Rock SpringsGreen RiverBrigham City
Logan
Idaho Falls
Rexburg
Bozeman
Butte
Helena
Great Falls
Billings
Dickenson
Cloud Peak WA
Crow IR NorthernCheyenne IR
Yellowstone NP
Teton WA
Grand Teton NP
North Absaroka WA
Washakie WA
Bridger WA Fitzpatrick WA
Popo Agie WA
BighornCanyon NRA
Red RockLakes WA
Gates of theMountains WA
Scapegoat WA
Ft. Peck IRFt. Belknap IR
U.L. Bend WA
Theodore Roosevelt NP (North Unit)
Theodore Roosevelt NP (South Unit)
Absaroka-Beartooth WA
Emerald LakeFlorence Lake
Ross Lake
Hobbs Lake
LowerSaddlebag Lake
Black Joe Lake Deep Lake Upper Frozen Lake
Stepping Stone Lake Twin Island Lake
Modeling Domain
Montana Project Area
Wyoming Project Area
MT Near-Field Receptors
WY Near-Field Receptors
FIGURE 4.4 Near-Field and Far-Field Receptor Locations Selected for CALPUFF Modeling
4-7
The elevation of each receptor was obtained by using Digital Elevation Model data forthe 1:250,000 quads with 30-m horizontal resolution (USGS 2000a).
4.3 AMBIENT AIR QUALITY AND AQRV DATA
The existing ambient air quality levels, visibility, and lake chemistry parameters in andaround the project areas are described in several recently published EISs for proposed activitiesin the modeling domain (e.g., BLM 1999a; EIC 2000). These background data were used in thecurrent study as follows:
• Data on background concentrations for criteria pollutants based on the mostrecent representative maximum concentrations measured in the region werecombined with the data on predicted maximum cumulative impacts forcomparison with ambient standards,
• Data on background ozone (O3) concentrations were used as input to theCALPUFF model,
• Data on background concentrations of particulate chemical species werecombined with data on ambient and CALPUFF-predicted chemical speciesconcentrations for performing the sulfate/nitrate/ammonia equilibriumcalculation needed to predict the secondary particulate concentration, and
• Data on background levels of visibility and acid deposition were used toassess the significance of predicted changes in visibility and acid deposition.
The background data selected for use in the impact assessment of the Montana andWyoming Projects are described in the following sections. Additional data on ambient airquality, visibility, acid deposition, and ANC that have become available since the preparation ofthe recently published EISs were obtained and evaluated. Valid new data were included indefining the background ambient air quality and AQRV levels for this analysis.
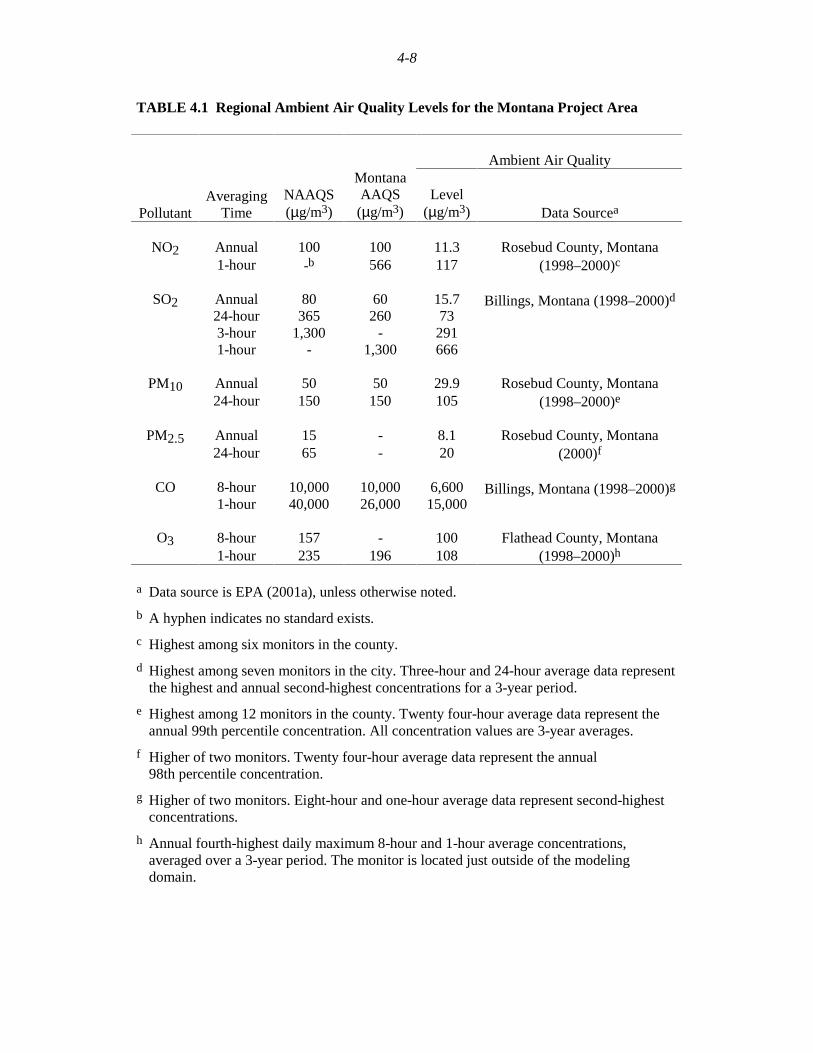
4.3.1 Criteria Pollutants
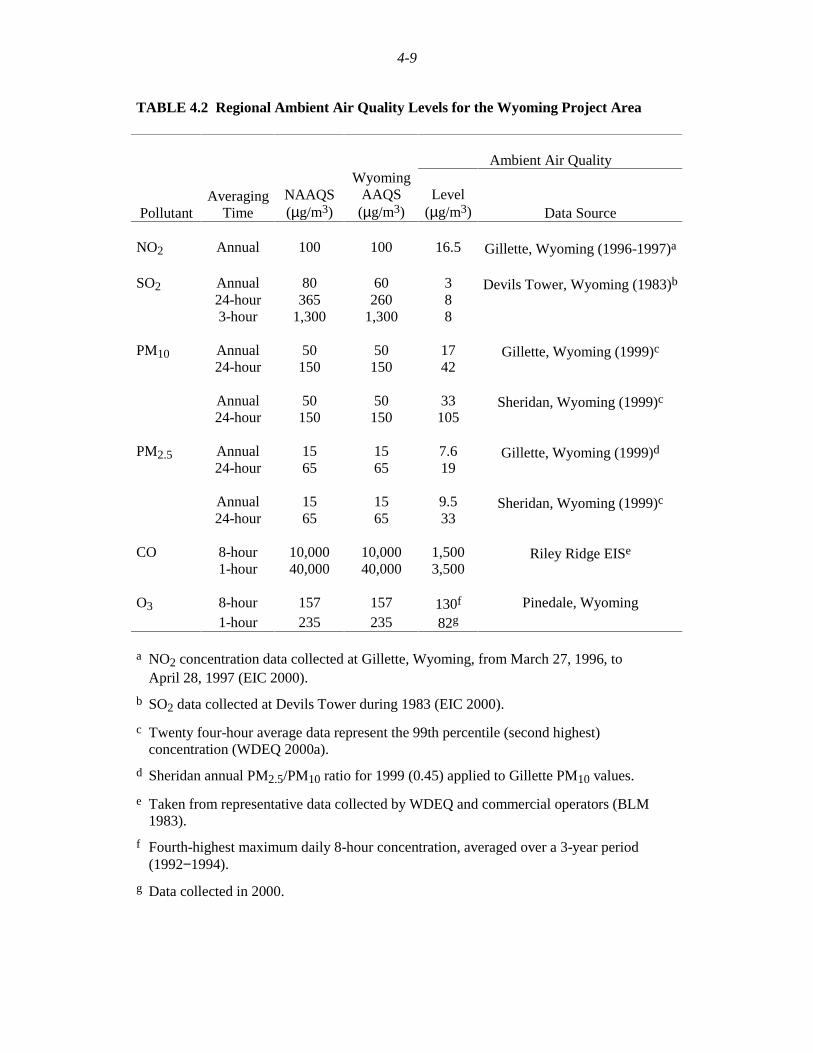
Ambient concentrations of criteria pollutants monitored within the modeling domain thatwere used to define regional background air quality levels for the Montana and Wyoming ProjectAreas are listed in Tables 4.1 and 4.2, respectively. The ranges of values recorded during thethree-year period (1998–2000) are presented for all monitoring stations located within theMontana Project Area (Table 4.1). Particulate matter (PM) data (PM10 and PM2.5) for theWyoming Project Area are presented for two locations: Sheridan and Gillette, Wyoming.Sheridan data were used to represent the background concentrations for the population centerreceptors in the community of Sheridan. Gillette data were used to represent the backgroundconcentrations for the rest of the Wyoming Project Area. Because of Gillette’s environmental
4-8
TABLE 4.1 Regional Ambient Air Quality Levels for the Montana Project Area
Ambient Air Quality
PollutantAveraging
TimeNAAQS(µg/m3)
MontanaAAQS
(µg/m3)Level
(µg/m3) Data Sourcea
Annual 100 100 11.3NO21-hour -b 566 117
Rosebud County, Montana(1998–2000)c
Annual 80 60 15.724-hour 365 260 733-hour 1,300 - 291
SO2
1-hour - 1,300 666
Billings, Montana (1998–2000)d
Annual 50 50 29.9PM1024-hour 150 150 105
Rosebud County, Montana(1998–2000)e
Annual 15 - 8.1PM2.524-hour 65 - 20
Rosebud County, Montana(2000)f
8-hour 10,000 10,000 6,600CO1-hour 40,000 26,000 15,000
Billings, Montana (1998–2000)g
8-hour 157 - 100O31-hour 235 196 108
Flathead County, Montana(1998–2000)h
a Data source is EPA (2001a), unless otherwise noted.
b A hyphen indicates no standard exists.
c Highest among six monitors in the county.
d Highest among seven monitors in the city. Three-hour and 24-hour average data representthe highest and annual second-highest concentrations for a 3-year period.
e Highest among 12 monitors in the county. Twenty four-hour average data represent theannual 99th percentile concentration. All concentration values are 3-year averages.
f Higher of two monitors. Twenty four-hour average data represent the annual98th percentile concentration.
g Higher of two monitors. Eight-hour and one-hour average data represent second-highestconcentrations.
h Annual fourth-highest daily maximum 8-hour and 1-hour average concentrations,averaged over a 3-year period. The monitor is located just outside of the modelingdomain.
4-9
TABLE 4.2 Regional Ambient Air Quality Levels for the Wyoming Project Area
Ambient Air Quality
PollutantAveraging
TimeNAAQS(µg/m3)
WyomingAAQS
(µg/m3)Level
(µg/m3) Data Source
NO2 Annual 100 100 16.5 Gillette, Wyoming (1996-1997)a
Annual 80 60 324-hour 365 260 8
SO2
3-hour 1,300 1,300 8
Devils Tower, Wyoming (1983)b
Annual 50 50 17PM1024-hour 150 150 42
Gillette, Wyoming (1999)c
Annual 50 50 3324-hour 150 150 105
Sheridan, Wyoming (1999)c
Annual 15 15 7.6PM2.524-hour 65 65 19
Gillette, Wyoming (1999)d
Annual 15 15 9.524-hour 65 65 33
Sheridan, Wyoming (1999)c
8-hour 10,000 10,000 1,500CO1-hour 40,000 40,000 3,500
Riley Ridge EISe
8-hour 157 157 130fO3
1-hour 235 235 82gPinedale, Wyoming
a NO2 concentration data collected at Gillette, Wyoming, from March 27, 1996, toApril 28, 1997 (EIC 2000).
b SO2 data collected at Devils Tower during 1983 (EIC 2000).
c Twenty four-hour average data represent the 99th percentile (second highest)concentration (WDEQ 2000a).
d Sheridan annual PM2.5/PM10 ratio for 1999 (0.45) applied to Gillette PM10 values.
e Taken from representative data collected by WDEQ and commercial operators (BLM1983).
f Fourth-highest maximum daily 8-hour concentration, averaged over a 3-year period(1992−1994).
g Data collected in 2000.
4-10
setting and its smaller population, Gillette data are considered more representative of the rest ofthe Wyoming Project Area than the data collected in Sheridan. As shown in these tables, allregional background air quality levels are in compliance with the NAAQS and SAAQS.
4.3.2 Chemical Species
The regional background ozone concentration value is needed as input to the CALPUFFmodel for use in its empirical chemical transformation algorithm. Because of the lack ofavailable data, this study used the same constant values as those used in modeling for otherrecent EIS projects: the values are in the region of 40 ppb (e.g., EIC 2000).
Chemical species data for ambient aerosols were determined by analyzing PM samplescollected twice a week at two Interagency Monitoring of Protected Visual Environments(IMPROVE) monitoring sites located near the Badlands and Bridger WAs. PM massconcentration data reconstructed from the speciated PM data at the two monitoring sites wereprocessed to generate monthly average PM speciation profiles (EIC 2000). The Badlands andBridger IMPROVE data were used to define the background concentrations of particulatesulfate, nitrate, and ammonium for those sensitive receptor areas located, respectively, east andwest of the eastern boundary of the project areas (Figure 4.4).
In addition to the chemical species data for airborne PM, background concentration datafor gaseous free ammonia and nitric acid (HNO3) are also required. Because there are nomeasurements of gaseous ammonia or HNO3 in the region, values of 5 and 0.5 ppb, respectively,were used in the current analysis, since they were used in the previous CALPUFF modelinganalyses (EIC 2000), to provide conservatively high estimates.
4.3.3 Visibility
FLAG has established a recommended screening procedure for identifying and evaluatingpotential visibility impairment primarily in mandatory federal PSD Class I areas (FLAG 2000).(See Appendix A for details.) According to the FLAG procedure, predicted changes in visibilityin terms of percent change in extinction (or change in deciview [dv]; a 10% change in extinctioncorresponds to 1.0 dv change) because of emissions from proposed sources would be computedand compared with estimated seasonal natural background reference visibility levels, and theresulting percent change in extinction (or change in dv) would be compared with FLAG-prescribed threshold levels for impact assessment. Table 4.3 lists the PSD Class I areas andspecified PSD Class II areas of concern within the modeling domain. Estimated seasonal naturalbackground visibility reference levels and associated parameter values, including site-specific,seasonal relative humidity adjustment factors as recommended by FLAG, are provided inTable 4.4 for the PSD Class I and PSD Class II areas of concern (FLAG 2000) located within themodeling domain. The analysis using the FLAG-prescribed threshold levels is called the FLAGscreening procedure in this study.
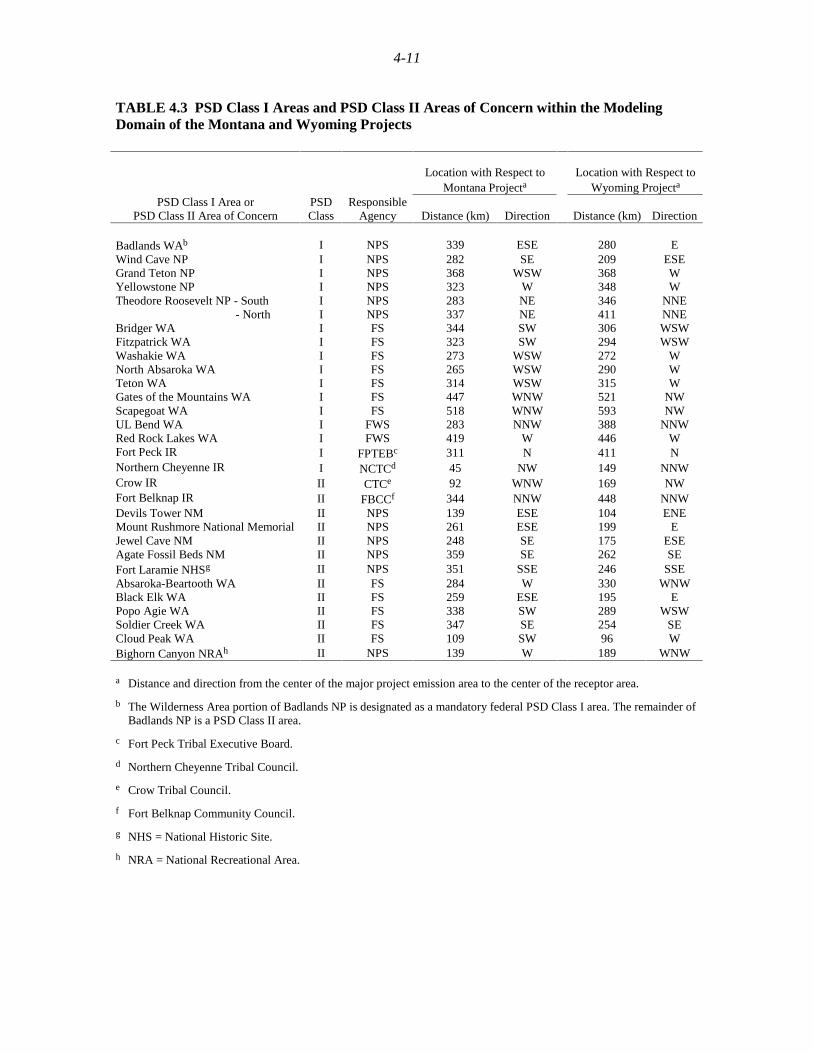
4-11
TABLE 4.3 PSD Class I Areas and PSD Class II Areas of Concern within the ModelingDomain of the Montana and Wyoming Projects
Location with Respect toMontana Projecta
Location with Respect toWyoming Projecta
PSD Class I Area orPSD Class II Area of Concern
PSDClass
ResponsibleAgency Distance (km) Direction Distance (km) Direction
Badlands WAb I NPS 339 ESE 280 EWind Cave NP I NPS 282 SE 209 ESEGrand Teton NP I NPS 368 WSW 368 WYellowstone NP I NPS 323 W 348 WTheodore Roosevelt NP - South I NPS 283 NE 346 NNE - North I NPS 337 NE 411 NNEBridger WA I FS 344 SW 306 WSWFitzpatrick WA I FS 323 SW 294 WSWWashakie WA I FS 273 WSW 272 WNorth Absaroka WA I FS 265 WSW 290 WTeton WA I FS 314 WSW 315 WGates of the Mountains WA I FS 447 WNW 521 NWScapegoat WA I FS 518 WNW 593 NWUL Bend WA I FWS 283 NNW 388 NNWRed Rock Lakes WA I FWS 419 W 446 WFort Peck IR I FPTEBc 311 N 411 NNorthern Cheyenne IR I NCTCd 45 NW 149 NNWCrow IR II CTCe 92 WNW 169 NWFort Belknap IR II FBCCf 344 NNW 448 NNWDevils Tower NM II NPS 139 ESE 104 ENEMount Rushmore National Memorial II NPS 261 ESE 199 EJewel Cave NM II NPS 248 SE 175 ESEAgate Fossil Beds NM II NPS 359 SE 262 SEFort Laramie NHSg II NPS 351 SSE 246 SSEAbsaroka-Beartooth WA II FS 284 W 330 WNWBlack Elk WA II FS 259 ESE 195 EPopo Agie WA II FS 338 SW 289 WSWSoldier Creek WA II FS 347 SE 254 SECloud Peak WA II FS 109 SW 96 WBighorn Canyon NRAh II NPS 139 W 189 WNW
a Distance and direction from the center of the major project emission area to the center of the receptor area.
b The Wilderness Area portion of Badlands NP is designated as a mandatory federal PSD Class I area. The remainder ofBadlands NP is a PSD Class II area.
c Fort Peck Tribal Executive Board.
d Northern Cheyenne Tribal Council.
e Crow Tribal Council.
f Fort Belknap Community Council.
g NHS = National Historic Site.
h NRA = National Recreational Area.

4-12
TABLE 4.4 Estimated Seasonal Natural Background Visibility Reference Levels
Mandatory FederalClass I Area Seasona
Hygroscopic(Mm-1)
Non-hygroscopic
(Mm-1)Rayleigh(Mm-1) f(RH)b
Particle bextwith f(RH)
(Mm-1)
ReferenceLevel
(Mm-1)c
Winter 0.6 4.5 10.0 3.1 6.4 16.4Spring 0.6 4.5 10.0 2.6 6.1 16.1Summer 0.6 4.5 10.0 2.2 5.8 15.8
Badlands WA
Fall 0.6 4.5 10.0 2.8 6.2 16.2
Winter 0.6 4.5 10.0 2.9 6.2 16.2Spring 0.6 4.5 10.0 1.9 5.6 15.6Summer 0.6 4.5 10.0 1.5 5.4 15.4
Bridger WAd
Fall 0.6 4.5 10.0 2.4 5.9 15.9
Winter 0.6 4.5 10.0 2.9 6.2 16.2Spring 0.6 4.5 10.0 1.9 5.7 15.7Summer 0.6 4.5 10.0 1.5 5.4 15.4
Fitzpatrick WA
Fall 0.6 4.5 10.0 2.4 6.0 16.0
Winter 0.6 4.5 10.0 3.2 6.4 16.4Spring 0.6 4.5 10.0 2.4 5.9 15.9Summer 0.6 4.5 10.0 2.2 5.8 15.8
Fort Peck IRe
Fall 0.6 4.5 10.0 3.5 6.6 16.6
Winter 0.6 4.5 10.0 3.1 6.4 16.4Spring 0.6 4.5 10.0 2.3 5.9 15.9Summer 0.6 4.5 10.0 1.8 5.6 15.6
Gates of theMountains WA
Fall 0.6 4.5 10.0 2.8 6.2 16.2
Winter 0.6 4.5 10.0 3.0 6.3 16.3Spring 0.6 4.5 10.0 2.0 5.7 15.7Summer 0.6 4.5 10.0 1.6 5.5 15.5
Grand Teton NP
Fall 0.6 4.5 10.0 2.5 6.0 16.0
Winter 0.6 4.5 10.0 2.9 6.2 16.2Spring 0.6 4.5 10.0 2.1 5.8 15.8Summer 0.6 4.5 10.0 1.7 5.5 15.5
North AbsarokaWAf
Fall 0.6 4.5 10.0 2.5 6.0 16.0
Winter 0.6 4.5 10.0 3.2 6.4 16.4Spring 0.6 4.5 10.0 2.1 5.8 15.8Summer 0.6 4.5 10.0 1.7 5.5 15.5
Red Rock LakesWA
Fall 0.6 4.5 10.0 2.7 6.1 16.1
Winter 0.6 4.5 10.0 3.5 6.6 16.6Spring 0.6 4.5 10.0 2.4 5.9 15.9Summer 0.6 4.5 10.0 1.9 5.6 15.6
Scapegoat WA
Fall 0.6 4.5 10.0 3.1 6.3 16.3
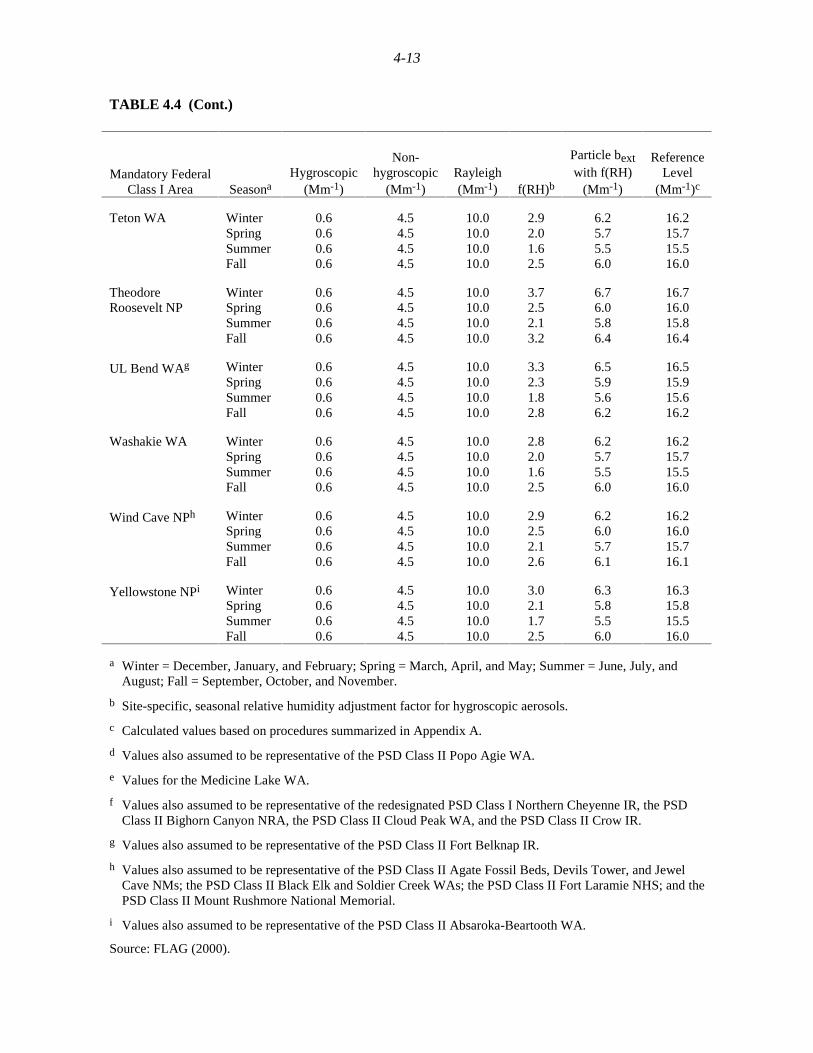
4-13
TABLE 4.4 (Cont.)
Mandatory FederalClass I Area Seasona
Hygroscopic(Mm-1)
Non-hygroscopic
(Mm-1)Rayleigh(Mm-1) f(RH)b
Particle bextwith f(RH)
(Mm-1)
ReferenceLevel
(Mm-1)c
Winter 0.6 4.5 10.0 2.9 6.2 16.2Spring 0.6 4.5 10.0 2.0 5.7 15.7Summer 0.6 4.5 10.0 1.6 5.5 15.5
Teton WA
Fall 0.6 4.5 10.0 2.5 6.0 16.0
Winter 0.6 4.5 10.0 3.7 6.7 16.7Spring 0.6 4.5 10.0 2.5 6.0 16.0Summer 0.6 4.5 10.0 2.1 5.8 15.8
TheodoreRoosevelt NP
Fall 0.6 4.5 10.0 3.2 6.4 16.4
Winter 0.6 4.5 10.0 3.3 6.5 16.5Spring 0.6 4.5 10.0 2.3 5.9 15.9Summer 0.6 4.5 10.0 1.8 5.6 15.6
UL Bend WAg
Fall 0.6 4.5 10.0 2.8 6.2 16.2
Winter 0.6 4.5 10.0 2.8 6.2 16.2Spring 0.6 4.5 10.0 2.0 5.7 15.7Summer 0.6 4.5 10.0 1.6 5.5 15.5
Washakie WA
Fall 0.6 4.5 10.0 2.5 6.0 16.0
Winter 0.6 4.5 10.0 2.9 6.2 16.2Spring 0.6 4.5 10.0 2.5 6.0 16.0Summer 0.6 4.5 10.0 2.1 5.7 15.7
Wind Cave NPh
Fall 0.6 4.5 10.0 2.6 6.1 16.1
Winter 0.6 4.5 10.0 3.0 6.3 16.3Spring 0.6 4.5 10.0 2.1 5.8 15.8Summer 0.6 4.5 10.0 1.7 5.5 15.5
Yellowstone NPi
Fall 0.6 4.5 10.0 2.5 6.0 16.0
a Winter = December, January, and February; Spring = March, April, and May; Summer = June, July, andAugust; Fall = September, October, and November.
b Site-specific, seasonal relative humidity adjustment factor for hygroscopic aerosols.
c Calculated values based on procedures summarized in Appendix A.
d Values also assumed to be representative of the PSD Class II Popo Agie WA.
e Values for the Medicine Lake WA.
f Values also assumed to be representative of the redesignated PSD Class I Northern Cheyenne IR, the PSDClass II Bighorn Canyon NRA, the PSD Class II Cloud Peak WA, and the PSD Class II Crow IR.
g Values also assumed to be representative of the PSD Class II Fort Belknap IR.
h Values also assumed to be representative of the PSD Class II Agate Fossil Beds, Devils Tower, and JewelCave NMs; the PSD Class II Black Elk and Soldier Creek WAs; the PSD Class II Fort Laramie NHS; and thePSD Class II Mount Rushmore National Memorial.
i Values also assumed to be representative of the PSD Class II Absaroka-Beartooth WA.
Source: FLAG (2000).
4-14
In addition, the State of Wyoming DEQ has provided a set of reference levels (visibilityconditions) for mandatory federal PSD Class I areas within the original Wyoming Project Studymodeling domain, on the basis of the mean of the cleanest 20% from the period winter 1987 tosummer 1997. A separate visibility analysis was performed; it used the same procedures as thosedescribed in Appendix A but was based on the following reference levels (in Mm-1) provided bythe State of Wyoming: (1) for Badlands WA and Wind Cave NP (winter 23.04, spring 26.13,summer 27.35, and fall 23.13); and (2) for Bridger, Fitzpatrick, North Absaroka, and WashakieWA (winter 14.41, spring 17.56, summer 19.05, and fall 16.37). Except for the winter season atthe Bridger, Fitzpatrick, North Absaroka, and Washakie WAs, all the reference levels providedby the WDEQ are higher than the FLAG-estimated seasonal natural background reference levelslisted in Table 4.4. The analysis using the WDEQ-provided reference levels is called the WDEQscreening procedure in this study.
In the refined visibility impact assessment conducted in this study (refined procedure),potential daily visibility degradation was calculated on the basis of direct total optical monitoring(transmissometer) data collected at the Badland WA (BL) during a 12-year period (1988−1999)and at Bridger WA (BG) during an 11-year period (1989−1999). The BL data were also used forAgate Fossil Beds NM (AF), Black Elk WA (BE), Devils Tower NM (DT), Fort LaramieNational Historic Site (NHS) (FL), Jewel Cave NM (JC), Mount Rushmore National Memorial(MR), Soldier Creek WA (SC), Theodore Roosevelt NP-North (TN), Theodore Roosevelt NP-South (TS), and Wind Cave NP (WC). The BG data also were used for Absaroka-Beartooth WA(AB), Bighorn Canyon NRA (BC), Cloud Peak WA (CP), Crow IR (CI), Fitzpatrick WA (FZ),Fort Belknap IR (FB), Fort Peck IR (FP), Gates of the Mountains WA (GM), Grand Teton NP(GT), North Absaroka WA (NA), Northern Cheyenne IR (NC), Popo Agie WA (PA), Red RockLakes WA (RR), Scapegoat WA (SG), Teton WA (TT), UL Bend WA (UB), Washakie WA(WK), and Yellowstone NP (YS). The potential number of days with visibility degradation equalto or greater than 1.0 dv was calculated for each year, and an annual average number of dayswith such visibility degradation was reported.
4.3.4 Acid Deposition
Acid deposition impacts were assessed by comparing (1) predicted annual total aciddeposition fluxes (wet and dry) with existing deposition LACs for terrestrial ecosystems insensitive receptors within the modeling domain (Fox et al. 1989), and (2) predicted changes inANC of sensitive lakes based on FS-recommended prediction methods (FS Rocky MountainRegion 2000) with the LAC thresholds for ANC changes. The sensitive lakes located in themodeling domain include Black Joe, Deep, Hobbs, and Upper Frozen Lakes in the Class IBridger WA, Ross Lake in the Class I Fitzpatrick WA, Stepping Stone and Twin Island Lakes inthe Class II Absaroka-Beartooth WA, Emerald Lake and Florence Lake in the Class II CloudPeak WA, and Lower Saddlebag Lake in the Class II Popo Agie WA. Information on location,size of watershed area, and monitored ANC for these sensitive lakes is presented in Table 4.5.
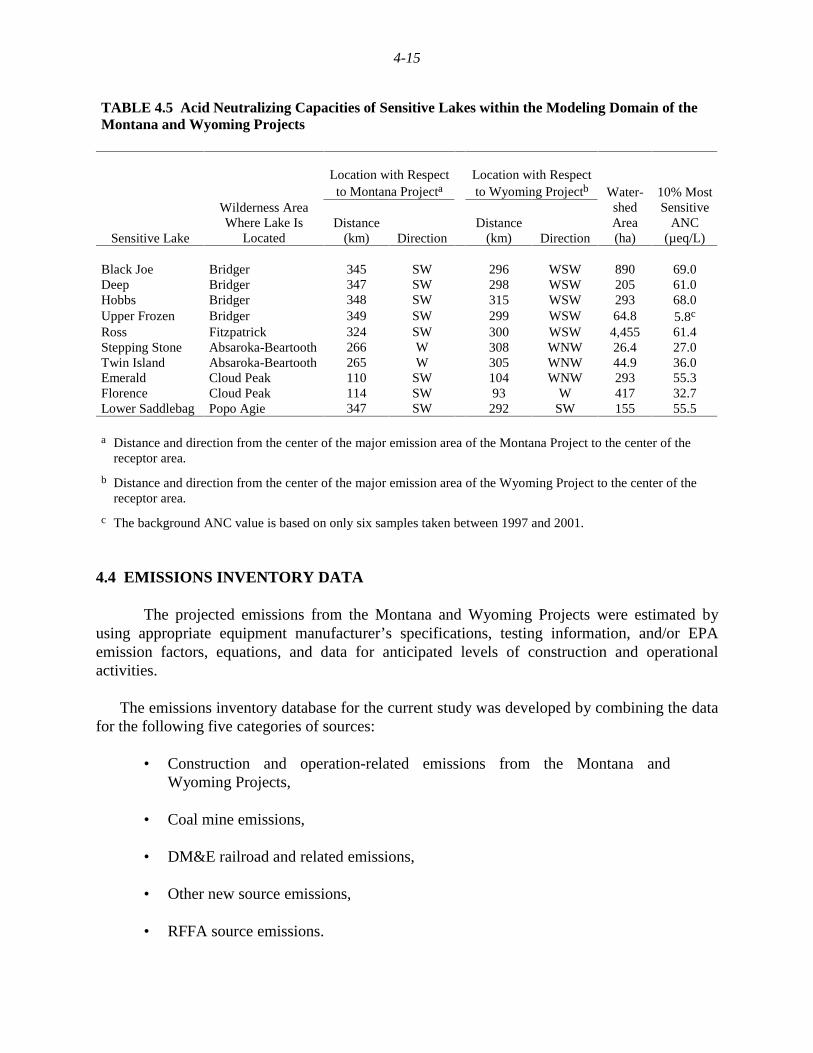
4-15
TABLE 4.5 Acid Neutralizing Capacities of Sensitive Lakes within the Modeling Domain of theMontana and Wyoming Projects
Location with Respectto Montana Projecta
Location with Respectto Wyoming Projectb
Sensitive Lake
Wilderness AreaWhere Lake Is
LocatedDistance
(km) DirectionDistance
(km) Direction
Water-shedArea(ha)
10% MostSensitive
ANC(µeq/L)
Black Joe Bridger 345 SW 296 WSW 890 69.0Deep Bridger 347 SW 298 WSW 205 61.0Hobbs Bridger 348 SW 315 WSW 293 68.0Upper Frozen Bridger 349 SW 299 WSW 64.8 5.8c
Ross Fitzpatrick 324 SW 300 WSW 4,455 61.4Stepping Stone Absaroka-Beartooth 266 W 308 WNW 26.4 27.0Twin Island Absaroka-Beartooth 265 W 305 WNW 44.9 36.0Emerald Cloud Peak 110 SW 104 WNW 293 55.3Florence Cloud Peak 114 SW 93 W 417 32.7Lower Saddlebag Popo Agie 347 SW 292 SW 155 55.5
a Distance and direction from the center of the major emission area of the Montana Project to the center of thereceptor area.
b Distance and direction from the center of the major emission area of the Wyoming Project to the center of thereceptor area.
c The background ANC value is based on only six samples taken between 1997 and 2001.
4.4 EMISSIONS INVENTORY DATA
The projected emissions from the Montana and Wyoming Projects were estimated byusing appropriate equipment manufacturer’s specifications, testing information, and/or EPAemission factors, equations, and data for anticipated levels of construction and operationalactivities.
The emissions inventory database for the current study was developed by combining the datafor the following five categories of sources:
• Construction and operation-related emissions from the Montana andWyoming Projects,
• Coal mine emissions,
• DM&E railroad and related emissions,
• Other new source emissions,
• RFFA source emissions.
4-16
The emission inventory data developed for the Wyoming Project Study were submitted tointerested stakeholders, including state DEQs, for their review. Stakeholders’ comments werereflected as appropriate in the final emissions inventory database, including the data onemissions associated with the Wyoming Project and other new and RFFA sources within themodeling domain.
A map depicting the distribution of the Montana and Wyoming Project-related emissionssources is provided in Figure 4.5. Figure 4.6 shows the locations of other emission sources notrelated directly to the Montana and Wyoming Projects.
4.4.1 Non-Project Emission Sources
This section describes the emissions from the sources that would not directly occur underthe Montana and Wyoming Projects, including coal mine sources, DM&E railroad and relatedsources, and other new and RFFA sources. (RFFA sources include several coal-burning powerplants forecast within the modeling domain and potential CBM and conventional O&G wells onthe IR and FS lands.) Emissions from these sources are common to all alternatives considered forthe Montana and Wyoming Project impact assessments, except potential indirect sources on IRand FS lands, which would not occur under Montana Alternative A (No Action). (See Figure 4.6for the locations of non-project emission sources.)
4.4.1.1 Coal Mine Sources
Currently, approximately 20 coal mines (14 in Wyoming and 6 in Montana) are operatingwithin the modeling domain of the current study. At a given mine, the annual coal production,and, consequently, the activities associated with mining, vary from year to year depending ondemand. Coal mining locations change gradually as coal mining progresses. Therefore, potentialemissions from coal mining activities at each mine within the modeling domain were estimatedfor 2006, the projected peak emission year for the Montana and Wyoming Projects. Theestimates were derived on the basis of the projected 2006 annual coal production (Doelger 2001;Giovanini 2001) and the reported emission rates per unit coal production at each mine (WDEQ2000b; Montana Department of Environmental Quality [MDEQ] 2001). The projected locationsof the mines anticipated to operate in 2006 were also obtained from the BLM (Doelger 2001;Giovanini 2001). Estimated 2006 emissions of criteria pollutants and volatile organic compounds(VOCs) from coal mines in the modeling domain are provided in Table 4.6. Projected emissionsincreases of NOx, SO2, PM10, CO, and VOCs from coal mines within the modeling domain from2000 to 2006 are estimated to be 2,744; 301; 2,229; 4,772; and 252 tons per year, respectively.
4.4.1.2 Other New and RFFA Sources
Emissions from new and RFFA sources within the modeling domain are based on theemissions database used in the DM&E expansion project modeling analysis (EIC 2000), which
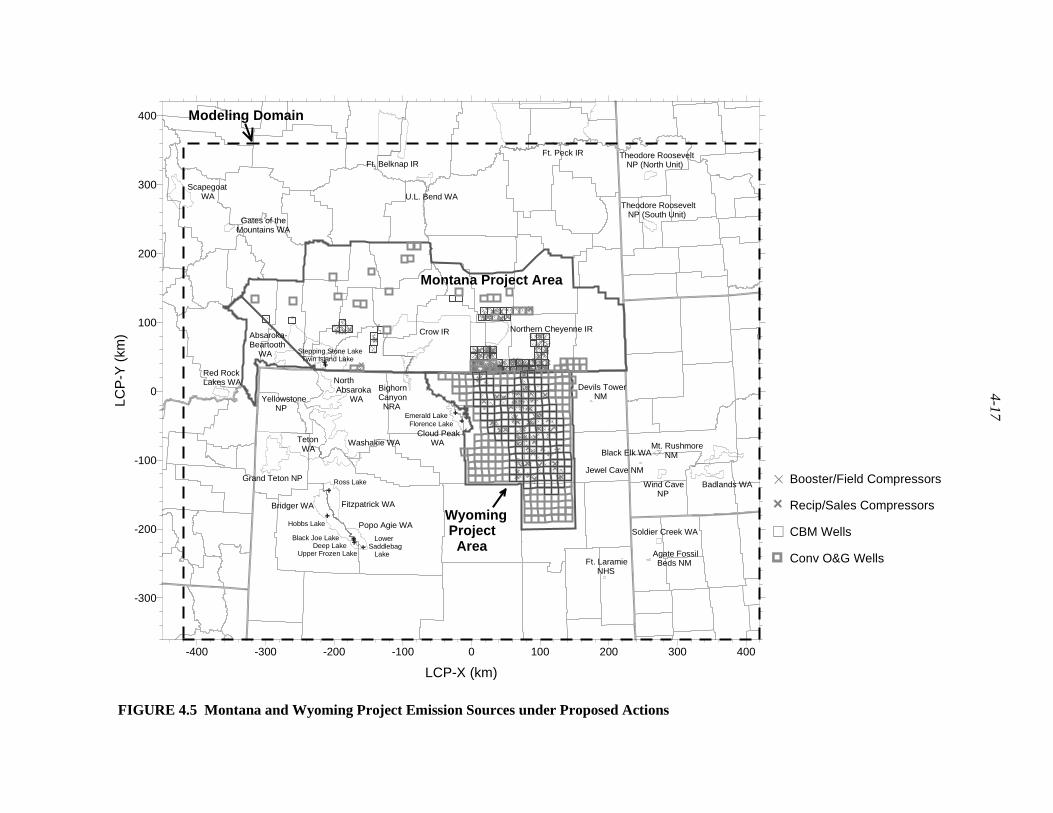
4-17
-400 -300 -200 -100 0 100 200 300 400
LCP-X (km)
-300
-200
-100
0
100
200
300
400LC
P-Y
(km
)
Badlands WAWind Cave NP
Jewel Cave NM
Black Elk WAMt. Rushmore NM
Soldier Creek WA
Agate Fossil Beds NMFt. Laramie
NHS
Devils Tower NM
Cloud Peak WA
Crow IR Northern Cheyenne IR
Yellowstone NP
Teton WA
Grand Teton NP
North Absaroka WA
Washakie WA
Bridger WA Fitzpatrick WA
Popo Agie WA
BighornCanyon NRA
Red RockLakes WA
Gates of theMountains WA
Scapegoat WA
Ft. Peck IRFt. Belknap IR
U.L. Bend WA
Theodore Roosevelt NP (North Unit)
Theodore Roosevelt NP (South Unit)
Absaroka-Beartooth WA
Emerald LakeFlorence Lake
Ross Lake
Hobbs Lake
LowerSaddlebag Lake
Black Joe Lake Deep Lake Upper Frozen Lake
Stepping Stone Lake Twin Island Lake
Modeling Domain
Montana Project Area
Wyoming Project Area
Booster/Field Compressors
Recip/Sales Compressors
CBM Wells
Conv O&G Wells
FIGURE 4.5 Montana and Wyoming Project Emission Sources under Proposed Actions
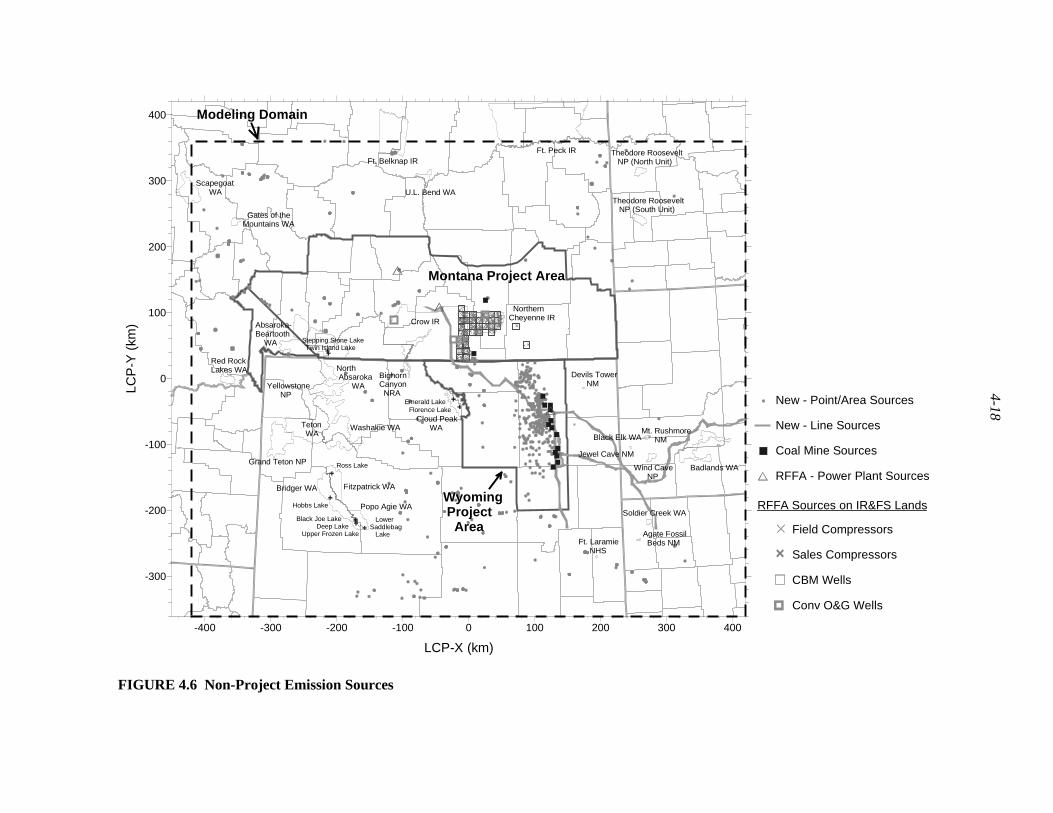
4-18
-400 -300 -200 -100 0 100 200 300 400
LCP-X (km)
-300
-200
-100
0
100
200
300
400
LCP
-Y (
km)
Badlands WAWind Cave NP
Jewel Cave NM
Black Elk WAMt. Rushmore NM
Soldier Creek WA
Agate Fossil Beds NMFt. Laramie
NHS
Devils Tower NM
Cloud Peak WA
Crow IR
NorthernCheyenne IR
Yellowstone NP
Teton WA
Grand Teton NP
North Absaroka WA
Washakie WA
Bridger WA Fitzpatrick WA
Popo Agie WA
BighornCanyon NRA
Red RockLakes WA
Gates of theMountains WA
Scapegoat WA
Ft. Peck IRFt. Belknap IR
U.L. Bend WA
Theodore Roosevelt NP (North Unit)
Theodore Roosevelt NP (South Unit)
Absaroka-Beartooth WA
Emerald LakeFlorence Lake
Ross Lake
Hobbs Lake
LowerSaddlebag Lake
Black Joe Lake Deep Lake Upper Frozen Lake
Stepping Stone Lake Twin Island Lake
Modeling Domain
Montana Project Area
Wyoming Project Area
New - Point/Area Sources
New - Line Sources
Coal Mine Sources
RFFA - Power Plant Sources
RFFA Sources on IR&FS Lands
Field Compressors
Sales Compressors
CBM Wells
Conv O&G Wells
FIGURE 4.6 Non-Project Emission Sources
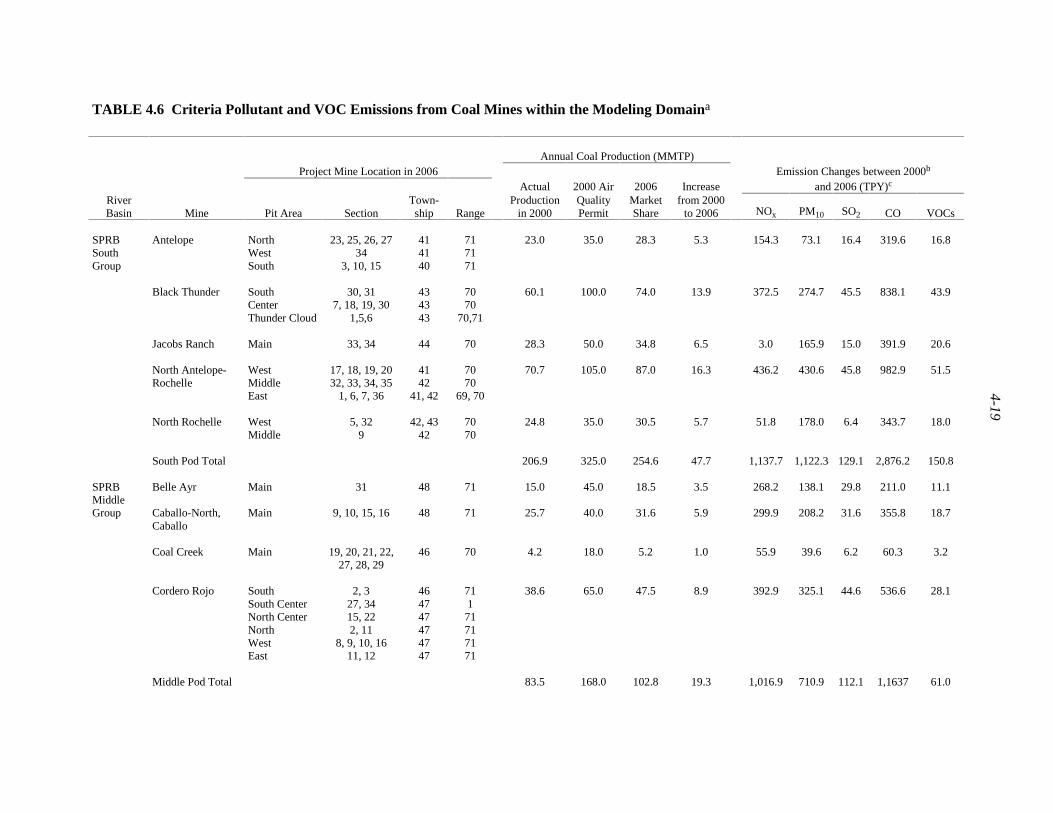
4-19
TABLE 4.6 Criteria Pollutant and VOC Emissions from Coal Mines within the Modeling Domaina
Annual Coal Production (MMTP)Project Mine Location in 2006 Emission Changes between 2000b
Actual 2000 Air 2006 Increase and 2006 (TPY)c
RiverBasin Mine Pit Area Section
Town-ship Range
Productionin 2000
QualityPermit
MarketShare
from 2000to 2006 NOx PM10 SO2 CO VOCs
North 23, 25, 26, 27 41 71West 34 41 71
SPRBSouthGroup
Antelope
South 3, 10, 15 40 71
23.0 35.0 28.3 5.3 154.3 73.1 16.4 319.6 16.8
South 30, 31 43 70Center 7, 18, 19, 30 43 70
Black Thunder
Thunder Cloud 1,5,6 43 70,71
60.1 100.0 74.0 13.9 372.5 274.7 45.5 838.1 43.9
Jacobs Ranch Main 33, 34 44 70 28.3 50.0 34.8 6.5 3.0 165.9 15.0 391.9 20.6
West 17, 18, 19, 20 41 70Middle 32, 33, 34, 35 42 70
North Antelope-Rochelle
East 1, 6, 7, 36 41, 42 69, 70
70.7 105.0 87.0 16.3 436.2 430.6 45.8 982.9 51.5
West 5, 32 42, 43 70North RochelleMiddle 9 42 70
24.8 35.0 30.5 5.7 51.8 178.0 6.4 343.7 18.0
South Pod Total 206.9 325.0 254.6 47.7 1,137.7 1,122.3 129.1 2,876.2 150.8
Belle Ayr Main 31 48 71 15.0 45.0 18.5 3.5 268.2 138.1 29.8 211.0 11.1SPRBMiddleGroup Caballo-North,
CaballoMain 9, 10, 15, 16 48 71 25.7 40.0 31.6 5.9 299.9 208.2 31.6 355.8 18.7
Coal Creek Main 19, 20, 21, 22,27, 28, 29
46 70 4.2 18.0 5.2 1.0 55.9 39.6 6.2 60.3 3.2
South 2, 3 46 71South Center 27, 34 47 1North Center 15, 22 47 71North 2, 11 47 71West 8, 9, 10, 16 47 71
Cordero Rojo
East 11, 12 47 71
38.6 65.0 47.5 8.9 392.9 325.1 44.6 536.6 28.1
Middle Pod Total 83.5 168.0 102.8 19.3 1,016.9 710.9 112.1 1,1637 61.0
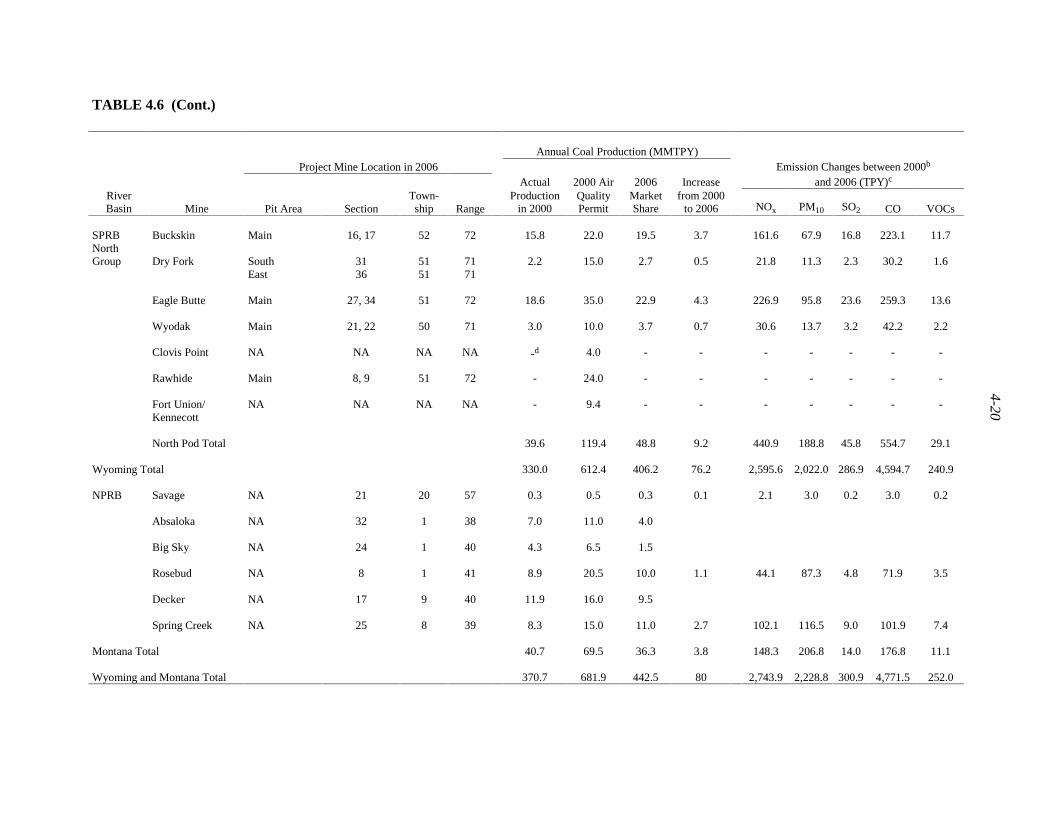
4-20
TABLE 4.6 (Cont.)
Annual Coal Production (MMTPY)Project Mine Location in 2006 Emission Changes between 2000b
Actual 2000 Air 2006 Increase and 2006 (TPY)c
RiverBasin Mine Pit Area Section
Town-ship Range
Productionin 2000
QualityPermit
MarketShare
from 2000to 2006 NOx PM10 SO2 CO VOCs
Buckskin Main 16, 17 52 72 15.8 22.0 19.5 3.7 161.6 67.9 16.8 223.1 11.7
South 31 51 71Dry ForkEast 36 51 71
2.2 15.0 2.7 0.5 21.8 11.3 2.3 30.2 1.6
Eagle Butte Main 27, 34 51 72 18.6 35.0 22.9 4.3 226.9 95.8 23.6 259.3 13.6
Wyodak Main 21, 22 50 71 3.0 10.0 3.7 0.7 30.6 13.7 3.2 42.2 2.2
Clovis Point NA NA NA NA -d 4.0 - - - - - - -
Rawhide Main 8, 9 51 72 - 24.0 - - - - - - -
Fort Union/Kennecott
NA NA NA NA - 9.4 - - - - - - -
SPRBNorthGroup
North Pod Total 39.6 119.4 48.8 9.2 440.9 188.8 45.8 554.7 29.1
Wyoming Total 330.0 612.4 406.2 76.2 2,595.6 2,022.0 286.9 4,594.7 240.9
Savage NA 21 20 57 0.3 0.5 0.3 0.1 2.1 3.0 0.2 3.0 0.2
Absaloka NA 32 1 38 7.0 11.0 4.0
Big Sky NA 24 1 40 4.3 6.5 1.5
Rosebud NA 8 1 41 8.9 20.5 10.0 1.1 44.1 87.3 4.8 71.9 3.5
Decker NA 17 9 40 11.9 16.0 9.5
NPRB
Spring Creek NA 25 8 39 8.3 15.0 11.0 2.7 102.1 116.5 9.0 101.9 7.4
Montana Total 40.7 69.5 36.3 3.8 148.3 206.8 14.0 176.8 11.1
Wyoming and Montana Total 370.7 681.9 442.5 80 2,743.9 2,228.8 300.9 4,771.5 252.0

4-21
TABLE 4.6 (Cont.)
a Data for Wyoming and Montana are provided from Doelger (2001) and Giovanini (2001), respectively. Abbreviations: MMTPY = million tons per year, TPY = tons per year, SPRB =South Powder River Basin, NPRB = North Powder River Basin, and NA = not applicable.
b Actual production for 1997 was used for Montana mines.
c For Wyoming, emissions increases above the 1997/2000 emissions levels are provided for 2006, the year when the NOx emissions from the Wyoming Project activities are projected to bethe highest; emissions changes for Montana coal mines are based on 1997 − 2006 data.
d A hyphen indicates no data available.
4-22
was an enhancement of the Horse Creek EIS modeling analysis (McVehil-Monnett Associates,Inc. 1999). The DM&E database was updated by (1) adding data for any known and quantifiablenew (permitted) and RFFA sources that were not included in the DM&E database (RFFAsources include several coal-burning power plants forecast within the modeling domain.Potential CBM and conventional O&G wells on the IR and FS lands are also included in RFFAsources under all Montana Project alternatives except Alternative A [No Action].); (2) updatingdata for any known and quantifiable changes in operating levels of existing sources that affectemissions, including facility shutdowns; (3) deleting data for any new (permitted) sources whosepermits have been cancelled; and (4) revising data in the DM&E database where necessary. TheDM&E database includes data on emissions from surface coal mining and train operations inaddition to emissions related to CBM production.
An updated emissions inventory database for the new (permitted) and RFFA sources thatare not represented by the background air quality measurements was prepared. Electronic files ofemission inventory data for criteria pollutants and HAPs that were used in the recent EIS projectsin the modeling domain were obtained through the BLM (e.g., EIC 2000). Emission inventorydata for additional new sources and RFFA sources were obtained from state DEQs and theindustries proposing such sources. Argonne reviewed these data sets and reorganized them intoan appropriate format. The review was conducted with care to ensure that no source was countedmore than once. For example, emission sources that were identified as RFFA sources in theemissions inventories for the previous modeling studies but for which permits have beenobtained to construct since that time, were included in the new source category (with permits toconstruct or operate) but eliminated from the previous RFFA source category. Emissionsinventory data were revised on the basis of information available in the permits issued.
Any revision or updating of data in the existing emissions inventory databases thatbecame necessary because of changes in design or operation (including facility shutdowns),permit cancellation, or because more appropriate emissions factors became available, wereperformed following the guidance provided by the BLM and state DEQs.
Emissions from CBM sources that were aggregated into one large source in the previousair quality modeling studies were disaggregated as necessary to the extent possible.
The new NOx emission sources whose impacts are not reflected in the backgroundambient concentrations identified for the Wyoming Project Area were included in the updatedemissions inventory database. The impacts of new sources that received permits to constructfrom state DEQs from September 1, 1994, through May 31, 2002, would not have been reflectedin background ambient concentrations measured between March 1996 and April 1997, providedthat the construction period for new sources is assumed to be approximately 18 months. Thismonitoring period (March 1996 through April 1997) was selected for the updated emissionsinventory database because it is the period when the most recent background nitrogen dioxide(NO2) data monitored within the State of Wyoming were available for this analysis (at Gillette,Wyoming [see Table 4.2]). The permit cutoff date for new sources to be included in the updatedemissions inventory database (August 31, 2000) was selected at the Wyoming Projectstakeholders meeting held in Buffalo, Wyoming, on August 3, 2000. Similarly, the RFFAprojects are those clearly defined as of August 31, 2000, as the sources reasonably expected to be
4-23
in operation within the next 10 years. The cutoff dates for the permits and for defining RFFAsources were later extended to May 31, 2002, and emissions data for these additional sourceswere collected and incorporated into the updated emissions inventory database.
Although available data on ambient background concentrations are more recent for othercriteria pollutants than the NO2 data (March 1996 through April 1997) identified for theWyoming Project Area, the updated emissions inventory database was used in CALPUFFmodeling without further modification so that conservatively high impact estimates would beobtained for those criteria pollutants. For example, PM10 ambient concentration data within theWyoming Project Area are available for the period from January 1, 1999, through December 31,1999 (at Gillette and Sheridan, Wyoming [see Table 4.2]). In this case, the new sources with aconstruction permit receipt date from September 1, 1994, until July 1, 1997 (18 months beforeJanuary 1, 1999), were assumed to not be reflected in the ambient concentration monitoredduring the period from January 1, 1999, through December 31, 1999.
The new and RFFA source emissions inventories are presented in Appendix B.1 andsummarized in Table 4.7.
4.4.2 Project Emission Sources
Activities associated with the first year of the Montana and Wyoming Projects that wouldresult in air pollutant emissions would include construction/installation, operation, and/ormaintenance of wells, well pads, compressor engines, roads, pipelines, electric power lines, andother ancillary facilities. These activities would increase in their spatial extent as more wellswere drilled and ancillary facilities were developed or installed. Then, as some of the wellsdrilled early in the project period reached the end of their productive periods, reclamationactivities for these wells and associated facilities would be initiated. Consequently, air pollutantemissions would gradually increase to their peak, followed by a gradual decrease as fewer newwells were drilled and more wells reached the end of their productive periods. The locations ofthe Montana and Wyoming Project emission sources are shown in Figure 4.5.
Air pollutant emissions from each of these activities were first estimated for the entireproject period (20 year for the Montana Project or 10 years for the Wyoming Project), allocatedto each year of the project period according to the development plans presented in Tables 1.2 and1.5, and then the year of peak emissions for each pollutant was identified. To minimize the airquality impact assessment effort, CALPUFF modeling was performed once for each alternativecombination, using composite peak emissions data, that is, the combination of peak-yearemissions data for each pollutant. Thus the air quality impacts estimated in this study areconservatively high estimates, because the peak-year emissions for all pollutants do not occur inany of the 20-year project periods.
Construction-related emissions estimates focused on emissions of PM10 and PM2.5.However, other criteria pollutant and VOC emissions released from construction equipment andvehicles, as well as temporary field generators, were also estimated. Fugitive PM emissions from
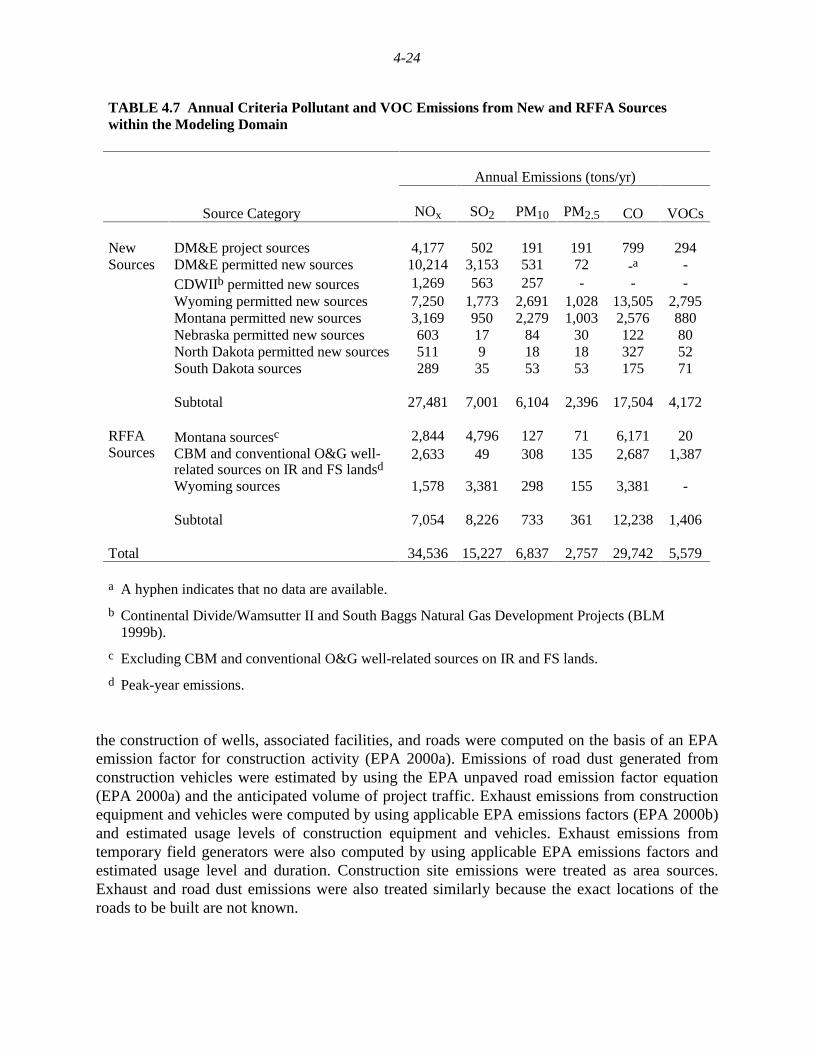
4-24
TABLE 4.7 Annual Criteria Pollutant and VOC Emissions from New and RFFA Sourceswithin the Modeling Domain
Annual Emissions (tons/yr)
Source Category NOx SO2 PM10 PM2.5 CO VOCs
DM&E project sources 4,177 502 191 191 799 294DM&E permitted new sources 10,214 3,153 531 72 -a -CDWIIb permitted new sources 1,269 563 257 - - -Wyoming permitted new sources 7,250 1,773 2,691 1,028 13,505 2,795Montana permitted new sources 3,169 950 2,279 1,003 2,576 880Nebraska permitted new sources 603 17 84 30 122 80North Dakota permitted new sources 511 9 18 18 327 52South Dakota sources 289 35 53 53 175 71
NewSources
Subtotal 27,481 7,001 6,104 2,396 17,504 4,172
Montana sourcesc 2,844 4,796 127 71 6,171 20CBM and conventional O&G well-related sources on IR and FS landsd
2,633 49 308 135 2,687 1,387
Wyoming sources 1,578 3,381 298 155 3,381 -
RFFASources
Subtotal 7,054 8,226 733 361 12,238 1,406
Total 34,536 15,227 6,837 2,757 29,742 5,579
a A hyphen indicates that no data are available.
b Continental Divide/Wamsutter II and South Baggs Natural Gas Development Projects (BLM1999b).
c Excluding CBM and conventional O&G well-related sources on IR and FS lands.
d Peak-year emissions.
the construction of wells, associated facilities, and roads were computed on the basis of an EPAemission factor for construction activity (EPA 2000a). Emissions of road dust generated fromconstruction vehicles were estimated by using the EPA unpaved road emission factor equation(EPA 2000a) and the anticipated volume of project traffic. Exhaust emissions from constructionequipment and vehicles were computed by using applicable EPA emissions factors (EPA 2000b)and estimated usage levels of construction equipment and vehicles. Exhaust emissions fromtemporary field generators were also computed by using applicable EPA emissions factors andestimated usage level and duration. Construction site emissions were treated as area sources.Exhaust and road dust emissions were also treated similarly because the exact locations of theroads to be built are not known.
4-25
For the operational phase, emissions of criteria pollutants (NOx, SO2, CO, PM10, andPM2.5) and VOCs were estimated for compressor engines (including booster [field] compressorsand sales [reciprocating] compressors), other equipment, road traffic, and road maintenanceactivities. HAP emissions were estimated for benzene, n-hexane, toluene, ethyl benzene, xylene,and formaldehyde. The emissions factors and stack parameters were obtained from equipmentmanufacturers with state DEQ review.
Emission rates were computed on the basis of the emissions factors and anticipated levelof operational activities (e.g., load factors and hours of operation per year). The reasonablyforeseeable emissions for compressor engines and dehydrators at compressor stations wereestimated by using conservatively high estimates of compressor engine hp requirements to movea unit volume of produced CBM (160 hp/106 ft3/d for booster compressors and 183 hp/106 ft3/dfor reciprocating compressors) and the dehydrator heat input rate to process a unit volume ofproduced CBM (250 × 106 Btu/h) (Keanini 2001). For impact analysis modeling, similaremissions from individual stacks at a given facility were aggregated into emissions from a singlestack.
Road dust emissions from vehicles traveling on access roads were estimated by using theEPA unpaved road emission factor equation (EPA 2000a) and the anticipated volume of projecttraffic. Fugitive dust emissions from access road maintenance activities were estimated on thebasis of the EPA emissions for construction activity (EPA 2000a) and the anticipated level ofroad maintenance activity.
4.4.2.1 Montana Project Sources
4.4.2.1.1 Alternative B, C, and E Sources. The estimated total emissions of criteriapollutants and VOCs from various project activities throughout the entire 20-year project periodunder Alternative E (Preferred Alternative) are summarized in Tables 4.8 through 4.10.Estimated emissions for the CBM project activities are provided in Table 4.8, and those for theconventional O&G project activities are provided in Table 4.9. Estimated combined totalemissions for the two types of project activities are presented in Table 4.10.
Table 4.11 presents the estimated year-by-year emissions of criteria pollutants and VOCsfrom various project activities under Alternative E. (See also Figures 4.7 and 4.8.) The 18th yearis estimated to be the year with the highest level of total project-related emissions of allpollutants for the Montana Project. The peak-emissions year is different for each pollutant. Forexample, the peak-emissions year is the 18th year for NOx (7,361 tons per year), and the 4th yearfor PM10 (956 tons per year). The projected peak-year emissions of NOx, SO2, PM10, PM2.5,CO, and VOCs from the Montana CBM and conventional O&G project activities underAlternative E are estimated to be 7,361; 293; 956; 382; 6,692; and 3,454 tons per year,respectively. With well development on the IR and FS lands (Alternative Ea), the projected peak-year emissions of NOx, SO2, PM10, PM2.5, CO, and VOCs from the Montana CBM and
4-26
TABLE 4.8 Estimated Total Criteria Pollutant and VOC Emissions from CBM-Related Activities of the MontanaProject under the Preferred Alternative during the 20-Year Project Period
Total Project Emissions (tons)Total
Project Activity Emission Source NOx PM10 PM2.5 SO2 CO VOCs (tons)
Construction Heavy equipment Fugitive dust 0 280 42 0 0 0 280 Exhaust 17,325 1,235 1,235 1,153 3,974 1,441 25,128Commuting vehicles Road dust 0 4,963 725 0 0 0 4,963
Construction sites (roads,wells, pads, pods, pipelines,compressor stations, fieldgenerators)
Exhaust 52 12 11 10 153 31 257
Subtotal 17,376 6,490 2,013 1,163 4,127 1,473 30,629
Operation Compressor stations Compressors Sales 27,183 898 898 36 21,086 18,122 67,325 Field 52,082 2,293 2,293 69 60,762 26,041 141,247Dehydrators 491 37 37 3 412 27 971Inspection visits Road dust 0 113 16 0 0 0 113 Exhaust <0.5 <0.5 <0.5 <0.5 3 <0.5 3
Wells Workover Road dust 0 942 138 0 0 0 942 Exhaust On-site 1,132 80 80 75 244 93 1,625 On-road 8 2 2 2 17 5 34
Wells and pipelines Inspection visits Road dust 0 881 129 0 0 0 881 Exhaust 2 <0.5 <0.5 <0.5 22 1 26
Subtotal 80,899 5,246 3,593 185 82,547 44,290 213,166
4-27
TABLE 4.8 (Cont.)
Total Project Emissions (tons)Total
Project Activity Emission Source NOx PM10 PM2.5 SO2 CO VOCs (tons)
Maintenance Roads Heavy equipment Fugitive dust 0 477 43 0 0 0 477 Exhaust 265 23 23 32 57 13 391Commuting vehicles Road dust 0 128 19 0 0 0 128 Exhaust <0.5 <0.5 <0.5 <0.5 3 <0.5 4
Compressor stations Maintenance visits Road dust 0 207 30 0 0 0 207 Exhaust <0.5 <0.5 <0.5 <0.5 5 <0.5 6
Subtotal 266 835 115 33 65 14 1,213
Total 98,541 12,571 5,722 1,381 86,739 45,776 245,007
4-28
TABLE 4.9 Estimated Total Criteria Pollutant and VOC Emissions from Conventional Oil- and Gas-RelatedActivities of the Montana Project under the Preferred Alternative during the 20-Year Project Period
Total Project Emissions (tons)Total
Project Activity Emission Source NOx PM10 PM2.5 SO2 CO VOC (tons)
Construction Heavy equipment Fugitive dust 0 29 4 0 0 0 29 Exhaust 21,639 788 788 2,668 5,053 801 30,949Commuting vehicles Road dust 0 1,084 158 0 0 0 1,084
Construction sites (roads,wells, pads, pods, pipelines,compressor stations, fieldgenerators)
Exhaust 11 3 2 2 28 6 50
Subtotal 21,649 1,904 953 2,670 5,081 807 32,112
Operation Wells Workover Road dust 0 16 2 0 0 0 16 Exhaust On-site 518 37 37 34 112 42 742 On-road <0.5 <0.5 <0.5 <0.5 <0.5 <0.5 <0.5
Wells and pipelines Inspection visits Road dust 0 259 38 0 0 0 259 Exhaust 1 <0.5 <0.5 <0.5 6 <0.5 8
Subtotal 518 312 77 34 118 43 1,025
Maintenance Roads Heavy equipment Fugitive dust 0 128 12 0 0 0 128 Exhaust 71 6 6 9 15 4 105Commuting vehicles Road dust 0 34 5 0 0 0 34 Exhaust <0.5 <0.5 <0.5 <0.5 1 <0.5 1
Subtotal 71 169 23 9 16 4 269
Total 22,239 2,385 1,053 2,713 5,215 854 33,406

4-29
TABLE 4.10 Estimated Total Criteria Pollutant and VOC Emissions from the Montana CBM- and Conventional Oil- andGas-Related Activities under the Preferred Alternative during the 20-Year Project Period
Total Project Emissions (tons)Total
Project Activity Emission Source NOx PM10 PM2.5 SO2 CO VOC (tons)
Construction Heavy equipment Fugitive dust 0 309 46 0 0 0 309 Exhaust 38,963 2,023 2,023 3,821 9,027 2,242 56,077Commuting vehicles Road dust 0 6,047 884 0 0 0 6,047
Construction sites (roads,wells, pads, pods, pipelines,compressor stations, fieldgenerators)
Exhaust 62 14 13 12 181 38 307
Subtotal 39,026 8,394 2,967 3,833 9,207 2,280 62,740
Operation Compressor stations Compressors Sales 27,183 898 898 36 21,086 18,122 67,325 Field 52,082 2,293 2,293 69 60,762 26,041 141,247Dehydrators 491 37 37 3 412 27 971Inspection visits Road dust 0 113 16 0 0 0 113 Exhaust <0.5 <0.5 <0.5 <0.5 3 <0.5 3
Wells Workover Road dust 0 958 140 0 0 0 958 Exhaust On-site 1,650 117 117 109 356 135 2,367 On-road 8 2 2 2 17 5 34
Wells and pipelines Inspection visits Road dust 0 1,140 167 0 0 0 1,140 Exhaust 2 <0.5 <0.5 <0.5 28 2 33
Subtotal 81,417 5,557 3,670 220 82,665 44,333 214,192
4-30
TABLE 4.10 (Cont.)
Total Project Emissions (tons)Total
Project Activity Emission Source NOx PM10 PM2.5 SO2 CO VOC (tons)
Maintenance Roads Heavy equipment Fugitive dust 0 605 55 0 0 0 605 Exhaust 336 29 29 41 73 17 496Commuting vehicles Road dust 0 163 24 0 0 0 163 Exhaust <0.5 <0.5 <0.5 <0.5 4 <0.5 5
Compressor stations Maintenance visits Road dust 0 207 30 0 0 0 207 Exhaust <0.5 <0.5 <0.5 <0.5 5 <0.5 6
Subtotal 337 1,004 138 41 82 18 1,482
Total 120,780 14,956 6,775 4,094 91,954 46,630 278,414
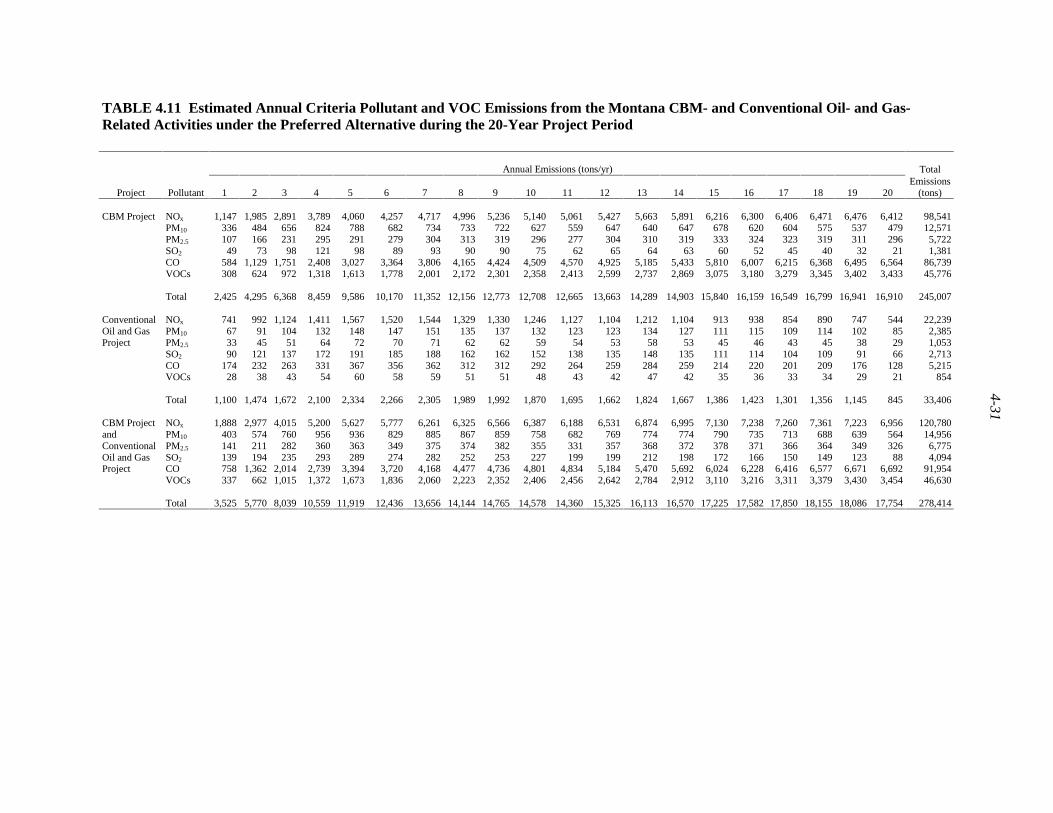
4-31
TABLE 4.11 Estimated Annual Criteria Pollutant and VOC Emissions from the Montana CBM- and Conventional Oil- and Gas-Related Activities under the Preferred Alternative during the 20-Year Project Period
Annual Emissions (tons/yr) Total
Project Pollutant 1 2 3 4 5 6 7 8 9 10 11 12 13 14 15 16 17 18 19 20Emissions
(tons)
CBM Project NOx 1,147 1,985 2,891 3,789 4,060 4,257 4,717 4,996 5,236 5,140 5,061 5,427 5,663 5,891 6,216 6,300 6,406 6,471 6,476 6,412 98,541PM10 336 484 656 824 788 682 734 733 722 627 559 647 640 647 678 620 604 575 537 479 12,571PM2.5 107 166 231 295 291 279 304 313 319 296 277 304 310 319 333 324 323 319 311 296 5,722SO2 49 73 98 121 98 89 93 90 90 75 62 65 64 63 60 52 45 40 32 21 1,381CO 584 1,129 1,751 2,408 3,027 3,364 3,806 4,165 4,424 4,509 4,570 4,925 5,185 5,433 5,810 6,007 6,215 6,368 6,495 6,564 86,739VOCs 308 624 972 1,318 1,613 1,778 2,001 2,172 2,301 2,358 2,413 2,599 2,737 2,869 3,075 3,180 3,279 3,345 3,402 3,433 45,776
Total 2,425 4,295 6,368 8,459 9,586 10,170 11,352 12,156 12,773 12,708 12,665 13,663 14,289 14,903 15,840 16,159 16,549 16,799 16,941 16,910 245,007
NOx 741 992 1,124 1,411 1,567 1,520 1,544 1,329 1,330 1,246 1,127 1,104 1,212 1,104 913 938 854 890 747 544 22,239PM10 67 91 104 132 148 147 151 135 137 132 123 123 134 127 111 115 109 114 102 85 2,385PM2.5 33 45 51 64 72 70 71 62 62 59 54 53 58 53 45 46 43 45 38 29 1,053SO2 90 121 137 172 191 185 188 162 162 152 138 135 148 135 111 114 104 109 91 66 2,713CO 174 232 263 331 367 356 362 312 312 292 264 259 284 259 214 220 201 209 176 128 5,215VOCs 28 38 43 54 60 58 59 51 51 48 43 42 47 42 35 36 33 34 29 21 854
ConventionalOil and GasProject
Total 1,100 1,474 1,672 2,100 2,334 2,266 2,305 1,989 1,992 1,870 1,695 1,662 1,824 1,667 1,386 1,423 1,301 1,356 1,145 845 33,406
NOx 1,888 2,977 4,015 5,200 5,627 5,777 6,261 6,325 6,566 6,387 6,188 6,531 6,874 6,995 7,130 7,238 7,260 7,361 7,223 6,956 120,780PM10 403 574 760 956 936 829 885 867 859 758 682 769 774 774 790 735 713 688 639 564 14,956PM2.5 141 211 282 360 363 349 375 374 382 355 331 357 368 372 378 371 366 364 349 326 6,775SO2 139 194 235 293 289 274 282 252 253 227 199 199 212 198 172 166 150 149 123 88 4,094CO 758 1,362 2,014 2,739 3,394 3,720 4,168 4,477 4,736 4,801 4,834 5,184 5,470 5,692 6,024 6,228 6,416 6,577 6,671 6,692 91,954VOCs 337 662 1,015 1,372 1,673 1,836 2,060 2,223 2,352 2,406 2,456 2,642 2,784 2,912 3,110 3,216 3,311 3,379 3,430 3,454 46,630
CBM ProjectandConventionalOil and GasProject
Total 3,525 5,770 8,039 10,559 11,919 12,436 13,656 14,144 14,765 14,578 14,360 15,325 16,113 16,570 17,225 17,582 17,850 18,155 18,086 17,754 278,414
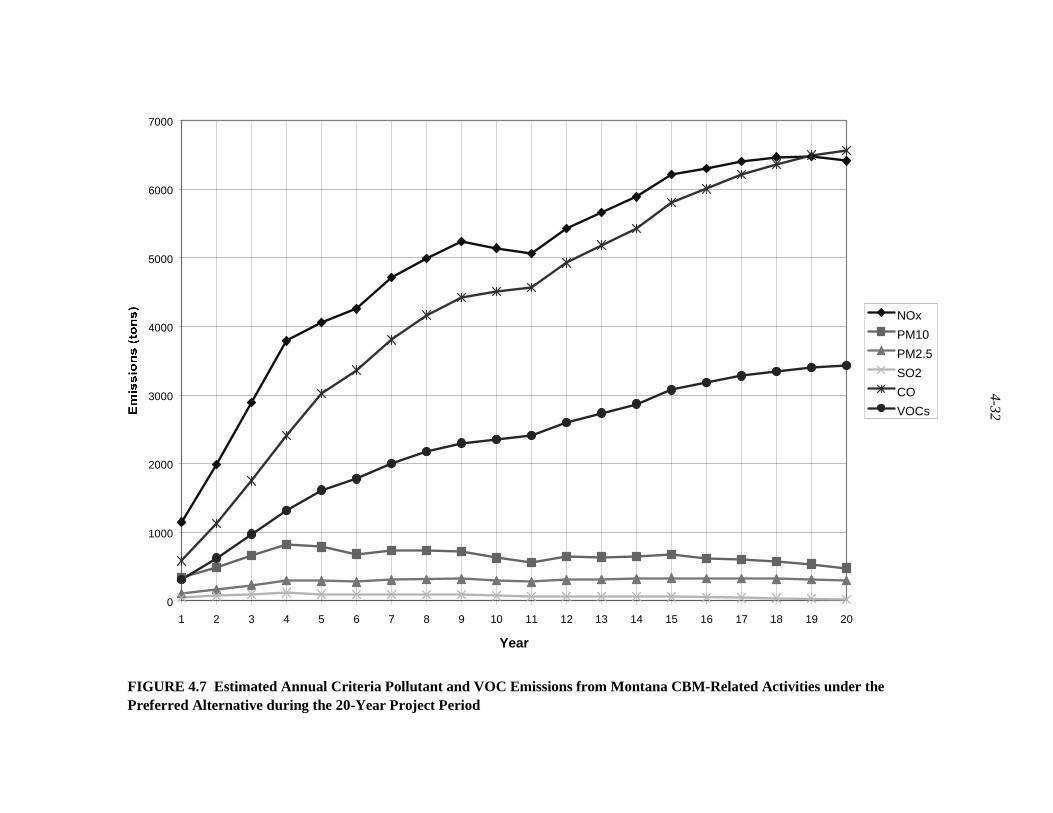
4-32
0
1000
2000
3000
4000
5000
6000
7000
1 2 3 4 5 6 7 8 9 10 11 12 13 14 15 16 17 18 19 20
Year
NOx
PM10
PM2.5
SO2
CO
VOCs
FIGURE 4.7 Estimated Annual Criteria Pollutant and VOC Emissions from Montana CBM-Related Activities under thePreferred Alternative during the 20-Year Project Period
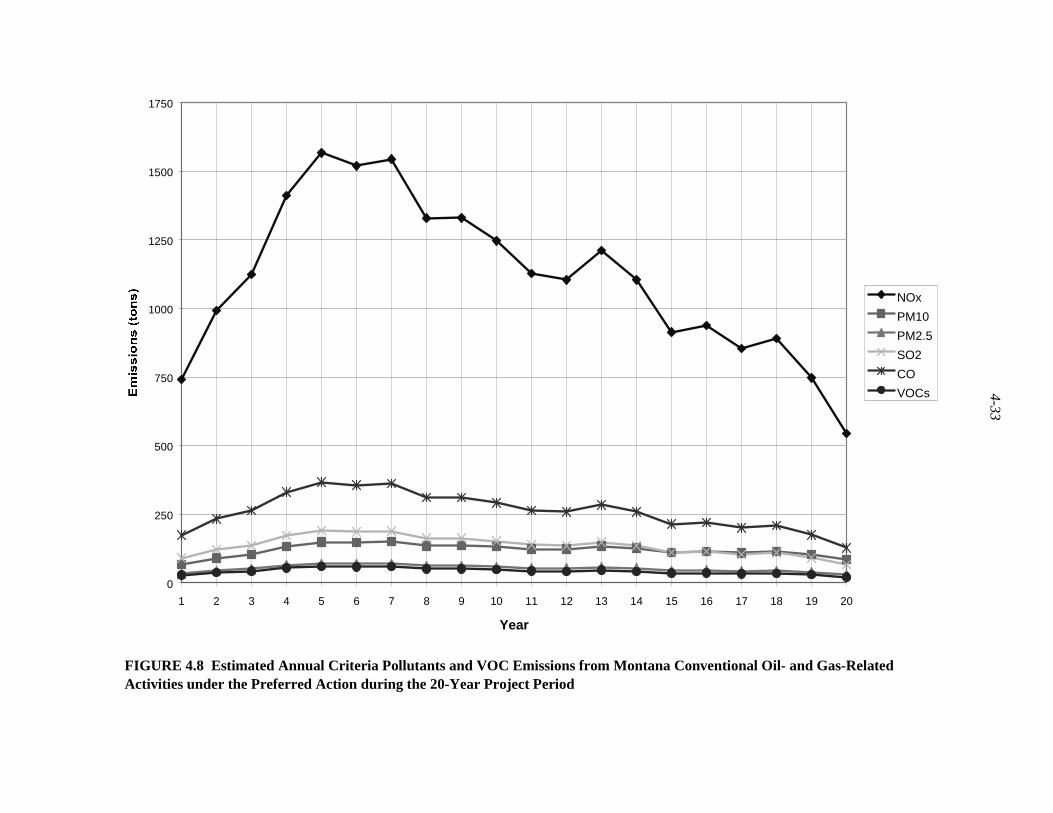
4-33
0
250
500
750
1000
1250
1500
1750
1 2 3 4 5 6 7 8 9 10 11 12 13 14 15 16 17 18 19 20
Year
NOx
PM10
PM2.5
SO2
CO
VOCs
FIGURE 4.8 Estimated Annual Criteria Pollutants and VOC Emissions from Montana Conventional Oil- and Gas-RelatedActivities under the Preferred Action during the 20-Year Project Period
4-34
conventional O&G project activities are estimated to be 9,959; 339; 1,230; 514; 9,378; and4,841 tons per year, respectively. These values are larger than those under Alternative E byapproximately 35, 16, 29, 35, 40, and 40%, respectively.
Details of the total estimated emissions and the basic data used in emissions calculationsfor the Montana CBM project activities under Alternative E are provided in Appendix B.2.1.Those for the Montana conventional O&G project activities, which are common to all MontanaProject alternatives, are provided in Appendix B.2.2.
4.4.2.1.2 Alternative D Sources. The only difference between Alternative D and E(Preferred Alternative) is that field (booster) compressors would be operated by electricity underAlternative D, while they would be fired by gas under Alternative E. Thus, emissions underAlternative D would be the emissions under Alternative E, minus the emissions from field(booster) compressor engines. Emissions would be released in generating electricity used tooperate the compressor engines, which would be provided by the generating stations or powerplants considered in this study as a part of RFFA sources in the non-project emissions inventory.Potential emissions from generating additional electricity that may be required from generatingstations at remote locations outside the modeling domain were not considered in the currentstudy. The projected peak-year emissions for NOx, SO2, PM10, PM2.5, CO, and VOCs underAlternative D are estimated to be 4,135; 292; 909; 313; 1,863; and 1,351 tons per year,respectively. These values represent 56, 100, 95, 82, 28, and 39% of those under Alternative E,respectively. With well development on the IR and FS lands, the projected peak-year emissionsof NOx, SO2, PM10, PM2.5, CO, and VOCs under Alternative Da are estimated to be 4,805; 336;1,155; 389; 2,512; and 1,860 tons per year, respectively. These values are equivalent to about 48,99, 94, 76, 27, and 38% of those under Alternative Ea (Preferred Alternative, including welldevelopment on the IR and FS lands), respectively.
4.4.2.1.3 Alternative A Sources. As listed in Table 1.1, the total number of CBM wellsto be drilled under Montana Project Alternative A (No Action) is very small (897), which is onlyabout 5% of the total number of CBM wells to be drilled under Alternative E (18,266). Thepeak-year emissions of NOx, SO2, PM10, PM2.5, CO, and VOCs under Alternative A(No Action) are 1,828; 199; 206; 92; 548; and 153 tons per year, respectively. These values areabout 25, 68, 22, 24, 8, and 4% of those under Alternative E, respectively.
4.4.2.2 Wyoming Project Sources
4.4.2.2.1 Alternative 1 Sources. The estimated total criteria pollutant and VOCemissions from various project activities throughout the entire 10-year project period underWyoming Project Alternative 1 (Proposed Action) are summarized in Tables 4.12 through 4.14.Estimated emissions for the CBM project activities are provided in Table 4.12, and those for theconventional O&G project activities are provided in Table 4.13. Estimated combined totalemissions for the two types of project activities are presented in Table 4.14.
4-35
TABLE 4.12 Estimated Total Criteria Pollutant and VOC Emissions from CBM-Related Activities of the WyomingProject under the Proposed Action during the 10-Year Project Period
Total Project Emissions (tons)Total
Project Activity Emission Source NOx PM10 PM2.5 SO2 CO VOC (tons)
Construction Heavy equipment Fugitive dust 0 647 97 0 0 0 647 Exhaust 37,333 2,660 2,660 2,490 8,167 3,035 53,684Commuting vehicles Road dust 0 9,737 1,423 0 0 0 9,737
Construction sites (roads,wells, pads, pods, pipelines,compressor stations, fieldgenerators)
Exhaust 111 26 24 22 290 67 515
Subtotal 37,443 13,069 4,204 2,511 8,457 3,102 64,582
Operation Compressor stations Compressors Reciprocating 35,529 1,692 1,692 68 40,604 33,837 111,729 Booster 29,584 1,954 1,954 59 51,772 22,188 105,557Dehydrators 206 16 16 1 173 11 406Inspection visits Road dust 0 226 33 0 0 0 226 Exhaust 1 <0.5 <0.5 <0.5 8 1 10
Wells Workover Road dust 0 1,378 201 0 0 0 1,378 Exhaust On-site 2,441 173 173 161 526 200 3,502 On-road 18 4 4 4 37 10 73
Wells and pipelines Inspection visits Road dust 0 579 85 0 0 0 579 Exhaust 2 <0.5 <0.5 <0.5 21 1 25
Subtotal 67,779 6,022 4,158 293 93,142 56,249 223,485
4-36
TABLE 4.12 (Cont.)
Total Project Emissions (tons)Total
Project Activity Emission Source NOx PM10 PM2.5 SO2 CO VOC (tons)
Maintenance Roads Heavy equipment Fugitive dust 0 804 73 0 0 0 804 Exhaust 446 39 39 55 96 23 659Commuting vehicles Road dust 0 147 21 0 0 0 147 Exhaust <0.5 <0.5 <0.5 <0.5 5 <0.5 6
Compressor stations Maintenance visits Road dust 0 89 13 0 0 0 89 Exhaust <0.5 <0.5 <0.5 <0.5 3 <0.5 4
Subtotal 447 1,079 146 55 105 23 1,709
Reclamation Roads Heavy equipment Fugitive dust 0 18 2 0 0 0 18 Exhaust 6 1 1 1 1 <0.5 9Commuting vehicles Road dust 0 3 0 0 0 0 3 Exhaust <0.5 <0.5 <0.5 <0.5 <0.5 <0.5 <0.5
Wells Heavy equipment Fugitive dust 0 173 16 0 0 0 173 Exhaust 71 6 6 9 15 4 105Commuting vehicles Road dust 0 31 5 0 0 0 31 Exhaust <0.5 <0.5 <0.5 <0.5 1 <0.5 1
Subtotal 77 232 29 9 18 4 340
Total 105,747 20,402 8,537 2,869 101,721 59,377 290,116
4-37
TABLE 4.13 Estimated Total Criteria Pollutant and VOC Emissions from Conventional Oil- and Gas-RelatedActivities of the Wyoming Project under the Proposed Action during the 10-Year Project Period
Total Project Emissions (tons)Total
Project Activity Emission Source NOx PM10 PM2.5 SO2 CO VOC (tons)
Construction Heavy equipment Fugitive dust 0 280 42 0 0 0 280 Exhaust 37,421 1,370 1,370 4,604 9,224 1,468 54,087Commuting vehicles Road dust 0 1,965 287 0 0 0 1,965
Construction sites (roads,wells, pads, pods, pipelines,compressor stations, fieldgenerators)
Exhaust 20 5 4 4 50 12 90
Subtotal 37,441 3,620 1,703 4,607 9,274 1,480 56,422
Operation Wells Workover Road dust 0 19 3 0 0 0 19 Exhaust On-site 893 63 63 59 192 73 1,281 On-road <0.5 <0.5 <0.5 <0.5 <0.5 <0.5 1
Wells and pipelines Inspection visits Road dust 0 147 22 0 0 0 147 Exhaust <0.5 <0.5 <0.5 <0.5 5 <0.5 6
Subtotal 893 230 88 59 198 74 1,454
Maintenance Roads Heavy equipment Fugitive dust 0 108 10 0 0 0 108 Exhaust 60 5 5 7 13 3 88Commuting vehicles Road dust 0 20 3 0 0 0 20 Exhaust <0.5 <0.5 <0.5 <0.5 1 <0.5 1
Subtotal 60 133 18 7 14 3 217
Total 38,394 3,982 1,809 4,674 9,486 1,557 58,093

4-38
TABLE 4.14 Estimated Total Criteria Pollutant and VOC Emissions from Wyoming CBM- and Conventional Oil- andGas-Related Activities under the Proposed Action during the 10-Year Project Period
Total Project Emissions (tons)Total
Project Activity Emission Source NOx PM10 PM2.5 SO2 CO VOC (tons)
Construction Heavy equipment Fugitive dust 0 927 139 0 0 0 927 Exhaust 74,754 4,030 4,030 7,093 17,391 4,503 107,771Commuting vehicles Road dust 0 11,701 1,710 0 0 0 11,701
Construction sites (roads,wells, pads, pods, pipelines,compressor stations, fieldgenerators)
Exhaust 130 30 28 25 340 78 605
Subtotal 74,884 16,689 5,907 7,119 17,731 4,581 121,004
Operation Compressor stations Compressors Reciprocating 35,529 1,692 1,692 68 40,604 33,837 111,729 Booster 29,584 1,954 1,954 59 51,772 22,188 105,557Dehydrators 206 16 16 1 173 11 406Inspection visits Road dust 0 226 33 0 0 0 226 Exhaust 1 <0.5 <0.5 <0.5 8 1 10
Wells Workover Road dust 0 1,397 204 0 0 0 1,397 Exhaust On-site 3,334 237 237 220 718 274 4,782 On-road 18 4 4 4 38 11 74
Wells and pipelines Inspection visits Road dust 0 726 106 0 0 0 726 Exhaust 2 <0.5 <0.5 <0.5 27 2 31
Subtotal 68,673 6,251 4,245 352 93,340 56,323 224,939
4-39
TABLE 4.14 (Cont.)
Total Project Emissions (tons)Total
Project Activity Emission Source NOx PM10 PM2.5 SO2 CO VOC (tons)
Maintenance Roads Heavy equipment Fugitive dust 0 911 83 0 0 0 911 Exhaust 506 44 44 62 109 26 747Commuting vehicles Road dust 0 166 24 0 0 0 166 Exhaust 1 <0.5 <0.5 <0.5 6 <0.5 7
Compressor stations Maintenance visits Road dust 0 89 13 0 0 0 89 Exhaust <0.5 <0.5 <0.5 <0.5 3 <0.5 4
Subtotal 507 1,211 164 62 119 26 1,925
Reclamation Roads Heavy equipment Fugitive dust 0 18 2 0 0 0 18 Exhaust 6 1 1 1 1 <0.5 9Commuting vehicles Road dust 0 3 0 0 0 0 3 Exhaust <0.5 <0.5 <0.5 <0.5 <0.5 <0.5 <0.5
Wells Heavy equipment Fugitive dust 0 173 16 0 0 0 173 Exhaust 71 6 6 9 15 4 105Commuting vehicles Road dust 0 31 5 0 0 0 31 Exhaust <0.5 <0.5 <0.5 <0.5 1 <0.5 1
Subtotal 77 232 29 9 18 4 340
Total 144,141 24,384 10,346 7,543 111,207 60,934 348,209
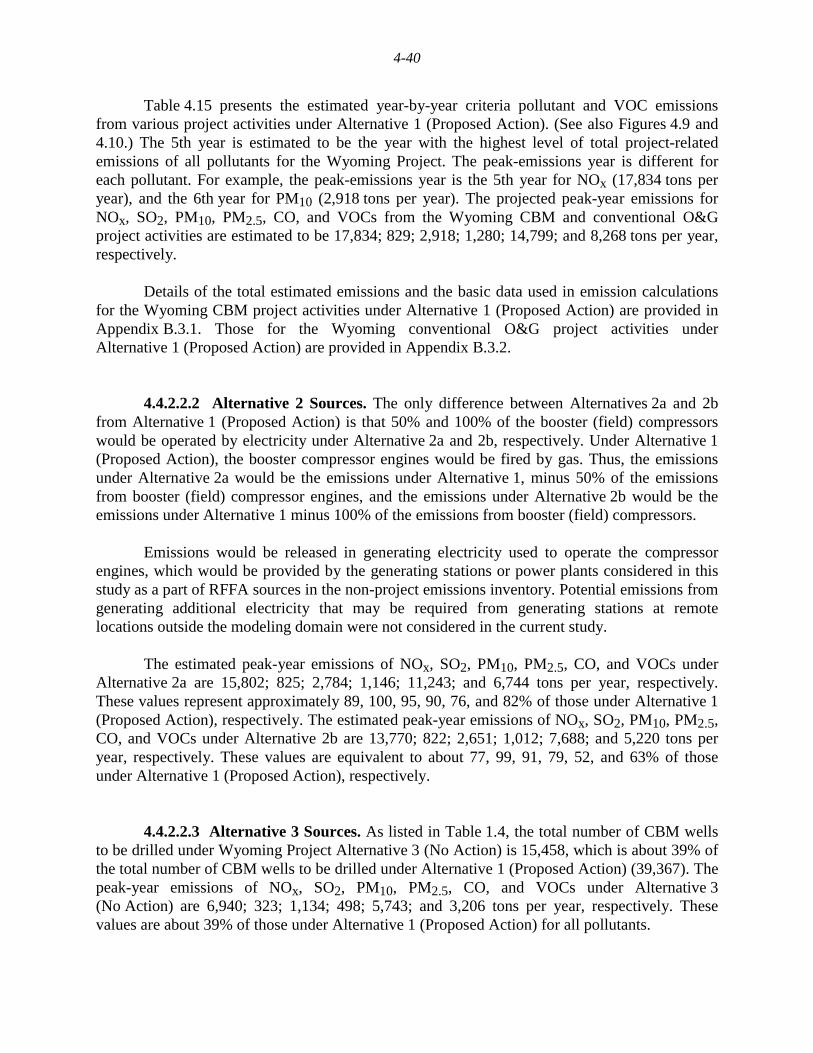
4-40
Table 4.15 presents the estimated year-by-year criteria pollutant and VOC emissionsfrom various project activities under Alternative 1 (Proposed Action). (See also Figures 4.9 and4.10.) The 5th year is estimated to be the year with the highest level of total project-relatedemissions of all pollutants for the Wyoming Project. The peak-emissions year is different foreach pollutant. For example, the peak-emissions year is the 5th year for NOx (17,834 tons peryear), and the 6th year for PM10 (2,918 tons per year). The projected peak-year emissions forNOx, SO2, PM10, PM2.5, CO, and VOCs from the Wyoming CBM and conventional O&Gproject activities are estimated to be 17,834; 829; 2,918; 1,280; 14,799; and 8,268 tons per year,respectively.
Details of the total estimated emissions and the basic data used in emission calculationsfor the Wyoming CBM project activities under Alternative 1 (Proposed Action) are provided inAppendix B.3.1. Those for the Wyoming conventional O&G project activities underAlternative 1 (Proposed Action) are provided in Appendix B.3.2.
4.4.2.2.2 Alternative 2 Sources. The only difference between Alternatives 2a and 2bfrom Alternative 1 (Proposed Action) is that 50% and 100% of the booster (field) compressorswould be operated by electricity under Alternative 2a and 2b, respectively. Under Alternative 1(Proposed Action), the booster compressor engines would be fired by gas. Thus, the emissionsunder Alternative 2a would be the emissions under Alternative 1, minus 50% of the emissionsfrom booster (field) compressor engines, and the emissions under Alternative 2b would be theemissions under Alternative 1 minus 100% of the emissions from booster (field) compressors.
Emissions would be released in generating electricity used to operate the compressorengines, which would be provided by the generating stations or power plants considered in thisstudy as a part of RFFA sources in the non-project emissions inventory. Potential emissions fromgenerating additional electricity that may be required from generating stations at remotelocations outside the modeling domain were not considered in the current study.
The estimated peak-year emissions of NOx, SO2, PM10, PM2.5, CO, and VOCs underAlternative 2a are 15,802; 825; 2,784; 1,146; 11,243; and 6,744 tons per year, respectively.These values represent approximately 89, 100, 95, 90, 76, and 82% of those under Alternative 1(Proposed Action), respectively. The estimated peak-year emissions of NOx, SO2, PM10, PM2.5,CO, and VOCs under Alternative 2b are 13,770; 822; 2,651; 1,012; 7,688; and 5,220 tons peryear, respectively. These values are equivalent to about 77, 99, 91, 79, 52, and 63% of thoseunder Alternative 1 (Proposed Action), respectively.
4.4.2.2.3 Alternative 3 Sources. As listed in Table 1.4, the total number of CBM wellsto be drilled under Wyoming Project Alternative 3 (No Action) is 15,458, which is about 39% ofthe total number of CBM wells to be drilled under Alternative 1 (Proposed Action) (39,367). Thepeak-year emissions of NOx, SO2, PM10, PM2.5, CO, and VOCs under Alternative 3(No Action) are 6,940; 323; 1,134; 498; 5,743; and 3,206 tons per year, respectively. Thesevalues are about 39% of those under Alternative 1 (Proposed Action) for all pollutants.
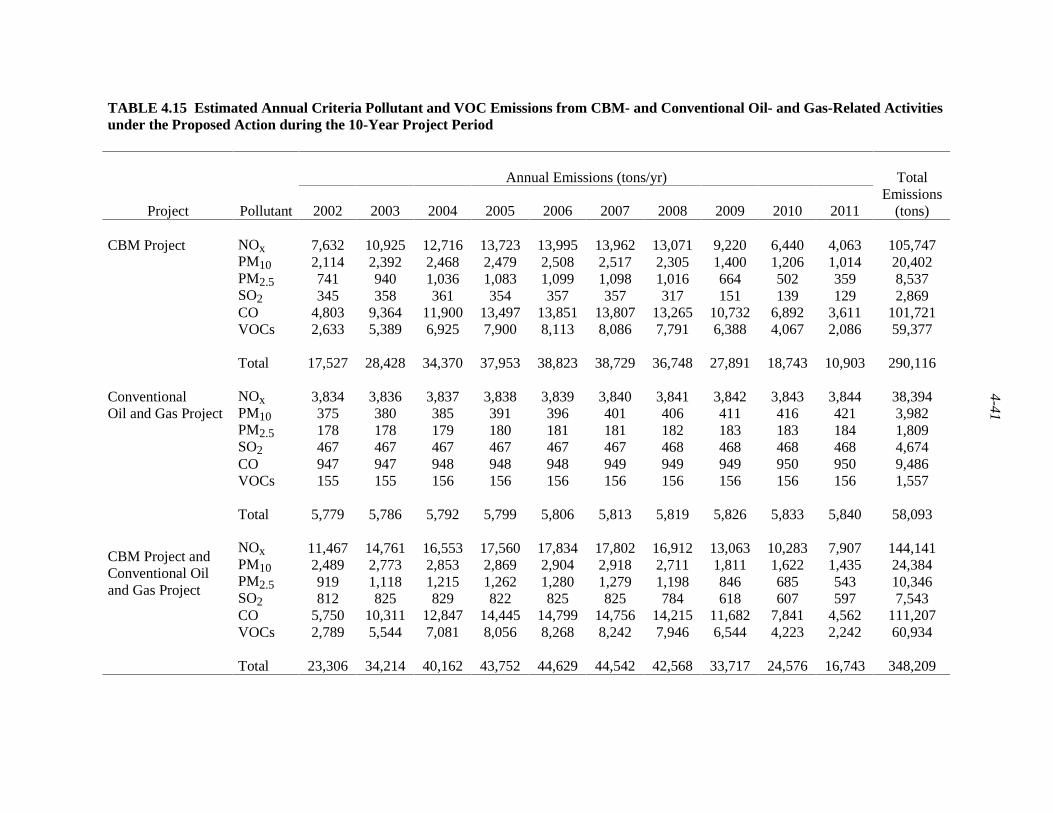
4-41
TABLE 4.15 Estimated Annual Criteria Pollutant and VOC Emissions from CBM- and Conventional Oil- and Gas-Related Activitiesunder the Proposed Action during the 10-Year Project Period
Annual Emissions (tons/yr)
Project Pollutant 2002 2003 2004 2005 2006 2007 2008 2009 2010 2011
TotalEmissions
(tons)
NOx 7,632 10,925 12,716 13,723 13,995 13,962 13,071 9,220 6,440 4,063 105,747PM10 2,114 2,392 2,468 2,479 2,508 2,517 2,305 1,400 1,206 1,014 20,402PM2.5 741 940 1,036 1,083 1,099 1,098 1,016 664 502 359 8,537SO2 345 358 361 354 357 357 317 151 139 129 2,869CO 4,803 9,364 11,900 13,497 13,851 13,807 13,265 10,732 6,892 3,611 101,721VOCs 2,633 5,389 6,925 7,900 8,113 8,086 7,791 6,388 4,067 2,086 59,377
CBM Project
Total 17,527 28,428 34,370 37,953 38,823 38,729 36,748 27,891 18,743 10,903 290,116
NOx 3,834 3,836 3,837 3,838 3,839 3,840 3,841 3,842 3,843 3,844 38,394PM10 375 380 385 391 396 401 406 411 416 421 3,982PM2.5 178 178 179 180 181 181 182 183 183 184 1,809SO2 467 467 467 467 467 467 468 468 468 468 4,674CO 947 947 948 948 948 949 949 949 950 950 9,486VOCs 155 155 156 156 156 156 156 156 156 156 1,557
ConventionalOil and Gas Project
Total 5,779 5,786 5,792 5,799 5,806 5,813 5,819 5,826 5,833 5,840 58,093
NOx 11,467 14,761 16,553 17,560 17,834 17,802 16,912 13,063 10,283 7,907 144,141PM10 2,489 2,773 2,853 2,869 2,904 2,918 2,711 1,811 1,622 1,435 24,384PM2.5 919 1,118 1,215 1,262 1,280 1,279 1,198 846 685 543 10,346SO2 812 825 829 822 825 825 784 618 607 597 7,543CO 5,750 10,311 12,847 14,445 14,799 14,756 14,215 11,682 7,841 4,562 111,207VOCs 2,789 5,544 7,081 8,056 8,268 8,242 7,946 6,544 4,223 2,242 60,934
CBM Project andConventional Oiland Gas Project
Total 23,306 34,214 40,162 43,752 44,629 44,542 42,568 33,717 24,576 16,743 348,209
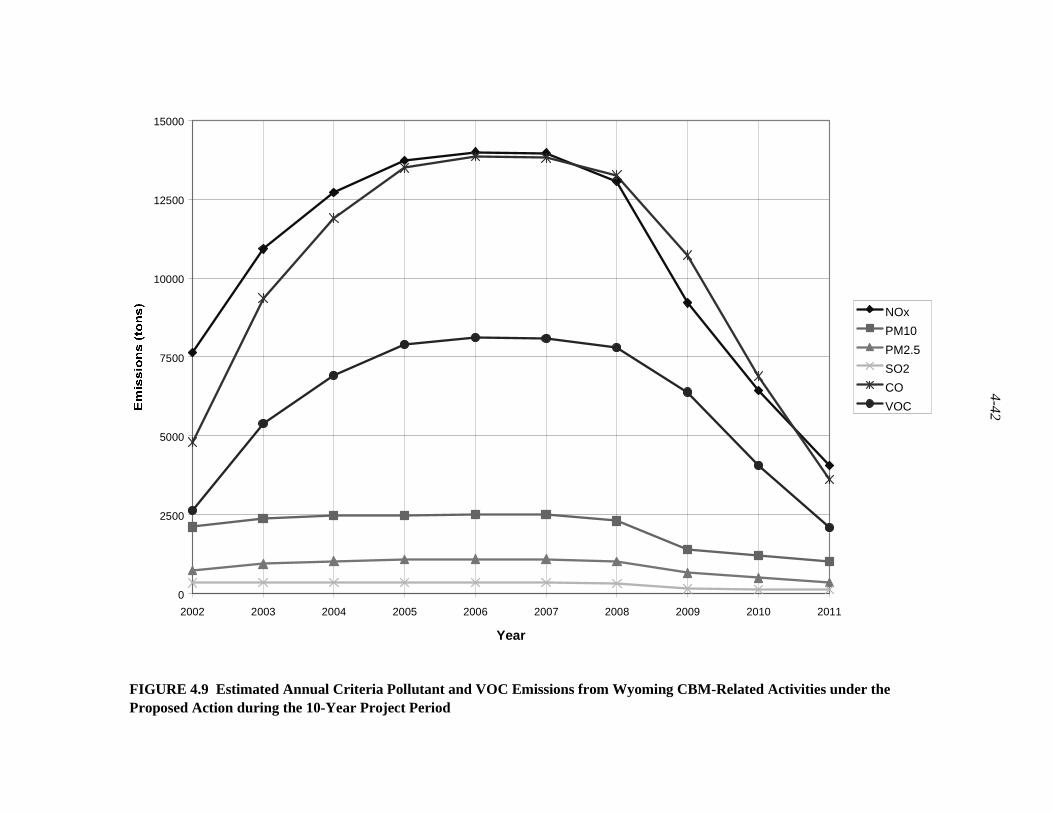
4-42
0
2500
5000
7500
10000
12500
15000
2002 2003 2004 2005 2006 2007 2008 2009 2010 2011
Year
NOx
PM10
PM2.5
SO2
CO
VOC
FIGURE 4.9 Estimated Annual Criteria Pollutant and VOC Emissions from Wyoming CBM-Related Activities under theProposed Action during the 10-Year Project Period
4-43
0
1000
2000
3000
4000
5000
2002 2003 2004 2005 2006 2007 2008 2009 2010 2011
Year
NOx
PM10
PM2.5
SO2
CO
VOC
FIGURE 4.10 Estimated Annual Criteria Pollutant and VOC Emissions from Wyoming Conventional Oil- and Gas-RelatedActivities under the Proposed Action during the 10-Year Project Period

4-44
5-1
5 AIR QUALITY MODELING AND POSTPROCESSING
The air quality modeling analysis for the current study was conducted by using theCALPUFF (Scire et al. 1999a) modeling system described in Section 3, with model input datadescribed in Section 4 to assess potential direct impacts on ambient air quality and AQRVs(visibility and acid deposition) that would result from the proposed new sources of each of theMontana and Wyoming Project Alternatives. Additional model runs were also made to assess thepotential impacts of other new and RFFA sources in the region alone, as well as to assesscumulative impacts from the combined Montana and Wyoming Projects and other new andRFFA sources.
The air quality modeling analysis used the daily maximum emission rates for theMontana and Wyoming Project sources and long-term (seasonal maximum) emission estimatesfor the other new and RFFA sources (as defined in the DM&E Expansion Project EIS emissioninventory database). The IWAQM-recommended default settings were used when they wereconsistent with the current version of CALPUFF. Thus, the default dry and wet depositionalgorithms were used. In addition, the following CALPUFF options were selected:
• Turbulence-based dispersion (based on similarity theory);
• Transitional plume rise;
• Stack tip downwash;
• Transition of horizontal dispersion to time-dependent (Heffter) growth rates;and
• Chemical transformation based on the RIVAD/ARM3 scheme, which treatsthe NO and NO2 conversion processes in addition to the NO2 to total NO3 andSO2 to SO4 conversions, with equilibrium between gaseous HNO3 andammonium nitrate aerosol.
Other CALPUFF model options and assumptions about background concentrations ofchemical species used in the current study were based on those used in the DM&E ExpansionProject modeling study (EIC 2000).
Potential increases in concentrations of NO2, SO2, PM10, PM2.5, and CO, and in sulfurand nitrogen deposition, as well as in visibility impairment (light extinction), were predicted atselected receptor locations, as described in Section 4. Concentration increases in PM10 andPM2.5 due to construction activities were also predicted for locations close to a selectedconstruction site, as described in Section 4. Concentrations of HAPs (e.g., formaldehyde) due toemissions from the proposed new sources of the Montana and Wyoming Projects were predictedat near-field receptors, as described in Section 4.
5-2
Nitrogen oxides would be a major component of the emissions from the Montana andWyoming Projects and other new sources in the region. CALPUFF simulates the oxidation ofNOx to nitrate and calculates the equilibrium between sulfate, nitrate, and ammonia to determinehow much of the converted NOx is particulate nitrate and how much is gaseous HNO3. The latestversion of CALPUFF allows the background concentrations of pollutants, such as sulfate andnitrate (representing contributions due to existing sources), to be input; thus, the contributions ofbackground concentrations of these species to the overall cumulative impacts would be included.
All air quality outputs from the modeling program are hourly values of directconcentration increases, which were processed to compute 3-, 8-, and 24-hour, and annualaverage direct concentration increases. Another category of predicted outputs is total ambientconcentration values (direct concentration increases plus the background concentrations).Visibility and deposition estimates are daily values, and the annual number of days with a givenlevel of visibility degradation and annual total sulfur and nitrogen deposition flux incrementswas derived from the daily values.
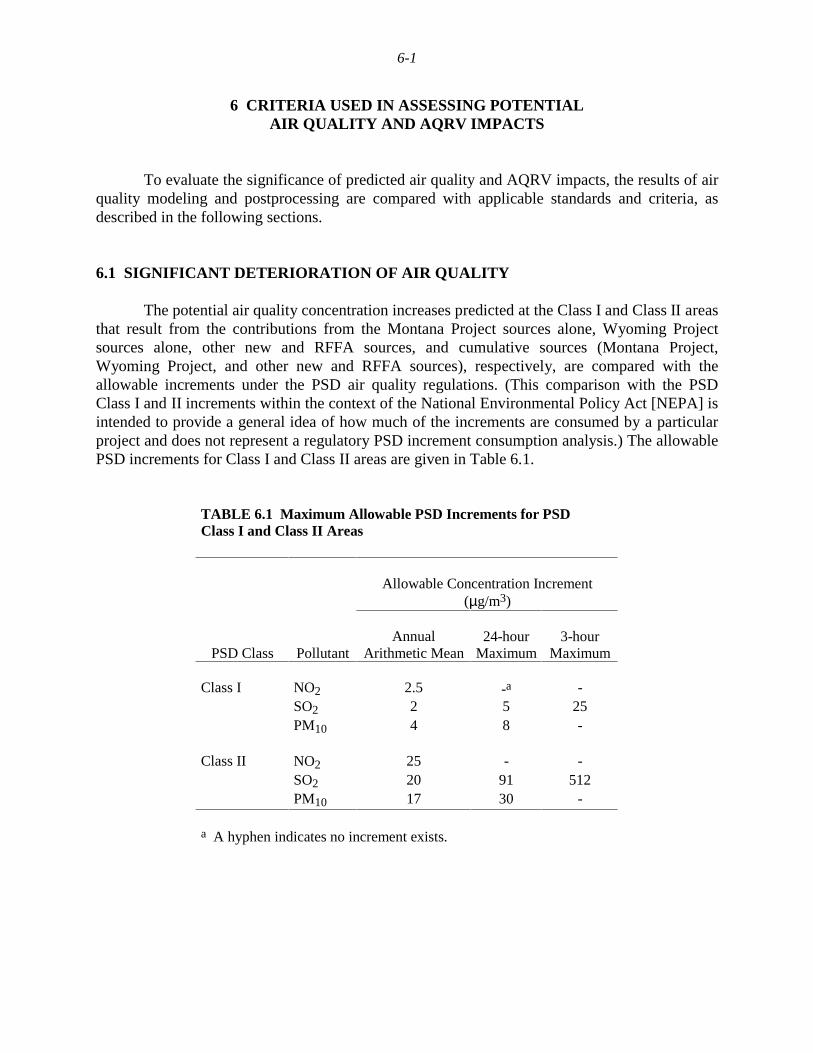
6-1
6 CRITERIA USED IN ASSESSING POTENTIALAIR QUALITY AND AQRV IMPACTS
To evaluate the significance of predicted air quality and AQRV impacts, the results of airquality modeling and postprocessing are compared with applicable standards and criteria, asdescribed in the following sections.
6.1 SIGNIFICANT DETERIORATION OF AIR QUALITY
The potential air quality concentration increases predicted at the Class I and Class II areasthat result from the contributions from the Montana Project sources alone, Wyoming Projectsources alone, other new and RFFA sources, and cumulative sources (Montana Project,Wyoming Project, and other new and RFFA sources), respectively, are compared with theallowable increments under the PSD air quality regulations. (This comparison with the PSDClass I and II increments within the context of the National Environmental Policy Act [NEPA] isintended to provide a general idea of how much of the increments are consumed by a particularproject and does not represent a regulatory PSD increment consumption analysis.) The allowablePSD increments for Class I and Class II areas are given in Table 6.1.
TABLE 6.1 Maximum Allowable PSD Increments for PSDClass I and Class II Areas
Allowable Concentration Increment(µg/m3)
PSD Class PollutantAnnual
Arithmetic Mean24-hour
Maximum3-hour
Maximum
NO2 2.5 -a -SO2 2 5 25
Class I
PM10 4 8 -
NO2 25 - -SO2 20 91 512
Class II
PM10 17 30 -
a A hyphen indicates no increment exists.
6-2
6.2 AMBIENT AIR QUALITY
6.2.1 Criteria Pollutants
The potential total concentrations (cumulative concentration contributions due to theemissions from the proposed new sources of the Montana Project Study, the Wyoming Project,other new sources and RFFA sources, plus the background concentrations) of criteria pollutantsestimated at near-field receptors are compared with applicable health- and welfare-relatedNAAQS and SAAQS.
The NAAQS and SAAQS for the states, parts of which are located within the modelingdomain (Wyoming, Montana, North Dakota, South Dakota, and Nebraska), are established forNO2, SO2, PM10, PM2.5, O3, CO, and lead (Pb). Given the insignificant levels of potentialPb emissions, the Pb standard is not addressed in this analysis. The O3 standard is also notaddressed in this analysis because an appropriate algorithm to estimate O3 concentrations overthe modeling domain is not available in the CALPUFF modeling system. Table 6.2 gives theNAAQS and SAAQS addressed in this study.
6.2.2 Hazardous Air Pollutants
Because ambient HAP standards have not been established by the EPA or the States ofMontana and Wyoming, the maximum estimated concentration increases (8-hour average) ofHAPs due to the proposed new sources of the Montana and Wyoming Projects are comparedwith a range of state AACLs (EPA 1997) (Table 6.3). The distances from a compressor stationwith the highest HAP emission rates where the potential cancer risks from long-term (70-year)exposures to HAPs would be less than the threshold range of 1 × 10⁻⁶ to 1 × 10⁻⁴ were estimatedunder two cases: an MEI and an MLE condition. These potential cancer risks were estimated byusing the EPA unit risk factors (EPA 2001b). For each case (MEI or MLE), an adjustment factorwas used to account for the duration of exposure to HAPs. If exposure of an MEI is based on100% of the time for the lifetime of a CBM compressor (i.e., 20 years), the adjustment factorwould be 0.29 (20/70 × 1). If it is assumed that an MLE condition consists of 64% of the time ata receptor location (at the maximum predicted concentration) and 36% of the time at a moredistant location (i.e., at 1/4 the maximum predicted concentration) for a total period of 20 years,then the adjustment factor would be 0.21 (i.e., 20/70 × [0.64 × 1 + 0.36 × 0.25]). Since there areno regulatory requirements, the above assessments are provided for information purposes only.
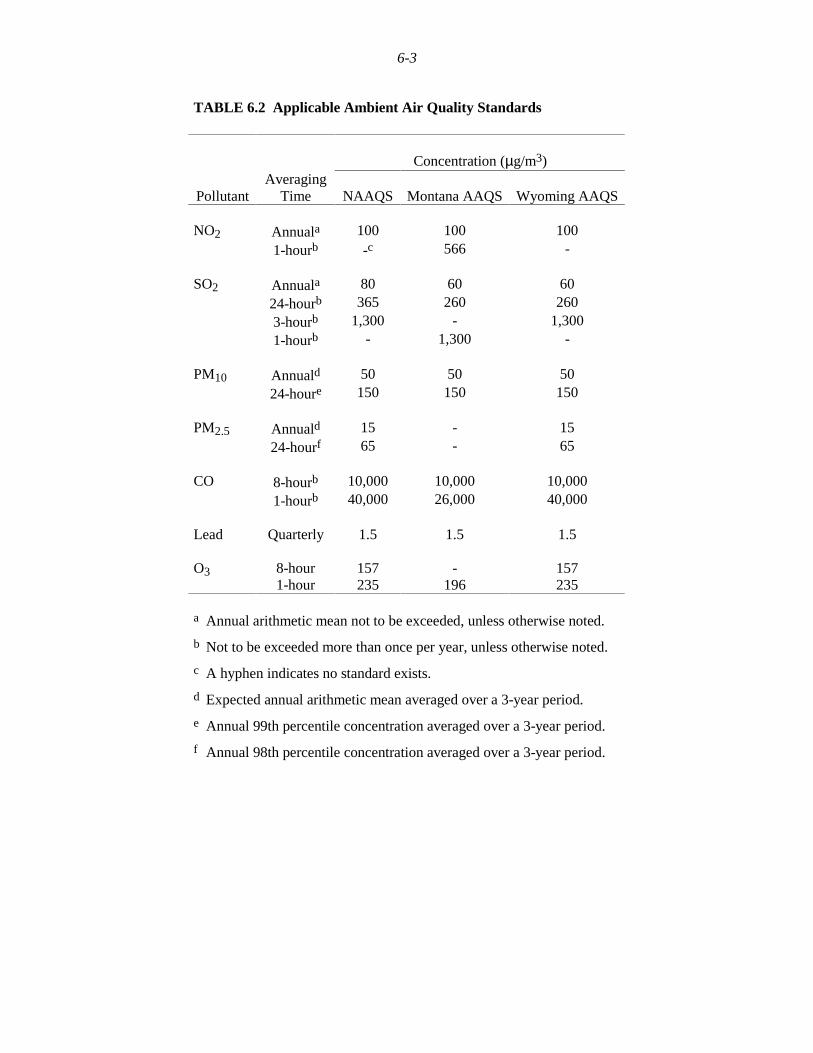
6-3
TABLE 6.2 Applicable Ambient Air Quality Standards
Concentration (µg/m3)
PollutantAveraging
Time NAAQS Montana AAQS Wyoming AAQS
Annuala 100 100 100NO2
1-hourb -c 566 -
Annuala 80 60 6024-hourb 365 260 2603-hourb 1,300 - 1,300
SO2
1-hourb - 1,300 -
Annuald 50 50 50PM10
24-houre 150 150 150
Annuald 15 - 15PM2.5
24-hourf 65 - 65
8-hourb 10,000 10,000 10,000CO1-hourb 40,000 26,000 40,000
Lead Quarterly 1.5 1.5 1.5
8-hour 157 - 157O31-hour 235 196 235
a Annual arithmetic mean not to be exceeded, unless otherwise noted.
b Not to be exceeded more than once per year, unless otherwise noted.
c A hyphen indicates no standard exists.
d Expected annual arithmetic mean averaged over a 3-year period.
e Annual 99th percentile concentration averaged over a 3-year period.
f Annual 98th percentile concentration averaged over a 3-year period.
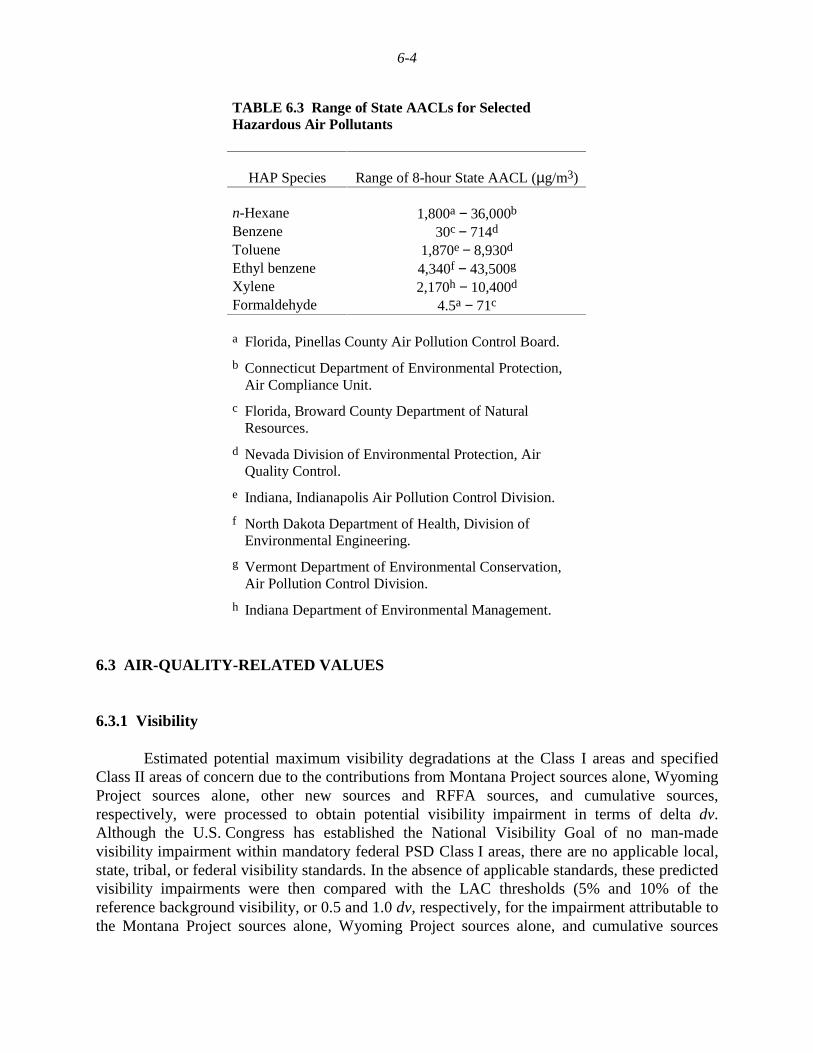
6-4
TABLE 6.3 Range of State AACLs for SelectedHazardous Air Pollutants
HAP Species Range of 8-hour State AACL (µg/m3)
n-Hexane 1,800a − 36,000b
Benzene 30c − 714d
Toluene 1,870e − 8,930d
Ethyl benzene 4,340f − 43,500g
Xylene 2,170h − 10,400d
Formaldehyde 4.5a − 71c
a Florida, Pinellas County Air Pollution Control Board.
b Connecticut Department of Environmental Protection,Air Compliance Unit.
c Florida, Broward County Department of NaturalResources.
d Nevada Division of Environmental Protection, AirQuality Control.
e Indiana, Indianapolis Air Pollution Control Division.
f North Dakota Department of Health, Division ofEnvironmental Engineering.
g Vermont Department of Environmental Conservation,Air Pollution Control Division.
h Indiana Department of Environmental Management.
6.3 AIR-QUALITY-RELATED VALUES
6.3.1 Visibility
Estimated potential maximum visibility degradations at the Class I areas and specifiedClass II areas of concern due to the contributions from Montana Project sources alone, WyomingProject sources alone, other new sources and RFFA sources, and cumulative sources,respectively, were processed to obtain potential visibility impairment in terms of delta dv.Although the U.S. Congress has established the National Visibility Goal of no man-madevisibility impairment within mandatory federal PSD Class I areas, there are no applicable local,state, tribal, or federal visibility standards. In the absence of applicable standards, these predictedvisibility impairments were then compared with the LAC thresholds (5% and 10% of thereference background visibility, or 0.5 and 1.0 dv, respectively, for the impairment attributable tothe Montana Project sources alone, Wyoming Project sources alone, and cumulative sources
6-5
[including both the Montana and Wyoming Project sources and other new sources and RFFAsources]).
Initially, potential visibility impacts were predicted (screened) by using the assumednatural background visibility data presented in Table 4.4 and the reference levels provided by theState of Wyoming. For those locations where predicted visibility impairment would equal orexceed 10% extinction or 1.0 dv, a refined assessment of potential daily optical visibilityimpairment was made by using measured optical conditions in order to determine the magnitude,frequency, and duration of such impairment. (See Appendix A for the procedures to be used topredict visibility impairment.)
6.3.2 Acid Deposition
There are no applicable local, state, tribal or federal standards with respect to aciddeposition. In the absence of applicable standards, predicted increases in acid deposition fluxesand changes in ANC were compared with LAC thresholds recommended by the USDA ForestService.
Estimated annual wet, dry, and total (wet plus dry) deposition fluxes of total sulfur andnitrogen due to the contributions from the Montana Project sources alone, Wyoming Projectsources alone, other new and RFFA sources, and cumulative sources combined, respectively,were compared with LAC thresholds for terrestrial ecosystems (Fox et al. 1989). The LACthreshold values used for terrestrial ecosystems in sensitive areas throughout the modelingdomain were 5 and 3 kg/ha/yr for total sulfur and nitrogen deposition fluxes, respectively(Fox et al. 1989). The LAC thresholds for ANC changes were 10% for lakes with backgroundANC values greater than 25 µeq/L, and no more than a 1 µeq/L change in ANC for lakes withbackground ANC values equal to or less than 25 µeq/L (FS Rocky Mountain Region 2000).

6-6
7-1
7 ASSESSMENT OF POTENTIAL AIR QUALITY AND AQRV IMPACTS
This section presents the modeling results of potential air quality and AQRV impacts ofthe emissions from:
1. Montana Project sources, non-Montana Project sources (Wyoming Projectsources and other new and RFFA sources in the modeling domain), andcumulative sources (Montana and Wyoming Project sources, other new andRFFA sources combined) under the 10 alternative combinations consideredfor the Montana Project EIS (Table 1.3); and
2. Wyoming Project sources, non-Wyoming Project sources (Montana Projectsources and other new and RFFA sources in the modeling domain), andcumulative sources (Wyoming and Montana Project sources, other new andRFFA sources combined) under eight alternative combinations considered forthe Wyoming Project EIS (Table 1.3).
Estimated potential maximum near-field and far-field air quality impacts were comparedwith applicable PSD increments and ambient air quality standards, and potential near-field HAPimpacts were compared with a range of AACLs established by states. Estimated potentialmaximum far-field AQRV (visibility and acid deposition) impacts were compared with relevantLAC thresholds (Section 6).
For the most part, the estimated potential maximum near-field and far-field air qualityimpacts and acid deposition impacts were much lower than the applicable standards or LACthresholds. However, potential maximum far-field visibility impacts estimated by the screeningprocedures exceeded LAC thresholds at most visibility-sensitive receptors for the case ofMontana Project emissions under Alternative A (No Action) and Wyoming Project emissionsunder Alternative 3 (No Action). Thus, potential maximum far-field visibility impacts werefurther estimated by the refined procedure, and the magnitude, frequency, and duration ofpotential daily visibility impairment are presented.
7.1 NON-PROJECT SOURCES
Estimated potential near- and far-field impacts on air quality and AQRV due to non-project sources (new and RFFA sources) are described in Sections 7.2 and 7.3 where appropriate.
7-2
7.2 MONTANA PROJECT SOURCES
7.2.1 Near-Field Impacts
7.2.1.1 Criteria Pollutants
7.2.1.1.1 Emissions from Montana Project, Non-Montana Project, and CumulativeSources. The estimated potential near-field air quality impacts due to the emissions from eachcategory of emission sources under each of the five Montana-Wyoming Alternativecombinations evaluated (Montana Alternatives E, Ea, D, Da, and A, combined with WyomingAlternative 1) are presented in Appendix C.1.1 for the Montana Project sources, non-MontanaProject sources (Wyoming Project sources under Alternative 1 and other new and RFFA sources,excluding those on the IR and FS lands), and cumulative sources. Table 7.1 summarizes theestimated potential maximum near-field impacts of criteria air pollutants due to the emissionsfrom these source categories under five Montana-Wyoming alternative combinations (MontanaAlternatives E, Ea, D, Da, and A, all with Wyoming Project Alternative 1; simply designated asAlternatives E, Ea, D, Da, and A, hereafter). The potential increases in maximum near-fieldconcentrations of criteria pollutants due to the emissions from the Montana Project sources aloneunder all five alternative combinations are estimated to be equal or less than about 9 µg/m3 and102 µg/m3 for annual and 1-hour average NO2, respectively; about 1, 2, 4, and 5 µg/m3 forannual, 24-hour, 3-hour, and 1-hour average SO2, respectively; equal to or less than about4 µg/m3 and 13 µg/m3 for annual and 24-hour average PM10, respectively; equal to or less thanabout 1 µg/m3 and 7 µg/m3 for annual and 24-hour average PM2.5, respectively; and equal to orless than about 77 µg/m3 and 113 µg/m3 for 8-hour and 1-hour average CO, respectively.
Among the five alternative combinations, potential near-field air quality impacts due tothe emissions from the Montana Project sources are highest under Alternative Ea (PreferredAlternative plus well development on the IR and FS lands). Potential maximum near-fieldcriteria pollutant concentration increases due to the emissions from Montana Project sourceemissions are lower than those due to non-Montana source emissions for all SO2, PM10, PM2.5,and CO, but are higher for NO2. Under all alternatives, these concentration increases due to theemissions from the Montana Project sources are less than the maximum allowable PSDincrements for Class II areas and represent percentages equal or less than about 36, 5, and 43%of the maximum allowable Class II PSD increments for NO2, SO2, and PM10, respectively.
Potential maximum near-field criteria pollutant concentration increases for NO2, SO2,and annual PM10 that are due to the emissions from non-Montana Project sources (WyomingProject sources under Alternative 1 and other new and RFFA sources, excluding RFFA sourceson the IR and FS lands) are less than the maximum allowable PSD increments for Class II areasand represent percentages equal to or less than about 20, 11, and 76% of the maximum allowableClass II PSD increments for NO2, SO2, and annual PM10, respectively. The potential maximum
7-3
TABLE 7.1 Estimated Potential Maximum Near-Field Air Quality Impacts Due to Emissions from Montana ProjectSources, Non-Montana Project Sources, and Cumulative Sources under Various Alternative Combinationsa
Maximum Concentration Increase (µg/m3)
Non-Montana ProjectSources Montana Project Sources Cumulative Sources
PSDIncrementfor Class II
CriteriaPollutant
AveragingTime All Alt. Alt. E Alt. Ea Alt. D Alt. Da Alt. A Alt. E Alt. D Alt. A
Area(µg/m3)
Annual 5(20)b
9(36)
9(36)
6(24)
7(28)
2(8)
11(44)
8(32)
6(24)
25NO2
1-hour 181 100 102 50 50 21 207 195 187 -c
Annual 1(5)
0.7(4)
0.7(5)
0.7(4)
0.7(4)
0.3(2)
1(5)
1(5)
1(5)
20
24-hour 10(11)
2(2)
2(2)
2(2)
2(2)
1(1)
11(12)
10(11)
10(11)
91
3-hour 23(4)
4(1)
4(1)
4(1)
4(1)
2(<1)
24(5)
24(5)
23(4)
512
SO2
1-hour 27 5 5 5 5 2 28 28 28 -
Annual 13(76)
4(24)
4(24)
3(18)
3(18)
1(6)
14(82)
14(82)
13(76)
17PM10
24-hourd 104(346)
12(40)
13(43)
11(37)
11(37)
2(7)
107(357)
106(353)
105(350)
30
Annual 6 1 1 1 1 <1 6 6 6 -PM2.524-hourd 44 6 7 4 5 1 46 45 44 -
8-hour 311 74 77 29 30 30 337 320 314 -CO1-hour 540 109 113 48 48 49 548 541 540 -
a Non-Montana Project sources include Wyoming Project sources under Alternative 1 and other new and RFFA sources, excluding RFFA sources onthe IR and FS lands. Cumulative sources include Montana Project sources, Wyoming Project sources under Alternative 1, and other new and RFFAsources, including RFFA sources on the IR and FS lands.
b Values in parentheses are the predicted maximum concentration increases as a percent of the maximum allowable PSD increments for a Class IIarea.
c A hyphen indicates no increment exists.d Concentration increases for 24-hour PM10 and PM2.5 are the second-highest values.
7-4
near-field 24-hour PM10 concentration increase due to the emissions from non-Montana Projectsources is estimated to be about 346% of the maximum allowable Class II PSD increment for the24-hour PM10 concentration, which is primarily due to the emissions from coal mine sources.Excluding emissions from coal mine sources (e.g., Spring Creek Mine), the potential maximumnear-field 24-hour PM10 concentration increase due to the emissions from non-Montana Projectsources is estimated to be about 45% of the maximum allowable Class II PSD increment for the24-hour PM10 concentration. Again, comparisons with PSD increments are made as a generalcomparison; since emissions sources included in this analysis may or may not legally consumePSD increments, this comparison does not represent a regulatory PSD increment consumptionanalysis.
The potential increases in maximum near-field concentrations of criteria pollutants due tothe emissions from cumulative sources (Montana Project sources, Wyoming Project sourcesunder Alternative 1, and other new and RFFA sources, including RFFA sources on the IR andFS lands) under all five alternative combinations (cumulative sources under Alternative Ea areidentical to those under Alternative E, and cumulative sources under Alternative Da are identicalto those under Alternative D) are estimated to be equal or less than about 11 µg/m3 and207 µg/m3 for annual and 1-hour NO2, respectively; equal to or less than 1, 11, 24, and 25 µg/m3
for annual, 24-hour, 3-hour, and 1-hour average SO2, respectively; equal to or less than 14 µg/m3
and 107 µg/m3 for annual and 24-hour average PM10, respectively; equal to or less than 6 µg/m3
and 46 µg/m3 for annual and 24-hour average PM2.5, respectively; and equal to or less than 337µg/m3 and 548 µg/m3 for 8-hour and 1-hour average CO, respectively.
Among the five alternative combinations, potential near-field air quality impacts due tothe emissions from cumulative sources are highest under Alternative E (or Ea). Potentialmaximum near-field criteria concentration increases for NO2, SO2, and annual PM10 that are dueto emissions from cumulative sources are less than the maximum allowable Class II PSDincrements and represent percentages equal to or less than about 44, 28, and 82% of themaximum allowable Class II PSD increments for NO2, SO2, and annual PM10, respectively. Thepotential maximum near-field 24-hour PM10 concentration increase due to the emissions fromcumulative sources is estimated to be about 357% of the maximum allowable Class II PSDincrement for 24-hour PM10, which is primarily due to the emissions from coal mine sources.Excluding the emissions from coal mine sources, the potential maximum near-field 24-hourPM10 concentration increase due to the emissions from cumulative sources is estimated to beabout 85% of the maximum allowable Class II PSD increment for 24-hour PM10.
The estimated potential maximum near-field total concentrations (concentration increasesdue to cumulative source emissions plus background concentrations) of criteria pollutants arecompared with applicable ambient air quality standards (Montana SAAQS [MAAQS] andNAAQS) in Table 7.2. The potential maximum total concentrations are less than applicableMAAQS or NAAQS under all alternative combinations, representing percentages equal or lessthan about 57, 53, 88, 93, and 69% of applicable standards for NO2, SO2, annual PM10, annualPM2.5 and CO, respectively. Potential maximum near-field total concentrations of 24-hour PM10and PM2.5 are estimated to be equal to or less than about 141 and 101% of the applicableMAAQS or NAAQS. Excluding emissions from coal mine sources (e.g., Spring Creek Mine),
7-5
TABLE 7.2 Estimated Potential Maximum Near-Field Total Air Quality Concentrations,Including Contributions from Montana Project Sources and Non-Montana Project Sourcesunder Various Alternative Combinations
Maximum Concentration (µg/m3)
Increase Due toCumulative Sources Total Concentration
CriteriaPollutant
AveragingTime
MontanaBackground Alt. E Alt. D Alt. A Alt. E Alt. D Alt. A
MAAQS(µg/m3)
NAAQS(µg/m3)
Annual 11 11 8 6 22 (22)a
19(19)
17(17)
100 100NO2
1-hour 117 207 195 187 324(57)
312(55)
304(54)
566 - b
Annual 16 0.7 0.7 0.3 17(28)
17(28)
17(28)
60 80
24-hour 73 11 10 10 84(32)
83(32)
83(32)
260 365
3-hour 291 24 24 23 315(24)
315(24)
314(24)
- 1,300
SO2
1-hour 666 28 28 28 694(53)
694(53)
694(53)
1,300 -
Annual 30 14 14 13 44(88)
44(88)
43(88)
50 50PM10
24-hourc 105 107 106 105 212(141)
211(141)
210(140)
150 150
Annual 8 6 6 6 14(93)
14(93)
14(93)
15 15PM2.5
24-hourc 20 46 45 44 66(101)
65(100)
64(98)
65 65
8-hour 6,600 337 320 314 6,937(69)
6,920(69)
6,914(69)
10,000 10,000CO
1-hour 15,000 548 541 540 15,548(60)
15,541(60)
15,540(60)
26,000 40,000
a Values in parentheses are the predicted maximum total concentrations as a percent of MAAQS. Where MAAQS do notexist, NAAQS were used.
b A hyphen indicates no standard exists.
c Concentration increases for 24-hour PM10 and PM2.5 are the second-highest values.
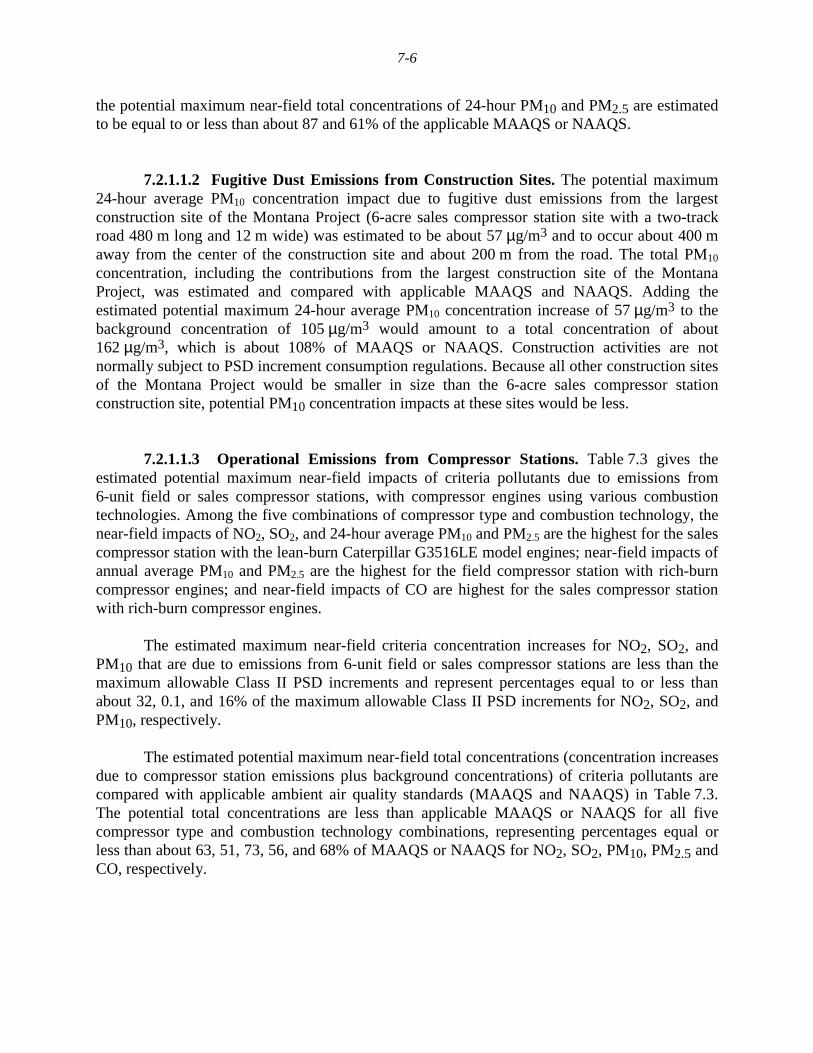
7-6
the potential maximum near-field total concentrations of 24-hour PM10 and PM2.5 are estimatedto be equal to or less than about 87 and 61% of the applicable MAAQS or NAAQS.
7.2.1.1.2 Fugitive Dust Emissions from Construction Sites. The potential maximum24-hour average PM10 concentration impact due to fugitive dust emissions from the largestconstruction site of the Montana Project (6-acre sales compressor station site with a two-trackroad 480 m long and 12 m wide) was estimated to be about 57 µg/m3 and to occur about 400 maway from the center of the construction site and about 200 m from the road. The total PM10
concentration, including the contributions from the largest construction site of the MontanaProject, was estimated and compared with applicable MAAQS and NAAQS. Adding theestimated potential maximum 24-hour average PM10 concentration increase of 57 µg/m3 to thebackground concentration of 105 µg/m3 would amount to a total concentration of about162 µg/m3, which is about 108% of MAAQS or NAAQS. Construction activities are notnormally subject to PSD increment consumption regulations. Because all other construction sitesof the Montana Project would be smaller in size than the 6-acre sales compressor stationconstruction site, potential PM10 concentration impacts at these sites would be less.
7.2.1.1.3 Operational Emissions from Compressor Stations. Table 7.3 gives theestimated potential maximum near-field impacts of criteria pollutants due to emissions from6-unit field or sales compressor stations, with compressor engines using various combustiontechnologies. Among the five combinations of compressor type and combustion technology, thenear-field impacts of NO2, SO2, and 24-hour average PM10 and PM2.5 are the highest for the salescompressor station with the lean-burn Caterpillar G3516LE model engines; near-field impacts ofannual average PM10 and PM2.5 are the highest for the field compressor station with rich-burncompressor engines; and near-field impacts of CO are highest for the sales compressor stationwith rich-burn compressor engines.
The estimated maximum near-field criteria concentration increases for NO2, SO2, andPM10 that are due to emissions from 6-unit field or sales compressor stations are less than themaximum allowable Class II PSD increments and represent percentages equal to or less thanabout 32, 0.1, and 16% of the maximum allowable Class II PSD increments for NO2, SO2, andPM10, respectively.
The estimated potential maximum near-field total concentrations (concentration increasesdue to compressor station emissions plus background concentrations) of criteria pollutants arecompared with applicable ambient air quality standards (MAAQS and NAAQS) in Table 7.3.The potential total concentrations are less than applicable MAAQS or NAAQS for all fivecompressor type and combustion technology combinations, representing percentages equal orless than about 63, 51, 73, 56, and 68% of MAAQS or NAAQS for NO2, SO2, PM10, PM2.5 andCO, respectively.
7-7
TABLE 7.3 Estimated Potential Maximum Near-Field Air Quality Impacts Due to Emissions from the 6-Unit Field and SalesCompressor Station
Maximum Concentration Increase (µg/m3)a
PSD Maximum Concentration (µg/m3)Field Compressor Sales Compressor Increment
CriteriaPollutant
AveragingTime Rich Burn Lean Burn Rich Burn Lean Burn 1b Lean Burn 2c
for Class IIArea
MontanaBackground Totald MAAQS NAAQS
Annual 6.7 (27)e 6.6 (26) 4.1 (16) 7.9 (32) 3.6 (14) 25 11 19 (19) 100 100NO2
1-hour 131 122 171 237 164 -f 117 354 (63) 566 -
Annual < 0.1(< 0.1)
< 0.1(< 0.1)
< 0.1(<0.1)
< 0.1(< 0.1)
< 0.1(< 0.1)
20 16 16 (27) 60 80
24-hour 0.1(0.1)
.1(0.1)
0.1(0.1)
0.3(0.1)
0.1(0.1)
91 73 73 (28) 260 365
3-hour 0.2(< 0.1)
0.2(< 0.1)
0.2(<0.1)
0.3(0.1)
0.2(<0.1)
512 291 291 (22) - 1,300
SO2
1-hour 0.2 0.2 0.3 0.4 0.3 - 666 666 (51) 1,300 -
Annual 0.4 (2) 0.4 (2) 0.2 (1) 0.2 (1) 0.1 (1) 17 30 30 (61) 50 50PM10
24-hour 3.6 (12) 3.8 (13) 4.5 (15) 4.9 (16) 1.5 (5) 30 105 110 (73) 150 150
Annual 0.4 0.4 0.2 0.2 0.1 - 8 8 (56) 15 15PM2.5
24-hour 3.6 3.8 4.5 4.9 1.5 - 20 25 (38) 65 65
8-hour 152 124 210 85 28 - 6,600 6,810 (68) 10,000 10,000CO1-hour 233 163 304 106 44 - 15,000 15,304 (59) 26,000 40,000
a Estimated concentration increases are for a 6-unit compressor station with a total capacity of 2,100 hp and 9,900 hp for field (booster) and sales (reciprocating) compressorstations, respectively.
b Lean-burn Caterpillar G3516LE model.
c Lean-burn Caterpillar G3608 model.
d Values in parentheses are the predicted maximum total concentrations as a percent of MAAQS. Where MAAQS do not exist, NAAOS were used.
e Values in parentheses are the predicted maximum concentration increases as a percent of the maximum allowable PSD increments for a Class II Area.
f A hyphen indicates no increment or standard exists.
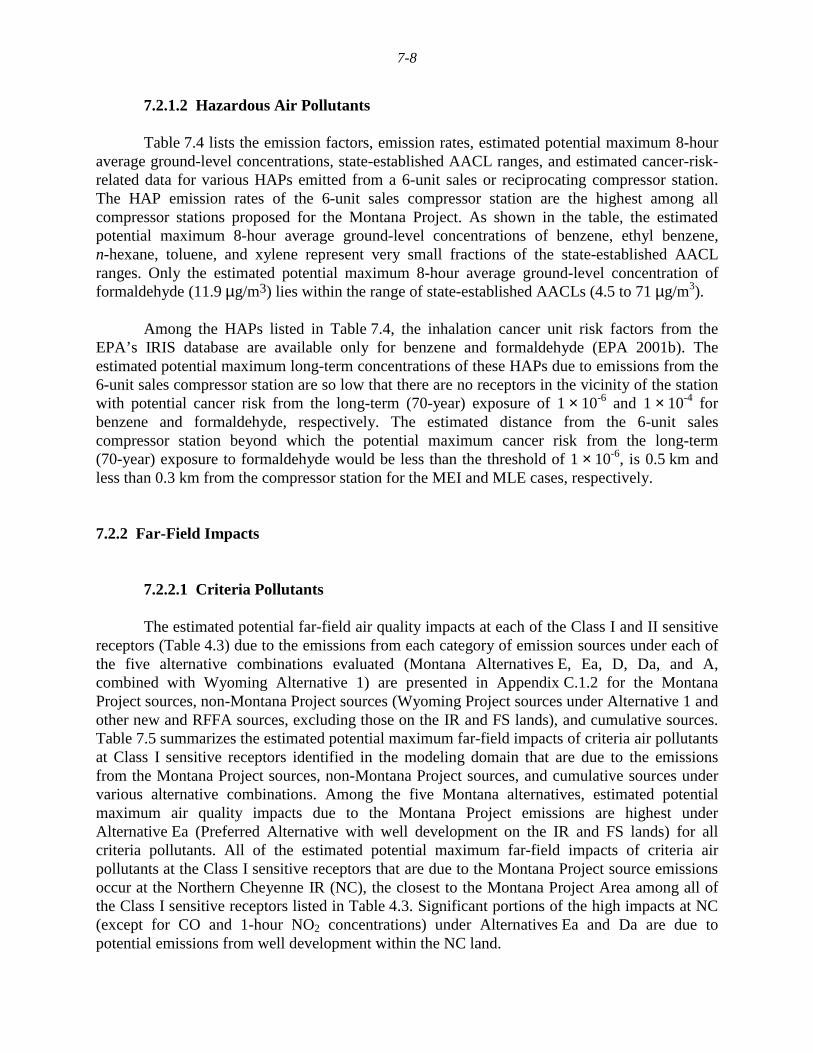
7-8
7.2.1.2 Hazardous Air Pollutants
Table 7.4 lists the emission factors, emission rates, estimated potential maximum 8-houraverage ground-level concentrations, state-established AACL ranges, and estimated cancer-risk-related data for various HAPs emitted from a 6-unit sales or reciprocating compressor station.The HAP emission rates of the 6-unit sales compressor station are the highest among allcompressor stations proposed for the Montana Project. As shown in the table, the estimatedpotential maximum 8-hour average ground-level concentrations of benzene, ethyl benzene,n-hexane, toluene, and xylene represent very small fractions of the state-established AACLranges. Only the estimated potential maximum 8-hour average ground-level concentration offormaldehyde (11.9 µg/m3) lies within the range of state-established AACLs (4.5 to 71 µg/m3).
Among the HAPs listed in Table 7.4, the inhalation cancer unit risk factors from theEPA’s IRIS database are available only for benzene and formaldehyde (EPA 2001b). Theestimated potential maximum long-term concentrations of these HAPs due to emissions from the6-unit sales compressor station are so low that there are no receptors in the vicinity of the stationwith potential cancer risk from the long-term (70-year) exposure of 1 × 10⁻⁶ and 1 × 10⁻⁴ forbenzene and formaldehyde, respectively. The estimated distance from the 6-unit salescompressor station beyond which the potential maximum cancer risk from the long-term(70-year) exposure to formaldehyde would be less than the threshold of 1 × 10⁻⁶, is 0.5 km andless than 0.3 km from the compressor station for the MEI and MLE cases, respectively.
7.2.2 Far-Field Impacts
7.2.2.1 Criteria Pollutants
The estimated potential far-field air quality impacts at each of the Class I and II sensitivereceptors (Table 4.3) due to the emissions from each category of emission sources under each ofthe five alternative combinations evaluated (Montana Alternatives E, Ea, D, Da, and A,combined with Wyoming Alternative 1) are presented in Appendix C.1.2 for the MontanaProject sources, non-Montana Project sources (Wyoming Project sources under Alternative 1 andother new and RFFA sources, excluding those on the IR and FS lands), and cumulative sources.Table 7.5 summarizes the estimated potential maximum far-field impacts of criteria air pollutantsat Class I sensitive receptors identified in the modeling domain that are due to the emissionsfrom the Montana Project sources, non-Montana Project sources, and cumulative sources undervarious alternative combinations. Among the five Montana alternatives, estimated potentialmaximum air quality impacts due to the Montana Project emissions are highest underAlternative Ea (Preferred Alternative with well development on the IR and FS lands) for allcriteria pollutants. All of the estimated potential maximum far-field impacts of criteria airpollutants at the Class I sensitive receptors that are due to the Montana Project source emissionsoccur at the Northern Cheyenne IR (NC), the closest to the Montana Project Area among all ofthe Class I sensitive receptors listed in Table 4.3. Significant portions of the high impacts at NC(except for CO and 1-hour NO2 concentrations) under Alternatives Ea and Da are due topotential emissions from well development within the NC land.
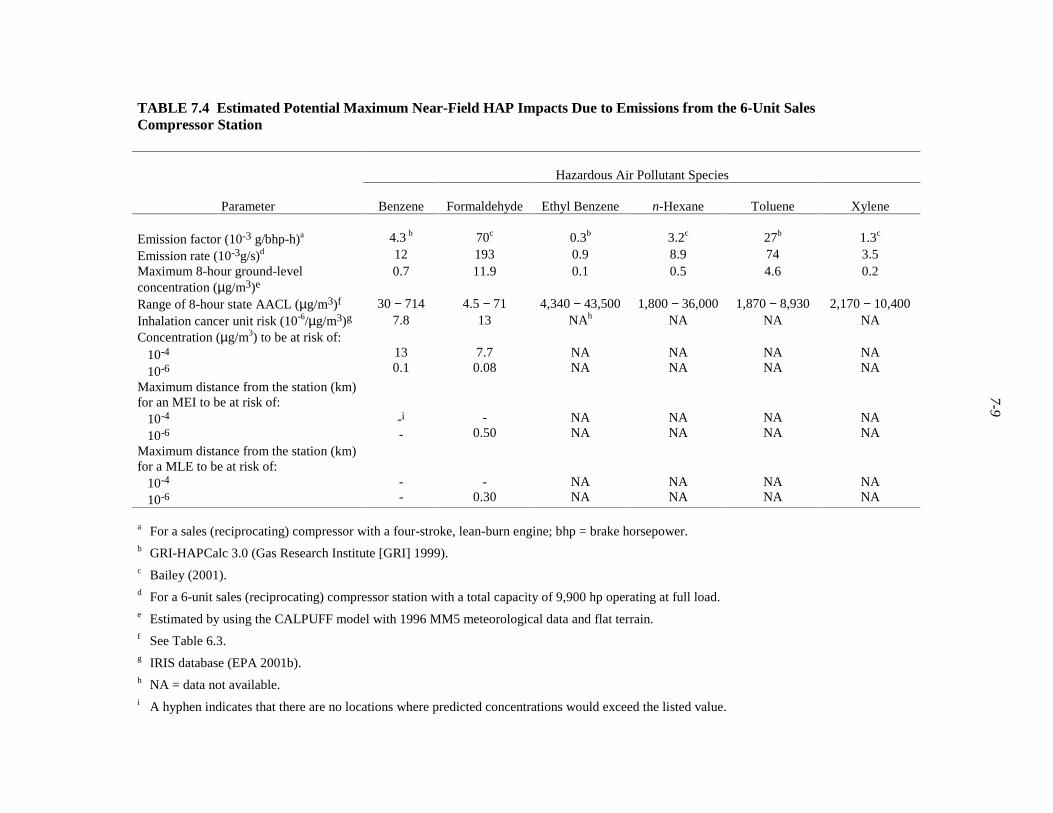
7-9
TABLE 7.4 Estimated Potential Maximum Near-Field HAP Impacts Due to Emissions from the 6-Unit SalesCompressor Station
Hazardous Air Pollutant Species
Parameter Benzene Formaldehyde Ethyl Benzene n-Hexane Toluene Xylene
Emission factor (10-3 g/bhp-h)a 4.3 b 70c 0.3b 3.2c 27b 1.3c
Emission rate (10-3g/s)d 12 193 0.9 8.9 74 3.5Maximum 8-hour ground-levelconcentration (µg/m3)e
0.7 11.9 0.1 0.5 4.6 0.2
Range of 8-hour state AACL (µg/m3)f 30 − 714 4.5 − 71 4,340 − 43,500 1,800 − 36,000 1,870 − 8,930 2,170 − 10,400Inhalation cancer unit risk (10-6/µg/m3)g 7.8 13 NAh NA NA NAConcentration (µg/m3) to be at risk of: 10-4
10-6
130.1
7.70.08
NANA
NANA
NANA
NANA
Maximum distance from the station (km)for an MEI to be at risk of: 10-4
10-6-i
--
0.50NANA
NANA
NANA
NANA
Maximum distance from the station (km)for a MLE to be at risk of: 10-4
10-6--
-0.30
NANA
NANA
NANA
NANA
a For a sales (reciprocating) compressor with a four-stroke, lean-burn engine; bhp = brake horsepower.b GRI-HAPCalc 3.0 (Gas Research Institute [GRI] 1999).c Bailey (2001).d For a 6-unit sales (reciprocating) compressor station with a total capacity of 9,900 hp operating at full load.e Estimated by using the CALPUFF model with 1996 MM5 meteorological data and flat terrain.f See Table 6.3.g IRIS database (EPA 2001b).h NA = data not available.i A hyphen indicates that there are no locations where predicted concentrations would exceed the listed value.
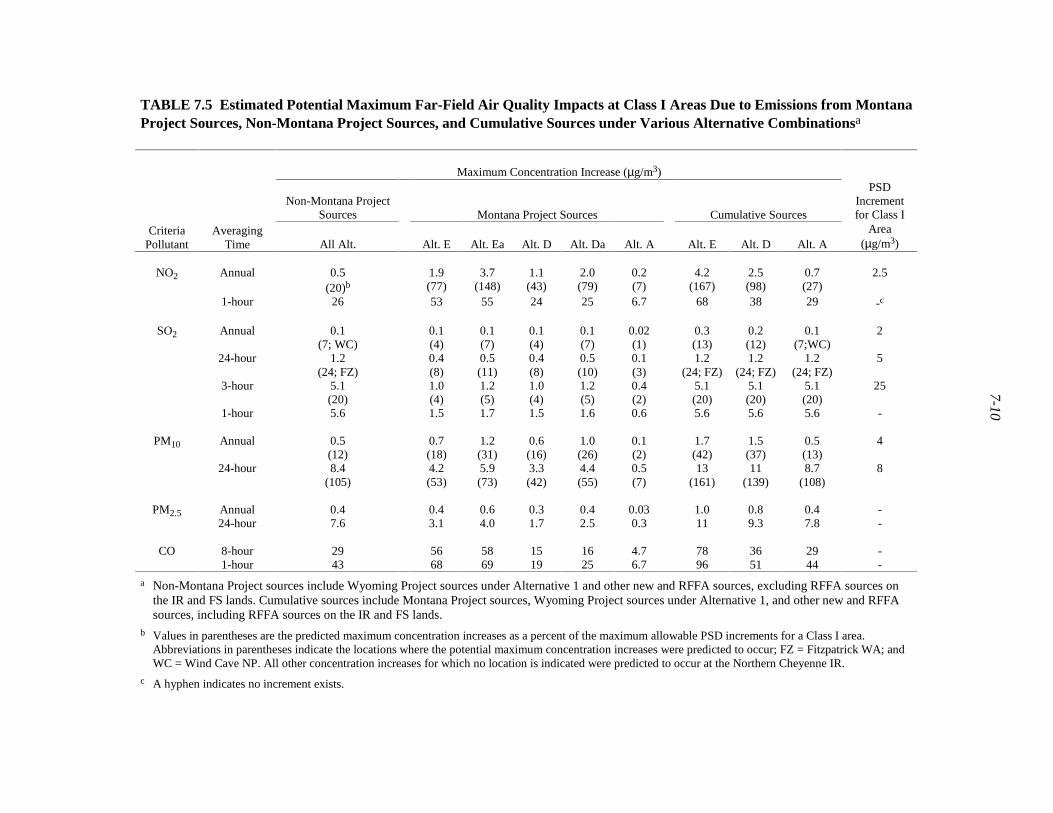
7-10
TABLE 7.5 Estimated Potential Maximum Far-Field Air Quality Impacts at Class I Areas Due to Emissions from MontanaProject Sources, Non-Montana Project Sources, and Cumulative Sources under Various Alternative Combinationsa
Maximum Concentration Increase (µg/m3)
Non-Montana ProjectSources Montana Project Sources Cumulative Sources
PSDIncrementfor Class I
CriteriaPollutant
AveragingTime All Alt. Alt. E Alt. Ea Alt. D Alt. Da Alt. A Alt. E Alt. D Alt. A
Area(µg/m3)
Annual 0.5(20)b
1.9(77)
3.7(148)
1.1(43)
2.0(79)
0.2(7)
4.2(167)
2.5(98)
0.7(27)
2.5NO2
1-hour 26 53 55 24 25 6.7 68 38 29 -c
Annual 0.1(7; WC)
0.1(4)
0.1(7)
0.1(4)
0.1(7)
0.02(1)
0.3(13)
0.2(12)
0.1(7;WC)
2
24-hour 1.2(24; FZ)
0.4(8)
0.5(11)
0.4(8)
0.5(10)
0.1(3)
1.2(24; FZ)
1.2(24; FZ)
1.2(24; FZ)
5
3-hour 5.1(20)
1.0(4)
1.2(5)
1.0(4)
1.2(5)
0.4(2)
5.1(20)
5.1(20)
5.1(20)
25
SO2
1-hour 5.6 1.5 1.7 1.5 1.6 0.6 5.6 5.6 5.6 -
Annual 0.5(12)
0.7(18)
1.2(31)
0.6(16)
1.0(26)
0.1(2)
1.7(42)
1.5(37)
0.5(13)
4PM10
24-hour 8.4(105)
4.2(53)
5.9(73)
3.3(42)
4.4(55)
0.5(7)
13(161)
11(139)
8.7(108)
8
Annual 0.4 0.4 0.6 0.3 0.4 0.03 1.0 0.8 0.4 -PM2.524-hour 7.6 3.1 4.0 1.7 2.5 0.3 11 9.3 7.8 -
8-hour 29 56 58 15 16 4.7 78 36 29 -CO1-hour 43 68 69 19 25 6.7 96 51 44 -
a Non-Montana Project sources include Wyoming Project sources under Alternative 1 and other new and RFFA sources, excluding RFFA sources onthe IR and FS lands. Cumulative sources include Montana Project sources, Wyoming Project sources under Alternative 1, and other new and RFFAsources, including RFFA sources on the IR and FS lands.
b Values in parentheses are the predicted maximum concentration increases as a percent of the maximum allowable PSD increments for a Class I area.Abbreviations in parentheses indicate the locations where the potential maximum concentration increases were predicted to occur; FZ = Fitzpatrick WA; andWC = Wind Cave NP. All other concentration increases for which no location is indicated were predicted to occur at the Northern Cheyenne IR.
c A hyphen indicates no increment exists.
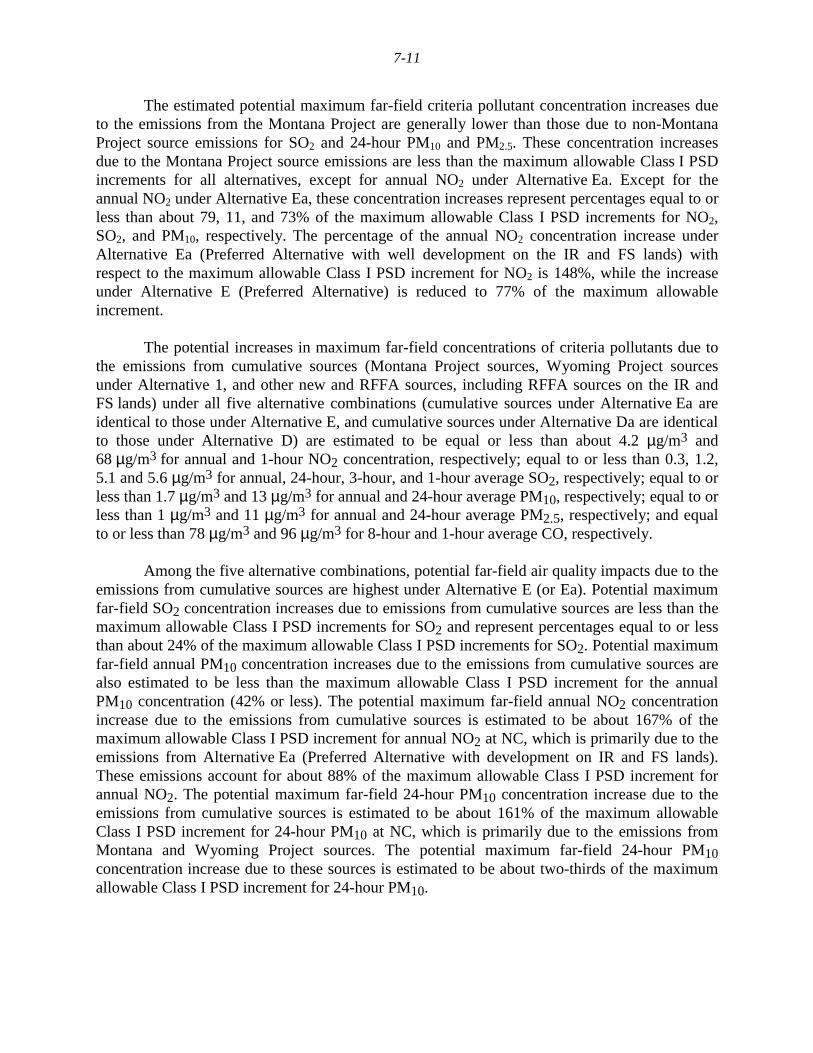
7-11
The estimated potential maximum far-field criteria pollutant concentration increases dueto the emissions from the Montana Project are generally lower than those due to non-MontanaProject source emissions for SO2 and 24-hour PM10 and PM2.5. These concentration increasesdue to the Montana Project source emissions are less than the maximum allowable Class I PSDincrements for all alternatives, except for annual NO2 under Alternative Ea. Except for theannual NO2 under Alternative Ea, these concentration increases represent percentages equal to orless than about 79, 11, and 73% of the maximum allowable Class I PSD increments for NO2,SO2, and PM10, respectively. The percentage of the annual NO2 concentration increase underAlternative Ea (Preferred Alternative with well development on the IR and FS lands) withrespect to the maximum allowable Class I PSD increment for NO2 is 148%, while the increaseunder Alternative E (Preferred Alternative) is reduced to 77% of the maximum allowableincrement.
The potential increases in maximum far-field concentrations of criteria pollutants due tothe emissions from cumulative sources (Montana Project sources, Wyoming Project sourcesunder Alternative 1, and other new and RFFA sources, including RFFA sources on the IR andFS lands) under all five alternative combinations (cumulative sources under Alternative Ea areidentical to those under Alternative E, and cumulative sources under Alternative Da are identicalto those under Alternative D) are estimated to be equal or less than about 4.2 µg/m3 and68 µg/m3 for annual and 1-hour NO2 concentration, respectively; equal to or less than 0.3, 1.2,5.1 and 5.6 µg/m3 for annual, 24-hour, 3-hour, and 1-hour average SO2, respectively; equal to orless than 1.7 µg/m3 and 13 µg/m3 for annual and 24-hour average PM10, respectively; equal to orless than 1 µg/m3 and 11 µg/m3 for annual and 24-hour average PM2.5, respectively; and equalto or less than 78 µg/m3 and 96 µg/m3 for 8-hour and 1-hour average CO, respectively.
Among the five alternative combinations, potential far-field air quality impacts due to theemissions from cumulative sources are highest under Alternative E (or Ea). Potential maximumfar-field SO2 concentration increases due to emissions from cumulative sources are less than themaximum allowable Class I PSD increments for SO2 and represent percentages equal to or lessthan about 24% of the maximum allowable Class I PSD increments for SO2. Potential maximumfar-field annual PM10 concentration increases due to the emissions from cumulative sources arealso estimated to be less than the maximum allowable Class I PSD increment for the annualPM10 concentration (42% or less). The potential maximum far-field annual NO2 concentrationincrease due to the emissions from cumulative sources is estimated to be about 167% of themaximum allowable Class I PSD increment for annual NO2 at NC, which is primarily due to theemissions from Alternative Ea (Preferred Alternative with development on IR and FS lands).These emissions account for about 88% of the maximum allowable Class I PSD increment forannual NO2. The potential maximum far-field 24-hour PM10 concentration increase due to theemissions from cumulative sources is estimated to be about 161% of the maximum allowableClass I PSD increment for 24-hour PM10 at NC, which is primarily due to the emissions fromMontana and Wyoming Project sources. The potential maximum far-field 24-hour PM10concentration increase due to these sources is estimated to be about two-thirds of the maximumallowable Class I PSD increment for 24-hour PM10.
7-12
The estimated potential maximum far-field impacts of criteria air pollutants at theClass II sensitive receptors identified in the modeling domain that are due to the emissions fromthe Montana Project sources, non-Montana Project sources, and cumulative sources aresummarized in Table 7.6 for various alternative combinations. Among the five alternatives, theestimated potential maximum air quality impacts due to Montana Project emissions are highestunder Alternative Ea (Preferred Alternative with well development on the IR and FS lands) forall criteria pollutants. The estimated potential maximum far-field impacts of criteria airpollutants at the Class II sensitive receptors that are due to the Montana Project source emissionsoccur at the Crow IR (CR), the closest to the Montana Project Area among all of the Class IIsensitive receptors listed in Table 4.3.
The estimated potential maximum far-field criteria pollutant concentration increases dueto Montana Project emissions are lower than those due to non-Montana Project source emissionsfor all criteria pollutants, except for the annual NO2 (under Alternatives E, Ea, D, and Da),1-hour NO2 (under Alternatives E and Ea) and 8-hour CO (under Alternative Ea). Theseconcentration increases due to Montana Project emissions are only small fractions of themaximum allowable PSD increments for Class II under all alternatives, representing percentagesequal to or less than about 19, 2, and 27% of the maximum allowable Class II PSD incrementsfor NO2, SO2, and PM10, respectively.
Potential maximum far-field criteria concentration increases for NO2, SO2, and PM10that are due to emissions from cumulative sources are less than the maximum allowable Class IIPSD increments and represent percentages equal to or less than about 22, 6, and 99% of themaximum allowable Class II PSD increments for NO2, SO2, and PM10, respectively.
The estimated potential maximum far-field total concentrations (concentration increasesdue to cumulative source emissions plus baseline concentrations) of criteria pollutants arecompared with applicable ambient air quality standards (MAAQS and NAAQS) in Table 7.7.The estimated potential maximum total concentrations are less than the applicable MAAQS orNAAQS under all alternative combinations, representing percentages equal to or less than about34, 54, 90, 62, and 67% of the applicable ambient standards for NO2, SO2, PM10, PM2.5 and CO,respectively.
7.2.2.2 Visibility
The potential far-field visibility impacts due to the emissions from the followingemissions source categories were estimated by the screening and refined procedures(Appendix A) at each of the Class I and Class II sensitive receptors (Table 4.3) for each of the10 alternative combinations (Montana Alternatives E, Ea, D, Da, and A, combined withWyoming Alternative 1 or 3):
• Non-project sources (new and RFFA sources, excluding the RFFA sources onthe IR and FS lands),
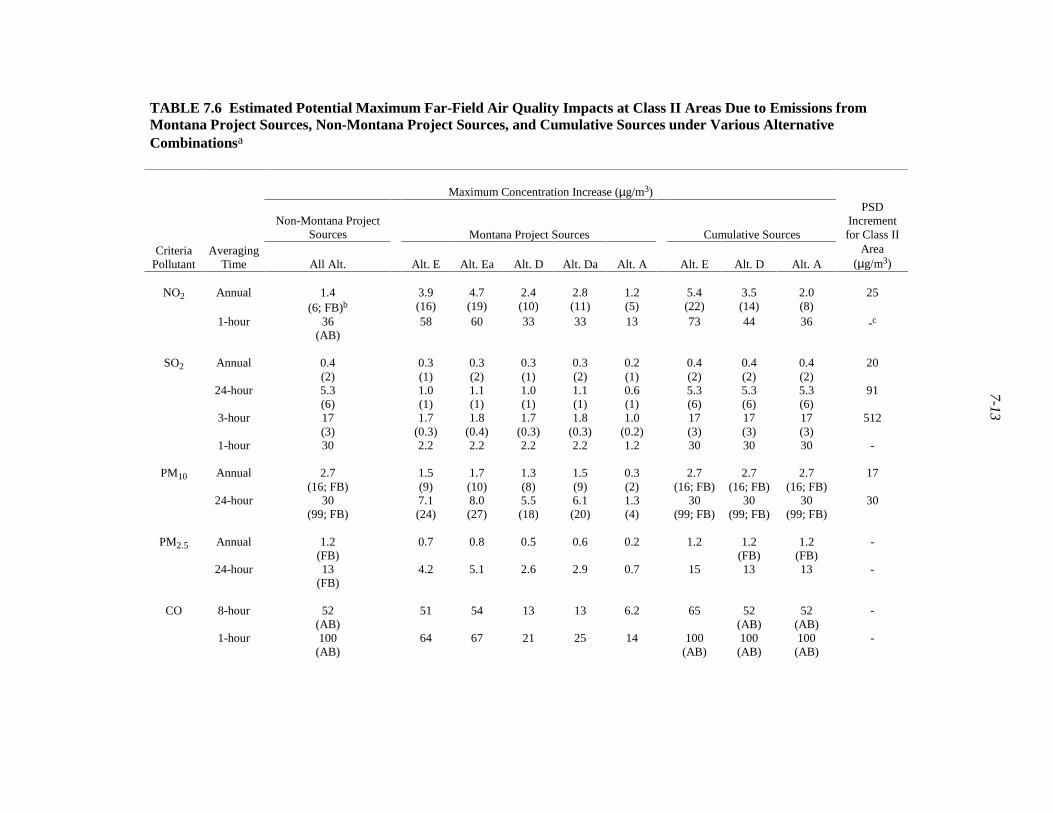
7-13
TABLE 7.6 Estimated Potential Maximum Far-Field Air Quality Impacts at Class II Areas Due to Emissions fromMontana Project Sources, Non-Montana Project Sources, and Cumulative Sources under Various AlternativeCombinationsa
Maximum Concentration Increase (µg/m3)
Non-Montana ProjectSources Montana Project Sources Cumulative Sources
PSDIncrementfor Class II
CriteriaPollutant
AveragingTime All Alt. Alt. E Alt. Ea Alt. D Alt. Da Alt. A Alt. E Alt. D Alt. A
Area(µg/m3)
Annual 1.4(6; FB)b
3.9(16)
4.7(19)
2.4(10)
2.8(11)
1.2(5)
5.4(22)
3.5(14)
2.0(8)
25NO2
1-hour 36(AB)
58 60 33 33 13 73 44 36 -c
Annual 0.4(2)
0.3(1)
0.3(2)
0.3(1)
0.3(2)
0.2(1)
0.4(2)
0.4(2)
0.4(2)
20
24-hour 5.3(6)
1.0(1)
1.1(1)
1.0(1)
1.1(1)
0.6(1)
5.3(6)
5.3(6)
5.3(6)
91
3-hour 17(3)
1.7(0.3)
1.8(0.4)
1.7(0.3)
1.8(0.3)
1.0(0.2)
17(3)
17(3)
17(3)
512
SO2
1-hour 30 2.2 2.2 2.2 2.2 1.2 30 30 30 -
Annual 2.7(16; FB)
1.5(9)
1.7(10)
1.3(8)
1.5(9)
0.3(2)
2.7(16; FB)
2.7(16; FB)
2.7(16; FB)
17PM10
24-hour 30(99; FB)
7.1(24)
8.0(27)
5.5(18)
6.1(20)
1.3(4)
30(99; FB)
30(99; FB)
30(99; FB)
30
Annual 1.2(FB)
0.7 0.8 0.5 0.6 0.2 1.2 1.2(FB)
1.2(FB)
-PM2.5
24-hour 13(FB)
4.2 5.1 2.6 2.9 0.7 15 13 13 -
8-hour 52(AB)
51 54 13 13 6.2 65 52(AB)
52(AB)
-CO
1-hour 100(AB)
64 67 21 25 14 100(AB)
100(AB)
100(AB)
-

7-14
TABLE 7.6 (Cont.)
a Non-Montana Project sources include Wyoming Project sources under Alternative 1 and other new and RFFA sources, excluding RFFA sourceson the IR and FS lands. Cumulative sources include Montana Project sources, Wyoming Project sources under Alternative 1, and other new andRFFA sources, including RFFA sources on the IR and FS lands.
b Values in parentheses are the predicted maximum concentration increases as a percent of the maximum allowable PSD increments for a Class II area.Abbreviations in parentheses indicate the locations where the potential maximum concentration increases were predicted to occur; AB = Absaroka-Beartooth WA; and FB = Fort Belknap IR. All other concentration increases for which no locations are indicated were predicted to occur at the Crow IR.
c A hyphen indicates no increment exists.
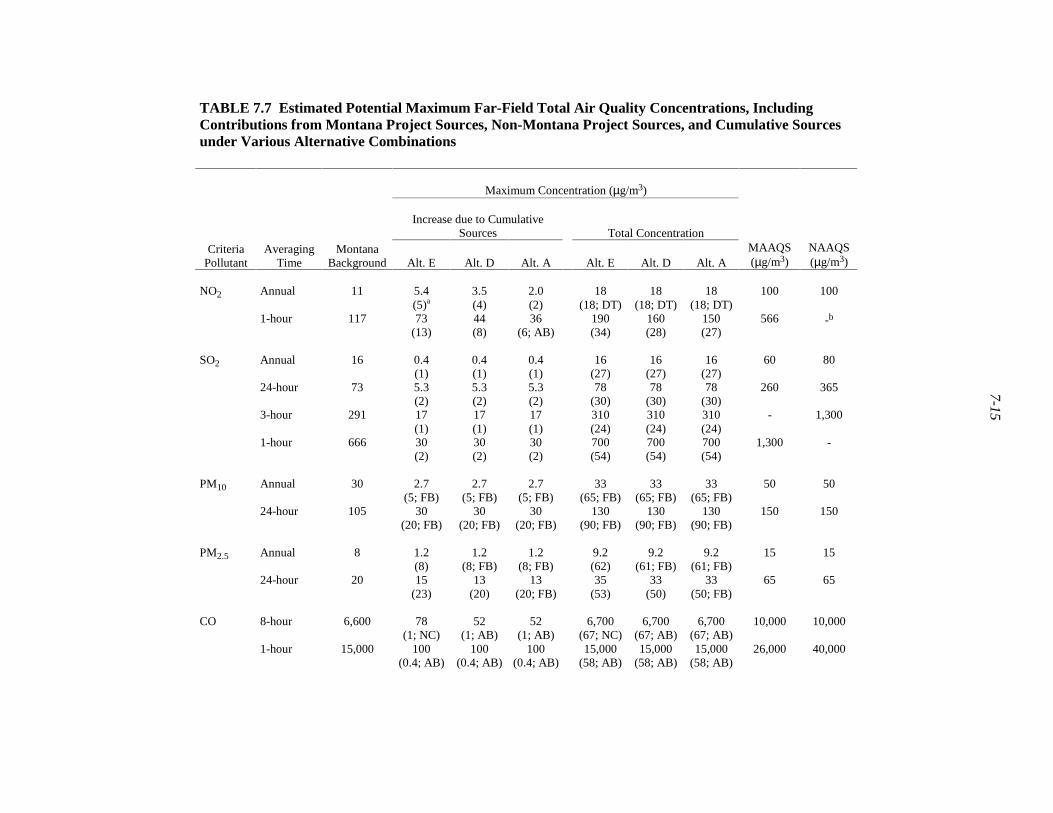
7-15
TABLE 7.7 Estimated Potential Maximum Far-Field Total Air Quality Concentrations, IncludingContributions from Montana Project Sources, Non-Montana Project Sources, and Cumulative Sourcesunder Various Alternative Combinations
Maximum Concentration (µg/m3)
Increase due to CumulativeSources Total Concentration
CriteriaPollutant
AveragingTime
MontanaBackground Alt. E Alt. D Alt. A Alt. E Alt. D Alt. A
MAAQS(µg/m3)
NAAQS(µg/m3)
Annual 11 5.4(5)a
3.5(4)
2.0(2)
18(18; DT)
18(18; DT)
18(18; DT)
100 100NO2
1-hour 117 73(13)
44(8)
36(6; AB)
190(34)
160(28)
150(27)
566 -b
Annual 16 0.4(1)
0.4(1)
0.4(1)
16(27)
16(27)
16(27)
60 80
24-hour 73 5.3(2)
5.3(2)
5.3(2)
78(30)
78(30)
78(30)
260 365
3-hour 291 17(1)
17(1)
17(1)
310(24)
310(24)
310(24)
- 1,300
SO2
1-hour 666 30(2)
30(2)
30(2)
700(54)
700(54)
700(54)
1,300 -
PM10 Annual 30 2.7(5; FB)
2.7(5; FB)
2.7(5; FB)
33(65; FB)
33(65; FB)
33(65; FB)
50 50
24-hour 105 30(20; FB)
30(20; FB)
30(20; FB)
130(90; FB)
130(90; FB)
130(90; FB)
150 150
PM2.5 Annual 8 1.2(8)
1.2(8; FB)
1.2(8; FB)
9.2(62)
9.2(61; FB)
9.2(61; FB)
15 15
24-hour 20 15(23)
13(20)
13(20; FB)
35(53)
33(50)
33(50; FB)
65 65
CO 8-hour 6,600 78(1; NC)
52(1; AB)
52(1; AB)
6,700(67; NC)
6,700(67; AB)
6,700(67; AB)
10,000 10,000
1-hour 15,000 100(0.4; AB)
100(0.4; AB)
100(0.4; AB)
15,000(58; AB)
15,000(58; AB)
15,000(58; AB)
26,000 40,000
7-16
TABLE 7.7 (Cont.)
a Values in parentheses are the predicted maximum concentrations as a percent of the AAQS of the state where the receptor is located.Abbreviations in parentheses indicate the locations where the potential maximum concentration increases were predicted to occur;AB = Absaroka-Beartooth WA; DT = Devils Tower NM; FB = Fort Belknap IR; and NC = Northern Cheyenne IR. All otherconcentration increases for which no locations are indicated were predicted to occur at the Crow IR.
b A hyphen indicates no standard exists.
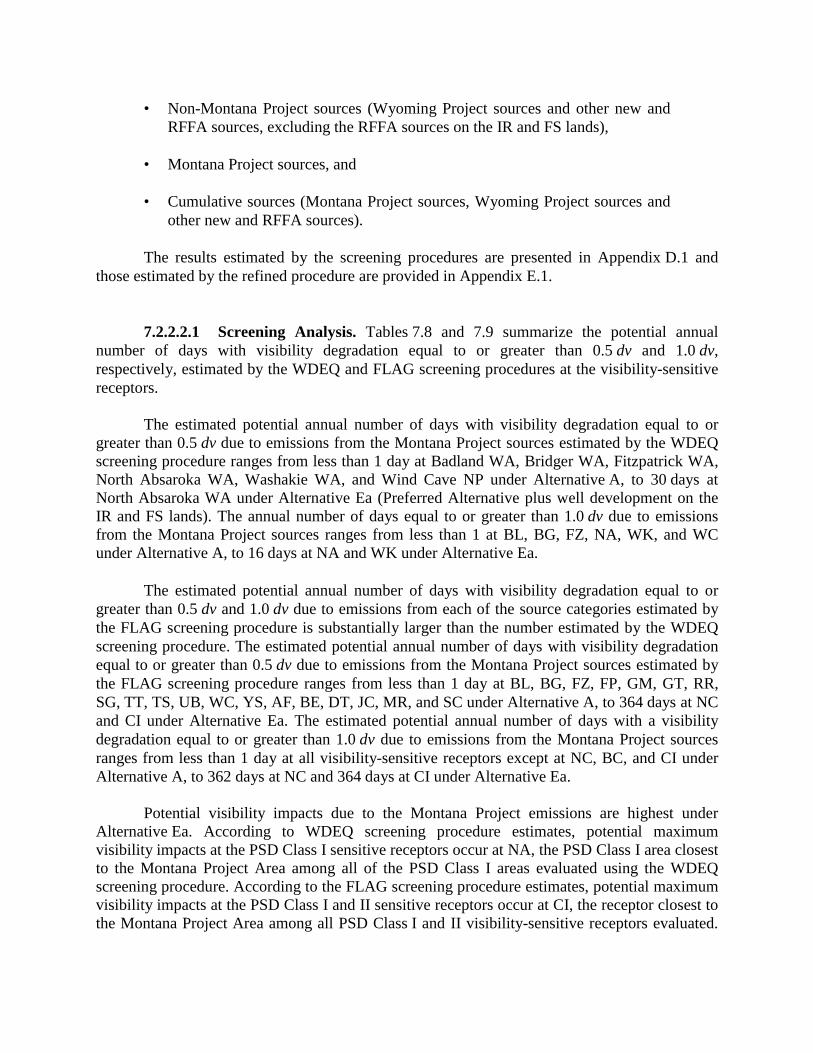
• Non-Montana Project sources (Wyoming Project sources and other new andRFFA sources, excluding the RFFA sources on the IR and FS lands),
• Montana Project sources, and
• Cumulative sources (Montana Project sources, Wyoming Project sources andother new and RFFA sources).
The results estimated by the screening procedures are presented in Appendix D.1 andthose estimated by the refined procedure are provided in Appendix E.1.
7.2.2.2.1 Screening Analysis. Tables 7.8 and 7.9 summarize the potential annualnumber of days with visibility degradation equal to or greater than 0.5 dv and 1.0 dv,respectively, estimated by the WDEQ and FLAG screening procedures at the visibility-sensitivereceptors.
The estimated potential annual number of days with visibility degradation equal to orgreater than 0.5 dv due to emissions from the Montana Project sources estimated by the WDEQscreening procedure ranges from less than 1 day at Badland WA, Bridger WA, Fitzpatrick WA,North Absaroka WA, Washakie WA, and Wind Cave NP under Alternative A, to 30 days atNorth Absaroka WA under Alternative Ea (Preferred Alternative plus well development on theIR and FS lands). The annual number of days equal to or greater than 1.0 dv due to emissionsfrom the Montana Project sources ranges from less than 1 at BL, BG, FZ, NA, WK, and WCunder Alternative A, to 16 days at NA and WK under Alternative Ea.
The estimated potential annual number of days with visibility degradation equal to orgreater than 0.5 dv and 1.0 dv due to emissions from each of the source categories estimated bythe FLAG screening procedure is substantially larger than the number estimated by the WDEQscreening procedure. The estimated potential annual number of days with visibility degradationequal to or greater than 0.5 dv due to emissions from the Montana Project sources estimated bythe FLAG screening procedure ranges from less than 1 day at BL, BG, FZ, FP, GM, GT, RR,SG, TT, TS, UB, WC, YS, AF, BE, DT, JC, MR, and SC under Alternative A, to 364 days at NCand CI under Alternative Ea. The estimated potential annual number of days with a visibilitydegradation equal to or greater than 1.0 dv due to emissions from the Montana Project sourcesranges from less than 1 day at all visibility-sensitive receptors except at NC, BC, and CI underAlternative A, to 362 days at NC and 364 days at CI under Alternative Ea.
Potential visibility impacts due to the Montana Project emissions are highest underAlternative Ea. According to WDEQ screening procedure estimates, potential maximumvisibility impacts at the PSD Class I sensitive receptors occur at NA, the PSD Class I area closestto the Montana Project Area among all of the PSD Class I areas evaluated using the WDEQscreening procedure. According to the FLAG screening procedure estimates, potential maximumvisibility impacts at the PSD Class I and II sensitive receptors occur at CI, the receptor closest tothe Montana Project Area among all PSD Class I and II visibility-sensitive receptors evaluated.
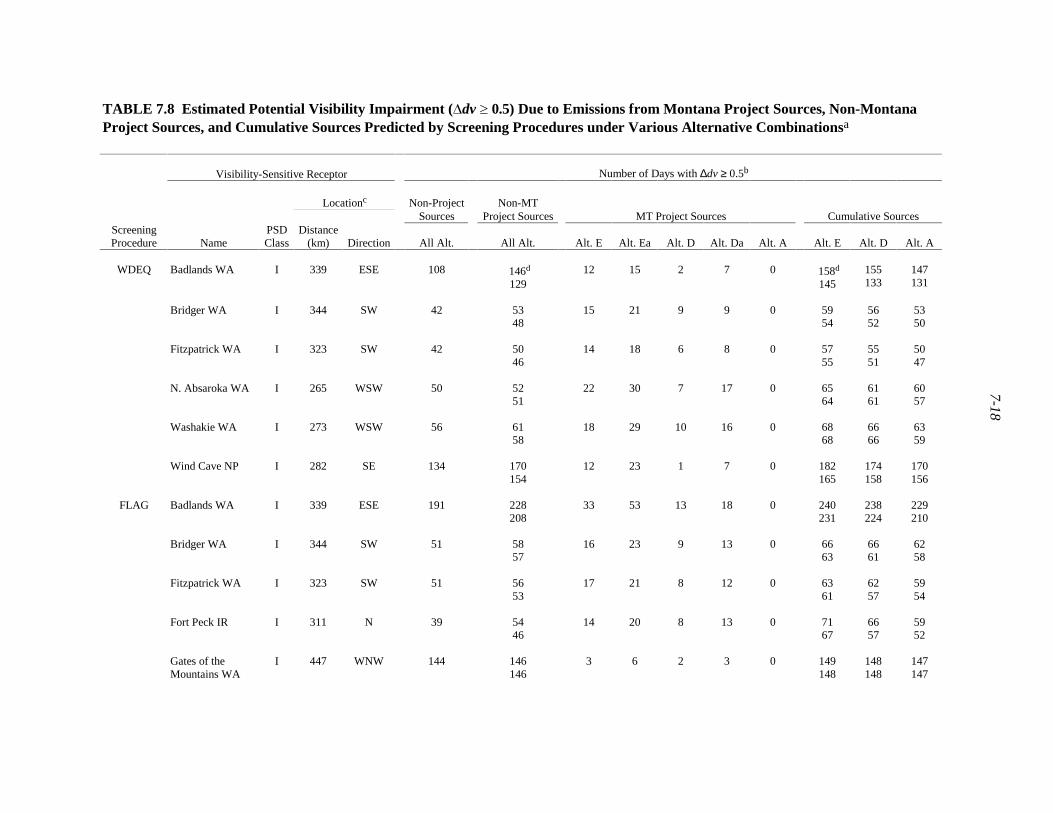
7-18
TABLE 7.8 Estimated Potential Visibility Impairment (�dv � 0.5) Due to Emissions from Montana Project Sources, Non-MontanaProject Sources, and Cumulative Sources Predicted by Screening Procedures under Various Alternative Combinationsa
Visibility-Sensitive Receptor Number of Days with ∆dv ≥ 0.5b
Locationc Non-Project Non-MTSources Project Sources MT Project Sources Cumulative Sources
ScreeningProcedure Name
PSDClass
Distance(km) Direction All Alt. All Alt. Alt. E Alt. Ea Alt. D Alt. Da Alt. A Alt. E Alt. D Alt. A
Badlands WA I 339 ESE 108 146d
12912 15 2 7 0 158d
145155133
147131
Bridger WA I 344 SW 42 5348
15 21 9 9 0 5954
5652
5350
Fitzpatrick WA I 323 SW 42 5046
14 18 6 8 0 5755
5551
5047
N. Absaroka WA I 265 WSW 50 5251
22 30 7 17 0 6564
6161
6057
Washakie WA I 273 WSW 56 6158
18 29 10 16 0 6868
6666
6359
WDEQ
Wind Cave NP I 282 SE 134 170154
12 23 1 7 0 182165
174158
170156
FLAG Badlands WA I 339 ESE 191 228208
33 53 13 18 0 240231
238224
229210
Bridger WA I 344 SW 51 5857
16 23 9 13 0 6663
6661
6258
Fitzpatrick WA I 323 SW 51 5653
17 21 8 12 0 6361
6257
5954
Fort Peck IR I 311 N 39 5446
14 20 8 13 0 7167
6657
5952
Gates of theMountains WA
I 447 WNW 144 146146
3 6 2 3 0 149148
148148
147147
7-19
TABLE 7.8 (Cont.)
Visibility-Sensitive Receptor Number of Days with ∆dv ≥ 0.5b
Locationc Non-Project Non-MTSources Project Sources MT Project Sources Cumulative Sources
ScreeningProcedure Name
PSDClass
Distance(km) Direction All Alt. All Alt. Alt. E Alt. Ea Alt. D Alt. Da Alt. A Alt. E Alt. D Alt. A
FLAG(Cont.)
Grand Teton NP I 368 WSW 24 32d
2610 13 4 8 0 35d
323431
3227
N. Absaroka WA I 265 WSW 68 7368
28 39 18 26 2 8988
8481
7875
N. Cheyenne IR I 45 NW 332 333332
363 364 362 364 95 364364
364364
338337
Red Rock LakesWA
I 419 W 30 3631
1 5 0 0 0 3837
3836
3736
Scapegoat WA I 518 WNW 51 5251
4 4 2 2 0 5656
5554
5352
Teton WA I 314 WSW 46 49d
4715 20 9 12 0 58
575554
5047
T. Roosevelt NP-North
I 337 NE 44 6252
21 27 8 14 1 8368
7565
6756
T. Roosevelt NP-South
I 283 NE 82 10090
32 43 21 29 0 117110
113105
10692
UL Bend WA I 283 NNW 81 9082
22 24 7 20 0 103101
10196
9486
Washakie WA I 273 WSW 68 7472
24 38 18 21 3 8382
8079
7774
Wind Cave NP I 282 SE 235 253241
32 44 14 21 0 265255
262250
254245
Yellowstone NP I 323 W 72 7573
23 28 11 17 0 8382
8382
8179
7-20
TABLE 7.8 (Cont.)
Visibility-Sensitive Receptor Number of Days with ∆dv ≥ 0.5b
Locationc Non-Project Non-MTSources Project Sources MT Project Sources Cumulative Sources
ScreeningProcedure Name
PSDClass
Distance(km) Direction All Alt. All Alt. Alt. E Alt. Ea Alt. D Alt. Da Alt. A Alt. E Alt. D Alt. A
FLAG(Cont.)
Absaroka-Beartooth WA
II 284 W 175 175d
17544 47 28 30 3 178d
178178178
177177
Agate Fossil BedsNM
II 359 SE 193 213202
24 32 5 10 0 221211
216209
215203
Bighorn CanyonNRA
II 139 W 249 253251
69 94 52 69 11 269269
266266
259259
Black Elk WA II 259 ESE 229 259243
33 43 15 18 0 268260
266255
261248
Cloud Peak WA II 109 SW 115 144130
78 97 62 71 4 158152
155150
148137
Crow IR II 92 WNW 356 356356
364 364 364 364 362 364364
364364
364364
Devils Tower NM II 139 ESE 240 281266
84 100 49 65 0 302291
293285
286270
Fort Belknap IR II 344 NNW 354 356355
11 18 5 10 1 356356
356356
356356
Fort Laramie NHS II 351 SSE 195 216204
24 33 9 14 1 228212
220210
218205
Jewel Cave NM II 248 SE 238 256249
29 41 13 22 0 268263
264255
258249
Mt. RushmoreNational Memorial
II 261 ESE 213 240227
31 43 14 17 0 253245
251240
242229
7-21
TABLE 7.8 (Cont.)
Visibility-Sensitive Receptor Number of Days with ∆dv ≥ 0.5b
Locationc Non-Project Non-MTSources Project Sources MT Project Sources Cumulative Sources
ScreeningProcedure Name
PSDClass
Distance(km) Direction All Alt. All Alt. Alt. E Alt. Ea Alt. D Alt. Da Alt. A Alt. E Alt. D Alt. A
FLAG(Cont.)
Popo Agie WA II 338 SW 54 62d
5615 26 8 10 1 64d
626362
6359
Soldier Creek WA II 347 SE 207 234223
24 38 6 11 0 243232
238228
235224
a Non-project sources include other new and RFFA sources, excluding those on IR and FS lands. Non-Montana Project sources include Wyoming Project sources and other new andRFFA sources, excluding RFFA sources on the IR and FS lands. Cumulative sources include Montana Project sources, Wyoming Project sources, and other new and RFFA sources,including RFFA sources on the IR and FS lands.
b The number of days is a rounded value.
c Distance and direction are from the center point of the project area to the center point of the receptor area.
d Values in the first row are with Wyoming Project emissions under Alt. 1 (high emissions case), and values in the second row are with Wyoming Project emissions under Alt. 3 (lowemissions case).
7-22
TABLE 7.9 Estimated Potential Visibility Impairment (�dv � 1.0) Due to Emissions from Montana Project Sources, Non-MontanaProject Sources, and Cumulative Sources Predicted by Screening Procedures under Various Alternative Combinationsa
Visibility-Sensitive Receptor Number of Days with ∆dv ≥ 1.0b
Locationc Non-Project Non-MTSources Project Sources MT Project Sources Cumulative Sources
ScreeningProcedure Name
PSDClass
Distance(km) Direction All Alt. All Alt. Alt. E Alt. Ea Alt. D Alt. Da Alt. A Alt. E Alt. D Alt. A
Badlands WA I 339 ESE 56 79d
632 7 0 0 0 88d
768369
8065
Bridger WA I 344 SW 21 3025
9 10 3 4 0 4135
3629
3126
Fitzpatrick WA I 323 SW 19 2620
7 8 3 3 0 3633
2925
2721
N. Absaroka WA I 265 WSW 26 3328
7 16 4 4 0 4342
4039
3835
Washakie WA I 273 WSW 33 4341
11 16 4 8 0 5351
5047
4645
WDEQ
Wind Cave NP I 282 SE 67 9175
1 8 0 0 0 10386
9979
9577
FLAG Badlands WA I 339 ESE 112 154130
10 15 1 5 0 167153
163143
154133
Bridger WA I 344 SW 25 3529
9 11 4 6 0 4842
4537
3829
Fitzpatrick WA I 323 SW 23 3327
8 14 3 6 0 4641
4235
3831
Fort Peck IR I 311 N 13 2616
6 10 0 4 0 3934
3327
2717
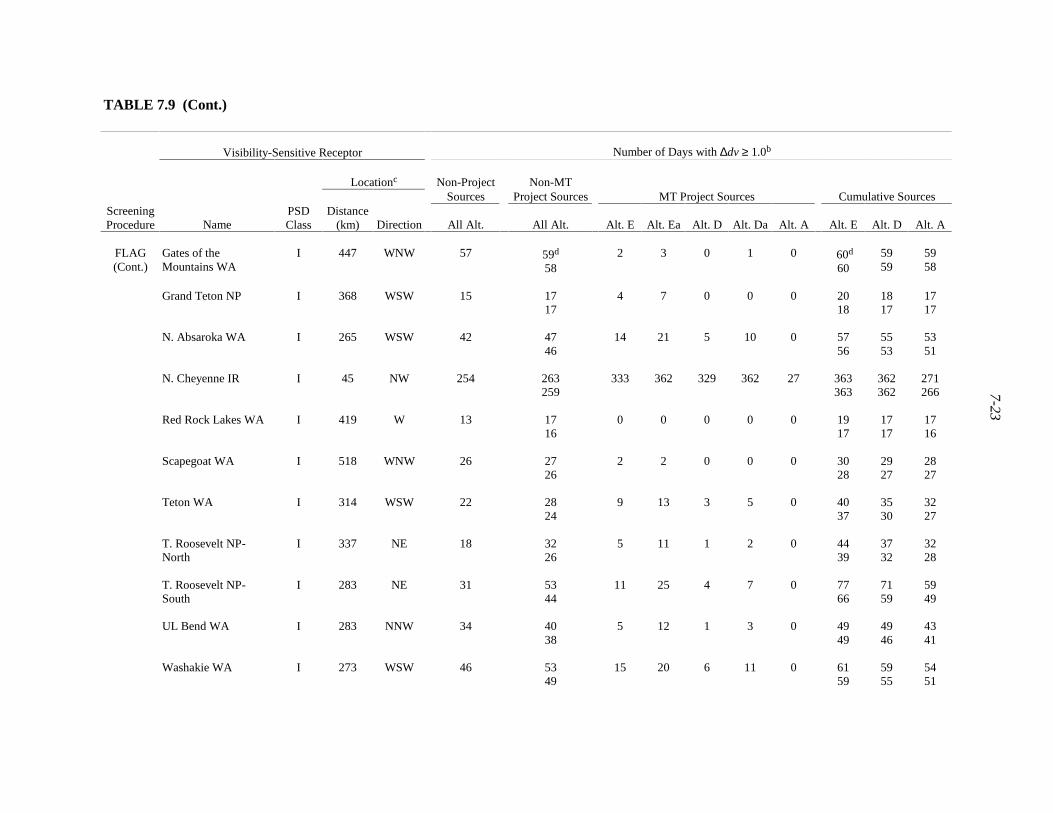
7-23
TABLE 7.9 (Cont.)
Visibility-Sensitive Receptor Number of Days with ∆dv ≥ 1.0b
Locationc Non-Project Non-MTSources Project Sources MT Project Sources Cumulative Sources
ScreeningProcedure Name
PSDClass
Distance(km) Direction All Alt. All Alt. Alt. E Alt. Ea Alt. D Alt. Da Alt. A Alt. E Alt. D Alt. A
FLAG(Cont.)
Gates of theMountains WA
I 447 WNW 57 59d
582 3 0 1 0 60d
605959
5958
Grand Teton NP I 368 WSW 15 1717
4 7 0 0 0 2018
1817
1717
N. Absaroka WA I 265 WSW 42 4746
14 21 5 10 0 5756
5553
5351
N. Cheyenne IR I 45 NW 254 263259
333 362 329 362 27 363363
362362
271266
Red Rock Lakes WA I 419 W 13 1716
0 0 0 0 0 1917
1717
1716
Scapegoat WA I 518 WNW 26 2726
2 2 0 0 0 3028
2927
2827
Teton WA I 314 WSW 22 2824
9 13 3 5 0 4037
3530
3227
T. Roosevelt NP-North
I 337 NE 18 3226
5 11 1 2 0 4439
3732
3228
T. Roosevelt NP-South
I 283 NE 31 5344
11 25 4 7 0 7766
7159
5949
UL Bend WA I 283 NNW 34 4038
5 12 1 3 0 4949
4946
4341
Washakie WA I 273 WSW 46 5349
15 20 6 11 0 6159
5955
5451
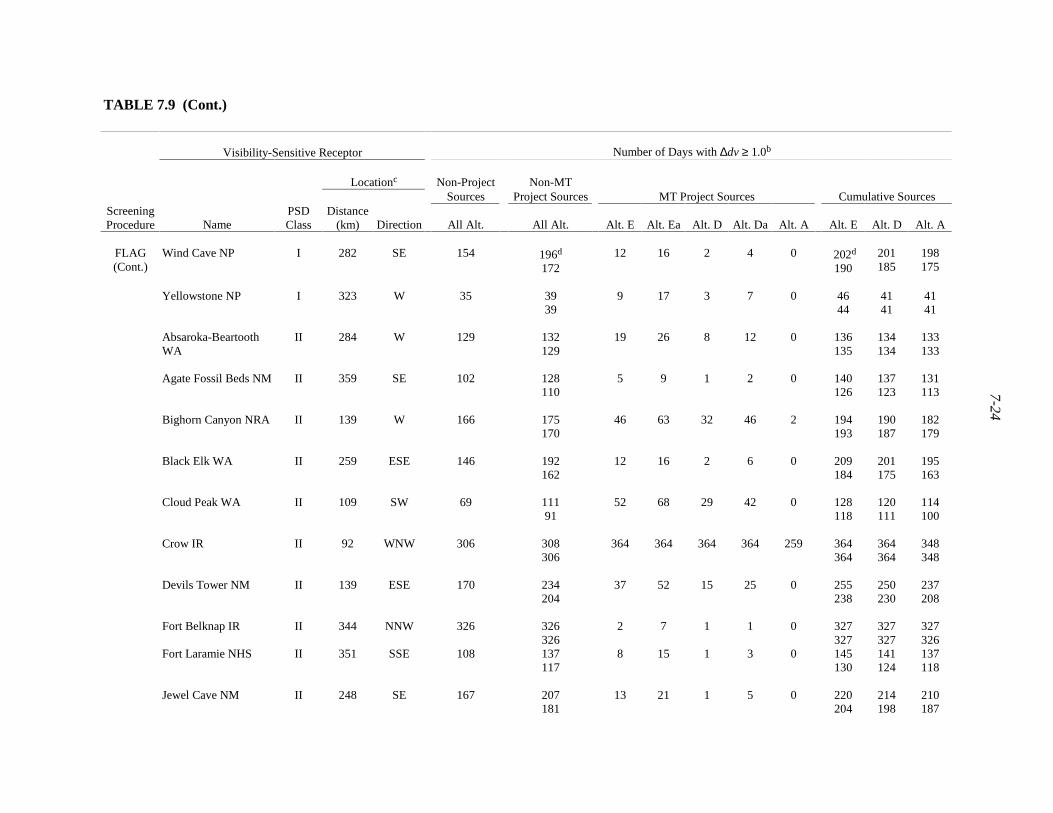
7-24
TABLE 7.9 (Cont.)
Visibility-Sensitive Receptor Number of Days with ∆dv ≥ 1.0b
Locationc Non-Project Non-MTSources Project Sources MT Project Sources Cumulative Sources
ScreeningProcedure Name
PSDClass
Distance(km) Direction All Alt. All Alt. Alt. E Alt. Ea Alt. D Alt. Da Alt. A Alt. E Alt. D Alt. A
FLAG(Cont.)
Wind Cave NP I 282 SE 154 196d
17212 16 2 4 0 202d
190201185
198175
Yellowstone NP I 323 W 35 3939
9 17 3 7 0 4644
4141
4141
Absaroka-BeartoothWA
II 284 W 129 132129
19 26 8 12 0 136135
134134
133133
Agate Fossil Beds NM II 359 SE 102 128110
5 9 1 2 0 140126
137123
131113
Bighorn Canyon NRA II 139 W 166 175170
46 63 32 46 2 194193
190187
182179
Black Elk WA II 259 ESE 146 192162
12 16 2 6 0 209184
201175
195163
Cloud Peak WA II 109 SW 69 11191
52 68 29 42 0 128118
120111
114100
Crow IR II 92 WNW 306 308306
364 364 364 364 259 364364
364364
348348
Devils Tower NM II 139 ESE 170 234204
37 52 15 25 0 255238
250230
237208
Fort Belknap IR II 344 NNW 326 326326
2 7 1 1 0 327327
327327
327326
Fort Laramie NHS II 351 SSE 108 137117
8 15 1 3 0 145130
141124
137118
Jewel Cave NM II 248 SE 167 207181
13 21 1 5 0 220204
214198
210187
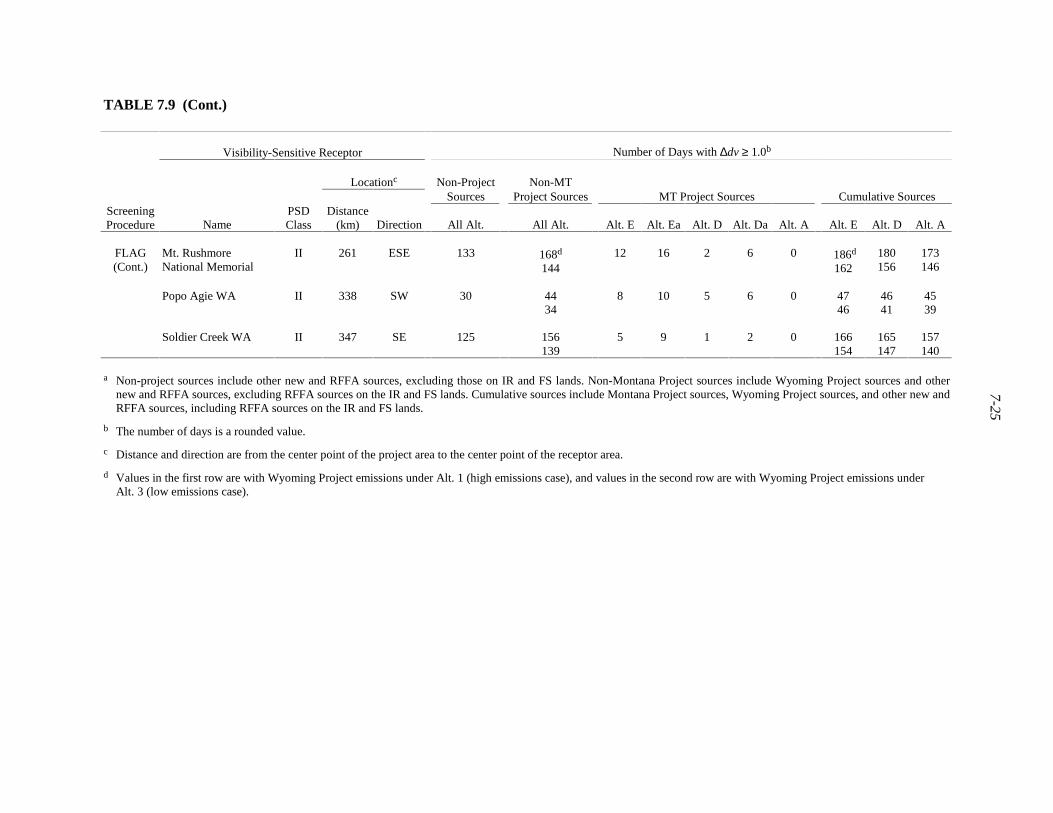
7-25
TABLE 7.9 (Cont.)
Visibility-Sensitive Receptor Number of Days with ∆dv ≥ 1.0b
Locationc Non-Project Non-MTSources Project Sources MT Project Sources Cumulative Sources
ScreeningProcedure Name
PSDClass
Distance(km) Direction All Alt. All Alt. Alt. E Alt. Ea Alt. D Alt. Da Alt. A Alt. E Alt. D Alt. A
FLAG(Cont.)
Mt. RushmoreNational Memorial
II 261 ESE 133 168d
14412 16 2 6 0 186d
162180156
173146
Popo Agie WA II 338 SW 30 4434
8 10 5 6 0 4746
4641
4539
Soldier Creek WA II 347 SE 125 156139
5 9 1 2 0 166154
165147
157140
a Non-project sources include other new and RFFA sources, excluding those on IR and FS lands. Non-Montana Project sources include Wyoming Project sources and othernew and RFFA sources, excluding RFFA sources on the IR and FS lands. Cumulative sources include Montana Project sources, Wyoming Project sources, and other new andRFFA sources, including RFFA sources on the IR and FS lands.
b The number of days is a rounded value.
c Distance and direction are from the center point of the project area to the center point of the receptor area.
d Values in the first row are with Wyoming Project emissions under Alt. 1 (high emissions case), and values in the second row are with Wyoming Project emissions underAlt. 3 (low emissions case).
7-26
In general, estimated potential visibility impacts decrease as the distance between the MontanaProject Area and the receptor area increases, and as the direction from the Montana Project Areato the receptor area changes from downwind to upwind of the prevailing winds.
The potential visibility impacts due to the Montana Project source emissions estimated bythe screening procedures are lower than those due to the non-project source emissions at allvisibility-sensitive receptors except NC and CI, under all Montana alternatives evaluated. Asexpected, the potential visibility impacts due to non-project source emissions estimated by thescreening procedures are similar to or lower than those due to the non-Montana Project sourceemissions at all visibility-sensitive receptors under all alternative combinations evaluated.
The estimated potential annual number of days with visibility degradation equal to orgreater than 0.5 dv due to emissions from cumulative sources estimated by the WDEQ screeningprocedure ranges from about 47 days at FZ under Montana Alternative A and WyomingAlternative 3, to 182 days at WC under Montana Alternative E and Wyoming Alternative 1. Theestimated potential annual number of days with visibility degradation equal to or greater than1.0 dv due to emissions from cumulative sources estimated by the WDEQ screening procedureranges from about 21 days at FZ under Montana Alternative A and Wyoming Alternative 3, to103 days at WC under Montana Alternative E and Wyoming Alternative 1.
The estimated potential annual number of days with visibility degradation equal to orgreater than 0.5 dv due to emissions from cumulative sources estimated by the FLAG screeningprocedure ranges from about 27 days at GT under Montana Alternative A and WyomingAlternative 3, to 364 days at CI under all of Montana Alternatives E and Wyoming Alternative 1or 3. The estimated potential annual number of days with visibility degradation equal to orgreater than 1.0 dv due to emissions from cumulative sources ranges from about 16 days at RRunder Montana Alternative A and Wyoming Alternative 3, to 364 days at CI under anycombination of Montana Alternative D or E and Wyoming Alternative 1 or 3.
7.2.2.2.2 Refined Analysis. The potential far-field daily visibility impacts due to theemissions from each source category were also estimated by the refined procedure at each of theClass I and II sensitive receptors (Table 4.3) for each of the 10 alternative combinations(Montana Alternatives E, Ea, D, Da, and A, combined with Wyoming Alternative 1 or 3). Theresults are presented in Appendix E.1 for the non-project sources, non-Montana Project sources,Montana Project sources, and cumulative sources.
Table 7.10 summarizes the potential annual number of days with visibility degradationequal to or greater than 1.0 dv. Visibility degradation trends indicated in the result of thevisibility impact analysis conducted by using the refined procedure are similar to those of theanalysis conducted by using the screening procedures described in Section 7.2.2.2.1, with respectto the following parameters: (1) relative significance of the Montana Project sources, non-Montana Project sources, and non-project sources; (2) effect of the distance between theMontana Project Area and receptor area; and (3) direction from the Montana Project Area to thereceptor area relative to the prevailing wind direction.
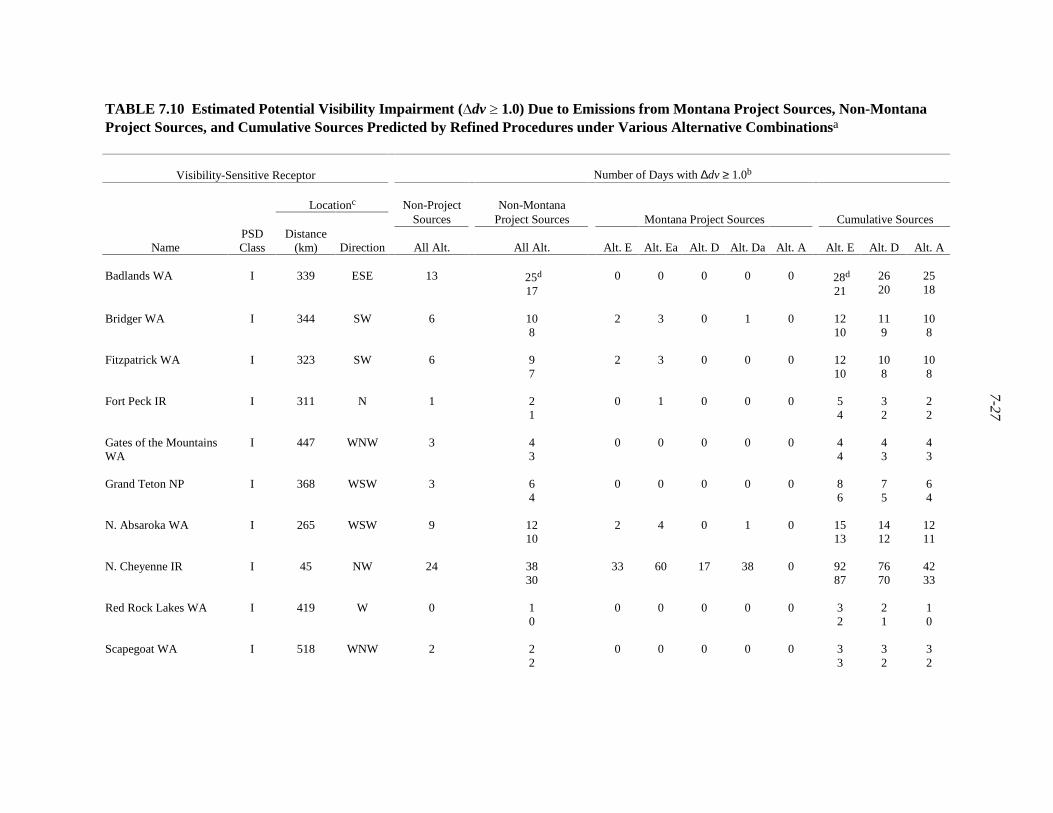
7-27
TABLE 7.10 Estimated Potential Visibility Impairment (�dv � 1.0) Due to Emissions from Montana Project Sources, Non-MontanaProject Sources, and Cumulative Sources Predicted by Refined Procedures under Various Alternative Combinationsa
Visibility-Sensitive Receptor Number of Days with ∆dv ≥ 1.0b
Locationc Non-Project Non-MontanaSources Project Sources Montana Project Sources Cumulative Sources
NamePSDClass
Distance(km) Direction All Alt. All Alt. Alt. E Alt. Ea Alt. D Alt. Da Alt. A Alt. E Alt. D Alt. A
Badlands WA I 339 ESE 13 25d
170 0 0 0 0 28d
212620
2518
Bridger WA I 344 SW 6 108
2 3 0 1 0 1210
119
108
Fitzpatrick WA I 323 SW 6 97
2 3 0 0 0 1210
108
108
Fort Peck IR I 311 N 1 21
0 1 0 0 0 54
32
22
Gates of the MountainsWA
I 447 WNW 3 43
0 0 0 0 0 44
43
43
Grand Teton NP I 368 WSW 3 64
0 0 0 0 0 86
75
64
N. Absaroka WA I 265 WSW 9 1210
2 4 0 1 0 1513
1412
1211
N. Cheyenne IR I 45 NW 24 3830
33 60 17 38 0 9287
7670
4233
Red Rock Lakes WA I 419 W 0 10
0 0 0 0 0 32
21
10
Scapegoat WA I 518 WNW 2 22
0 0 0 0 0 33
32
32
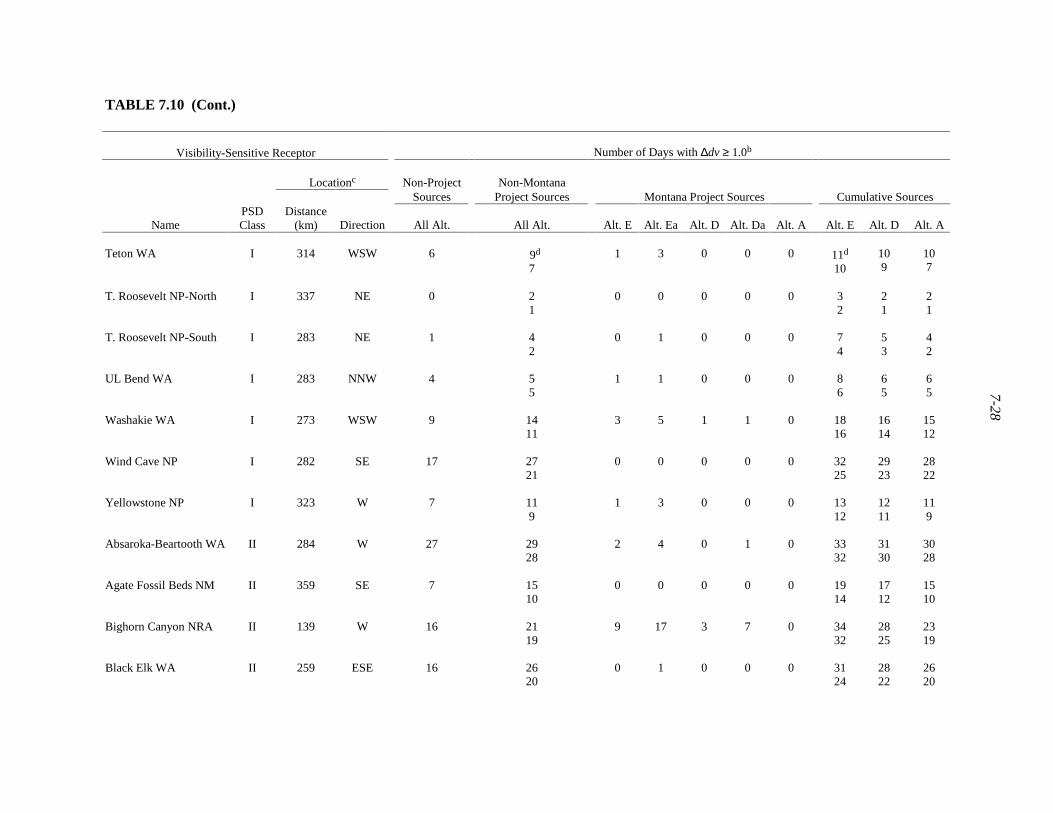
7-28
TABLE 7.10 (Cont.)
Visibility-Sensitive Receptor Number of Days with ∆dv ≥ 1.0b
Locationc Non-Project Non-MontanaSources Project Sources Montana Project Sources Cumulative Sources
NamePSDClass
Distance(km) Direction All Alt. All Alt. Alt. E Alt. Ea Alt. D Alt. Da Alt. A Alt. E Alt. D Alt. A
Teton WA I 314 WSW 6 9d
71 3 0 0 0 11d
10109
107
T. Roosevelt NP-North I 337 NE 0 21
0 0 0 0 0 32
21
21
T. Roosevelt NP-South I 283 NE 1 42
0 1 0 0 0 74
53
42
UL Bend WA I 283 NNW 4 55
1 1 0 0 0 86
65
65
Washakie WA I 273 WSW 9 1411
3 5 1 1 0 1816
1614
1512
Wind Cave NP I 282 SE 17 2721
0 0 0 0 0 3225
2923
2822
Yellowstone NP I 323 W 7 119
1 3 0 0 0 1312
1211
119
Absaroka-Beartooth WA II 284 W 27 2928
2 4 0 1 0 3332
3130
3028
Agate Fossil Beds NM II 359 SE 7 1510
0 0 0 0 0 1914
1712
1510
Bighorn Canyon NRA II 139 W 16 2119
9 17 3 7 0 3432
2825
2319
Black Elk WA II 259 ESE 16 2620
0 1 0 0 0 3124
2822
2620
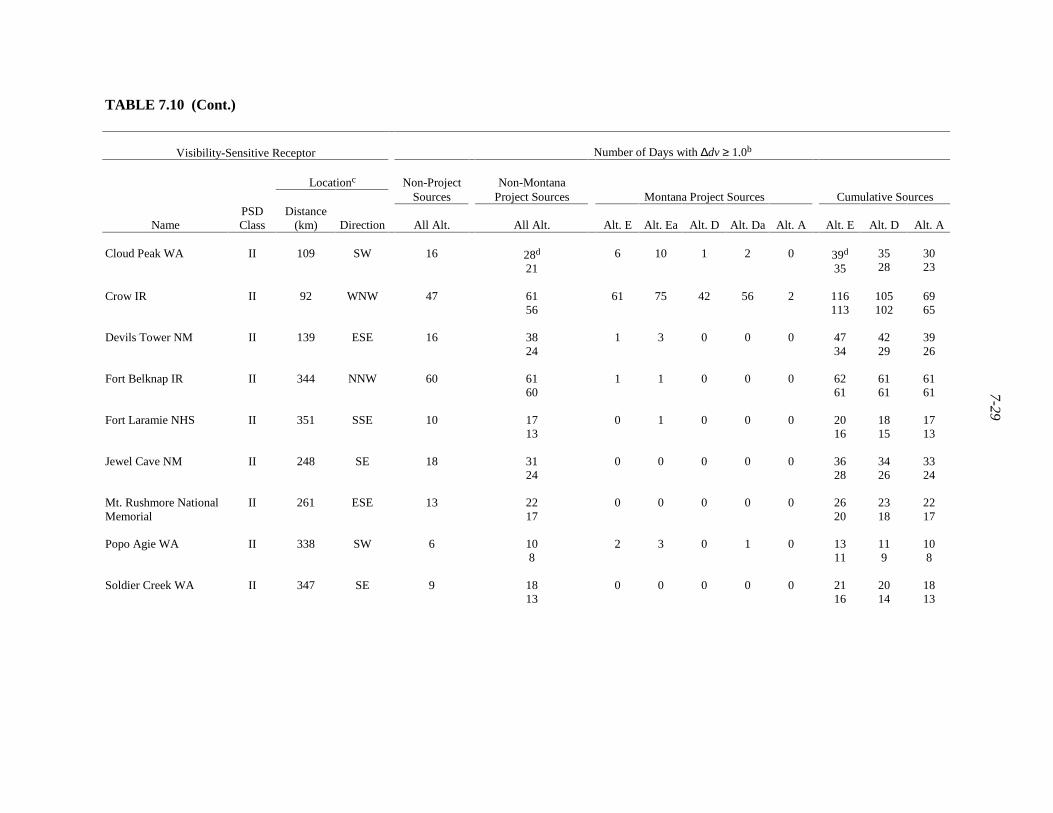
7-29
TABLE 7.10 (Cont.)
Visibility-Sensitive Receptor Number of Days with ∆dv ≥ 1.0b
Locationc Non-Project Non-MontanaSources Project Sources Montana Project Sources Cumulative Sources
NamePSDClass
Distance(km) Direction All Alt. All Alt. Alt. E Alt. Ea Alt. D Alt. Da Alt. A Alt. E Alt. D Alt. A
Cloud Peak WA II 109 SW 16 28d
216 10 1 2 0 39d
353528
3023
Crow IR II 92 WNW 47 6156
61 75 42 56 2 116113
105102
6965
Devils Tower NM II 139 ESE 16 3824
1 3 0 0 0 4734
4229
3926
Fort Belknap IR II 344 NNW 60 6160
1 1 0 0 0 6261
6161
6161
Fort Laramie NHS II 351 SSE 10 1713
0 1 0 0 0 2016
1815
1713
Jewel Cave NM II 248 SE 18 3124
0 0 0 0 0 3628
3426
3324
Mt. Rushmore NationalMemorial
II 261 ESE 13 2217
0 0 0 0 0 2620
2318
2217
Popo Agie WA II 338 SW 6 108
2 3 0 1 0 1311
119
108
Soldier Creek WA II 347 SE 9 1813
0 0 0 0 0 2116
2014
1813

7-30
TABLE 7.10 (Cont.)
a Non-project sources include other new and RFFA sources, excluding those on IR and FS lands. Non-Montana Project sources include Wyoming Project sources and othernew and RFFA sources, excluding RFFA sources on the IR and FS lands. Cumulative sources include Montana Project sources, Wyoming Project sources, and other newand RFFA sources, including RFFA sources on the IR and FS lands.
b The number of days is a rounded value.
c Distance and direction are from the center point of the project area to the center point of the receptor area.
d Values in the first row are with Wyoming Project emissions under Alt. 1 (high emissions case), and values in the second row are with Wyoming Project emissions underAlt. 3 (low emissions case).
7-31
The potential annual number of days with visibility degradation equal to or greater than1.0 dv due to emissions from the Montana Project sources as estimated by the refined procedureranges from less than 1 day at all visibility-sensitive receptors evaluated except CI under one ormore alternatives, to about 75 days at CI under Alternative Ea.
The potential visibility impacts due to the Montana Project source emissions estimated bythe refined procedure are lower than those due to the non-project source emissions at allvisibility-sensitive receptors except NC and CI, under all Montana Project alternatives evaluated.The potential visibility impacts due to non-project source emissions estimated by the refinedprocedure are similar to or lower than those due to the non-Montana Project source emissions atall visibility-sensitive receptors under all alternatives evaluated.
The potential annual number of days with visibility degradation equal to or greater than1.0 dv due to emissions from cumulative sources estimated by the refined procedure ranges fromless than 1 day at RR under Montana Alternative A and Wyoming Alternative 3, to 116 days atCI under Montana Alternative E and Wyoming Alternative 1.
7.2.2.3 Acid Deposition
The potential far-field acid deposition impacts due to the emissions from each of thefollowing source categories were estimated at each of the Class I and II sensitive receptors(Table 4.3) and sensitive lakes (Table 4.5) for each of the 10 alternative combinations (MontanaAlternatives E, Ea, D, Da, and A, combined with Wyoming Alternative 1 or 3):
• Non-project sources (new and RFFA sources, excluding the RFFA sources onthe IR and FS lands),
• Non-Montana Project sources (Wyoming Project sources and other new andRFFA sources, excluding the RFFA sources on the IR and FS lands),
• Montana Project sources, and
• Cumulative sources (Montana Project sources, Wyoming Project sources andother new and RFFA sources).
The results are presented in Appendix F.1.
The predicted maximum acid deposition fluxes at the Class I and II sensitive receptorslisted in Table 4.3 due to the emissions from cumulative sources under Montana Alternative Eand Wyoming Alternative 1 occur at the Fort Belknap IR for sulfur (0.12 kg/ha/yr) and theNorthern Cheyenne IR for nitrogen (0.97 kg/ha/yr). These annual deposition fluxes areapproximately 2 and 32% of the LAC thresholds of 5 and 3 kg/ha/yr for total sulfur and nitrogendeposition fluxes, respectively. Adding these predicted maximum increases in acid depositionfluxes to the current highest background total deposition fluxes (0.90 and 1.62 kg/ha/yr for sulfurand nitrogen, respectively) monitored in the modeling domain (ESE 2001) results in predicted
7-32
maximum total acid deposition fluxes of 1.02 and 2.59 kg/ha/yr for sulfur and nitrogen,respectively. These predicted maximum total acid deposition fluxes represent about 20 and 86%of the LAC thresholds of 5 and 3 kg/ha/yr for total sulfur and nitrogen deposition fluxes,respectively.
Table 7.11 presents the potential changes in ANC at the sensitive lakes listed in Table 4.5estimated for emissions from non-project sources, non-Montana Project sources, MontanaProject sources, and cumulative sources under various alternative combinations. Except for theUpper Frozen Lake and Florence Lake, the estimated potential changes in ANC due to emissionsfrom non-project sources, non-Montana Project sources, Montana Project sources, andcumulative sources under all alternative combinations evaluated are less than 10%, the LACthreshold for lakes with background ANC values greater than 25 µeq/L (see Table 7.11 for the10% most sensitive ANC values of the sensitive lakes evaluated).
At Florence Lake, the estimated potential change in ANC due to emissions fromcumulative sources under Montana Alternative E and Wyoming Alternative 1 is 10.4%, slightlyabove the LAC threshold for lakes with background ANC values greater than 25 µeq/L (10%).
For the Upper Frozen Lake (with the 10% most sensitive ANC value of 5.8 µeq/L), theestimated potential change in ANC due to emissions from Montana Project Sources are all lessthan 1 µeq/L, the LAC threshold for lakes with background ANC values equal to or less than25 µeq/L. However, the estimated potential changes in ANC due to emissions from cumulativesources range from 1.3 to 1.8 µeq/L under all alternative combinations evaluated. These changesare mainly due to the contributions from non-Montana Project sources (1.2 to 1.6 µeq/L).
7.3 WYOMING PROJECT SOURCES
7.3.1 Near-Field Impacts
7.3.1.1 Criteria Pollutants
7.3.1.1.1 Emissions from Wyoming Project, Non-Wyoming Project, and CumulativeSources. Table 7.12 summarizes the estimated potential maximum near-field impacts of criteriaair pollutants due to the emissions from the Wyoming Project sources under WyomingAlternatives 1, 2a, 2b, and 3, non-Wyoming Project sources (Montana Project sources underAlternative E and other new and RFFA sources), and cumulative sources under four Wyoming-Montana alternative combinations. The potential increases in maximum near-field concentrationsof criteria pollutants due to the emissions from the Wyoming Project sources under allfour alternatives are estimated to be equal to or less than about 8 µg/m3 for annual average NO2;<1, 2, and 3 µg/m3 for annual, 24-hour, and 3-hour average SO2, respectively; 3 and 20 µg/m3
7-33
TABLE 7.11 Estimated Potential Changes in ANC at Sensitive Lakes Due to Emissions from the Montana ProjectSources, Non-Montana Project Sources, and Cumulative Sources under Various Alternative Combinationsa
Potential ANC Change (%)Sensitive Lake
Locationb 10% MostNon-
ProjectNon-MTProject MT Project Sources Cumulative Sources
Sensitive Sources Sources
Name WADistance
(km) DirectionANC
(µeq/L) All Alt. All Alt. Alt. E Alt. Ea Alt. D Alt. Da Alt. A Alt. E Alt. D Alt. A
Black Joe Bridger 345 SW 69.0 1.5 2.2c
1.80.3 0.4 0.2 0.2 0.1 2.6c
2.12.42.0
2.31.8
Deep Bridger 347 SW 61.0 1.7 2.52.0
0.3 0.4 0.2 0.2 0.1 2.92.4
2.72.2
2.62.1
Hobbs Bridger 348 SW 68.0 0.8 1.21.0
0.2 0.3 0.1 0.2 0.04 1.51.3
1.41.1
1.31.0
Upperd
FrozenBridger 349 SW 5.8e 1.1 1.6
1.20.19 0.25 0.10 0.13 0.04 1.8
1.51.71.4
1.61.3
Ross Fitzpatrick 324 SW 61.4 1.2 1.71.3
0.3 0.4 0.2 0.2 0.1 2.11.7
1.91.6
1.71.4
SteppingStone
Absaroka-Beartooth
266 W 27.0 1.7 2.01.8
0.4 0.6 0.3 0.3 0.1 2.52.4
2.32.1
2.11.9
Twin Island Absaroka-Beartooth
265 W 36.0 1.2 1.41.3
0.3 0.4 0.2 0.2 0.1 1.81.7
1.61.5
1.51.4
Emerald Cloud Peak 101 SW 55.3 2.8 4.43.5
1.1 1.4 0.6 0.7 0.2 5.94.9
5.24.2
4.63.7
Florence Cloud Peak 114 SW 32.7 5.0 8.16.3
1.7 2.3 0.9 1.1 0.3 10.48.5
9.27.4
8.46.5
LowerSaddlebag
Popo Agie 347 SW 55.5 2.2 3.22.5
0.4 0.5 0.2 0.2 0.1 3.63.0
3.42.8
3.22.6

7-34
TABLE 7.11 (Cont.)
a Non-project sources include other new and RFFA sources, excluding those on IR and FS lands. Non-Montana Project sources include Wyoming Project sources andother new and RFFA sources, excluding RFFA sources on the IR and FS lands. Cumulative sources include Montana Project sources, Wyoming Project sources,and other new and RFFA sources, including RFFA sources on the IR and FS lands.
b Direction and distance are from the center of the Montana Project area to the center of each sensitive lake.
c Values in the first row are with Wyoming Project emissions under Alt. 1 (high emissions case), and values in the second row are with Wyoming Project emissionsunder Alt. 3 (low emissions case).
d ANC values for the Upper Frozen Lake are in µeq/L.
e The background ANC value is based on only six samples taken on four days between 1997 and 2001.
7-35
TABLE 7.12 Estimated Potential Maximum Near-Field Air Quality Impacts Due to Emissions from Wyoming Project Sources,Non-Wyoming Project Sources, and Cumulative Sources under Various Alternative Combinationsa
Maximum Concentration Increase (µg/m3)
Non-WyomingProject Sources Wyoming Project Sources Cumulative Sources
CriteriaPollutant
AveragingTime All Alt. Alt. 1 Alt. 2a Alt. 2b Alt. 3 Alt. 1 Alt. 2a Alt. 2b Alt. 3
PSD Incrementfor Class II
Area (µg/m3)
NO2 Annual 3(12)b
8(32)
7(28)
6(24)
3(12)
10(40)
10(40)
9(36)
6(24)
25
Annual 0.2(1)
0.5(3)
0.5(3)
0.5(3)
0.2(1)
0.6(3)
0.6(3)
0.6(3)
0.3(2)
20
24-hour 2(2)
2(2)
2(2)
2(2)
0.6(1)
3(3)
3(3)
3(3)
2(2)
91
SO2
3-hour 5(1)
3(1)
3(1)
3(1)
1(<1)
5(1)
5(1)
5(1)
5(1)
512
Annual 0.9(5)
3(18)
3(18)
3(18)
1(6)
4(24)
4(24)
4(24)
2(12)
17PM10
24-hourc 9(30)
20(67)
17(57)
15(50)
7(23)
31(103)
28(93)
25(83)
16(53)
30
Annual 0.7 2 1 1 0.7 2 2 2 1 -dPM2.5
24-hourc 9 16 13 11 6 24 21 19 13 -
8-hour 124 156 93 77 183 156 132 124 183 -CO1-hour 142 223 157 157 261 223 197 169 261 -
a Non-Wyoming Project sources include Montana Project sources under Alternative E, and other new and RFFA sources. Cumulative sources includeWyoming Project sources, Montana Project sources under Alternative E, and other new and RFFA sources.
b Values in parentheses are the predicted maximum concentration increases as a percent of the maximum allowable PSD increments for a Class II area.
c Concentration increases for 24-hour PM10 and PM2.5 are the second-highest values.
d A hyphen indicates no increment exists.
7-36
for annual and 24-hour average PM10, respectively; 2 and 16 µg/m3 for annual and 24-houraverage PM2.5, respectively; and 183 and 261 µg/m3 for 8-hour and 1-hour average CO,respectively.
Among the four Wyoming alternatives, potential air quality impacts due to the emissionsfrom Wyoming Project sources are the highest under Alternative 1 (Proposed Action), except forthe potential concentration increases in 8-hour and 1-hour average CO under Alternative 3(No-Action Alternative). The predicted increase in CO impacts under the “No Action”Alternative is a result of different CO emission source densities than under Alternatives 1, 2a,and 2b. Potential maximum near-field criteria pollutant concentration increases due to theemissions from Wyoming Project sources under Alternative 1 (Proposed Action) are lower thanthose due to non-Wyoming Project source emissions for 3-hour SO2, but are higher for NO2,annual and 24-hour SO2, PM10, PM2.5, and CO. Under all alternatives, these concentrationincreases due to the emissions from the Wyoming Project sources are less than the maximumallowable PSD increments for Class II areas, representing percentages equal to or less than about32, 3, and 67% of the maximum allowable Class II PSD increments for NO2, SO2, and PM10,respectively. Again, comparisons with PSD increments are made as a general comparison; sinceemission sources included in this analysis may or may not legally consume PSD increments, thiscomparison does not represent a regulatory PSD increment consumption analysis.
Potential increases in maximum near-field concentrations of criteria pollutants due to theemissions from non-Wyoming Project sources (Montana Project sources under Alternative E andother new and RFFA sources, including RFFA sources on the IR and FS lands) are estimated tobe less than the maximum allowable PSD increments for Class II areas and represent percentagesequal to or less than about 12, 2, and 30% of the maximum allowable Class II PSD incrementsfor NO2, SO2, and PM10, respectively.
The potential increases in maximum near-field concentrations of criteria pollutants due tothe emissions from cumulative sources (Wyoming Project sources, Montana Project sourcesunder Alternative E, and other new and RFFA sources, including RFFA sources on the IR andFS lands) under all four alternative combinations are estimated to be equal to or less than about10� ���3 for annual average NO2���������� ���������������������� ���3 for annual, 24-hour,and 3-hour average SO2�� �������������������� ����������� ���3������� ���3 for annual and24-hour average PM10�� �������������������� ����������� ���3������� ���3 for annual and24-hour average PM2.5�� ������������ ��� ���� ��� � � ���� ���� � �� ���3� ��� ���� ���3 for8-hour and 1-hour average CO, respectively.
Among the four alternative combinations, potential near-field air quality impacts due tothe emissions from cumulative sources are highest under Alternative 1. Potential maximum near-field criteria concentration increases for NO2, SO2, and annual PM10 that are due to emissionsfrom cumulative sources are less than the maximum allowable Class II PSD increments andrepresent percentages equal to or less than about 40, 3, and 24% of the maximum allowableClass II PSD increments for NO2, SO2, and annual PM10, respectively. The potential maximumnear-field 24-hour PM10 concentration increase due to the emissions from cumulative sources isestimated to be about 103% of the maximum allowable Class II PSD increment for 24-hourPM10 concentration, which is primarily due to the emissions from Wyoming Project sources.
7-37
The potential maximum near-field 24-hour PM10 concentration increase from Wyoming Projectsources is estimated to be about two-thirds of the maximum allowable Class II PSD incrementfor 24-hour PM10.
The estimated potential maximum near-field total concentrations (concentration increasesdue to cumulative source emissions plus background concentrations) of criteria pollutants arecompared with applicable ambient air quality standards (Wyoming SAAQS [WAAQS] andNAAQS) in Table 7.13. The potential maximum total concentrations are less than applicableWAAQS or NAAQS under all alternative combinations, representing percentages equal or lessthan about 27, 7, 49, 67, and 17% of WAAQS for NO2, SO2, PM10, PM2.5 and CO, respectively.
7.3.1.1.2 Fugitive Dust Emissions from Construction Sites. The potential maximum24-hour average PM10 concentration impact due to fugitive dust emissions from the largestconstruction site of the Wyoming Project (7-acre reciprocating compressor station with a two-track road 480 m long and 12 m wide) was estimated to be about 55 µg/m3 and occur about240 m away from the compressor station site and about 200 m from the road. The total PM10concentration, including the contributions from the largest construction site of the WyomingProject, was estimated and compared with applicable WAAQS and NAAQS. Constructionactivities are not normally subject to PSD increment consumption regulations. Adding theestimated potential maximum 24-hour average PM10 concentration increase of 55 µg/m3 to thebackground concentration of 42 µg/m3 would amount to a total concentration of about 97 µg/m3,which is about 65% of WAAQS. Because all other construction sites of the Wyoming Projectwould be smaller in size than the 7-acre reciprocating compressor station site, potential PM10concentration impacts at these sites would be less.
7.3.1.1.3 Operational Emissions from Compressor Stations. Table 7.14 presents theestimated potential maximum near-field impacts of criteria pollutants due to emissions from6-unit booster or reciprocating compressor stations with compressor engines using variouscombustion technologies. Among the five combinations of compressor engine type andcombustion technology, the near-field impacts of NO2, SO2, and 24-hour average PM10 andPM2.5 are the highest for the reciprocating compressor station with the lean-burn CaterpillarG3516LE model engines; near-field impacts of annual average PM10 and PM2.5 are the highestfor the booster compressor station with rich-burn compressor engines; and near-field impacts ofCO are highest for the reciprocating compressor station with rich-burn compressor engines.
The estimated maximum near-field criteria concentration increases for NO2, SO2, andPM10 that are due to emissions from 6-unit booster or reciprocating compressor stations are lessthan the maximum allowable Class II PSD increments and represent percentages equal to or lessthan about 30, 0.1, and 18% of the maximum allowable Class II PSD increments for NO2, SO2,and PM10, respectively.
The estimated potential maximum near-field total concentrations (concentration increasesdue to compressor station emissions plus background concentrations) of criteria pollutants are
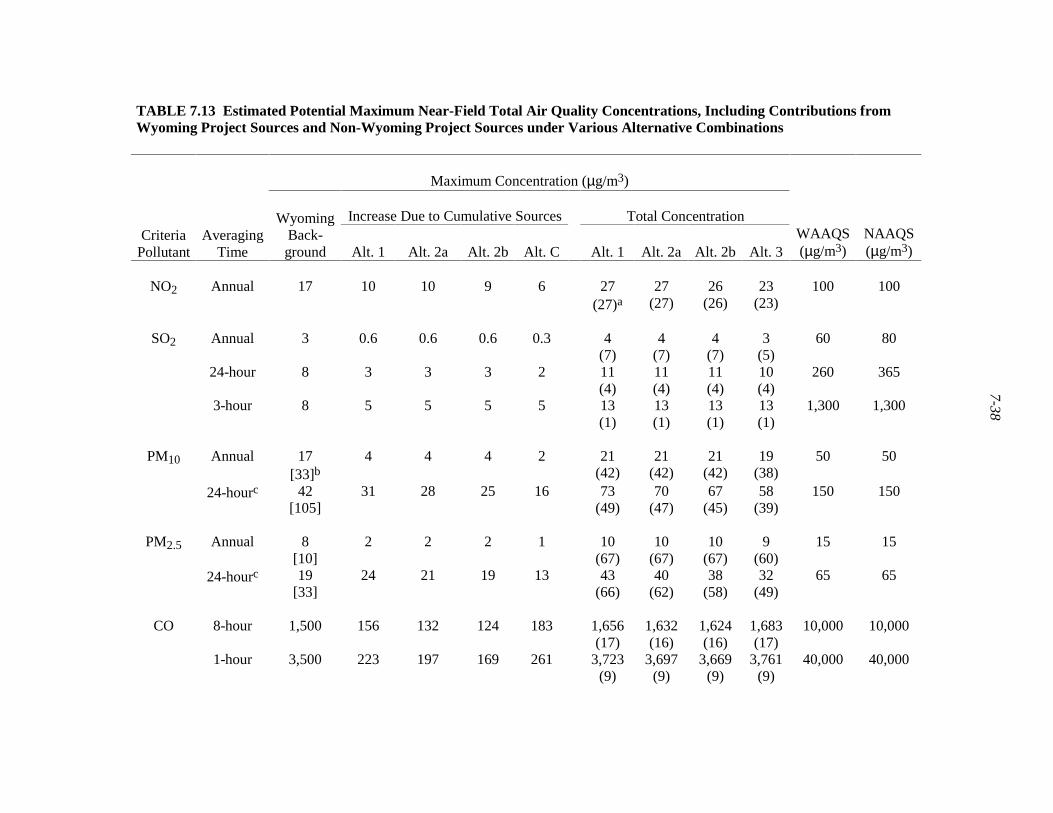
7-38
TABLE 7.13 Estimated Potential Maximum Near-Field Total Air Quality Concentrations, Including Contributions fromWyoming Project Sources and Non-Wyoming Project Sources under Various Alternative Combinations
Maximum Concentration (µg/m3)
Increase Due to Cumulative Sources Total ConcentrationCriteria
PollutantAveraging
Time
WyomingBack-ground Alt. 1 Alt. 2a Alt. 2b Alt. C Alt. 1 Alt. 2a Alt. 2b Alt. 3
WAAQS(µg/m3)
NAAQS(µg/m3)
NO2 Annual 17 10 10 9 6 27(27)a
27(27)
26(26)
23(23)
100 100
Annual 3 0.6 0.6 0.6 0.3 4(7)
4(7)
4(7)
3(5)
60 80
24-hour 8 3 3 3 2 11(4)
11(4)
11(4)
10(4)
260 365
SO2
3-hour 8 5 5 5 5 13(1)
13(1)
13(1)
13(1)
1,300 1,300
Annual 17[33]b
4 4 4 2 21(42)
21(42)
21(42)
19(38)
50 50PM10
24-hourc 42[105]
31 28 25 16 73(49)
70(47)
67(45)
58(39)
150 150
Annual 8[10]
2 2 2 1 10(67)
10(67)
10(67)
9(60)
15 15PM2.5
24-hourc 19[33]
24 21 19 13 43(66)
40(62)
38(58)
32(49)
65 65
8-hour 1,500 156 132 124 183 1,656(17)
1,632(16)
1,624(16)
1,683(17)
10,000 10,000CO
1-hour 3,500 223 197 169 261 3,723(9)
3,697(9)
3,669(9)
3,761(9)
40,000 40,000

7-39
TABLE 7.13 (Cont.)
a Values in parentheses are the predicted maximum total concentrations as a percent of WAAQS.
b Values in brackets are the background concentrations at Sheridan, Wyoming.
c Concentration increases for 24-hour PM10 and PM2.5 are the second-highest values.
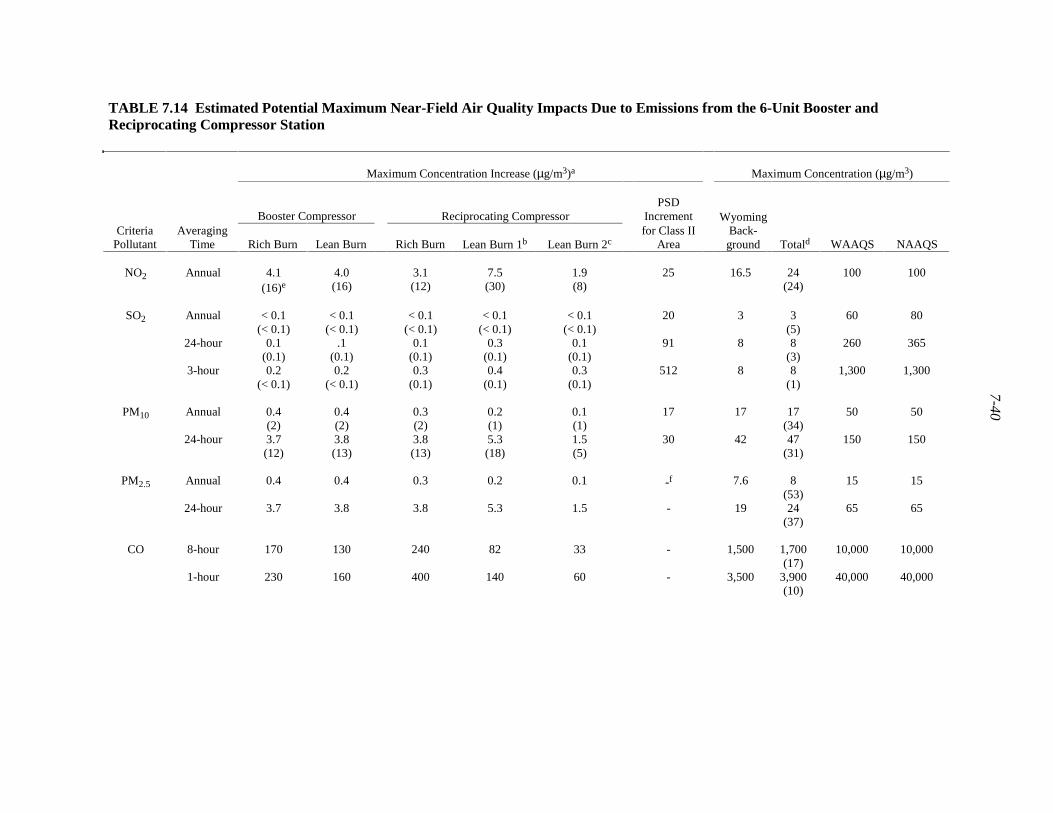
7-40
TABLE 7.14 Estimated Potential Maximum Near-Field Air Quality Impacts Due to Emissions from the 6-Unit Booster andReciprocating Compressor Station
Maximum Concentration Increase (µg/m3)a Maximum Concentration (µg/m3)
Booster Compressor Reciprocating CompressorPSD
IncrementCriteria
PollutantAveraging
Time Rich Burn Lean Burn Rich Burn Lean Burn 1b Lean Burn 2cfor Class II
Area
WyomingBack-ground Totald WAAQS NAAQS
NO2 Annual 4.1(16)e
4.0(16)
3.1(12)
7.5(30)
1.9(8)
25 16.5 24(24)
100 100
Annual < 0.1(< 0.1)
< 0.1(< 0.1)
< 0.1(< 0.1)
< 0.1(< 0.1)
< 0.1(< 0.1)
20 3 3(5)
60 80
24-hour 0.1(0.1)
.1(0.1)
0.1(0.1)
0.3(0.1)
0.1(0.1)
91 8 8(3)
260 365
SO2
3-hour 0.2(< 0.1)
0.2(< 0.1)
0.3(0.1)
0.4(0.1)
0.3(0.1)
512 8 8(1)
1,300 1,300
Annual 0.4(2)
0.4(2)
0.3(2)
0.2(1)
0.1(1)
17 17 17(34)
50 50PM10
24-hour 3.7(12)
3.8(13)
3.8(13)
5.3(18)
1.5(5)
30 42 47(31)
150 150
Annual 0.4 0.4 0.3 0.2 0.1 -f 7.6 8(53)
15 15PM2.5
24-hour 3.7 3.8 3.8 5.3 1.5 - 19 24(37)
65 65
8-hour 170 130 240 82 33 - 1,500 1,700(17)
10,000 10,000CO
1-hour 230 160 400 140 60 - 3,500 3,900(10)
40,000 40,000
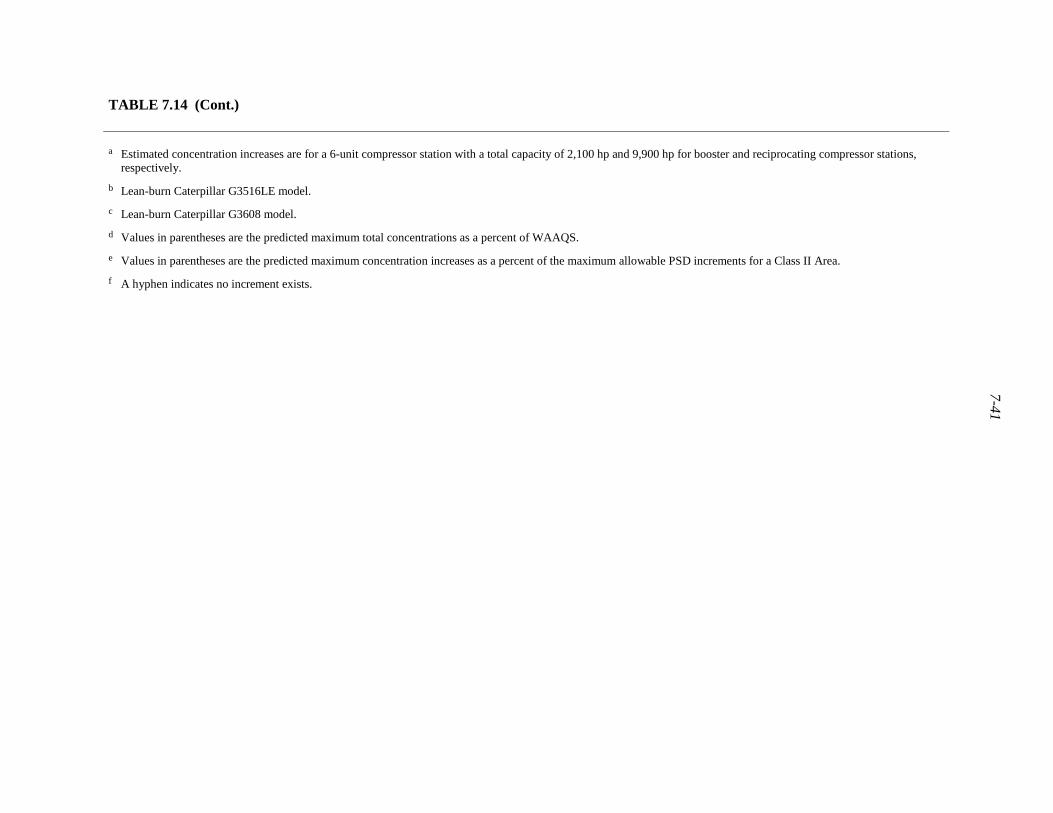
7-41
TABLE 7.14 (Cont.)
a Estimated concentration increases are for a 6-unit compressor station with a total capacity of 2,100 hp and 9,900 hp for booster and reciprocating compressor stations,respectively.
b Lean-burn Caterpillar G3516LE model.
c Lean-burn Caterpillar G3608 model.
d Values in parentheses are the predicted maximum total concentrations as a percent of WAAQS.
e Values in parentheses are the predicted maximum concentration increases as a percent of the maximum allowable PSD increments for a Class II Area.
f A hyphen indicates no increment exists.
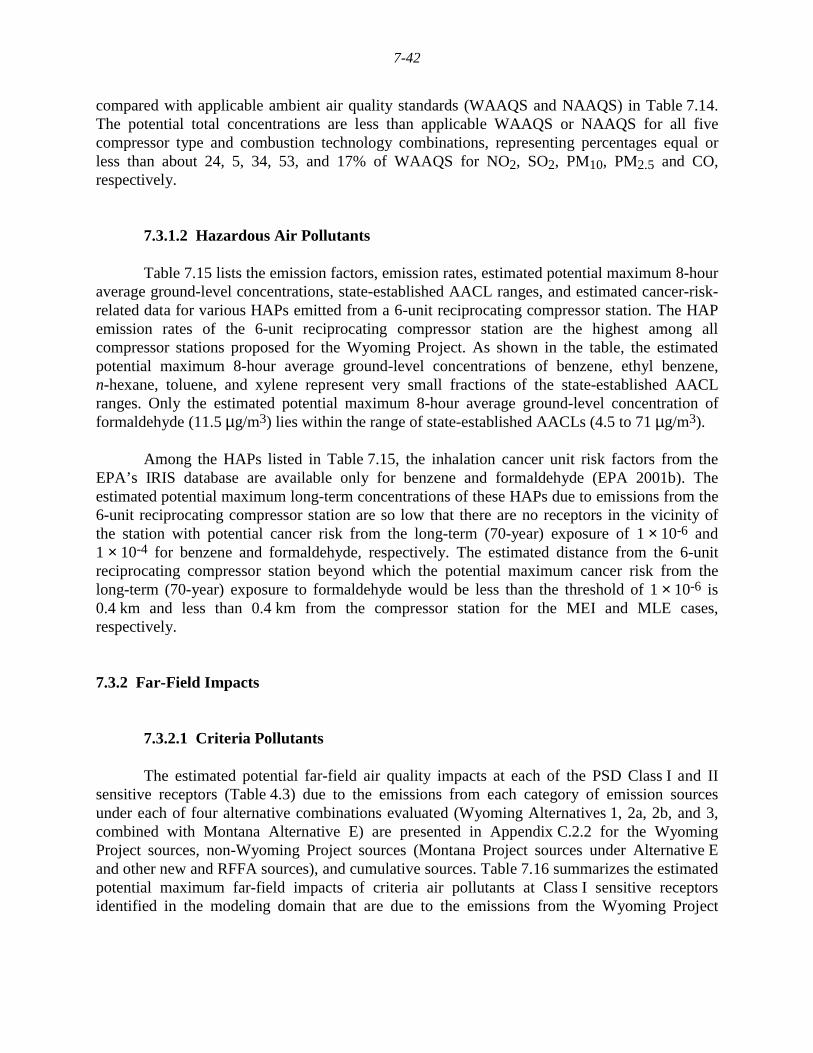
7-42
compared with applicable ambient air quality standards (WAAQS and NAAQS) in Table 7.14.The potential total concentrations are less than applicable WAAQS or NAAQS for all fivecompressor type and combustion technology combinations, representing percentages equal orless than about 24, 5, 34, 53, and 17% of WAAQS for NO2, SO2, PM10, PM2.5 and CO,respectively.
7.3.1.2 Hazardous Air Pollutants
Table 7.15 lists the emission factors, emission rates, estimated potential maximum 8-houraverage ground-level concentrations, state-established AACL ranges, and estimated cancer-risk-related data for various HAPs emitted from a 6-unit reciprocating compressor station. The HAPemission rates of the 6-unit reciprocating compressor station are the highest among allcompressor stations proposed for the Wyoming Project. As shown in the table, the estimatedpotential maximum 8-hour average ground-level concentrations of benzene, ethyl benzene,n-hexane, toluene, and xylene represent very small fractions of the state-established AACLranges. Only the estimated potential maximum 8-hour average ground-level concentration offormaldehyde (11.5 µg/m3) lies within the range of state-established AACLs (4.5 to 71 µg/m3).
Among the HAPs listed in Table 7.15, the inhalation cancer unit risk factors from theEPA’s IRIS database are available only for benzene and formaldehyde (EPA 2001b). Theestimated potential maximum long-term concentrations of these HAPs due to emissions from the6-unit reciprocating compressor station are so low that there are no receptors in the vicinity ofthe station with potential cancer risk from the long-term (70-year) exposure of 1 × 10⁻⁶ and1 × 10-4 for benzene and formaldehyde, respectively. The estimated distance from the 6-unitreciprocating compressor station beyond which the potential maximum cancer risk from thelong-term (70-year) exposure to formaldehyde would be less than the threshold of 1 × 10⁻⁶ is0.4 km and less than 0.4 km from the compressor station for the MEI and MLE cases,respectively.
7.3.2 Far-Field Impacts
7.3.2.1 Criteria Pollutants
The estimated potential far-field air quality impacts at each of the PSD Class I and IIsensitive receptors (Table 4.3) due to the emissions from each category of emission sourcesunder each of four alternative combinations evaluated (Wyoming Alternatives 1, 2a, 2b, and 3,combined with Montana Alternative E) are presented in Appendix C.2.2 for the WyomingProject sources, non-Wyoming Project sources (Montana Project sources under Alternative Eand other new and RFFA sources), and cumulative sources. Table 7.16 summarizes the estimatedpotential maximum far-field impacts of criteria air pollutants at Class I sensitive receptorsidentified in the modeling domain that are due to the emissions from the Wyoming Project
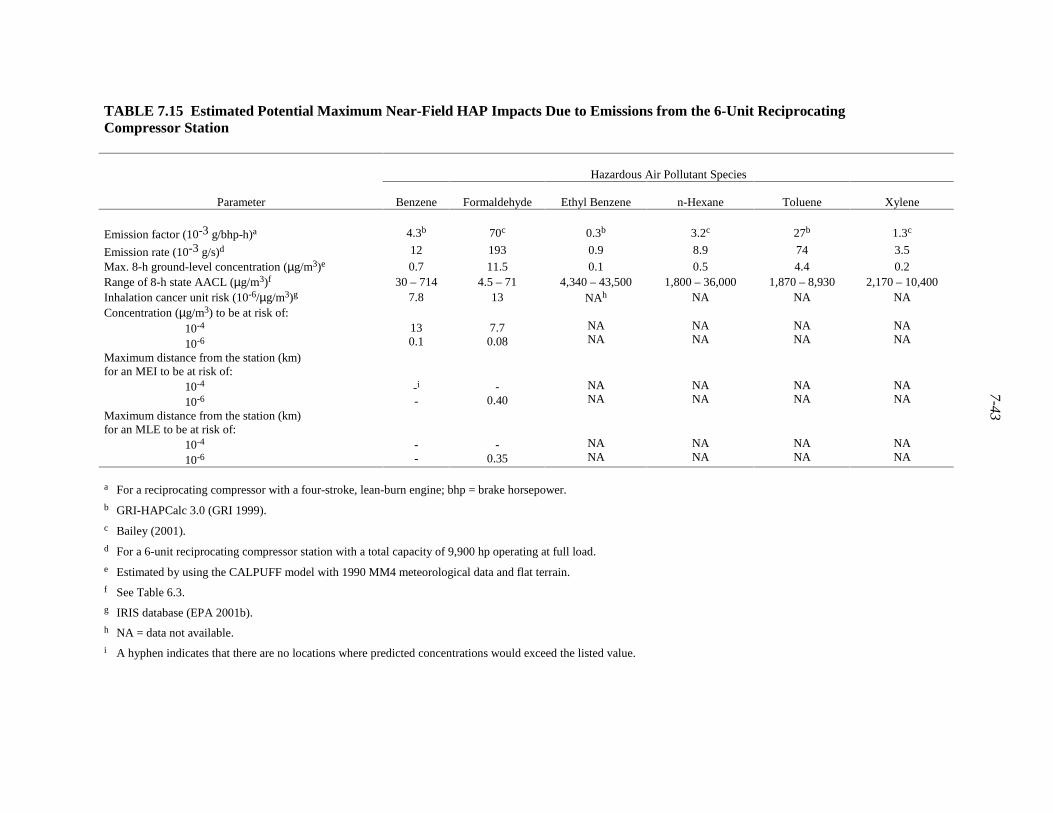
7-43
TABLE 7.15 Estimated Potential Maximum Near-Field HAP Impacts Due to Emissions from the 6-Unit ReciprocatingCompressor Station
Hazardous Air Pollutant Species
Parameter Benzene Formaldehyde Ethyl Benzene n-Hexane Toluene Xylene
Emission factor (10-3 g/bhp-h)a 4.3b 70c 0.3b 3.2c 27b 1.3c
Emission rate (10-3 g/s)d 12 193 0.9 8.9 74 3.5
Max. 8-h ground-level concentration (µg/m3)e 0.7 11.5 0.1 0.5 4.4 0.2Range of 8-h state AACL (µg/m3)f 30 – 714 4.5 – 71 4,340 – 43,500 1,800 – 36,000 1,870 – 8,930 2,170 – 10,400Inhalation cancer unit risk (10-6/µg/m3)g 7.8 13 NAh NA NA NAConcentration (µg/m3) to be at risk of: 10-4
10-6130.1
7.70.08
NANA
NANA
NANA
NANA
Maximum distance from the station (km)for an MEI to be at risk of: 10-4
10-6-i
--
0.40NANA
NANA
NANA
NANA
Maximum distance from the station (km)for an MLE to be at risk of: 10-4
10-6--
-0.35
NANA
NANA
NANA
NANA
a For a reciprocating compressor with a four-stroke, lean-burn engine; bhp = brake horsepower.b GRI-HAPCalc 3.0 (GRI 1999).c Bailey (2001).d For a 6-unit reciprocating compressor station with a total capacity of 9,900 hp operating at full load.e Estimated by using the CALPUFF model with 1990 MM4 meteorological data and flat terrain.f See Table 6.3.g IRIS database (EPA 2001b).h NA = data not available.i A hyphen indicates that there are no locations where predicted concentrations would exceed the listed value.
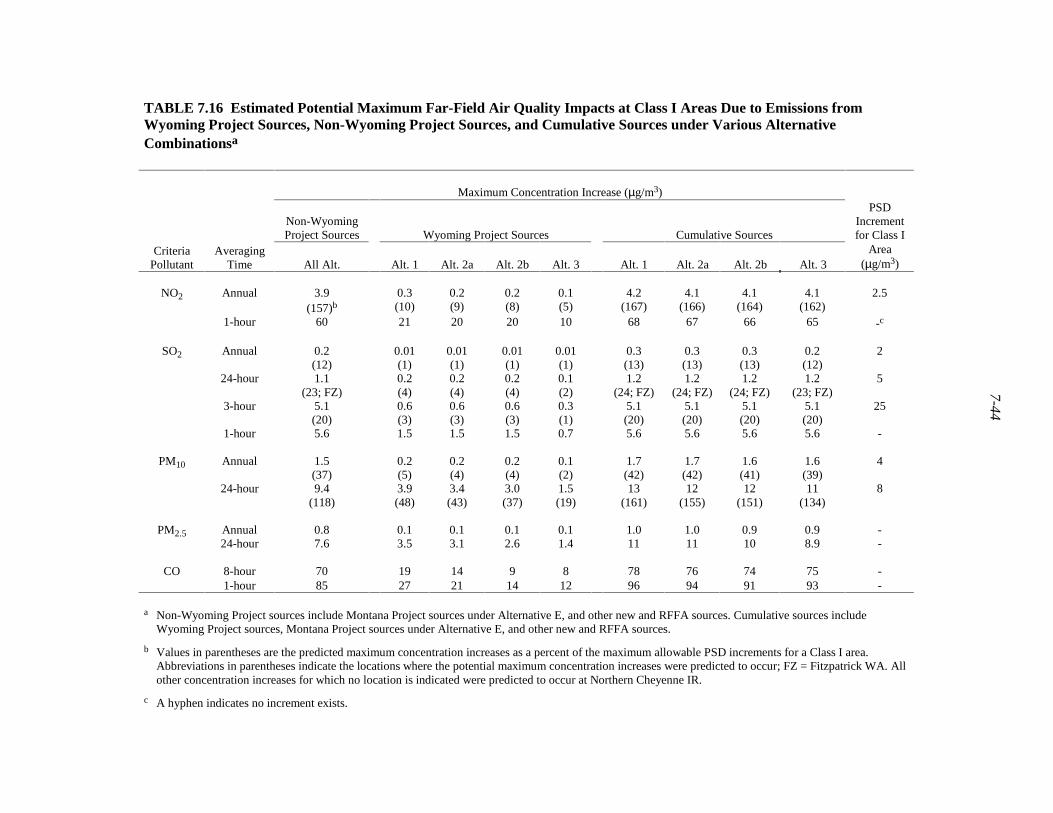
7-44
TABLE 7.16 Estimated Potential Maximum Far-Field Air Quality Impacts at Class I Areas Due to Emissions fromWyoming Project Sources, Non-Wyoming Project Sources, and Cumulative Sources under Various AlternativeCombinationsa
Maximum Concentration Increase (µg/m3)
Non-WyomingProject Sources Wyoming Project Sources Cumulative Sources
PSDIncrementfor Class I
CriteriaPollutant
AveragingTime All Alt. Alt. 1 Alt. 2a Alt. 2b Alt. 3 Alt. 1 Alt. 2a Alt. 2b Alt. 3
Area(µg/m3)
Annual 3.9(157)b
0.3(10)
0.2(9)
0.2(8)
0.1(5)
4.2(167)
4.1(166)
4.1(164)
4.1(162)
2.5NO2
1-hour 60 21 20 20 10 68 67 66 65 -c
Annual 0.2(12)
0.01(1)
0.01(1)
0.01(1)
0.01(1)
0.3(13)
0.3(13)
0.3(13)
0.2(12)
2
24-hour 1.1(23; FZ)
0.2(4)
0.2(4)
0.2(4)
0.1(2)
1.2(24; FZ)
1.2(24; FZ)
1.2(24; FZ)
1.2(23; FZ)
5
3-hour 5.1(20)
0.6(3)
0.6(3)
0.6(3)
0.3(1)
5.1(20)
5.1(20)
5.1(20)
5.1(20)
25
SO2
1-hour 5.6 1.5 1.5 1.5 0.7 5.6 5.6 5.6 5.6 -
Annual 1.5(37)
0.2(5)
0.2(4)
0.2(4)
0.1(2)
1.7(42)
1.7(42)
1.6(41)
1.6(39)
4PM10
24-hour 9.4(118)
3.9(48)
3.4(43)
3.0(37)
1.5(19)
13(161)
12(155)
12(151)
11(134)
8
Annual 0.8 0.1 0.1 0.1 0.1 1.0 1.0 0.9 0.9 -PM2.524-hour 7.6 3.5 3.1 2.6 1.4 11 11 10 8.9 -
8-hour 70 19 14 9 8 78 76 74 75 -CO1-hour 85 27 21 14 12 96 94 91 93 -
a Non-Wyoming Project sources include Montana Project sources under Alternative E, and other new and RFFA sources. Cumulative sources includeWyoming Project sources, Montana Project sources under Alternative E, and other new and RFFA sources.
b Values in parentheses are the predicted maximum concentration increases as a percent of the maximum allowable PSD increments for a Class I area.Abbreviations in parentheses indicate the locations where the potential maximum concentration increases were predicted to occur; FZ = Fitzpatrick WA. Allother concentration increases for which no location is indicated were predicted to occur at Northern Cheyenne IR.
c A hyphen indicates no increment exists.
7-45
sources, non-Wyoming Project sources, and cumulative sources under various alternativecombinations. Among the four Wyoming alternatives, estimated potential maximum air qualityimpacts due to the Wyoming Project emissions are highest under Alternative 1 (ProposedAction) for all criteria pollutants. With a few exceptions, the estimated potential maximum far-field impacts of criteria air pollutants at the Class I sensitive receptors that are due to theWyoming Project source emissions occur at the Northern Cheyenne IR, the closest to theWyoming Project Area among all of the Class I sensitive receptors listed in Table 4.3. Asignificant portion of the high annual NO2 impacts at NC are due to potential well developmentwithin NC lands.
The estimated potential maximum far-field criteria pollutant concentration increases dueto the emissions from Wyoming Project sources are lower than those due to non-WyomingProject source emissions for all criteria pollutants. These concentration increases due to theWyoming Project emissions are considerably less than the maximum allowable PSD incrementsfor Class I areas under all alternatives, representing percentages equal to or less than about 10, 4,and 48% of the maximum allowable Class I PSD increments for NO2, SO2, and PM10,respectively.
The potential increases in maximum far-field concentrations of criteria pollutants due tothe emissions from cumulative sources (Wyoming Project sources, Montana Project sourcesunder Alternative E, and other new and RFFA sources, including RFFA sources on the IR andFS lands) under all four alternative combinations are estimated to be equal to or less than about4.2� ���3������� ���3 for annual and 1-hour NO2, respectively; equal to or less than 0.3, 1.2,�� �������� ���3 for annual, 24-hour, 3-hour, and 1-hour average SO2, respectively; equal to or�������������� ���3�������� ���3 for annual and 24-hour average PM10, respectively; equal to or������������ ���3�������� ���3 for annual and 24-hour average PM2.5, respectively; and equal to��������������� ���3�������� ���3 for 8-hour and 1-hour average CO, respectively.
Among the four alternative combinations, potential far-field air quality impacts due to theemissions from cumulative sources are highest under Alternative 1. Potential maximum far-fieldSO2 concentration increases due to emissions from cumulative sources are less than themaximum allowable Class I PSD increments for SO2 and represent percentages equal to or lessthan about 24% of the maximum allowable Class I PSD increments for SO2. Potential maximumfar-field annual PM10 concentration increases due to the emissions from cumulative sources arealso estimated to be less than the maximum allowable Class I PSD increment for annual PM10(42% or less). The potential maximum far-field annual NO2 concentration increase due to theemissions from cumulative sources is estimated to be about 167% of the maximum allowableClass I PSD increment for annual NO2 at NC, which is primarily due to the emissions fromAlternative Ea (Preferred Alternative with development on IR and FS lands). These emissionsaccount for about 88% of the maximum allowable Class I PSD increment for annual NO2. Thepotential maximum far-field 24-hour PM10 concentration increase due to the emissions fromcumulative sources is estimated to be about 161% of the maximum allowable Class I PSDincrement for 24-hour PM10 at NC, which is primarily due to the emissions from Montana andWyoming Project sources. The potential maximum far-field 24-hour PM10 concentration increasedue to the emissions from these sources is estimated to be about two-thirds of the maximumallowable Class I PSD increment for 24-hour PM10.
7-46
The estimated potential maximum far-field impacts of criteria air pollutants at theClass II sensitive receptors identified in the modeling domain that are due to the emissions fromthe Wyoming Project sources, non-Wyoming Project sources, and cumulative sources aresummarized in Table 7.17 for various alternative combinations. Among the four alternativecombinations, the estimated potential maximum air quality impacts due to Wyoming Projectemissions are highest under Alternative 1 (Proposed Action) for all criteria pollutants. Theestimated potential maximum far-field impacts of criteria air pollutants at the Class II sensitivereceptors occur at the Crow IR (the closest to the Wyoming Project Area among all of theClass II sensitive receptors listed in Table 4.3) or Devils Tower NM (the closest to the WyomingProject Area downwind of the prevailing winds among all of the Class II sensitive receptorslisted in Table 4.3).
The estimated potential maximum far-field criteria pollutant concentration increases dueto Wyoming Project source emissions are lower than those due to non-Wyoming Project sourceemissions for all criteria pollutants. These concentration increases due to Wyoming Projectemissions are only small fractions of the maximum allowable PSD increments for Class II areasunder all alternatives, representing percentages equal to or less than about 2, 0.3, and 18% of themaximum allowable PSD increments for Class II areas for NO2, SO2, and PM10, respectively.
Potential maximum far-field criteria concentration increases for NO2, SO2, and PM10that are due to emissions from cumulative sources are less than the maximum allowable Class IIPSD increments and represent percentages equal to or less than about 22, 6, and 99% of themaximum allowable Class II PSD increments for NO2, SO2, and PM10, respectively.
The estimated potential maximum far-field total concentrations (concentration increasesdue to cumulative source emissions plus baseline concentrations) of criteria pollutants arecompared with applicable ambient air quality standards (WAAQS and NAAQS) in Table 7.18.The estimated potential maximum total concentrations are less than the applicable WAAQS orNAAQS under all alternative combinations, representing percentages equal to or less than about34, 54, 90, 62, and 67% of WAAQS for NO2, SO2, PM10, PM2.5 and CO, respectively.
7.3.2.2 Visibility
The potential far-field visibility impacts due to the emissions from the followingemissions source categories were estimated by the screening and refined procedures(Appendix A) at each of the Class I and II sensitive receptors (Table 4.3) for each of the eightalternative combinations (Wyoming Alternatives 1, 2a, 2b, and 3, combined with MontanaAlternative E or A):
• Non-project sources (new and RFFA sources, excluding the RFFA sources onthe IR and FS lands),
7-47
TABLE 7.17 Estimated Potential Maximum Far-Field Air Quality Impacts at Class II Areas Due to Emissions from WyomingProject Sources, Non-Wyoming Project Sources, and Cumulative Sources under Various Alternative Combinationsa
Maximum Concentration Increase (µg/m3)
Non-WyomingProject Sources Wyoming Project Sources Cumulative Sources
PSDIncrementfor Class II
CriteriaPollutant
AveragingTime All Alt. Alt. 1 Alt. 2a Alt. 2b Alt. 3 Alt. 1 Alt. 2a Alt. 2b Alt. 3
Area(µg/m3)
Annual 5.1(20)b
0.6(2; DT)
0.5(2; DT)
0.5(2; DT)
0.3(1)
5.4(22)
5.4(21)
5.3(21)
5.3(21)
25NO2
1-hour 69 17 15 14 9.8 73 73 72 73 -c
Annual 0.4(2)
0.04(0.2; DT)
0.04(0.2; DT)
0.04(0.2; DT)
0.01(0.0; DT)
0.4(2)
0.4(2)
0.4(2)
0.4(2)
20
24-hour 5.3(6)
0.3(0.3)
0.3(0.3)
0.3(0.3)
0.1(0.2)
5.3(6)
5.3(6)
5.3(6)
5.3(6)
91
3-hour 17(3)
0.7(0.1)
0.7(0.1)
0.7(0.1)
0.3(0.1)
17(3)
17(3)
17(3)
17(3)
512
SO2
1-hour 30 1.0 1.0 1.0 0.5 30 30 30 30 -
Annual 2.7(16; FB)
0.3(2; DT)
0.3(2; DT)
0.2(1; DT)
0.2(1; DT)
2.7(16; FB)
2.7(16; FB)
2.7(16; FB)
2.7(16; FB)
17PM10
24-hour 30(99; FB)
5.5(18)
4.8(16)
4.1(14)
2.1(7)
30(99; FB)
30(99; FB)
30(99; FB)
30(99; FB)
30
Annual 1.2(FB)
0.2(DT)
0.2(DT)
0.2(DT)
0.1 1.2 1.2 1.2 1.2(FB)
-PM2.5
24-hour 13(FB)
5.1 4.5 3.8 2.0 15 14 13 13(FB)
-
8-hour 62 18 14 9.6 9.0 65 65 64 64 -CO1-hour 100
(AB)25
(DT)19
(DT)13
(DT)11 100
(AB)100
(AB)100
(AB)100
(AB)-

7-48
TABLE 7.17 (Cont.)
a Non-Wyoming Project sources include Montana Project sources under Alternative E, and other new and RFFA sources. Cumulative sources includeWyoming Project sources, Montana Project sources under Alternative E, and other new and RFFA sources.
b Values in parentheses are the predicted maximum concentration increases as a percent of the maximum allowable PSD increments for a Class II area.Abbreviations in parentheses indicate the locations where the potential maximum concentration increases were predicted to occur; AB = Absaroka-Beartooth WA; DT = Devils Tower NM; and FB = Fort Belknap IR. All other concentration increases for which no locations are indicated werepredicted to occur at Crow IR.
c A hyphen indicates no increment exists.
7-49
TABLE 7.18 Estimated Potential Maximum Far-Field Total Air Quality Concentrations, Including Contributions from WyomingProject Sources, Non-Wyoming Project Sources, and Cumulative Sources under Various Alternative Combinations
Maximum Concentration (µg/m3)
Increase due to Cumulative Sources Total ConcentrationCriteria
PollutantAveraging
TimeWyoming
Background Alt. 1 Alt. 2a Alt. 2b Alt. 3 Alt. 1 Alt. 2a Alt. 2b Alt. 3WAAQS(µg/m3)
NAAQS(µg/m3)
Annual 16.5 5.4(5)a
5.4(5)
5.3(5)
5.3(5)
18(18; DT)
18(18; DT)
18(18; DT)
17(17; DT)
100 100NO2
1-hour - 73(13)
73(13)
72(13)
73(13)
190(34)
190(34)
190(33)
190(34)
-b -
Annual 3 0.4(1)
0.4(1)
0.4(1)
0.4(1)
16(27)
16(27)
16(27)
16(27)
60 80
24-hour 8 5.3(2)
5.3(2)
5.3(2)
5.3(2)
78(30)
78(30)
78(30)
78(30)
260 365
3-hour 8 17(1)
17(1)
17(1)
17(1)
310(24)
310(24)
310(24)
310(24)
1,300 1,300
SO2
1-hour - 30(2)
30(2)
30(2)
30(2)
700(54)
700(54)
700(54)
700(54)
- -
Annual 17[33]c
2.7(5; FB)
2.7(5; FB)
2.7(5; FB)
2.7(5; FB)
33(65; FB)
33(65; FB)
33(65; FB)
33(65; FB)
50 50PM10
24-hour 42[105]
30(20; FB)
30(20; FB)
30(20; FB)
30(20; FB)
130(90; FB)
130(90; FB)
130(90; FB)
130(90; FB)
150 150
Annual 7.6[9.5]
1.2(8)
1.2(8)
1.2(8)
1.2(8; FB)
9.2(62)
9.2(62)
9.2(61)
9.2(61; FB)
15 15PM2.5
24-hour 19[33]
15(23)
14(22)
13(21)
13(20; FB)
35(53)
34(52)
33(51)
33(50; FB)
65 65
8-hour 1,500 78(1)
76(1)
74(1)
75(1)
6,700(67)
6,700(67)
6,700(67)
6,700(67)
10,000 10,000CO
1-hour 3,500 100(0.4; AB)
100(0.4; AB)
100(0.4; AB)
100(0.4; AB)
15,000(58; AB)
15,000(58; AB)
15,000(58; AB)
15,000(58; AB)
40,000 40,000
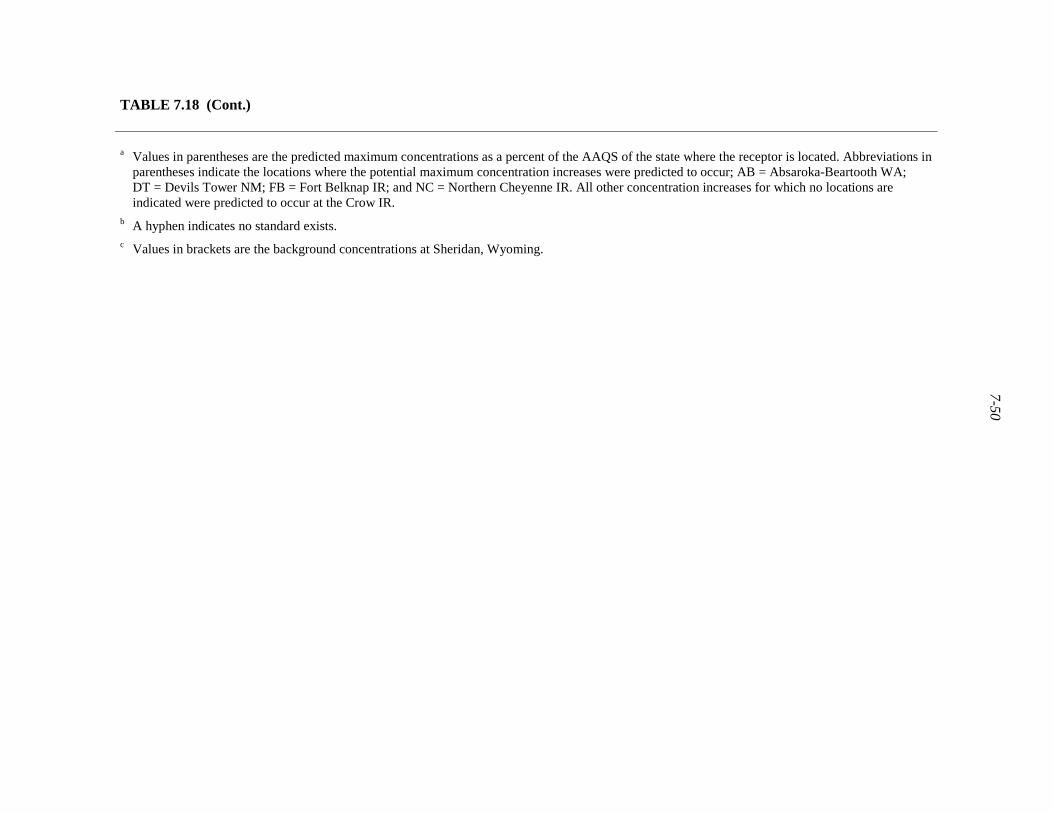
7-50
TABLE 7.18 (Cont.)
a Values in parentheses are the predicted maximum concentrations as a percent of the AAQS of the state where the receptor is located. Abbreviations inparentheses indicate the locations where the potential maximum concentration increases were predicted to occur; AB = Absaroka-Beartooth WA;DT = Devils Tower NM; FB = Fort Belknap IR; and NC = Northern Cheyenne IR. All other concentration increases for which no locations areindicated were predicted to occur at the Crow IR.
b A hyphen indicates no standard exists.c Values in brackets are the background concentrations at Sheridan, Wyoming.
7-51
• Non-Wyoming Project sources (Montana Project sources and other new andRFFA sources),
• Wyoming Project sources, and
• Cumulative sources (Wyoming Project sources, Montana Project sources, andother new and RFFA sources).
The results estimated by the screening procedures are presented in Appendix D.2 andthose estimated by the refined procedure are provided in Appendix E.2.
7.3.2.2.1 Screening Analysis. Tables 7.19 and 7.20 summarize the potential annualnumber of days with visibility degradation equal to or greater than 0.5 dv and 1.0 dv,respectively, estimated by the WDEQ and FLAG screening procedures at the visibility-sensitivereceptors.
The estimated potential annual number of days with visibility degradation equal to orgreater than 0.5 dv due to emissions from the Wyoming Project sources estimated by the WDEQscreening procedure ranges from 6 days at FZ under Alternative 3, to 55 days at BL underAlternative 1. The annual number of days equal to or greater than 1.0 dv due to emissions fromthe Wyoming Project sources estimated by the WDEQ screening procedure ranges from 2 daysat BL and WC under Alternative 3, to 28 days at WC under Alternative 1.
The estimated potential annual number of days with visibility degradation equal to orgreater than 0.5 and 1.0 dv due to emissions from each of the source categories estimated by theFLAG screening procedure is larger than the number estimated by the WDEQ screeningprocedure. The estimated potential annual number of days with visibility degradation equal to orgreater than 0.5 dv due to emissions from the Wyoming Project sources estimated by the FLAGscreening procedure ranges from less than 1 day at RR under Alternative 3, to 215 days at DTunder Alternative 1. The estimated potential annual number of days with a visibility degradationequal to or greater than 1.0 dv due to emissions from the Wyoming Project sources estimated bythe FLAG screening procedure ranges from less than 1 day at GM, RR, and SG underAlternative 3, to 144 days at DT under Alternative 1.
Potential visibility impacts due to the Wyoming Project emissions are highest underAlternative 1. According to the WDEQ screening procedure estimates, potential maximumvisibility impacts at the PSD Class I sensitive receptors occur at BL and WC, the PSD Class Iareas located closest to the downwind direction of prevailing winds from the Wyoming ProjectArea among all of the PSD Class I areas evaluated using the WDEQ screening procedure.According to the FLAG screening procedure estimates, potential maximum visibility impacts atthe Class I and II sensitive receptors occur at DT, the receptor closest to the Wyoming ProjectArea in the downwind direction of prevailing winds among all Class I and II visibility-sensitivereceptors evaluated. In general, estimated potential visibility impacts decrease as the distancebetween the Wyoming Project Area and the receptor area increases and as the direction from the
7-52
TABLE 7.19 Estimated Potential Visibility Impairment (�dv � 0.5) Due to Emissions from Wyoming Project Sources, Non-WyomingProject Sources, and Cumulative Sources Predicted by Screening Procedures under Various Alternative Combinationsa
Visibility-Sensitive Receptor Number of Days with ∆dv ≥ 0.5b
Locationc Non- Project Non-WyomingSources Project Sources Wyoming Project Sources Cumulative Sources
ScreeningProcedure Name
PSDClass
Distance(km) Direction All Alt. All Alt. Alt. 1 Alt. 2a Alt. 2b Alt. 3 Alt. 1 Alt. 2a Alt. 2b Alt. 3
WDEQ Badlands WA I 280 E 108 129d
11155 44 40 21 158d
147154144
153141
145131
Bridger WA I 306 WSW 42 5445
21 20 15 8 5953
5953
5852
5450
Fitzpatrick WA I 294 WSW 42 5246
20 18 14 6 5750
5750
5750
5547
N. Absaroka WA I 290 W 50 6353
19 18 14 8 6560
6560
6558
6457
Washakie WA I 272 W 56 6756
24 22 22 12 6863
6863
6863
6859
Wind Cave NP I 209 ESE 134 149139
54 47 38 20 182170
177168
174166
165156
Badlands WA I 280 E 191 215196
102 91 86 44 240229
240229
239228
231210
Bridger WA I 306 WSW 51 6053
26 24 23 12 6662
6661
6661
6358
Fitzpatrick WA I 294 WSW 51 5852
22 21 21 10 6359
6358
6357
6154
Fort Peck IR I 411 N 39 6142
14 12 12 3 7159
7157
7156
6752
Gates of theMountains WA
I 521 NW 144 148145
5 5 4 2 149147
149147
149147
148147
FLAG
7-53
TABLE 7.19 (Cont.)
Visibility-Sensitive Receptor Number of Days with ∆dv ≥ 0.5b
Locationc Non-Project Non-WyomingSources Project Sources Wyoming Project Sources Cumulative Sources
ScreeningProcedure Name
PSDClass
Distance(km) Direction All Alt. All Alt. Alt. 1 Alt. 2a Alt. 2b Alt. 3 Alt. 1 Alt. 2a Alt. 2b Alt. 3
FLAG(Cont.)
Grand Teton NP I 368 W 24 32d
25
14 11 11 6 35d
32
3532
3532
3227
N. Absaroka WA I 290 W 68 8772
21 21 19 10 8978
8978
8978
8875
N. Cheyenne IR I 149 NNW 332 364337
124 121 117 90 364338
364338
364338
364337
Red Rock Lakes WA I 446 W 30 3632
6 5 4 0 3837
3837
3837
3736
Scapegoat WA I 593 NW 51 5552
3 3 3 2 5653
5653
5652
5652
Teton WA I 315 W 46 5646
18 18 16 9 5850
5850
5749
5747
T. Roosevelt NP-North
I 411 NNE 44 6449
24 20 19 8 8367
8265
8064
6856
T. Roosevelt NP-South
I 346 NNE 82 10485
44 40 36 19 117106
117105
114103
11092
UL Bend WA I 388 NNW 81 10182
17 15 14 6 10394
10393
10393
10186
Washakie WA I 272 W 68 8171
29 27 26 15 8377
8377
8377
8274
Wind Cave NP I 209 ESE 235 249235
124 109 102 43 265264
264254
263254
255245
Yellowstone NP I 348 W 72 8278
20 19 16 10 8381
8380
8380
8279
7-54
TABLE 7.19 (Cont.)
Visibility-Sensitive Receptor Number of Days with ∆dv ≥ 0.5b
Locationc Non-Project Non-WyomingSources Project Sources Wyoming Project Sources Cumulative Sources
ScreeningProcedure Name
PSDClass
Distance(km) Direction All Alt. All Alt. Alt. 1 Alt. 2a Alt. 2b Alt. 3 Alt. 1 Alt. 2a Alt. 2b Alt. 3
FLAG(Cont.)
Absaroka-BeartoothWA
II 330 WNW 175 178d
177
20 19 18 12 178d
177
178177
178177
178177
Agate Fossil BedsNM
II 262 SE 193 204194
85 78 67 25 221215
220213
218211
211203
Bighorn CanyonNRA
II 189 WNW 249 269257
54 50 48 33 269259
269259
269259
269259
Black Elk WA II 195 E 229 250231
117 107 96 38 268261
268259
268258
260248
Cloud Peak WA II 96 W 115 142121
105 100 97 62 158148
158147
157147
152137
Crow IR II 169 NW 356 364364
166 164 162 140 364364
364364
364364
364364
Devils Tower NM II 104 ENE 240 284253
215 211 203 120 302286
301285
299285
291270
Fort Belknap IR II 411 N 354 356355
13 10 8 4 356356
356356
356356
356356
Fort Laramie NHS II 246 SSE 195 207195
62 56 53 27 228218
224216
222215
212205
Jewel Cave NM II 175 ESE 238 257240
138 127 119 52 268258
268257
268257
263249
Mt. RushmoreNational Memorial
II 199 E 213 235217
110 100 85 37 253242
251239
251239
245229
Popo Agie WA II 289 WSW 54 6056
26 26 25 12 6463
6462
6462
6259
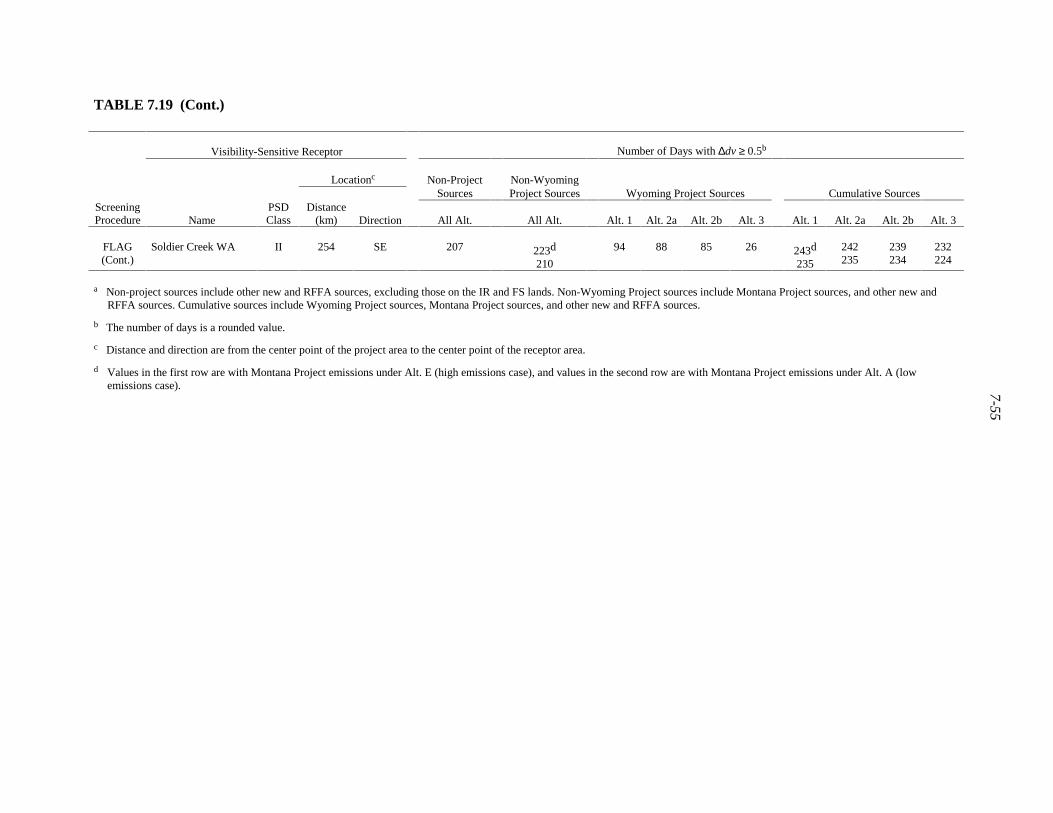
7-55
TABLE 7.19 (Cont.)
Visibility-Sensitive Receptor Number of Days with ∆dv ≥ 0.5b
Locationc Non-Project Non-WyomingSources Project Sources Wyoming Project Sources Cumulative Sources
ScreeningProcedure Name
PSDClass
Distance(km) Direction All Alt. All Alt. Alt. 1 Alt. 2a Alt. 2b Alt. 3 Alt. 1 Alt. 2a Alt. 2b Alt. 3
FLAG(Cont.)
Soldier Creek WA II 254 SE 207 223d
210
94 88 85 26 243d
235
242235
239234
232224
a Non-project sources include other new and RFFA sources, excluding those on the IR and FS lands. Non-Wyoming Project sources include Montana Project sources, and other new andRFFA sources. Cumulative sources include Wyoming Project sources, Montana Project sources, and other new and RFFA sources.
b The number of days is a rounded value.
c Distance and direction are from the center point of the project area to the center point of the receptor area.
d Values in the first row are with Montana Project emissions under Alt. E (high emissions case), and values in the second row are with Montana Project emissions under Alt. A (lowemissions case).
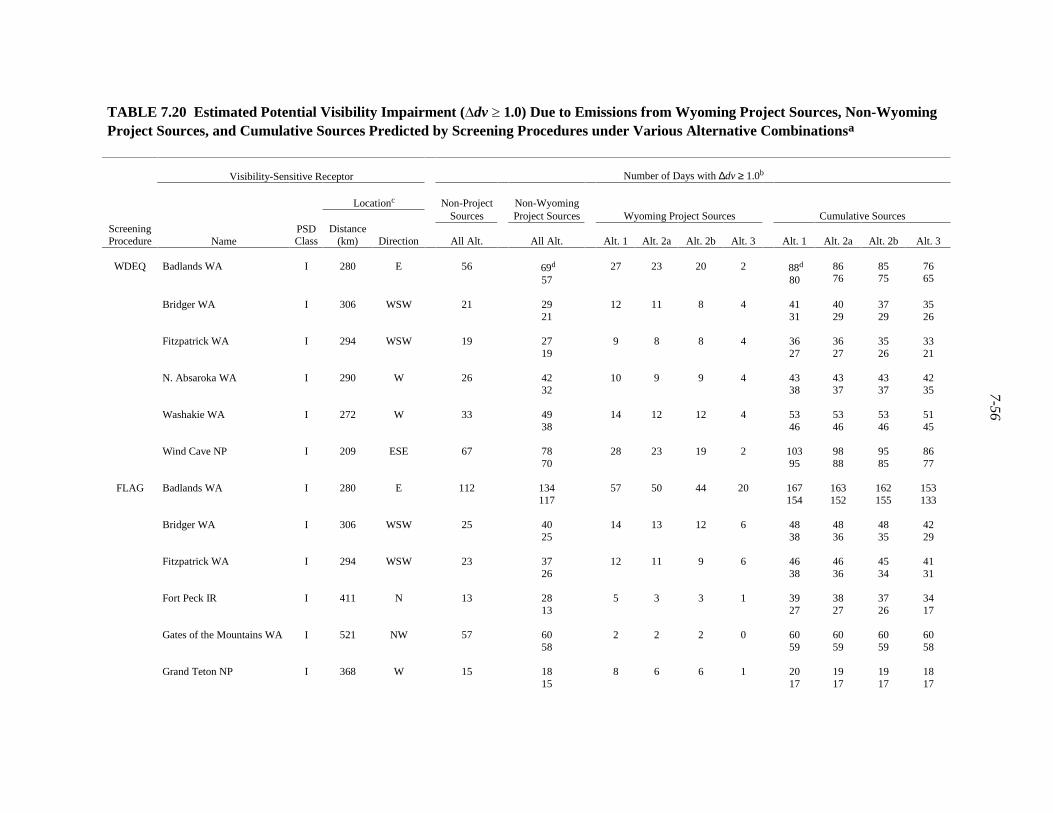
7-56
TABLE 7.20 Estimated Potential Visibility Impairment (�dv � 1.0) Due to Emissions from Wyoming Project Sources, Non-WyomingProject Sources, and Cumulative Sources Predicted by Screening Procedures under Various Alternative Combinationsa
Visibility-Sensitive Receptor Number of Days with ∆dv ≥ 1.0b
Locationc Non-Project Non-WyomingSources Project Sources Wyoming Project Sources Cumulative Sources
ScreeningProcedure Name
PSDClass
Distance(km) Direction All Alt. All Alt. Alt. 1 Alt. 2a Alt. 2b Alt. 3 Alt. 1 Alt. 2a Alt. 2b Alt. 3
Badlands WA I 280 E 56 69d
5727 23 20 2 88d
808676
8575
7665
Bridger WA I 306 WSW 21 2921
12 11 8 4 4131
4029
3729
3526
Fitzpatrick WA I 294 WSW 19 2719
9 8 8 4 3627
3627
3526
3321
N. Absaroka WA I 290 W 26 4232
10 9 9 4 4338
4337
4337
4235
Washakie WA I 272 W 33 4938
14 12 12 4 5346
5346
5346
5145
WDEQ
Wind Cave NP I 209 ESE 67 7870
28 23 19 2 10395
9888
9585
8677
FLAG Badlands WA I 280 E 112 134117
57 50 44 20 167154
163152
162155
153133
Bridger WA I 306 WSW 25 4025
14 13 12 6 4838
4836
4835
4229
Fitzpatrick WA I 294 WSW 23 3726
12 11 9 6 4638
4636
4534
4131
Fort Peck IR I 411 N 13 2813
5 3 3 1 3927
3827
3726
3417
Gates of the Mountains WA I 521 NW 57 6058
2 2 2 0 6059
6059
6059
6058
Grand Teton NP I 368 W 15 1815
8 6 6 1 2017
1917
1917
1817
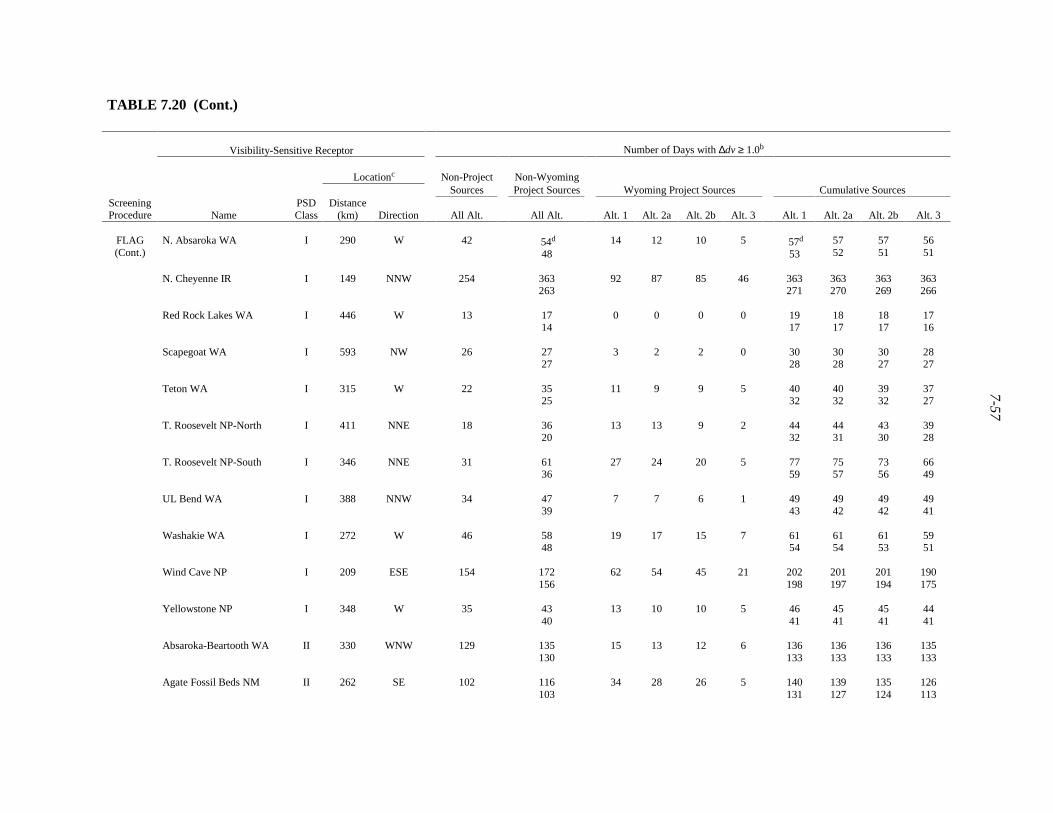
7-57
TABLE 7.20 (Cont.)
Visibility-Sensitive Receptor Number of Days with ∆dv ≥ 1.0b
Locationc Non-Project Non-WyomingSources Project Sources Wyoming Project Sources Cumulative Sources
ScreeningProcedure Name
PSDClass
Distance(km) Direction All Alt. All Alt. Alt. 1 Alt. 2a Alt. 2b Alt. 3 Alt. 1 Alt. 2a Alt. 2b Alt. 3
FLAG(Cont.)
N. Absaroka WA I 290 W 42 54d
4814 12 10 5 57d
535752
5751
5651
N. Cheyenne IR I 149 NNW 254 363263
92 87 85 46 363271
363270
363269
363266
Red Rock Lakes WA I 446 W 13 1714
0 0 0 0 1917
1817
1817
1716
Scapegoat WA I 593 NW 26 2727
3 2 2 0 3028
3028
3027
2827
Teton WA I 315 W 22 3525
11 9 9 5 4032
4032
3932
3727
T. Roosevelt NP-North I 411 NNE 18 3620
13 13 9 2 4432
4431
4330
3928
T. Roosevelt NP-South I 346 NNE 31 6136
27 24 20 5 7759
7557
7356
6649
UL Bend WA I 388 NNW 34 4739
7 7 6 1 4943
4942
4942
4941
Washakie WA I 272 W 46 5848
19 17 15 7 6154
6154
6153
5951
Wind Cave NP I 209 ESE 154 172156
62 54 45 21 202198
201197
201194
190175
Yellowstone NP I 348 W 35 4340
13 10 10 5 4641
4541
4541
4441
Absaroka-Beartooth WA II 330 WNW 129 135130
15 13 12 6 136133
136133
136133
135133
Agate Fossil Beds NM II 262 SE 102 116103
34 28 26 5 140131
139127
135124
126113

7-58
TABLE 7.20 (Cont.)
Visibility-Sensitive Receptor Number of Days with ∆dv ≥ 1.0b
Locationc Non-Project Non-WyomingSources Project Sources Wyoming Project Sources Cumulative Sources
ScreeningProcedure Name
PSDClass
Distance(km) Direction All Alt. All Alt. Alt. 1 Alt. 2a Alt. 2b Alt. 3 Alt. 1 Alt. 2a Alt. 2b Alt. 3
FLAG(Cont.)
Bighorn Canyon NRA II 189 WNW 166 191d
17736 32 29 17 194d
182194182
193182
193179
Black Elk WA II 195 E 146 165148
58 49 40 18 209195
207190
200185
184163
Cloud Peak WA II 96 W 69 11076
65 60 56 31 128114
125112
124111
118100
Crow IR II 169 NW 306 364348
123 116 113 87 364348
364348
364348
364348
Devils Tower NM II 104 ENE 170 213176
144 130 124 54 255237
253234
251233
238208
Fort Belknap IR II 411 N 326 327326
5 4 4 1 327327
327327
327327
327326
Fort Laramie NHS II 246 SSE 108 122112
39 33 26 10 145137
143135
140133
130118
Jewel Cave NM II 175 ESE 167 189169
71 64 53 23 220210
215205
214202
204187
Mt. Rushmore NationalMemorial
II 199 E 133 153137
53 43 38 18 186173
182167
177164
162146
Popo Agie WA II 289 WSW 30 4131
15 14 13 5 4745
4744
4744
4639
Soldier Creek WA II 254 SE 125 141127
35 32 29 6 166157
165156
164154
154140

7-59
TABLE 7.20 (Cont.)
a Non-project sources include other new and RFFA sources, excluding those on the IR and FS lands. Non-Wyoming Project sources include Montana Project sources, and other new and RFFAsources. Cumulative sources include Wyoming Project sources, Montana Project sources, and other new and RFFA sources.
b The number of days is a rounded value.
c Distance and direction are from the center point of the project area to the center point of the receptor area.
d Values in the first row are with Montana Project emissions under Alt. E (high emissions case), and values in the second row are with Montana Project emissions under Alt. A (low emissionscase).
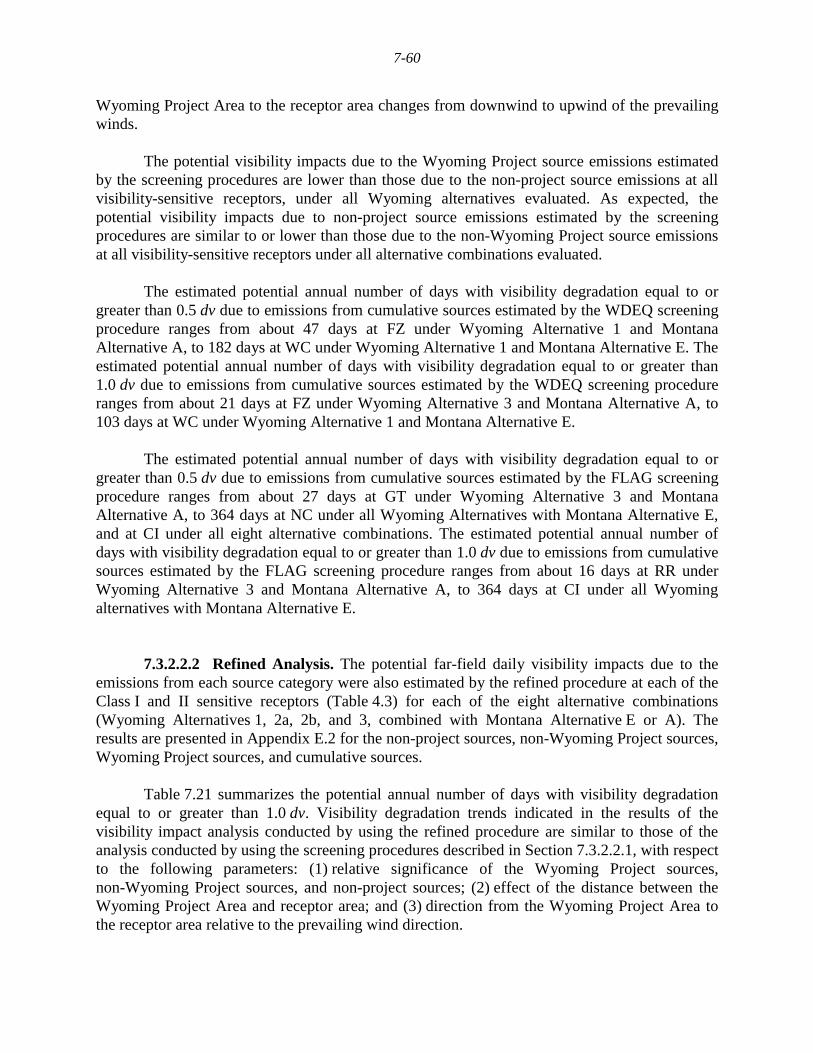
7-60
Wyoming Project Area to the receptor area changes from downwind to upwind of the prevailingwinds.
The potential visibility impacts due to the Wyoming Project source emissions estimatedby the screening procedures are lower than those due to the non-project source emissions at allvisibility-sensitive receptors, under all Wyoming alternatives evaluated. As expected, thepotential visibility impacts due to non-project source emissions estimated by the screeningprocedures are similar to or lower than those due to the non-Wyoming Project source emissionsat all visibility-sensitive receptors under all alternative combinations evaluated.
The estimated potential annual number of days with visibility degradation equal to orgreater than 0.5 dv due to emissions from cumulative sources estimated by the WDEQ screeningprocedure ranges from about 47 days at FZ under Wyoming Alternative 1 and MontanaAlternative A, to 182 days at WC under Wyoming Alternative 1 and Montana Alternative E. Theestimated potential annual number of days with visibility degradation equal to or greater than1.0 dv due to emissions from cumulative sources estimated by the WDEQ screening procedureranges from about 21 days at FZ under Wyoming Alternative 3 and Montana Alternative A, to103 days at WC under Wyoming Alternative 1 and Montana Alternative E.
The estimated potential annual number of days with visibility degradation equal to orgreater than 0.5 dv due to emissions from cumulative sources estimated by the FLAG screeningprocedure ranges from about 27 days at GT under Wyoming Alternative 3 and MontanaAlternative A, to 364 days at NC under all Wyoming Alternatives with Montana Alternative E,and at CI under all eight alternative combinations. The estimated potential annual number ofdays with visibility degradation equal to or greater than 1.0 dv due to emissions from cumulativesources estimated by the FLAG screening procedure ranges from about 16 days at RR underWyoming Alternative 3 and Montana Alternative A, to 364 days at CI under all Wyomingalternatives with Montana Alternative E.
7.3.2.2.2 Refined Analysis. The potential far-field daily visibility impacts due to theemissions from each source category were also estimated by the refined procedure at each of theClass I and II sensitive receptors (Table 4.3) for each of the eight alternative combinations(Wyoming Alternatives 1, 2a, 2b, and 3, combined with Montana Alternative E or A). Theresults are presented in Appendix E.2 for the non-project sources, non-Wyoming Project sources,Wyoming Project sources, and cumulative sources.
Table 7.21 summarizes the potential annual number of days with visibility degradationequal to or greater than 1.0 dv. Visibility degradation trends indicated in the results of thevisibility impact analysis conducted by using the refined procedure are similar to those of theanalysis conducted by using the screening procedures described in Section 7.3.2.2.1, with respectto the following parameters: (1) relative significance of the Wyoming Project sources,non-Wyoming Project sources, and non-project sources; (2) effect of the distance between theWyoming Project Area and receptor area; and (3) direction from the Wyoming Project Area tothe receptor area relative to the prevailing wind direction.
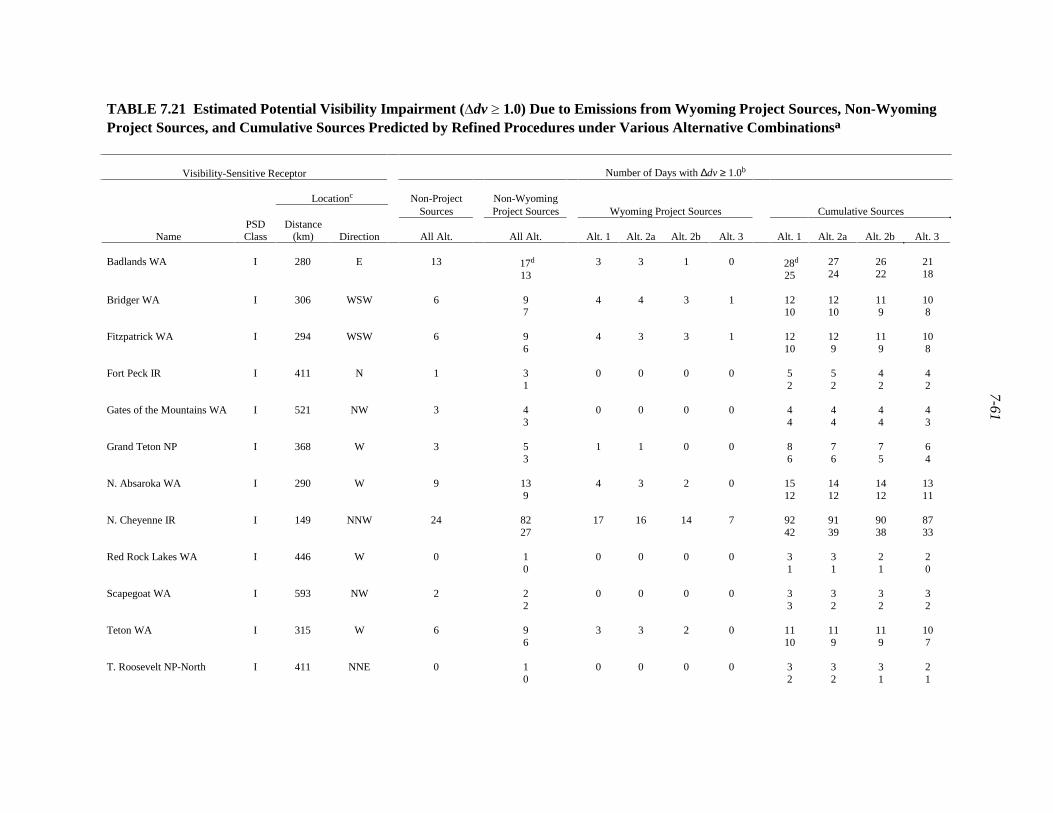
7-61
TABLE 7.21 Estimated Potential Visibility Impairment (�dv � 1.0) Due to Emissions from Wyoming Project Sources, Non-WyomingProject Sources, and Cumulative Sources Predicted by Refined Procedures under Various Alternative Combinationsa
Visibility-Sensitive Receptor Number of Days with ∆dv ≥ 1.0b
Locationc Non-Project Non-WyomingSources Project Sources Wyoming Project Sources Cumulative Sources
NamePSDClass
Distance(km) Direction All Alt. All Alt. Alt. 1 Alt. 2a Alt. 2b Alt. 3 Alt. 1 Alt. 2a Alt. 2b Alt. 3
Badlands WA I 280 E 13 17d
133 3 1 0 28d
252724
2622
2118
Bridger WA I 306 WSW 6 97
4 4 3 1 1210
1210
119
108
Fitzpatrick WA I 294 WSW 6 96
4 3 3 1 1210
129
119
108
Fort Peck IR I 411 N 1 31
0 0 0 0 52
52
42
42
Gates of the Mountains WA I 521 NW 3 43
0 0 0 0 44
44
44
43
Grand Teton NP I 368 W 3 53
1 1 0 0 86
76
75
64
N. Absaroka WA I 290 W 9 139
4 3 2 0 1512
1412
1412
1311
N. Cheyenne IR I 149 NNW 24 8227
17 16 14 7 9242
9139
9038
8733
Red Rock Lakes WA I 446 W 0 10
0 0 0 0 31
31
21
20
Scapegoat WA I 593 NW 2 22
0 0 0 0 33
32
32
32
Teton WA I 315 W 6 96
3 3 2 0 1110
119
119
107
T. Roosevelt NP-North I 411 NNE 0 10
0 0 0 0 32
32
31
21
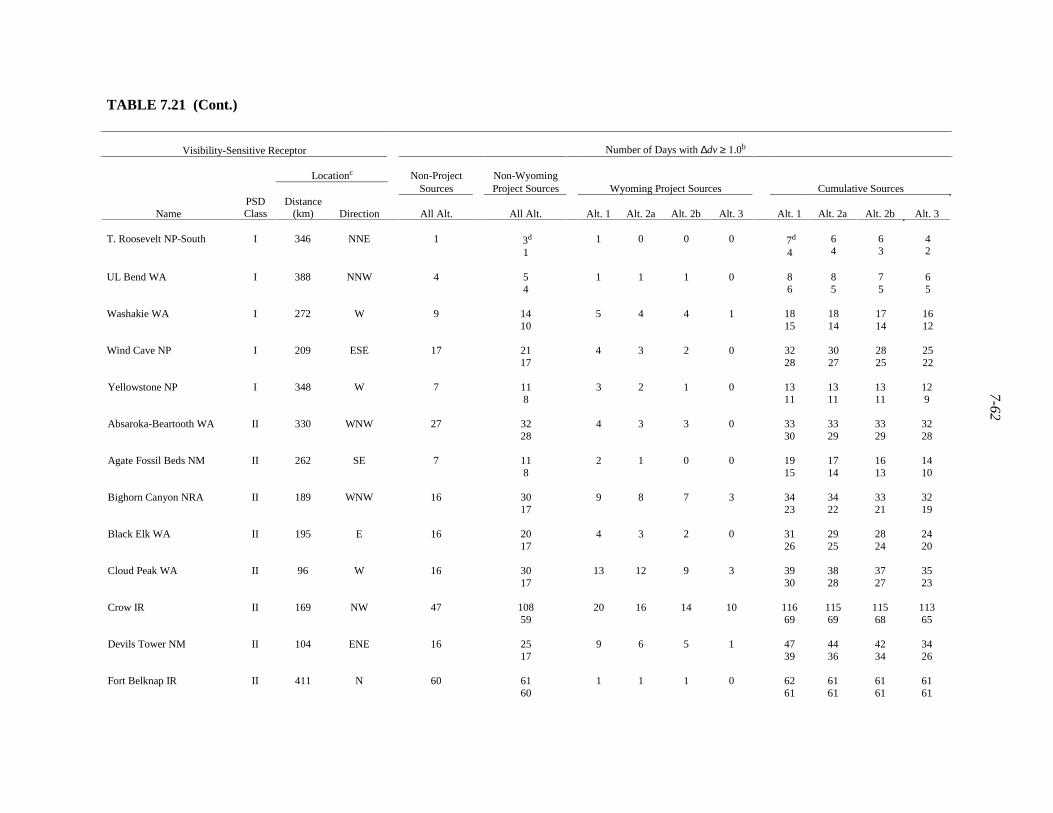
7-62
TABLE 7.21 (Cont.)
Visibility-Sensitive Receptor Number of Days with ∆dv ≥ 1.0b
Locationc Non-Project Non-WyomingSources Project Sources Wyoming Project Sources Cumulative Sources
NamePSDClass
Distance(km) Direction All Alt. All Alt. Alt. 1 Alt. 2a Alt. 2b Alt. 3 Alt. 1 Alt. 2a Alt. 2b Alt. 3
T. Roosevelt NP-South I 346 NNE 1 3d
11 0 0 0 7d
464
63
42
UL Bend WA I 388 NNW 4 54
1 1 1 0 86
85
75
65
Washakie WA I 272 W 9 1410
5 4 4 1 1815
1814
1714
1612
Wind Cave NP I 209 ESE 17 2117
4 3 2 0 3228
3027
2825
2522
Yellowstone NP I 348 W 7 118
3 2 1 0 1311
1311
1311
129
Absaroka-Beartooth WA II 330 WNW 27 3228
4 3 3 0 3330
3329
3329
3228
Agate Fossil Beds NM II 262 SE 7 118
2 1 0 0 1915
1714
1613
1410
Bighorn Canyon NRA II 189 WNW 16 3017
9 8 7 3 3423
3422
3321
3219
Black Elk WA II 195 E 16 2017
4 3 2 0 3126
2925
2824
2420
Cloud Peak WA II 96 W 16 3017
13 12 9 3 3930
3828
3727
3523
Crow IR II 169 NW 47 10859
20 16 14 10 11669
11569
11568
11365
Devils Tower NM II 104 ENE 16 2517
9 6 5 1 4739
4436
4234
3426
Fort Belknap IR II 411 N 60 6160
1 1 1 0 6261
6161
6161
6161
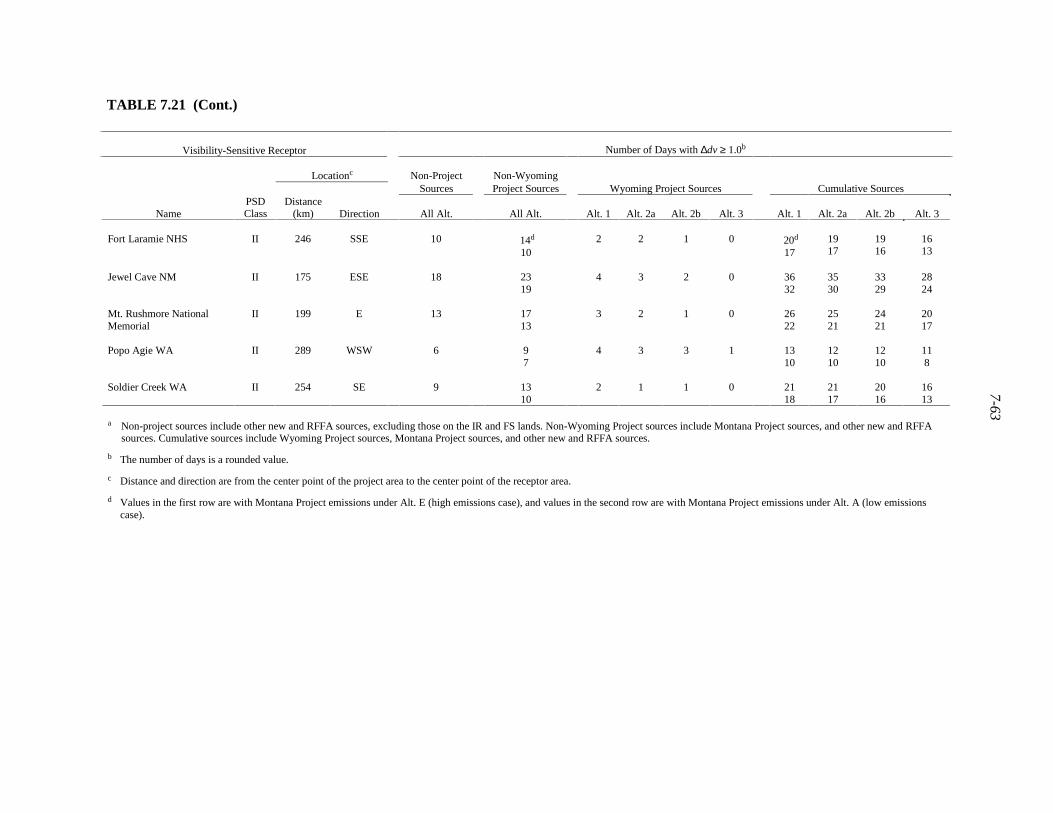
7-63
TABLE 7.21 (Cont.)
Visibility-Sensitive Receptor Number of Days with ∆dv ≥ 1.0b
Locationc Non-Project Non-WyomingSources Project Sources Wyoming Project Sources Cumulative Sources
NamePSDClass
Distance(km) Direction All Alt. All Alt. Alt. 1 Alt. 2a Alt. 2b Alt. 3 Alt. 1 Alt. 2a Alt. 2b Alt. 3
Fort Laramie NHS II 246 SSE 10 14d
102 2 1 0 20d
171917
1916
1613
Jewel Cave NM II 175 ESE 18 2319
4 3 2 0 3632
3530
3329
2824
Mt. Rushmore NationalMemorial
II 199 E 13 1713
3 2 1 0 2622
2521
2421
2017
Popo Agie WA II 289 WSW 6 97
4 3 3 1 1310
1210
1210
118
Soldier Creek WA II 254 SE 9 1310
2 1 1 0 2118
2117
2016
1613
a Non-project sources include other new and RFFA sources, excluding those on the IR and FS lands. Non-Wyoming Project sources include Montana Project sources, and other new and RFFAsources. Cumulative sources include Wyoming Project sources, Montana Project sources, and other new and RFFA sources.
b The number of days is a rounded value.
c Distance and direction are from the center point of the project area to the center point of the receptor area.
d Values in the first row are with Montana Project emissions under Alt. E (high emissions case), and values in the second row are with Montana Project emissions under Alt. A (low emissionscase).
7-64
The potential annual number of days with visibility degradation equal to or greater than1.0 dv due to emissions from the Wyoming Project sources as estimated by the refined procedureis less than 1 day at the majority of the visibility-sensitive receptors evaluated under one or moreWyoming Alternatives. The highest estimated potential annual number of days with visibilitydegradation equal to or greater than 1.0 dv due to emissions from the Wyoming Project sourcesas estimated by the refined procedure is 20 days at CI under the Wyoming Alternative 1.
The potential visibility impacts due to the Wyoming Project source emissions estimatedby the refined procedure are lower than those due to the non-project source emissions at allvisibility-sensitive receptors under all Wyoming Project alternatives evaluated. As expected, thepotential visibility impacts due to non-project source emissions estimated by the refinedprocedure are similar to or lower than those due to the non-Wyoming Project source emissions atall visibility-sensitive receptors under all alternative combinations evaluated.
The potential annual number of days with visibility degradation equal to or greater than1.0 dv due to emissions from cumulative sources estimated by the refined procedure ranges fromless than 1 day at RR under Wyoming Alternative 3 and Montana Alternative A, to 116 days atCI under Wyoming Alternative 1 and Montana Alternative E.
7.3.2.3 Acid Deposition
The potential far-field acid deposition impacts due to the emissions from each of thefollowing source categories were estimated at each of the Class I and II sensitive receptors(Table 4.3) and sensitive lakes (Table 4.5) for each of the eight alternative combinations(Wyoming Alternatives 1, 2a, 2b, and 3, combined with Montana Alternative E or A):
• Non-project sources (new and RFFA sources, excluding the RFFA sources onthe IR and FS lands),
• Non-Wyoming Project sources (Montana Project sources and other new andRFFA sources),
• Wyoming Project sources, and
• Cumulative sources (Wyoming Project sources, Montana Project sources, andother new and RFFA sources).
The results are presented in Appendix F.2.
The predicted maximum acid deposition fluxes at the Class I and II sensitive receptorslisted in Table 4.3 due to the emissions from cumulative sources under Wyoming Alternative 1and Montana Alternative E occur at the Fort Belknap IR for sulfur (0.12 kg/ha/yr) and at theNorthern Cheyenne IR for nitrogen (0.97 kg/ha/yr). These annual deposition fluxes areapproximately 2 and 32% of the LAC thresholds of 5 and 3 kg/ha/yr for total sulfur and nitrogendeposition fluxes, respectively. Adding these predicted maximum increases in acid deposition
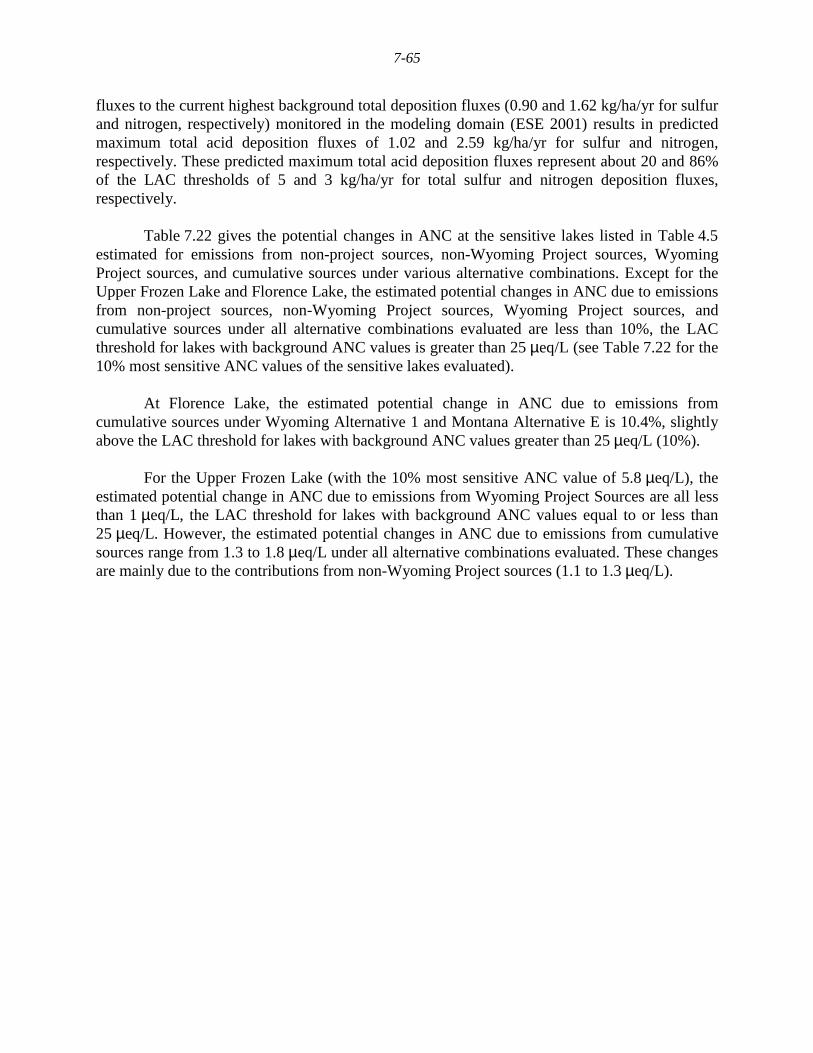
7-65
fluxes to the current highest background total deposition fluxes (0.90 and 1.62 kg/ha/yr for sulfurand nitrogen, respectively) monitored in the modeling domain (ESE 2001) results in predictedmaximum total acid deposition fluxes of 1.02 and 2.59 kg/ha/yr for sulfur and nitrogen,respectively. These predicted maximum total acid deposition fluxes represent about 20 and 86%of the LAC thresholds of 5 and 3 kg/ha/yr for total sulfur and nitrogen deposition fluxes,respectively.
Table 7.22 gives the potential changes in ANC at the sensitive lakes listed in Table 4.5estimated for emissions from non-project sources, non-Wyoming Project sources, WyomingProject sources, and cumulative sources under various alternative combinations. Except for theUpper Frozen Lake and Florence Lake, the estimated potential changes in ANC due to emissionsfrom non-project sources, non-Wyoming Project sources, Wyoming Project sources, andcumulative sources under all alternative combinations evaluated are less than 10%, the LACthreshold for lakes with background ANC values is greater than 25 µeq/L (see Table 7.22 for the10% most sensitive ANC values of the sensitive lakes evaluated).
At Florence Lake, the estimated potential change in ANC due to emissions fromcumulative sources under Wyoming Alternative 1 and Montana Alternative E is 10.4%, slightlyabove the LAC threshold for lakes with background ANC values greater than 25 µeq/L (10%).
For the Upper Frozen Lake (with the 10% most sensitive ANC value of 5.8 µeq/L), theestimated potential change in ANC due to emissions from Wyoming Project Sources are all lessthan 1 µeq/L, the LAC threshold for lakes with background ANC values equal to or less than25 µeq/L. However, the estimated potential changes in ANC due to emissions from cumulativesources range from 1.3 to 1.8 µeq/L under all alternative combinations evaluated. These changesare mainly due to the contributions from non-Wyoming Project sources (1.1 to 1.3 µeq/L).
7-66
TABLE 7.22 Estimated Potential Changes in ANC at Sensitive Lakes Due to Emissions from the Wyoming Project Sources, Non-Wyoming Project Sources, and Cumulative Sources under Various Alternative Combinationsa
Sensitive Lake Potential ANC Change (%)
Locationb 10% Most Non-WYSensitive Non-Project Project Wyoming Project Sources Cumulative Sources
Name WADistance
(km) DirectionANC
(µeq/L)SourcesAll Alt.
SourcesAll Alt. Alt. 1 Alt.2a Alt. 2b Alt. 3 Alt. 1 Alt.2a Alt. 2b Alt. 3
Black Joe Bridger 296 WSW 69.0 1.5 1.9c
1.60.7 0.6 0.6 0.3 2.6c
2.32.52.2
2.42.1
2.11.8
Deep Bridger 298 WSW 61.0 1.7 2.11.8
0.8 0.7 0.6 0.3 2.92.6
2.82.5
2.72.4
2.42.1
Hobbs Bridger 315 WSW 68.0 0.8 1.10.9
0.4 0.3 0.3 0.2 1.51.3
1.51.2
1.41.2
1.31.0
Upper Frozend Bridger 299 WSW 5.8e 1.1 1.31.1
0.51 0.45 0.39 0.19 1.811.59
1.751.53
1.691.47
1.491.27
Ross Fitzpatrick 300 WSW 61.4 1.2 1.61.2
0.5 0.5 0.4 0.2 2.11.7
2.01.7
2.01.6
1.71.4
Stepping Stone Absaroka-Beartooth
308 WNW 27.0 1.7 2.21.8
0.3 0.3 0.2 0.1 2.52.1
2.52.1
2.52.1
2.41.9
Twin Island Absaroka-Beartooth
305 WNW 36.0 1.2 1.61.3
0.2 0.2 0.2 0.1 1.81.5
1.81.5
1.81.5
1.71.4
Emerald Cloud Peak 104 WNW 55.3 2.8 4.23.0
1.7 1.5 1.3 0.7 5.94.6
5.74.4
5.54.3
4.93.7
Florence Cloud Peak 93 W 32.7 5.0 7.25.2
3.1 2.8 2.5 1.3 10.48.4
10.08.0
9.77.7
8.56.5
LowerSaddlebag
Popo Agie 292 SW 55.5 2.2 2.62.2
1.0 0.9 0.8 0.4 3.63.2
3.53.1
3.43.0
3.02.6
a Non-project sources include other new and RFFA sources, excluding those on the IR and FS lands. Non-Wyoming Project sources include Montana Project sources, andother new and RFFA sources. Cumulative sources include Wyoming Project sources, Montana Project sources, and other new and RFFA sources.
b Direction and distance are from the center of the Wyoming Project Area to the center of each sensitive lake.
c Values in the first row are with Montana Project emissions under Alt. E (high emissions case), and values in the second row are with Montana Project emissions underAlt. A (low emissions case).
d ANC values for the Upper Frozen Lake are in µeq/L.
e The background ANC is based on only six samples taken on four days between 1997 and 2001.
8-1
8 REFERENCES
ANL: See Argonne National Laboratory.
Argonne National Laboratory, 2001a, Air Quality Assessment Protocol for the Powder RiverBasin Oil and Gas Project, prepared for Bureau of Land Management, Argonne, Ill., Dec.
Argonne National Laboratory, 2001b, unpublished information, Argonne, Ill.
Argonne National Laboratory, 2002, unpublished information, Argonne, Ill.
Bailey, B., 2001, personal communication from Bailey (Wyoming Department of EnvironmentalQuality, Casper, Wyo.) to P. Beels (BLM, Buffalo Field Office, Buffalo, Wyo.), Aug. 28.
BLM: See Bureau of Land Management.
Bureau of Land Management, 1983, Riley Ridge Natural Gas Project Draft EnvironmentalImpact Statement, Sublette, Lincoln and Sweetwater Counties, Wyoming, Cheyenne, Wyo.
Bureau of Land Management, 1999a, Wyodak Coalbed Methane Project Draft EnvironmentalImpact Statement, Buffalo Field Office, Buffalo, Wyo., May.
Bureau of Land Management, 1999b, Revised Air Quality Impact Assessment Technical SupportDocument, Continental Divide/Wamsutter II and South Baggs Natural Gas DevelopmentProjects - Environmental Impact Statement, Vol. I - Emission Inventory and Near-Field Analysis,Rawlins and Rock Springs Field Office, Wyo., Sept.
Bureau of Land Management, 2002, Draft Environmental Impact Statement and Draft PlanningAmendment for the Powder River Basin Oil and Gas Project, Vols. 1 and 2, WY-070-02-065,Wyoming State Office, Cheyenne, Wyo., Jan.
Doelger, N., 2001, personal communications from Doelger (BLM, Denver, Colo.) to Y. Chang(Argonne National Laboratory, Argonne, Ill.), Oct. 9.
EIC: See ENVIRON International Corporation.
ENVIRON International Corporation, 2000, Air Quality Technical Support Document for thePowder River Basin Expansion Project Dakota, Minnesota, and Eastern Railway CorporationNew Railway Retrofit Project (Preliminary Draft), prepared for Burns and McDonnell, KansasCity, Mo., May.
ENVIRON International Corporation, 2001, Development of a New CALMET MeteorologicalModeling Database for Assessing the Air Quality and AQRV Impacts of New Sources Located inSoutheastern Montana and Vicinity, prepared for Argonne National Laboratory, Nov.
8-2
Environmental Science & Engineering, Inc., 2001, Clean Air Status and Trends Network(CASTNet) 2000 Annual Report, prepared for U.S. Environmental Protection Agency, Office ofAir Quality Planning and Standards.
EPA: See U.S. Environmental Protection Agency.
ESE: See Environmental Science & Engineering, Inc.
FLAG: See Federal Land Managers’ Air Quality Related Values Workgroup.
Federal Land Managers’ Air Quality Related Values Workgroup (FLAG), 2000, Phase I Report,Dec.
Fox, D.G., et al., 1989, A Screening Procedure to Evaluate Air Pollution Effects on Class IWilderness Areas, Rocky Mountain Forest and Range Experiment Station, General TechnicalSupport RM-168, Fort Collins, Colo., Jan.
FS: USDA Forest Service.
Gas Research Institute, 1999, GRI-HAPCalc, Version 3.0, GRI-99/0084, Chicago, Ill., Nov.
Giovanini, R., 2001, personal communication from Giovanini (BLM, Miles City, Mont.) toY. Chang (Argonne National Laboratory, Argonne, Ill.), Oct. 3.
GRI: See Gas Research Institute.
Keanini, D., 2001, personal communications from Keanini (Western Gas Resources Inc.,Denver, Colo.) to K. Chun (Argonne National Laboratory, Argonne, Ill.), May 24, May 30,June 7, and Aug. 29.
McVehil-Monnett Associates, Inc., 1999, Horse Creek Coal Lease Application Cumulative AirQuality Impact Analysis, Technical Reference Document prepared for U.S. Bureau of LandManagement, Casper, Wyo., Dec.
MDEQ: See Montana Department of Environmental Quality.
Montana Department of Environmental Quality, 2001, Air quality permit-related documents onfile at MDEQ, accessed by K. Chun, Jan. 15−19.
Scire, J.S., et al., 1999a, A User’s Guide for the CALPUFF Dispersion Model (Version 5.0),Earth Tech, Inc., Concord, Mass., Oct.
Scire, J.S., et al., 1999b, A User’s Guide for the CALMET Meteorological Model (Version 5.0),Earth Tech, Inc., Concord, Mass., Sept.
U.S. Environmental Protection Agency, 1997, National Air Toxics Information Clearing House(NATICH) Database, Office of Air Quality Planning and Standards, Research Triangle Park,N.C.
8-3
U.S. Environmental Protection Agency, 1998, Interagency Workgroup on Air Quality Modeling(IWAQM) Phase II Summary Report: Recommendations for Modeling Long-Range TransportImpacts, EPA-454/R-98-019, Research Triangle Park, N.C.
U.S. Environmental Protection Agency, 2000a, Compilation of Air Pollution Emission Factors,AP-42, 5th Ed., Vol. I: Stationary Point and Area Sources. Available athttp://www.epa.gov/chief/ap42.html, accessed July 10.
U.S. Environmental Protection Agency, 2000b, Compilation of Air Pollutant Emission Factors,AP-42, pending 5th Ed., Vol. II: Mobile Sources. Available at http://www.epa.gov/otaq/ap42.htm, accessed July 10.
U.S. Environmental Protection Agency, 2001a, EPA AIRData Monitor Summary Report,available at http://www.epa.gov/air/data/monsum.html, accessed May 4.
U.S. Environmental Protection Agency, 2001b, Integrated Risk Information System (IRIS)Database, Office of Research and Development, Research Triangle Park, N.C. Available athttp://www.epa.gov/iris, accessed Nov. 10.
USDA Forest Service Rocky Mountain Region, 2000, Screening Methodology for CalculatingANC Changes to High Elevation Lakes, Dec.
U.S. Geological Survey, 2000a, USGS Digital Elevation Model Data. Available athttp://edcwww.cr.usgs.gov/glis/hyper/guide/usgs_dem, accessed July 10.
U.S. Geological Survey, 2000b, USGS Land Use and Land Cover Data. Available athttp://edc.usgs.gov/glis/hyper/guide/1_250_lul, accessed Nov. 2.
USGS: See U.S. Geological Survey.
WDEQ: See Wyoming Department of Environmental Quality.
Wyoming Department of Environmental Quality, 2000a, Wyoming’s Air Quality: Ambient AirMonitoring Data - 1999, Cheyenne, Wyo.
Wyoming Department of Environmental Quality, 2000b, Air quality permit-related documentson file at WDEQ, Cheyenne, Wyo., accessed by Y. Chang and K. Chun, Dec. 11−13.

8-4
A-1
APPENDIX A:
PROCEDURES FOR PREDICTING MAXIMUMAND DAILY VISIBILITY IMPAIRMENT

A-2
A-3
APPENDIX A:
PROCEDURES FOR PREDICTING MAXIMUMAND DAILY VISIBILITY IMPAIRMENT
The Federal Land Managers’ Air-Quality-Related Values Workgroup (FLAG), consistingof the Forest Service (FS) in the U.S. Department of Agriculture (USDA), and the National ParkService (NPS) and U.S. Fish and Wildlife Service (FWS) in the Department of the Interior(DOI), has established recommended procedures for identifying and evaluating potentialvisibility impacts primarily in mandatory federal Prevention of Significant Deterioration (PSD)Class I areas (FLAG 2000). The procedures are designed to help FLAG agencies when theyreview New Source Review permit applications to focus on the potential contribution ofanthropogenic pollutant emissions to visibility degradation. Although the seasonal FLAGscreening visibility analysis approach applies conservative assumptions (tending to overestimatepotential impacts), it does represent an appropriate screening level analysis (e.g., if potentialimpacts do not exceed the conservative screening thresholds, then further refined analysis is notnecessary).
FLAG has developed a generalized seasonal screening analysis approach on the basis ofthe following:
1. Estimation of the potential concentration of visibility-impairing pollutants(mainly primary fine and coarse particulate matter [PM], secondaryammonium nitrate [NH4NO3], and secondary ammonium sulfate [NH4]2SO4);
2. Application of bulk-averaged visibility extinction efficiencies, including arepresentative relative humidity adjustment factor;
3. Computation of the predicted percent change (increase) of predictedextinction above an assumed “natural background” reference level; and
4. Comparison of the predicted change with FLAG-prescribed threshold levels.
Representative site-specific, seasonal relative humidity adjustment factors and estimated“natural background” reference visibility levels are presented in Table 4.4 and in Appendix 2.B(Estimate of Natural Conditions) of the FLAG Report (2000). In addition, the State of WyomingDepartment of Environmental Quality has established different “natural background” referencevisibility levels for selected mandatory federal PSD Class I areas within Wyoming.
Specifically, the maximum 24-hour concentrations of primary fine particulate matter(PM2.5) and primary coarse particulate matter ([PM10] − [PM2.5]), as well as nitrate ion (NO3-)and sulfate ion (SO4=), are predicted at each of the Class I and Class II areas of concern locatedin the modeling domain. The mass concentrations of secondary NH4NO3 and [NH4]2SO4 arecalculated by assuming the presence of excess ambient ammonia (by using adjustment factors of1.290 and 1.375, respectively). Separate “dry” extinction coefficients are applied for each
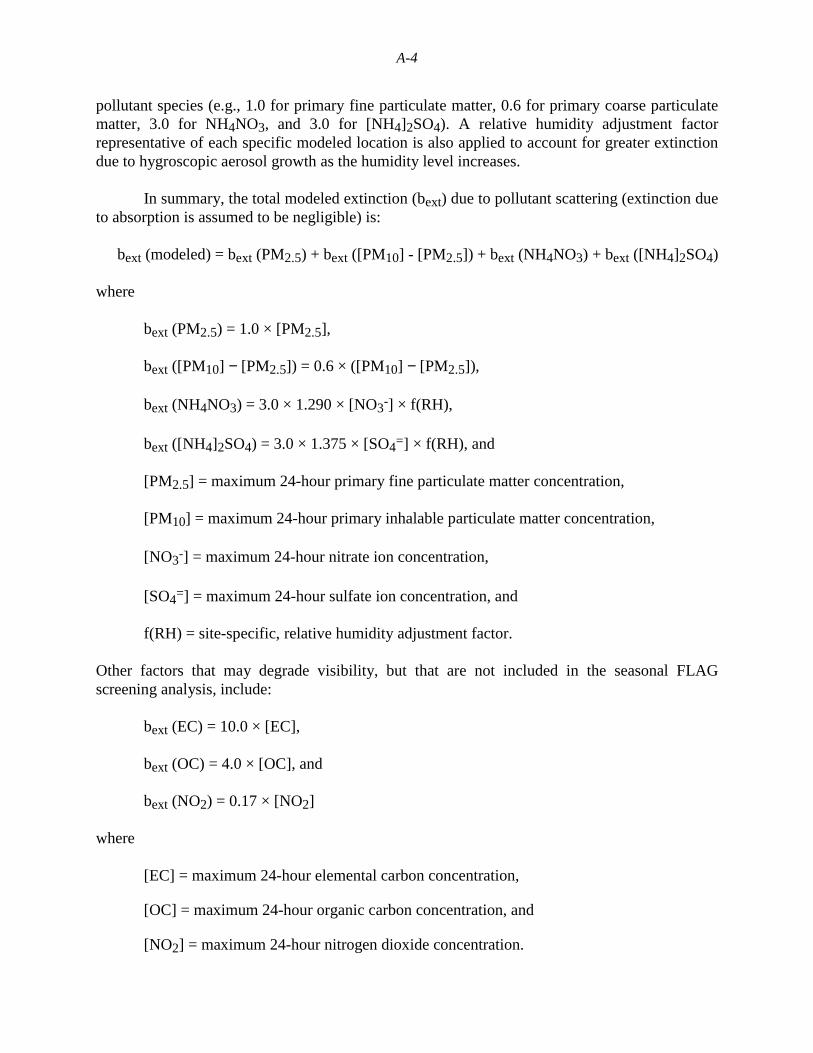
A-4
pollutant species (e.g., 1.0 for primary fine particulate matter, 0.6 for primary coarse particulatematter, 3.0 for NH4NO3, and 3.0 for [NH4]2SO4). A relative humidity adjustment factorrepresentative of each specific modeled location is also applied to account for greater extinctiondue to hygroscopic aerosol growth as the humidity level increases.
In summary, the total modeled extinction (bext) due to pollutant scattering (extinction dueto absorption is assumed to be negligible) is:
bext (modeled) = bext (PM2.5) + bext ([PM10] - [PM2.5]) + bext (NH4NO3) + bext ([NH4]2SO4)
where bext (PM2.5) = 1.0 × [PM2.5], bext ([PM10] − [PM2.5]) = 0.6 × ([PM10] − [PM2.5]),
bext (NH4NO3) = 3.0 × 1.290 × [NO3-] × f(RH), bext ([NH4]2SO4) = 3.0 × 1.375 × [SO4=] × f(RH), and [PM2.5] = maximum 24-hour primary fine particulate matter concentration, [PM10] = maximum 24-hour primary inhalable particulate matter concentration,
[NO3-] = maximum 24-hour nitrate ion concentration, [SO4=] = maximum 24-hour sulfate ion concentration, and f(RH) = site-specific, relative humidity adjustment factor. Other factors that may degrade visibility, but that are not included in the seasonal FLAGscreening analysis, include: bext (EC) = 10.0 × [EC], bext (OC) = 4.0 × [OC], and bext (NO2) = 0.17 × [NO2] where [EC] = maximum 24-hour elemental carbon concentration,
[OC] = maximum 24-hour organic carbon concentration, and
[NO2] = maximum 24-hour nitrogen dioxide concentration.
A-5
Using the seasonal FLAG screening analysis, the site-specific total modeled extinction iscompared with each site-specific assumed “natural background” reference level to determine thepotential percent (and corresponding deciview [dv]) change. A 10% change in extinctioncorresponds to 1.0 dv. Finally, the predicted potential change in visibility is compared with theFLAG-prescribed threshold levels of 5 and 10% change in extinction (0.5 and 1.0 dv change) astheir limits of acceptable change (LACs). If the predicted visibility impairment is less than 5%(0.5 dv), then “the FLM [Federal Land Manager] would not likely object to the proposed action.”Where a cumulative analysis has been performed and the predicted visibility impairment isgreater than, or equal to, 10% (1.0 dv), then “the FLM will consider the magnitude, frequency,duration, and other factors to assess the impact, but is likely to object to the issuance of thepermit.” Where a cumulative analysis has been performed and the predicted visibilityimpairment is greater than or equal to 5% (0.5 dv) but less 10% (1.0 dv), then “the FLM is notlikely to object to the proposed action.”
For example, if the maximum 24-hour primary fine particulate matter, primary coarseparticulate matter, nitrate ion, and sulfate ion concentrations at Badlands Wilderness Area (WA)were predicted to be 0.01, 0.03, 0.10, and 0.06 �g/m3 on August 31, respectively, the f(RH) isassumed to be 2.2, and the “natural background” reference level is assumed to be 15.8 Mm-1
(FLAG 2000). Then the predicted extinction due to pollutant scattering would be 1.42 Mm-1,resulting in predicted visibility impairment of about 9% (0.9 dv). However, if the same pollutantconcentrations were predicted to occur on the next day (September 1), when the f(RH) isassumed to be 2.8 and the “natural background” reference level is assumed to be 16.2 Mm-1,then the predicted extinction due to pollutant scattering would be 1.80 Mm-1, resulting inpredicted visibility impairment of about 11.0% (1.1 dv). Since this is a cumulative impactanalysis, in the first case, the predicted visibility impairment would be less than 10% (1.0 dv),and “the FLM is not likely to object.” However, in the second case, the predicted visibilityimpairment would be more than 10% (1.0 dv), and “the FLM is likely to object.” In the current study for the Montana and Wyoming Project Environmental ImpactStatement (EIS), the total modeled extinction level (on the basis of predicted site-specificmaximum 24-hour primary fine particulate matter, primary coarse particulate matter, nitrate ion,and sulfate ion concentrations and the assumed site-specific relative humidity adjustment factor)was compared with the seasonal FLAG screening “natural background” reference level at eachClass I area and each Class II area of concern. Where the predicted maximum visibilityimpairment was equal to or exceeded 10% (1.0 dv), an assessment of potential daily visibilityimpairment using the daily FLAG refined methodology was made in order to determine themagnitude, frequency, and duration of such impairment. The refined daily visibility impairment analysis calculates total modeled extinction on thebasis of predicted maximum 24-hour primary fine particulate matter, primary coarse particulatematter, nitrate ion, and sulfate ion concentrations, as described above, but it uses site-specificdaily relative humidity adjustment factors based on hourly site-specific relative humidity valuesmeasured concurrently with the hourly optical extinction values. A maximum relative humidityof 90% is used because direct optical monitoring devices are not reliable above this level.
A-6
Potential daily visibility impairment is calculated on the basis of direct total opticalmonitoring (transmissometer) data collected at Badlands WA (also used for Agate Fossil BedsNational Monument [NM], Black Elk WA, Devils Tower NM, Fort Laramie National HistoricSite [NHS], Jewel Cave NM, Mount Rushmore National Memorial, Soldier Creek WA,Theodore Roosevelt National Park [NP]-north, Theodore Roosevelt NP-south, and Wind CaveNP) and at Bridger WA (also used for Absaroka-Beartooth WA, Bighorn Canyon NationalRecreational Area [NRA], Cloud Peak WA, Crow Indian Reservation [IR], Fitzpatrick WA, FortBelknap IR, Fort Peck IR, Gates of the Mountains WA, Grand Teton NP, North Absaroka WA,Northern Cheyenne IR, Popo Agie WA, Red Rock Lakes WA, Scapegoat WA, Teton WA, ULBend WA, Washakie WA, and Yellowstone NP).
For example, if on April 1, 1990, the daily average transmissometer value was measuredto be 32.16 Mm-1; the maximum 24-hour primary fine particulate matter, primary coarseparticulate matter, nitrate ion, and sulfate ion concentrations at Badlands WA were predicted tobe 0.03, 0.04, 0.07, and 0.16 �g/m3, respectively; and the daily average f(RH) was calculated tobe 1.8, then the predicted extinction due to pollutant scattering would be 1.73 Mm-1, resulting inpredicted visibility impairment of about 5% (0.5 dv). By reporting the entire range of potentialvisibility impairment throughout the optical monitoring period, the magnitude, frequency, andduration of such impairment will be evident.
REFERENCE
Federal Land Managers, 2000, Federal Land Managers’ Air Quality Related Values Workgroup(FLAG) Phase I Report, Dec.

B-1
Appendix B: Emission Inventories
B.1 New and RFFA Source Emission Inventories
B.1.1 Montana SourcesB.1.1.1 New Sources: Permit Actions (9/1/94 – 5/31/02)B.1.1.2 RFFA Sources
B.1.2 Nebraska SourcesB.1.2.1 New Sources: Permit Actions (9/1/94 – 5/31/02)
B.1.3 North Dakota SourcesB.1.3.1 New Sources: Permit Actions (9/1/94 – 5/31/02)
B.1.4 South Dakota SourcesB.1.4.1 New Sources: Permit Actions (9/1/94 – 5/31/02)
B.1.5 Wyoming SourcesB.1.5.1 New Sources: Permit Actions (9/1/94 – 5/31/02)B.1.5.2 RFFA Sources
B.2 Montana Project Emission Inventories
B.2.1 Montana CBM Project Activities under the Preferred Alternative (Alt. E)B.2.1.1 Construction ActivitiesB.2.1.2 Operational ActivitiesB.2.1.3 Maintenance Activities
B.2.2 Montana Conventional Oil and Gas Project Activities under the Preferred Alternative(Alt. E)B.2.2.1 Construction ActivitiesB.2.2.2 Operational ActivitiesB.2.2.3 Maintenance Activities
B.3 Wyoming Project Emission Inventories
B.3.1 Wyoming CBM Project Activities under the Proposed Action (Alt. 1)B.3.1.1 Construction ActivitiesB.3.1.2 Operational ActivitiesB.3.1.3 Maintenance ActivitiesB.3.1.4 Reclamation Activities

B-2
B.3.2 Wyoming Conventional Oil and Gas Project Activities under the Proposed Action(Alt. 1)B.3.2.1 Construction ActivitiesB.3.2.2 Operational ActivitiesB.3.2.3 Maintenance Activities
C-1
Appendix C: Estimated Impacts on Criteria Air Pollutants
C.1 Criteria Pollutant Impacts for Montana EIS
C.1.1 Near-Field Impacts of Montana Project, Non-Project, and Cumulative SourcesC.1.1.1 Montana Project Alt. E (and Ea) and Wyoming Project Alt. 1C.1.1.2 Montana Project Alt. D (and Da) and Wyoming Project Alt. 1C.1.1.3 Montana Project Alt. A and Wyoming Project Alt. 1
C.1.2 Far-Field Impacts of Montana Project, Non-Project, and Cumulative SourcesC.1.2.1 Montana Project Alt. E (and Ea) and Wyoming Project Alt. 1C.1.2.2 Montana Project Alt. D (and Da) and Wyoming Project Alt. 1C.1.2.3 Montana Project Alt. A and Wyoming Project Alt. 1
C.2 Criteria Pollutant Impacts for Wyoming EIS
C.2.1 Near-Field Impacts of Wyoming Project, Non-Project, and Cumulative SourcesC.2.1.1 Wyoming Project Alt. 1 and Montana Project Alt. EC.2.1.2 Wyoming Project Alt. 2a and Montana Project Alt. EC.2.1.3 Wyoming Project Alt. 2b and Montana Project Alt. EC.2.1.4 Wyoming Project Alt. 3 and Montana Project Alt. E
C.2.2 Far-Field Impacts of Wyoming Project, Non-Project, and Cumulative SourcesC.2.2.1 Wyoming Project Alt. 1 and Montana Project Alt. EC.2.2.2 Wyoming Project Alt. 2a and Montana Project Alt. EC.2.2.3 Wyoming Project Alt. 2b and Montana Project Alt. EC.2.2.4 Wyoming Project Alt. 3 and Montana Project Alt. E
D-1
APPENDIX D: ESTIMATED VISIBILITY IMPACTS AT SENSITIVE RECEPTORS -FLAG AND WYOMING SCREENING ANALYSIS
D.1 Visibility Impacts for Montana EIS
D.1.1 Non-Montana Project SourcesD.1.1.1 New and RFFA Sources (excluding RFFA sources on the IR and FS lands)D.1.1.2 New and RFFA Sources (excluding RFFA sources on the IR and FS lands)
and Wyoming Project Alt. 1D.1.1.3 New and RFFA Sources (excluding RFFA sources on the IR and FS lands) and
Wyoming Project Alt. 3
D.1.2 Montana Project Source ImpactsD.1.2.1 Montana Project Alt. ED.1.2.2 Montana Project Alt. EaD.1.2.3 Montana Project Alt. DD.1.2.4 Montana Project Alt. DaD.1.2.5 Montana Project Alt. A
D.1.3 Montana Project, Non-Project, and Cumulative Source ImpactsD.1.3.1 Montana Project Alt. E and Wyoming Project Alt. 1D.1.3.2 Montana Project Alt. E and Wyoming Project Alt. 3D.1.3.3 Montana Project Alt. D and Wyoming Project Alt. 1D.1.3.4 Montana Project Alt. D and Wyoming Project Alt. 3D.1.3.5 Montana Project Alt. A and Wyoming Project Alt. 1D.1.3.6 Montana Project Alt. A and Wyoming Project Alt. 3
D.2 Visibility Impacts for Wyoming EIS
D.2.1 Non-Wyoming Project SourcesD.2.1.1 New and RFFA SourcesD.2.1.2 New and RFFA Sources and Montana Project Alt. ED.2.1.3 New and RFFA Sources and Montana Project Alt. A
D.2.2 Wyoming Project Source ImpactsD.2.2.1 Wyoming Project Alt. 1D.2.2.2 Wyoming Project Alt. 2aD.2.2.3 Wyoming Project Alt. 2bD.2.2.4 Wyoming Project Alt. 3
D.2.3 Wyoming Project, Non-Project, and Cumulative Source ImpactsD.2.3.1 Wyoming Project Alt. 1 and Montana Project Alt. ED.2.3.2 Wyoming Project Alt. 1 and Montana Project Alt. AD.2.3.3 Wyoming Project Alt. 2a and Montana Project Alt. ED.2.3.4 Wyoming Project Alt. 2a and Montana Project Alt. AD.2.3.5 Wyoming Project Alt. 2b and Montana Project Alt. E

D-2
D.2.3.6 Wyoming Project Alt. 2b and Montana Project Alt. AD.2.3.7 Wyoming Project Alt. 3 and Montana Project Alt. ED.2.3.8 Wyoming Project Alt. 3 and Montana Project Alt. A
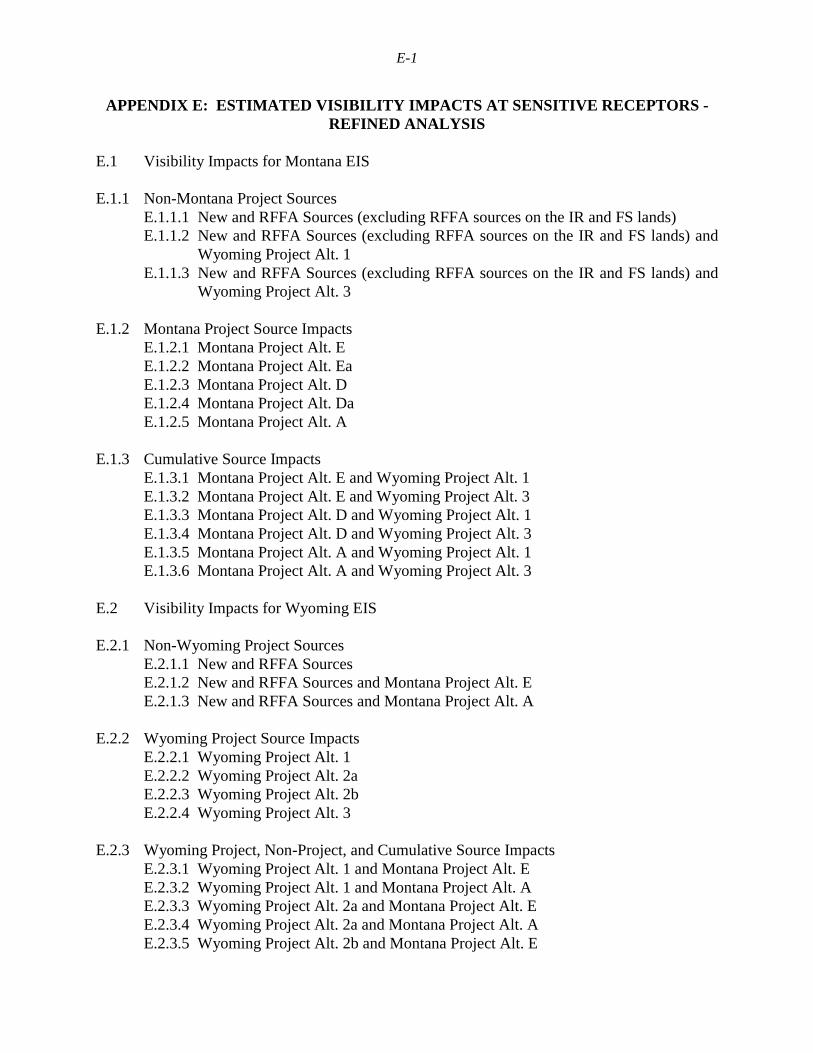
E-1
APPENDIX E: ESTIMATED VISIBILITY IMPACTS AT SENSITIVE RECEPTORS -REFINED ANALYSIS
E.1 Visibility Impacts for Montana EIS
E.1.1 Non-Montana Project SourcesE.1.1.1 New and RFFA Sources (excluding RFFA sources on the IR and FS lands)E.1.1.2 New and RFFA Sources (excluding RFFA sources on the IR and FS lands) and
Wyoming Project Alt. 1E.1.1.3 New and RFFA Sources (excluding RFFA sources on the IR and FS lands) and
Wyoming Project Alt. 3
E.1.2 Montana Project Source ImpactsE.1.2.1 Montana Project Alt. EE.1.2.2 Montana Project Alt. EaE.1.2.3 Montana Project Alt. DE.1.2.4 Montana Project Alt. DaE.1.2.5 Montana Project Alt. A
E.1.3 Cumulative Source ImpactsE.1.3.1 Montana Project Alt. E and Wyoming Project Alt. 1E.1.3.2 Montana Project Alt. E and Wyoming Project Alt. 3E.1.3.3 Montana Project Alt. D and Wyoming Project Alt. 1E.1.3.4 Montana Project Alt. D and Wyoming Project Alt. 3E.1.3.5 Montana Project Alt. A and Wyoming Project Alt. 1E.1.3.6 Montana Project Alt. A and Wyoming Project Alt. 3
E.2 Visibility Impacts for Wyoming EIS
E.2.1 Non-Wyoming Project SourcesE.2.1.1 New and RFFA SourcesE.2.1.2 New and RFFA Sources and Montana Project Alt. EE.2.1.3 New and RFFA Sources and Montana Project Alt. A
E.2.2 Wyoming Project Source ImpactsE.2.2.1 Wyoming Project Alt. 1E.2.2.2 Wyoming Project Alt. 2aE.2.2.3 Wyoming Project Alt. 2bE.2.2.4 Wyoming Project Alt. 3
E.2.3 Wyoming Project, Non-Project, and Cumulative Source ImpactsE.2.3.1 Wyoming Project Alt. 1 and Montana Project Alt. EE.2.3.2 Wyoming Project Alt. 1 and Montana Project Alt. AE.2.3.3 Wyoming Project Alt. 2a and Montana Project Alt. EE.2.3.4 Wyoming Project Alt. 2a and Montana Project Alt. AE.2.3.5 Wyoming Project Alt. 2b and Montana Project Alt. E

E-2
E.2.3.6 Wyoming Project Alt. 2b and Montana Project Alt. AE.2.3.7 Wyoming Project Alt. 3 and Montana Project Alt. EE.2.3.8 Wyoming Project Alt. 3 and Montana Project Alt. A
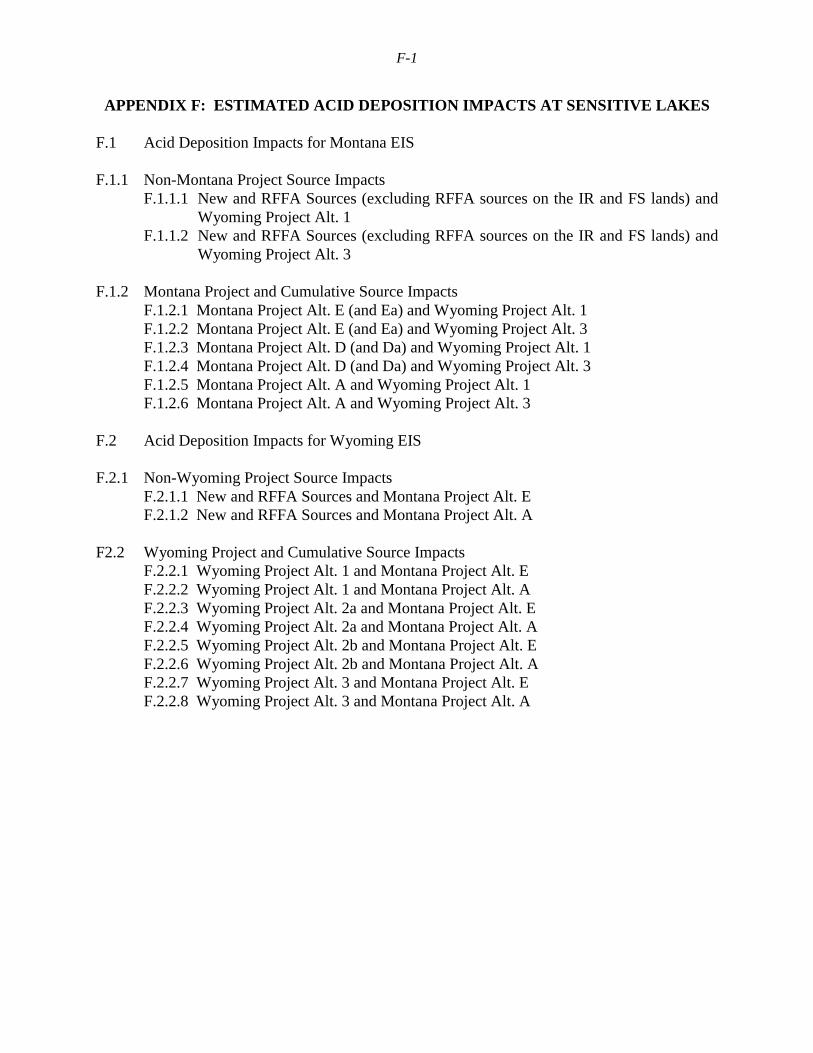
F-1
APPENDIX F: ESTIMATED ACID DEPOSITION IMPACTS AT SENSITIVE LAKES
F.1 Acid Deposition Impacts for Montana EIS
F.1.1 Non-Montana Project Source ImpactsF.1.1.1 New and RFFA Sources (excluding RFFA sources on the IR and FS lands) and
Wyoming Project Alt. 1F.1.1.2 New and RFFA Sources (excluding RFFA sources on the IR and FS lands) and
Wyoming Project Alt. 3
F.1.2 Montana Project and Cumulative Source ImpactsF.1.2.1 Montana Project Alt. E (and Ea) and Wyoming Project Alt. 1F.1.2.2 Montana Project Alt. E (and Ea) and Wyoming Project Alt. 3F.1.2.3 Montana Project Alt. D (and Da) and Wyoming Project Alt. 1F.1.2.4 Montana Project Alt. D (and Da) and Wyoming Project Alt. 3F.1.2.5 Montana Project Alt. A and Wyoming Project Alt. 1F.1.2.6 Montana Project Alt. A and Wyoming Project Alt. 3
F.2 Acid Deposition Impacts for Wyoming EIS
F.2.1 Non-Wyoming Project Source ImpactsF.2.1.1 New and RFFA Sources and Montana Project Alt. EF.2.1.2 New and RFFA Sources and Montana Project Alt. A
F2.2 Wyoming Project and Cumulative Source ImpactsF.2.2.1 Wyoming Project Alt. 1 and Montana Project Alt. EF.2.2.2 Wyoming Project Alt. 1 and Montana Project Alt. AF.2.2.3 Wyoming Project Alt. 2a and Montana Project Alt. EF.2.2.4 Wyoming Project Alt. 2a and Montana Project Alt. AF.2.2.5 Wyoming Project Alt. 2b and Montana Project Alt. EF.2.2.6 Wyoming Project Alt. 2b and Montana Project Alt. AF.2.2.7 Wyoming Project Alt. 3 and Montana Project Alt. EF.2.2.8 Wyoming Project Alt. 3 and Montana Project Alt. A