technical tips for qpcr
DESCRIPTION
Sample and Experimental ConsiderationsTRANSCRIPT
Integrated DNA Technologies
Technical Tips for qPCR Sample and Experimental Considerations
Aurita Menezes, PhDqPCR Product Manager
2
Session Outcomes
We will discuss: Intercalating Dyes (SYBR® Green) vs 5 nuclease assays′ Steps to a Successful qPCR Experiment
Assay design criteria Experimental design considerations
Sample isolation Sample quantification cDNA synthesis Dye and instrument compatibility Experimental layout
Multiplexing Experimental plate layout Methods of quantification
3
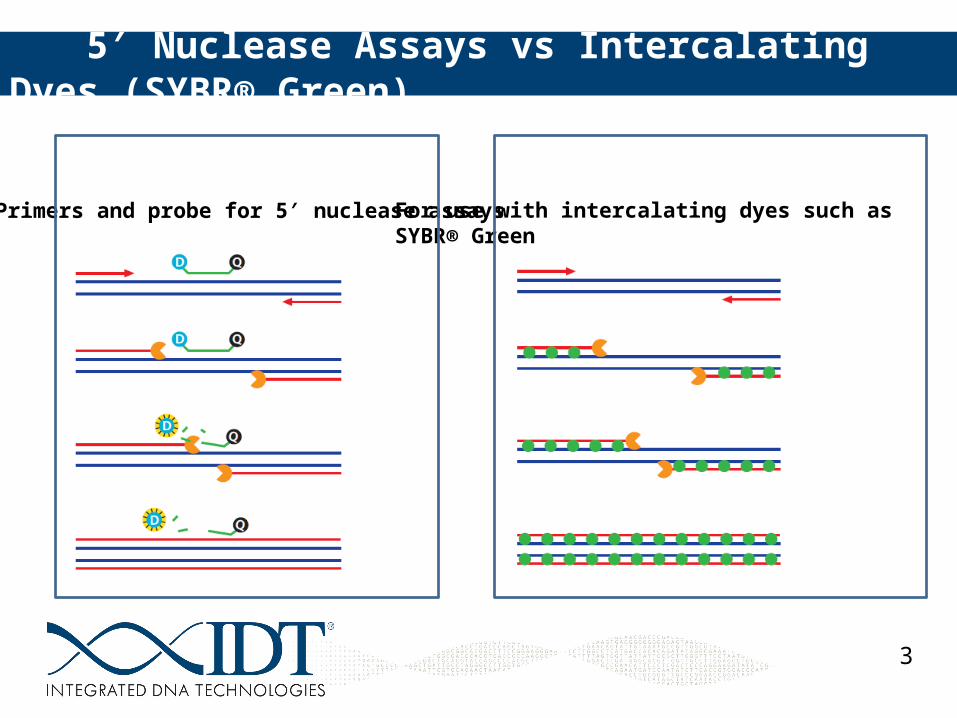
5 Nuclease Assays vs Intercalating Dyes (SYBR® Green)′
For use with intercalating dyes such as SYBR® Green
Primers and probe for 5 nuclease assays′
4
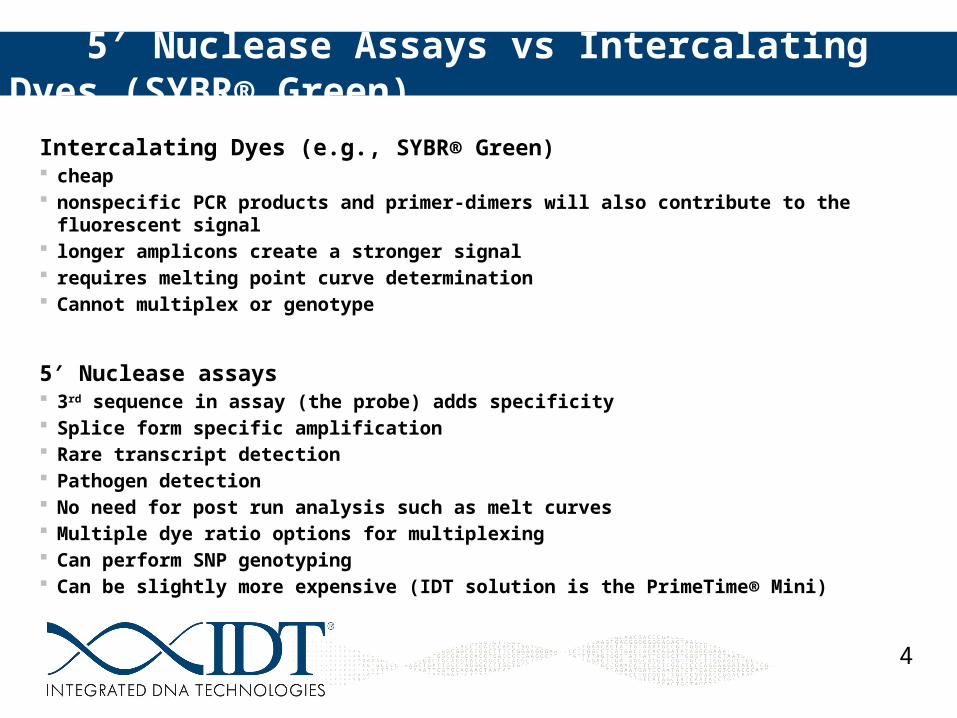
Intercalating Dyes (e.g., SYBR® Green) cheap nonspecific PCR products and primer-dimers will also contribute to the fluorescent signal longer amplicons create a stronger signal requires melting point curve determination Cannot multiplex or genotype
5 Nuclease assays′ 3rd sequence in assay (the probe) adds specificity Splice form specific amplification Rare transcript detection Pathogen detection No need for post run analysis such as melt curves Multiple dye ratio options for multiplexing Can perform SNP genotyping Can be slightly more expensive (IDT solution is the PrimeTime® Mini)
5 Nuclease Assays vs Intercalating Dyes (SYBR® Green)′
5
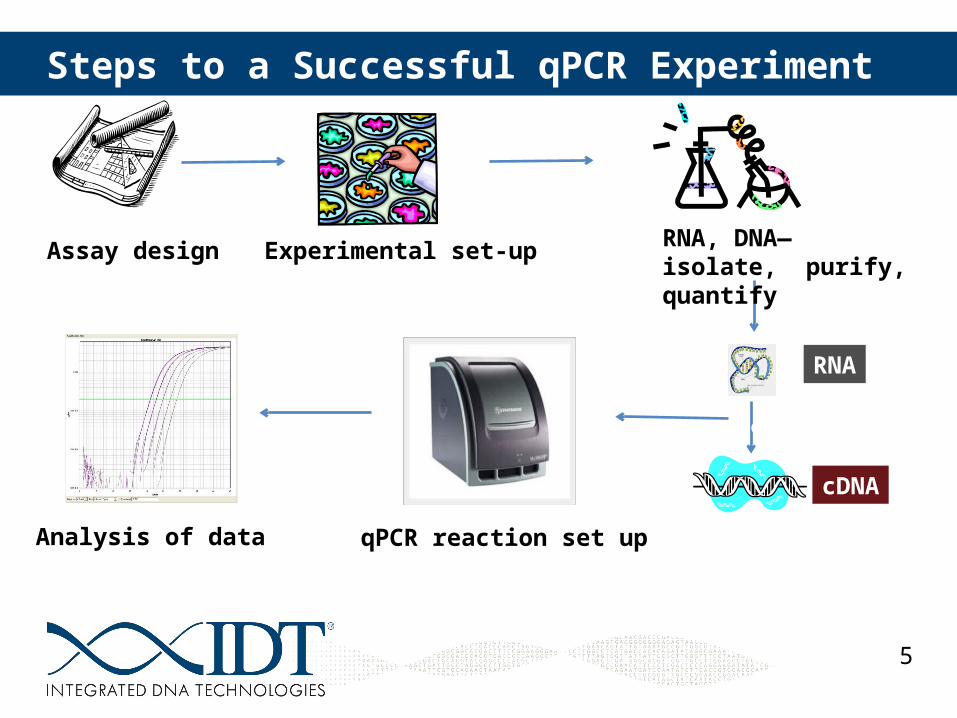
Steps to a Successful qPCR Experiment
Assay design
RNA
cDNA
Reverse Transcription
qPCR reaction set upAnalysis of data
Experimental set-up RNA, DNA— isolate, purify, quantify
6
Assay Design
7
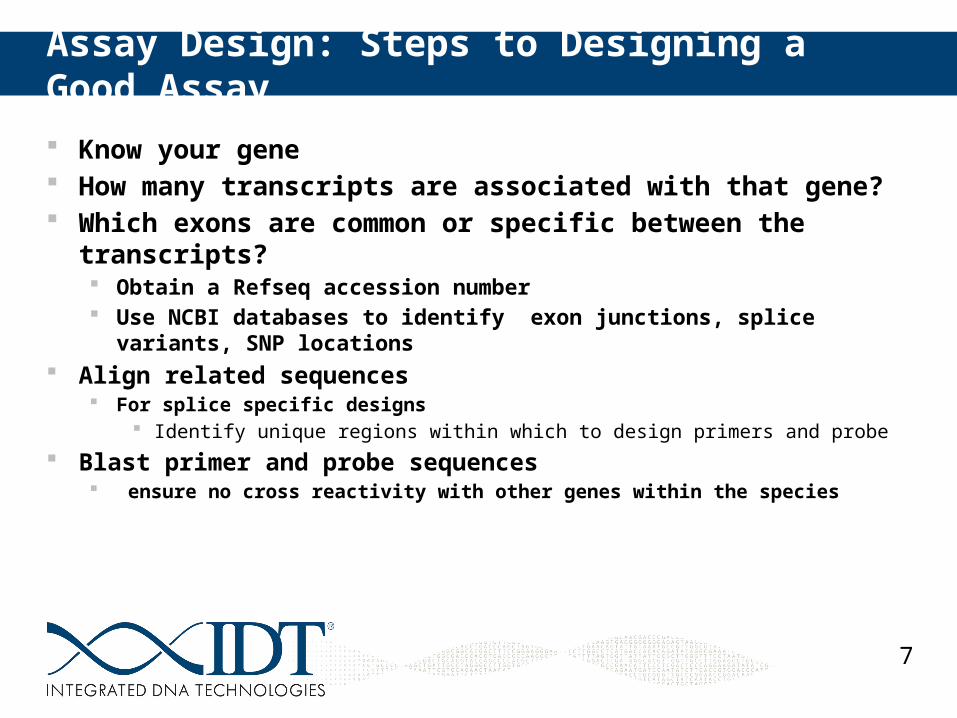
Assay Design: Steps to Designing a Good Assay
Know your gene How many transcripts are associated with that gene? Which exons are common or specific between the transcripts?
Obtain a Refseq accession number Use NCBI databases to identify exon junctions, splice variants, SNP locations
Align related sequences For splice specific designs
Identify unique regions within which to design primers and probe Blast primer and probe sequences
ensure no cross reactivity with other genes within the species
8
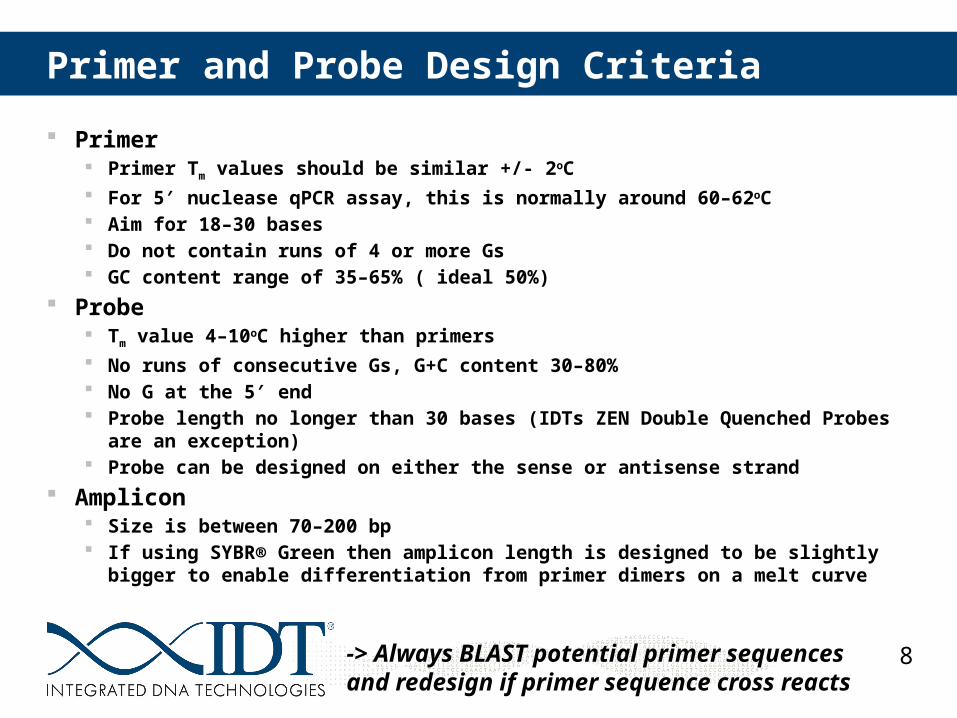
Primer and Probe Design Criteria
Primer Primer Tm values should be similar +/- 2oC For 5 nuclease qPCR assay, this is normally around 60–62′ oC Aim for 18–30 bases Do not contain runs of 4 or more Gs GC content range of 35–65% ( ideal 50%)
Probe Tm value 4–10oC higher than primers No runs of consecutive Gs, G+C content 30–80% No G at the 5 end′ Probe length no longer than 30 bases (IDTs ZEN Double Quenched Probes are an exception) Probe can be designed on either the sense or antisense strand
Amplicon Size is between 70–200 bp If using SYBR® Green then amplicon length is designed to be slightly bigger to enable
differentiation from primer dimers on a melt curve
-> Always BLAST potential primer sequences and redesign if primer sequence cross reacts
9
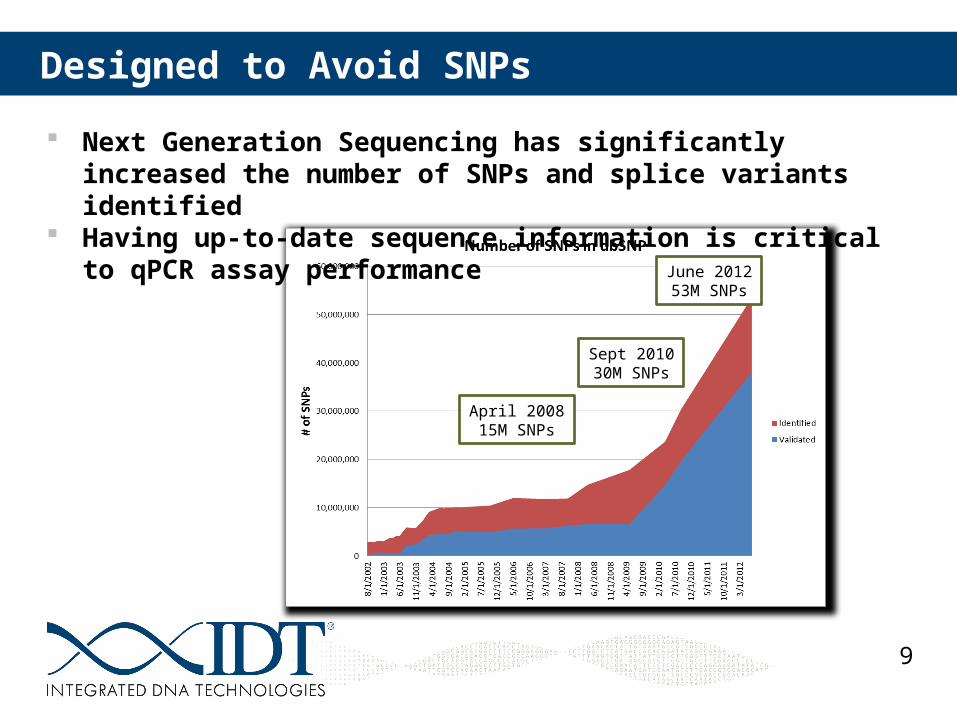
April 200815M SNPs
Sept 201030M SNPs
June 201253M SNPs
Designed to Avoid SNPs
Next Generation Sequencing has significantly increased the number of SNPs and splice variants identified
Having up-to-date sequence information is critical to qPCR assay performance
10
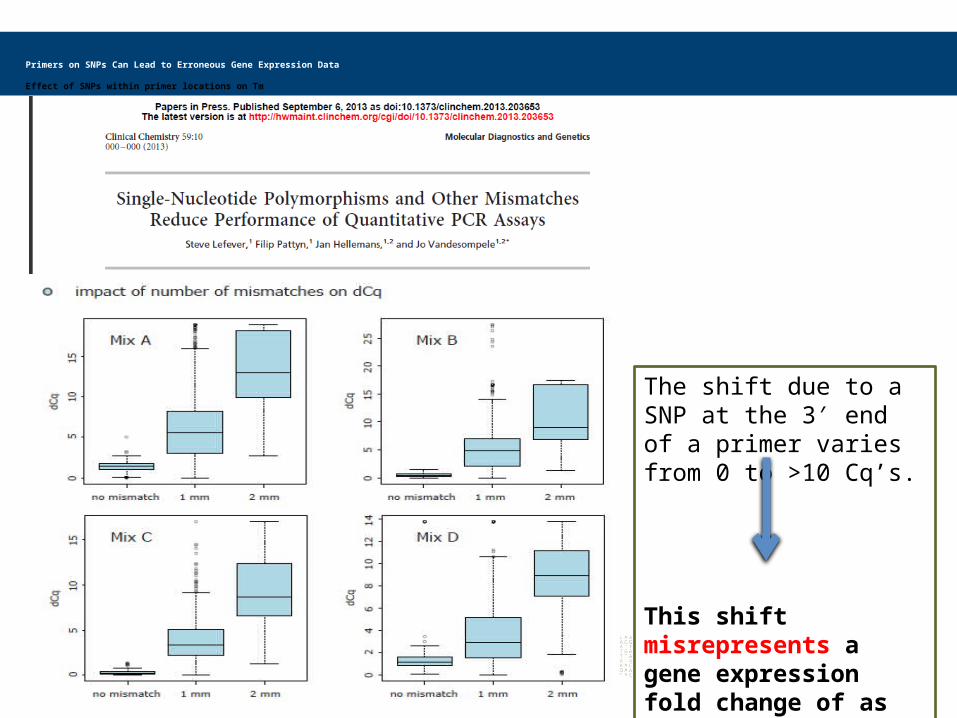
The shift due to a SNP at the 3 end of a primer varies ′from 0 to >10 Cq’s.
This shift misrepresents a gene expression fold change of as much as 1000 fold!
Primers on SNPs Can Lead to Erroneous Gene Expression Data
Effect of SNPs within primer locations on Tm
11
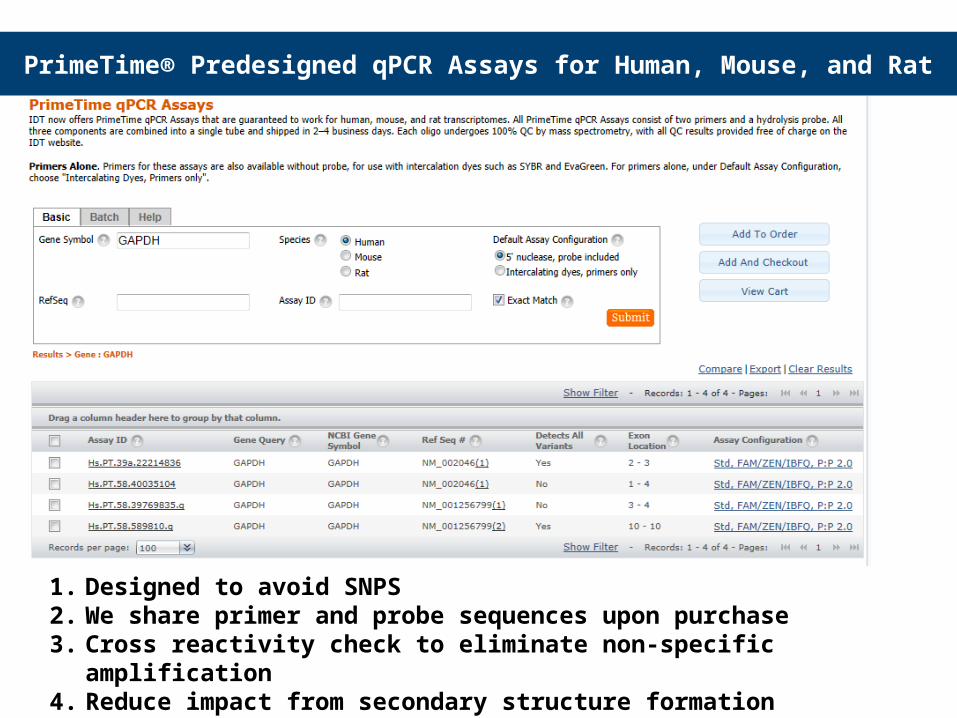
PrimeTime® Predesigned qPCR Assays for Human, Mouse, and Rat
1. Designed to avoid SNPS2. We share primer and probe sequences upon purchase3. Cross reactivity check to eliminate non-specific amplification4. Reduce impact from secondary structure formation
12
Experimental Design Considerations
13
Experimental Design Considerations
Number of reactions Number of replicates Number of samples Number of controls Number of reference genes Sample maximization versus gene maximization
14
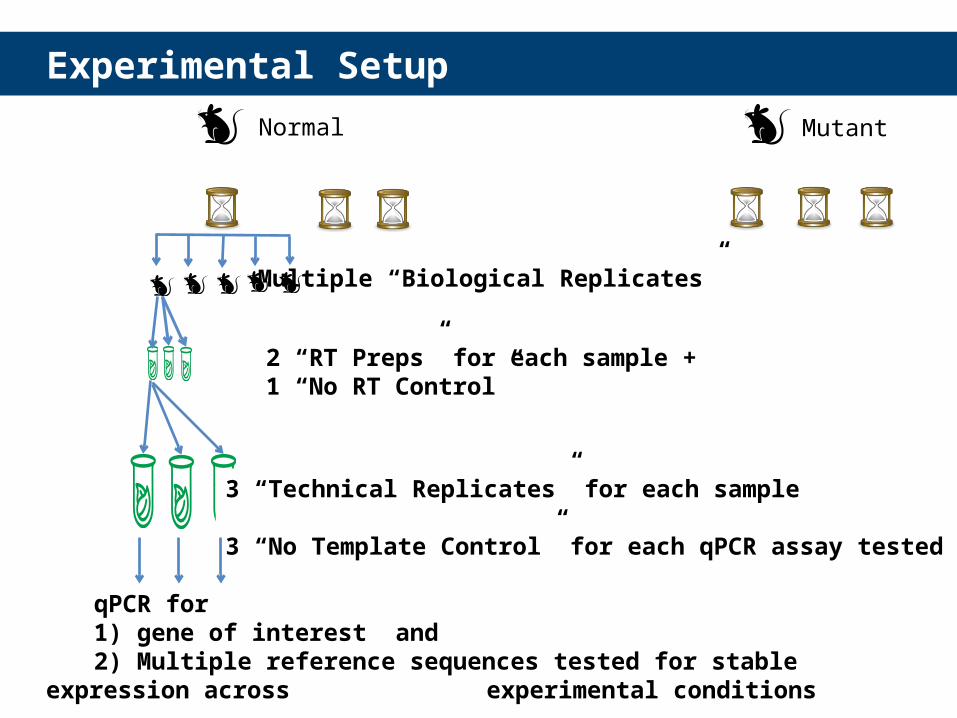
Experimental Setup
24h 48h 72h 24h 48h 72h
qPCR for 1) gene of interest and2) Multiple reference sequences tested for stable expression across
experimental conditions
Normal Mutant
Multiple “Biological Replicates”
2 “RT Preps” for each sample + 1 “No RT Control”
3 “Technical Replicates” for each sample
3 “No Template Control” for each qPCR assay tested
15
RNA Sample Isolation
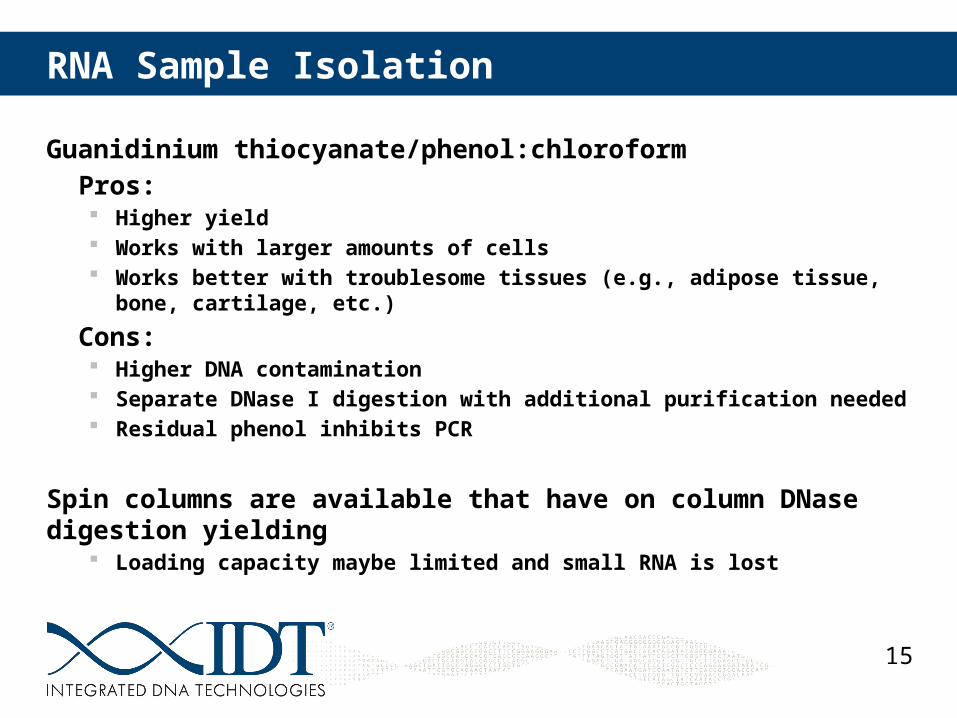
Guanidinium thiocyanate/phenol:chloroformPros: Higher yield Works with larger amounts of cells Works better with troublesome tissues (e.g., adipose tissue, bone, cartilage, etc.)
Cons: Higher DNA contamination Separate DNase I digestion with additional purification needed Residual phenol inhibits PCR
Spin columns are available that have on column DNase digestion yielding Loading capacity maybe limited and small RNA is lost
16
Sample Quantification
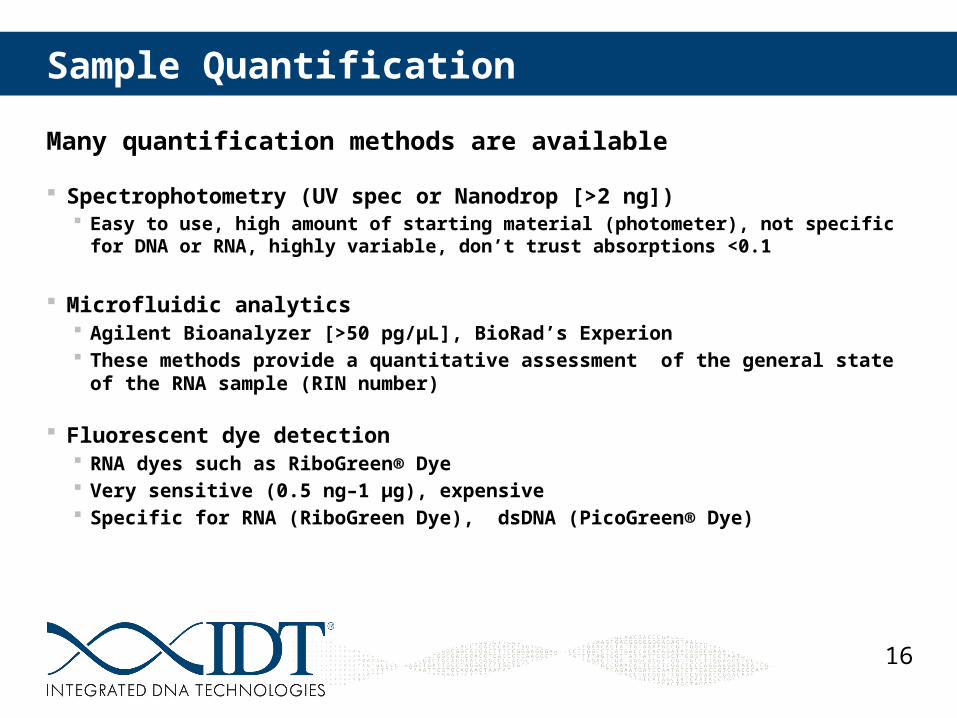
Many quantification methods are available
Spectrophotometry (UV spec or Nanodrop [>2 ng]) Easy to use, high amount of starting material (photometer), not specific for DNA or RNA, highly
variable, don’t trust absorptions <0.1
Microfluidic analytics Agilent Bioanalyzer [>50 pg/μL], BioRad’s Experion These methods provide a quantitative assessment of the general state of the RNA sample (RIN
number)
Fluorescent dye detection RNA dyes such as RiboGreen® Dye Very sensitive (0.5 ng–1 μg), expensive Specific for RNA (RiboGreen Dye), dsDNA (PicoGreen® Dye)
17
Sample Quantification
Always use the same method of quantification Comparison of data obtained using RNA isolated by different
methods is not advisable Comparison of data obtained using different RT priming strategies is
not recommended Accurate quantification is crucial for true estimation by qPCR
18
Reverse Transcription
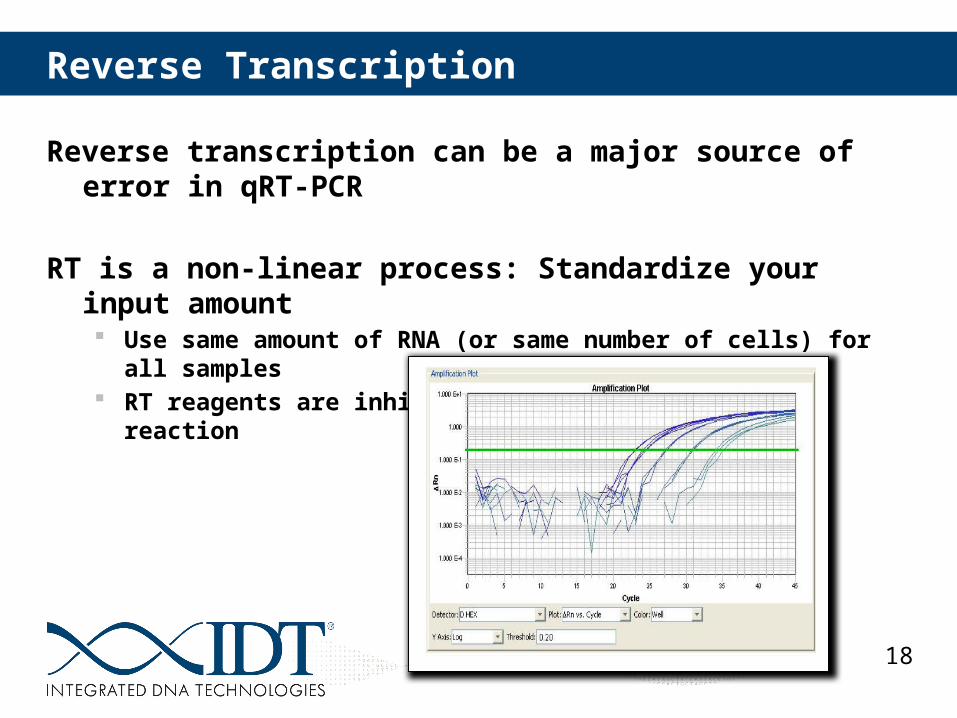
Reverse transcription can be a major source of error in qRT-PCR
RT is a non-linear process: Standardize your input amount Use same amount of RNA (or same number of cells) for all samples RT reagents are inhibitory to PCR, so dilute the reaction
19
Priming Strategy Can Make a Difference
Oligo(dT) < Hexamer < Oligo(dT) + Hexamer < Gene Specific Primer Random primers and oligo (dT) primers will produce random cDNA, while gene-specific primers will
produce cDNA only for a specific target
Random primers Bind to RNA at a variety of complementary sites, resulting in short, partial-length cDNAs Can be used when the template has extensive secondary structure Will produce the greatest yield, but the majority of the cDNA will be copies of ribosomal RNA, unless it is depleted prior to
RT-PCR Advantage: Transcriptome is preserved so that any remaining cDNA can be used in other qPCR assays Disadvantage: Low abundance messages may be under-represented due to consumption of reagents during cDNA synthesis
of the more prevalent RNAs
Oligo(dT) primers will ensure that mRNA containing poly(A) tails are reverse transcribed These primers are more commonly used when trying to limit the amount of ribosomal RNA being copied, or when the qPCR
assays are designed to target the 3 end of the RNA′ If the mRNA is long, the 5 end of the message may be under-represented′
Gene-specific oligonucleotide primers, which selectively prime the mRNA of interest Yields the least complex cDNA mixture and avoids reagent depletion Gene specific primers can yield earlier Cqs, however only one gene can be tested per cDNA sample Disadvantage: cDNA produced cannot be used for assaying other genes
20
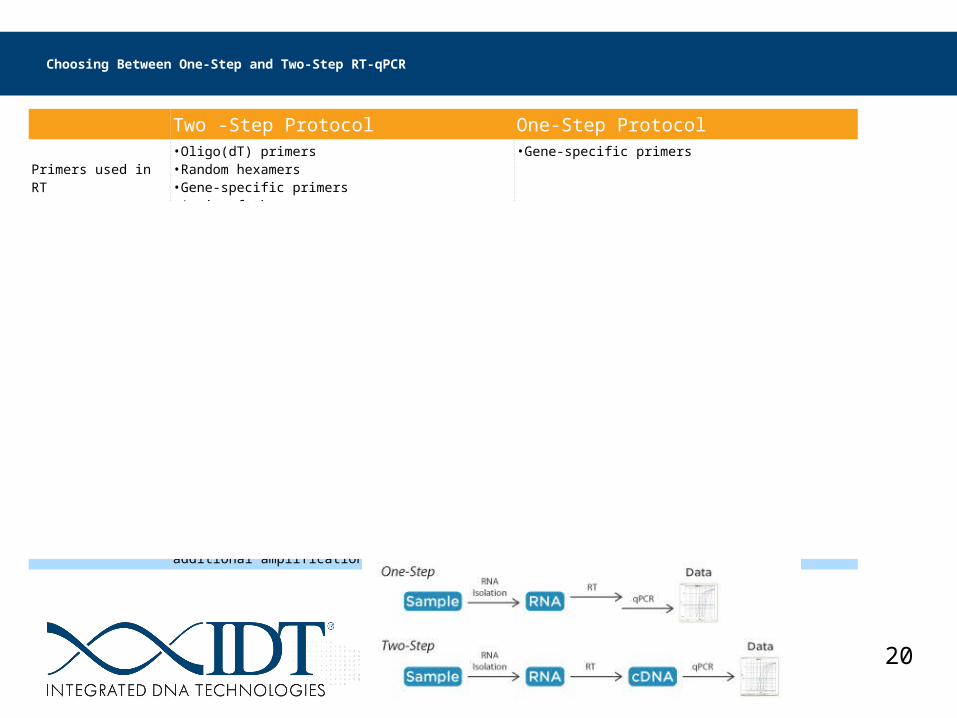
Two -Step Protocol One-Step Protocol
Primers used in RT
•Oligo(dT) primers•Random hexamers •Gene-specific primers•A mix of these
•Gene-specific primers
Advantages
•Choice of primers•Optimize reactions for maximum yield•Modulate amount of RT that goes into PCR—controlling for target abundance•Perform multiple PCR reactions on the same cDNA sample •Experiment with different RT and Taq enzymes
•Quick setup and limited handling •Easy processing of multiple samples for repetitive tests, or high-throughput screening•Fewer pipetting steps, reducing potential errors•Eliminates possibility of contamination between the RT and qPCR steps
Considerations
•Requires more setup, hands-on, and machine time•Additional pipetting increases the chances for experimental errors and contamination•Uses more reagents
•Must “start over,” or save RNA aliquot and perform new RT to analyze new target(s) or repeat amplifications•Reaction conditions are not optimal—efficiency and thus quantification are affected
Best for:
•Amplifying multiple targets from a single RNA source•When you plan to reuse cDNA for additional amplifications
•Working with multiple RNA samples to amplify only a few targets•Assays performed repeatedly
Choosing Between One-Step and Two-Step RT-qPCR
21
Controls
Negative Controls No Template Control (detects contamination) Minus RT (examines genomic DNA presence) Biological Control sample wherein the GOI is not expressed
Positive control Sample in which gene is expressed Synthetic template such as gBlocks® Gene Fragments, Ultramer ® Oligonucleotides
Normal control Untreated sample Healthy individual (normal)
22
Multiplexing
23
Why Multiplex?
Sample amount, cost, and time With limited sample amounts, one of the best ways to minimize
consumption is to run qPCR assays in multiplex format Most of the qPCR instruments on the market can simultaneously measure 2–5 different dyes in a single well
Expression levels of several genes of interest can be determined
quickly and with minimal sample size
Best practices in qPCR usually require multiple gene normalizers,
all of which can be run at the same time
24
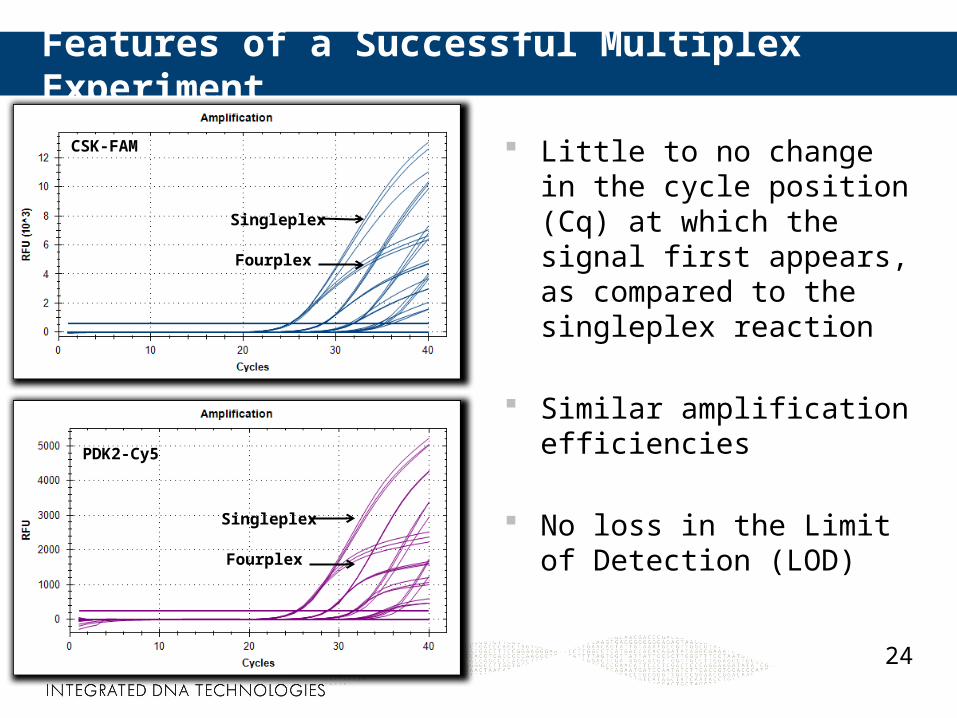
Features of a Successful Multiplex Experiment
Little to no change in the cycle position (Cq) at which the signal first appears, as compared to the singleplex reaction
Similar amplification efficiencies
No loss in the Limit of Detection (LOD)
CSK-FAM
PDK2-Cy5
Singleplex
Fourplex
Singleplex
Fourplex
25
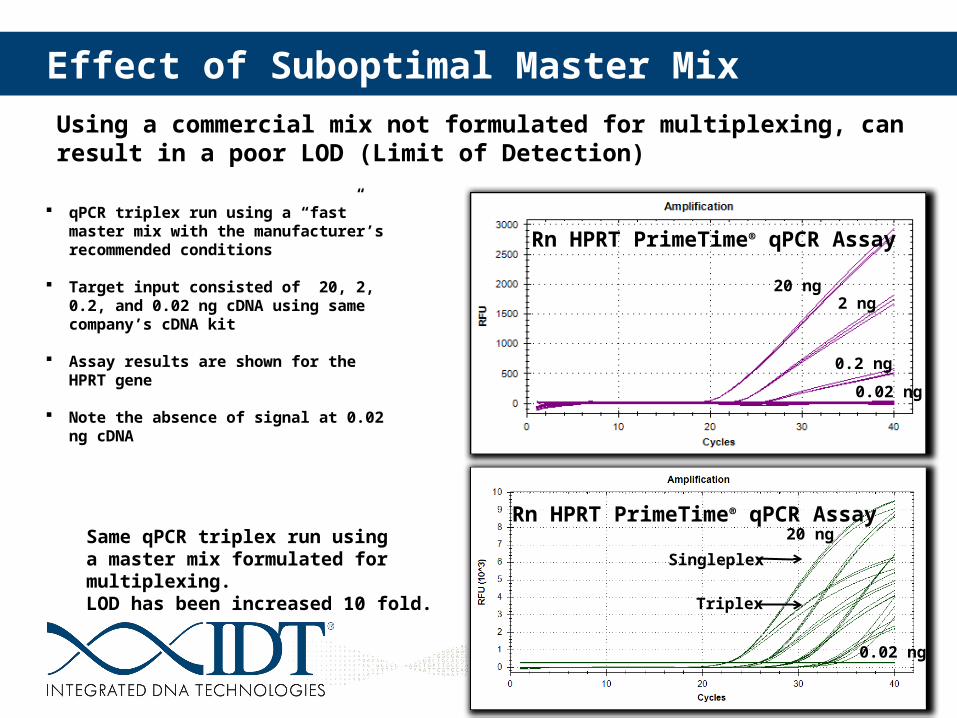
Effect of Suboptimal Master Mix
qPCR triplex run using a “fast” master mix with the manufacturer’s recommended conditions
Target input consisted of 20, 2, 0.2, and 0.02 ng cDNA using same company’s cDNA kit
Assay results are shown for the HPRT gene
Note the absence of signal at 0.02 ng cDNA
EDIT NAME
EDIT JOB TITLE
Same qPCR triplex run usinga master mix formulated for multiplexing.LOD has been increased 10 fold.
Rn HPRT PrimeTime® qPCR Assay
Singleplex
Triplex
Rn HPRT PrimeTime® qPCR Assay
20 ng2 ng
0.2 ng
0.02 ng
0.02 ng
20 ng
Using a commercial mix not formulated for multiplexing, can result in a poor LOD (Limit of Detection)
26
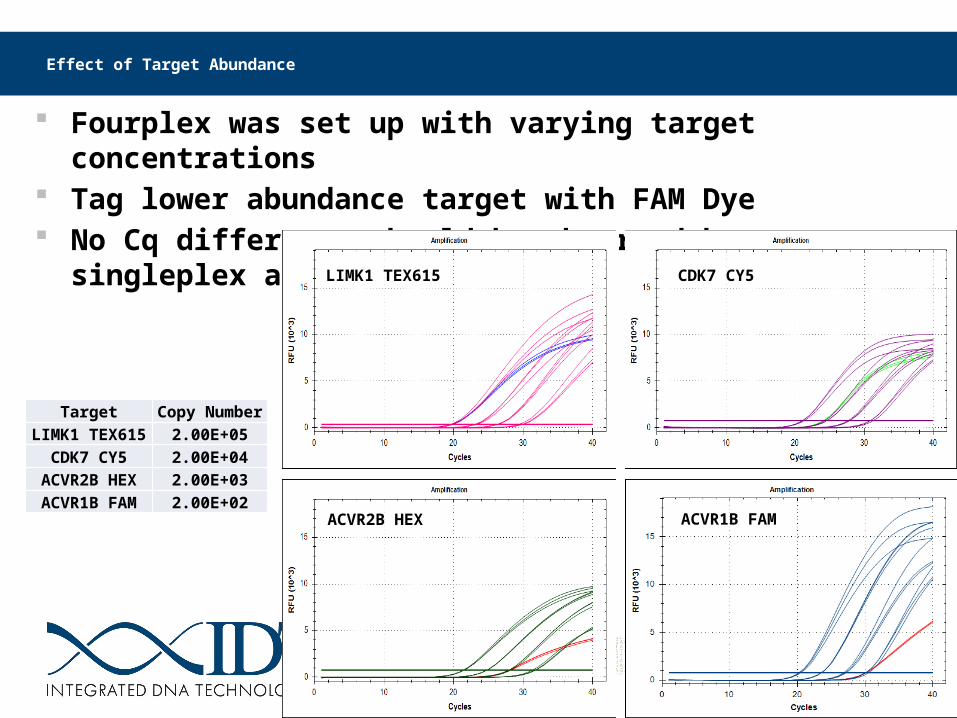
Effect of Target Abundance
Fourplex was set up with varying target concentrations Tag lower abundance target with FAM Dye No Cq difference should be observed between singleplex and multiplex
Target Copy NumberLIMK1 TEX615 2.00E+05
CDK7 CY5 2.00E+04ACVR2B HEX 2.00E+03ACVR1B FAM 2.00E+02
ACVR1B FAMACVR2B HEX
LIMK1 TEX615 CDK7 CY5
27
gBlocks® Gene Fragments: For Generation of Standard Curves
Double-stranded DNA Fragments 125–1000 bp in length Sequence-verified 200 ng DNA provided, dry
28
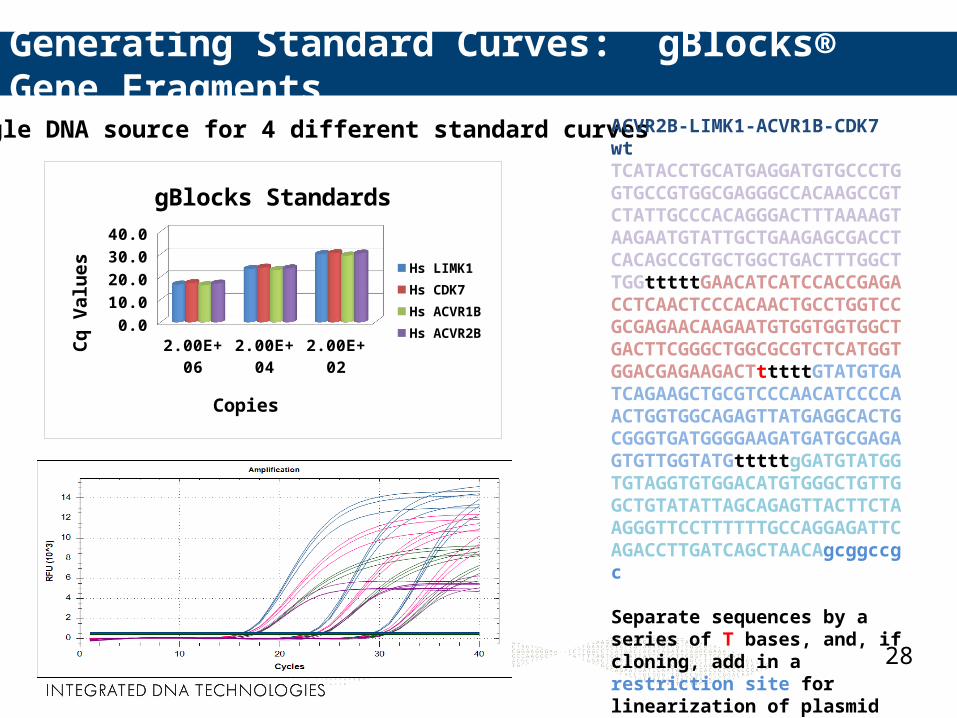
Generating Standard Curves: gBlocks® Gene Fragments
2.00E+06 2.00E+04 2.00E+020.0
10.0
20.0
30.0
40.0
gBlocks Standards
Hs LIMK1
Hs CDK7
Hs ACVR1B
Hs ACVR2B
Copies
Cq
Va
lue
s
A single DNA source for 4 different standard curves ACVR2B-LIMK1-ACVR1B-CDK7 wtTCATACCTGCATGAGGATGTGCCCTGGTGCCGTGGCGAGGGCCACAAGCCGTCTATTGCCCACAGGGACTTTAAAAGTAAGAATGTATTGCTGAAGAGCGACCTCACAGCCGTGCTGGCTGACTTTGGCTTGGtttttGAACATCATCCACCGAGACCTCAACTCCCACAACTGCCTGGTCCGCGAGAACAAGAATGTGGTGGTGGCTGACTTCGGGCTGGCGCGTCTCATGGTGGACGAGAAGACTtttttGTATGTGATCAGAAGCTGCGTCCCAACATCCCCAACTGGTGGCAGAGTTATGAGGCACTGCGGGTGATGGGGAAGATGATGCGAGAGTGTTGGTATGtttttgGATGTATGGTGTAGGTGTGGACATGTGGGCTGTTGGCTGTATATTAGCAGAGTTACTTCTAAGGGTTCCTTTTTTGCCAGGAGATTCAGACCTTGATCAGCTAACAgcggccgc
Separate sequences by a series of T bases, and, if cloning, add in a restriction site for linearization of plasmid if necessary.
29
Range of Dilution
Range of dilution while generating standard curves A standard curve across multiple log10 units is needed The concentrations should span a minimum of 4 log10 of magnitude, but
preferably 5−6 log10 The concentrations of the test unknowns should fall within the range of
concentrations used within the standard curve without the need to extrapolate The PCR efficiency is close to 100% when the slope of the amplification curve is
close to −3.32
30
Summary: Establishing Robust Multiplex Assays
Use master mix formulated for multiplexing. Regular master mixes may need to be supplemented with additional
dNTPs, Mg+2, polymerase. Follow the recommended cycling conditions. Dye choices are made based on separation of excitation/emission
wavelengths and filter combinations available on a particular platform. Always test assay efficiency. Run each assay first in singleplex reaction
before conducting multiplex qPCR.
31
Real Time PCR Instrument
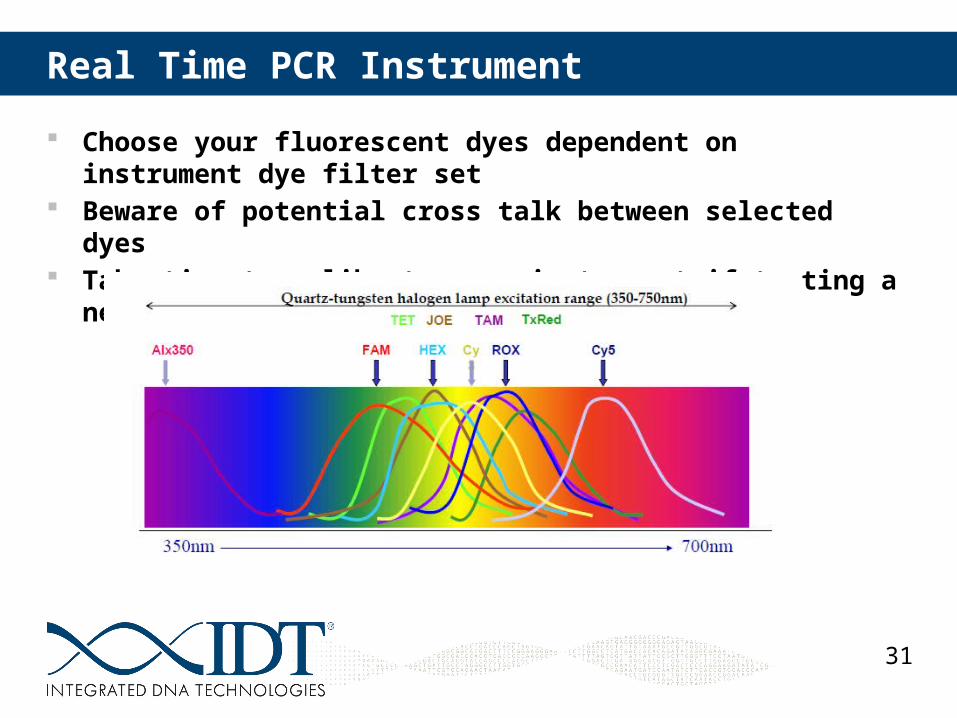
Choose your fluorescent dyes dependent on instrument dye filter set Beware of potential cross talk between selected dyes Take time to calibrate your instrument if testing a new dye
32
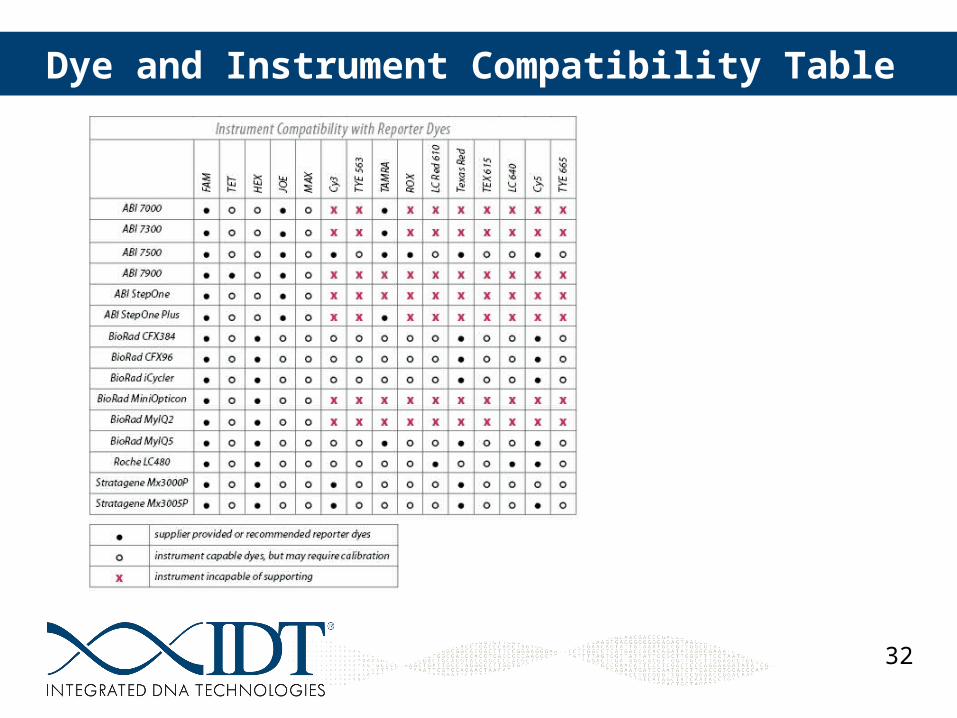
Dye and Instrument Compatibility Table
33
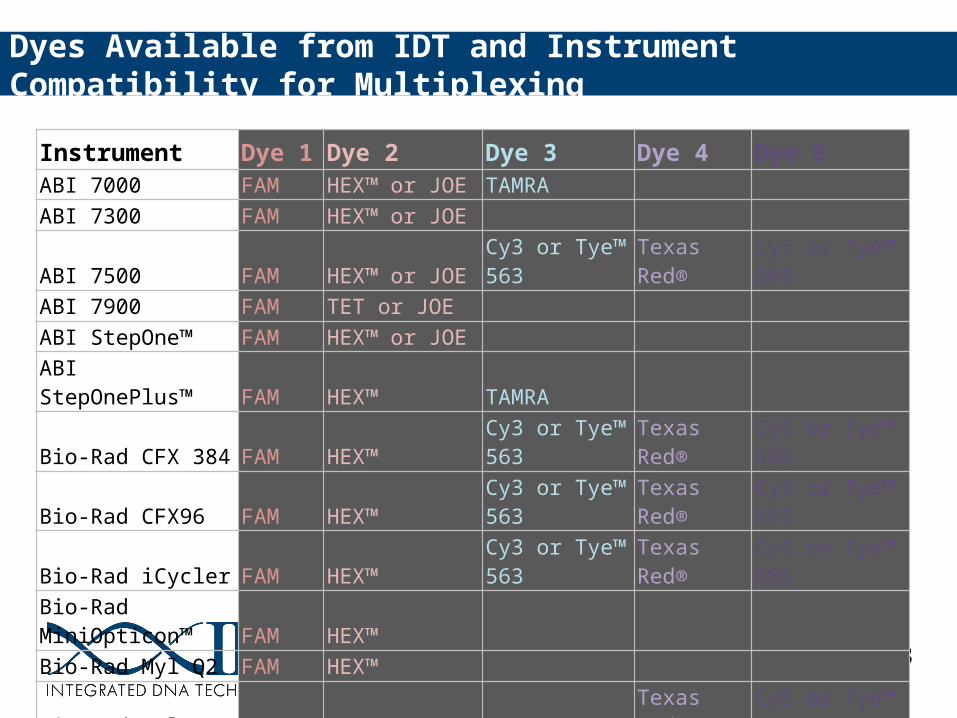
Instrument Dye 1 Dye 2 Dye 3 Dye 4 Dye 5ABI 7000 FAM HEX™ or JOE TAMRAABI 7300 FAM HEX™ or JOEABI 7500 FAM HEX™ or JOE Cy3 or Tye™ 563 Texas Red® Cy5 or Tye™ 665ABI 7900 FAM TET or JOEABI StepOne™ FAM HEX™ or JOEABI StepOnePlus™ FAM HEX™ TAMRABio-Rad CFX 384 FAM HEX™ Cy3 or Tye™ 563 Texas Red® Cy5 or Tye™ 665Bio-Rad CFX96 FAM HEX™ Cy3 or Tye™ 563 Texas Red® Cy5 or Tye™ 665Bio-Rad iCycler FAM HEX™ Cy3 or Tye™ 563 Texas Red® Cy5 or Tye™ 665Bio-Rad MiniOpticon™ FAM HEX™ Bio-Rad Myl Q2 FAM HEX™ Bio-Rad MylQ5 FAM HEX™ TAMRA Texas Red® Cy5 or Tye™ 665Roche LightCycler®480 FAM HEX™ or JOE LCRed 610 LC640Agilent Mx3000P FAM HEX™ or JOE Cy3 or Tye™ 563 Texas Red®Agilent Mx3005P FAM HEX™ or JOE Cy3 or Tye™ 563 Texas Red® Cy5 or Tye™ 665
Dyes Available from IDT and Instrument Compatibility for Multiplexing
34
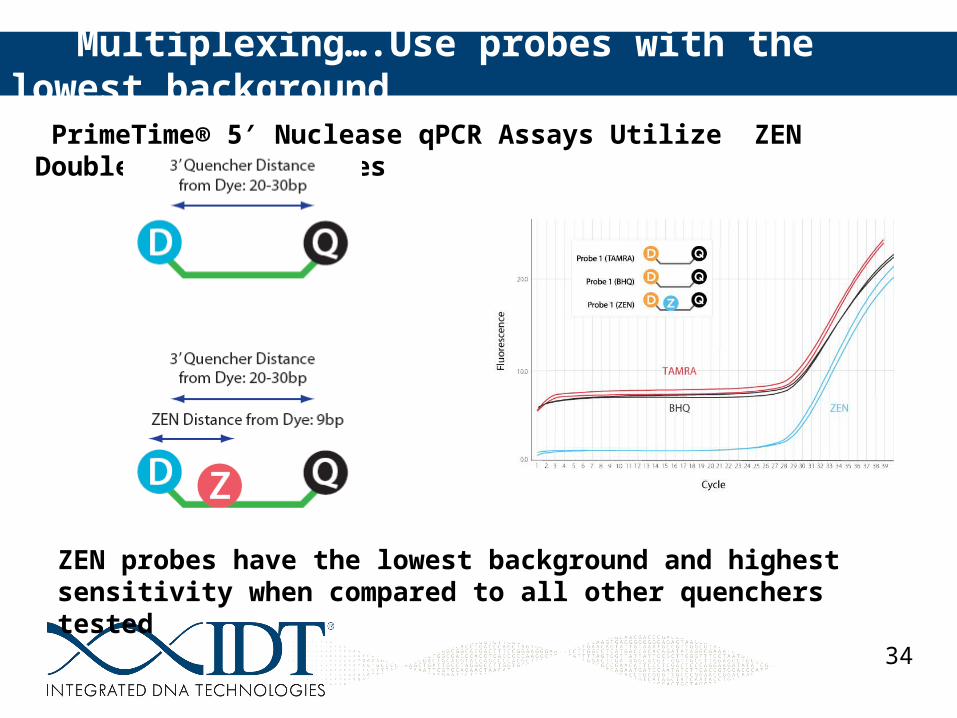
PrimeTime® 5 Nuclease qPCR Assays Utilize ZEN Double-Quenched Probes′
Multiplexing….Use probes with the lowest background
ZEN probes have the lowest background and highest sensitivity when compared to all other quenchers tested
35
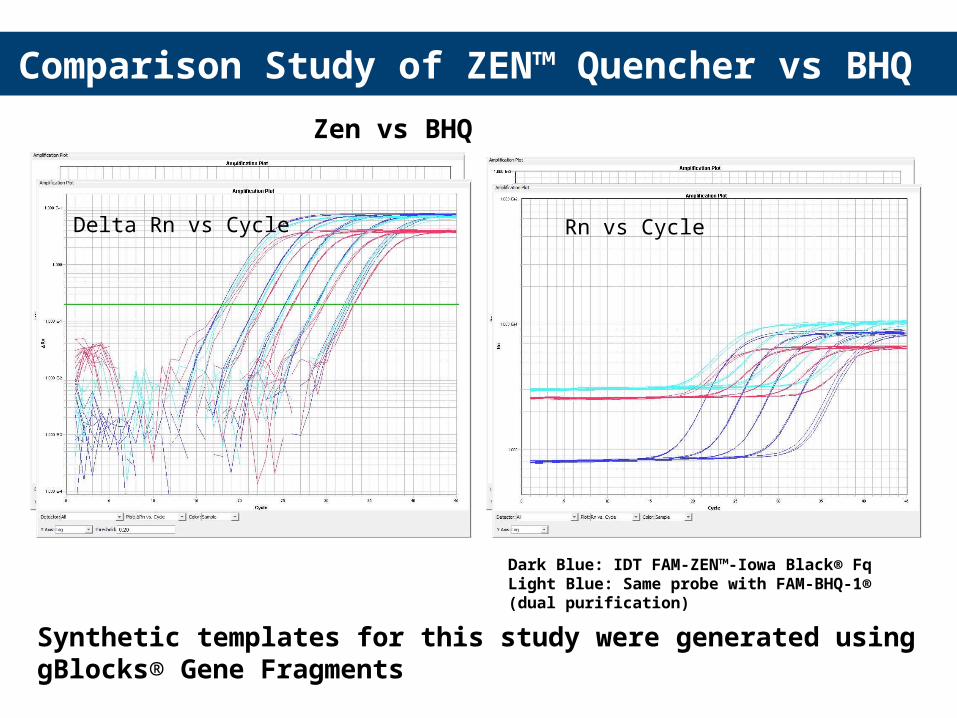
Zen vs BHQ
Dark Blue: IDT FAM-ZEN™-Iowa Black® FqLight Blue: Same probe with FAM-BHQ-1® (dual purification)Red: Same probe with FAM-BHQ-1® ( single purification)
Comparison Study of ZEN™ Quencher vs BHQ
Delta Rn vs Cycle Rn vs Cycle
Synthetic templates for this study were generated using gBlocks® Gene Fragments
36
Experimental Plate Layout
37
Plate Layout—Maximize Samples or Genes?
Sample maximization No increase in variation due to absence of inter-run variation Suitable for retrospective studies and controlled experiments
Gene maximization Introduces inter-run variation Applicable for larger studies in which the number of samples do not fit
Inter-run calibration Identical sample measured for the same gene in different runs
38
Sample Maximization vs Gene Maximization
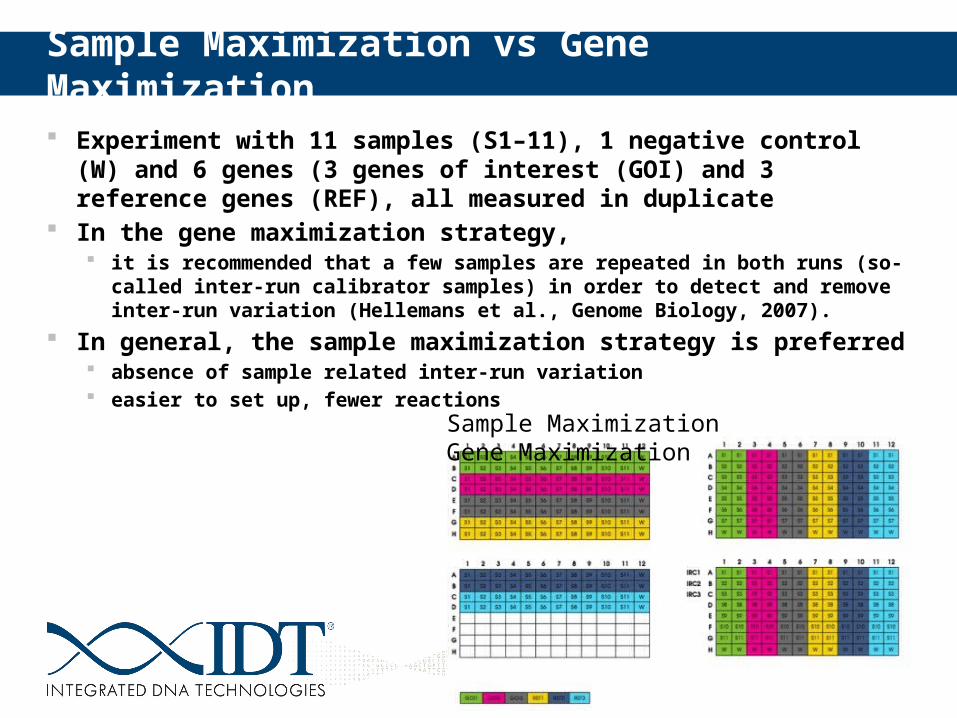
Experiment with 11 samples (S1–11), 1 negative control (W) and 6 genes (3 genes of interest (GOI) and 3 reference genes (REF), all measured in duplicate
In the gene maximization strategy, it is recommended that a few samples are repeated in both runs (so-called inter-run
calibrator samples) in order to detect and remove inter-run variation (Hellemans et al., Genome Biology, 2007).
In general, the sample maximization strategy is preferred absence of sample related inter-run variation easier to set up, fewer reactions Sample Maximization Gene Maximization
39
Methods of Quantification
40
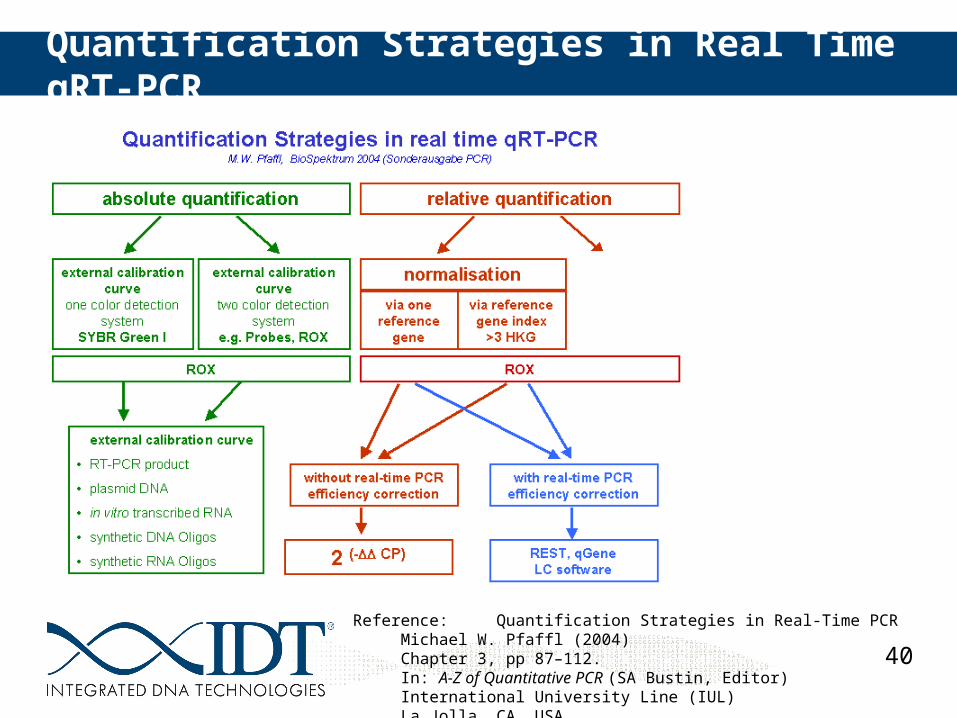
Quantification Strategies in Real Time qRT-PCR
Reference: Quantification Strategies in Real-Time PCRMichael W. Pfaffl (2004) Chapter 3, pp 87–112.In: A-Z of Quantitative PCR (SA Bustin, Editor)International University Line (IUL)La Jolla, CA, USA.
41
Absolute Quantification
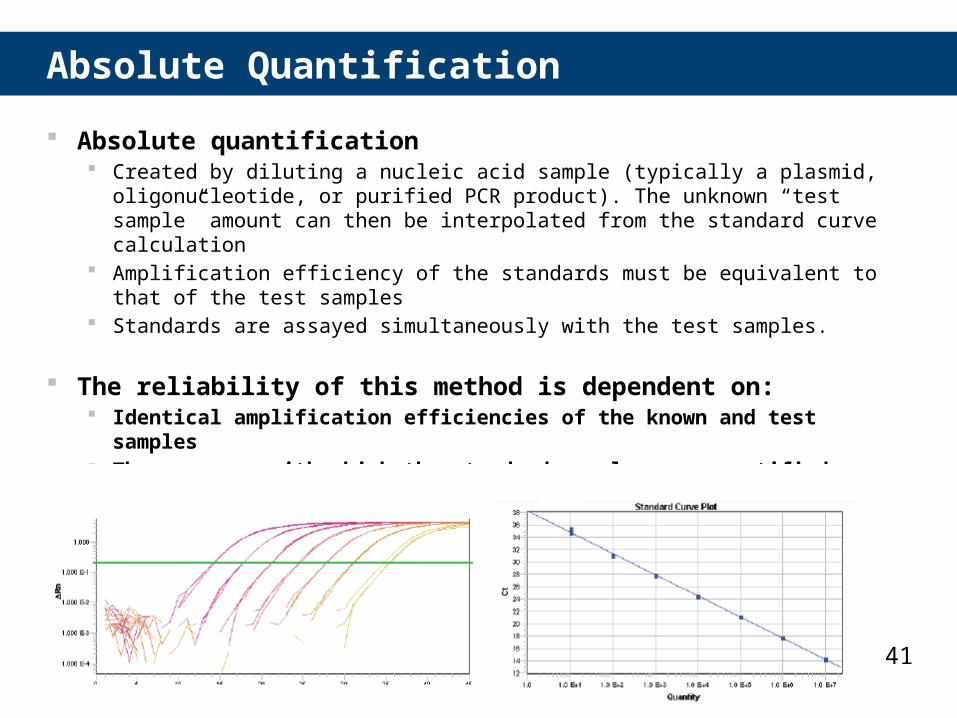
Absolute quantification Created by diluting a nucleic acid sample (typically a plasmid, oligonucleotide, or
purified PCR product). The unknown “test sample” amount can then be interpolated from the standard curve calculation
Amplification efficiency of the standards must be equivalent to that of the test samples
Standards are assayed simultaneously with the test samples.
The reliability of this method is dependent on: Identical amplification efficiencies of the known and test samples The accuracy with which the standard samples are quantified
42
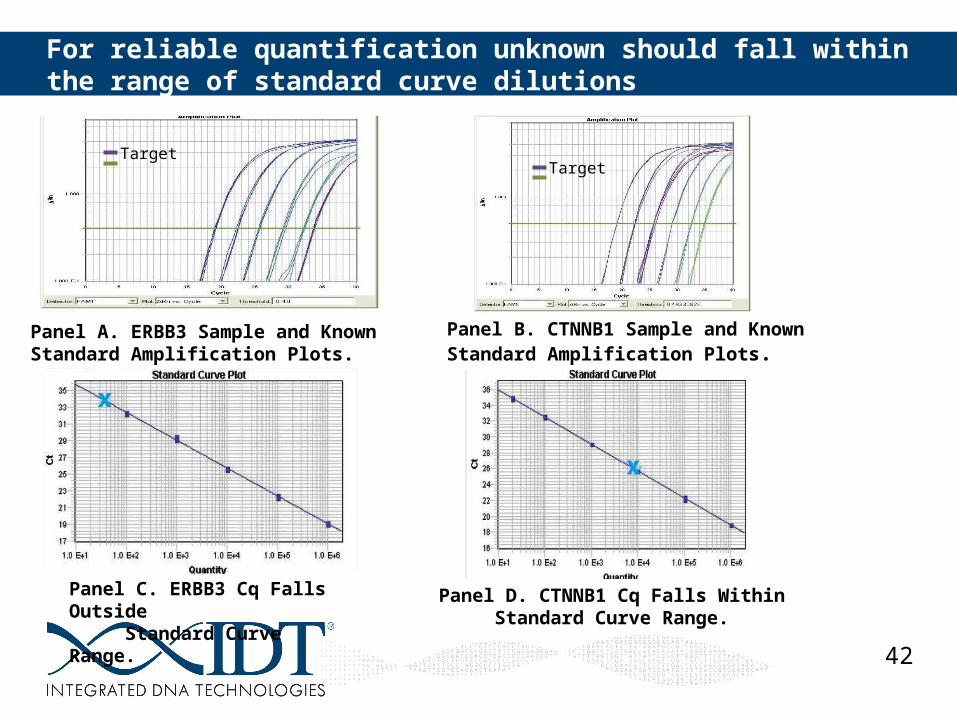
For reliable quantification unknown should fall within the range of standard curve dilutions
Panel A. ERBB3 Sample and Known Standard Amplification Plots.
Panel B. CTNNB1 Sample and Known Standard Amplification Plots.
Panel C. ERBB3 Cq Falls Outside Standard Curve Range.
Panel D. CTNNB1 Cq Falls Within Standard Curve Range.
TargetTarget
43
Relative Quantification
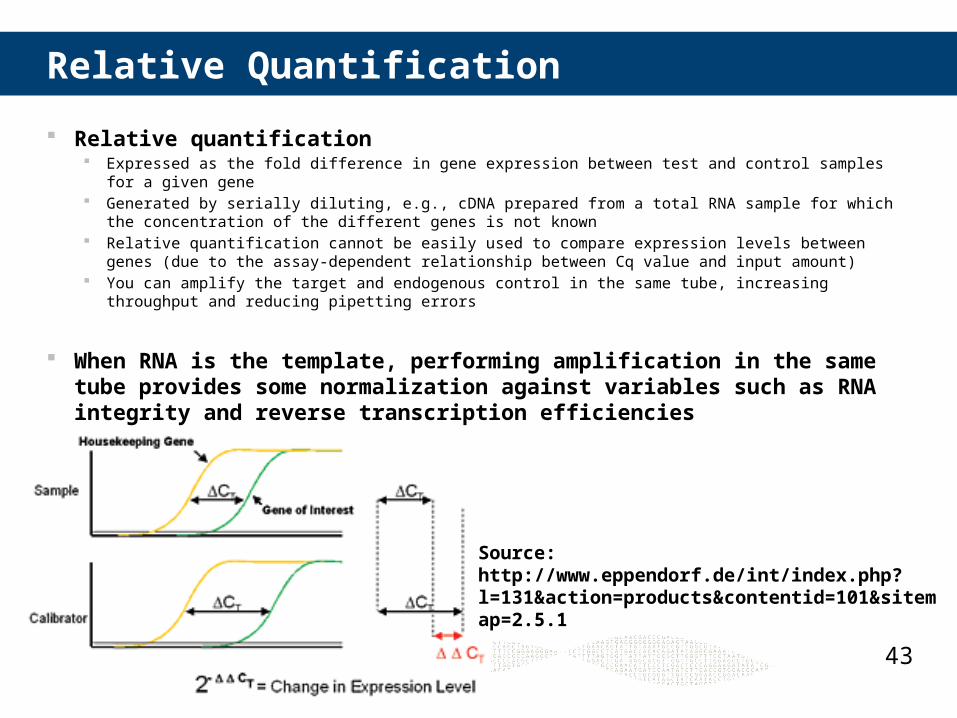
Relative quantification Expressed as the fold difference in gene expression between test and control samples for a given gene Generated by serially diluting, e.g., cDNA prepared from a total RNA sample for which the concentration of the
different genes is not known Relative quantification cannot be easily used to compare expression levels between genes (due to the assay-
dependent relationship between Cq value and input amount) You can amplify the target and endogenous control in the same tube, increasing throughput and reducing
pipetting errors
When RNA is the template, performing amplification in the same tube provides some normalization against variables such as RNA integrity and reverse transcription efficiencies
Source: http://www.eppendorf.de/int/index.php?l=131&action=products&contentid=101&sitemap=2.5.1
44
RT-qPCR Data Normalization Using Reference Genes
A measured difference in RNA expression level between 2 samples is the result of both true biological as well as experimentally induced (technical) variation
Variables that contribute to technical variation need to be minimized e.g., the amount and quality of starting material, enzymatic efficiencies, and overall transcriptional activity The remaining technical variation should be further reduced by using a proper
normalization approach, focusing the data on true biological variation
Use multiple stable reference genes
Source:Vandesompele et al. (2002) Genome Biology; Bustin et al. (2009) Clinical Chemistry.
45
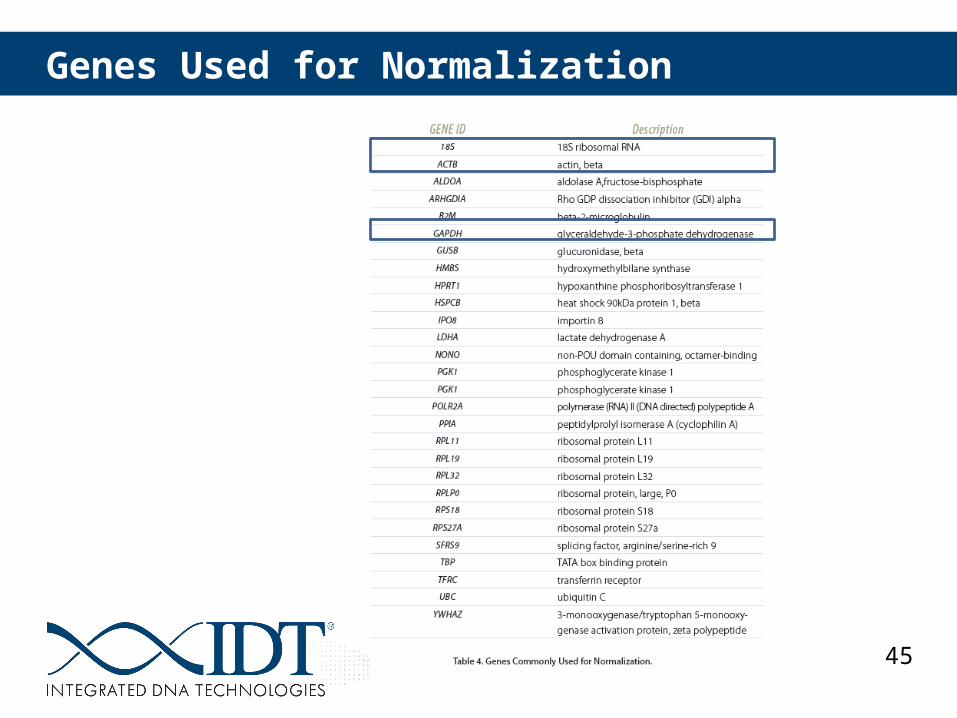
Genes Used for Normalization
46
Efficiency Calculations
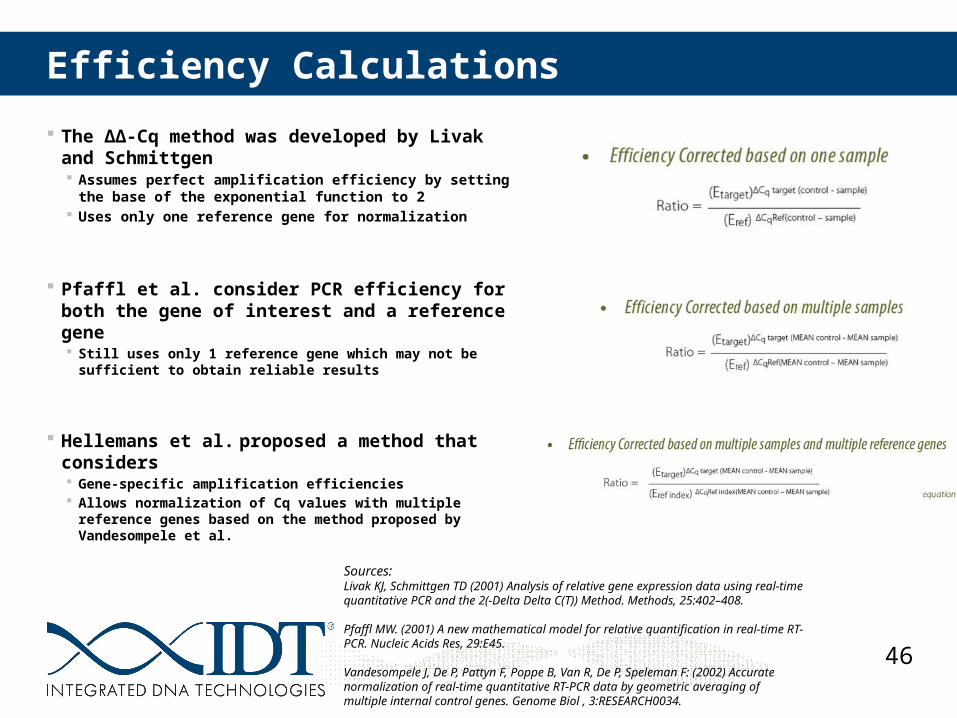
The ΔΔ-Cq method was developed by Livak and Schmittgen Assumes perfect amplification efficiency by setting the
base of the exponential function to 2 Uses only one reference gene for normalization
Pfaffl et al. consider PCR efficiency for both the gene of interest and a reference gene Still uses only 1 reference gene which may not be sufficient
to obtain reliable results
Hellemans et al. proposed a method that considers Gene-specific amplification efficiencies Allows normalization of Cq values with multiple reference
genes based on the method proposed by Vandesompele et al.
Sources:Livak KJ, Schmittgen TD (2001) Analysis of relative gene expression data using real-time quantitative PCR and the 2(-Delta Delta C(T)) Method. Methods, 25:402–408.
Pfaffl MW. (2001) A new mathematical model for relative quantification in real-time RT-PCR. Nucleic Acids Res, 29:E45.
Vandesompele J, De P, Pattyn F, Poppe B, Van R, De P, Speleman F: (2002) Accurate normalization of real-time quantitative RT-PCR data by geometric averaging of multiple internal control genes. Genome Biol , 3:RESEARCH0034.
47
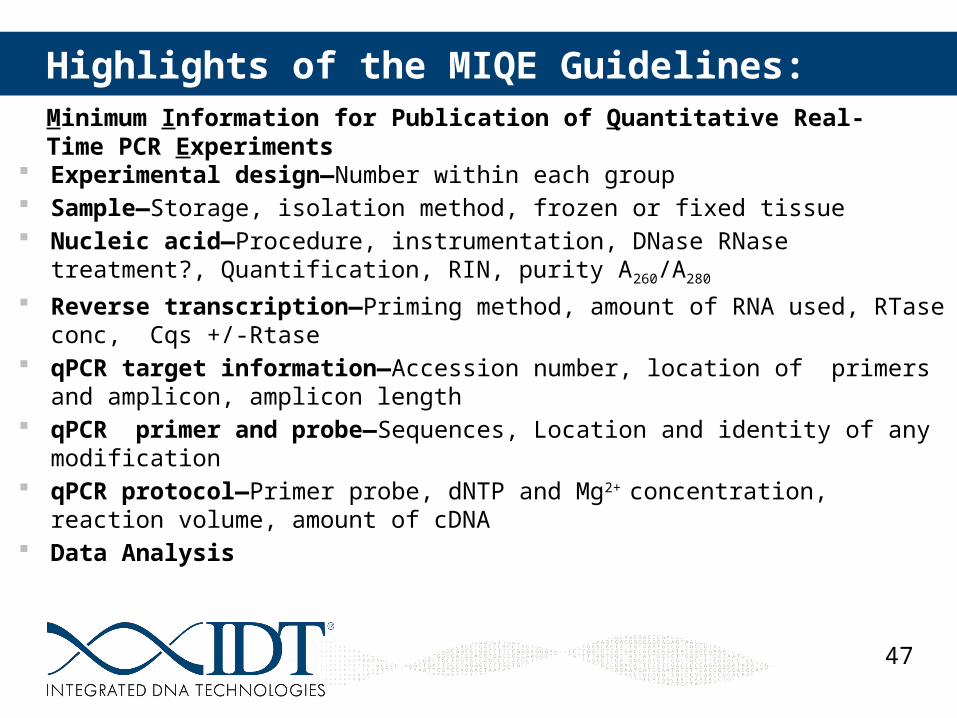
Highlights of the MIQE Guidelines:
Experimental design—Number within each group Sample—Storage, isolation method, frozen or fixed tissue Nucleic acid—Procedure, instrumentation, DNase RNase treatment?, Quantification,
RIN, purity A260/A280
Reverse transcription—Priming method, amount of RNA used, RTase conc, Cqs +/-Rtase
qPCR target information—Accession number, location of primers and amplicon, amplicon length
qPCR primer and probe—Sequences, Location and identity of any modification qPCR protocol—Primer probe, dNTP and Mg2+ concentration, reaction volume,
amount of cDNA Data Analysis
Minimum Information for Publication of Quantitative Real-Time PCR Experiments
48
Thank you
Questions?
49
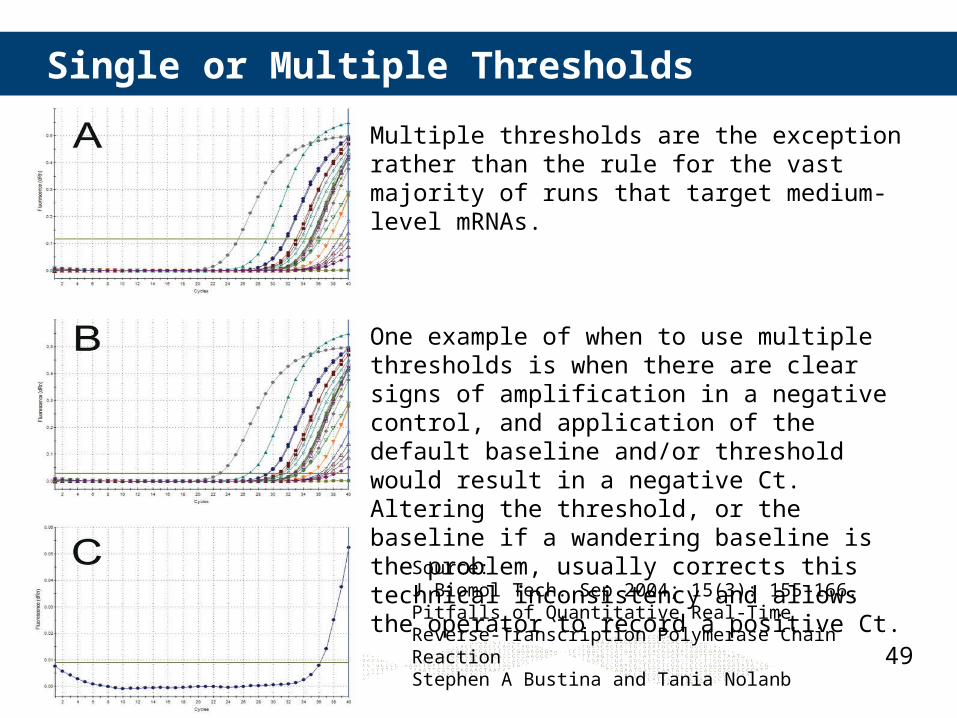
Single or Multiple Thresholds
Multiple thresholds are the exception rather than the rule for the vast majority of runs that target medium-level mRNAs.
One example of when to use multiple thresholds is when there are clear signs of amplification in a negative control, and application of the default baseline and/or threshold would result in a negative Ct. Altering the threshold, or the baseline if a wandering baseline is the problem, usually corrects this technical inconsistency and allows the operator to record a positive Ct.
Source: J Biomol Tech. Sep 2004; 15(3): 155–166. Pitfalls of Quantitative Real-Time Reverse-Transcription Polymerase Chain ReactionStephen A Bustina and Tania Nolanb