technicalpolicy briefingnote - economics of climate change
TRANSCRIPT

6Technical PolicyBriefing Note
Technical Policy BriefingNote 6: Ancillary Air
Quality BenefitsThe Reduction in Air Quality
Impacts and AssociatedEconomic Benefits of
Mitigation Policy:
Summary of Resultsfrom the EC RTD Climate
Cost Project
Mike Holland, Markus Amann,Chris Heyes, Peter Rafaj,
Wolfgang Schöpp,Alistair Hunt and Paul Watkiss

• Mitigation policy has a beneficial effect in reducing greenhouse gas
(GHG) emissions, because it introduces cleaner fuels and improves
energy efficiency. These mitigation measures also reduce emissions of
air pollutants such as oxides of nitrogen (NOx), sulphur dioxide (SO2)
and fine particles (PM), and as a result, they improve air quality.
• Despite large improvements in Europe in recent decades, current air
quality (air pollution) levels are responsible for adverse health and
environmental impacts, including a significant shortening of life
expectancy. These impacts have large economic costs. The air quality
improvements from mitigation policy will reduce these costs, and
therefore lead to economic co-benefits.
• These ancillary co-benefits are important when comparing the costs
and benefits of mitigation. Whilst the full benefit of European GHG
reductions may only be experienced by future generations and occur at
the global level, the ancillary benefits of air quality improvements occur
in the short-term and lead to direct (local) benefits in Europe.
• The ClimateCost study has assessed the health, environmental and
economic air quality benefits of mitigation policy. The analysis used the
GAINS and ALPHA models to assess a mitigation policy scenario that is
consistent with the EC’s 2 degrees target, and compared this to a
baseline medium-high emissions scenario.
• The estimated benefits of the 2 degrees stabilisation (mitigation)
scenario, over and above the baseline scenario, are substantial.
• Under the mitigation scenario, there are large reductions in EU air
pollutant emissions, with a 60% reduction in sulphur dioxide (SO2) and
480,000years of life (expectancy)gained annually in the EU27by 2050, due to theimprovement in air qualityunder a mitigation scenario
€44 to€95bnannual air quality co-benefit inthe EU27 in 2050 under amitigation scenario
€24air quality co-benefit per tonneof CO2 abated (EU27 in 2050)
€36bn/yravoided air quality abatementcosts in 2050 (EU27) under amitigation scenario
Key Messages
02/03
a 46% reduction in oxides of nitrogen (NOx) when
compared to the baseline in 2050. There is also a 19%
reduction in emissions of particulate matter (PM).
• These emission reductions – and the associated
improvement in air quality – lead to large health benefits.
Under the mitigation scenario, average life expectancy in
Europe (EU27) is extended by 1 month of life by 2050:
equivalent to an annual benefit of 480,000 years of life.
• In addition, the mitigation scenario reduces the number of
ozone related deaths in the EU27 by 3400 fatalities a year
by 2050, as well as reducing the annual number of cases
of chronic bronchitis and hospital admissions by 27,000
and 20,000 respectively. It also leads to an estimated
reduction of 127 million minor symptom days each year by
2050.
• The economic benefits of these health improvements are
estimated at €43 billion per year in 2050 in the EU27(current prices, undiscounted), based on a value of life
years lost approach for the change in mortality risk. Using
an alternative valuation metric of the value of a statistical
life, the benefits of the mitigation scenario increase to
€94 billion per year by 2050.
• When expressed against the CO2 reductions achieved, the
air quality co-benefits of the mitigation scenario are around
€24 for each tonne of CO2 reduced over the periodinvestigated.
• GHG mitigation policies also reduce the need to
implement air quality pollution measures and equipment
required by legislation. These avoided costs have also
been considered in ClimateCost, using the GAINS model.
Under the mitigation scenario, the regulatory air quality
costs in the EU27 are reduced by €36 billion per year by2050, mostly due to avoided costs of NOx and PM control
in the transport sector.
• The mitigation scenario also leads to important co-benefits
for managed and unmanaged ecosystems, reducing
acidification and eutrophication. Under the mitigation
scenario, the area of forest in the EU27 that exceeds the
critical loads for acid deposition is reduced by 42
thousand km2 by 2050, a 15% reduction on the baseline.
The area of ecosystems in the EU27 that exceeds the
critical load for nitrogen deposition and eutrophication is
reduced by 144 thousand km2 by 2050.
• The study has also considered the air quality benefits of
global mitigation policy in other world regions using the
GAINS model, which reveals even larger health benefits.
Under the mitigation scenario, the average life expectancy
gain is estimated at 19 months in China and nearly 30
months in India by 2050, compared to the baseline, and
would also reduce ozone related mortality by more than 75
thousand cases per year across the two countries.
• The magnitude of the co-benefits above demonstrates
they are very relevant to the policy discussion on the costs
and benefits of mitigation. It also emphasises the
importance of exploiting synergies in the fields of climate
and air pollution.
1. IntroductionThe objective of the ClimateCost project is to advanceknowledge on the economics of climate change, focusing onthree key areas: the economic costs of climate change (thecosts of inaction), the costs and benefits of adaptation, andthe costs and benefits of long-term targets and mitigation.The project has assessed the impacts and economic costsof climate change in Europe and globally. This included abottom-up sectoral impact assessment and analysis ofadaptation for Europe, as well as a global economicmodelling analysis with sector-based impact models,computable general equilibrium models and global economicintegrated assessment models.
This technical policy briefing note (TPBN)1 provides anoverview of the air quality benefits work undertaken in theproject, which has assessed the avoided impacts andeconomic ancillary benefits of mitigation policy, focusing onEurope (EU27), though with discussion of the benefits forChina and India. The paper is based on ClimateCost reportsby Rafaj et al (2011) and Holland et al (2011a)2.
1.1 BackgroundAir pollution has a number of important impacts on humanhealth, as well as on the natural and man-madeenvironment. These include impacts of short-term and long-term exposure to air pollution on our health, damage tobuilding materials, effects on crops, and impacts on naturaland semi-natural ecosystems (both terrestrial and aquatic).These are described in the box below. These impacts have anumber of important economic costs – known as externalcosts or externalities – as they are not included in the price
of goods or services that lead to air pollution.
Concerns over these impacts have led to the introduction ofmajor air quality policies in Europe over the past fewdecades. These were initially driven by the need to reduceimpacts on natural or semi-natural ecosystems (acidificationand eutrophication) and were implemented as internationalagreements to reduce emissions. More recently, they havefocused on reducing the significant impacts of air qualityconcentrations on human health and the wider environment.These have been translated through to a set of policies,which includes the Thematic Strategy on Air Pollution (CEC,2005). These policies have led to substantial reductions inemissions – and improvement of air quality – since the late1970s.
Nevertheless, air pollution still leads to widespread healthand environmental impacts in Europe. Recent reports for theEuropean Commission (Amann et al, 2011; Holland et al,2011b) estimate that across Europe as a whole, as far eastas the European regions of Russia, nearly 5 million life yearswill be lost annually as a result of emissions in 2020, and37% of ecosystems will be at risk of damage from nitrogendeposition.
At the same time that air pollution policy continues to targetthese impacts, it has become apparent that mitigation policycan lead to very large reductions in the air pollutantemissions – and thus large improvements in air quality.These arise because the use of cleaner fuels (e.g.renewables) or reduced demand (e.g. through energyefficiency) reduces fossil fuel use and the associatedcombustion emissions of oxides of nitrogen (NOx), sulphurdioxide (SO2) and fine particles (PM). These provideadditional benefits that should be considered when weighingup the potential costs and benefits of mitigation policydirected at GHG control.
Policy Brief
06
04/05
1 The research leading to these results received funding from the European Union Seventh Framework Programme (FP7/2007- 2013) under grant agreementn° 212774. This TPBN was written by Mike Holland and Alistair Hunt from Metroeconomica, Markus Amman, Chris Heyes, Peter Rafaj and Wolfgang Schöppfrom the Mitigation of Air Pollution & Greenhouse Gases (MAG) Program of IIASA, and Paul Watkiss from Paul Watkiss Associates (UK). The citation should be:Holland, M., Amann, M., Heyes, C., Rafaj, P., Schöpp, W. Hunt, A., and Watkiss, P. (2011). (2011). The Reduction in Air Quality Impacts and AssociatedEconomic Benefits of Mitigation Policy. Summary of Results from the EC RTD ClimateCost Project. In Watkiss, P (Editor), 2011. The ClimateCost Project. FinalReport. Volume 1: Europe. Published by the Stockholm Environment Institute, Sweden, 2011. ISBN 978-91-86125-35-6.2 This note is a summary of two ClimateCost reports, from Work Package 5.1.– Co-benefits of post-2012 global GHG-mitigation policies. Peter Rafaj, Wolfgang Schöpp, Peter Russ‡, Chris Heyes, Markus Amann. Mitigation of Air Pollution& Greenhouse Gases (MAG) Program, IIASA. ‡Institute for Prospective Technological Studies (IPTS), Joint Research Centre (JRC), Seville, Spain.– Quantification and monetisation of the co-benefits from control of regional air pollutants. Mike Holland, Alistair Hunt, Fintan Hurley, Brian Miller, Anne Wagner,Ritu Mathur, Atul K, Anil Ramaprasad.These are summarised in the final deliverable, which is available from the ClimateCost website.

These ancillary air quality benefits are different to the benefitsof mitigation in reducing global climate change. While thebenefit of GHG reductions from mitigation are mostlyexperienced by future generations at the global level, theancillary air quality benefits accrue to the current generationand are local or regional in nature. They therefore provideimmediate and tangible benefits to those who reduce GHGemissions.
Mitigation policy therefore has potential to generate large co-benefits for Europe. Moreover, there are potentially evengreater benefits for other major emitters, notably in majordeveloping countries which have much higher baseline levelsof air pollution, such as China and India. These countries areincreasingly suffering air quality pollution levels that aresimilar to historic European levels, with the health andenvironmental impacts. Reducing GHG emissions in thesecountries will thus produce large, immediate and localised
benefits, and provide an extra justification for a low carbontransition.
Against this background, the ClimateCost project hasquantified the benefits of mitigation policy, in terms ofphysical impacts and the monetary values. This technicalbriefing note summarises the approach and findings.
2. Socio-EconomicProjections and ScenariosIn the assessment of the future effects of mitigation policy,assumptions have to be made about future conditions,which require socio-economic scenarios. In scientific terms,a scenario is a plausible future (‘storyline’) of environmentaland anthropogenic change as informed by expert
Air Quality
The impacts of air pollutionStudies of early air pollution episodes (such as the Londonsmog episodes of the 1950s) revealed that very high levelsof ambient air pollution are associated with strong increasesin health impacts. Recent studies also reveal smallerincreases at the current levels of air pollution typical ofEurope. The health effects associated with short-term (acute)exposure include premature mortality (deaths broughtforward), respiratory and cardio-vascular hospitaladmissions, and probably exacerbation of asthma and otherrespiratory symptoms. The evidence for these effects isstrongest for particulates (usually characterized as PM10 orPM2.5) and for ozone. There is also now strong evidence thatlong-term (chronic) exposure to particulates damages healthand that these effects, measured through reduced lifeexpectancy, are substantially greater than the effects ofacute exposure. These health impacts have major economiccosts because of the additional burden they impose on thehealth service, the lost time at work, and the pain andsuffering of affected individuals.
Air pollution also impacts on other receptors. The effects ofatmospheric pollutants on buildings provide some of theclearest examples of air pollution damage. Air pollution isassociated with a number of impacts including acid
corrosion of stone, metals and paints in ‘utilitarian’applications; acid impacts on materials of cultural merit(including stone, fine art, etc.); ozone damage to polymericmaterials, particularly natural rubbers; and soiling ofbuildings. SO2 is the primary pollutant of concern in buildingcorrosion. The analysis of building soiling is concerned withthe deposition of particles on external surfaces and the dis-colouration of stone and other materials.
Ozone is recognised as the most serious regional airpollutant problem for agriculture in Europe at the presenttime, though some air pollutants other than ozone have beenlinked in the literature to crop damages (e.g. SO2, NO2, HF),though generally at higher levels than are currentlyexperienced.
Air pollution also impacts on natural and semi-naturalecosystems. The effects of SO2 and secondary pollutantson ecosystems ranging from forests to freshwaters are wellknown, and have been the prime concern until recently ininternational negotiations. Emissions of NOX are also knownto be responsible for a range of impacts on ecosystemsparticularly through their contribution to acidification,eutrophication and the generation of tropospheric ozone.Recent analysis shows that the problem of eutrophicationfrom N deposition is far more extensive than currentproblems from acidification.
judgement, but it does not mean that this future willnecessarily occur.
The most widely used in the context of climate change arethe emissions scenarios of the IPCC Special Report onEmission Scenarios (the SRES scenarios, Nakicenovic et al.,2000). These define a set of future self-consistent andharmonised socio-economic conditions and emissionsfutures that, in turn, have been used to assess potentialchanges in climate through the use of global and regionalclimate models. There is a wide range of future drivers andemissions paths associated with the scenarios.
The ClimateCost project focused on a number of scenarios.This included consideration of SRES medium-high (A1B) anda mitigation scenario consistent with the EU 2 degree target,based on ENSEMBLES E1 scenario (van der Linden et al.,2009).
In the analysis of air quality co-benefits reported in thistechnical briefing note, a slightly updated set of emissionscenarios has been used, based on projections of energyuse data provided by the POLES model (Russ et al, 2009).These include consideration of current air quality legislation.They are broadly consistent with the SRES A1B andENSEMBLES E1 scenarios, but with some minordifferences, notably in the emission profile in recent yearsand in the immediate future. These updated scenarios areparticularly important here because of the greater analyticalfocus on the short-term and on local impacts (in Europe), i.e.to ensure the analysis matches a current profile consistentwith current emissions and air quality concentrations.
2.1 Scenarios usedThe Baseline scenario used in this analysis explores abaseline situation in which no further climate and air pollutionpolicies are implemented beyond that in place in the year2010, thus energy consumption from 2010 through to 2050is driven by population and economic growth. Note that thisdoes take into account the existence of the emission tradingscheme (ETS) market in the EU and the prospect of futureclimate policies in other countries. It also includes theconsequences of the financial crisis in 2008/2009, and theevolution of the oil prices, but it excludes the implementationof the unilateral GHG reduction target (20% compared to1990 by 2020) and the renewables target (20% by 2020) asproposed in the EU energy and climate change package
(EC, 2008).
The Mitigation scenario used in this analysis was providedby the POLES model. It is a greenhouse gas reductionscenario with global CO2 emissions reduced by 60% in 2050compared to 1990. These reductions, together with those inagriculture and in land-use change and forestry (de-forestation), contribute to achieving a global meantemperature increase of less than 2 degrees above pre-industrial levels. The scenario assumes developed countriestake on a collective emission reduction target and set up atrading system such as the EU ETS or similar policymeasures that establish a carbon price for the energyintensive industrial sectors, including the power sector.Energy intensive sectors in developing countries areexposed to a low carbon price, simulating the limitedpenetration or visibility of a carbon price for all individualfirms through policy instruments such as the CDM.
Further details of both scenarios are available from Rafaj et al(2011).
The project has assessed these two scenarios, reported asthe baseline and the 2 degrees target, and has assessed thedifference between them to provide the economic benefits ofmitigation. The assessment has been undertaken for thefuture decades from today through to 2050. It is stressedthat benefits would continue to accrue beyond this time solong as policies remained in place.
3. MethodsThe usual approach taken for the detailed quantification ofthe benefits of air pollution emissions through tomonetisation is often referred to as the ‘impact pathwayapproach’. This is a logical progression from emissions,through the estimation of the modelled dispersion andchange in air quality concentrations, to exposure andquantification of impacts and their valuation. This approachwas advanced through the series of EC Research projectsunder the ExternE series (EC, 1995, 1999).
The approach is shown in Figure 1 below.
ClimateCost has used this impact pathway approachthrough the following series of steps:
1. Quantification of emissions;
2. Analysis of pollutant dispersion and chemistry across
Policy Brief
06
06/07

Europe (and also China and India) and assessment of thechange in air pollution concentrations;
3. Quantification of the exposure of people, environmentand buildings that are affected by air pollution, i.e. linkingpollution with the ‘stock at risk’ e.g. using populationdata;
4. Quantification of the impacts of air pollution, usingrelationships from studies that link pollutionconcentrations with physical impacts such as cropdamages or health impacts;
5. Valuation of the impacts. This is undertaken from theperspective of ‘willingness to pay’ (WTP). For someeffects, such as damage to crops, this approach can becarried out using market data. For non-market effects
such as on health, the assessment uses a combinationof the ‘market’ data (e.g. the cost of medicines and care)combined with estimates of people’s willingness to payfrom stated and revealed preference techniques.
The analysis used two models to undertake this analysis,working within a Geographical Information Systems (GIS)framework: the GAINS (Greenhouse Gas and Air PollutionInteractions and Synergies) model and the ALPHA model.Both are described in the box below.
The two models are complementary as they focus ondifferent aspects of the steps in Figure 1 above. Both theGAINS model (SERI, 2004, also 2007, 2009)3 and the CAFECBA method (Krupnick et al, 2004) have been extensivelypeer reviewed, and applied previously in EC policy impactassessment (CEC, 2005b).
Air Quality
3 See http://gains.iiasa.ac.at/index.php/documentation-of-model-methodology/model-reviews/gains-review-2009.
Identify sources and quantify emissions (e.g. PM, SO2, NOx)
Calculate dispersion of precursors and concentrations
Apply concentration-response functions to estimate impacts,
e.g. health impacts
Value using market prices or non-market estimates (WTP)
C1
Co
I o Impact
Con
cent
ratio
n
I 1
Stock at risk e.g. population
Figure 1. Impact Pathway Approach
Source: Watkiss et al, 2008.
Policy Brief
06
08/09
4 http://www.ec4macs.eu/home/index.html?sb=1.
Greenhouse Gas and AirPollution Interactions andSynergies – GAINSThe Greenhouse and Air pollution Interactions and Synergies(GAINS) model explores cost-effective strategies to reduceemissions of greenhouse gases (GHG) and conventional airpollutants. The GAINS model (http://gains.iiasa.ac.at)produces emission scenarios for all major air pollutants forany exogenously supplied projection of future economicactivities, abatement potentials, and costs as well asinteractions in abatement between various pollutants(Amman et al., 2011).
It includes detailed atmospheric chemistry and transportmodels which allow the atmospheric modelling of emissionsand the estimation of pollution concentrations, includingboth primary and secondary pollutants. Theseconcentrations are combined with other necessary datasuch as critical loads and levels, relative risk factors,population, ecosystems areas, etc. This then allows theestimation of the effects on human health from the exposureof fine particles and ground-level ozone, and the ecosystemsdamage to vegetation via excess deposition of acidifying andeutrophying compounds.
The model also has a detailed abatement module whichallows the analysis of abatement control to reduce theseimpacts, using a cost-effectiveness framework that canaddress multiple targets of health and ecosystem protection,as well as reducing GHG emissions. Thereby, GAINS allowsfor a comprehensive and combined analysis of air pollutionand climate change mitigation strategies, which revealsimportant synergies and trade-offs between these policyareas.
Within the ClimateCost study the global version of GAINSwas run to estimate the air pollution changes associatedwith the emission reduction scenarios, and the associatedbenefits to ecosystems and health.
CAFE CBA and the ALPHAmodelThe Atmospheric Long-range Pollution Health/environmentAssessment (ALPHA) model (Holland et al, 2008) wasdeveloped to provide a detailed quantification of benefits ofpollution controls in Europe. It has been used extensively forEuropean policy assessments including work on the NationalEmission Ceilings Directive and the UN/ECE GothenburgProtocol under the Convention on Long RangeTransboundary Air Pollution, directives on air quality includingthe Clean Air For Europe (CAFE) Directive, directives on fuelquality and directives on emission limits for industry.
The model takes dispersion data from the EMEP or GAINSmodels and provides a detailed quantification of effects onhealth, including various morbidity impacts (on chronicbronchitis, hospital admissions, etc.) and mortality, andeffects on building materials and crops. Extension of themodel for quantification of effects on ecosystem services iscurrently under consideration.
Analysis then continues to monetization of quantified effects,permitting final results to be used in cost-benefit analysisusing information on abatement costs from models such asGAINS. The model can be applied at any desired geographicscale and over any area of interest provided that appropriatepollution and population data are available.
Further information on the methods, data, and assumptionsthat underpin the GAINS and ALPHA models are availableon the website of the EC4MACS Project4.
3.1 Emissions Analysis and InputsThe analysis first investigated the reduction in emissions ofgreenhouse gases in the EU and the associated reductionsin emissions of sulphur dioxide (SO2), oxides of nitrogen (NOand NO2, together referred to as NOx), and fine particles

(PM2.5), but excluding the greenhouse gas nitrous oxide (N2O) and volatile organic compounds (VOCs).
The analysis was undertaken for two scenarios, a reference
(baseline) scenario out to 2050 and a mitigation scenariodesigned to limit global temperature to 2°C compared topre-industrial levels. The emission scenarios are described inthe box below.
Air Quality
Emission ScenariosThe scenarios assessed in ClimateCost were originallydeveloped by Russ et al (2009) using the POLES(Prospective Outlook for Long term Energy System) worldenergy sector model and the GEM-E3 (General EquilibriumModel: Energy, Economy, Environment) multi-sector generalequilibrium model. The scenarios were developed to assessthe technological and economic effects of a 50% likelihoodof limiting global temperature increase to 2°C. Within theanalysis, POLES provided analysis of the technologies of theenergy sector at a global scale, computing the direct cost ofreducing emissions in the energy sector, while the GEM-E3model used a multi-sector perspective that allowsassessment of the economic consequences in the wholeeconomy, therefore assessing the direct and indirect effectsof mitigation policies.
In setting emission levels by country under the MitigationScenario, the modelling accounted for both efficiency andequity to prescribe alternative burden sharing options,through consideration of: GDP per capita as an indicator ofwealth and ability to pay; the energy intensity of theeconomy as an indicator of the potential to reduceemissions; GHG emission trends as an indicator of thosethat have taken early action (and constrain subsequent
ability to reduce emissions); and recent levels of populationgrowth.
These four criteria were brought together to provide a centralscenario, which has been adopted in this analysis. Thisscenario includes an assumption of imperfect operation ofglobal carbon markets (as opposed to perfect trading or notrading at all), in which international trading graduallydevelops over time, bringing in more and more countries.The modelling includes some account of the 2008/9economic crisis through IMF forecasts made in 2008, thoughthis seems likely to have been too optimistic in terms ofeconomic recovery in the USA and Europe.
The GHG reductions in the Mitigation Scenario are primarilyfrom energy efficiency measures (accounting for roughly halfof the global reduction in 2020-2030). Significant reductionsin GHG emissions are also made through use of carboncapture and storage and fuel switching. The latter covers amove from (e.g.) coal and oil to lower carbon fossil fuels or torenewables and nuclear. The sectors contributing most toemission reductions are power generation followed by otherindustries, with a modest contribution from the transport anddomestic sectors. Projected total emissions of CO2 for theEU27 in the Baseline and Mitigation Scenarios are shown inFigure 2.
0
500
1000
1500
2000
2500
3000
3500
4000
4500
2000 2005 2010 2015 2020 2025 2030 2035 2040 2045 2050
EU27
CO
2Em
issi
ons
kTC
O2/
year
Baseline
Mitgation
4500
2000
2500
3000
3500
4000
4500
raey/2O
CTksnoiss
enilseBa
noitagtMi
0
500
1000
1500
2000
2000 20
siEm
2O
C72
EU
005 2010 2015 22020 2025 2030 22035 2040 2045 22050
Figure 2. Projected total
emissions of CO2 for the EU27,
2005 to 2050.
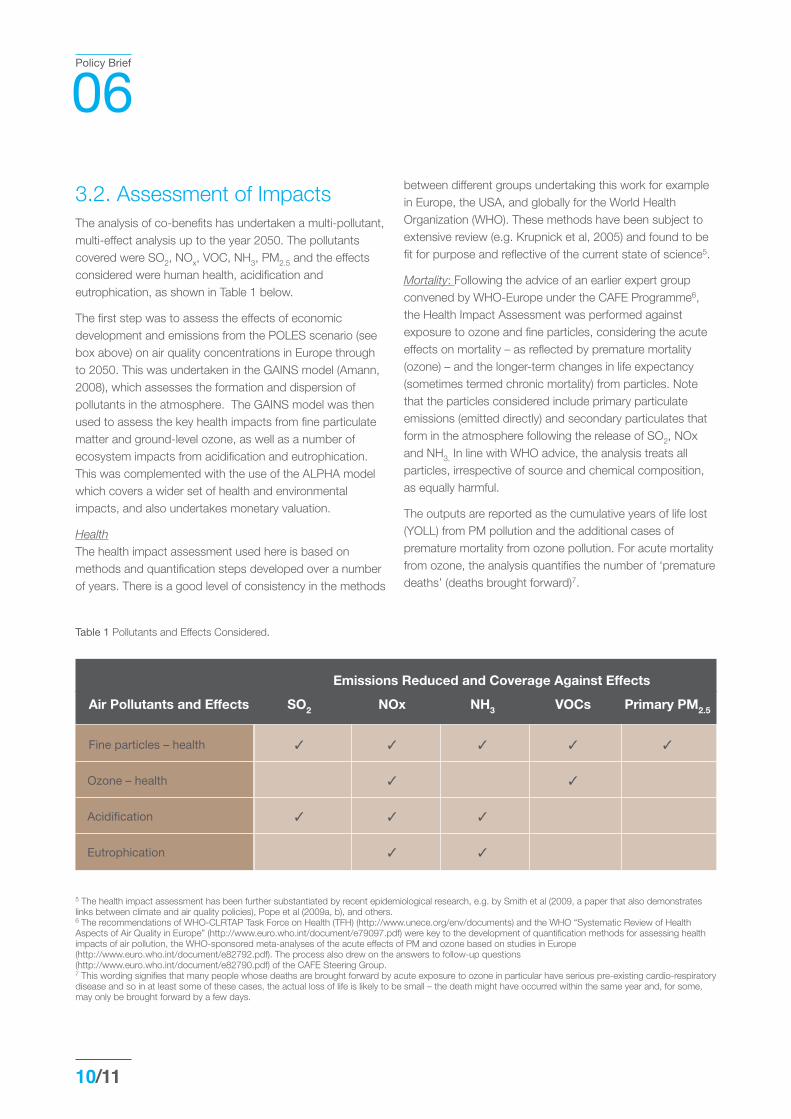
3.2. Assessment of ImpactsThe analysis of co-benefits has undertaken a multi-pollutant,multi-effect analysis up to the year 2050. The pollutantscovered were SO2, NOx, VOC, NH3, PM2.5 and the effectsconsidered were human health, acidification andeutrophication, as shown in Table 1 below.
The first step was to assess the effects of economicdevelopment and emissions from the POLES scenario (seebox above) on air quality concentrations in Europe throughto 2050. This was undertaken in the GAINS model (Amann,2008), which assesses the formation and dispersion ofpollutants in the atmosphere. The GAINS model was thenused to assess the key health impacts from fine particulatematter and ground-level ozone, as well as a number ofecosystem impacts from acidification and eutrophication.This was complemented with the use of the ALPHA modelwhich covers a wider set of health and environmentalimpacts, and also undertakes monetary valuation.
HealthThe health impact assessment used here is based onmethods and quantification steps developed over a numberof years. There is a good level of consistency in the methods
between different groups undertaking this work for examplein Europe, the USA, and globally for the World HealthOrganization (WHO). These methods have been subject toextensive review (e.g. Krupnick et al, 2005) and found to befit for purpose and reflective of the current state of science5.
Mortality: Following the advice of an earlier expert groupconvened by WHO-Europe under the CAFE Programme6,the Health Impact Assessment was performed againstexposure to ozone and fine particles, considering the acuteeffects on mortality – as reflected by premature mortality(ozone) – and the longer-term changes in life expectancy(sometimes termed chronic mortality) from particles. Notethat the particles considered include primary particulateemissions (emitted directly) and secondary particulates thatform in the atmosphere following the release of SO2, NOxand NH3. In line with WHO advice, the analysis treats allparticles, irrespective of source and chemical composition,as equally harmful.
The outputs are reported as the cumulative years of life lost(YOLL) from PM pollution and the additional cases ofpremature mortality from ozone pollution. For acute mortalityfrom ozone, the analysis quantifies the number of ‘prematuredeaths’ (deaths brought forward)7.
Policy Brief
06
10/11
5 The health impact assessment has been further substantiated by recent epidemiological research, e.g. by Smith et al (2009, a paper that also demonstrateslinks between climate and air quality policies), Pope et al (2009a, b), and others.6 The recommendations of WHO-CLRTAP Task Force on Health (TFH) (http://www.unece.org/env/documents) and the WHO “Systematic Review of HealthAspects of Air Quality in Europe” (http://www.euro.who.int/document/e79097.pdf) were key to the development of quantification methods for assessing healthimpacts of air pollution, the WHO-sponsored meta-analyses of the acute effects of PM and ozone based on studies in Europe(http://www.euro.who.int/document/e82792.pdf). The process also drew on the answers to follow-up questions(http://www.euro.who.int/document/e82790.pdf) of the CAFE Steering Group.7 This wording signifies that many people whose deaths are brought forward by acute exposure to ozone in particular have serious pre-existing cardio-respiratorydisease and so in at least some of these cases, the actual loss of life is likely to be small – the death might have occurred within the same year and, for some,may only be brought forward by a few days.
Table 1 Pollutants and Effects Considered.
Emissions Reduced and Coverage Against Effects
Air Pollutants and Effects SO2 NOx NH3 VOCs Primary PM2.5
Fine particles – health � � � � �
Ozone – health � �
Acidification � � �
Eutrophication � �
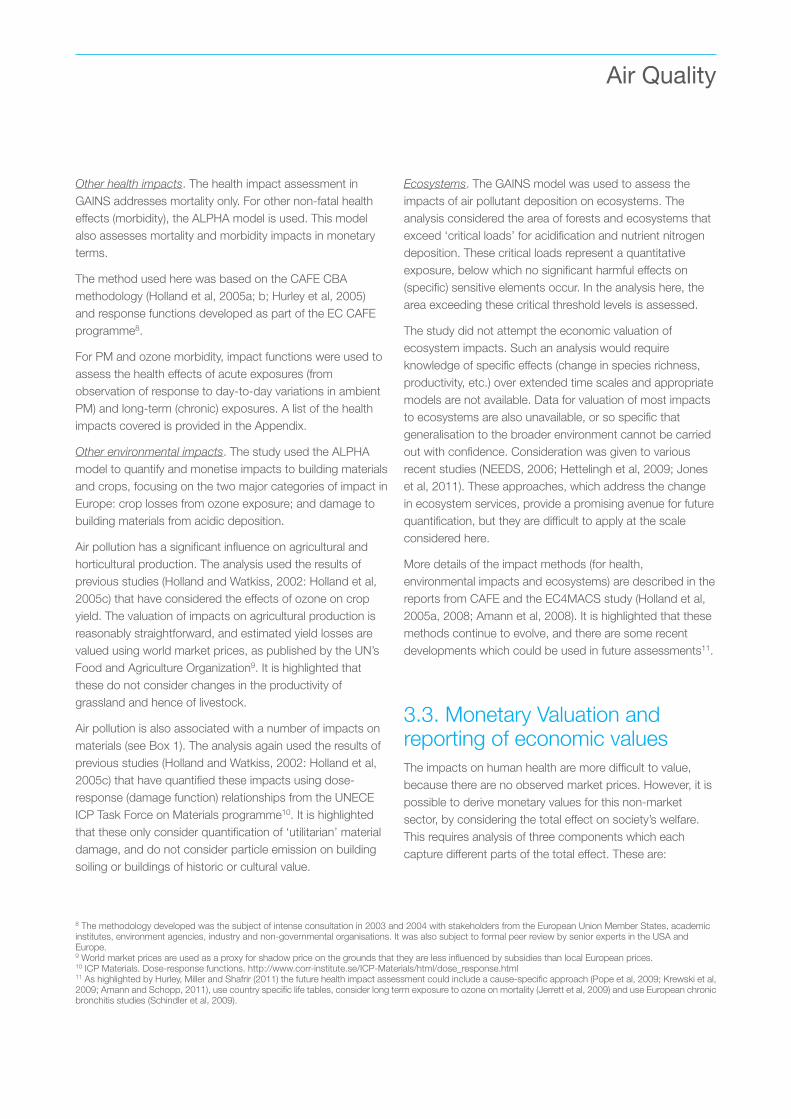
Other health impacts. The health impact assessment inGAINS addresses mortality only. For other non-fatal healtheffects (morbidity), the ALPHA model is used. This modelalso assesses mortality and morbidity impacts in monetaryterms.
The method used here was based on the CAFE CBAmethodology (Holland et al, 2005a; b; Hurley et al, 2005)and response functions developed as part of the EC CAFEprogramme8.
For PM and ozone morbidity, impact functions were used toassess the health effects of acute exposures (fromobservation of response to day-to-day variations in ambientPM) and long-term (chronic) exposures. A list of the healthimpacts covered is provided in the Appendix.
Other environmental impacts. The study used the ALPHAmodel to quantify and monetise impacts to building materialsand crops, focusing on the two major categories of impact inEurope: crop losses from ozone exposure; and damage tobuilding materials from acidic deposition.
Air pollution has a significant influence on agricultural andhorticultural production. The analysis used the results ofprevious studies (Holland and Watkiss, 2002: Holland et al,2005c) that have considered the effects of ozone on cropyield. The valuation of impacts on agricultural production isreasonably straightforward, and estimated yield losses arevalued using world market prices, as published by the UN’sFood and Agriculture Organization9. It is highlighted thatthese do not consider changes in the productivity ofgrassland and hence of livestock.
Air pollution is also associated with a number of impacts onmaterials (see Box 1). The analysis again used the results ofprevious studies (Holland and Watkiss, 2002: Holland et al,2005c) that have quantified these impacts using dose-response (damage function) relationships from the UNECEICP Task Force on Materials programme10. It is highlightedthat these only consider quantification of ‘utilitarian’ materialdamage, and do not consider particle emission on buildingsoiling or buildings of historic or cultural value.
Ecosystems. The GAINS model was used to assess theimpacts of air pollutant deposition on ecosystems. Theanalysis considered the area of forests and ecosystems thatexceed ‘critical loads’ for acidification and nutrient nitrogendeposition. These critical loads represent a quantitativeexposure, below which no significant harmful effects on(specific) sensitive elements occur. In the analysis here, thearea exceeding these critical threshold levels is assessed.
The study did not attempt the economic valuation ofecosystem impacts. Such an analysis would requireknowledge of specific effects (change in species richness,productivity, etc.) over extended time scales and appropriatemodels are not available. Data for valuation of most impactsto ecosystems are also unavailable, or so specific thatgeneralisation to the broader environment cannot be carriedout with confidence. Consideration was given to variousrecent studies (NEEDS, 2006; Hettelingh et al, 2009; Joneset al, 2011). These approaches, which address the changein ecosystem services, provide a promising avenue for futurequantification, but they are difficult to apply at the scaleconsidered here.
More details of the impact methods (for health,environmental impacts and ecosystems) are described in thereports from CAFE and the EC4MACS study (Holland et al,2005a, 2008; Amann et al, 2008). It is highlighted that thesemethods continue to evolve, and there are some recentdevelopments which could be used in future assessments11.
3.3. Monetary Valuation andreporting of economic valuesThe impacts on human health are more difficult to value,because there are no observed market prices. However, it ispossible to derive monetary values for this non-marketsector, by considering the total effect on society’s welfare.This requires analysis of three components which eachcapture different parts of the total effect. These are:
Air Quality
8 The methodology developed was the subject of intense consultation in 2003 and 2004 with stakeholders from the European Union Member States, academicinstitutes, environment agencies, industry and non-governmental organisations. It was also subject to formal peer review by senior experts in the USA andEurope.9 World market prices are used as a proxy for shadow price on the grounds that they are less influenced by subsidies than local European prices.10 ICP Materials. Dose-response functions. http://www.corr-institute.se/ICP-Materials/html/dose_response.html11 As highlighted by Hurley, Miller and Shafrir (2011) the future health impact assessment could include a cause-specific approach (Pope et al, 2009; Krewski et al,2009; Amann and Schopp, 2011), use country specific life tables, consider long term exposure to ozone on mortality (Jerrett et al, 2009) and use European chronicbronchitis studies (Schindler et al, 2009).

• The resource costs i.e. medical treatment costs;
• The opportunity costs, in terms of lost productivity; and
• Dis-utility i.e. pain or suffering, concern andinconvenience to family and others.
The first two components can be captured relatively easily.Techniques are also available to capture the thirdcomponent, by assessing the ‘willingness to pay’ or the‘willingness to accept compensation’ for a particular healthoutcome. These are derived using survey-based “stated”preference methods and/or “revealed” preferences methodsthat are based on observed expenditures such as onconsumer safety.
ClimateCost has made use of existing unit estimates forhealth based impacts, and adopts established benefit valuetransfer procedures to apply these values.
However, there is substantial debate concerning the correctapproach to valuation of mortality risks in the context of airpollution. These can be valued using a long-establishedmetric, the value of statistical life (VSL – also known as thevalue of a prevented fatality, VPF), but changes in lifeexpectancy can also be valued using the value of a life year(VOLY), which provides a way of accounting for differinglengths of remaining life expectancy. Both approaches areused in the literature and both have strengths andweaknesses. ClimateCost has therefore used both forvaluation. This is also the approach used in the EuropeanCommission’s Clean Air For Europe (CAFE) Programme,following peer review guidance.
The main results reported below use a VOLY of €60,000,which is consistent with the (low) value used in EC CAFEassessment. The VSL is also applied, using values of €1.1million and €3.8 million. The lower figure is also broadlyconsistent with the EC CAFE analysis. In the sections below,numbers are first presented for the VOLY, using the midvalue of €60,000. Results are then provided in a latersection based on the VSL.
For morbidity (non-fatal) impacts, a literature review hasassessed the most appropriate values. Note that for acutemortality from ozone, the analysis quantifies the number of‘premature deaths’ (deaths brought forward) and thesecases are valued using a VOLY approach, assuming that onaverage, each premature death leads to the loss of 12months of life.
The same monetary values for mortality risk and morbidity
are used across all European countries.
Consistent with all sector-based analysis in ClimateCost, theeconomic valuation results below are presented in terms ofconstant 2005 prices in Euros over future years, without anyadjustments or discounting. The results are presented in thisway to facilitate direct comparison, over time, and betweensectors. However, subsequent policy analysis that looks atthe costs and benefits of mitigation policy would need towork with present values (i.e. values that are adjusted anddiscounted as with standard economic appraisal). Thisanalysis is included in other parts of the ClimateCost study
3.4 What is included andexcluded in the analysis?When considering the results in this technical briefing note, itis important to be explicit about what is included orexcluded, and on the areas of uncertainty covered.
The results below only present the effects of mitigation policyon air quality – they do not include analysis of how climatechange might affect air quality concentrations more generally.Climate change has the potential to increase future ambientbackground ozone concentrations in summer months, andalso influence the frequency and intensity of highconcentration (ozone episodes). However, the evidence forthese effects is by no means well understood, and the currentevidence indicates there could be potential positive as well asnegative effects of climate change on ozone formation.Similarly, climate change could affect the formation, transportor (wet) deposition rates of particulate species, though bothpositive and negative effects are possible.
The impacts for building materials are monetised using repairand replacement costs. While a similar approach could, intheory, be applied to historic and cultural buildings, there is alack of data on the stock at risk (number of such buildingsand an inventory of the materials in them), and also therelevant valuation of building damage, thus the numbersreported here only include utilitarian buildings.
Finally, despite the large, well-documented literature availableon these effects, it is not currently possible to conduct aneconomic analysis of the effects on ecosystems. Theomission of these effects therefore significantlyunderestimates the total reported benefits, and it isrecommended that the physical benefits to ecosystems are
Policy Brief
06
12/13

considered directly alongside the economic valuespresented in the findings.
4. Results – impacts andeconomic costs of airpollution
4.1 European EmissionsThe emission trends for the EU under the Baseline and
Mitigation Scenarios are summarised Table 2 (and plotted inFigure 3) based on data generated by GAINS. The analysisincludes current policies and so there are large emissionreductions in the baseline scenario up to 2030, whichthereafter remains broadly constant. Note that the baselineincludes all emission limit values and fuel quality standards,as used in the analysis for the revision of the NationalEmission Ceilings (NEC) Directive (Amann et al., 2008).
The results in Table 2/Figure 3 show:
• The pollutants that show the greatest reductions underthe mitigation scenario are SO2 and NOx. This is notsurprising as these pollutants are closely linked with CO2emissions, as they are products of fossil fuel combustion.
Air Quality
Table 2. Emissions (million tonnes/year) 2005 to 2050 in Europe (EU27), under the baseline and mitigation scenarios, and the benefits ofmitigation (Mtonnes and % reduction in year of emission).
Million tonnes per year in EU27, Baseline scenario
2005 2020 2030 2050
SO2 8053 2411 2083 2239
NOx 11221 5219 3991 4034
PM2.5 1595 931 831 877
Million tonnes per year in EU27, Mitigation (2°C) scenario
2005 2020 2030 2050
SO2 8053 2086 1440 906
NOx 11221 4854 3200 2190
PM2.5 1595 932 813 710
Net benefits of Mitigation – million tonnes and % reduction from the baseline
2005 2020 2030 2050
SO2 0 325 (14%) 643 (31%) 1333 (60%)
NOx 0 365 (7%) 791 (20%) 1844 (46%)
PM2.5 0 -1 (0%) 18 (2%) 167 (19%)
Source GAINS, Rafaj et al (2011).

• There is little difference between the Baseline andMitigation Scenario emissions through to 2020. This isdue to the existing legislation that targets air quality,such as the Euro standards for motor vehicles, theLarge Combustion Plant Directive, and measures toimprove fuel quality such as the Directive on the sulphurcontent of certain liquid fuels.
• A significant difference for emissions of PM2.5 is onlyapparent for 2050.
• There is very little change in the Baseline Scenario after2030, as legislation currently in place will have taken itsfull effect by then.
For the other major air pollutants, VOC and NH3 (not shownin the Table and Figure above) the emission reductions aremuch lower because these pollutants are less affected bydecarbonisation of the energy system. For VOCs, emissionbenefits are estimated to be 2% in 2030 rising to 9% in2050. For ammonia, emissions are similar in the baselineand mitigation scenario.
The mitigation scenario ismost effective in reducingoxides of sulphur andnitrogen, with reductions of60% and 46% respectively in2050 in Europe, whilereductions in particulatematter are lower at 19%.
4.3 HealthThe reduction in air quality concentrations in Europe haslarge potential health benefits. The analysis has quantifiedand monetised these benefits, comparing the projectedimpacts from air pollution under the baseline and mitigationscenario.
The first step in this analysis is to estimate the change in air
Policy Brief
06
14/15
Key to the figures:The graphs show the emissions of three main air pollutants SO2 (top)NOx (middle) and PM2.5 (bottom) in 2005, 2020, 2030 and 2050, for abaseline scenario (BAS) and the mitigation scenario (MIT), with eachbar also showing the breakdown of emissions by sector.
Figure 3. European (EU27) emissions of SO2, NOx, and PM2.5,
annual Million tonnes, from 2005 to 2050 under the Baseline and
Mitigation Scenarios. (Source GAINS, Rafaj et al (2011)).
BAS MIT BAS MIT BAS MIT
0.0
2.5
5.0
7.5
10.0 2005 2020 2030 2050
MtS
O2/y
r
7.5
10.0 2005
/yr
2020 2030 2050
0.0
2.5
5.0 SOM
t2/
SAB TMI SAB TMI SAB TMI
BAS MIT BAS MIT BAS MIT
0.0
2.5
5.0
7.5
10.0
2005 2020 2030 2050
MtN
Ox/y
r 7.5
10.0
2005
/yr
2020 2030 2050
0.0
2.5
5.0
ON
Mt
x/
SAB TMI SAB TMI SAB TMI
BAS MIT BAS MIT BAS MIT
0
1
22005 2020 2030 2050
MtP
M2.
5/yr
22005
5/yr
2020 2030 2050
0
1
PMM
t2.
5
SAB TMI SAB TMI SAB TMI
Other
Transport
Industry
Domestic
Energy
ehtO
nraT
sudnI
moD
reEn
re
rtosp
ryst
ciste
yrg
Other
Transport
Industry
Domestic
Energy
ehtO
nraT
sudnI
moD
reEn
re
rtosp
ryst
ciste
yrg
Other
Transport
Industry
Domestic
Energy
ehtO
nraT
sudnI
moD
reEn
re
rtosp
ryst
cistme
yrg

quality concentrations, and link this with population toestimate the population-weighted-exposures.
Figure 4 below shows the ambient concentrations ofPM2.5 up to 2050 in the EU, showing the baseline (BAS)and mitigation scenario (MIT) over time. This iscompared against the WHO target guideline levels onPM, shown in red (WHO, 2005). At the current time thereis still widespread non-compliance, but by 2050 mostcountries will be below the target levels. Nonetheless,under the mitigation scenario, all EU countries fall withinthe WHO target level. Mitigation target therefore has thebenefit of ensuring European wide compliance.Furthermore, there are still residual health impacts thatare thought to occur below the target level. Under themitigation scenario, average ambient concentrations ofPM2.5 in the EU are by 36% lower than the Baselineprojections by 2050.
Figure 4 Ambient concentrations of PM2.5 (population weighted,annual mean) for the Baseline and the Mitigation scenarios inthe EU27. Ranges indicate variations over EU countries.
Key:The figure shows the mean EU27 population weighted PMconcentrations under the ______ baseline and – - – mitigationscenarios. These can be compared to the WHO target guidelinelevels for PM, shown as -x-. The grey and green shaded areasshow the upper range for individual countries. Note that underthe mitigation scenario, all EU countries in 2050 are within theWHO target level, while under the baseline, some still remainabove. Source GAINS, Rafaj et al (2011).
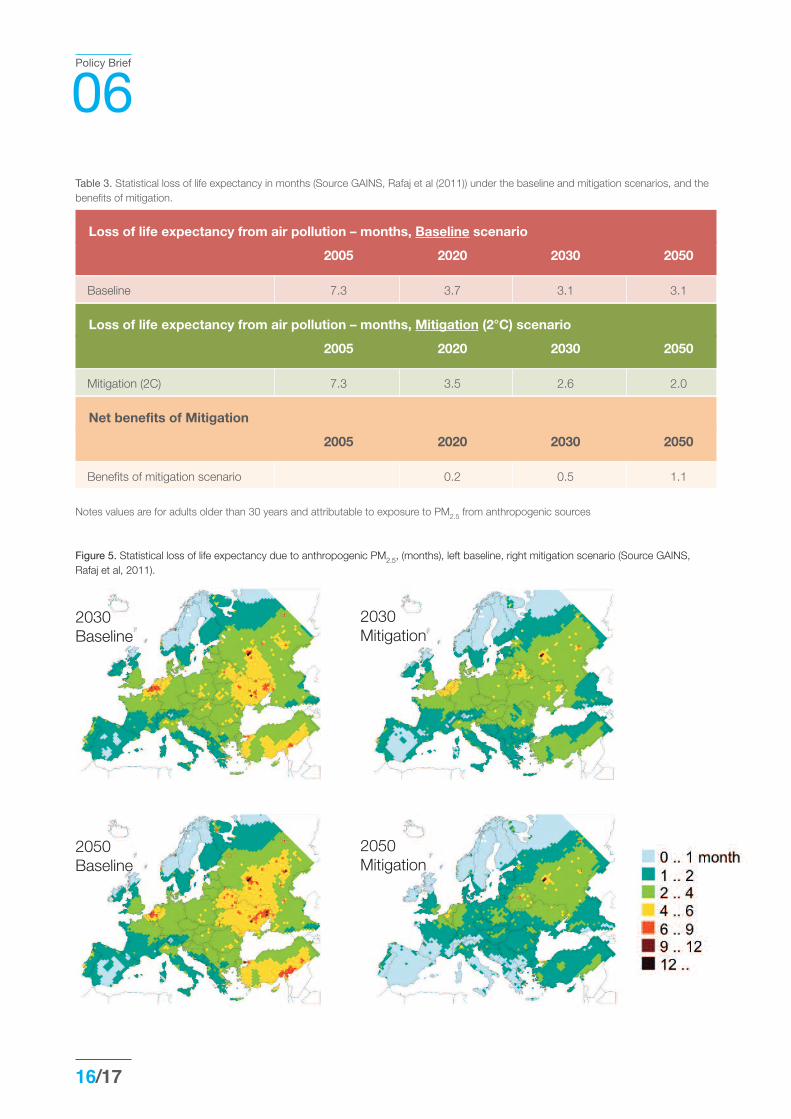
Table 3 presents the statistical loss of life expectancyestimated in the GAINS model from air pollution. Thisshows that across Europe, the population currently losesan average of 7 months of life expectancy (on average)from air pollution. By 2020, this fall to around 4 monthsof life lost on average, for both the baseline andmitigation scenario. However, under the mitigation scenario, the loss of lifeexpectancy continues to fall from 2030 to 2050, down to2 months on average, and thus mitigation achieves abenefit of a month of life expectancy compared to thebaseline in 2050 (a 35% reduction in the loss of lifeexpectancy compared to the Baseline).
A full breakdown by Member State is provided in theAppendix. It is stressed that is an average across thewhole population, and the population as a whole will varyin their sensitivity to air pollution.
Air pollution currently has asignificant impact inreducing life expectancy inEurope, by 7 months onaverage. While current airpollution legislation isexpected to halve this by2050, mitigation policywould increase lifeexpectancy by 1 month onaverage.
Figure 5 shows the variation in these impacts acrossEurope, for 2030 and 2050 under the baseline andmitigation scenario. The largest losses of average lifeexpectancy are in Belgium and the Netherlands. Thesmallest are in the fringes of Europe, for example inFinland, Ireland and Sweden. These differences are dueto trans-boundary pollution.
Air Quality
0
5
10
15
20
2005 2020 2030 2050
!g P
M2.
5/m
3
EU-27 BAS All regs
MIT All regs
BAS Mean
MIT Mean
WHO Target
7-2EU
7
s grelAlBAS
10
15
20
3m/5.
PM2
gs grelAlTMI
naMeBAS
naMeTMI
tergaTTaOHW
0
5
2005
PM2
g!
2020 2030
2030 2050
Policy Brief
06
16/17
2030Baseline
2030Mitigation
2050Baseline
2050Mitigation
Figure 5. Statistical loss of life expectancy due to anthropogenic PM2.5, (months), left baseline, right mitigation scenario (Source GAINS, Rafaj et al, 2011).
Table 3. Statistical loss of life expectancy in months (Source GAINS, Rafaj et al (2011)) under the baseline and mitigation scenarios, and thebenefits of mitigation.
Loss of life expectancy from air pollution – months, Baseline scenario
2005 2020 2030 2050
Baseline 7.3 3.7 3.1 3.1
Loss of life expectancy from air pollution – months, Mitigation (2°C) scenario
2005 2020 2030 2050
Mitigation (2C) 7.3 3.5 2.6 2.0
Net benefits of Mitigation
2005 2020 2030 2050
Benefits of mitigation scenario 0.2 0.5 1.1
Notes values are for adults older than 30 years and attributable to exposure to PM2.5 from anthropogenic sources
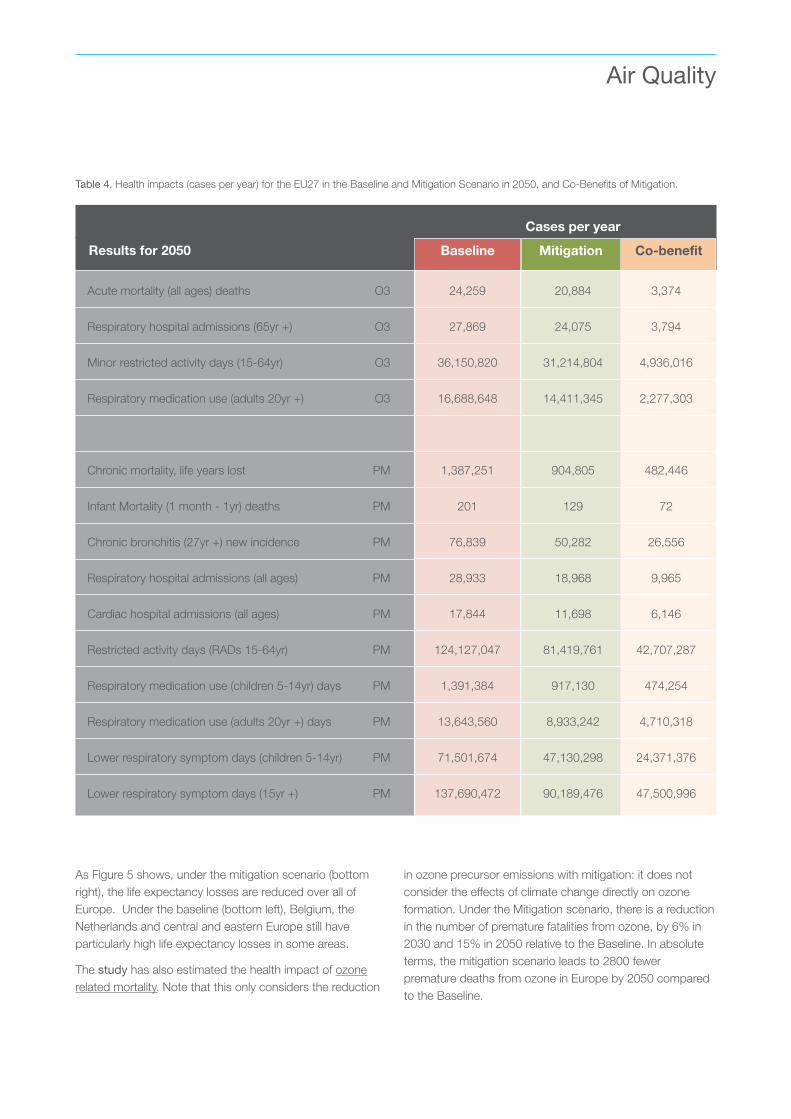
As Figure 5 shows, under the mitigation scenario (bottomright), the life expectancy losses are reduced over all ofEurope. Under the baseline (bottom left), Belgium, theNetherlands and central and eastern Europe still haveparticularly high life expectancy losses in some areas.
The study has also estimated the health impact of ozonerelated mortality. Note that this only considers the reduction
in ozone precursor emissions with mitigation: it does notconsider the effects of climate change directly on ozoneformation. Under the Mitigation scenario, there is a reductionin the number of premature fatalities from ozone, by 6% in2030 and 15% in 2050 relative to the Baseline. In absoluteterms, the mitigation scenario leads to 2800 fewerpremature deaths from ozone in Europe by 2050 comparedto the Baseline.
Air Quality
Table 4. Health impacts (cases per year) for the EU27 in the Baseline and Mitigation Scenario in 2050, and Co-Benefits of Mitigation.
Cases per year
Results for 2050 Baseline Mitigation Co-benefit
Acute mortality (all ages) deaths O3 24,259 20,884 3,374
Respiratory hospital admissions (65yr +) O3 27,869 24,075 3,794
Minor restricted activity days (15-64yr) O3 36,150,820 31,214,804 4,936,016
Respiratory medication use (adults 20yr +) O3 16,688,648 14,411,345 2,277,303
Chronic mortality, life years lost PM 1,387,251 904,805 482,446
Infant Mortality (1 month - 1yr) deaths PM 201 129 72
Chronic bronchitis (27yr +) new incidence PM 76,839 50,282 26,556
Respiratory hospital admissions (all ages) PM 28,933 18,968 9,965
Cardiac hospital admissions (all ages) PM 17,844 11,698 6,146
Restricted activity days (RADs 15-64yr) PM 124,127,047 81,419,761 42,707,287
Respiratory medication use (children 5-14yr) days PM 1,391,384 917,130 474,254
Respiratory medication use (adults 20yr +) days PM 13,643,560 8,933,242 4,710,318
Lower respiratory symptom days (children 5-14yr) PM 71,501,674 47,130,298 24,371,376
Lower respiratory symptom days (15yr +) PM 137,690,472 90,189,476 47,500,996
Baseline Co-benefitMitigation
The ALPHA model provides a more extensive quantificationof health impacts, including a number of effects onmorbidity, as well as valuing all health outcomes in monetaryterms.
The results for the Baseline and Mitigation Scenarios for2050 are presented in Table 4, in terms of the physical healtheffects (outcomes or cases per year). The table also showsthe difference between the two scenarios (i.e. the ‘co-benefit’). Values for 2020, 2030 and 2050 are presented inthe Appendix
By 2050 the results for the EU27 in Table 4 reveal that:
• For fine particles, the annual co-benefits are estimated at480,000 fewer life years lost to air pollution12, 72 fewercases of infant mortality, 27,000 fewer new cases ofchronic bronchitis, 16,000 fewer hospital admissions andin total around 120 million fewer person days ofrestricted activity, respiratory medication use and lowerrespiratory symptoms.
• For ozone, the Mitigation Scenario leads to 3,400 fewerdeaths brought forward each year, 3,800 fewer hospitaladmissions and a reduction of around 7 million persondays of ‘minor restricted activity’ and respiratorymedication use.
The mitigation scenario leadsto an estimated annual benefitof 480,000 life years gained, aswell as 27,000 avoided casesof chronic bronchitis, 20,000fewer annual hospitaladmissions and around 127 million avoided minorsymptom days each year by2050 in the EU27.
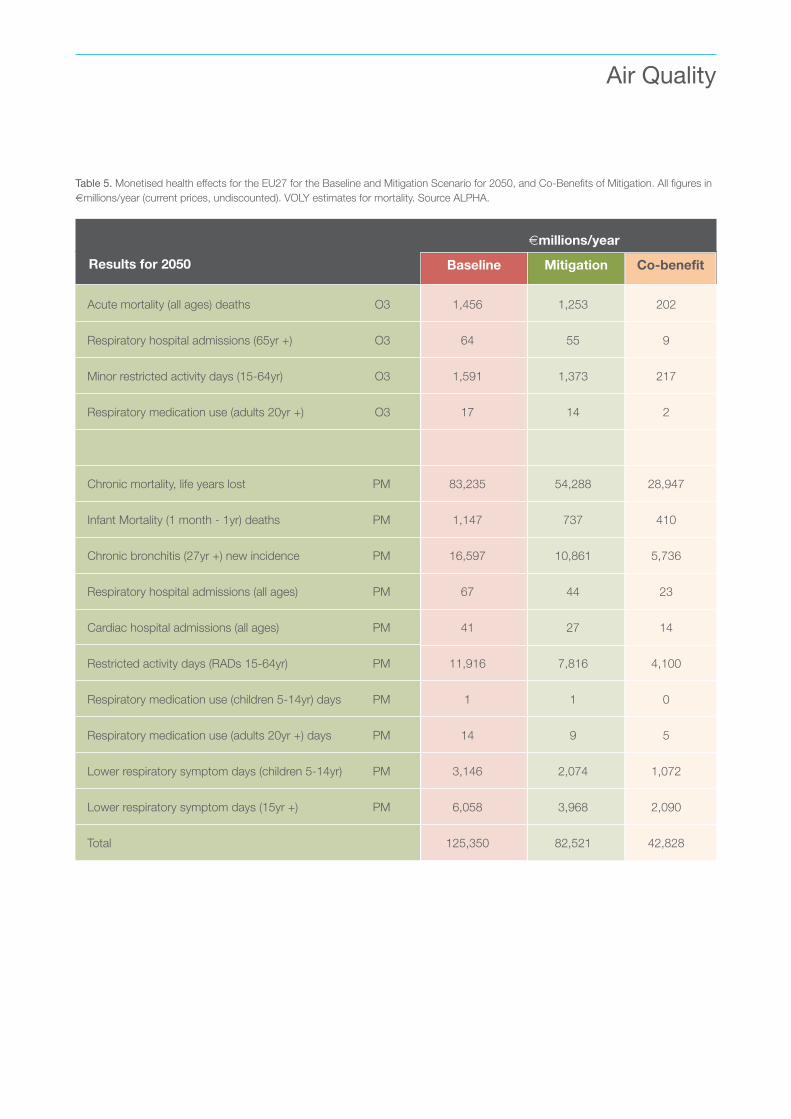
These benefits are then converted to monetary equivalents.The values for 2050 presented below in Table 5. Full resultsare presented in the Appendix. The value of a life year lostmetric has been used in these table, using a VOLY of€60,000. The impact on the estimates with the use of thevalue of statistical life is presented in a later section. Thegreatest impacts – and co-benefits – arise from the chroniceffects on mortality and chronic bronchitis and the acuteeffects on restricted activity days, which are all associatedwith exposure to fine particles.
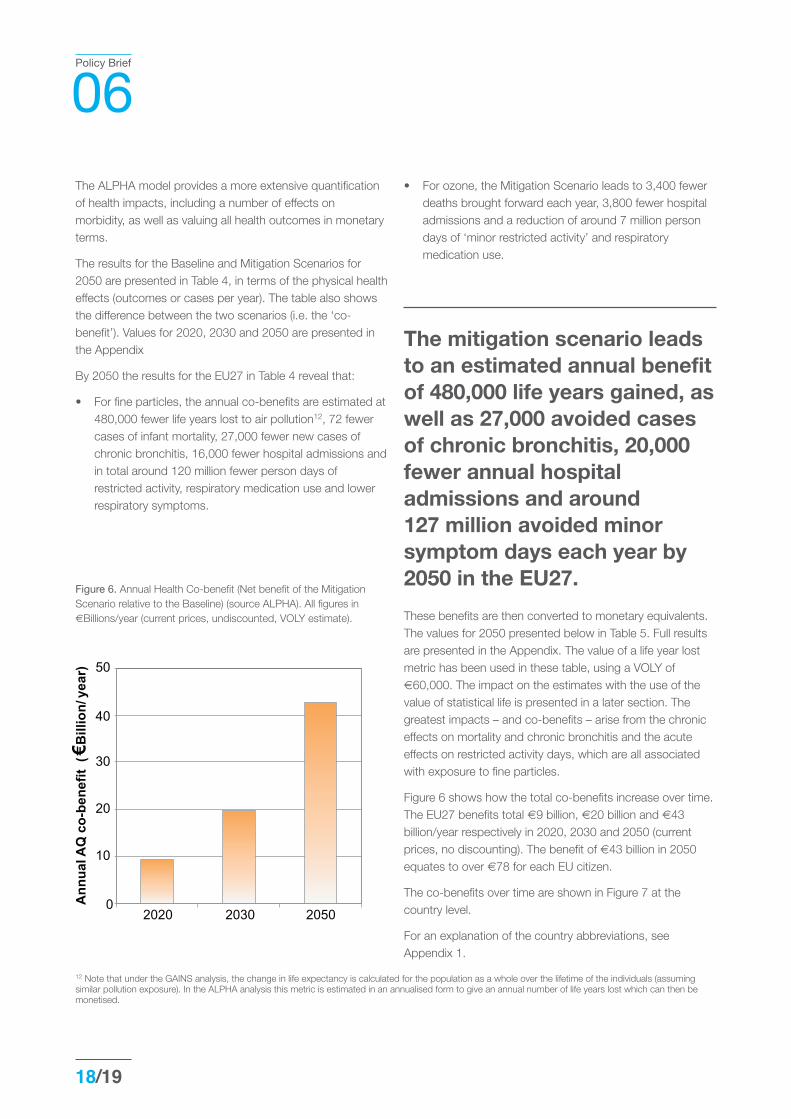
Figure 6 shows how the total co-benefits increase over time.The EU27 benefits total €9 billion, €20 billion and €43billion/year respectively in 2020, 2030 and 2050 (currentprices, no discounting). The benefit of €43 billion in 2050equates to over €78 for each EU citizen.
The co-benefits over time are shown in Figure 7 at thecountry level.
For an explanation of the country abbreviations, seeAppendix 1.
Policy Brief
06
18/19
12 Note that under the GAINS analysis, the change in life expectancy is calculated for the population as a whole over the lifetime of the individuals (assumingsimilar pollution exposure). In the ALPHA analysis this metric is estimated in an annualised form to give an annual number of life years lost which can then bemonetised.
0
10
20
30
40
50
2020 2030 2050
Ann
ual A
Q c
o-be
nefit
(B
illio
n/ye
ar)
Figure 6. Annual Health Co-benefit (Net benefit of the MitigationScenario relative to the Baseline) (source ALPHA). All figures in€Billions/year (current prices, undiscounted, VOLY estimate).
Air Quality
Table 5. Monetised health effects for the EU27 for the Baseline and Mitigation Scenario for 2050, and Co-Benefits of Mitigation. All figures in€millions/year (current prices, undiscounted). VOLY estimates for mortality. Source ALPHA.
€millions/year
Results for 2050 Baseline Mitigation Co-benefit
Acute mortality (all ages) deaths O3 1,456 1,253 202
Respiratory hospital admissions (65yr +) O3 64 55 9
Minor restricted activity days (15-64yr) O3 1,591 1,373 217
Respiratory medication use (adults 20yr +) O3 17 14 2
Chronic mortality, life years lost PM 83,235 54,288 28,947
Infant Mortality (1 month - 1yr) deaths PM 1,147 737 410
Chronic bronchitis (27yr +) new incidence PM 16,597 10,861 5,736
Respiratory hospital admissions (all ages) PM 67 44 23
Cardiac hospital admissions (all ages) PM 41 27 14
Restricted activity days (RADs 15-64yr) PM 11,916 7,816 4,100
Respiratory medication use (children 5-14yr) days PM 1 1 0
Respiratory medication use (adults 20yr +) days PM 14 9 5
Lower respiratory symptom days (children 5-14yr) PM 3,146 2,074 1,072
Lower respiratory symptom days (15yr +) PM 6,058 3,968 2,090
Total 125,350 82,521 42,828
Baseline Co-benefitMitigation

The economic healthcobenefits of the mitigationscenario in Europe (EU27) areestimated at €9 billion/year by 2020, rising to €20billion/year by 2030 and €43 billion/year by 2050 (VOLY approach).
As highlighted earlier, two approaches can be used forvaluing the change in risk of mortality – the VOLY and theVSL. In ClimateCost both have been used. To further reflectuncertainty, the following ranges have been used:
• VOLY: €37,500 to €215,000 with the best estimate of€60,000
• VSL: €1.1 million, €3.8 million and €5.6 million.
The values in the Tables and Figures above use the VOLYmid estimate (€60,000). Table 6 presents the effects on thetotal results (all health impact) with the different values formortality valuation above. It is highlighted that the use of alow VSL estimate (of just over €1 million) increases the co-benefits to €94 billion in 2050, while using values from therecent literature increases this significantly.
It is also possible to assess these co-benefits against theGHG emission reductions, to estimate the co-benefit pertonne of GHG reduced. This provides a useful way forcommunicating the size of the benefits.
The emissions of CO2 for the EU27 were shown in Figure 2.Current 2005 emissions were just under 4 billiontonnes/year, and fall to under 1 billion tonnes/year by 2050under the mitigation scenario (around an 80% reduction onthe 2005 baseline).
Using the values presented in Figure 6, the air quality co-benefits are estimated at €24 a tonne of CO2 mitigated in2020, €21/tCO2 in 2030, and €24/tCO2 by 2050. Aselsewhere, these figures are estimated using the mid-estimate of the VOLY (€60,000). The values would be higherwith the use of VSL estimates.”
When expressed against theCO2 reductions achieved, theair quality co-benefits of themitigation scenario are around€24 a tonne of CO2 across theperiod.
Policy Brief
06
20/21
Figure 7. Annual Health Co-benefit by Country (Net benefit of the Mitigation Scenario relative to the Baseline) (source ALPHA). All figures in€Millions/year (current prices, undiscounted, VOLY estimate).
0
1,000
2,000
3,000
4,000
5,000
6,000
7,000
8,000
9,000
AT BE BG CY CZ DK EE FI FR DE GR HU IE IT LV LT LU MT NL PL PT RO SK SI ES SE UK
Co-
bene
fit, !
Mill
ion/
year
(VO
LY) 2020
2030
2050
7,000
8,000
9,000
Y)
LLY)
(VO
r
2020
2030
2020
2030
3,000
4,000
5,000
6,000
raey/noillM
i!
t,fiene
2050
2050
0
1,000
2,000
AT BE
e-bo
C
BE BG CY CZ K D EE
EE FI FR E D GR HU
HU E I IT V LLV LT
LU MT NL PL PT
RO SK SI ES SE
K U

4.3 Crops and MaterialsAnalysis of the effects of changes in emissions on materialshas focused on SO2 and its impact on materials used in‘utilitarian’ buildings. The material results are shown in Table7 below, and can be seen to be a small fraction (0.4%) of thehealth co-benefits in Table 6. Note that the analysis ofmaterials damage omits damage to cultural heritage and
damage from pollutants other than SO2 (e.g. effects of otheracidifying gases).
The results of the effects of ozone on crops are presented inTable 8 below. Given the non-linearities in ozone chemistry,the approach used only gives a very approximate result ofthe change over time. However, total co-benefits of reducedcrop damage are again a small fraction of the health impactsquantified in Table 6 above.
Air Quality
Table 6. Mitigation Co-benefits in the EU27 based on different mortality valuation approaches and unit values. All figures in €millions/year(current prices, undiscounted).
Valuation metric and Net benefits of Mitigation –
unit cost €millions/year (current prices, undiscounted).
2020 2030 2050
VOLY low (€37,500) 6,893 14,556 31,606
VOLY mid (€60,000) 9,450 19,865 42,828
VOLY high (€215,000) 26,560 55,504 118,325
VSL low (€1.1 million) 15,680 36,142 94,025
VSL mid (€3.8 million) 47,425 110,305 292,009
VSL high (€5.6 million) 68,652 159,901 424,471
Table 7. Damage to building materials from SO2 emissions for the EU27 under the Baseline and Mitigation Scenario (€Million/year, currentprices, undiscounted).
€Million/year
2020 2030 2050
Total: Baseline Scenario 509 434 447
Total: Mitigation Scenario 442 303 183
Co-benefit (difference between the 67 131 264two scenarios)
4.4 Ecosystems (Critical LoadsExceedance)The protection of ecosystems has been the main stimulusfor tackling transboundary air pollution in Europe, particularlyconcerns about ‘acid rain’ in the 1970s and 1980s, whichwas responsible for acidification of freshwater ecosystemsand forest decline.
Since then, there have been significant reductions in the acidburden to ecosystems, particularly in emissions of SO2.There have also been large reductions in emissions of NOx,but the fall in NH3 emissions has been more modest.
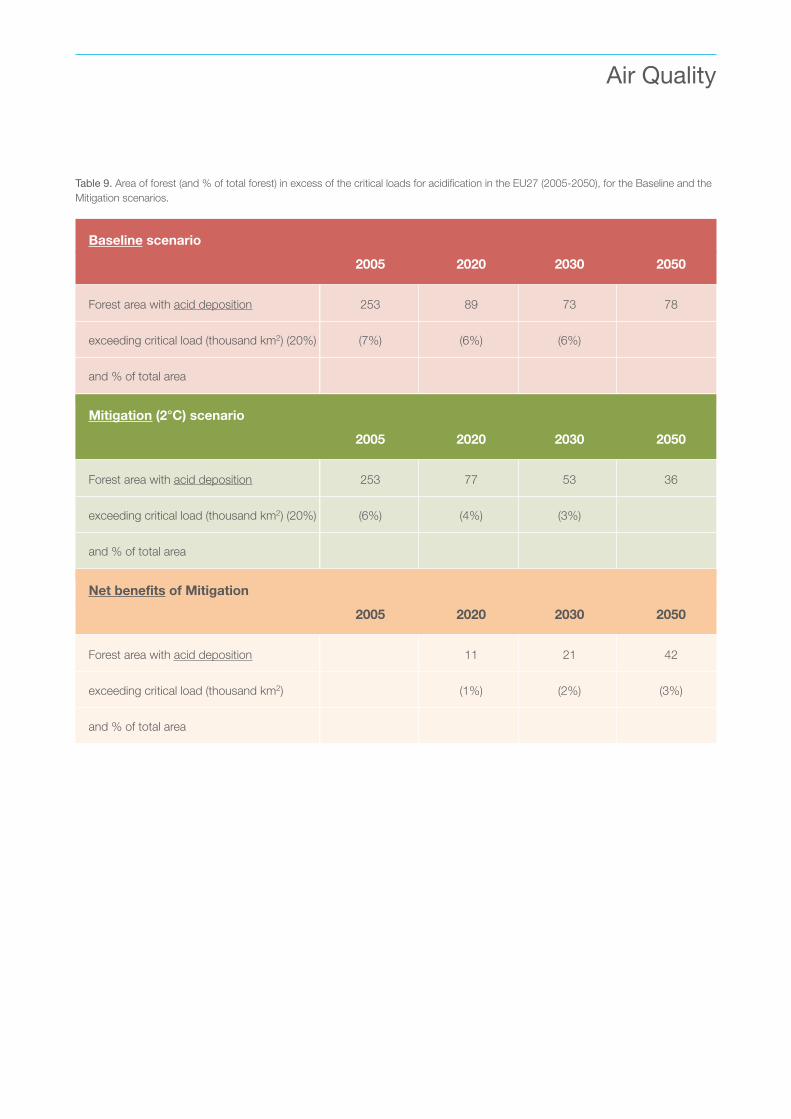
One result of such action is that the area of ecosystemssubject to exceedance of the critical load for acidificationhas declined substantially since the 1970s. Table 9 showsthe area of forest in excess of the critical loads foracidification. In 2005, 20% of the forest area of the EU27was subject to critical load exceedance for acidification. By
2020 this is projected to fall to 7% under the BaselineScenario, because of existing legislation. However, under theMitigation Scenario the area subject to exceedance morethan halves between 2020 and 2050, to less than 3%, andthe mitigation scenario reduces the forest area exposed toacidification deposition by 42 thousand km2.
Figure 8 shows the distribution of the Baseline and Mitigationscenario exceedences over Europe. These are concentratedin a band running across Northern Europe from the west ofFrance to Ukraine.
Policy Brief
06
22/23
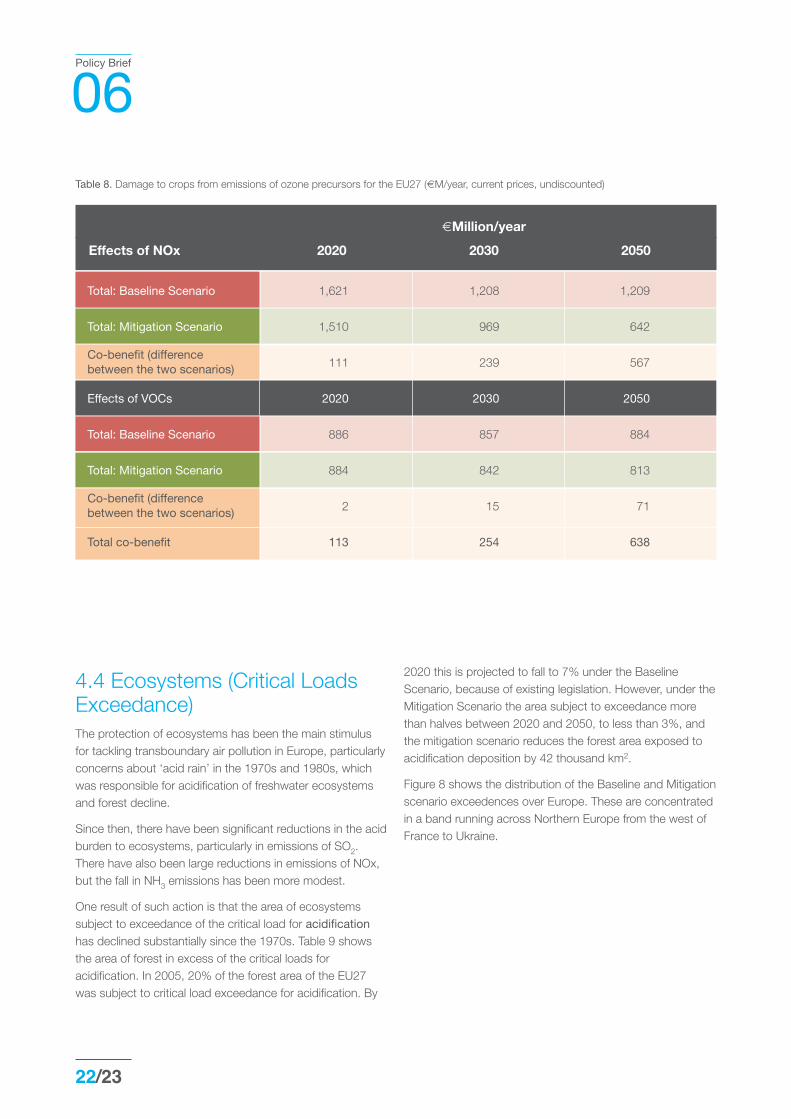
Table 8. Damage to crops from emissions of ozone precursors for the EU27 (€M/year, current prices, undiscounted)
€Million/year
Effects of NOx 2020 2030 2050
Total: Baseline Scenario 1,621 1,208 1,209
Total: Mitigation Scenario 1,510 969 642
Co-benefit (differencebetween the two scenarios) 111 239 567
Effects of VOCs 2020 2030 2050
Total: Baseline Scenario 886 857 884
Total: Mitigation Scenario 884 842 813
Co-benefit (differencebetween the two scenarios) 2 15 71
Total co-benefit 113 254 638
Air Quality
Table 9. Area of forest (and % of total forest) in excess of the critical loads for acidification in the EU27 (2005-2050), for the Baseline and theMitigation scenarios.
Baseline scenario
2005 2020 2030 2050
Forest area with acid deposition 253 89 73 78
exceeding critical load (thousand km2) (20%) (7%) (6%) (6%)
and % of total area
Mitigation (2°C) scenario
2005 2020 2030 2050
Forest area with acid deposition 253 77 53 36
exceeding critical load (thousand km2) (20%) (6%) (4%) (3%)
and % of total area
Net benefits of Mitigation
2005 2020 2030 2050
Forest area with acid deposition 11 21 42
exceeding critical load (thousand km2) (1%) (2%) (3%)
and % of total area

Table 10 reports the extent of exceedance of the critical loadfor eutrophication. In the Baseline this falls from 72% in2005 to 56% by 2050. Under the Mitigation Scenario, theextent of exceedance falls to 48% by 2050 – animprovement, but there is still a high level of residualexceedance.
Policy Brief
06
24/25
Figure 8. Percentage of forest area (%) affected by exceedance of the critical load for acidification
2030Baseline
2030Mitigation
2050Baseline
2050Mitigation
Source GAINS, Rafaj et al (2011).
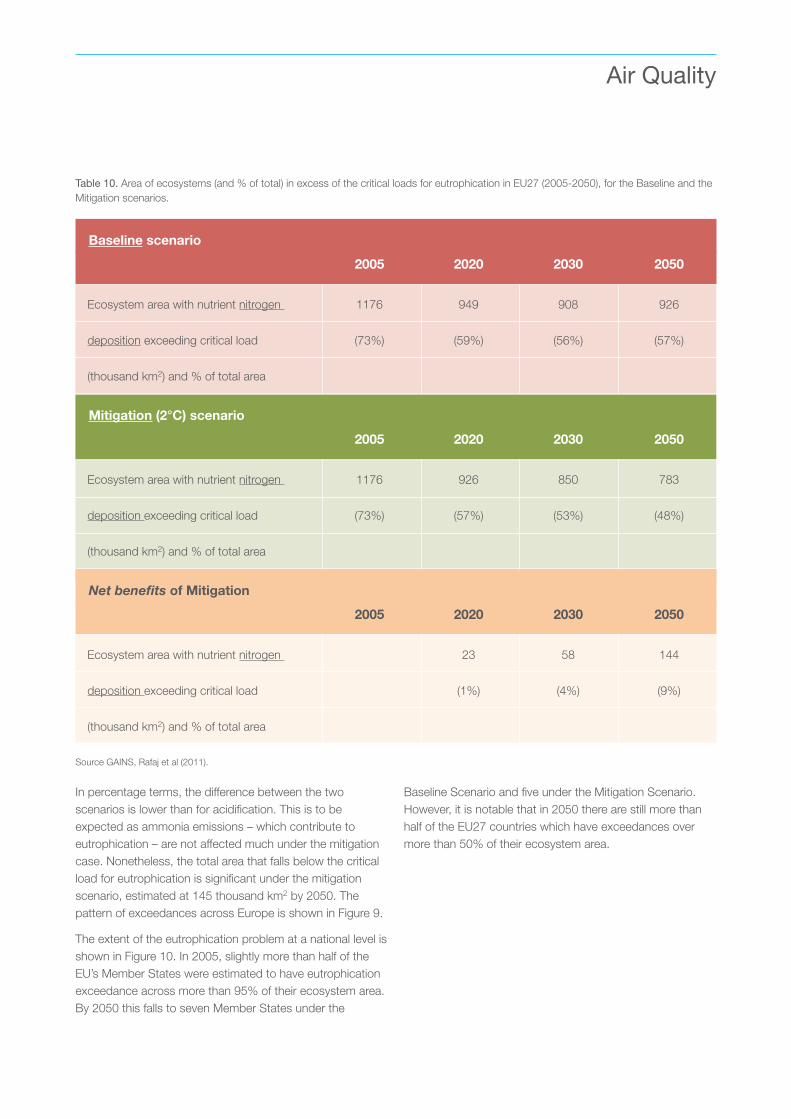
In percentage terms, the difference between the twoscenarios is lower than for acidification. This is to beexpected as ammonia emissions – which contribute toeutrophication – are not affected much under the mitigationcase. Nonetheless, the total area that falls below the criticalload for eutrophication is significant under the mitigationscenario, estimated at 145 thousand km2 by 2050. Thepattern of exceedances across Europe is shown in Figure 9.
The extent of the eutrophication problem at a national level isshown in Figure 10. In 2005, slightly more than half of theEU’s Member States were estimated to have eutrophicationexceedance across more than 95% of their ecosystem area.By 2050 this falls to seven Member States under the
Baseline Scenario and five under the Mitigation Scenario.However, it is notable that in 2050 there are still more thanhalf of the EU27 countries which have exceedances overmore than 50% of their ecosystem area.
Air Quality
Table 10. Area of ecosystems (and % of total) in excess of the critical loads for eutrophication in EU27 (2005-2050), for the Baseline and theMitigation scenarios.
Baseline scenario
2005 2020 2030 2050
Ecosystem area with nutrient nitrogen 1176 949 908 926
deposition exceeding critical load (73%) (59%) (56%) (57%)
(thousand km2) and % of total area
Mitigation (2°C) scenario
2005 2020 2030 2050
Ecosystem area with nutrient nitrogen 1176 926 850 783
deposition exceeding critical load (73%) (57%) (53%) (48%)
(thousand km2) and % of total area
(48%)Net benefits of Mitigation
2005 2020 2030 2050
Ecosystem area with nutrient nitrogen 23 58 144
deposition exceeding critical load (1%) (4%) (9%)
(thousand km2) and % of total area
Source GAINS, Rafaj et al (2011).

The mitigation scenarioreduces the forest areaexposed to acidificationdeposition exceeding criticalloads by 42 thousand km2 in2050 and the sensitiveecosystem area exposed toeutrophication by 144thousand km2.
4.5 Avoided Abatement CostsMitigation policies also have an additional ancillary benefitsthrough avoiding the need to implement air pollutionmeasures required by legislation. The mitigation scenario willreduce the costs of air pollution abatement because of thelower levels of fossil fuels, which in turn requires fewerinstallations of air-pollution control equipment.
In Europe, the legislation in the Euro standards and theIndustrial Emissions Directive (IED) lead to additional costson polluters (consistent with the polluter pays principle) andrequires equipment to reduce pollution. For example, underthe IED, coal fired power stations need to be fitted withtechnologies such as bag filters or electrostatic precipitatorsto reduce emissions of particles, flue gas desulphurisation toreduce SO2 releases and NOx controls such as selective
Policy Brief
06
26/27
Figure 9. Percentage of ecosystem area affected by exceedance of the critical load for nutrient nitrogen (Source GAINS, Rafaj et al, 2011).
2030Baseline
2030Mitigation
2050Baseline
2050Mitigation
Source GAINS, Rafaj et al (2011).

catalytic/non-catalytic reduction (SCR/SNCR). Thesetechnologies incur capital expenditure and operating costsfor manpower, reagents, waste material disposal, etc.
The GAINS model has calculated the difference inabatement costs (for each pollutant) between the Baselineand Mitigation Scenarios. These are estimated as the annualsavings (in 2005 prices) in future years13.
The costs of implementing current legislation within the EU –through to 2050 – are estimated at about 76 billion €2005 peryear (undiscounted) in the baseline scenario. The GAINScalculation suggests that this cost can be halved by 2050under a mitigation scenario, with the savings (co-benefits)estimated at €36 billion/year by 2050 for the EU27. Theresults are shown in Table 11.
The breakdown by sector is shown in Figure 11. The largestpart of these savings is related to the transport sector. Inrespect of emissions, the largest reduction in abatement
costs is for NOx control, at about three quarters of the total,with most of the remainder associated with savings for SO2controls. Savings for control of PM14, VOCs and NH3 aremuch more modest, reflecting the nature of the mechanismsfor reducing GHGs in the Mitigation Scenario.
The benefits by country are shown in Figure 12 below. Thecountry codes are listed in Appendix 1.
At the global level, the annual savings are much greater, andare estimated by the GAINS model to be more than 250billion Euros/year by 2050 (€2005, undiscounted). Asignificant proportion of these – around one fifth – are in theUSA. Most of these benefits (in relative terms) arise in thepower sector, where control costs are reduced verysignificantly, followed by the transport sector, which has thehighest absolute reductions.
While care needs to be taken in applying these cost savingsin any policy impact assessment to avoid double counting,
Air Quality
13 These are estimated as annualised costs (investment and fixed operating costs) in current prices for future years, using a 4% discount rate which is consistentwith the GAINS analysis. These are not discounted back to the current year i.e. to 2010.
2005 2005
Figure 10. Proportion of countries with varying levels of exceedance of the critical load for eutrophication by ecosystem area.
Baseline 2050 Baseline 2050 Baseline 2050 Mitigation 2050 tiagtiMi 0502no
Data source: GAINS, Rafaj et al (2011).
>95%:AustriaBelgiumCzech RepublicDenmarkFranceGreeceHungaryLatviaLithuaniaLuxembourgPolandPortugalSlovakiaSlovenia
>95%:Czech RepublicDenmarkGreeceLithuaniaLuxembourgPolandSlovakia
>95%:Czech RepublicDenmarkLithuaniaLuxembourgSlovakia
<50%
50% to 75%
75% to 95%
>95%

Policy Brief
06
28/29
14 Note that many of the technologies that abate NOx also abate PM10, but in the analysis, the costs are counted against NOx reductions
Figure 11. Abatement costs total (billion) for sectors, 2005 to 2050, from climate policies (2005 prices, undiscounted).
BAS MIT BAS MIT BAS MIT
0
25
50
75
100 2005 2020 2030 2050
Bill
ion
Euro
2005
/yr Other
Transport
Industry
Domestic
Energy
2005 2020
2030 2050
25
50
75
100
orEu
noilliB
2005
/yr
2005 2020
2030 2050
r ehtO
rtospnraT
ry studnI
c istmeoD
y rgeEn
0
S AB TMI
S AB TMI S AB TMI
Table 11. Potential abatement costs, 2005 to 2050, under the baseline and mitigation scenarios. Source GAINS, Rafaj et al (2011). Allfigures in €billions/year (2005 prices, undiscounted).
Cost of abatement – billions of Euros per year in EU27, Baseline scenario
2005 2020 2030 2050
Costs of abatement EU27 – baseline 46.8 85.1 92.2 82.0
Costs of abatement – billions of Euros per year in EU27, Mitigation (2°C) scenario
2005 2020 2030 2050
Costs of abatement EU27 – mitigation 46.8 80.2 75.8 46.3
Net benefits of Mitigation
2005 2020 2030 2050
Benefits of mitigation scenario 0 4.9 16.4 35.7
Source GAINS, Rafaj et al, 2011).

they demonstrate that climate policy can reduce theregulatory burden on business in some ways.
Mitigation also reduces the airpollution abatement requiredby legislation, leading to costsavings for business. In theEU27, these savings areestimated at €36 billion/yearby 2050.
4.6 Other EffectsThe main measures for reducing emissions under theMitigation Scenario are improvements to energy efficiency,fuel switching and the use of carbon capture andsequestration (CCS). These have a broad range of effectsbeyond the effects on greenhouse gas emissions and the airpollutants considered in this TPBN (and the economicconsequences assessed by Russ et al in their 2009 paperon the scenarios). Most of these are beneficial for society,though there is some potential for negative impacts. Thefollowing illustrates the additional benefits. These have notbeen assessed in the ClimateCost project, but should beconsidered in the wider discussion of mitigation co-benefits.
Energy security: Climate policies that reduce the use offossil fuels through fuel switching or energy efficiency provideimportant energy security benefits. These policies reduce thedemand for imports of fossil fuels and provide important
Air Quality
Figure 12. Abatement savings in 2030 to 2050, from climate policies. Source GAINS, Rafaj et al (2011). All figures in €millions/year (2005prices, undiscounted).
0
1000
2000
3000
4000
5000
6000
7000
AT BE BG CY CZ DK EE FI FR DE GR HU IE IT LV LT LU MT NL PL PT RO SK SI ES SE UK
Cos
t sav
ings
-Miti
gatio
n (M
ill E
uro/
year
)
2020
2030
2050
7000
2020
2020
5000
6000
)
2020
2030
2050
2020
2030
2050
4000
5000 ) raey/orEu
ll(M
inotiag
3000
gti-M
isgnivast so
C
1000
2000
0 AT
BE BG CY CZ
CZ K D EE FI
FR E D GR
HU E I IT V LLV
V LT LU MT
NL PL PT RO
RO SK SI ES
SE K U
For an explanation of the abbreviations, see Appendix 1.

macro-economic benefits associated with reduced energyimports. This is important as 55% of Europe’s primaryenergy is imported (CEC, 2011) and this figure will increaseslightly in future years under the baseline scenario. Second,by reducing reliance on fossil fuels, these policies potentiallyprovide greater price stability (lower volatility). This isparticularly important given oil price fluctuations and pricespikes in recent years, and because fossil reserves areprimarily in regions with higher geopolitical risks.
Risk of major accidents and legacy issues: A switch fromfossil fuels will reduce the risk of some types of majoraccident. These include coal mining accidents, of whichthere have been a number of events in recent years,particularly in China, but also in the USA, New Zealand andthe UK (amongst others). They also include accidentsassociated with oil and gas extraction and transport. Theseare very varied in type, including oil spills from tankers,accidents from rigs such as Piper Alpha in the North Sea
and Deepwater Horizon in the Gulf of Mexico. However,some low carbon technologies are also not without risk ofaccident, most notably the use of nuclear power duringoperation, as at Fukushima, and from the storage of wasteover extended periods. Advocates of all these technologiestend to argue that major accidents affecting their favouredtechnology are not typical of the advanced technologies thatwould be installed today, but nonetheless, accidents stillhappen, despite the existence of sophisticated managementand inspection protocols intended to avoid them. Theserisks are therefore important in balancing the overall ancillaryeffects of alternative future pathways. Alongside the issuesof major accidents are legacy issues associated with nuclearwaste, and CO2 storage.
Landscape and amenity: Widespread deployment of somerenewable technologies, notably wind turbines, could have asignificant impact on landscapes. Widespread deploymentof wind turbines will have an immediate and possibly largeeffect on the amenity value of landscapes in the short tomedium term.
The examples provided above only represent a short-list ofco-benefits/trade-offs of climate policies. There are otherpotential areas that could also be added, notably possibleemployment or growth opportunities (CEC, 2011). However,they underline the fact that the consequences of climatecontrols are far reaching and monetisation of theseadditional issues is a priority for future analysis.
5. Co-Benefits in China andIndiaWhile mitigation policy has potentially large co-benefits inEurope, there are potentially even greater benefits for othermajor emitters with higher current baseline pollution levels,notably in China and India. These countries are increasinglysuffering air pollution problems similar to historic Europeanlevels, and there is a growing awareness of the associatedhealth and environmental impacts.
The ClimateCost study has therefore assessed the potentialco-benefits of mitigation in these countries. This has usedthe GAINS model analysis, using a similar approach to thatoutlined for Europe above.
Figure 13 below illustrates the baseline population weightedconcentrations of PM2.5 up to 2050 in China and India,
Policy Brief
06
30/31

Air Quality
Figure 13. Ambient concentrations of PM2.5 (population weighted, annual mean) for the Baseline and the Mitigation scenarios. Rangesindicate variations over provinces/states.
Figure 14. Statistical loss of life expectancy (months) in China due to anthropogenic PM2.5 for the Baseline (left panel) and Mitigation (rightpanel) scenarios in 2050.
Source GAINS, Rafaj et al (2011).
Figure 15. Statistical loss of life expectancy (months) in India due to anthropogenic PM2.5 for the Baseline (left panel) and Mitigation (rightpanel) scenarios in 2050.
Source GAINS, Rafaj et al (2011).

showing the comparison of baseline (BAS) and mitigationscenario (MIT) over time set against the WHO targetguideline levels on PM (WHO, 2005). Note these values canbe directly compared against the same plot for Europe inFigure 4.
Unlike Europe, most of the regions of China and India haveconcentrations that far above the WHO guideline level of 10µg PM2.5/m
3. Under the mitigation scenario, average ambientconcentrations of PM2.5 in China and India are 47% and63% lower, respectively, when compared to the Baselineprojections in 2050. In turn, these air quality improvementslead to very large health benefits. In China, large health benefits start to arise in 2030, in linewith the changes in emissions of air pollutants between themitigation and baseline scenarios. By 2050, the loss instatistical life expectancy due to PM2.5 is halved under theMitigation scenario, as shown in Figure 14, and compared tothe Baseline scenario, it increases life expectancy by nearly20 months. The premature deaths attributable to ozone arealso reduced annually by 20,000 cases with mitigation.
Similarly, in India, the mitigation scenario brings majorimprovements after 2030. The gain in the statistical lifeexpectancy from mitigation policies is estimated at 30months by 2050 (see Figure 15), while the projectedpremature death-rates due to ground-level ozone arereduced by 55,000 cases per year by 2050, relative to theBaseline case.
The pollution reductions in the mitigation scenario would alsohave very dramatic benefits in reducing acidification andeutrophication loads in these countries, which are anincreasingly recognised problem.
7. DiscussionThe total co-benefits (health, materials and crops) ofreducing emissions under a mitigation scenario (consistentwith the EU 2 degrees target) are estimated to reach €44 to€95 billion/year by 2050 (current prices, undiscounted).
These benefits are significant when compared to theunderlying costs of mitigation, and accrue to the MemberStates that are undertaking emissions reductions, withbenefits arising in the short-term.
When expressed against the CO2 reductions achieved, theair quality co-benefits of the mitigation scenario are around
€24 per tonne of CO2 across the period (mid estimate VOLY,current prices).
It is highlighted that there remains some uncertainty over thevaluation of mortality. There is almost a factor of 10 variationin the total health co-benefits between the most and leastconservative positions on mortality valuation (Table 6) thoughthere is much less difference (less than a factor of 2)between the central values in use in policy (€60 000 VOLYand €1.1 million VSL). While many experts in health impactassessment (see Rabl et al, 2011) believe that the VSL ispoorly suited to the specific case of air pollution and theunderlying method for deriving life expectancy changes,there remains support for its use.
There are also some limitations to the analysis presentedhere, principally in relation to the omission from themonetised damage estimates of impacts on ecosystems,and possibly the omission of effects of long-term exposureto ozone on mortality. Inclusion of these impacts wouldincrease our estimates of co-benefits, noting in particular theextensive exceedance of the critical load for nutrientnitrogen.
Nonetheless, it is clear that given the size of these co-benefits, they warrant much greater consideration in thediscussion of mitigation policy than currently given. Furtherwork to monetise additional co-benefits, such as energysecurity, are also highlighted as a priority.
Finally, despite the significant fall in emissions of the regionalpollutants under the Baseline, described above, and despitethe further reductions in emissions associated with theMitigation Scenario, there remains a loss of 905,000 millionlife years annually across the EU27 by 2050. Along with thestill widespread exceedance of the critical load foreutrophication by 2050, this demonstrates both the severityof the problems of regional air pollution and the difficulties inaddressing them. This, in turn, emphasises the need toexploit opportunities that exist in the synergies betweenclimate and air quality policies.
ReferencesAmann, M. et al (2008) Interim Report on ModellingTechnology The Greenhouse Gas – Air Pollution Interactionsand Synergies Model (GAINS). European Consortium forModelling of Air Pollution and Climate Strategies –
Policy Brief
06
32/33

EC4MACS. Task 2: Integrated Assessment of Air Pollutionand Greenhouse Gases.http://www.ec4macs.eu/home/reports/Interim%20Methodology%20Reports/1_GAINS_MR.pdf. Accessed August 2011.
Amann M, Bertok I, Borken-Kleefeld J, Cofala J, Heyes C,Höglund-Isaksson L, Klimont Z, Nguyen B, Posch M, RafajP, Sandler R, Schöpp W, Wagner F, Winiwarter W. (2011)Cost-effective control of air quality and greenhouse gases inEurope: Modeling and policy applications. EnvironmentalModelling & Software, Article in press (Published online 15September 2011) [doi: 10.1016/j.envsoft.2011.07.012]
Amann, M., Bertok, I., Borken-Kleefeld, J., Cofala, J., Heyes,C., Höglund-Isaksson, L., Klimont, Z., Rafaj, P., Schöpp, W.and Wagner, F. (2011) Cost-effective Emission Reductions toImprove Air Quality in Europe in 2020
Analysis of Policy Options for the EU for the Revision of theGothenburg Protocol: NEC Scenario Analysis Report #8.June 2011.http://ec.europa.eu/environment/air/pollutants/pdf/nec8.pdf.Accessed August 2011.
Amann, M. and Schopp, W. (2011) Calculation of cause-specific mortality impacts of fine particulate matter in GAINS.Background paper for the Meeting of the UNECE Task Forceon Health Bonn, May 12-13, 2011.
CEC (2005). Thematic Strategy on Air Pollution (COM(2005)446). Directive on Ambient Air Quality and Cleaner Air forEurope (the “CAFE” Directive) (COM(2005) 447), Publishedby the Commission of the European Communities, Brussels.
CEC (2011). A Roadmap for moving to a competitive lowcarbon economy in 2050. Commission Staff WorkingDocument. Impact Assessment. Accompanying Documentto the Communication from the Commission to theEuropean Parliament, the Council, the EUROPEANEconomic and Social Committee and the Committee of theREGIONS. Brussels, 8.3.2011. SEC(2011) 288 final.
EC (1995). European Commission, DGXII, Science,Research and Development, JOULE. Externalities of Energy,‘ExternE’ Project. Volume 2. Methodology. (EUR 16521 EN).
ExternE (1998a) ExternE – Externalities of Energy. Volume10: National Implementation. Linares, P. and Montes, J.(Eds). http://www.externe.info/reportex/vol10.pdf. AccessedSeptember 2011.
EC (1998b). European Commission Directorate-General XII
Science, Research and Development. ExternE Externalitiesof Energy. Volume 7: Methodology 1998 Update.http://www.externe.info/reportex/vol7.pdf. AccessedSeptember 2011.
European Commission (EC) (2008). COMMISSION STAFFWORKING DOCUMENT: IMPACT ASSESSMENT Documentaccompanying the Package of Implementation measures forthe EU’s objectives on climate change and renewable energyfor 2020. SEC 2008 (85/3)
Hettelingh, J.-P., Posch, M. and Slootweg, J. (eds) (2009)Progress in the modelling of critical thresholds, impacts toplant species diversity and ecosystem services in Europe.CCE Status Report 2009.http://www.pbl.nl/en/themasites/cce/publications/040/index.html. Accessed September 2011.
Holland, M. and Watkiss, P. (2002) Benefits Table database:Estimates of the marginal external costs of air pollution inEurope BeTa Version E1.02a. Contract report for EC DGEnvironment.
Holland, M., Hunt, A., Hurley, F., Navrud, S. and Watkiss, P.(2005a) Methodology for the Cost-Benefit analysis for CAFE:Volume 1: Overview of Methodology. http://www.cafe-cba.org/assets/volume_1_methodology_overview_02-05.pdf. Accessed September 2011.
Holland, M., Hurley, F., Hunt, A. and Watkiss, P. (2005b)Methodology for the Cost-Benefit Analysis for CAFE: Volume3: Uncertainty in the CAFE CBA: Methods and First Analysis.http://www.cafe-cba.org/assets/volume_3_methodology_05-05.pdf.Accessed September 2011.
Holland et al (2005c) Damages per tonne emission ofPM2.5, NH3, SO2, NOx and VOCs from each EU25Member State (excluding Cyprus) and surrounding seas.http://www.cafe-cba.org/assets/marginal_damage_03-05.pdf. Accessed September 2011.
Holland, M., Pye, S., Jones, G., Hunt, A., Markandya, A.,Hurley, F. and Watkiss, P. (2008) Interim Report on ModellingTechnology Benefits Assessment and Comparison of Costsand Benefits European Consortium for Modelling of AirPollution and Climate Strategies – EC4MACS. Task 8:Benefits Assessment.http://www.ec4macs.eu/home/reports/Interim%20Methodology%20Reports/4_BenefitsAssessment_task_8.pdf.Accessed August 2011.
Air Quality

Holland, M., Hunt, A., Wagner, A., Hurley, F., Miller, B.,Mathur, R and Ramaprasad, A. (2011a). Quantification andmonetisation of the co-benefits from control of regional airpollutants. Contribution to ClimateCost (The Full Costs ofClimate Change) Work Package 5: Ancillary Benefits.
Holland, M., Wagner, A., Hurley, F., Miller, B. and Hunt, A.(2011b) Cost Benefit Analysis for the Revision of the NationalEmission Ceilings Directive:
Policy Options for revisions to the Gothenburg Protocol tothe UNECE Convention on Long-Range Transboundary AirPollution.http://ec.europa.eu/environment/air/pollutants/pdf/Gothenburg%20CBA1%20final%202011.pdf. Accessed August 2011.
Hurley, F., Hunt, A., Cowie, H., Holland, M., Miller, B., Pye, S.and Watkiss, P. (2005) Methodology for the Cost-Benefitanalysis for CAFE: Volume 2: Health Impact Assessment.http://www.cafe-cba.org/assets/volume_2_methodology_overview_02-05.pdf. Accessed September 2011.
Hurley, J., Holland, M., Watkiss, P. and Hunt, A. (2005) CAFECBA Team Response to: UNICE concerns with key aspectsof the CAFE CBA methodologyhttp://www.cafe-cba.org/assets/response_to_UNICE_concerns_05-05-05.pdf. Accessed September 2011.
Hurley, F., Miller, B. and Shafrir, A. (2011) Health ImpactAssessment for the National Emissions Ceiling Directive(NECD) – Methodological Issues.http://ec.europa.eu/environment/air/pollutants/pdf/IOM%20Report%20methodology%20NECD%20HIA.pdf. AccessedSeptember 2011.
Jones, M.L.M., Provins, A., Harper-Simmonds, L., Holland,M., Mills, G., Hayes, F., Emmett, B.A., Hall, J., Sheppard,L.J., Smith, R., Sutton, M., Hicks, K., Ashmore, M., Haines-Young, R. (2011, in preparation) Using the EcosystemsServices Approach to Value Air Quality (Defra ProjectNE0117). Report to Department for Environment Food andRural Affairs (Defra)
Krewski D, Jerrett M, Burnett R T, Ma R, Hughes E, et al.(2009). Extended follow- up and spatial analysis of theAmerican Cancer Society study linking particulate airpollution and mortality. HEI Research Report, 140, HealthEffects Institute, Boston, MA.
Krupnick, A., Ostro, B. and Bull, K. (2005) Peer review of the
methodology of cost-benefit analysis of the Clean Air ForEurope Programme (CAFE). http://www.cafe-cba.org/assets/cafe_peer_review.pdf. Accessed August2011.
NAEI (2011) National Atmospheric Emissions Inventory forthe UK. http://naei.defra.gov.uk/. Accessed August 2011.
Nakicenovic N, Alcamo J, Davis G., de Vries B., Fenhann J,Gaffin S, Gregory K, Grübler A. et al., (2000), Special Reporton Emissions Scenarios, Working Group III,Intergovernmental Panel on Climate Change (IPCC),Cambridge University Press, Cambridge, UK, pp. 595.http://www.grida.no/climate/ipcc/emission/index.htmAccessed March 2011.
NEEDS (2006) Deliverable D.4.2.- RS 1b/WP4 – July 06“Assessment of Biodiversity Losses”. http://www.needs-project.org/RS1b/RS1b_D4.2.pdf. Accessed September2011.
Pope, C.A. III, Burnett, R.T., Krewski, D., Jerrett, M., Shi, Y.,Calle, E.E. and Thun, M.J. (2009a) Cardiovascular mortalityand exposure to airborne fine particulate matter andcigarette smoke: Shape of the exposure responserelationship. Circulation, 120, 941-948.
Pope, C.A. III, Ezzati, M. and Dockery, D.W. (2009b) Fineparticulate air pollution and life expectancy in the UnitedStates. New England Journal of Medicine. 360, 376-386.
Rabl, A., Spadaro, J. and Holand, M. (in preparation)External costs of air pollutants.
Peter Rafaj, Wolfgang Schöpp, Peter Russ, Chris Heyes,Markus Amann (2011). Co-benefits of post-2012 globalGHG-mitigation policies. Contribution to ClimateCost (TheFull Costs of Climate Change) Work Package 5: AncillaryBenefits.
Russ, P, Ciscar, J.C., Saveyn, B., Soria, A., Szabó, L., VanIerland, T., Van Regemorter, D. and Virdis, R. (2009)Economic Assessment of Post-2012 Global Climate Policies:Analysis of Greenhouse Gas Emission Reduction Scenarioswith the POLES and GEM-E3 models. IPTS (Institute forProspective Technological Studies), Sevilla.http://ftp.jrc.es/EURdoc/JRC50307.pdf. Accessed August2011.
Smith, K.R., Jerrett, M., Anderson, H., Burnett, R., Stone, V.,Derwent,R., Atkinson, R., Cohen, A., Shnokoff, S., Krewski,D., Pope III, C.A., Thun, M. and Thurston, G. (2009) Public
Policy Brief
06
34/35
health benefits of strategies to reduce greenhouse-gasemissions: Health implications of short-lived greenhousespollutants. The Lancet, 374, 2091-2103.
UNECE (2011) United Nations Economic Commission forEurope: Convention on Long Range Transboundary AirPollution. http://unece.org/env/lrtap/.
van der Linden, P. and Mitchell, J.B. (eds.) (2009).ENSEMBLES: Climate Change and its Impacts: Summary ofresearch and results from the ENSEMBLES project. MetOffice Hadley Centre, FitzRoy Road, Exeter EX1 3PB: UK.160pp.
Watkiss, P., Holland, M., Hurley, F. and Pye S. (2008).Damage Costs for Air Pollution. Report to the Departmentfor Environment, Food and Rural Affairs, UK. Published onthe Defra website.
WHO (World Health Organisation) (2006). Air qualityguidelines. Global update 2005. Particulate matter, ozone,nitrogen dioxide and sulfur dioxide. Copenhagen, WHORegional Office for Europe, 2006.
Air Quality

Policy Brief
06
36/37
Table A1. Country codes
AT Austria
BE Belgium
BG Bulgaria
CY Cyprus
CZ Czech Republic
DK Denmark
EE Estonia
FI Finland
FR France
DE Germany
GR Greece
HU Hungary
IE Ireland
IT Italy
LV Latvia
LT Lithuania
LU Luxembourg
MT Malta
NL Netherlands
PL Poland
PT Portugal
RO Romania
SK Slovakia
SI Slovenia
ES Spain
SE Sweden
UK United Kingdom

Air Quality
List of health impacts quantified
Impact / population group Population Exposure metric
Mortality from acute exposure All ages O3, SOMO35
Respiratory Hospital Admissions Over 65 years O3, SOMO35
Minor Restricted Activity Days (MRADs) 15 to 64 years O3, SOMO35
Respiratory medication use Adults over 20 years O3, SOMO35
Mortality from chronic exposure as life Over 30 years PM2.5, annual averageyears lost or premature deaths
Infant Mortality 1 month to 1 year PM2.5, annual average
Chronic Bronchitis Over 27 years PM2.5, annual average
Respiratory Hospital Admissions All ages PM2.5, annual average
Cardiac Hospital Admissions All ages PM2.5, annual average
Restricted Activity Days (RADs) 15 to 64 years PM2.5, annual average
Respiratory medication use 5 to 14 years PM2.5, annual average
Respiratory medication use Over 20 years PM2.5, annual average
Lower Respiratory Symptom days 5 to 14 years PM2.5, annual average
Lower Respiratory Symptom days Over 15 years PM2.5, annual average
Note the effect of chronic exposure to PM2.5 on mortality is expressed in two ways, in terms of the loss of life expectancy(expressed as the total number of life years lost annually across the affected population) and the number of deathsbrought forward (expressed as number of cases (deaths) per year). The loss of life expectancy is the preferred measureof impact on theoretical and practical grounds, though deaths brought forward is included for valuation purposes. Thetwo estimates are not additive, however, they allow alternative valuation approaches to be adopted.

Policy Brief
06
38/39
Table A2. Estimated average loss of life expectancy (Months) (Source GAINS, Rafaj et al, 2011).
Baseline Scenario Mitigation Scenario
Country 2005 2020 2030 2050 2020 2030 2050
Austria 6.7 3.2 2.6 2.6 3.0 2.1 1.6Belgium 11.5 6.1 5.6 6.0 5.7 4.9 4.2Bulgaria 8.2 3.4 3.0 3.2 3.1 2.1 1.5Cyprus 4.1 4.1 3.9 4.4 3.2 2.1 1.5Czech Rep. 8.2 4.1 3.3 3.3 3.9 2.7 2.0Denmark 6.4 3.3 3.0 3.1 3.1 2.6 2.3Estonia 5.2 2.8 2.5 2.6 2.5 2.0 1.6Finland 2.9 1.6 1.5 1.7 1.5 1.2 1.0France 6.9 3.5 2.9 2.9 3.3 2.5 2.0Germany 8.7 4.4 3.8 3.9 4.1 3.2 2.5Greece 7.8 3.7 3.0 3.2 3.4 2.3 1.9Hungary 9.5 4.7 4.0 4.1 4.4 3.1 2.3Ireland 3.4 1.8 1.5 1.5 1.8 1.3 1.1Italy 6.6 3.4 2.5 2.7 3.2 2.1 1.7Latvia 5.8 3.5 3.1 3.1 3.3 2.6 2.0Lithuania 5.7 3.3 3.1 3.3 3.1 2.6 2.1Luxembourg 8.6 4.4 3.9 4.2 4.2 3.4 2.9Malta 5.1 3.9 2.1 2.1 3.8 1.8 1.6Netherlands 11.1 5.8 5.4 5.8 5.5 4.7 4.2Poland 9.0 4.6 3.7 3.7 4.3 3.1 2.3Portugal 6.5 3.7 3.1 3.2 3.5 2.6 2.1Romania 9.1 4.2 3.7 3.9 3.8 2.7 1.9Slovakia 8.3 4.0 3.4 3.5 3.8 2.7 2.0Slovenia 7.3 3.6 2.9 2.9 3.4 2.3 1.7Spain 4.5 2.2 1.6 1.7 2.1 1.4 1.1Sweden 3.4 1.8 1.7 1.8 1.7 1.5 1.3United Kingdom 6.2 3.1 2.7 2.8 2.9 2.4 2.1EU-27 average 7.3 3.7 3.1 3.1 3.5 2.6 2.0
Albania 5.0 2.4 1.9 2.1 2.3 1.5 1.2Belarus 6.3 4.2 4.2 5.0 4.0 4.2 3.6Bosnia-H 5.4 2.4 2.0 2.2 2.2 1.6 1.2Croatia 7.5 3.8 3.0 3.2 3.5 2.3 1.8FYR Macedonia 5.8 2.5 2.1 2.2 2.3 1.5 1.1R Moldova 7.5 4.2 4.0 4.4 3.6 2.7 2.4Norway 2.2 1.3 1.3 1.5 1.3 1.2 1.2Russia 7.4 4.8 4.8 4.4 4.1Serbia-M 7.5 3.2 2.7 3.0 2.9 2.0 1.4Switzerland 5.4 2.7 2.2 2.4 2.6 1.9 1.6TurkeyUkraine 8.6 5.2 5.1 5.7 4.3 3.3 2.6Non-EU average 7.3 4.5 4.4 4.1 4.1 3.6 2.1
Baseline Scenario Mitigation Scenario
Country 2005 2020 2030 2050 2020 2030 2050

Air Quality
Table A3. Health impacts (cases per year) for the EU27 of for the Baseline and the Mitigation Scenario for 2020, 2030 and2050 (source ALPHA), and the Co-Benefits.
Cases/year
Results for 2020Baseline Mitigation Co-benefit
Acute mortality (all ages) deaths O3 19,911 19,455 456Respiratory hospital admissions (65yr +) O3 19,610 19,173 437Minor restricted activity days (15-64yr) O3 43,904,691 42,909,607 995,084Respiratory medication use (adults 20yr +) O3 16,671,412 16,295,076 376,335Chronic mortality, life years lost PM 1,793,840 1,684,260 109,580Infant Mortality (1 month - 1yr) deaths PM 304 284 20Chronic bronchitis (27yr +) new incidence PM 84,559 79,467 5,091Respiratory hospital admissions (all ages) PM 32,370 30,425 1,945Cardiac hospital admissions (all ages) PM 19,964 18,764 1,200Restricted activity days (RADs 15-64yr) PM 165,076,033 155,113,567 9,962,466Respiratory medication use (children 5-14yr) days PM 1,624,839 1,527,875 96,964Respiratory medication use (adults 20yr +) days PM 15,139,994 14,228,761 911,234Lower respiratory symptom days (children 5-14yr) PM 83,498,667 78,515,813 4,982,854Lower respiratory symptom days (15yr +) PM 153,110,816 143,899,871 9,210,946
Results for 2030Acute mortality (all ages) deaths O3 20,067 18,958 1,109Respiratory hospital admissions (65yr +) O3 21,663 20,505 1,159Minor restricted activity days (15-64yr) O3 39,396,060 37,257,639 2,138,421Respiratory medication use (adults 20yr +) O3 15,952,748 15,090,715 862,033Chronic mortality, life years lost PM 1,443,492 1,215,323 228,170Infant Mortality (1 month - 1yr) deaths PM 223 186 37Chronic bronchitis (27yr +) new incidence PM 72,204 60,925 11,279Respiratory hospital admissions (all ages) PM 27,441 23,174 4,268Cardiac hospital admissions (all ages) PM 16,924 14,292 2,632Restricted activity days (RADs 15-64yr) PM 131,614,877 110,986,476 20,628,401Respiratory medication use (children 5-14yr) days PM 1,352,598 1,144,796 207,802Respiratory medication use (adults 20yr +) days PM 12,873,281 10,865,142 2,008,138Lower respiratory symptom days (children 5-14yr) PM 69,508,511 58,829,817 10,678,694Lower respiratory symptom days (15yr +) PM 130,378,109 110,050,954 20,327,155
Results for 2050Acute mortality (all ages) deaths O3 24,259 20,884 3,374Respiratory hospital admissions (65yr +) O3 27,869 24,075 3,794Minor restricted activity days (15-64yr) O3 36,150,820 31,214,804 4,936,016Respiratory medication use (adults 20yr +) O3 16,688,648 14,411,345 2,277,303Chronic mortality, life years lost PM 1,387,251 904,805 482,446Infant Mortality (1 month - 1yr) deaths PM 201 129 72Chronic bronchitis (27yr +) new incidence PM 76,839 50,282 26,556Respiratory hospital admissions (all ages) PM 28,933 18,968 9,965Cardiac hospital admissions (all ages) PM 17,844 11,698 6,146Restricted activity days (RADs 15-64yr) PM 124,127,047 81,419,761 42,707,287Respiratory medication use (children 5-14yr) days PM 1,391,384 917,130 474,254Respiratory medication use (adults 20yr +) days PM 13,643,560 8,933,242 4,710,318Lower respiratory symptom days (children 5-14yr) PM 71,501,674 47,130,298 24,371,376Lower respiratory symptom days (15yr +) PM 137,690,472 90,189,476 47,500,996
Baseline Co-benefitMitigation
Results for 2030
Results for 2050
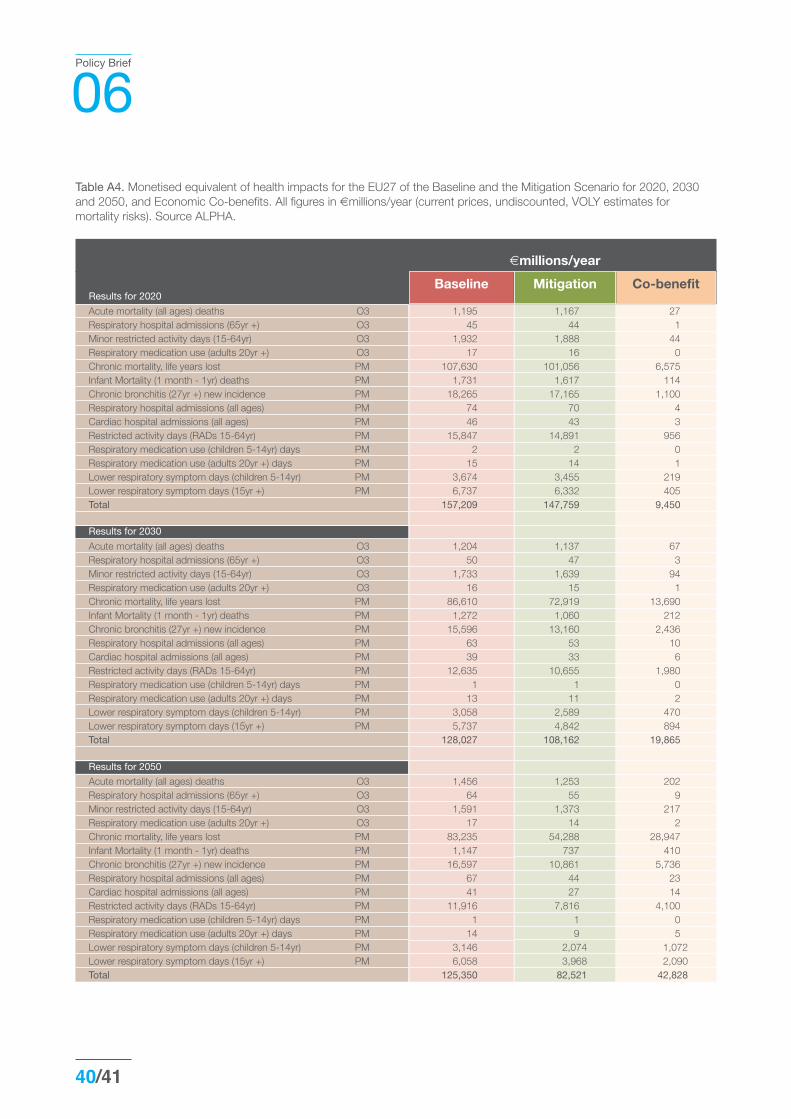
Policy Brief
06
40/41
Table A4. Monetised equivalent of health impacts for the EU27 of the Baseline and the Mitigation Scenario for 2020, 2030and 2050, and Economic Co-benefits. All figures in €millions/year (current prices, undiscounted, VOLY estimates formortality risks). Source ALPHA.
€millions/year
Results for 2020Baseline Mitigation Co-benefit
Acute mortality (all ages) deaths O3 1,195 1,167 27Respiratory hospital admissions (65yr +) O3 45 44 1Minor restricted activity days (15-64yr) O3 1,932 1,888 44Respiratory medication use (adults 20yr +) O3 17 16 0Chronic mortality, life years lost PM 107,630 101,056 6,575Infant Mortality (1 month - 1yr) deaths PM 1,731 1,617 114Chronic bronchitis (27yr +) new incidence PM 18,265 17,165 1,100Respiratory hospital admissions (all ages) PM 74 70 4Cardiac hospital admissions (all ages) PM 46 43 3Restricted activity days (RADs 15-64yr) PM 15,847 14,891 956Respiratory medication use (children 5-14yr) days PM 2 2 0Respiratory medication use (adults 20yr +) days PM 15 14 1Lower respiratory symptom days (children 5-14yr) PM 3,674 3,455 219Lower respiratory symptom days (15yr +) PM 6,737 6,332 405Total 157,209 147,759 9,450
Acute mortality (all ages) deaths O3 1,204 1,137 67Respiratory hospital admissions (65yr +) O3 50 47 3Minor restricted activity days (15-64yr) O3 1,733 1,639 94Respiratory medication use (adults 20yr +) O3 16 15 1Chronic mortality, life years lost PM 86,610 72,919 13,690Infant Mortality (1 month - 1yr) deaths PM 1,272 1,060 212Chronic bronchitis (27yr +) new incidence PM 15,596 13,160 2,436Respiratory hospital admissions (all ages) PM 63 53 10Cardiac hospital admissions (all ages) PM 39 33 6Restricted activity days (RADs 15-64yr) PM 12,635 10,655 1,980Respiratory medication use (children 5-14yr) days PM 1 1 0Respiratory medication use (adults 20yr +) days PM 13 11 2Lower respiratory symptom days (children 5-14yr) PM 3,058 2,589 470Lower respiratory symptom days (15yr +) PM 5,737 4,842 894Total 128,027 108,162 19,865
Acute mortality (all ages) deaths O3 1,456 1,253 202Respiratory hospital admissions (65yr +) O3 64 55 9Minor restricted activity days (15-64yr) O3 1,591 1,373 217Respiratory medication use (adults 20yr +) O3 17 14 2Chronic mortality, life years lost PM 83,235 54,288 28,947Infant Mortality (1 month - 1yr) deaths PM 1,147 737 410Chronic bronchitis (27yr +) new incidence PM 16,597 10,861 5,736Respiratory hospital admissions (all ages) PM 67 44 23Cardiac hospital admissions (all ages) PM 41 27 14Restricted activity days (RADs 15-64yr) PM 11,916 7,816 4,100Respiratory medication use (children 5-14yr) days PM 1 1 0Respiratory medication use (adults 20yr +) days PM 14 9 5Lower respiratory symptom days (children 5-14yr) PM 3,146 2,074 1,072Lower respiratory symptom days (15yr +) PM 6,058 3,968 2,090Total 125,350 82,521 42,828
Baseline Co-benefitMitigation
Results for 2030
Results for 2050


The research leading to these results has received fundingfrom the European Union Seventh Framework Programme(FP7/2007- 2013) under grant agreement n° 212774.To find out more about the ClimateCost project, please visit:www.climatecost.eu
For further information on the ClimateCost project: contact Paul Watkiss at [email protected]
For further information on the GAINS Model, contact Markus Amann, [email protected]
For further information on the CAFE CBA analysis, contact Mike Holland, [email protected]
The views expressed in this publication are the soleresponsibility of the author(s) and do not necessarily reflectthe views of the European Commission. The EuropeanCommunity is not liable for any use made of this information.
Copyright: ClimateCost, 2011.
First published December 2011
The CimateCost project involved 22 partners, the leadorganisation being the Stockholm Environment Institute(Oxford).
Citation. Holland, M., Amann, M., Heyes, C., Rafaj, P.,Schöpp, W. Hunt, A., and Watkiss, P. (2011). The Reductionin Air Quality Impacts and Associated Economic Benefits ofMitigation Policy. Summary of Results from the EC RTDClimateCost Project. In Watkiss, P (Editor), 2011. TheClimateCost Project. Final Report. Volume 1: Europe.
Published by the Stockholm Environment Institute, Sweden,2011. ISBN 978-91-86125-35-6.
06Technical PolicyBriefing Note
Further information