technique for measuring the dielectric constant of thin materials
TRANSCRIPT

~ 1 ' 1
IEEE TRANSACTIONS ON INSTRUMENTATION A N D MEASUREMENT, VOL. 31, NO. 4, DECEMBER 1988 63 1
Technique for Measuring the Dielectric Constant of Thin Materials
KAMAL SARABANDI AND FAWWAZ T. ULABY, FELLOW, IEEE
Abstract-A practical technique for measuring the dielectric con- stant of vegetation leaves and similarly thin materials is presented. A rectangular section of the leaf is placed in the transverse plane in a rectangular waveguide, and the magnitude and phase of the reflection coefficient are measured over the desired frequency band using a vec- tor network analyzer. By treating the leaf as an infinitesimally thin resistive sheet, an explicit expression for its dielectric constant is ob- tained in terms of the reflection coefficient. Because of the thin-sheet approximation, however, this approach is valid only at frequencies be- low 1.5 GHz. To extend the technique to higher frequencies, higher order approximations are derived and their accuracies are compared to the exact dielectric-slab solution. For a material whose thickness is 0.5 mm or less, the proposed technique was found to provide accurate values of its dielectric constant up to frequencies of 12 GHz or higher. The technique was used to measure the 8-12-GHz dielectric spectrum for vegetation leaves, Teflona, and rock samples.
I. INTRODUCTION OMPTED BY THE need for a practical technique
vegetation leaves, solutions were sought for the voltage reflection coefficient measured at the input of a rectan- gular waveguide containing a thin slab placed in a plane orthogonal to the propagation direction (Fig. 1). The slab is modeled in Section I1 as a resistive-current-sheet [ 11, [2], which has proved to be an excellent approach for characterizing the radar-cross-section of a vegetation leaf over a wide range of moisture conditions (and a corre- spondingly wide range of the relative dielectric constant € 1 .
To evaluate the accuracy of the technique for measuring the real and imaginary parts of E from measurements of the complex reflection coefficient I?, an exact solution for I' of the slab will be obtained in Section I11 and then used to simulate the measurement process for given values of E . The evaluation is performed in Section IV by compar- ing the true value of E with that predicted by the resistive- current-sheet expression. It turns out that the resistive- current-sheet solution is identical with the zeroth-order approximation of the exact solution for I?. One of the at- tractive features of the zeroth-order solution is that it pro- vides an explicit expression for E in terms of I?.
The evaluation shows that the zeroth-order solution
p" for measuring the microwave dielectric constant of
Manuscript received November 23, 1987; revised May 4, 1988 and May
The authors are with the Department of Electrical Engineering and
IEEE Log Number 8823465.
28, 1988.
Computer Science, University of Michigan, Ann Arbor, MI 48109.
matched lwd
I
\. \ resistive sheet of thickness '5
Fig. 1. Rectangular waveguide with thin resistive sheet of thickness 7 at z = 0.
provides an excellent estimate for the real part of the di- electric constant, E ' , if the slab thickness 7 is sufficiently small to satisfy the condition 7 5 0.05ho m, where ho is the free-space wavelength. For a typical leaf-thickness of 0.3 mm, this condition is satisfied for any moisture condition if the frequency f 5 15 GHz. A much more stringent condition on 7 is required in order for the zeroth- order solution to give accurate values for E " ; namely 7 5 O.O1ho and E " / E ' I 0.1, or equivalently, f 5 1.5 GHz for vegetation leaves. To relax this limitation, alter- nate solutions for r are obtained in Section I11 by invok- ing approximations that lead to first- and second-order so- lutions whose forms are invertible to explicit expressions for E . Use of the second-order solution is found to extend the frequency range from 1.5-12 GHz for a leaf with a high moisture content and to higher frequencies for drier leaves.
Section V presents 8-12-GHz spectra of the dielectric constant E for vegetation leaves, Teflon and rock slices, all measured using the technique developed in this paper. Where possible, the results are compared with measure- ments made by other techniques.
11. MODEL FOR A THIN RESISTIVE SHEET Consider the rectangular waveguide diagrammed in Fig.
1. The guide is terminated with a matched load, has di- mensions u X b, and contains a thin resistive sheet of thickness 7 at z = 0. The waveguide dimensions are such that only the TElo mode can propagate in the guide.
We seek a relationship between the input voltage re- flection coefficient r and the relative complex dielectric
00 18-9456/88/ 1200-063 1$01 .OO O 1988 IEEE
632 IEEE TRANSACTIONS ON INS1 rRUMENTATION A N D MEASUREMENT, VOL. 31, NO. 4, DECEMBER 1988
constant of the sheet material E. To this end, we shall develop expressions for the electric and magnetic fields in Regions I and I1 and then apply the appropriate boundary conditions. If $I and are the electric potentials in Re- gions I and 11, respectively, solutions of the scalar Helm- holtz equation
(V2 + k2)*I,II = 0 ( 1 )
for the TElo mode leads to [4]
( 3 )
where a time factor eiw‘ was assumed and suppressed. The constants C, and C2 represent the magnitudes of the in- cident and reflected waves in Region I, C3 represents the magnitude of the wave traveling towards the matched load in Region 11, and
The components of E and a may be obtained from (2) and ( 3 ) by applying the relations [4]
1 ZW
- - E = -V X ($2) H = -iwc($i) + - VV .($2).
( 5 ) The resistive sheet model [ 11 treats the sheet in the plane
z = 0 as infinitesimally thin carrying an induced tangen- tial electric current 5 that is related to E by
ri X ri X E = -R5 ( 6 ) where ii is the surface normal of the sheet (ri = i in Re- gion I and f i = -2 in Region 11) and R is the sheet resis- tivity
R = -lye ohms per square meter. (7) kT(E - 1 )
In the above expression, k = 27r/X0, 7 is the sheet thick- ness, yo is the free-space intrinsic impedance, and
(8 ) E = E ’ - jc”
is its relative complex dielectric constant. The condition for continuity of the tangential electric field from Region I to Region I1 and the boundary condition for the magnetic field requires that
2 x (EI - EII) = 0 2 x (E, - EII) = 5. (9) The unknown coefficients C,, C2, C3 can be obtained by applying the boundary conditions given by (6) and (9). The complex voltage reflection coefficient is then found to be
from which an explicit expression for E is obtained
2 i k z r i ( ’ ) m
E = l + = 1 + 7 ( 1 + i/r) . k27(1 + r )
( 1 1 ) Thus by measuring the complex reflection coefficient r and the sheet thickness 7 we can compute E directly. This technique can be very useful for measuring the dielectric constant of vegetation leaves and other similarly thin slabs. Its success, however, depends on two factors: a) the ability to measure both the magnitude and phase of r accurately, which now is possible with the HP-8510 vec- tor network analyzer, and b) the validity of the thin-sheet assumption underlying the derivation that led to (1 1). To examine the range of validity of this assumption and to quantify it in the form of specific limits, we shall first derive the expression for the reflection coefficient when a dielectric slab of arbitrary thickness is placed in the wave- guide, and then compare the exact solution with the so- lution given by (10) and (1 l ) .
111. MODEL FOR A SLAB OF ARBITRARY THICKNESS
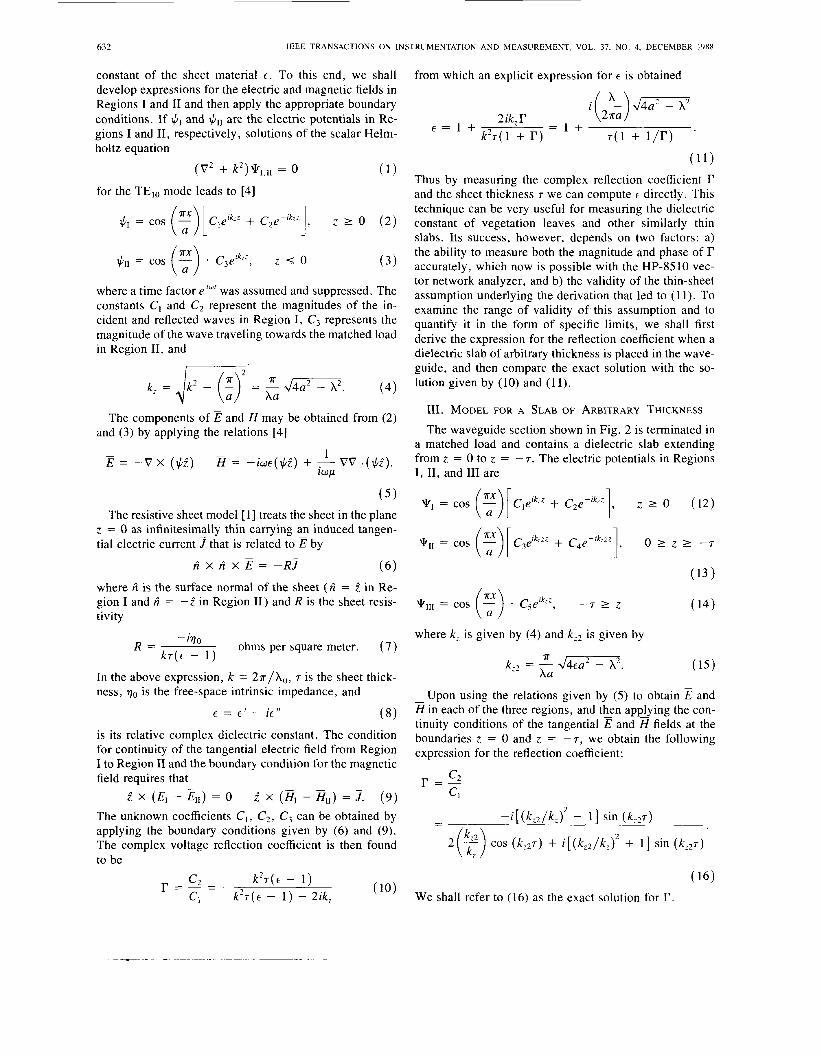
The waveguide section shown in Fig. 2 is terminated in a matched load and contains a dielectric slab extending from z = 0 to z = -7. The electric potentials in Regions I, 11, and 111 are
where k, is given by (4) and kz2 is given by
kz2 = m. Xu
- Upon using the relations given by (5) to obtain E and H in each of the three regions, and then applying the con- tinuity conditions of the tangential E and fields at the boundaries z = 0 and z = -7, we obtain the following expression for the reflection coefficient:
- - -i[(kZ2/kJ2 - 11 sin (kz27)
cos (kz27) + i[(kZ2/kzT + 1 1 sin (kz27)
( 16) We shall refer to (16) as the exact solution for I’.

SAKABANDI AND ULABY DIELECl KIC CONSTANT OF THIN MATERIALS 633
matched IOod
f‘ I
Fig. 2 . Rectangular waveguide with a dielectric slab occupying region (between i = 0 and : = - 7 )
I1
A . Second-Order Solution If k:?r is small and we use the approximations
sin kZ2r z kZ2r
cos k;2r G 1 - f(kr2r)’.
The expressions given by (16) can be simplified the second-order solution
C. Zeroth-Order Solution If E >> 1 , we may use the approximation
because -1 I 1 - : ( X / u ) ’ < 1 . Equation leads to
2 ik,r & E o = I + r k 2 ( r + 1 )
which is identical with the resistive-sheet approximation given by (1 1).
IV. SENSITIVITY ANALYSIS The second-order solution for r , given by ( I S ) , was
based on assuming that kz2r << 1 and on retaining terms up to and including power of 2 in the series expressions for sin kz2r and cos kz2r , as indicated by (17). In the first-
( 1 7 ~ )
(17b)
to give
- ( t - 1 ) r g
from which we obtain the following explicit expression for the second-order solution of the relative dielectric constant:
E = € 2
B. First-Order Solution
order solution, only the zeroth- and first-order terms were retained. The purpose of these derivations is to use them for computing E from measured values of the complex re- flection coefficient r. The accuracies of the approximate expressions given by ( 19) and (2 l ) , corresponding to the second- and first-order solutions for E , respectively, de- pends on the magnitude of kz2r. For a standard waveguide operated in the TElo mode, the dimension a is on the or- der of 3X/4. Hence,
kz2r = k r m = kr-. If, instead Of the approximation given by ( 1 7 b ) 7 we If we require that k r & be small, then kZ2 will be smaller
were to set cos k2:r z 1 in (16) (i.e., ignoring second- and higher order powers of ( k Z 2 r ) ) , we would obtain the
still.
result
- 1
which can then be solved to obtain the expression
1 - [ I - ( ~ 7 2 ~ ~ ) - 2 i k ; / 7 k 2 ] r
( 1 + r ) The zeroth-order solution (22) is only applicable if E is
sufficiently large to allow the approximation given by (2 1) to be used in (20). Hence, for E large, the first- and zeroth- order solutions should yield comparable results.
€ % E , = ( 2 1 )
for the first-order estimate o f t .

634 IEEE TRANSACTIONS ON INSTRUMENTATION A N D MEASUREMENT, VOL. 37. NO. 4. DECEMBER 1988
> . 4 2.00 E ;
1.98
.. . .. .. . . . . . .. .. .. .. .. .. .... .... .. .. .. .. . ... .. .. .. .... .. .... .. .. .. ....... .. .. .. .. .. .. .. .. .. .. . EO -
1 €2 1
Thlckness (mm)
(a)
0.020 i
0005 I ~ ~ . ~ I ~ . . ~ I . . ~ ~ I . . . . I . . . . I . . . . I . . . , I . . . . I , . , .
0.0 0.1 02 03 0.4 0.5 0.6 0.7 oa 09 1.0 Thickness (rnrn)
(b) Fig. 3. Relative (a) pennittivities e& e;, and E ; , and (b) dielectric loss fac-
tors.
To evaluate these approximate expressions for E , we conducted the following sensitivity analysis. We selected specific values of the waveguide width a, the wavelength A, and the relative complex dielectric constant of the slab, E . We then computed r using the exact solution (16). The computed value of I' was then used in (22), (21), and (19) to compute the zeroth-, first-, and second-order estimates of E . We denote these eo , e l , and E ~ .
Our first example of this procedure is Fig. 3 where we show plots of eo, e l , and e2 at 10 GHz as a function of 7
for a slab with true dielectric constant E = 2 - iO.01. We observe that €6, E ; , and E ; in Fig. 3(a) each provide values that are within 1 percent of E' for 7 I 1 mm. Among the three approximations, €6 is the most accurate, in spite of the fact that the left-hand side of (21) is equal to 2, rather than approximately equal to 1 as required by (21). This insensitivity of r to the first term in the denominator of (20) is because this term is much smaller than the second term in the denominator of (20), thereby exercising a mi- nor influence on the final expression for E ' .
Measuring E' of a material usually is not a difficult problem, but measuring E " of a low-loss material can be. The errors associated with using the approximations lead-
r
21 -
E =ZO-jIO f =10 GHz
Thlckness (rnrn)
(b) Fig. 4. Relative (a) pennittivities e;, E ; , and E ; , and (b) dielectric loss fac-
tors.
5. 1 . - , . I . . . . I , I . . I , . . . I ~ . . . , , . , . , . . / , , , . , . ~ . / , . , . , . 0 0 0.1 0.2 0.3 0.4 0.5 0.6 0.7 08 0.9
ing to E ; , ~ i ' , E ; are shown in Fig. 3(b) in the form of deviations from the true value E" = 0.01. For 7 I 1 mm, the relative error is 20 percent for E ; , 50 percent for €;I, and the estimate provided by E( is grossly inaccurate. Hence, in spite of the result that €6 provides a good esti- mate of E ' , the zeroth-order solution is inadequate for es- timating E " .
Fig. 4 shows results for a material with E = 20 - i10. Again €6 provides an adequate estimate of E' over a wide range of the thickness 7 . For the imaginary part, however, E ; consistently provides more accurate estimates of E " than those provided by either E { or E ! .
A summary of the relative accuracies of the three ap- proximations eo, E ~ , and c 2 , is presented in Table I for slab thicknesses 7 equal to 1 and 5 percent of Ao/m. The entries in the table are the maximum relative errors in per- cent. For €6, for example, the maximum relative error is defined as
where €6 is the value provided by (22) and E' is the true value of the slab permittivity.

1 I l l
SARABANDI A N D ULABY DIELECTRIC CONSTANT OF THIN MATERIALS
0.5
635
" ' " . ~ " ~ ' ' ' ~ ' ' ' ' '
: I Measurement Accuracy
TABLE I MAXIMUM RELATIVE ERRURS ASSOCIATED WITH THE EXPRESSIONS FOR € 0 ,
€ 1 , A N D €2; THE QUANTITY e; IS DEFINED AS: e; = maX I E' - € A / € 1 x 100 AND SIMILAR DEFINITIONS APPLY FOR THE REMAINING ERROR
QUANTITIES
0.114 0.341 2920
182.8 1835 1.445
0.127 0.124 a060
0.436 a267 0.018
Maxirmrn Error, %
0.063 OD62 0.029
0.215 0.132 0.091
TJJ I 6 = 0.05
E' / E '
104 104 1
3.107 2.672 17.05
9340 96.70 10.11
3.293 3.216 1.916
33.M &62) 2727
W38 1506 0.866
15.11 3.526 '2.238
V . DIELECTRIC MEASUREMENTS
A . Measurement System A HP-8510A vector network analyzer was used in con-
junction with a HP-85 1 1 parameter test set and a HP-9000 computer (Fig. 5) to measure the amplitude and phase of the reflection coefficient of dielectric slabs placed in a waveguide sample-holder. The arrangement shown in Fig. 5 consists of a waveguide section connected to the HP- 85 1 1 through a coax-to-waveguide adapter on one end and to a waveguide section terminated in a matched load on the other end. A thin piece of Styrofoam is placed in the sample-holder section at a distance 7 from the waveguide opening (junction between the two waveguide sections) where T is equal to the thickness of the dielectric sample. Another thin piece of Styrofoam is placed on the other side of the sample (in the empty waveguide section) to keep the sample in place.
After placing the sample in the waveguide, the network analyzer is used to measure the complex reflection coef- ficient over the frequency range of interest. In the present setup, the frequency coverage is from 8 to 12 GHz.
B. Measurement Accuracy The accuracy of the dielectric-constant measurement is
critically based upon the accuracy with which the reflec- tion coefficient r can be measured. The measurement of r may contain some random, nonrepeatable errors caused by system noise and environmental variations as well as certain systematic errors that are repeatable and, there- fore, correctable. To correct the systematic errors, the measurement system is calibrated using three independent standards whose reflection coefficients are known over the frequency range under consideration. These include a
m HP 8510
computer
HP 8511
dieiectT material
coaxla1 to waveguide adaptor
styroloam Styrofoam
Fig. 5 . Measurement system.
0. V, 0
7 z OSmm
I MeasurernentAccurW
Data measured by Coaxial Probe
Basalt
I 0.4 1
._ ___-T--r . , , , I 1 . , . , I . ~ - . , - 10 11 12
00-- +
Frequency (GHz)
(b) Fig. 6. Measured (a) relative permittivity and (b) dielectric loss factor of
Teflon and three rock samples.
C. Sample Measurements The technique described in the previous sections was
used to measure the 8-12-GHz dielectric spectra of three types of rock materials (each cut in the shape of a thin slab with a cross-section equal to that of the waveguide's) and a thin leaf of vegetation material with a gravimetric short-circuited-load. ii matched load, and an offset short. . " I

636 IEEE TRANSACTIONS ON INSTRUMENTATION A N D MEASUREMENT, VOL. 31, NO. 4, DECEMBER 1988
10
e
1 vegetation Leaf I Measurement Accuracy
- -
- _ _ _ _ _ _ Waveguide Measurements o Estimated From Dielectrk Model [3]
' ~ " ~ " ~ ~ ~ ~ ~ ~ ~ ' ~ ~ ~ ~ ~ ~ ~ ~ ~ ~ ' ~ ' ~ ~ ~ ~ ' ~ ~ ' ~ ~ '
Model Accuracy 7 = 0.23 mm Gravimetric Moisture Content = 90%
T 4s
.. c -1
moisture content of 90 percent. In addition, a thin slab of Teflon with E = 2.0 - j0.005 was measured also. The results are given in Figs. 6 and 7. The results for Teflon were found to be in excellent agreement with those mea- sured for a thick sample for both E' and E " . The measured permittivities of the rock samples are essentially constant over the 8-12-GHz band (Fig. 6(a)), and for two of the samples (rhyolite and rhyodlacite) the measured permit- tivity compares very well with values measured by a coaxial probe using an approximate reflection technique
The plots of Fig. 6(b) display E " , the relative dielectric loss factor for Teflon, and the three rock samples. We have no reason to expect E of rocks to exhibit a dispersive behavior in the 8-12-GHz frequency region, and there- fore, we suspect that the observed variability, particularly in the 8-9-GHz range, is an artifact of the measurement system.
The example shown in Fig. 7 is for a leaf vegetation. Its gravimetric moisture was 0.9 and its thickness 0.23 mm. The continuous curves represent the values of E' and E" measured with the waveguide technique and the circles represent values calculated using a model [3] with an ac- curacy of f 2 0 percent. Within this range of accuracy, both the data and model are in good agreement.
[51.
VI. CONCLUSIONS
waveguide. The dielectric constant of the leaf is then cal- culated from the measured reflection coefficient.
An explicit expression for the dielectric constant is ob- tained in terms of the reflection coefficient by simplifying the exact solution for reflection from a dielectric slab using a thin-sheet approximation. The technique is found to provide accurate measurements of the complex dielectric constant for natural materials, including vegetation leaves and rocks, up to 12 GHz if the thickness is 0.55 mm or less.
It is worth mentioning that the technique can be ex- tended to measure the relative permeability by modifying (12)-( 14). Because such a modification results in having four unknowns, it will be necessary to measure the reflec- tion coefficient corresponding to two different sample thicknesses in order to determine both E and p . Alterna- tively, one can measure the reflection and transmission coefficients of one sample to realize the same objective.
REFERENCES [ l ] R. F. Harrington and J . R. Mautz, "An impedance sheet approxima-
tion for thin dielectric shells," IEEE Trans. Anrennas Propagar., vol.
[2] T. B. A. Senior, K . Sarabandi, and F. T. Ulaby, "Measuring and mod- eling the backscattering cross section of a leaf," Radio Sci. , vol. 22. no. 6, pp. 1109-1 116, Nov. 1987.
[3] F. T. Ulaby and M. A. El-Rayes, "Microwave dielectric spectrum of vegetation-Part 11: Dual-dispersion model," IEEE Trans. Geosci. Re- mote Sensing.. vol. GE-25. DD. 550-557. 1987.
AP-23, pp. 532-534, 1975.
.. The techniaue Dresented in this paper for measuring the [41 R. F. Harryngton, Time-Harmonic Electromagnetic Fields. New
I 1 . . I
York: McGraw-Hill, 1961, p. 130. M , A. El-Rayes and F, T, Ulaby, vegetation-Part I: Experimental observations," IEEE Trans. Geosci. Remore Sensing., VOI. GE-25, pp. 541-549, 1987.
dielectric constant of thin slabs is based on measuring the Complex reflection coefficient Of the input Of a waveguide section with the slab placed in the transverse plane of the
dielectric spectrum of