technische universitÄt mÜnchen lehrstuhl für proteomik …
TRANSCRIPT
TECHNISCHE UNIVERSITÄT MÜNCHEN
Lehrstuhl für Proteomik und Bioanalytik
Quantitative chemical and phosphoproteomics
for studying signaling in cancer
Fiona Pachl
Vollständiger Abdruck der von der Fakultät Wissenschaftszentrum Weihenstephan für Ernährung, Landnutzung und Umwelt der Technischen Universität München zur Erlangung des akademischen Grades eines
Doktors der Naturwissenschaften
genehmigten Dissertation.
Vorsitzender: Univ.-Prof. Dr. D. Langosch
Prüfer der Dissertation: 1. Univ.-Prof. Dr. B. Küster
2. Univ.-Prof. Dr. R. Hückelhoven
Die Dissertation wurde am 29.08.2013 bei der Technischen Universität München eingereicht und durch die Fakultät Wissenschaftszentrum Weihenstephan für Ernährung, Landnutzung und Umwelt am 28.10.2013 angenommen.

Content
Chapter 1 General introduction
1
Chapter 2 Characterization of a high field Orbitrap mass spectrometer for proteome analysis
31
Chapter 3 Ultra-high intra spectrum mass accuracy enables unambiguous identification of fragment reporter ions in isobaric multiplexed quantitative proteomics
53
Chapter 4 Characterization of a chemical affinity probe targeting AKT kinases
75
Chapter 5 Chemical and phosphoproteomic characterization of triciribine action in pancreatic cancer
105
Summary
137
Zusammenfassung
139
List of publications
143
Danksagung
145
Curriculum vitae
147


Chapter 1
General Introduction

General introduction | Chapter 1
3
Mass spectrometry-based proteomics
Overview
The term proteome was coined more than 15 years ago and comprises the entire set of proteins expressed by a genome in a cell tissue, biofluid or organism at certain time point [1]. Proteomics [2] provides a complementary approach to genomics and transcriptomics technologies and allows the global study of biological processes directly at the protein level. Despite in principle encoded in the genome, the proteome provides a much higher complexity produced by alternative splicing, processing and post-translational modifications such as phosphorylation, acetylation, methylation, glycosylation and ubiquitination [3-6]. Furthermore, the dynamic nature of gene expression, subcellular localization, protein-protein interaction, and protein stability extend the complexity on protein level [7, 8]. Proteomics has undergone a tremendous progress from visualizing proteins on two-dimensional gels [9] to the identification and quantification of more than 10,000 proteins from a human cell line [10, 11].
Mass spectrometry (MS) has become the dominant technique in system-wide protein and peptide identification [12, 13]. Moreover, it has proven to be successful in quantification of proteins [14-16] and the analysis of post-translational modifications [17]. Mainly two evolving technologies have enabled the rapid progress in proteomics: first, new techniques for peptide sequencing using mass spectrometry, including the development of soft ionization methods, such as electrospray ionization (ESI) and matrix-assisted laser desorption/ ionization (MALDI); and second, the miniaturization of liquid chromatography (LC). The following paragraphs provide a brief overview of a general mass spectrometry-based proteomics workflow and fundamental techniques commonly used.
Mass spectrometry-based proteomics research can be classified into two major approaches: top-down and bottom-up [18]]. In the first, intact proteins are introduced into the mass spectrometer for the determination of their intact and fragment masses. If sufficient informative fragments are observed, the approach provides a complete description of the primary structure of the protein and location of modifications [19]. However, the analysis of intact proteins by tandem mass spectrometry is a major challenge due to the fact that fractionation and separation of proteins from a complex mixture is limited with traditional methods such as gel electrophoresis or chromatographic techniques [20]. In addition, multiple charge states derived from electrospray ionization and low fragmentation efficiency of large molecules complicate spectra interpretation [21].
In the vast majority of proteomics studies the bottom-up (or shotgun) strategy is applied, in which the peptide detection is used to infer the presence of a protein. Here, the extracted proteins are first digested into a complex peptide mixture that is subsequently separated by sample pre-fractionation or enrichment techniques. Proteins are then identified by tandem mass spectrometry and database search. This approach is suitable for the high-throughput analysis of complex samples. Moreover it is attractive because of its sensitivity and proteome coverage.
Chapter 1 | General introduction
4
However, information, e.g. about protein isoforms or distinguishability of close homologues, is lost upon the conversion of intact proteins into peptide mixtures, which can result in inaccurate identifications.
The shotgun proteomics workflow; sample preparation
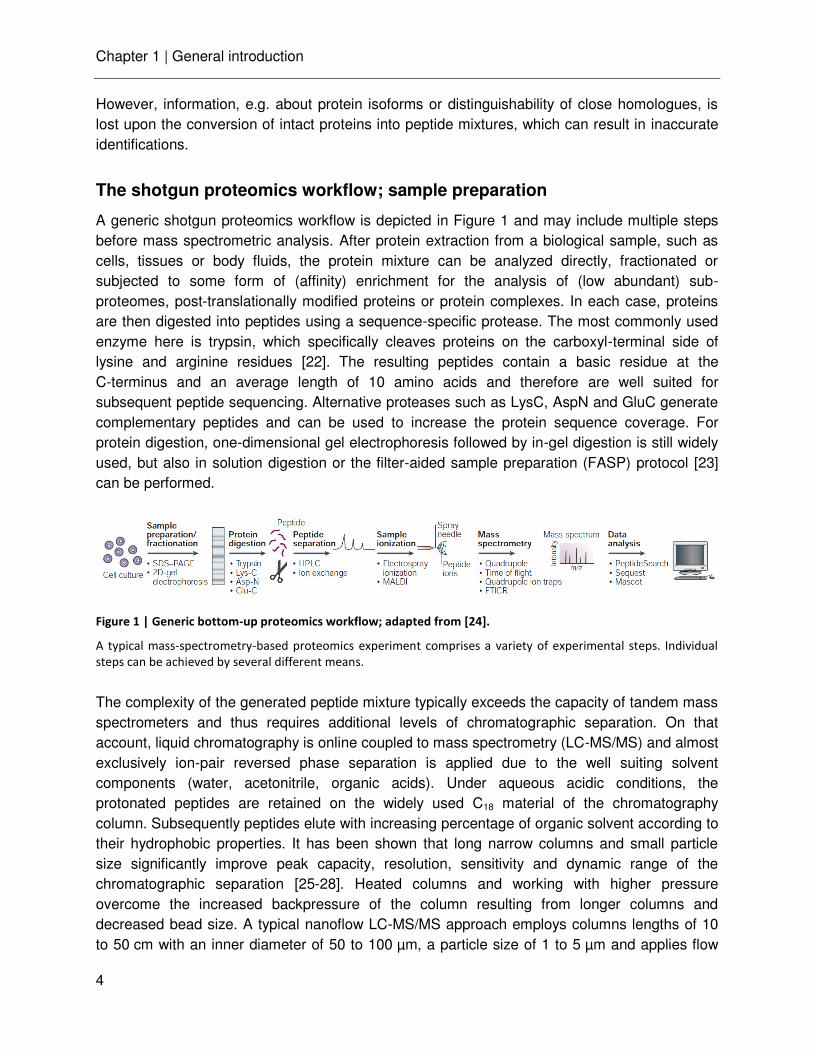
A generic shotgun proteomics workflow is depicted in Figure 1 and may include multiple steps before mass spectrometric analysis. After protein extraction from a biological sample, such as cells, tissues or body fluids, the protein mixture can be analyzed directly, fractionated or subjected to some form of (affinity) enrichment for the analysis of (low abundant) sub-proteomes, post-translationally modified proteins or protein complexes. In each case, proteins are then digested into peptides using a sequence-specific protease. The most commonly used enzyme here is trypsin, which specifically cleaves proteins on the carboxyl-terminal side of lysine and arginine residues [22]. The resulting peptides contain a basic residue at the C-terminus and an average length of 10 amino acids and therefore are well suited for subsequent peptide sequencing. Alternative proteases such as LysC, AspN and GluC generate complementary peptides and can be used to increase the protein sequence coverage. For protein digestion, one-dimensional gel electrophoresis followed by in-gel digestion is still widely used, but also in solution digestion or the filter-aided sample preparation (FASP) protocol [23] can be performed.
Figure 1 | Generic bottom-up proteomics workflow; adapted from [24].
A typical mass-spectrometry-based proteomics experiment comprises a variety of experimental steps. Individual
steps can be achieved by several different means.
The complexity of the generated peptide mixture typically exceeds the capacity of tandem mass spectrometers and thus requires additional levels of chromatographic separation. On that account, liquid chromatography is online coupled to mass spectrometry (LC-MS/MS) and almost exclusively ion-pair reversed phase separation is applied due to the well suiting solvent components (water, acetonitrile, organic acids). Under aqueous acidic conditions, the protonated peptides are retained on the widely used C18 material of the chromatography column. Subsequently peptides elute with increasing percentage of organic solvent according to their hydrophobic properties. It has been shown that long narrow columns and small particle size significantly improve peak capacity, resolution, sensitivity and dynamic range of the chromatographic separation [25-28]. Heated columns and working with higher pressure overcome the increased backpressure of the column resulting from longer columns and decreased bead size. A typical nanoflow LC-MS/MS approach employs columns lengths of 10 to 50 cm with an inner diameter of 50 to 100 µm, a particle size of 1 to 5 µm and applies flow
General introduction | Chapter 1
5
rates in the range of 100 to 500 nL/min.
As peptide mixture are more complex in large scale proteomics studies, the introduction of further dimensions of separation is often favored to increase the coverage and dynamic range. The pre-fractionation is performed according to the physiochemical properties of the peptide population, such as charge, isoelectric point or hydrophobicity. Hereby, best possible orthogonality of the chosen separation techniques is required. Common approaches for the separation of peptides are isoelectric focusing (IEF), strong cation or anion exchange chromatography (SCX/SAX) or hydrophilic interaction chromatography (HILIC). Alternatively, specific subsets of peptides containing certain modifications can be targeted through different enrichment techniques.
Mass spectrometric instrumentation
In general, a mass spectrometer consists of three parts: an ionization source to generate gas-phase ions, a mass analyzer to separate ions according to their mass-to-charge (m/z) ratio and an ion detector. Ionization is commonly achieved by either matrix-assisted laser desorption/ ionization or electrospray ionization. Once ions are produced, they are transferred into the mass spectrometer via an electrostatic potential between the ion source and the mass analyzer and subsequently separated according to their m/z ratio. Following separation, the ions reach the detector and generate a signal which is translated into a mass spectrum containing the signal intensity plotted against the m/z value. Alternatively, structural information can be acquired by fragmentation and separation of the ion population in a tandem mass spectrometer.
Soft ionization techniques
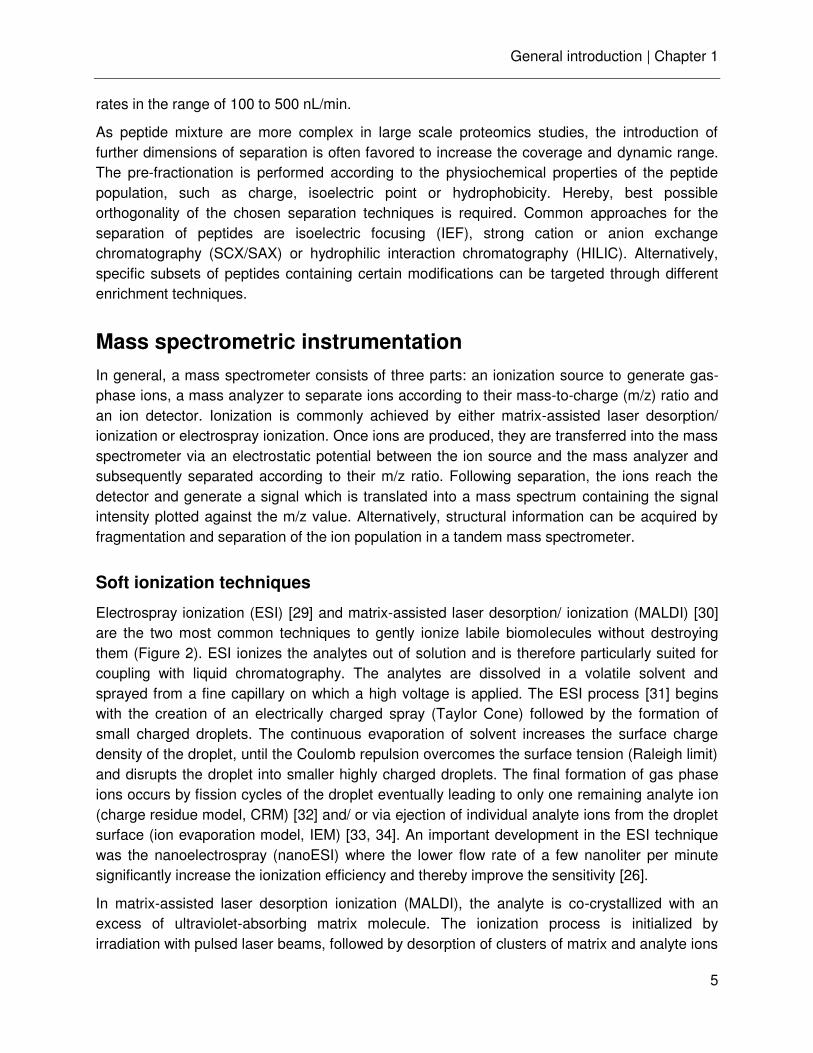
Electrospray ionization (ESI) [29] and matrix-assisted laser desorption/ ionization (MALDI) [30] are the two most common techniques to gently ionize labile biomolecules without destroying them (Figure 2). ESI ionizes the analytes out of solution and is therefore particularly suited for coupling with liquid chromatography. The analytes are dissolved in a volatile solvent and sprayed from a fine capillary on which a high voltage is applied. The ESI process [31] begins with the creation of an electrically charged spray (Taylor Cone) followed by the formation of small charged droplets. The continuous evaporation of solvent increases the surface charge density of the droplet, until the Coulomb repulsion overcomes the surface tension (Raleigh limit) and disrupts the droplet into smaller highly charged droplets. The final formation of gas phase ions occurs by fission cycles of the droplet eventually leading to only one remaining analyte ion (charge residue model, CRM) [32] and/ or via ejection of individual analyte ions from the droplet surface (ion evaporation model, IEM) [33, 34]. An important development in the ESI technique was the nanoelectrospray (nanoESI) where the lower flow rate of a few nanoliter per minute significantly increase the ionization efficiency and thereby improve the sensitivity [26].
In matrix-assisted laser desorption ionization (MALDI), the analyte is co-crystallized with an excess of ultraviolet-absorbing matrix molecule. The ionization process is initialized by irradiation with pulsed laser beams, followed by desorption of clusters of matrix and analyte ions
Chapter 1 | General introduction
6
into the gas phase. MALDI predominantly produces singly charged ions and is commonly used to analyze relatively simple analyte mixtures. An important advantage of MALDI is that the 2-dimensional coordinates are preserved which is of great use in the imaging mass spectrometry field [35].
Figure 2 | Soft ionization techniques; adapted from [24].
General principle of analyte ion formation by (A) MALDI and (B) ESI.
Mass analyzers
The common mass analyzers used for proteomic research can be categorized in two major types: the scanning and ion-beam mass spectrometers, such as quadrupole and time-of-flight (TOF) analyzers, and the trapping mass spectrometers, such as ion traps (three-dimensional (3D) or linear (2D) ion trap), Orbitrap and Fourier-transform ion cyclotron resonance (FTICR) analyzer. Each analyzer has certain performance characteristics, such as resolution, mass accuracy, mass range, sensitivity, analysis speed and dynamic range, which are summarized in Table 1. Various hybrid instruments have been designed to combine the capabilities of different mass analyzers and to respond to specific needs during analysis.
Table 1 | Performance characteristics of mass analyzers; adapted from [19, 26].
Quadrupole TOF ion trap Orbitrap FTICR
Mass resolution <2000 >30,000 10,000 >200,000 >750,000
Mass accuracy 100-1000 ppm 2-5 ppm 100-1000 ppm 1-5 ppm <2 ppm
m/z range <4000 >500,000 <4000 <2000 <2000
Dynamic range 1e4
1e3
1e3
5e3
1e3
Scan speed sec μsec 20-200 msec 20-200 msec 20-200 msec
General introduction | Chapter 1
7
Orbitrap-based mass spectrometers
Orbitrap-based mass spectrometers became the workhorse in proteomics [36, 37] and were applied throughout this thesis. A short overview is given in the following section.
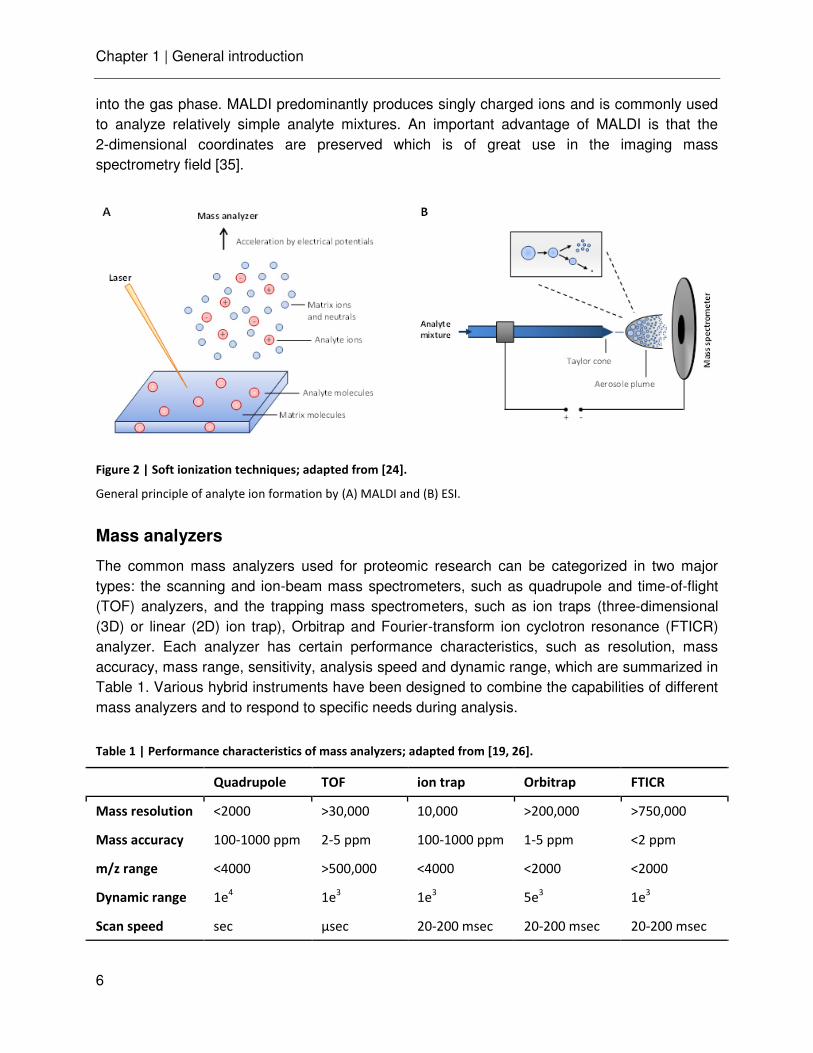
The orbitrap as new type of mass analyzer was invented by Makarov in 2000 [38, 39] and since then the instrument technology has undergone several major improvements towards increased acquisition speed, higher resolving power, mass accuracy and sensitivity driven by several substantial developments [37]. Ion packages, collected externally in a curved quadrupole, the C-trap, are injected in the orbitrap analyzer and trapped in an electrostatic field generated by an outer barrel-like electrode and a central spindle electrode. The ions orbit harmonically around the central electrode and oscillate along the z-axis with a frequency independent of initial energy, angle or velocity and characteristic of their m/z values. The axial oscillation is recorded as image current on the two halves of the outer electrode and converted into a mass spectrum by Fourier transformation. The orbitrap analyzer combines very high mass accuracy with high resolution capabilities. In fact, recent developments, mainly the introduction of the so called high-field compact orbitrap and enhanced Fourier transform algorithm for signal deconvolution, further improve scan speed and resolution [40-42].
Figure 3 | Schematic overview of a LTQ-Orbitrap mass spectrometer; adapted from [36].
The front part is a linear (dual-pressure cell) ion trap capable of detecting MS and MSn spectra. In the C-trap, ions
are accumulated and focused to either subject them to fragmentation in the HCD collision cell or directly inject and
detect them into the orbitrap analyzer, the central mass analyzer of the instrument (upper panel). The lower panel
depicts a model of the orbitrap analyzer. Upon injection, the ions oscillate around the central electrode (A) with a
fre uency (ωz) characteristic for their m/z value. The induced image current is detected and a m/z spectrum from
the different ions is determined after Fourier transformation.
m/z
k z

Chapter 1 | General introduction
8
For proteomic applications, the orbitrap mass analyzer is typically coupled to a linear ion trap (LTQ) (Figure 3), combining the advantages of the orbitrap with the scan speed and exquisite sensitivity of the ion trap [43, 44]. A linear ion trap consists of a quadrupole where the ions are trapped by a potential barrier on endcap electrodes and provide a high ion capacity [45]. The performance of linear ion traps was further increased by the implementation of a dual-pressure cell design [46]. The combination of the two mass analyzers enables operation of the instrument in parallel fashion. While the acquisition of a high resolution full MS spectrum in the orbitrap, the linear ion trap simultaneously carries out fragmentation and detection of selected precursors, the so called “high-low strategy” [47, 48]. A significant development in instrumentation represents the addition of a multipole collision cell which enables beam-type collision induced dissociation (also known as higher energy collision induced dissociation, HCD) with orbitrap readout [49]. This allows the acquisition of both peptide and fragment ions with high mass accuracy, the so called “high-high strategy”, which turned out to advantageous in various proteomic applications like PTM analysis [50, 51].
Protein Identification by Tandem Mass Spectrometry
Principle
Tandem mass spectrometry enables the determination of the primary sequence of a peptide as well as the analysis of post-translational modifications. The basic principle is to acquire two or more mass spectra. The first (full scan) mass spectrum is generated from the precursor ions to determine the m/z values of the intact peptides. For the second mass spectrum, the precursor of interest is isolated, fragmented and the various fragment ions are recorded. Tandem mass spectrometry can either be performed in instruments containing two analyzers (‘tandem in space’) or consecutively inside the same analyzer (‘tandem in time’). Each concept has certain advantages and disadvantages, but both are widely used. The former one is mainly applied in triple quadrupole, quadrupole TOF or orbitrap mass spectrometers, examples for the latter one are ion traps or FT-ICR instruments.
Peptide sequencing by tandem mass spectrometry
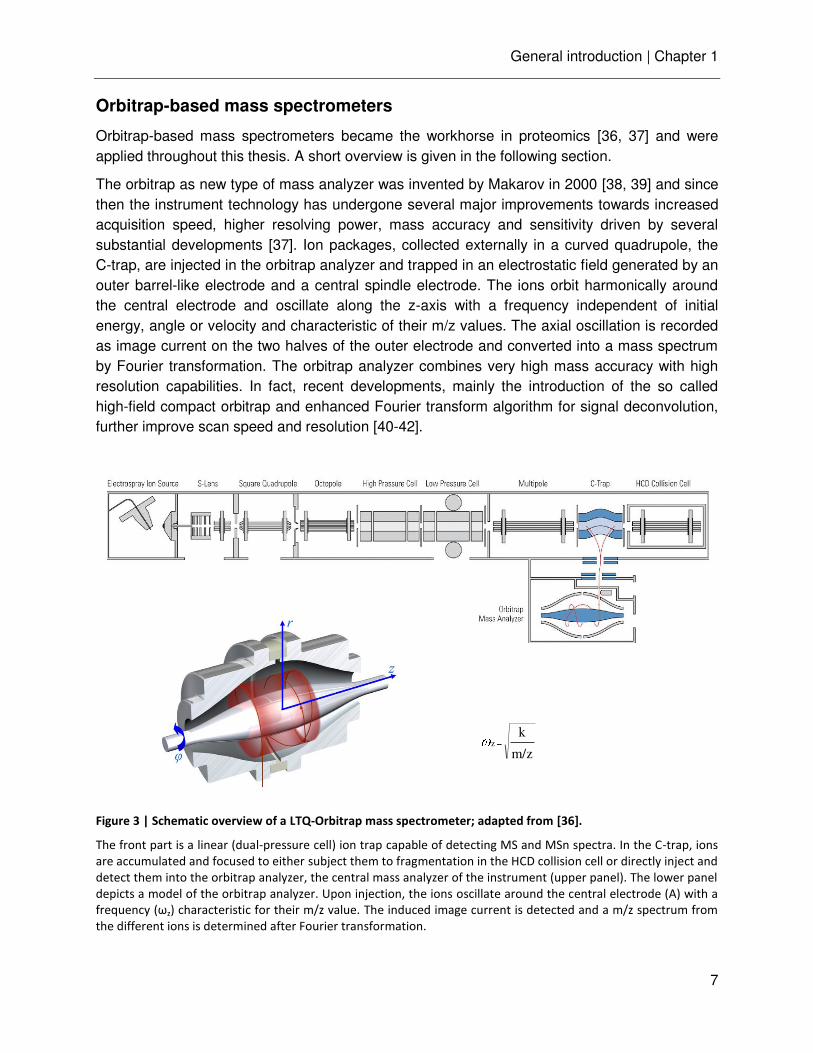
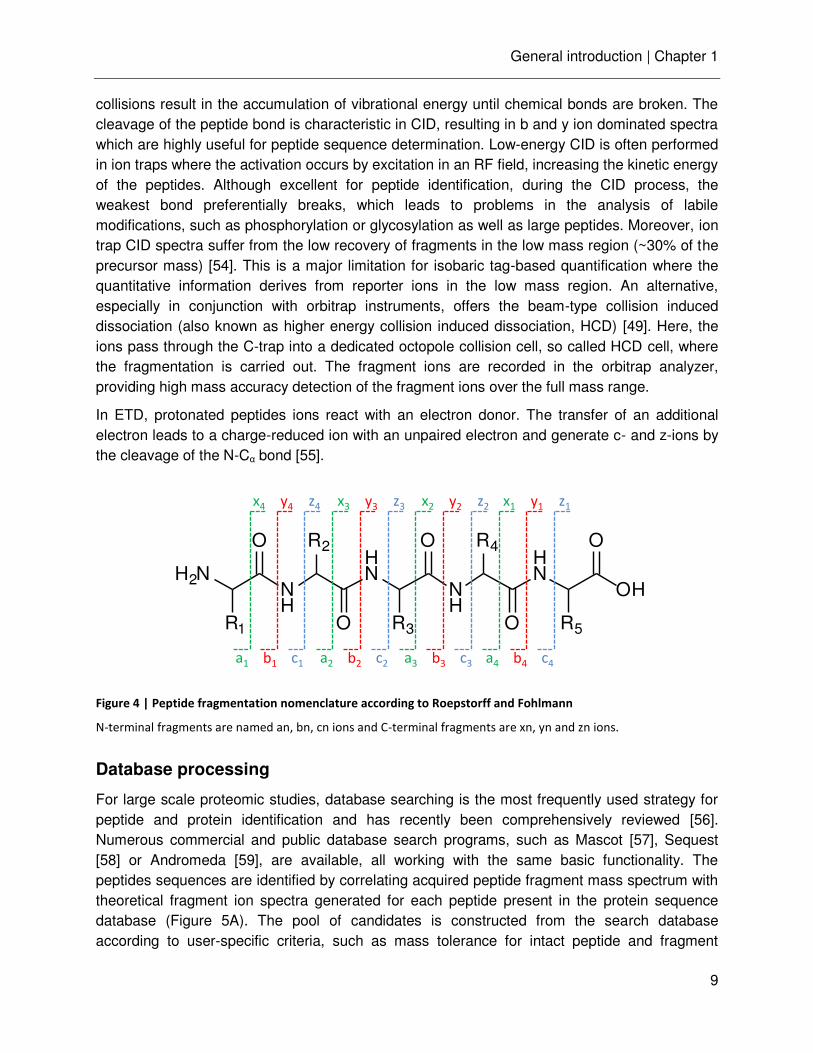
A variety of fragmentation techniques are employed in tandem mass spectrometry, among them collision induced dissociation (CID) and electron transfer dissociation (ETD) are the most common ones in proteomics research. Depending on the mechanism of fragmentation, the peptide backbone can principally break at three types of bond and consequently generate different fragment ions. The nomenclature of the resulting peptide fragments was first introduced by Roepstorff and Fohlmann [52] and later modified by Johnson et al. [53] (Figure 4). Fragment ions which contain the N-terminal side of the peptide are termed as a, b, and c ions, while C-terminal fragments are termed x, y, z.
Collision induced dissociation remains the most commonly employed activation techniques. In CID, peptides fragment by collision with inert gas molecules (N2, He, Ar). These multiple
General introduction | Chapter 1
9
collisions result in the accumulation of vibrational energy until chemical bonds are broken. The cleavage of the peptide bond is characteristic in CID, resulting in b and y ion dominated spectra which are highly useful for peptide sequence determination. Low-energy CID is often performed in ion traps where the activation occurs by excitation in an RF field, increasing the kinetic energy of the peptides. Although excellent for peptide identification, during the CID process, the weakest bond preferentially breaks, which leads to problems in the analysis of labile modifications, such as phosphorylation or glycosylation as well as large peptides. Moreover, ion trap CID spectra suffer from the low recovery of fragments in the low mass region (~30% of the precursor mass) [54]. This is a major limitation for isobaric tag-based quantification where the quantitative information derives from reporter ions in the low mass region. An alternative, especially in conjunction with orbitrap instruments, offers the beam-type collision induced dissociation (also known as higher energy collision induced dissociation, HCD) [49]. Here, the ions pass through the C-trap into a dedicated octopole collision cell, so called HCD cell, where the fragmentation is carried out. The fragment ions are recorded in the orbitrap analyzer, providing high mass accuracy detection of the fragment ions over the full mass range.
In ETD, protonated peptides ions react with an electron donor. The transfer of an additional electron leads to a charge-reduced ion with an unpaired electron and generate c- and z-ions by the cleavage of the N-Cα bond [55].
Figure 4 | Peptide fragmentation nomenclature according to Roepstorff and Fohlmann
N-terminal fragments are named an, bn, cn ions and C-terminal fragments are xn, yn and zn ions.
Database processing
For large scale proteomic studies, database searching is the most frequently used strategy for peptide and protein identification and has recently been comprehensively reviewed [56]. Numerous commercial and public database search programs, such as Mascot [57], Sequest [58] or Andromeda [59], are available, all working with the same basic functionality. The peptides sequences are identified by correlating acquired peptide fragment mass spectrum with theoretical fragment ion spectra generated for each peptide present in the protein sequence database (Figure 5A). The pool of candidates is constructed from the search database according to user-specific criteria, such as mass tolerance for intact peptide and fragment
H2N
R1
NH
HN
NH
O OR2
R3
R4HN
OH
O O
O
R5
a1 b1 c1 a2 b2 c2 a3 b3 c3 a4 b4 c4
x4 y4 z4 x3 y3 z3 x2 y2 z2 x1 y1 z1
Chapter 1 | General introduction
10
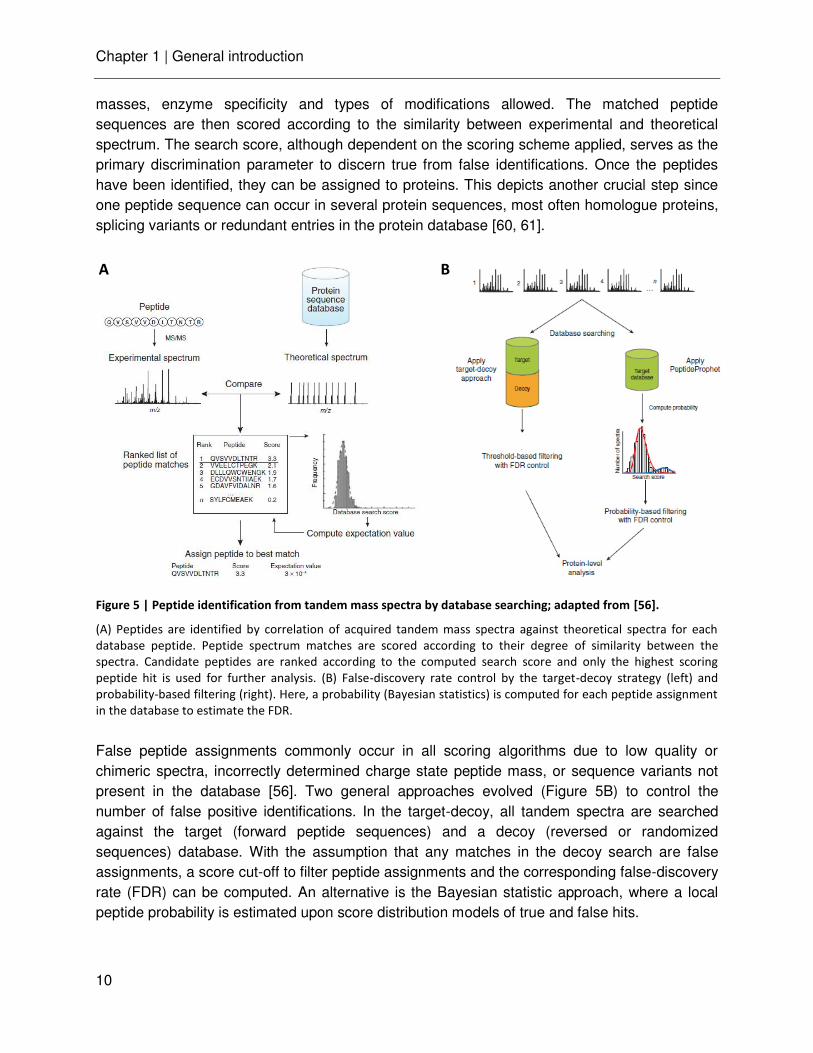
masses, enzyme specificity and types of modifications allowed. The matched peptide sequences are then scored according to the similarity between experimental and theoretical spectrum. The search score, although dependent on the scoring scheme applied, serves as the primary discrimination parameter to discern true from false identifications. Once the peptides have been identified, they can be assigned to proteins. This depicts another crucial step since one peptide sequence can occur in several protein sequences, most often homologue proteins, splicing variants or redundant entries in the protein database [60, 61].
Figure 5 | Peptide identification from tandem mass spectra by database searching; adapted from [56].
(A) Peptides are identified by correlation of acquired tandem mass spectra against theoretical spectra for each
database peptide. Peptide spectrum matches are scored according to their degree of similarity between the
spectra. Candidate peptides are ranked according to the computed search score and only the highest scoring
peptide hit is used for further analysis. (B) False-discovery rate control by the target-decoy strategy (left) and
probability-based filtering (right). Here, a probability (Bayesian statistics) is computed for each peptide assignment
in the database to estimate the FDR.
False peptide assignments commonly occur in all scoring algorithms due to low quality or chimeric spectra, incorrectly determined charge state peptide mass, or sequence variants not present in the database [56]. Two general approaches evolved (Figure 5B) to control the number of false positive identifications. In the target-decoy, all tandem spectra are searched against the target (forward peptide sequences) and a decoy (reversed or randomized sequences) database. With the assumption that any matches in the decoy search are false assignments, a score cut-off to filter peptide assignments and the corresponding false-discovery rate (FDR) can be computed. An alternative is the Bayesian statistic approach, where a local peptide probability is estimated upon score distribution models of true and false hits.
A B

General introduction | Chapter 1
11
Mass spectrometry-based quantitative proteomics
Mass spectrometry-based proteomics has become increasingly quantitative and a multitude of techniques for relative and absolute quantification have been developed for this purpose (Figure 6) [14, 15, 62]. Quantitative proteomics workflows can be generally divided into methods using stable isotope labeling and label-free methods. In the former approach, introduced heavy isotopes induce a mass shift in the differentially labeled peptides that can be recognized by the mass spectrometer and at the same time serves as the basis of quantification. Label-free approaches instead compare the mass spectrometric response (e.g. signal intensity, number of acquired spectra) of two or more separate analyses.
Figure 6 | Common quantitative mass spectrometry workflows; adapted from [14, 15].
Boxes in blue and yellow represent two experimental conditions. Horizontal lines indicate when samples are
combined. Dashed lines indicate points at which experimental variation and thus quantification errors can occur.
Stable isotope labeling is based on the stable isotope dilution theory that states that the physiochemical properties of the labeled and native version of a peptide are identical and thus they behave identical during sample preparation and mass spectrometric analysis. Therefore, two (or more) samples can be combined during sample processing and, given the mass shift introduced by the heavy isotopes of the label, relative quantification is achieved by comparing their respective signal intensities. Isotope labels can be introduced metabolically (e.g. SILAC [63]), chemically (e.g. iTRAQ [64], TMT [65], ICAT [66], dimethyl labeling [67]) or enzymatically (18O labeling [68]) at protein or peptide level.
Chemical labeling approaches have become widely used in proteomics since the tag is
Chapter 1 | General introduction
12
introduced after biosynthesis and therefore, unlike metabolic tagging, the method can be applied to all kinds of samples. Perhaps most popular at this time are isobaric tags, such as tandem mass tags (TMT) and isobaric tags for absolute and relative quantification (iTRAQ), both of which target primary amines of the peptide/ protein N-terminus and the ε-amino group of lysine using NHS chemistry. The reagents are designed such that the differentially labeled peptides have identical mass in the precursor ions spectra. The quantitative information derives upon fragmentation from the differentially isotope encoded reporter ions in the lower mass region of the tandem mass spectra. The main advantage of isobaric reagents is that they allow quantification with high sample multiplexity [69, 70] in the same MS analysis without increasing the complexity of LC separation or precursor mass spectra. However, a common problem in isobaric labeling strategies is the interference of the reporter ion signal with near isobaric ions and co-isolated peptides that may distort the quantification accuracy. Recently, several strategies to overcome this issue have been developed (see also Chapter 3) [71-75]. Alongside the isobaric labeling strategies, dimethyl labeling offers an alternative. Here, the primary amine groups of the peptides are labeled with formaldehyde via reductive amination. The relative quantification is achieved by integration of the MS1 signal of the ‘heavy’ and ‘light’ labeled peptides in the survey scan. The reaction is fast and specific, and the reagents are inexpensive, which makes the method attractive. However, deuterated formaldehyde is used to achieve a sufficient mass shift of 4 Da, which can result in small retention time differences during LC separation.
Currently two fundamentally different label-free quantification strategies can be distinguished: intensity-based and spectral counting. The second approach is based on the empirical observation that the higher the amount protein in the sample, the more spectrum matches can be obtained for a certain protein. Intensity-based quantification employs the integrated area under the curve of extracted ion chromatograms (XIC) [76] of a certain peptide for gaining the quantitative information. Peptide identification is subsequently based on the tandem mass spectrum, which is acquired during the same MS analysis. Relative quantification is achieved by the comparison of the same peptide signal between two or more experiments. Moreover, LC alignment software tools can optimize the chromatographic profiles of peptides [77, 78] and improve reproducibility and sample coverage. A main feature of intensity-based label-free quantification is that there are, in principle, no limits to the number of samples for comparison. Also, a good quantitative accuracy and high dynamic range can be achieved, but at the expense of data acquisition and analysis time.
The aforementioned methods suit well for the relative quantification of proteins between samples but also absolute quantification can be achieved with spiked in isotopic labeled peptides [79, 80] and label-free approaches [81-83].
Chemical proteomics
The ability to quantitatively measure the changes of proteins and their various isoforms to a depth of 4-10,000 proteins and across a dynamic range of 4-6 orders of magnitude represents an important advance in state-of-the-art proteomics [10, 11]. However, the abundance of a
General introduction | Chapter 1
13
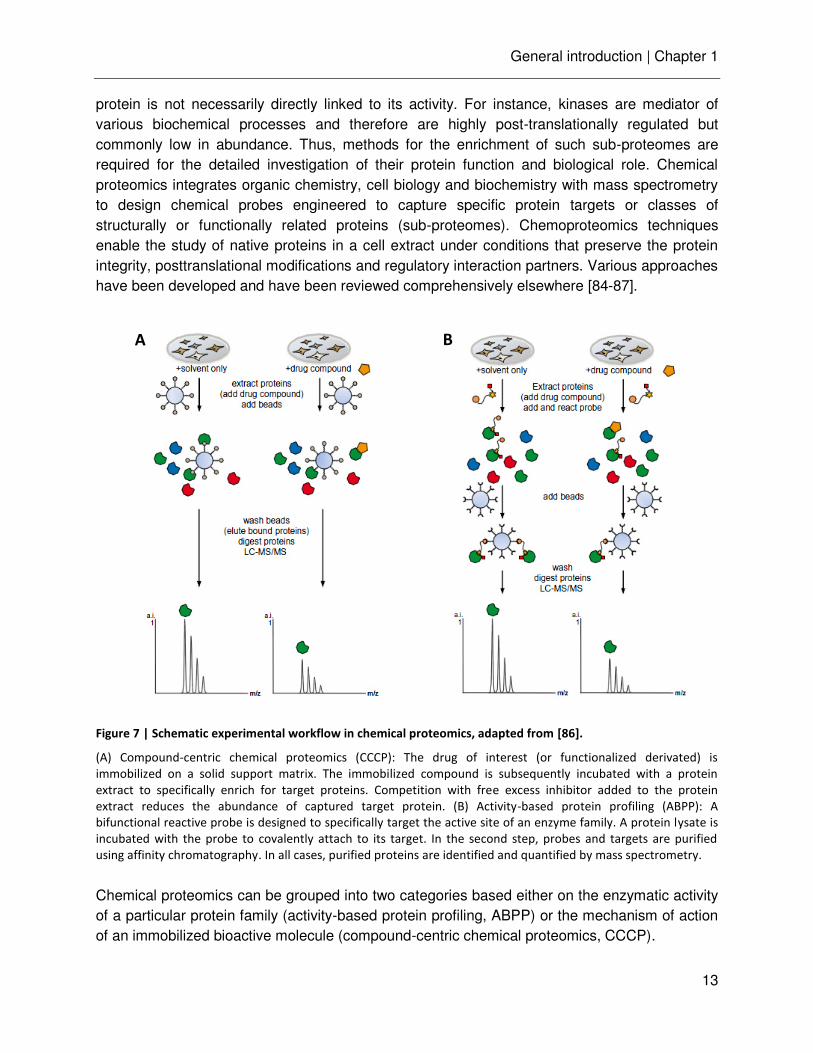
protein is not necessarily directly linked to its activity. For instance, kinases are mediator of various biochemical processes and therefore are highly post-translationally regulated but commonly low in abundance. Thus, methods for the enrichment of such sub-proteomes are required for the detailed investigation of their protein function and biological role. Chemical proteomics integrates organic chemistry, cell biology and biochemistry with mass spectrometry to design chemical probes engineered to capture specific protein targets or classes of structurally or functionally related proteins (sub-proteomes). Chemoproteomics techniques enable the study of native proteins in a cell extract under conditions that preserve the protein integrity, posttranslational modifications and regulatory interaction partners. Various approaches have been developed and have been reviewed comprehensively elsewhere [84-87].
Figure 7 | Schematic experimental workflow in chemical proteomics, adapted from [86].
(A) Compound-centric chemical proteomics (CCCP): The drug of interest (or functionalized derivated) is
immobilized on a solid support matrix. The immobilized compound is subsequently incubated with a protein
extract to specifically enrich for target proteins. Competition with free excess inhibitor added to the protein
extract reduces the abundance of captured target protein. (B) Activity-based protein profiling (ABPP): A
bifunctional reactive probe is designed to specifically target the active site of an enzyme family. A protein lysate is
incubated with the probe to covalently attach to its target. In the second step, probes and targets are purified
using affinity chromatography. In all cases, purified proteins are identified and quantified by mass spectrometry.
Chemical proteomics can be grouped into two categories based either on the enzymatic activity of a particular protein family (activity-based protein profiling, ABPP) or the mechanism of action of an immobilized bioactive molecule (compound-centric chemical proteomics, CCCP).
A B
Chapter 1 | General introduction
14
In activity-based approaches, a bifunctional reactive probe is designed to specifically target the active site of an enzyme class and is used as an affinity tool to purify these enzymes (Figure 7A) [88].
In the compound centric or affinity-based profiling, the drug or compound of interest is immobilized covalently (or via a biotin tag) on a solid support matrix (Figure 7B). The immobilized compound is then incubated with a protein sample to specifically enrich for target proteins that are subsequently analyzed by LC-MS/MS. The chemical synthesis of a suitable functionalized analogue (typically comprising an amino, carboxyl or hydroxyl group) of the compound of choice is commonly required. For this purpose, information of the structure activity relationship (SAR) of a compound is beneficial to ensure that the modified molecule retains similar target binding properties. Ideally, the affinity probe is a potent binder of the target proteins with Kd values in the nanomolar range. This allows the better removal of unspecific background proteins with stringent purification methods without losing lower abundant specific binders. The compound-centric chemoproteomic approach has successfully been applied to diverse target classes such as protein kinases [89-94], histone acetylases [95], ATP/ADP binding proteins [96], cyclic nucleotides [97, 98] and phosphatidylinositols [99, 100]. Applications of this approach are mainly in drug discovery [89, 101, 102], but CCCP has also been used to characterize the function of the target protein within its biological context [103-105].
Kinase profiling
Protein kinases are involved in the regulation of many cellular processes and aberrant kinase signaling has been recognized in a variety of human diseases. The role of kinases is further discussed in a later section. As kinases are often low abundant signaling proteins, the selective enrichment of this target class is a crucial step when studying their biological function. To date, various strategies for kinase profiling have been developed [106, 107].
Conventionally the activation status of a kinase has been determined based on its activity in an in vitro assay. Phospho-specific antibodies in combination with western blotting, or enzyme-linked immunosorbent assay (ELISA) formats allow the high-throughput screening for kinase activity in classic pathway analysis tools [108]. In kinase peptide substrate arrays, immobilized peptides are incubated with one or multiple upstream kinases. Phosphorylation is subsequently determined by phospho-imaging (radioactive [33P]ATP) or fluorescence microscopy (anti-phospho antibodies) [107]. A main drawback of these strategies is the lack of specific antibodies and/or specific substrates [109].
Chemical proteomics techniques in conjunction with mass spectrometry have been demonstrated to be a powerful tool [89, 91, 110, 111]. As introduced above, a suitable ATP-competitive kinase inhibitor (affinity compound) is covalently immobilized on a biocompatible matrix such as sepharose and purifies kinases from a complex lysate by competitively binding to the ATP pocket within the kinase domain. The main advantage of chemical proteomics is that it enables an unbiased study of native kinases within their cellular environment. This means, the proteins kinases occur at natural abundances, post-translationally modified and in the presence
General introduction | Chapter 1
15
of in vivo cofactors and interaction partners.
One such successful approach is the kinobead technology introduced by Bantscheff et al. [89]. Kinobeads make use of several immobilized broad range ATP-competitive kinase inhibitors for the specific enrichment of a large subset of the native kinome. Apart from kinases, over 2000 additional ATP and nucleotide dependent proteins, such as chaperones, helicases, ATPases, motor proteins, transporters and metabolic enzymes, share a similar structural domain and frequently bind to the beads. In conjunction with quantitative mass spectrometry, kinobeads enable the differential profiling of kinase expression in cells or tissues [103, 105]. When configured as competition binding assay, it can be used to determine the selectivity of small molecule kinase inhibitors against hundreds of proteins in a single experiment [89]. For this application, different concentrations of the drug are titrated into protein extracts or cell culture that is subsequently subjected to kinase enrichment. The free drug in the lysate competes with the affinity matrix for binding into the ATP binding pocket. Kinase targets that bind the inhibitor show a dose dependent reduction in binding to the kinobeads, whereas non-targets are unaffected. Despite the conceptual advantages, kinobeads also have shortcomings, notably incomplete coverage of the kinome (see also Chapter 4). In addition to the presence of kinases, their regulation and catalytic activity are relevant for their physiological function. Recent studies therefore combined chemical and phosphoproteomics for comparative large-scale kinome profiling, characterizing the activity of kinase inhibitor drugs in disease or kinome signaling across the cell cycle [92, 93, 112].
Kinases and their role in cancer
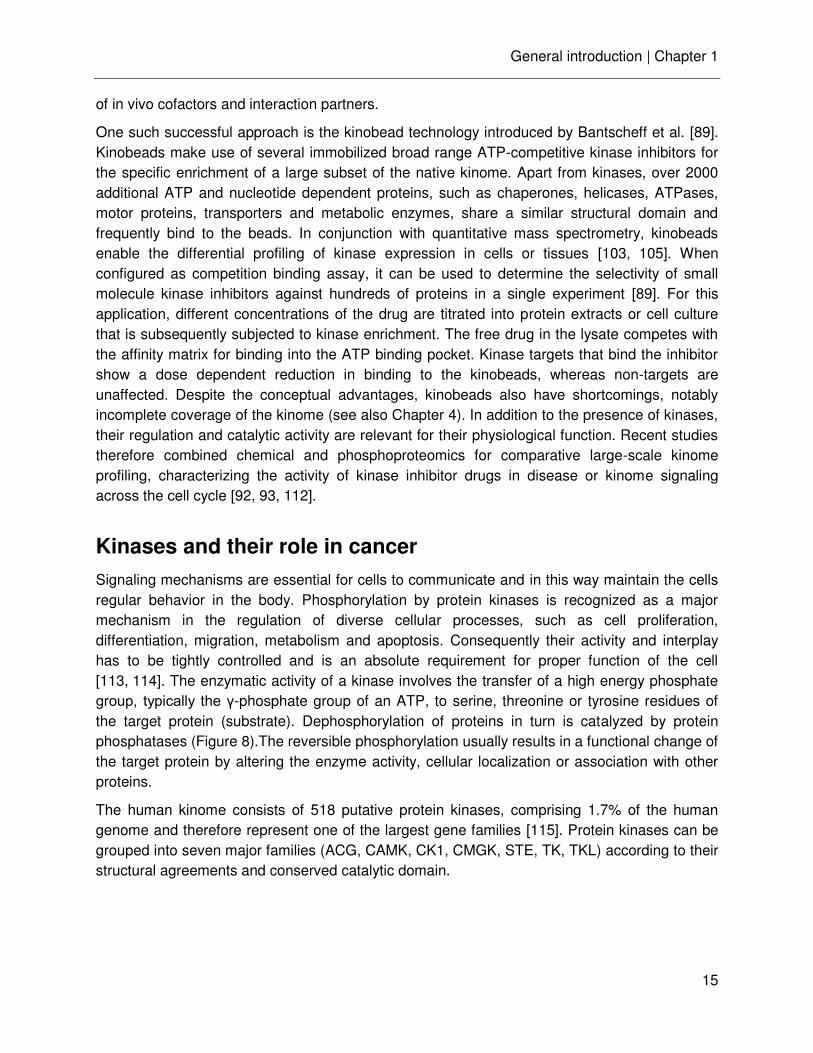
Signaling mechanisms are essential for cells to communicate and in this way maintain the cells regular behavior in the body. Phosphorylation by protein kinases is recognized as a major mechanism in the regulation of diverse cellular processes, such as cell proliferation, differentiation, migration, metabolism and apoptosis. Consequently their activity and interplay has to be tightly controlled and is an absolute requirement for proper function of the cell [113, 114]. The enzymatic activity of a kinase involves the transfer of a high energy phosphate group, typically the -phosphate group of an ATP, to serine, threonine or tyrosine residues of the target protein (substrate). Dephosphorylation of proteins in turn is catalyzed by protein phosphatases (Figure 8).The reversible phosphorylation usually results in a functional change of the target protein by altering the enzyme activity, cellular localization or association with other proteins.
The human kinome consists of 518 putative protein kinases, comprising 1.7% of the human genome and therefore represent one of the largest gene families [115]. Protein kinases can be grouped into seven major families (ACG, CAMK, CK1, CMGK, STE, TK, TKL) according to their structural agreements and conserved catalytic domain.
Chapter 1 | General introduction
16
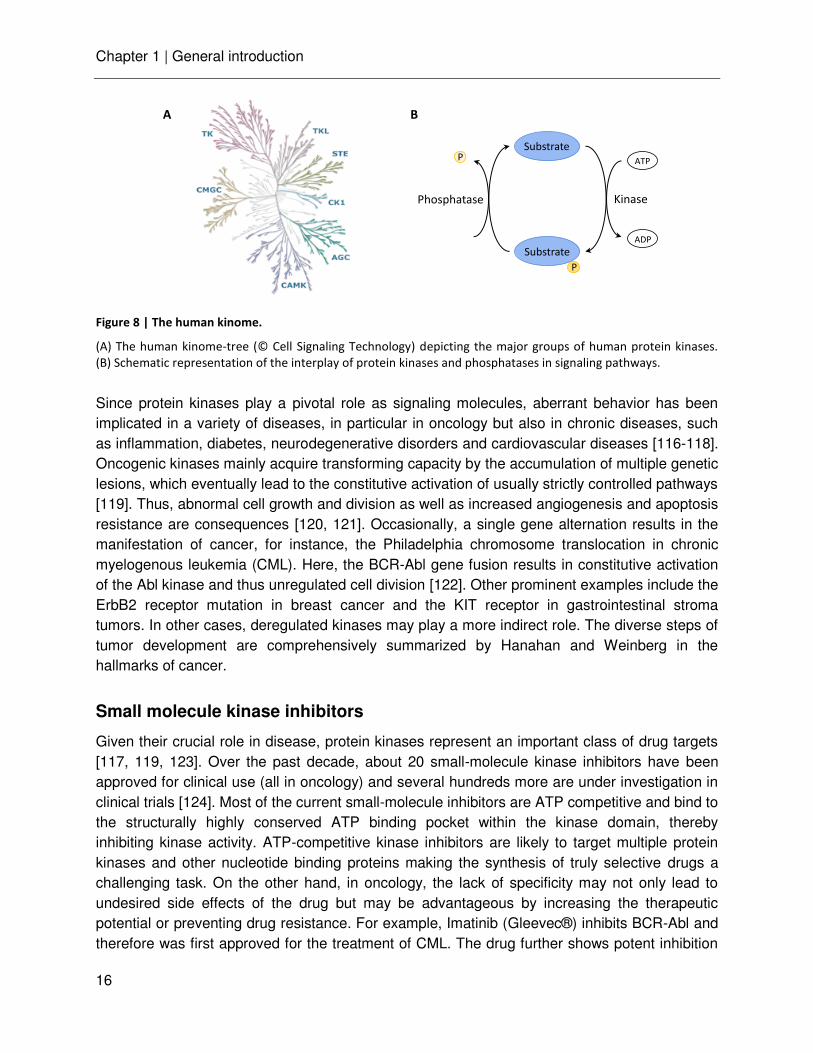
Figure 8 | The human kinome.
(A) The human kinome-tree (© Cell Signaling Technology) depicting the major groups of human protein kinases.
(B) Schematic representation of the interplay of protein kinases and phosphatases in signaling pathways.
Since protein kinases play a pivotal role as signaling molecules, aberrant behavior has been implicated in a variety of diseases, in particular in oncology but also in chronic diseases, such as inflammation, diabetes, neurodegenerative disorders and cardiovascular diseases [116-118]. Oncogenic kinases mainly acquire transforming capacity by the accumulation of multiple genetic lesions, which eventually lead to the constitutive activation of usually strictly controlled pathways [119]. Thus, abnormal cell growth and division as well as increased angiogenesis and apoptosis resistance are consequences [120, 121]. Occasionally, a single gene alternation results in the manifestation of cancer, for instance, the Philadelphia chromosome translocation in chronic myelogenous leukemia (CML). Here, the BCR-Abl gene fusion results in constitutive activation of the Abl kinase and thus unregulated cell division [122]. Other prominent examples include the ErbB2 receptor mutation in breast cancer and the KIT receptor in gastrointestinal stroma tumors. In other cases, deregulated kinases may play a more indirect role. The diverse steps of tumor development are comprehensively summarized by Hanahan and Weinberg in the hallmarks of cancer.
Small molecule kinase inhibitors
Given their crucial role in disease, protein kinases represent an important class of drug targets [117, 119, 123]. Over the past decade, about 20 small-molecule kinase inhibitors have been approved for clinical use (all in oncology) and several hundreds more are under investigation in clinical trials [124]. Most of the current small-molecule inhibitors are ATP competitive and bind to the structurally highly conserved ATP binding pocket within the kinase domain, thereby inhibiting kinase activity. ATP-competitive kinase inhibitors are likely to target multiple protein kinases and other nucleotide binding proteins making the synthesis of truly selective drugs a challenging task. On the other hand, in oncology, the lack of specificity may not only lead to undesired side effects of the drug but may be advantageous by increasing the therapeutic potential or preventing drug resistance. For example, Imatinib (Gleevec®) inhibits BCR-Abl and therefore was first approved for the treatment of CML. The drug further shows potent inhibition
Substrate
Substrate
KinasePhosphatase
ATP
P
P
ADP
A B
General introduction | Chapter 1
17
of c-Kit and PDGFR and hence is also used in the treatment of gastrointestinal tumors (GIST) and myeloproliferative diseases [125].
In contrast, allosteric inhibitors interact with a structural domain outside the ATP-binding site. This mode of inhibition tends to be highly selective since the inhibitor utilizes binding sites and regulatory mechanisms unique to a particular kinase. As an example, the mode of action of some AKT inhibitors in clinical trials is dependent on the pleckstrin homology (PH) domain. This domain is important for the recruitment of AKT to the plasma membrane via interaction with phosphoinositides, the initial step for activation of AKT kinase activity. A number of inhibitors have been developed that target the PH domain and thereby hinder the activation of AKT [126]. One of them is MK-2206 [127] which is currently tested in numerous phase I or phase II studies.
Regardless whether the kinase inhibitor acts in an ATP-competitive or allosteric manner, the determination of an inhibitor’s selectivity is of central importance for the correct interpretation of its biological effects.
AKT kinase and signaling
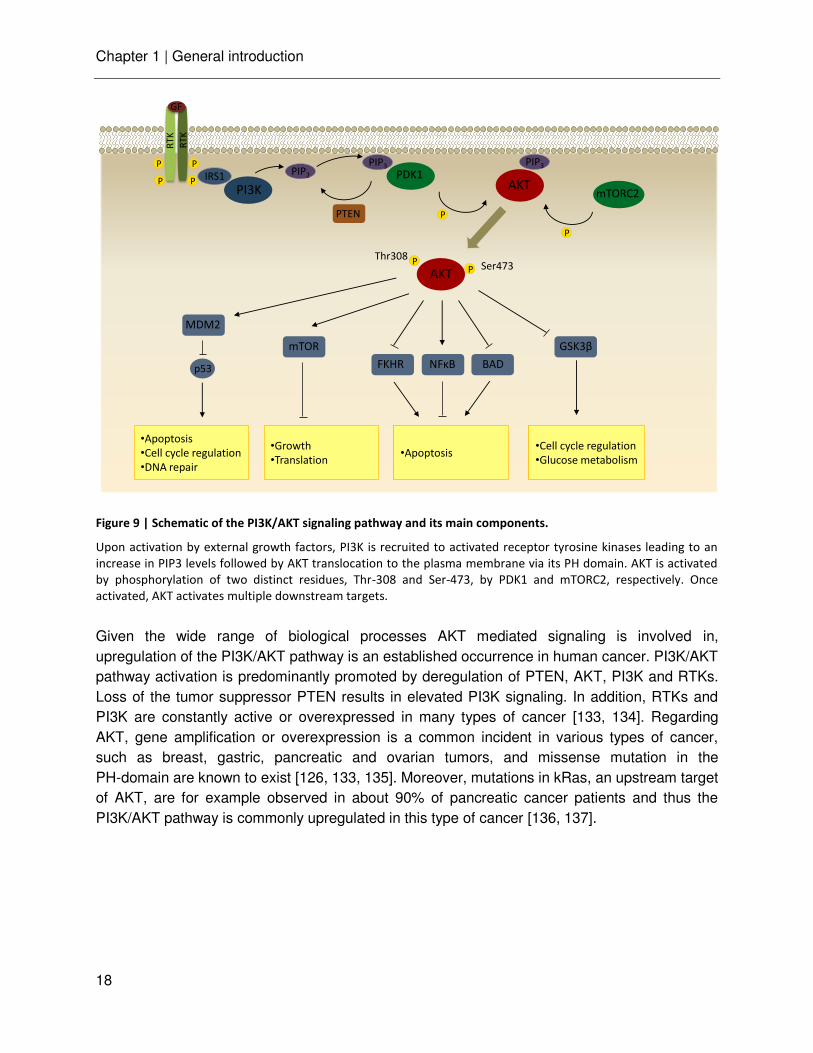
To illustrate the function of protein kinases in more detail, the following section describes AKT as a central node within the PI3K/AKT signaling cascade. The serine/threonine kinase AKT, also known as protein kinase B, belongs to the AGC kinase family and is a key mediator of cell growth, proliferation and apoptosis [126, 128]. There are three known isoforms of AKT1, AKT2, AKT3, all highly homologous to each other but with distinct functions [129]. Structurally, these homologues contain three functional domains: a N-terminal PH-domain, a central catalytic kinase domain and a C-terminal hydrophobic regulatory domain. The activation of AKT occurs within the PI3K signaling pathway (Figure 9). Growth factor or cytokine induced dimerization of receptor tyrosine kinases (RTK) leads to their autophosphorylation. The activated RTK in turn activates PI3K (phosphatidylinositol-3 kinase) either by direct binding or indirectly via IRS1. PI3K converts phosphatidylinositol (4,5)-bisphosphate (PIP2) to phosphatidylinositol (3,4,5)-trisphosphate (PIP3), which recruits AKT and PDK1 via their PH domain to the plasma membrane. AKT then becomes activated via phosphorylation of two key residues, Ser 473 and Thr 308, by the mTor complex 2 (mTORC2) and PDK1, respectively [130]. Once activated, AKT acts on diverse downstream targets and thereby is involved in cell proliferation, survival, cell growth, glucose metabolism, cell mortality and angiogenesis [131, 132]. For example, the PI3K/AKT pathway promotes cell survival by the inactivation of several proapoptotic factors, including Bcl-2-associated death promoter (BAD), procaspase-9 and Forkhead (FKHR) transcription factors. Moreover, the activation of the IκB kinase (IKK) leads to the expression of survival factors. The inactivation of glycogen synthase kinase 3 beta (GSK3b) by AKT enhances the cyclinD1 level and drives cell cycle progression. In addition, it stimulates glycolysis, lipid production and glucose uptake in response to insulin [128].
Chapter 1 | General introduction
18
Figure 9 | Schematic of the PI3K/AKT signaling pathway and its main components.
Upon activation by external growth factors, PI3K is recruited to activated receptor tyrosine kinases leading to an
increase in PIP3 levels followed by AKT translocation to the plasma membrane via its PH domain. AKT is activated
by phosphorylation of two distinct residues, Thr-308 and Ser-473, by PDK1 and mTORC2, respectively. Once
activated, AKT activates multiple downstream targets.
Given the wide range of biological processes AKT mediated signaling is involved in, upregulation of the PI3K/AKT pathway is an established occurrence in human cancer. PI3K/AKT pathway activation is predominantly promoted by deregulation of PTEN, AKT, PI3K and RTKs. Loss of the tumor suppressor PTEN results in elevated PI3K signaling. In addition, RTKs and PI3K are constantly active or overexpressed in many types of cancer [133, 134]. Regarding AKT, gene amplification or overexpression is a common incident in various types of cancer, such as breast, gastric, pancreatic and ovarian tumors, and missense mutation in the PH-domain are known to exist [126, 133, 135]. Moreover, mutations in kRas, an upstream target of AKT, are for example observed in about 90% of pancreatic cancer patients and thus the PI3K/AKT pathway is commonly upregulated in this type of cancer [136, 137].
P
P
P
PPIP2
PIP3 PIP3
AKTPI3K
PDK1IRS1
PTEN
mTORC2
P
P
AKTP
P
MDM2
p53
mTOR
FKHR NFκB BAD
GSK3β
•Apoptosis
•Cell cycle regulation
•DNA repair
•Growth
•Translation•Apoptosis
•Cell cycle regulation
•Glucose metabolism
GF
RT
K
RT
K
Ser473Thr308
General introduction | Chapter 1
19
Aim and outline of this thesis
Protein kinases are pivotal regulators of cell signaling that modulate their function and activity through specific phosphorylation events. Major diseases, such as cancer, have been recognized to be caused by deregulated kinase signaling. Knowledge about kinases involved in these signaling pathways and about the selectivity of therapeutic kinase inhibitor drugs improves the understanding of critical cellular pathways and is important for the correct interpretation of their biological and pharmacological effects. Chemical proteomics techniques in combination with quantitative mass spectrometry have emerged as important tools for the large scale characterization of kinase signaling and drug selectivity. The research described in this thesis comprises several projects with the common goal to study kinase signaling in cancer.
In the first two chapters, quantitative mass spectrometry methods, as the analytical technique of choice throughout this thesis, were systematically evaluated and optimized for the application of target profiling by kinase-centric chemical proteomics. In chapter 2 a novel state of the art hybrid linear ion trap high field Orbitrap mass spectrometer, the Orbitrap Elite, was characterized in detail for proteomic application. The performance of a number of data-dependent acquisition scan types enabled on this instrument was evaluated. The main results obtained from the analysis of complex digests of human cell lines showed that the very high resolution and scan speed available on this instrument significantly improved the success of protein identification, confirming that the Orbitrap Elite is a valuable and versatile tool for mass spectrometry based proteomics.
Chapter 3 focuses on the establishment and optimization of mass spectrometry based quantification strategies. Isobaric tagging using reagents such as TMT are popular tools for mass spectrometry based quantitative proteomics. Here, a new mode of data processing was developed to improve the identification of reporter ions in high resolution tandem mass spectra by intra-spectrum mass differences resulting in more accurate quantification. Moreover, relative quantification by isobaric mass tags was compared to an intensity-based label-free quantification for selectivity profiling of small-molecule kinase inhibitors. The results suggested better characteristics of the label-free approach for that particular kind of application.
Chapter 4 describes the development of a new affinity probe targeting AKT and many other protein kinases to expand the kinome coverage of the published kinobeads. Together with some other improvements, the probe was applied to the selectivity profiling of several AKT inhibitors. The results provided detailed information about affinity and selectivity of the drugs, allowing a better interpretation of their pharmacological and systems biological effects.
In the last chapter, established chemical proteomics and phosphoproteomics technologies in conjunction with quantitative mass spectrometry was used for the profiling of murine Kras-induced pancreatic ductal adenocarcinoma cell lines in respect of their responsiveness to the AKT inhibitor triciribine. It was shown that this approach can indeed be used for studying signaling pathways. Several known pathways were detected to be differentially regulated in sensitive cell lines, indicating again the high diversity of tumor biology.
Chapter 1 | General introduction
20
Abbreviations
ABPP activity-based protein profiling
CCCP Compound-centric chemical proteomics
CID collision induced dissociation
CLM chronic myelogenous leukemia
CRM charge residue model
ESI electrospray ionization
ETD electron transfer dissociation
FASP filter-aided sample preparation
FDR false-discovery rate
FT-ICR Fourier transform ion cyclotron mass spectrometer
GIST gastrointestinal tumors
HCD higher energy collision induced dissociation
HILIC hydrophilic interaction chromatography
ICAT isotope-coded affinity tag
IEF isoelectric focusing
IEM ion evaporation model
iTRAQ isobaric tag for relative and absolute quantitation
LC liquid chromatography
LC-MS/MS liquid chromatography coupled to tandem mass spectrometry
MALDI matrix-assisted laser desorption/ ionization
MS mass spectrometry
PH pleckstrin homology domain
SAR structure activity relationship
SAX strong anion exchange chromatography
SCX strong cation exchange chromatography
SILAC stable isotope labeling with amino acids in cell culture
TMT tandem mass tag
TOF time-of-flight
XIC extracted ion chromatogram

General introduction | Chapter 1
21
References
1. Wilkins, M. R.; Pasquali, C.; Appel, R. D.; Ou, K.; Golaz, O.; Sanchez, J. C.; Yan, J. X.; Gooley, A. A.; Hughes, G.; Humphery-Smith, I.; Williams, K. L.; Hochstrasser, D. F., From proteins to proteomes: large scale protein identification by two-dimensional electrophoresis and amino acid analysis. Biotechnology (N Y) 1996, 14 (1), 61-5.
2. Wasinger, V. C.; Cordwell, S. J.; Cerpa-Poljak, A.; Yan, J. X.; Gooley, A. A.; Wilkins, M. R.; Duncan, M. W.; Harris, R.; Williams, K. L.; Humphery-Smith, I., Progress with gene-product mapping of the Mollicutes: Mycoplasma genitalium. Electrophoresis 1995, 16 (7), 1090-4.
3. Mann, M.; Jensen, O. N., Proteomic analysis of post-translational modifications. Nat Biotechnol 2003, 21 (3), 255-61.
4. Ong, S. E.; Mittler, G.; Mann, M., Identifying and quantifying in vivo methylation sites by heavy methyl SILAC. Nat Methods 2004, 1 (2), 119-26.
5. Denison, C.; Kirkpatrick, D. S.; Gygi, S. P., Proteomic insights into ubiquitin and ubiquitin-like proteins. Curr Opin Chem Biol 2005, 9 (1), 69-75.
6. Zaia, J., Mass spectrometry of oligosaccharides. Mass Spectrom Rev 2004, 23 (3), 161-227.
7. Alberts, B., The cell as a collection of protein machines: preparing the next generation of molecular biologists. Cell 1998, 92 (3), 291-4.
8. Blackstock, W. P.; Weir, M. P., Proteomics: quantitative and physical mapping of cellular proteins. Trends Biotechnol 1999, 17 (3), 121-7.
9. O'Farrell, P. H., High resolution two-dimensional electrophoresis of proteins. J Biol Chem 1975, 250 (10), 4007-21.
10. Beck, M.; Schmidt, A.; Malmstroem, J.; Claassen, M.; Ori, A.; Szymborska, A.; Herzog, F.; Rinner, O.; Ellenberg, J.; Aebersold, R., The quantitative proteome of a human cell line. Mol Syst Biol 2011, 7, 549.
11. Nagaraj, N.; Wisniewski, J. R.; Geiger, T.; Cox, J.; Kircher, M.; Kelso, J.; Paabo, S.; Mann, M., Deep proteome and transcriptome mapping of a human cancer cell line. Mol Syst Biol 2011, 7, 548.
12. Aebersold, R.; Mann, M., Mass spectrometry-based proteomics. Nature 2003, 422 (6928), 198-207.
13. Mallick, P.; Kuster, B., Proteomics: a pragmatic perspective. Nat Biotechnol 2010, 28 (7), 695-709.
14. Bantscheff, M.; Schirle, M.; Sweetman, G.; Rick, J.; Kuster, B., Quantitative mass spectrometry in proteomics: a critical review. Anal Bioanal Chem 2007, 389 (4), 1017-31.
15. Bantscheff, M.; Lemeer, S.; Savitski, M. M.; Kuster, B., Quantitative mass spectrometry in proteomics: critical review update from 2007 to the present. Anal Bioanal Chem 2012, 404 (4), 939-65.
16. Ong, S. E.; Mann, M., Mass spectrometry-based proteomics turns quantitative. Nat Chem Biol 2005, 1 (5), 252-62.
17. Witze, E. S.; Old, W. M.; Resing, K. A.; Ahn, N. G., Mapping protein post-translational modifications with mass spectrometry. Nat Methods 2007, 4 (10), 798-806.

Chapter 1 | General introduction
22
18. Chait, B. T., Chemistry. Mass spectrometry: bottom-up or top-down? Science 2006, 314 (5796), 65-6.
19. Han, X.; Aslanian, A.; Yates, J. R., 3rd, Mass spectrometry for proteomics. Curr Opin Chem Biol 2008, 12 (5), 483-90.
20. Yates, J. R., 3rd; Kelleher, N. L., Top Down Proteomics. Anal Chem 2013.
21. Kelleher, N. L., Top-down proteomics. Anal Chem 2004, 76 (11), 197A-203A.
22. Olsen, J. V.; Ong, S. E.; Mann, M., Trypsin cleaves exclusively C-terminal to arginine and lysine residues. Mol Cell Proteomics 2004, 3 (6), 608-14.
23. Wisniewski, J. R.; Zougman, A.; Nagaraj, N.; Mann, M., Universal sample preparation method for proteome analysis. Nat Methods 2009, 6 (5), 359-62.
24. Steen, H.; Mann, M., The ABC's (and XYZ's) of peptide sequencing. Nat Rev Mol Cell Biol 2004, 5 (9), 699-711.
25. Kocher, T.; Swart, R.; Mechtler, K., Ultra-high-pressure RPLC hyphenated to an LTQ-Orbitrap Velos reveals a linear relation between peak capacity and number of identified peptides. Anal Chem 2011, 83 (7), 2699-704.
26. Yates, J. R.; Ruse, C. I.; Nakorchevsky, A., Proteomics by mass spectrometry: approaches, advances, and applications. Annu Rev Biomed Eng 2009, 11, 49-79.
27. Gale, D. C.; Smith, R. D., Small volume and low flow-rate electrospray lonization mass spectrometry of aqueous samples. Rapid Communications in Mass Spectrometry 1993, 7 (11), 1017-1021.
28. Thakur, S. S.; Geiger, T.; Chatterjee, B.; Bandilla, P.; Frohlich, F.; Cox, J.; Mann, M., Deep and highly sensitive proteome coverage by LC-MS/MS without prefractionation. Mol Cell Proteomics 2011, 10 (8), M110 003699.
29. Fenn, J. B.; Mann, M.; Meng, C. K.; Wong, S. F.; Whitehouse, C. M., Electrospray ionization for mass spectrometry of large biomolecules. Science 1989, 246 (4926), 64-71.
30. Karas, M.; Hillenkamp, F., Laser desorption ionization of proteins with molecular masses exceeding 10,000 daltons. Anal Chem 1988, 60 (20), 2299-301.
31. Wilm, M., Principles of electrospray ionization. Mol Cell Proteomics 2011, 10 (7), M111 009407.
32. Wilm, M., Mann, M., Electrospray and Taylor-Cone theory, Dole's beam of macromolecules at last? Int J Mass Spectrom Ion Process 1994, 136 (2–3), 167–180.
33. Iribarne, J. V., Thomson, B.A., On the evaporation of small ions from charged droplets. Journal of Chemical Physics 1976, 64 (6), 2287–2294.
34. Nguyen, S.; Fenn, J. B., Gas-phase ions of solute species from charged droplets of solutions. Proc Natl Acad Sci U S A 2007, 104 (4), 1111-7.
35. McDonnell, L. A.; Heeren, R. M., Imaging mass spectrometry. Mass Spectrom Rev 2007, 26 (4), 606-43.
36. Scigelova, M.; Makarov, A., Orbitrap mass analyzer--overview and applications in proteomics. Proteomics 2006, 6 Suppl 2, 16-21.
37. Zubarev, R. A.; Makarov, A., Orbitrap mass spectrometry. Anal Chem 2013, 85 (11), 5288-96.
General introduction | Chapter 1
23
38. Makarov, A., Electrostatic axially harmonic orbital trapping: a high-performance technique of mass analysis. Anal Chem 2000, 72 (6), 1156-62.
39. Hu, Q.; Noll, R. J.; Li, H.; Makarov, A.; Hardman, M.; Graham Cooks, R., The Orbitrap: a new mass spectrometer. J Mass Spectrom 2005, 40 (4), 430-43.
40. Makarov, A.; Denisov, E.; Lange, O., Performance evaluation of a high-field Orbitrap mass analyzer. J Am Soc Mass Spectrom 2009, 20 (8), 1391-6.
41. Michalski, A.; Damoc, E.; Lange, O.; Denisov, E.; Nolting, D.; Muller, M.; Viner, R.; Schwartz, J.; Remes, P.; Belford, M.; Dunyach, J. J.; Cox, J.; Horning, S.; Mann, M.; Makarov, A., Ultra high resolution linear ion trap Orbitrap mass spectrometer (Orbitrap Elite) facilitates top down LC MS/MS and versatile peptide fragmentation modes. Mol Cell Proteomics 2012, 11 (3), O111 013698.
42. Denisov, E.; Damoc, E.; Lange, O.; Makarov, A., Orbitrap mass spectrometry with resolving powers above 1,000,000. International Journal of Mass Spectrometry 2012, 325–327 (0), 80-85.
43. Olsen, J. V.; de Godoy, L. M.; Li, G.; Macek, B.; Mortensen, P.; Pesch, R.; Makarov, A.; Lange, O.; Horning, S.; Mann, M., Parts per million mass accuracy on an Orbitrap mass spectrometer via lock mass injection into a C-trap. Mol Cell Proteomics 2005, 4 (12), 2010-21.
44. Makarov, A.; Denisov, E.; Kholomeev, A.; Balschun, W.; Lange, O.; Strupat, K.; Horning, S., Performance evaluation of a hybrid linear ion trap/orbitrap mass spectrometer. Anal Chem 2006, 78 (7), 2113-20.
45. Schwartz, J. C.; Senko, M. W.; Syka, J. E., A two-dimensional quadrupole ion trap mass spectrometer. J Am Soc Mass Spectrom 2002, 13 (6), 659-69.
46. Second, T. P.; Blethrow, J. D.; Schwartz, J. C.; Merrihew, G. E.; MacCoss, M. J.; Swaney, D. L.; Russell, J. D.; Coon, J. J.; Zabrouskov, V., Dual-pressure linear ion trap mass spectrometer improving the analysis of complex protein mixtures. Anal Chem 2009, 81 (18), 7757-65.
47. Yates, J. R.; Cociorva, D.; Liao, L.; Zabrouskov, V., Performance of a linear ion trap-Orbitrap hybrid for peptide analysis. Anal Chem 2006, 78 (2), 493-500.
48. de Godoy, L. M.; Olsen, J. V.; Cox, J.; Nielsen, M. L.; Hubner, N. C.; Frohlich, F.; Walther, T. C.; Mann, M., Comprehensive mass-spectrometry-based proteome quantification of haploid versus diploid yeast. Nature 2008, 455 (7217), 1251-4.
49. Olsen, J. V.; Macek, B.; Lange, O.; Makarov, A.; Horning, S.; Mann, M., Higher-energy C-trap dissociation for peptide modification analysis. Nat Methods 2007, 4 (9), 709-12.
50. Phanstiel, D. H.; Brumbaugh, J.; Wenger, C. D.; Tian, S.; Probasco, M. D.; Bailey, D. J.; Swaney, D. L.; Tervo, M. A.; Bolin, J. M.; Ruotti, V.; Stewart, R.; Thomson, J. A.; Coon, J. J., Proteomic and phosphoproteomic comparison of human ES and iPS cells. Nat Methods 2011, 8 (10), 821-7.
51. Hahne, H.; Moghaddas Gholami, A.; Kuster, B., Discovery of O-GlcNAc-modified proteins in published large-scale proteome data. Mol Cell Proteomics 2012, 11 (10), 843-50.
52. Roepstorff, P.; Fohlman, J., Proposal for a common nomenclature for sequence ions in mass spectra of peptides. Biomed Mass Spectrom 1984, 11 (11), 601.
53. Johnson, R. S.; Martin, S. A.; Biemann, K.; Stults, J. T.; Watson, J. T., Novel fragmentation process of peptides by collision-induced decomposition in a tandem mass spectrometer:
Chapter 1 | General introduction
24
differentiation of leucine and isoleucine. Anal Chem 1987, 59 (21), 2621-5.
54. Cunningham, C., Jr.; Glish, G. L.; Burinsky, D. J., High amplitude short time excitation: a method to form and detect low mass product ions in a quadrupole ion trap mass spectrometer. J Am Soc Mass Spectrom 2006, 17 (1), 81-4.
55. Syka, J. E.; Coon, J. J.; Schroeder, M. J.; Shabanowitz, J.; Hunt, D. F., Peptide and protein sequence analysis by electron transfer dissociation mass spectrometry. Proc Natl Acad Sci U S A 2004, 101 (26), 9528-33.
56. Nesvizhskii, A. I.; Vitek, O.; Aebersold, R., Analysis and validation of proteomic data generated by tandem mass spectrometry. Nat Methods 2007, 4 (10), 787-97.
57. Perkins, D. N.; Pappin, D. J.; Creasy, D. M.; Cottrell, J. S., Probability-based protein identification by searching sequence databases using mass spectrometry data. Electrophoresis 1999, 20 (18), 3551-67.
58. Eng, J.; McCormack, A.; Yates, J., An approach to correlate tandem mass spectral data of peptides with amino acid sequences in a protein database. Journal of the American Society for Mass Spectrometry 1994, 5 (11), 976-989.
59. Cox, J.; Neuhauser, N.; Michalski, A.; Scheltema, R. A.; Olsen, J. V.; Mann, M., Andromeda: a peptide search engine integrated into the MaxQuant environment. J Proteome Res 2011, 10 (4), 1794-805.
60. Nesvizhskii, A. I.; Aebersold, R., Interpretation of shotgun proteomic data: the protein inference problem. Mol Cell Proteomics 2005, 4 (10), 1419-40.
61. Fitzgibbon, M.; Li, Q.; McIntosh, M., Modes of inference for evaluating the confidence of peptide identifications. J Proteome Res 2008, 7 (1), 35-9.
62. Wasinger, V. C.; Zeng, M.; Yau, Y., Current status and advances in quantitative proteomic mass spectrometry. Int J Proteomics 2013, 2013, 180605.
63. Ong, S. E.; Blagoev, B.; Kratchmarova, I.; Kristensen, D. B.; Steen, H.; Pandey, A.; Mann, M., Stable isotope labeling by amino acids in cell culture, SILAC, as a simple and accurate approach to expression proteomics. Mol Cell Proteomics 2002, 1 (5), 376-86.
64. Ross, P. L.; Huang, Y. N.; Marchese, J. N.; Williamson, B.; Parker, K.; Hattan, S.; Khainovski, N.; Pillai, S.; Dey, S.; Daniels, S.; Purkayastha, S.; Juhasz, P.; Martin, S.; Bartlet-Jones, M.; He, F.; Jacobson, A.; Pappin, D. J., Multiplexed protein quantitation in Saccharomyces cerevisiae using amine-reactive isobaric tagging reagents. Mol Cell Proteomics 2004, 3 (12), 1154-69.
65. Thompson, A.; Schafer, J.; Kuhn, K.; Kienle, S.; Schwarz, J.; Schmidt, G.; Neumann, T.; Johnstone, R.; Mohammed, A. K.; Hamon, C., Tandem mass tags: a novel quantification strategy for comparative analysis of complex protein mixtures by MS/MS. Anal Chem 2003, 75 (8), 1895-904.
66. Gygi, S. P.; Rist, B.; Gerber, S. A.; Turecek, F.; Gelb, M. H.; Aebersold, R., Quantitative analysis of complex protein mixtures using isotope-coded affinity tags. Nat Biotechnol 1999, 17 (10), 994-9.
67. Hsu, J. L.; Huang, S. Y.; Chow, N. H.; Chen, S. H., Stable-isotope dimethyl labeling for quantitative proteomics. Anal Chem 2003, 75 (24), 6843-52.
68. Yao, X.; Freas, A.; Ramirez, J.; Demirev, P. A.; Fenselau, C., Proteolytic 18O labeling for comparative proteomics: model studies with two serotypes of adenovirus. Anal Chem 2001, 73 (13), 2836-42.
General introduction | Chapter 1
25
69. Werner, T.; Becher, I.; Sweetman, G.; Doce, C.; Savitski, M. M.; Bantscheff, M., High-resolution enabled TMT 8-plexing. Anal Chem 2012, 84 (16), 7188-94.
70. McAlister, G. C.; Huttlin, E. L.; Haas, W.; Ting, L.; Jedrychowski, M. P.; Rogers, J. C.; Kuhn, K.; Pike, I.; Grothe, R. A.; Blethrow, J. D.; Gygi, S. P., Increasing the multiplexing capacity of TMTs using reporter ion isotopologues with isobaric masses. Anal Chem 2012, 84 (17), 7469-78.
71. Bantscheff, M.; Boesche, M.; Eberhard, D.; Matthieson, T.; Sweetman, G.; Kuster, B., Robust and sensitive iTRAQ quantification on an LTQ Orbitrap mass spectrometer. Mol Cell Proteomics 2008, 7 (9), 1702-13.
72. Ting, L.; Rad, R.; Gygi, S. P.; Haas, W., MS3 eliminates ratio distortion in isobaric multiplexed quantitative proteomics. Nat Methods 2011, 8 (11), 937-40.
73. Wenger, C. D.; Lee, M. V.; Hebert, A. S.; McAlister, G. C.; Phanstiel, D. H.; Westphall, M. S.; Coon, J. J., Gas-phase purification enables accurate, multiplexed proteome quantification with isobaric tagging. Nat Methods 2011, 8 (11), 933-5.
74. Savitski, M. M.; Fischer, F.; Mathieson, T.; Sweetman, G.; Lang, M.; Bantscheff, M., Targeted data acquisition for improved reproducibility and robustness of proteomic mass spectrometry assays. J Am Soc Mass Spectrom 2010, 21 (10), 1668-79.
75. Savitski, M. M.; Mathieson, T.; Zinn, N.; Sweetman, G.; Doce, C.; Becher, I.; Pachl, F.; Kuster, B.; Bantscheff, M., Measuring and managing ratio compression for accurate iTRAQ/TMT quantification. J Proteome Res 2013.
76. Higgs, R. E.; Knierman, M. D.; Gelfanova, V.; Butler, J. P.; Hale, J. E., Comprehensive label-free method for the relative quantification of proteins from biological samples. J Proteome Res 2005, 4 (4), 1442-50.
77. Wang, P.; Tang, H.; Fitzgibbon, M. P.; McIntosh, M.; Coram, M.; Zhang, H.; Yi, E.; Aebersold, R., A statistical method for chromatographic alignment of LC-MS data. Biostatistics 2007, 8 (2), 357-67.
78. Strittmatter, E. F.; Ferguson, P. L.; Tang, K.; Smith, R. D., Proteome analyses using accurate mass and elution time peptide tags with capillary LC time-of-flight mass spectrometry. J Am Soc Mass Spectrom 2003, 14 (9), 980-91.
79. Gerber, S. A.; Rush, J.; Stemman, O.; Kirschner, M. W.; Gygi, S. P., Absolute quantification of proteins and phosphoproteins from cell lysates by tandem MS. Proc Natl Acad Sci U S A 2003, 100 (12), 6940-5.
80. Kirkpatrick, D. S.; Gerber, S. A.; Gygi, S. P., The absolute quantification strategy: a general procedure for the quantification of proteins and post-translational modifications. Methods 2005, 35 (3), 265-73.
81. Lu, P.; Vogel, C.; Wang, R.; Yao, X.; Marcotte, E. M., Absolute protein expression profiling estimates the relative contributions of transcriptional and translational regulation. Nat Biotechnol 2007, 25 (1), 117-24.
82. Schwanhausser, B.; Busse, D.; Li, N.; Dittmar, G.; Schuchhardt, J.; Wolf, J.; Chen, W.; Selbach, M., Global quantification of mammalian gene expression control. Nature 2011, 473 (7347), 337-42.
83. Schwanhausser, B.; Busse, D.; Li, N.; Dittmar, G.; Schuchhardt, J.; Wolf, J.; Chen, W.; Selbach, M., Corrigendum: Global quantification of mammalian gene expression control. Nature 2013, 495 (7439), 126-7.
Chapter 1 | General introduction
26
84. Schirle, M.; Bantscheff, M.; Kuster, B., Mass spectrometry-based proteomics in preclinical drug discovery. Chem Biol 2012, 19 (1), 72-84.
85. Bantscheff, M.; Scholten, A.; Heck, A. J., Revealing promiscuous drug-target interactions by chemical proteomics. Drug Discov Today 2009, 14 (21-22), 1021-9.
86. Bantscheff, M.; Drewes, G., Chemoproteomic approaches to drug target identification and drug profiling. Bioorg Med Chem 2012, 20 (6), 1973-8.
87. Rix, U.; Superti-Furga, G., Target profiling of small molecules by chemical proteomics. Nat Chem Biol 2009, 5 (9), 616-24.
88. Cravatt, B. F.; Wright, A. T.; Kozarich, J. W., Activity-based protein profiling: from enzyme chemistry to proteomic chemistry. Annu Rev Biochem 2008, 77, 383-414.
89. Bantscheff, M.; Eberhard, D.; Abraham, Y.; Bastuck, S.; Boesche, M.; Hobson, S.; Mathieson, T.; Perrin, J.; Raida, M.; Rau, C.; Reader, V.; Sweetman, G.; Bauer, A.; Bouwmeester, T.; Hopf, C.; Kruse, U.; Neubauer, G.; Ramsden, N.; Rick, J.; Kuster, B.; Drewes, G., Quantitative chemical proteomics reveals mechanisms of action of clinical ABL kinase inhibitors. Nat Biotechnol 2007, 25 (9), 1035-44.
90. Brehmer, D.; Godl, K.; Zech, B.; Wissing, J.; Daub, H., Proteome-wide identification of cellular targets affected by bisindolylmaleimide-type protein kinase C inhibitors. Mol Cell Proteomics 2004, 3 (5), 490-500.
91. Brehmer, D.; Greff, Z.; Godl, K.; Blencke, S.; Kurtenbach, A.; Weber, M.; Muller, S.; Klebl, B.; Cotten, M.; Keri, G.; Wissing, J.; Daub, H., Cellular targets of gefitinib. Cancer Res 2005, 65 (2), 379-82.
92. Daub, H.; Olsen, J. V.; Bairlein, M.; Gnad, F.; Oppermann, F. S.; Korner, R.; Greff, Z.; Keri, G.; Stemmann, O.; Mann, M., Kinase-selective enrichment enables quantitative phosphoproteomics of the kinome across the cell cycle. Mol Cell 2008, 31 (3), 438-48.
93. Li, J.; Rix, U.; Fang, B.; Bai, Y.; Edwards, A.; Colinge, J.; Bennett, K. L.; Gao, J.; Song, L.; Eschrich, S.; Superti-Furga, G.; Koomen, J.; Haura, E. B., A chemical and phosphoproteomic characterization of dasatinib action in lung cancer. Nat Chem Biol 2010, 6 (4), 291-9.
94. Rix, U.; Hantschel, O.; Durnberger, G.; Remsing Rix, L. L.; Planyavsky, M.; Fernbach, N. V.; Kaupe, I.; Bennett, K. L.; Valent, P.; Colinge, J.; Kocher, T.; Superti-Furga, G., Chemical proteomic profiles of the BCR-ABL inhibitors imatinib, nilotinib, and dasatinib reveal novel kinase and nonkinase targets. Blood 2007, 110 (12), 4055-63.
95. Bantscheff, M.; Hopf, C.; Savitski, M. M.; Dittmann, A.; Grandi, P.; Michon, A.-M.; Schlegl, J.; Abraham, Y.; Becher, I.; Bergamini, G.; Boesche, M.; Delling, M.; Dumpelfeld, B.; Eberhard, D.; Huthmacher, C.; Mathieson, T.; Poeckel, D.; Reader, V.; Strunk, K.; Sweetman, G.; Kruse, U.; Neubauer, G.; Ramsden, N. G.; Drewes, G., Chemoproteomics profiling of HDAC inhibitors reveals selective targeting of HDAC complexes. Nat Biotech 2011, 29 (3), 255-265.
96. Graves, P. R.; Kwiek, J. J.; Fadden, P.; Ray, R.; Hardeman, K.; Coley, A. M.; Foley, M.; Haystead, T. A. J., Discovery of Novel Targets of Quinoline Drugs in the Human Purine Binding Proteome. Molecular Pharmacology 2002, 62 (6), 1364-1372.
97. Hanke, S. E.; Bertinetti, D.; Badel, A.; Schweinsberg, S.; Genieser, H.-G.; Herberg, F. W., Cyclic nucleotides as affinity tools: Phosphorothioate cAMP analogues address specific PKA subproteomes. New Biotechnology 2011, 28 (4), 294-301.
General introduction | Chapter 1
27
98. Scholten, A.; Poh, M. K.; van Veen, T. A. B.; van Breukelen, B.; Vos, M. A.; Heck, A. J. R., Analysis of the cGMP/cAMP Interactome Using a Chemical Proteomics Approach in Mammalian Heart Tissue Validates Sphingosine Kinase Type 1-interacting Protein as a Genuine and Highly Abundant AKAP. Journal of Proteome Research 2006, 5 (6), 1435-1447.
99. Gharbi, S. I.; Zvelebil, M. J.; Shuttleworth, S. J.; Hancox, T.; Saghir, N.; Timms, J. F.; Waterfield, M. D., Exploring the specificity of the PI3K family inhibitor LY294002. Biochem J 2007, 404 (1), 15-21.
100. Krugmann, S.; Anderson, K. E.; Ridley, S. H.; Risso, N.; McGregor, A.; Coadwell, J.; Davidson, K.; Eguinoa, A.; Ellson, C. D.; Lipp, P.; Manifava, M.; Ktistakis, N.; Painter, G.; Thuring, J. W.; Cooper, M. A.; Lim, Z. Y.; Holmes, A. B.; Dove, S. K.; Michell, R. H.; Grewal, A.; Nazarian, A.; Erdjument-Bromage, H.; Tempst, P.; Stephens, L. R.; Hawkins, P. T., Identification of ARAP3, a Novel PI3K Effector Regulating Both Arf and Rho GTPases, by Selective Capture on Phosphoinositide Affinity Matrices. Molecular cell 2002, 9 (1), 95-108.
101. Kruse, U.; Bantscheff, M.; Drewes, G.; Hopf, C., Chemical and pathway proteomics: powerful tools for oncology drug discovery and personalized health care. Mol Cell Proteomics 2008, 7 (10), 1887-901.
102. Fleischer, T. C.; Murphy, B. R.; Flick, J. S.; Terry-Lorenzo, R. T.; Gao, Z.-H.; Davis, T.; McKinnon, R.; Ostanin, K.; Willardsen, J. A.; Boniface, J. J., Chemical Proteomics Identifies Nampt as the Target of CB30865, An Orphan Cytotoxic Compound. Chemistry & biology 2010, 17 (6), 659-664.
103. Wu, Z.; Doondeea, J. B.; Gholami, A. M.; Janning, M. C.; Lemeer, S.; Kramer, K.; Eccles, S. A.; Gollin, S. M.; Grenman, R.; Walch, A.; Feller, S. M.; Kuster, B., Quantitative chemical proteomics reveals new potential drug targets in head and neck cancer. Mol Cell Proteomics 2011, 10 (12), M111 011635.
104. Wu, Z.; Moghaddas Gholami, A.; Kuster, B., Systematic identification of the HSP90 candidate regulated proteome. Mol Cell Proteomics 2012, 11 (6), M111 016675.
105. Kruse, U.; Pallasch, C. P.; Bantscheff, M.; Eberhard, D.; Frenzel, L.; Ghidelli, S.; Maier, S. K.; Werner, T.; Wendtner, C. M.; Drewes, G., Chemoproteomics-based kinome profiling and target deconvolution of clinical multi-kinase inhibitors in primary chronic lymphocytic leukemia cells. Leukemia 2011, 25 (1), 89-100.
106. Knight, J. D.; Pawson, T.; Gingras, A. C., Profiling the kinome: current capabilities and future challenges. J Proteomics 2013, 81, 43-55.
107. Piersma, S.; Labots, M.; Verheul, H. W.; Jiménez, C., Strategies for kinome profiling in cancer and potential clinical applications: chemical proteomics and array-based methods. Analytical and Bioanalytical Chemistry 2010, 397 (8), 3163-3171.
108. Versteeg, H. H.; Nijhuis, E.; van den Brink, G. R.; Evertzen, M.; Pynaert, G. N.; van Deventer, S. J.; Coffer, P. J.; Peppelenbosch, M. P., A new phosphospecific cell-based ELISA for p42/p44 mitogen-activated protein kinase (MAPK), p38 MAPK, protein kinase B and cAMP-response-element-binding protein. Biochem J 2000, 350 Pt 3, 717-22.
109. Parikh, K.; Peppelenbosch, M. P., Kinome Profiling of Clinical Cancer Specimens. Cancer Research 2010, 70 (7), 2575-2578.
110. Godl, K.; Gruss, O. J.; Eickhoff, J.; Wissing, J.; Blencke, S.; Weber, M.; Degen, H.; Brehmer, D.; Orfi, L.; Horvath, Z.; Keri, G.; Muller, S.; Cotten, M.; Ullrich, A.; Daub, H.,
Chapter 1 | General introduction
28
Proteomic characterization of the angiogenesis inhibitor SU6668 reveals multiple impacts on cellular kinase signaling. Cancer Res 2005, 65 (15), 6919-26.
111. Wissing, J.; Jänsch, L.; Nimtz, M.; Dieterich, G.; Hornberger, R.; Kéri, G. r.; Wehland, J. r.; Daub, H., Proteomics Analysis of Protein Kinases by Target Class-selective Prefractionation and Tandem Mass Spectrometry. Molecular & Cellular Proteomics 2007, 6 (3), 537-547.
112. Oppermann, F. S.; Gnad, F.; Olsen, J. V.; Hornberger, R.; Greff, Z.; Keri, G.; Mann, M.; Daub, H., Large-scale proteomics analysis of the human kinome. Mol Cell Proteomics 2009, 8 (7), 1751-64.
113. Hanks, S. K., Genomic analysis of the eukaryotic protein kinase superfamily: a perspective. Genome Biol 2003, 4 (5), 111.
114. Blume-Jensen, P.; Hunter, T., Oncogenic kinase signalling. Nature 2001, 411 (6835), 355-365.
115. Manning, G.; Whyte, D. B.; Martinez, R.; Hunter, T.; Sudarsanam, S., The protein kinase complement of the human genome. Science 2002, 298 (5600), 1912-34.
116. Melnikova, I.; Golden, J., Targeting protein kinases. Nat Rev Drug Discov 2004, 3 (12), 993-994.
117. Fedorov, O.; Muller, S.; Knapp, S., The (un)targeted cancer kinome. Nat Chem Biol 2010, 6 (3), 166-169.
118. Page, T. H.; Smolinska, M.; Gillespie, J.; Urbaniak, A. M.; Foxwell, B. M., Tyrosine kinases and inflammatory signalling. Curr Mol Med 2009, 9 (1), 69-85.
119. Zhang, J.; Yang, P. L.; Gray, N. S., Targeting cancer with small molecule kinase inhibitors. Nat Rev Cancer 2009, 9 (1), 28-39.
120. Hanahan, D.; Weinberg, R. A., The hallmarks of cancer. Cell 2000, 100 (1), 57-70.
121. Hanahan, D.; Weinberg, R. A., Hallmarks of cancer: the next generation. Cell 2011, 144 (5), 646-74.
122. Kurzrock, R.; Kantarjian, H. M.; Druker, B. J.; Talpaz, M., Philadelphia chromosome-positive leukemias: from basic mechanisms to molecular therapeutics. Ann Intern Med 2003, 138 (10), 819-30.
123. Knapp, S.; Arruda, P.; Blagg, J.; Burley, S.; Drewry, D. H.; Edwards, A.; Fabbro, D.; Gillespie, P.; Gray, N. S.; Kuster, B.; Lackey, K. E.; Mazzafera, P.; Tomkinson, N. C. O.; Willson, T. M.; Workman, P.; Zuercher, W. J., A public-private partnership to unlock the untargeted kinome. Nat Chem Biol 2013, 9 (1), 3-6.
124. Cohen, P.; Alessi, D. R., Kinase drug discovery--what's next in the field? ACS Chem Biol 2013, 8 (1), 96-104.
125. Grant, S. K., Therapeutic protein kinase inhibitors. Cell Mol Life Sci 2009, 66 (7), 1163-77.
126. Garcia-Echeverria, C.; Sellers, W. R., Drug discovery approaches targeting the PI3K/Akt pathway in cancer. Oncogene 2008, 27 (41), 5511-26.
127. Tan, S.; Ng, Y.; James, D. E., Next-generation Akt inhibitors provide greater specificity: effects on glucose metabolism in adipocytes. Biochem J 2011, 435 (2), 539-44.
128. Manning, B. D.; Cantley, L. C., AKT/PKB signaling: navigating downstream. Cell 2007, 129 (7), 1261-74.

General introduction | Chapter 1
29
129. Franke, T. F., PI3K/Akt: getting it right matters. Oncogene 2008, 27 (50), 6473-88.
130. Cidado, J.; Park, B. H., Targeting the PI3K/Akt/mTOR pathway for breast cancer therapy. J Mammary Gland Biol Neoplasia 2012, 17 (3-4), 205-16.
131. Hennessy, B. T.; Smith, D. L.; Ram, P. T.; Lu, Y.; Mills, G. B., Exploiting the PI3K/AKT Pathway for Cancer Drug Discovery. Nat Rev Drug Discov 2005, 4 (12), 988-1004.
132. Hemmings, B. A.; Restuccia, D. F., PI3K-PKB/Akt pathway. Cold Spring Harb Perspect Biol 2012, 4 (9), a011189.
133. Markman, B.; Dienstmann, R.; Tabernero, J., Targeting the PI3K/Akt/mTOR pathway--beyond rapalogs. Oncotarget 2010, 1 (7), 530-43.
134. Altomare, D. A.; Testa, J. R., Perturbations of the AKT signaling pathway in human cancer. Oncogene 2005, 24 (50), 7455-64.
135. Fresno Vara, J. A.; Casado, E.; de Castro, J.; Cejas, P.; Belda-Iniesta, C.; Gonzalez-Baron, M., PI3K/Akt signalling pathway and cancer. Cancer Treat Rev 2004, 30 (2), 193-204.
136. Jones, S.; Zhang, X.; Parsons, D. W.; Lin, J. C.; Leary, R. J.; Angenendt, P.; Mankoo, P.; Carter, H.; Kamiyama, H.; Jimeno, A.; Hong, S. M.; Fu, B.; Lin, M. T.; Calhoun, E. S.; Kamiyama, M.; Walter, K.; Nikolskaya, T.; Nikolsky, Y.; Hartigan, J.; Smith, D. R.; Hidalgo, M.; Leach, S. D.; Klein, A. P.; Jaffee, E. M.; Goggins, M.; Maitra, A.; Iacobuzio-Donahue, C.; Eshleman, J. R.; Kern, S. E.; Hruban, R. H.; Karchin, R.; Papadopoulos, N.; Parmigiani, G.; Vogelstein, B.; Velculescu, V. E.; Kinzler, K. W., Core signaling pathways in human pancreatic cancers revealed by global genomic analyses. Science 2008, 321 (5897), 1801-6.
137. Pham, N. A.; Schwock, J.; Iakovlev, V.; Pond, G.; Hedley, D. W.; Tsao, M. S., Immunohistochemical analysis of changes in signaling pathway activation downstream of growth factor receptors in pancreatic duct cell carcinogenesis. BMC Cancer 2008, 8, 43.

Chapter 1 | General introduction
30
Chapter 2
Characterization of a high field Orbitrap mass
spectrometer for proteome analysis

Elite performance evaluation | Chapter 2
33
Introduction
Improvements in analytical technology, notably in peptide separation, quantitative mass spectrometry and informatics are continuing to drive progress in proteome research [1-3]. To date, most experimental approaches involve the analysis of complex peptide mixtures derived from the enzymatic digestion of proteins from total lysates of cells, tissues or body fluids. The resulting peptides are then separated by (multi-dimensional) liquid chromatography (LC) followed by peptide analysis employing tandem mass spectrometry (MS/MS). The sheer number of peptides derived from complete proteomes as well as their high dynamic range of abundance arising from the vast differences in the expression levels of the underlying proteins in a given biological material requires the use of mass spectrometers with high sensitivity, dynamic range and data acquisition speed. In order to generate confident peptide identifications from the generated tandem mass spectra, mass accuracy is an important parameter to consider for protein sequence database searching [4-6]. Some ten years ago, quadrupole time-of-flight instruments featuring mass accuracy of between 10 and 100 ppm were highly successful platforms for protein identification in proteomics. However, these were gradually overtaken by (linear) ion trap instruments owing to their superior sensitivity and speed despite the fact that the mass accuracy of these devices was generally much lower. The subsequent coupling of a linear ion trap with an FT-ICR device [7] and, later, the Orbitrap mass analyzer [8, 9] provided significant steps forward in protein identification by database searching owing to the combination of the outstanding mass accuracy, resolution and intra-scan dynamic range of the FT-ICR or Orbitrap for peptide mass measurements and the exquisite sensitivity of the ion trap for fragment ion measurements [10, 11]. The next significant development in Orbitrap instruments was the addition of a multipole collision cell which enabled beam type collision induced dissociation experiment (also known as higher energy collision induced dissociation, HCD) [12] with Orbitrap readout. This allows the measurement of peptide and fragment ions with high mass accuracy which turned out to be advantageous in a number of proteomic applications, notably for the analysis of post-translational modifications (PTMs) and peptide quantification using tandem mass tags [13-15]. The latest modification to the theme of a hybrid ion trap Orbitrap mass spectrometer is the Orbitrap Elite featuring a so-called compact high field Orbitrap and an enhanced Fourier Transform (FT) algorithm for signal deconvolution [16, 17]. In combination, these two elements improve both scan speed and resolution (max. of 240,000) and the first few reports in the literature showed that this instrument is particularly useful for analyzing intact proteins (so-called top down analysis) [16, 18] but also capable of in-depth bottom up analysis of complex proteomes [19, 20]. In this study, details on the performance of a number of data-dependent acquisition scan types enabled on this instrument for proteomic applications are reported. The main results obtained from the analysis of complex digests of human cell lines show that mass accuracy can be improved to below one ppm for all peptide ions when measured at very high resolution, that HCD is competitive with CID fragmentation in terms of protein identification performance at sample loadings between 0.1 and 1000 ng on column, that protein identification resulting from CID fragmentation can be significantly improved if using the correct mass tolerances and that, overall, the Orbitrap Elite improves peptide and

Chapter 2 | Elite performance evaluation
34
protein identification over its predecessor the Orbitrap Velos by a significant margin in all parameters assessed.

Elite performance evaluation | Chapter 2
35
Material and Methods
Sample preparation
E.coli K1β DH5α was grown aerobically at γ7 °C in LB medium. Exponentially growing cells were lysed by sonication in 50 mM Tris-HCl (pH 7.5) containing protease inhibitors (SIGMAFAST, Sigma-Aldrich, Munich, Germany). The cytosolic protein extract was reduced using 20 mM dithiothreitol, alkylated with 100 mM iodoacetamide and digested in solution with trypsin (1:50 w/w enzyme:substrate ratio, Promega Corp., Madison, WI, USA). Peptides were purified prior to LC-MS/MS analyses using C18 μZipTips (Millipore Corporation, Billerica, MA, USA) according to the manufacturer’s protocol. HeLa Sγ cervix carcinoma cells were cultured in Dulbecco's Modified Eagle Medium (DMEM) with high glucose (PAA, Pasching, Austria) supplemented with 10% (v/v) fetal bovine serum (FBS, PAA, Pasching, Austria) at 37 °C in humidified air and 10% CO2. Cells were washed with phosphate buffered saline (PBS) and harvested by lysis using 50mM Tris/HCl pH 7.5, 5% Glycerol, 1.5 mM MgCl2, 150 mM NaCl, 0.8% NP-40, 1 mM dithiothreitol and 25 mM NaF with freshly added protease inhibitors and phosphatase inhibitors (5x phosphatase inhibitor cocktail1, Sigma-Aldrich, Munich, Germany, 5x phosphatase inhibitor cocktail 2, Sigma-Aldrich, Munich, Germany, 1 mM sodium ortho-vanadate and 20 nM Calyculin A, LC Laboratories, Woburn, MA, USA). Protein extracts were clarified by ultracentrifugation for 1 h at 145,000 xg at 4 °C and protein concentration was determined by the Bradford method. Lysates were diluted in 8 M urea, 0.1 M Tris/HCl followed by protein digestion with trypsin (Promega Corp., Madison, WI, USA) according to the FASP protocol [21]. After overnight digestion, peptides were eluted from the filters with 50 mM TEAB and purified on C18 StageTips as described [22].
LC-MS/MS measurements
Mass spectrometry was performed by coupling an Eksigent nanoLC-Ultra 1D+ (Eksigent, Dublin, CA) to an Orbitrap Elite instrument (Thermo Scientific, Bremen, Germany). Peptides were delivered to a trap column (100 μm×β cm, packed in-house with Reprosil-Pur C18-AQ 5 µm resin, Dr. Maisch, Ammerbuch, Germany) at a flow rate of 5 µL/min in 100% solvent A (0.1% formic acid, FA, in HPLC grade water). After 10 min of loading and washing, peptides were transferred to an analytical column (75µm×40 cm, packed in-house with Reprosil-Gold C18, 3 µm resin, Dr. Maisch, Ammerbuch, Germany) and separated using a linear gradient from 7% to 35% of solvent B (0.1% FA in acetonitrile) at a flow rate of 300 nL/minute. Instrument parameter settings for HCD fragmentation were optimized using 1 µg E.coli digest and a 60 min gradient (see Figure 2). Unless otherwise stated, HeLa samples were analyzed using a 60 min gradient using the same gradient protocol as mentioned above. The Orbitrap Elite instrument was operated in data-dependent mode, automatically switching between MS and MS2. Full scan MS spectra (m/z 300 – 1300) were acquired in the Orbitrap at 30,000 (m/z 400) resolution (unless stated otherwise) using an automatic gain control (AGC) target value of 1e6 charges. Internal calibration was performed using (Si(CH3)2O)6H+ (m/z 445.120025) present in ambient
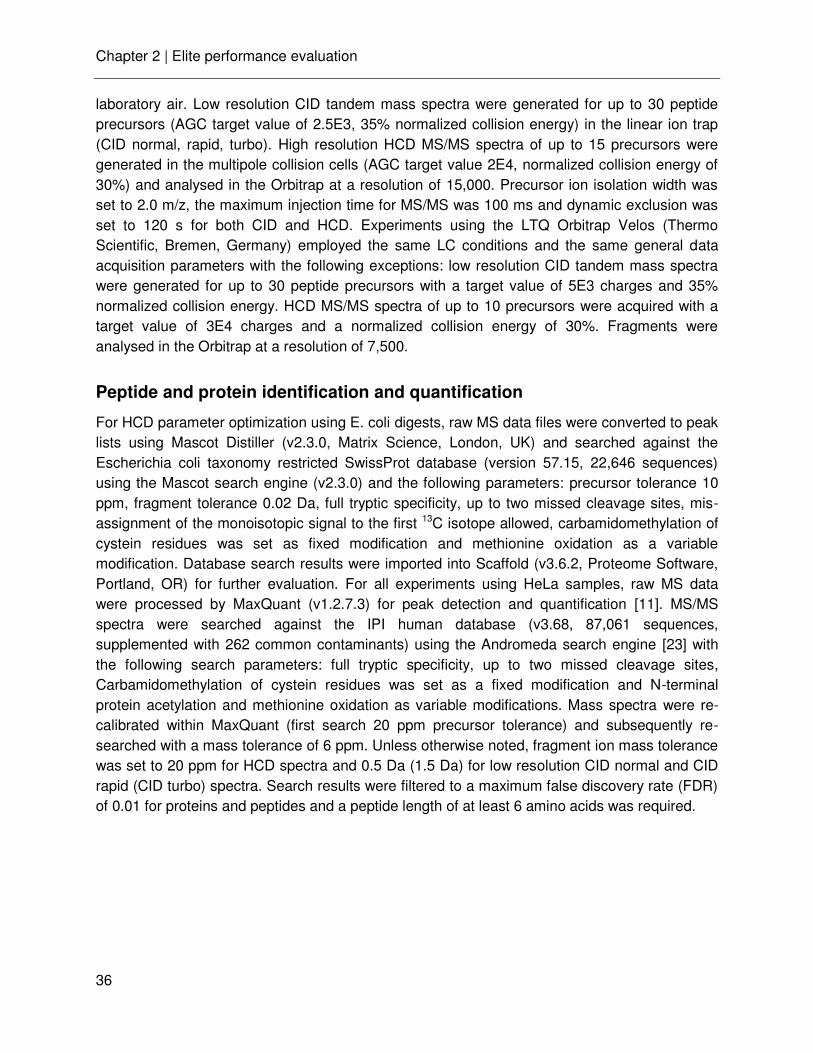
Chapter 2 | Elite performance evaluation
36
laboratory air. Low resolution CID tandem mass spectra were generated for up to 30 peptide precursors (AGC target value of 2.5E3, 35% normalized collision energy) in the linear ion trap (CID normal, rapid, turbo). High resolution HCD MS/MS spectra of up to 15 precursors were generated in the multipole collision cells (AGC target value 2E4, normalized collision energy of 30%) and analysed in the Orbitrap at a resolution of 15,000. Precursor ion isolation width was set to 2.0 m/z, the maximum injection time for MS/MS was 100 ms and dynamic exclusion was set to 120 s for both CID and HCD. Experiments using the LTQ Orbitrap Velos (Thermo Scientific, Bremen, Germany) employed the same LC conditions and the same general data acquisition parameters with the following exceptions: low resolution CID tandem mass spectra were generated for up to 30 peptide precursors with a target value of 5E3 charges and 35% normalized collision energy. HCD MS/MS spectra of up to 10 precursors were acquired with a target value of 3E4 charges and a normalized collision energy of 30%. Fragments were analysed in the Orbitrap at a resolution of 7,500.
Peptide and protein identification and quantification
For HCD parameter optimization using E. coli digests, raw MS data files were converted to peak lists using Mascot Distiller (v2.3.0, Matrix Science, London, UK) and searched against the Escherichia coli taxonomy restricted SwissProt database (version 57.15, 22,646 sequences) using the Mascot search engine (v2.3.0) and the following parameters: precursor tolerance 10 ppm, fragment tolerance 0.02 Da, full tryptic specificity, up to two missed cleavage sites, mis-assignment of the monoisotopic signal to the first 13C isotope allowed, carbamidomethylation of cystein residues was set as fixed modification and methionine oxidation as a variable modification. Database search results were imported into Scaffold (v3.6.2, Proteome Software, Portland, OR) for further evaluation. For all experiments using HeLa samples, raw MS data were processed by MaxQuant (v1.2.7.3) for peak detection and quantification [11]. MS/MS spectra were searched against the IPI human database (v3.68, 87,061 sequences, supplemented with 262 common contaminants) using the Andromeda search engine [23] with the following search parameters: full tryptic specificity, up to two missed cleavage sites, Carbamidomethylation of cystein residues was set as a fixed modification and N-terminal protein acetylation and methionine oxidation as variable modifications. Mass spectra were re-calibrated within MaxQuant (first search 20 ppm precursor tolerance) and subsequently re-searched with a mass tolerance of 6 ppm. Unless otherwise noted, fragment ion mass tolerance was set to 20 ppm for HCD spectra and 0.5 Da (1.5 Da) for low resolution CID normal and CID rapid (CID turbo) spectra. Search results were filtered to a maximum false discovery rate (FDR) of 0.01 for proteins and peptides and a peptide length of at least 6 amino acids was required.
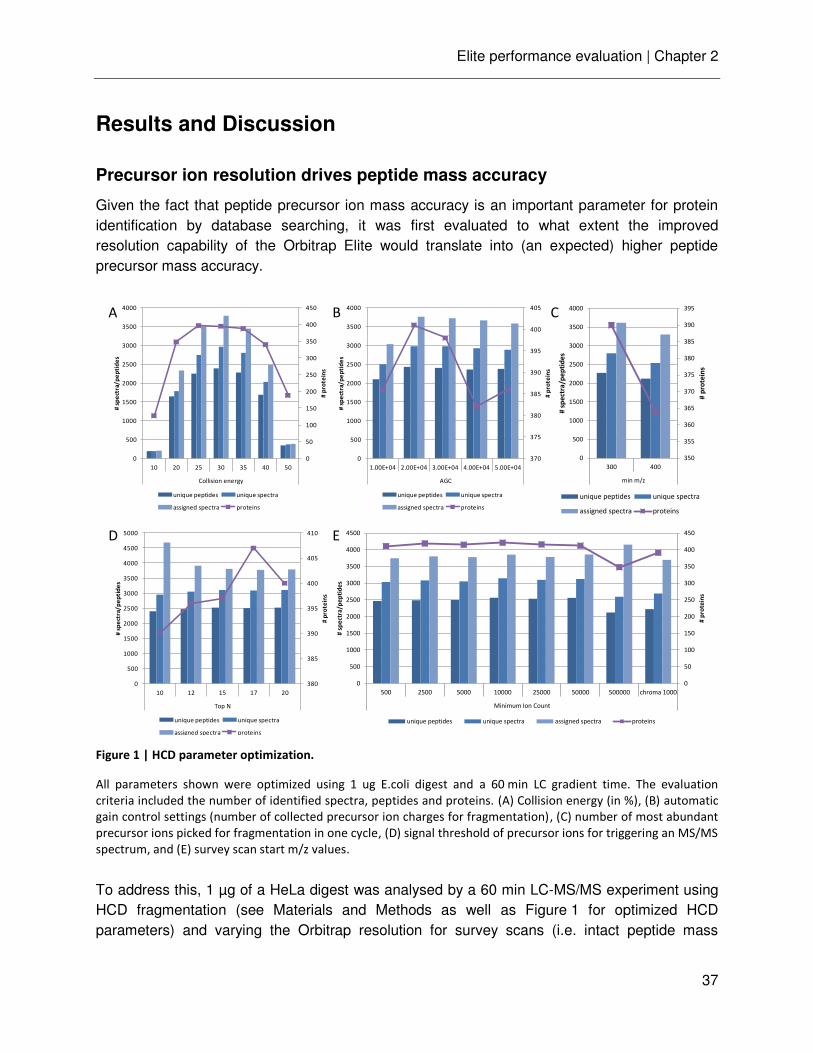
Elite performance evaluation | Chapter 2
37
Results and Discussion
Precursor ion resolution drives peptide mass accuracy
Given the fact that peptide precursor ion mass accuracy is an important parameter for protein identification by database searching, it was first evaluated to what extent the improved resolution capability of the Orbitrap Elite would translate into (an expected) higher peptide precursor mass accuracy.
Figure 1 | HCD parameter optimization.
All parameters shown were optimized using 1 ug E.coli digest and a 60 min LC gradient time. The evaluation
criteria included the number of identified spectra, peptides and proteins. (A) Collision energy (in %), (B) automatic
gain control settings (number of collected precursor ion charges for fragmentation), (C) number of most abundant
precursor ions picked for fragmentation in one cycle, (D) signal threshold of precursor ions for triggering an MS/MS
spectrum, and (E) survey scan start m/z values.
To address this, 1 µg of a HeLa digest was analysed by a 60 min LC-MS/MS experiment using HCD fragmentation (see Materials and Methods as well as Figure 1 for optimized HCD parameters) and varying the Orbitrap resolution for survey scans (i.e. intact peptide mass
0
50
100
150
200
250
300
350
400
450
0
500
1000
1500
2000
2500
3000
3500
4000
4500
500 2500 5000 10000 25000 50000 500000 chroma 1000
Minimum Ion Count#
pro
tein
s
# s
pe
ctra
/pe
pti
de
s
unique peptides unique spectra assigned spectra proteins
350
355
360
365
370
375
380
385
390
395
0
500
1000
1500
2000
2500
3000
3500
4000
300 400
min m/z
# p
rote
ins
# s
pe
ctra
/pe
pti
de
s
unique peptides unique spectra
assigned spectra proteins
0
50
100
150
200
250
300
350
400
450
0
500
1000
1500
2000
2500
3000
3500
4000
10 20 25 30 35 40 50
Collision energy
# p
rote
ins
# s
pe
ctra
/p
ep
tid
es
unique peptides unique spectra
assigned spectra proteins
370
375
380
385
390
395
400
405
0
500
1000
1500
2000
2500
3000
3500
4000
1.00E+04 2.00E+04 3.00E+04 4.00E+04 5.00E+04
AGC
# p
rote
ins
# s
pe
ctra
/p
ep
tid
es
unique peptides unique spectra
assigned spectra proteins
380
385
390
395
400
405
410
0
500
1000
1500
2000
2500
3000
3500
4000
4500
5000
10 12 15 17 20
Top N
# p
rote
ins
# s
pe
ctra
/p
ep
tid
es
unique peptides unique spectra
assigned spectra proteins
A B
D E
C
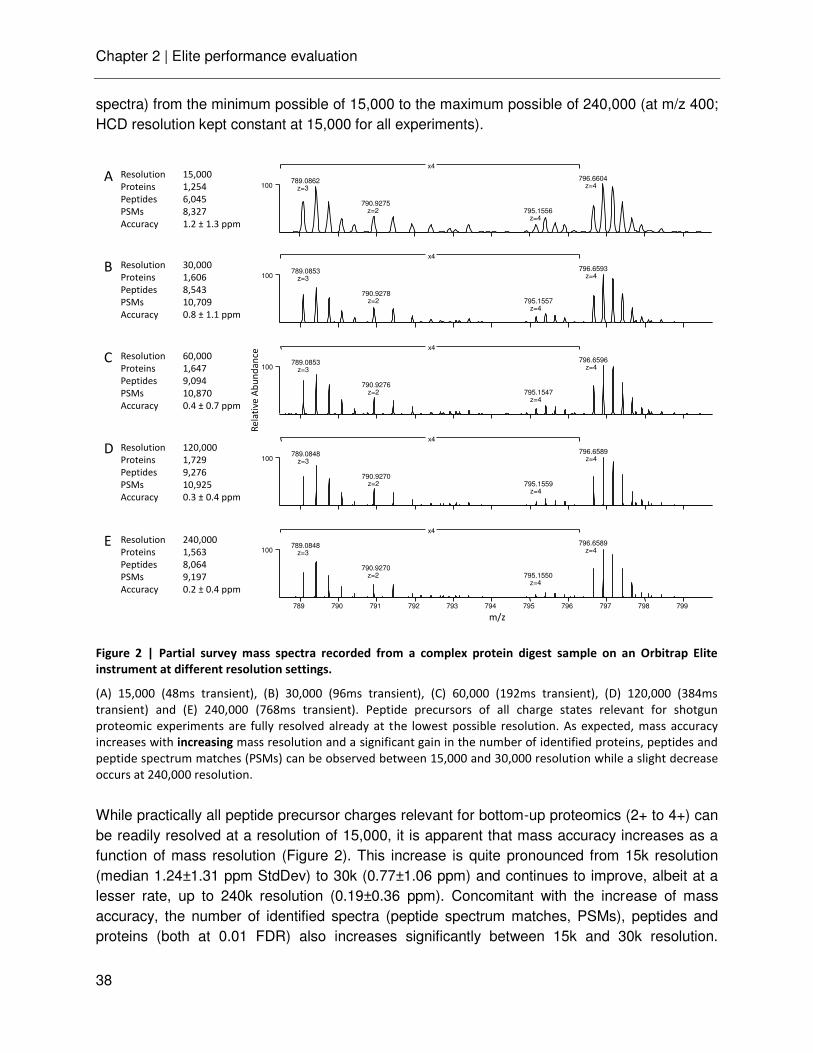
Chapter 2 | Elite performance evaluation
38
spectra) from the minimum possible of 15,000 to the maximum possible of 240,000 (at m/z 400; HCD resolution kept constant at 15,000 for all experiments).
Figure 2 | Partial survey mass spectra recorded from a complex protein digest sample on an Orbitrap Elite
instrument at different resolution settings.
(A) 15,000 (48ms transient), (B) 30,000 (96ms transient), (C) 60,000 (192ms transient), (D) 120,000 (384ms
transient) and (E) 240,000 (768ms transient). Peptide precursors of all charge states relevant for shotgun
proteomic experiments are fully resolved already at the lowest possible resolution. As expected, mass accuracy
increases with increasing mass resolution and a significant gain in the number of identified proteins, peptides and
peptide spectrum matches (PSMs) can be observed between 15,000 and 30,000 resolution while a slight decrease
occurs at 240,000 resolution.
While practically all peptide precursor charges relevant for bottom-up proteomics (2+ to 4+) can be readily resolved at a resolution of 15,000, it is apparent that mass accuracy increases as a function of mass resolution (Figure 2). This increase is quite pronounced from 15k resolution (median 1.24±1.31 ppm StdDev) to 30k (0.77±1.06 ppm) and continues to improve, albeit at a lesser rate, up to 240k resolution (0.19±0.36 ppm). Concomitant with the increase of mass accuracy, the number of identified spectra (peptide spectrum matches, PSMs), peptides and proteins (both at 0.01 FDR) also increases significantly between 15k and 30k resolution.
Resolution 15,000
Proteins 1,254
Peptides 6,045
PSMs 8,327
Accuracy 1.2 ± 1.3 ppm
Resolution 30,000
Proteins 1,606
Peptides 8,543
PSMs 10,709
Accuracy 0.8 ± 1.1 ppm
Resolution 60,000
Proteins 1,647
Peptides 9,094
PSMs 10,870
Accuracy 0.4 ± 0.7 ppm
Resolution 120,000
Proteins 1,729
Peptides 9,276
PSMs 10,925
Accuracy 0.3 ± 0.4 ppm
Resolution 240,000
Proteins 1,563
Peptides 8,064
PSMs 9,197
Accuracy 0.2 ± 0.4 ppm
100796.6604
z=4789.0862
z=3
790.9275z=2 795.1556
z=4
x4
789 790 791 792 793 794 795 796 797 798 799
m/z
100796.6589
z=4789.0848
z=3
790.9270z=2 795.1550
z=4
x4
100796.6593
z=4789.0853
z=3
790.9278z=2 795.1557
z=4
x4
100796.6596
z=4789.0853
z=3
790.9276z=2 795.1547
z=4
x4
100796.6589
z=4789.0848
z=3
790.9270z=2 795.1559
z=4
x4
Re
lati
ve A
bu
nd
an
ce
A
B
C
D
E
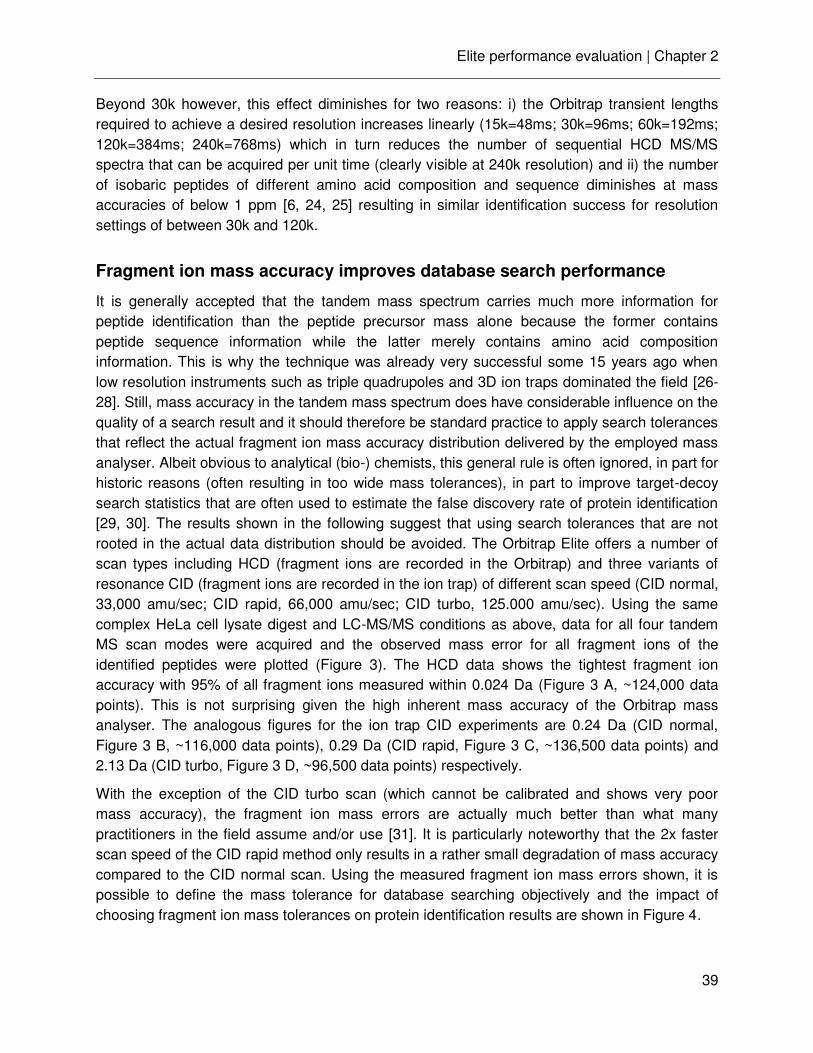
Elite performance evaluation | Chapter 2
39
Beyond 30k however, this effect diminishes for two reasons: i) the Orbitrap transient lengths required to achieve a desired resolution increases linearly (15k=48ms; 30k=96ms; 60k=192ms; 120k=384ms; 240k=768ms) which in turn reduces the number of sequential HCD MS/MS spectra that can be acquired per unit time (clearly visible at 240k resolution) and ii) the number of isobaric peptides of different amino acid composition and sequence diminishes at mass accuracies of below 1 ppm [6, 24, 25] resulting in similar identification success for resolution settings of between 30k and 120k.
Fragment ion mass accuracy improves database search performance
It is generally accepted that the tandem mass spectrum carries much more information for peptide identification than the peptide precursor mass alone because the former contains peptide sequence information while the latter merely contains amino acid composition information. This is why the technique was already very successful some 15 years ago when low resolution instruments such as triple quadrupoles and 3D ion traps dominated the field [26-28]. Still, mass accuracy in the tandem mass spectrum does have considerable influence on the quality of a search result and it should therefore be standard practice to apply search tolerances that reflect the actual fragment ion mass accuracy distribution delivered by the employed mass analyser. Albeit obvious to analytical (bio-) chemists, this general rule is often ignored, in part for historic reasons (often resulting in too wide mass tolerances), in part to improve target-decoy search statistics that are often used to estimate the false discovery rate of protein identification [29, 30]. The results shown in the following suggest that using search tolerances that are not rooted in the actual data distribution should be avoided. The Orbitrap Elite offers a number of scan types including HCD (fragment ions are recorded in the Orbitrap) and three variants of resonance CID (fragment ions are recorded in the ion trap) of different scan speed (CID normal, 33,000 amu/sec; CID rapid, 66,000 amu/sec; CID turbo, 125.000 amu/sec). Using the same complex HeLa cell lysate digest and LC-MS/MS conditions as above, data for all four tandem MS scan modes were acquired and the observed mass error for all fragment ions of the identified peptides were plotted (Figure 3). The HCD data shows the tightest fragment ion accuracy with 95% of all fragment ions measured within 0.024 Da (Figure 3 A, ~124,000 data points). This is not surprising given the high inherent mass accuracy of the Orbitrap mass analyser. The analogous figures for the ion trap CID experiments are 0.24 Da (CID normal, Figure 3 B, ~116,000 data points), 0.29 Da (CID rapid, Figure 3 C, ~136,500 data points) and 2.13 Da (CID turbo, Figure 3 D, ~96,500 data points) respectively.
With the exception of the CID turbo scan (which cannot be calibrated and shows very poor mass accuracy), the fragment ion mass errors are actually much better than what many practitioners in the field assume and/or use [31]. It is particularly noteworthy that the 2x faster scan speed of the CID rapid method only results in a rather small degradation of mass accuracy compared to the CID normal scan. Using the measured fragment ion mass errors shown, it is possible to define the mass tolerance for database searching objectively and the impact of choosing fragment ion mass tolerances on protein identification results are shown in Figure 4.

Chapter 2 | Elite performance evaluation
40
Figure 3 | Distribution of fragment ion mass error of identified proteins using different scan types.
(A) HCD experiments (recorded in the Orbitrap) show the lowest mass error with 95% of all ions measured within a
mass error of 0.024 Da. (B) analogous plot for the CID normal scan type (95% of all fragments are within 0.24 Da).
(C) analogous plot for the CID rapid method (95% of all fragments are within 0.29 Da) and (D) analogous plot for
the CID turbo scan mode (95% of all fragments are within 2.13 Da). Solid lines indicate the mean mass error of all
identified fragment ions within a ± 0.5 Da window for HCD, CID normal and CID rapid scans (± 2.0 Da for CID turbo).
The CID normal and the much faster CID rapid method show almost equal mass accuracy. Dashed lines show the
5% and 95% percentile of the data within the given mass window.
Varying the mass tolerance for the HCD data between 0.02 and 0.05 Da has little impact on database search results because this level of mass accuracy is sufficient to distinguish practically all naturally occurring amino acids (save the isobaric amino acids Ile and Leu) and also most y- and b-type fragment ions. The choice of mass tolerance is more important for searching ion trap CID data. Given the data shown in Figure 2, an MS/MS search tolerance of 0.25 Da to 0.3 Da should be sufficient to include all meaningful fragment ions of a (single) peptide and which would also readily distinguish peptides containing amino acid combinations such as Asn/Asp or Gln/Glu which differ by approx. one Dalton in mass. The results of actual searches entirely confirm this expectation (Figure 4). Search tolerances of 0.25 – 0.5 Da lead to a similar number of identified PSMs, peptides and proteins using the CID normal and CID rapid scans but considerably fewer at tolerances of 1 Da or higher. It is noteworthy that although the median search engine score (here Andromeda) increases as the search tolerance is relaxed, the number of identified peptides and proteins actually decreases.
0 500 1000 1500 2000 2500m/z
Ma
ss E
rro
r (D
a)
-0.6
-0.3
0.3
0.6
0A
0 500 1000 1500 2000 2500m/z
Ma
ss E
rro
r (D
a)
-0.6
-0.3
0.3
0.6
0
B
0 500 1000 1500 2000 2500m/z
Ma
ss E
rro
r (D
a)
-0.6
-0.3
0.3
0.6
0
C
0 500 1000 1500 2000 2500m/z
Ma
ss E
rro
r (D
a)
-2.0
-1.0
1.0
2.0
0
D
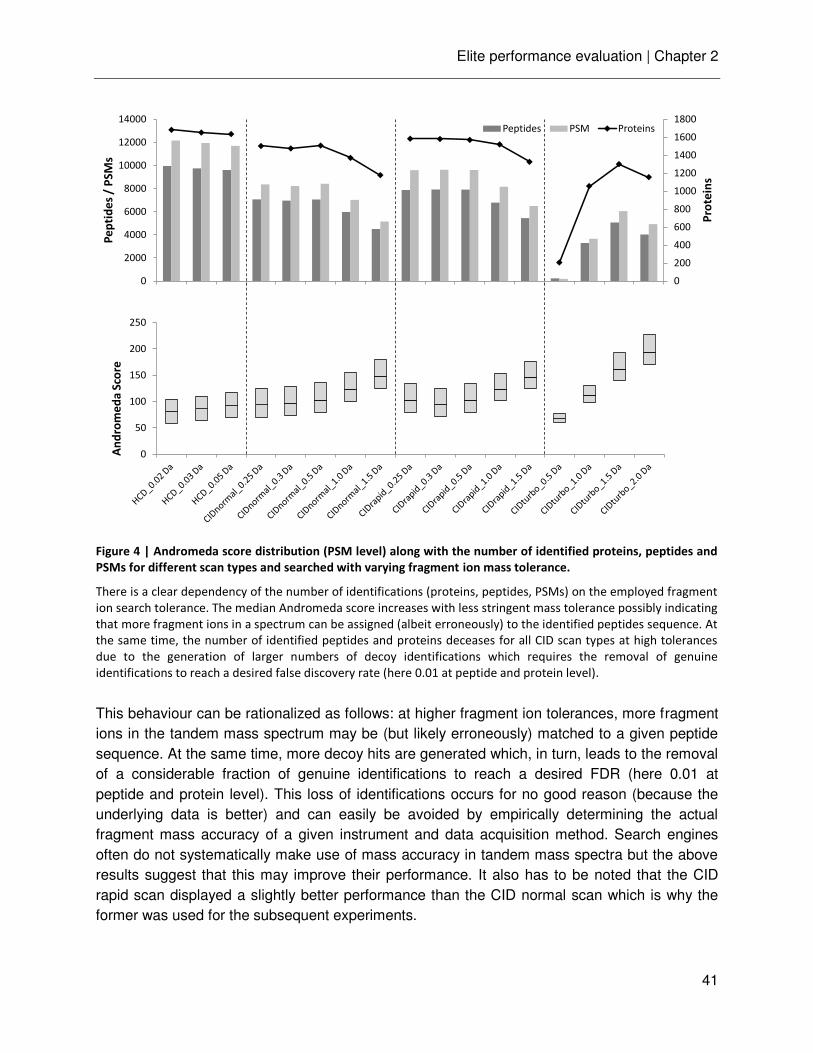
Elite performance evaluation | Chapter 2
41
Figure 4 | Andromeda score distribution (PSM level) along with the number of identified proteins, peptides and
PSMs for different scan types and searched with varying fragment ion mass tolerance.
There is a clear dependency of the number of identifications (proteins, peptides, PSMs) on the employed fragment
ion search tolerance. The median Andromeda score increases with less stringent mass tolerance possibly indicating
that more fragment ions in a spectrum can be assigned (albeit erroneously) to the identified peptides sequence. At
the same time, the number of identified peptides and proteins deceases for all CID scan types at high tolerances
due to the generation of larger numbers of decoy identifications which requires the removal of genuine
identifications to reach a desired false discovery rate (here 0.01 at peptide and protein level).
This behaviour can be rationalized as follows: at higher fragment ion tolerances, more fragment ions in the tandem mass spectrum may be (but likely erroneously) matched to a given peptide sequence. At the same time, more decoy hits are generated which, in turn, leads to the removal of a considerable fraction of genuine identifications to reach a desired FDR (here 0.01 at peptide and protein level). This loss of identifications occurs for no good reason (because the underlying data is better) and can easily be avoided by empirically determining the actual fragment mass accuracy of a given instrument and data acquisition method. Search engines often do not systematically make use of mass accuracy in tandem mass spectra but the above results suggest that this may improve their performance. It also has to be noted that the CID rapid scan displayed a slightly better performance than the CID normal scan which is why the former was used for the subsequent experiments.
0
200
400
600
800
1000
1200
1400
1600
1800
0
2000
4000
6000
8000
10000
12000
14000
Pro
tein
s
Pe
pti
de
s /
PS
Ms
Peptides PSM Proteins
0
50
100
150
200
250
An
dro
me
da
Sco
re
Chapter 2 | Elite performance evaluation
42
HCD vs CID for protein identification
There is an on-going debate in the field about the importance of high vs low resolution / accuracy tandem MS (e.g. HCD vs CID) for protein identification [14, 32, 33]. Roughly speaking, the arguments of the high resolution proponents revolve around the low rate of false positive matches when using tight mass tolerances for database searching and those of the low resolution proponents around data acquisition speed (i.e. the higher number of probed peptide precursors). In this context, it is worth noting that low resolution CID on the Orbitrap Elite comes with an actual resolution of ~3,000 for CID rapid and ~5,000 for CID normal. At this resolution, it is actually possible to determine the charge states of the majority of tryptic peptides. In the following, the performance of HCD and CID rapid across five orders of magnitude of sample loading (ranging from 0.1 ng digest to 1,000 ng digest on column; Figure 5) was compared.
Figure 5 | Comparison of HCD and CID rapid for analytical parameters relevant for protein identification.
Sample loading on column was varied across five orders of magnitude (0.1 ng to 1,000 ng). (A) Number of MS/MS
events for CID rapid (grey) and HCD (black). (B) Absolute number of tandem mass spectra identified. (C) Percentage
of identified tandem mass spectra at 1% FDR. (D) Number of identified peptides. (E) Number of identified proteins
and (F) Summed peptide intensities for all identified proteins. While CID rapid acquired more data per unit time,
the overall performance of the two scan types for peptide and protein identification were similar with a tendency
of HCD identifying more individual peptides.
0
1000
2000
3000
4000
5000
6000
7000
8000
9000
0.1 1 10 100 1000
# P
ep
tid
es
Amount digest [ng]
8
8.5
9
9.5
10
10.5
11
11.5
12
0.1 1 10 100 1000
Log
(In
ten
sity
)
Amount digest [ng]
400
600
800
1000
1200
1400
1600
1800
0.1 1 10 100 1000
# P
rote
ins
Amount digest [ng]
0
10
20
30
40
50
60
70
0.1 1 10 100 1000%
MS
/MS
id
en
tifi
ed
Amount digest [ng]
8000
10000
12000
14000
16000
18000
20000
22000
24000
26000
0.1 1 10 100 1000
# M
S/M
S
Amount digest [ng]
0
2000
4000
6000
8000
10000
12000
0.1 1 10 100 1000
# M
S/M
S i
de
nti
fie
d
Amount digest [ng]
A B C
D E F
Proteins
HCD
CID rapid
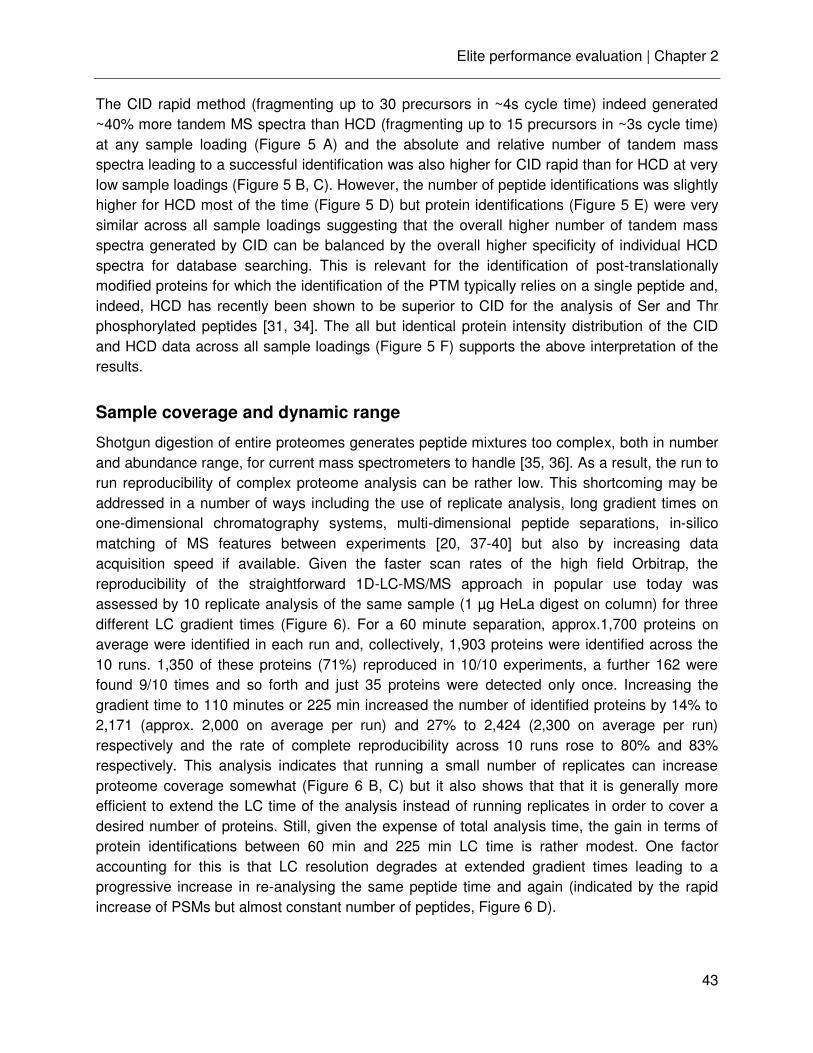
Elite performance evaluation | Chapter 2
43
The CID rapid method (fragmenting up to 30 precursors in ~4s cycle time) indeed generated ~40% more tandem MS spectra than HCD (fragmenting up to 15 precursors in ~3s cycle time) at any sample loading (Figure 5 A) and the absolute and relative number of tandem mass spectra leading to a successful identification was also higher for CID rapid than for HCD at very low sample loadings (Figure 5 B, C). However, the number of peptide identifications was slightly higher for HCD most of the time (Figure 5 D) but protein identifications (Figure 5 E) were very similar across all sample loadings suggesting that the overall higher number of tandem mass spectra generated by CID can be balanced by the overall higher specificity of individual HCD spectra for database searching. This is relevant for the identification of post-translationally modified proteins for which the identification of the PTM typically relies on a single peptide and, indeed, HCD has recently been shown to be superior to CID for the analysis of Ser and Thr phosphorylated peptides [31, 34]. The all but identical protein intensity distribution of the CID and HCD data across all sample loadings (Figure 5 F) supports the above interpretation of the results.
Sample coverage and dynamic range
Shotgun digestion of entire proteomes generates peptide mixtures too complex, both in number and abundance range, for current mass spectrometers to handle [35, 36]. As a result, the run to run reproducibility of complex proteome analysis can be rather low. This shortcoming may be addressed in a number of ways including the use of replicate analysis, long gradient times on one-dimensional chromatography systems, multi-dimensional peptide separations, in-silico matching of MS features between experiments [20, 37-40] but also by increasing data acquisition speed if available. Given the faster scan rates of the high field Orbitrap, the reproducibility of the straightforward 1D-LC-MS/MS approach in popular use today was assessed by 10 replicate analysis of the same sample (1 µg HeLa digest on column) for three different LC gradient times (Figure 6). For a 60 minute separation, approx.1,700 proteins on average were identified in each run and, collectively, 1,903 proteins were identified across the 10 runs. 1,350 of these proteins (71%) reproduced in 10/10 experiments, a further 162 were found 9/10 times and so forth and just 35 proteins were detected only once. Increasing the gradient time to 110 minutes or 225 min increased the number of identified proteins by 14% to 2,171 (approx. 2,000 on average per run) and 27% to 2,424 (2,300 on average per run) respectively and the rate of complete reproducibility across 10 runs rose to 80% and 83% respectively. This analysis indicates that running a small number of replicates can increase proteome coverage somewhat (Figure 6 B, C) but it also shows that that it is generally more efficient to extend the LC time of the analysis instead of running replicates in order to cover a desired number of proteins. Still, given the expense of total analysis time, the gain in terms of protein identifications between 60 min and 225 min LC time is rather modest. One factor accounting for this is that LC resolution degrades at extended gradient times leading to a progressive increase in re-analysing the same peptide time and again (indicated by the rapid increase of PSMs but almost constant number of peptides, Figure 6 D).
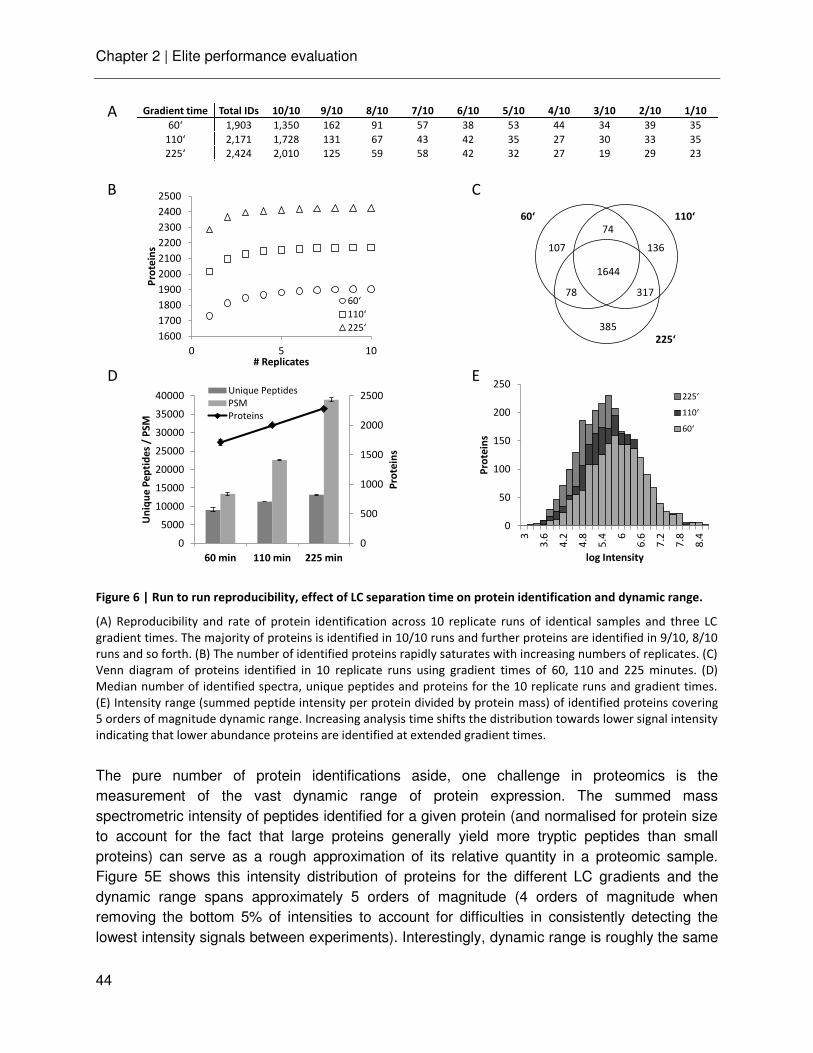
Chapter 2 | Elite performance evaluation
44
Figure 6 | Run to run reproducibility, effect of LC separation time on protein identification and dynamic range.
(A) Reproducibility and rate of protein identification across 10 replicate runs of identical samples and three LC
gradient times. The majority of proteins is identified in 10/10 runs and further proteins are identified in 9/10, 8/10
runs and so forth. (B) The number of identified proteins rapidly saturates with increasing numbers of replicates. (C)
Venn diagram of proteins identified in 10 replicate runs using gradient times of 60, 110 and 225 minutes. (D)
Median number of identified spectra, unique peptides and proteins for the 10 replicate runs and gradient times.
(E) Intensity range (summed peptide intensity per protein divided by protein mass) of identified proteins covering
5 orders of magnitude dynamic range. Increasing analysis time shifts the distribution towards lower signal intensity
indicating that lower abundance proteins are identified at extended gradient times.
The pure number of protein identifications aside, one challenge in proteomics is the measurement of the vast dynamic range of protein expression. The summed mass spectrometric intensity of peptides identified for a given protein (and normalised for protein size to account for the fact that large proteins generally yield more tryptic peptides than small proteins) can serve as a rough approximation of its relative quantity in a proteomic sample. Figure 5E shows this intensity distribution of proteins for the different LC gradients and the dynamic range spans approximately 5 orders of magnitude (4 orders of magnitude when removing the bottom 5% of intensities to account for difficulties in consistently detecting the lowest intensity signals between experiments). Interestingly, dynamic range is roughly the same
1600
1700
1800
1900
2000
2100
2200
2300
2400
2500
0 5 10
Pro
tein
s
# Replicates
6
1644
385
74
107 136
31778
60‘ 110‘
225‘
0
500
1000
1500
2000
2500
0
5000
10000
15000
20000
25000
30000
35000
40000
60 min 110 min 225 min
Pro
tein
s
Un
iqu
e P
ep
tid
es
/ P
SM
Unique Peptides
PSM
Proteins
Gradient time Total IDs 10/10 9/10 8/10 7/10 6/10 5/10 4/10 3/10 2/10 1/10
6 1,903 1,350 162 91 57 38 53 44 34 39 35
2,171 1,728 131 67 43 42 35 27 30 33 35
2,424 2,010 125 59 58 42 32 27 19 29 23
A
B
D
C
E
0
50
100
150
200
250
3
3.6
4.2
4.8
5.4 6
6.6
7.2
7.8
8.4
Pro
tein
s
log Intensity
6
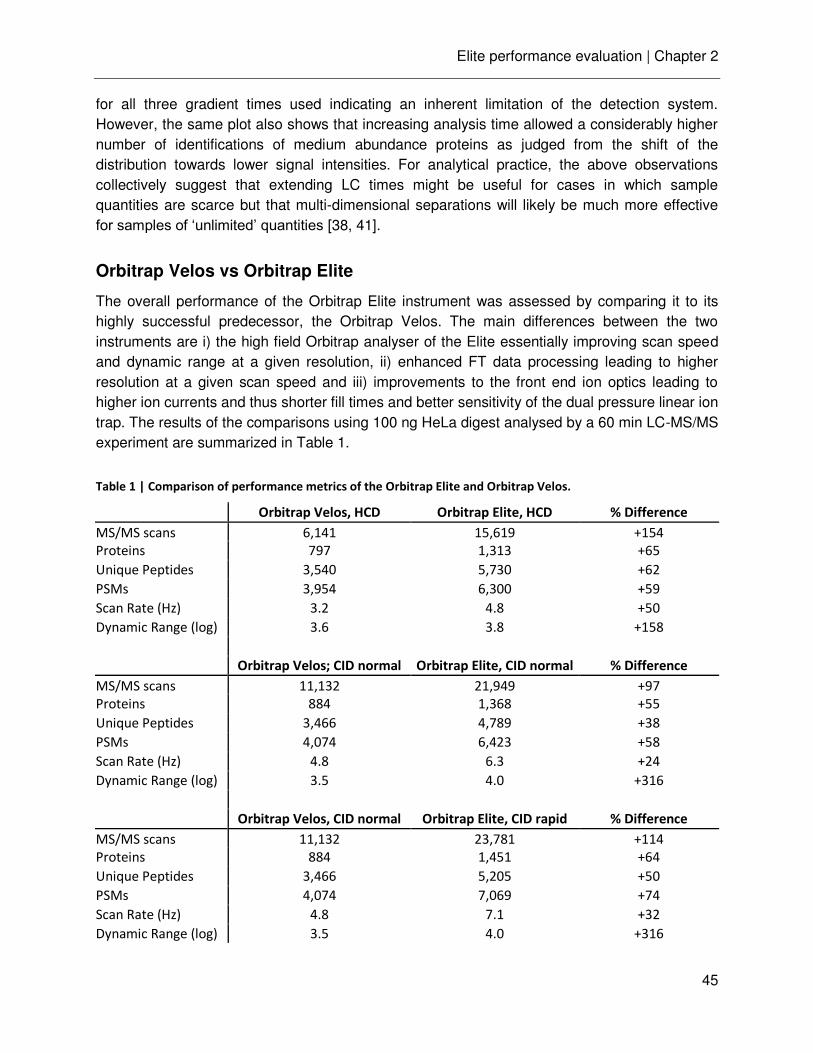
Elite performance evaluation | Chapter 2
45
for all three gradient times used indicating an inherent limitation of the detection system. However, the same plot also shows that increasing analysis time allowed a considerably higher number of identifications of medium abundance proteins as judged from the shift of the distribution towards lower signal intensities. For analytical practice, the above observations collectively suggest that extending LC times might be useful for cases in which sample quantities are scarce but that multi-dimensional separations will likely be much more effective for samples of ‘unlimited’ quantities [38, 41].
Orbitrap Velos vs Orbitrap Elite
The overall performance of the Orbitrap Elite instrument was assessed by comparing it to its highly successful predecessor, the Orbitrap Velos. The main differences between the two instruments are i) the high field Orbitrap analyser of the Elite essentially improving scan speed and dynamic range at a given resolution, ii) enhanced FT data processing leading to higher resolution at a given scan speed and iii) improvements to the front end ion optics leading to higher ion currents and thus shorter fill times and better sensitivity of the dual pressure linear ion trap. The results of the comparisons using 100 ng HeLa digest analysed by a 60 min LC-MS/MS experiment are summarized in Table 1.
Table 1 | Comparison of performance metrics of the Orbitrap Elite and Orbitrap Velos.
Orbitrap Velos, HCD Orbitrap Elite, HCD % Difference
MS/MS scans 6,141 15,619 +154
Proteins 797 1,313 +65
Unique Peptides 3,540 5,730 +62
PSMs 3,954 6,300 +59
Scan Rate (Hz) 3.2 4.8 +50
Dynamic Range (log) a)
3.6 3.8 +158
Orbitrap Velos; CID normal Orbitrap Elite, CID normal % Difference
MS/MS scans 11,132 21,949 +97
Proteins 884 1,368 +55
Unique Peptides 3,466 4,789 +38
PSMs 4,074 6,423 +58
Scan Rate (Hz) 4.8 6.3 +24
Dynamic Range (log) a)
3.5 4.0 +316
Orbitrap Velos, CID normal Orbitrap Elite, CID rapid % Difference
MS/MS scans 11,132 23,781 +114
Proteins 884 1,451 +64
Unique Peptides 3,466 5,205 +50
PSMs 4,074 7,069 +74
Scan Rate (Hz) 4.8 7.1 +32
Dynamic Range (log) a)
3.5 4.0 +316
Chapter 2 | Elite performance evaluation
46
Noteworthy, both instruments used identical LC systems and column and the Orbitrap Velos was independently optimized for proteomic samples as described in the experimental section. The use of the high field Orbitrap allowed increasing the number of acquired tandem mass spectra by 100-150%. This increase in scan speed was most pronounced for HCD experiments because all spectra are sequentially read out in the Orbitrap. For HCD, the overall scan rate was improved from 3.2 to 4.8 spectra per second. This in turn increased the number of PSMs, peptides and proteins by approximately 60%. The combined improvements in the instrument hardware also lead to a substantial performance increase in CID experiments with ion trap read out. The scan speed increased from 4.8 to 6.3 Hz and the number of PSMs, peptides and proteins increased by ~50%. The use of the new CID rapid scan mode, improved performance further to 7.1 spectra per second and ~60% more PSMs, peptides and proteins compared to the Orbitrap Velos. The above experiments also showed a very substantial increase in dynamic intensity range of the identified proteins (calculated as for Figure 6 E). The Orbitrap Elite showed an increase of dynamic range of 5-15% in log space corresponding to 150-300% in absolute intensity over the Orbitrap Velos (95% top intensity percentile as discussed in the previous section). This can in part be attributed to the faster scan speed and higher sensitivity of the instrument and in part to the higher inherent intra scan dynamic range of the high field Orbitrap analyzer [42]. This substantial increase in dynamic range is of considerable benefit for both protein identification (detection of more peptides) and quantification (higher signal for peptides).
Elite performance evaluation | Chapter 2
47
Concluding remarks
In this study, a hybrid linear ion trap high field Orbitrap mass spectrometer was characterised for proteomic applications. The very high resolution available on this instrument allows 95% of all peptide masses to be measured with sub ppm accuracy which, in turn, improves protein identification by database searching. It was further shown again that mass accuracy in tandem mass spectra is a valuable parameter for improving the success of protein identification without compromising quality. Furthermore, the new CID rapid scan type of the Orbitrap Elite shows similar performance to HCD fragmentation and both allow the identification of hundreds of proteins from as little as 0.1 ng of protein digest on column. The Orbitrap Elite outperforms its predecessor by a considerable margin on each metric assessed. The performance increase for proteomic applications is similar to that reported recently for the Q Exactive, which is a hybrid quadrupole Orbitrap instrument [43] confirming that the high field Orbitrap Elite is a valuable and versatile tool for mass spectrometry based proteomics.
Chapter 2 | Elite performance evaluation
48
Abbreviations
AGC automatic gain control
CID collision induced dissociation
FASP filter aided sample preparation
FDR false discovery rate
FT Fourier transformation
FT-ICR Fourier transform ion cyclotron mass spectrometer
HCD higher energy collision induced dissociation
LC-MS/MS liquid chromatography coupled to tandem mass spectrometry
ppm parts per million
PSM peptide spectrum match
Elite performance evaluation | Chapter 2
49
References
1. Mallick, P.; Kuster, B., Proteomics: a pragmatic perspective. Nat Biotechnol 2010, 28 (7), 695-709.
2. Bantscheff, M.; Schirle, M.; Sweetman, G.; Rick, J.; Kuster, B., Quantitative mass spectrometry in proteomics: a critical review. Anal Bioanal Chem 2007, 389 (4), 1017-31.
3. Bantscheff, M.; Lemeer, S.; Savitski, M. M.; Kuster, B., Quantitative mass spectrometry in proteomics: critical review update from 2007 to the present. Anal Bioanal Chem 2012, 404 (4), 939-65.
4. Clauser, K. R.; Baker, P.; Burlingame, A. L., Role of accurate mass measurement (+/- 10 ppm) in protein identification strategies employing MS or MS/MS and database searching. Anal Chem 1999, 71 (14), 2871-82.
5. Zubarev, R.; Mann, M., On the proper use of mass accuracy in proteomics. Mol Cell Proteomics 2007, 6 (3), 377-81.
6. Zubarev, R. A.; Hakansson, P.; Sundqvist, B., Accuracy requirements for peptide characterization by monoisotopic molecular mass measurements. Anal Chem 1996, 68 (22), 4060–4063.
7. Haas, W.; Faherty, B. K.; Gerber, S. A.; Elias, J. E.; Beausoleil, S. A.; Bakalarski, C. E.; Li, X.; Villen, J.; Gygi, S. P., Optimization and use of peptide mass measurement accuracy in shotgun proteomics. Mol Cell Proteomics 2006, 5 (7), 1326-37.
8. Makarov, A.; Denisov, E.; Kholomeev, A.; Balschun, W.; Lange, O.; Strupat, K.; Horning, S., Performance evaluation of a hybrid linear ion trap/orbitrap mass spectrometer. Anal Chem 2006, 78 (7), 2113-20.
9. Makarov, A.; Denisov, E.; Lange, O.; Horning, S., Dynamic range of mass accuracy in LTQ Orbitrap hybrid mass spectrometer. J Am Soc Mass Spectrom 2006, 17 (7), 977-82.
10. Adachi, J.; Kumar, C.; Zhang, Y.; Olsen, J. V.; Mann, M., The human urinary proteome contains more than 1500 proteins, including a large proportion of membrane proteins. Genome Biol 2006, 7 (9), R80.
11. de Godoy, L. M.; Olsen, J. V.; Cox, J.; Nielsen, M. L.; Hubner, N. C.; Frohlich, F.; Walther, T. C.; Mann, M., Comprehensive mass-spectrometry-based proteome quantification of haploid versus diploid yeast. Nature 2008, 455 (7217), 1251-4.
12. Olsen, J. V.; Macek, B.; Lange, O.; Makarov, A.; Horning, S.; Mann, M., Higher-energy C-trap dissociation for peptide modification analysis. Nat Methods 2007, 4 (9), 709-12.
13. Hahne, H.; Moghaddas Gholami, A.; Kuster, B., Discovery of O-GlcNAc-modified proteins in published large-scale proteome data. Mol Cell Proteomics 2012, 11 (10), 843-50.
14. Phanstiel, D. H.; Brumbaugh, J.; Wenger, C. D.; Tian, S.; Probasco, M. D.; Bailey, D. J.; Swaney, D. L.; Tervo, M. A.; Bolin, J. M.; Ruotti, V.; Stewart, R.; Thomson, J. A.; Coon, J. J., Proteomic and phosphoproteomic comparison of human ES and iPS cells. Nat Methods 2011, 8 (10), 821-7.
15. Pachl, F.; Fellenberg, K.; Wagner, C.; Kuster, B., Ultra-high intra-spectrum mass accuracy enables unambiguous identification of fragment reporter ions in isobaric multiplexed quantitative proteomics. Proteomics 2012, 12 (9), 1328-32.
Chapter 2 | Elite performance evaluation
50
16. Michalski, A.; Damoc, E.; Lange, O.; Denisov, E.; Nolting, D.; Muller, M.; Viner, R.; Schwartz, J.; Remes, P.; Belford, M.; Dunyach, J. J.; Cox, J.; Horning, S.; Mann, M.; Makarov, A., Ultra high resolution linear ion trap Orbitrap mass spectrometer (Orbitrap Elite) facilitates top down LC MS/MS and versatile peptide fragmentation modes. Mol Cell Proteomics 2012, 11 (3), O111 013698.
17. Xian, F.; Hendrickson, C. L.; Blakney, G. T.; Beu, S. C.; Marshall, A. G., Automated Broadband Phase Correction of Fourier Transform Ion Cyclotron Resonance Mass Spectra. Anal Chem 2010.
18. Ahlf, D. R.; Compton, P. D.; Tran, J. C.; Early, B. P.; Thomas, P. M.; Kelleher, N. L., Evaluation of the compact high-field orbitrap for top-down proteomics of human cells. J Proteome Res 2012, 11 (8), 4308-14.
19. Geiger, T.; Wehner, A.; Schaab, C.; Cox, J.; Mann, M., Comparative proteomic analysis of eleven common cell lines reveals ubiquitous but varying expression of most proteins. Mol Cell Proteomics 2012, 11 (3), M111 014050.
20. Vincent, C. E.; Potts, G. K.; Ulbrich, A.; Westphall, M. S.; Atwood, J. A., 3rd; Coon, J. J.; Weatherly, D. B., Segmentation of Precursor Mass Range Using "Tiling" Approach Increases Peptide Identifications for MS(1)-Based Label-Free Quantification. Anal Chem 2013.
21. Wisniewski, J. R.; Zougman, A.; Nagaraj, N.; Mann, M., Universal sample preparation method for proteome analysis. Nat Methods 2009, 6 (5), 359-62.
22. Rappsilber, J.; Mann, M.; Ishihama, Y., Protocol for micro-purification, enrichment, pre-fractionation and storage of peptides for proteomics using StageTips. Nat Protoc 2007, 2 (8), 1896-906.
23. Cox, J.; Neuhauser, N.; Michalski, A.; Scheltema, R. A.; Olsen, J. V.; Mann, M., Andromeda: a peptide search engine integrated into the MaxQuant environment. J Proteome Res 2011, 10 (4), 1794-805.
24. Conrads, T. P.; Anderson, G. A.; Veenstra, T. D.; Pasa-Tolic, L.; Smith, R. D., Utility of accurate mass tags for proteome-wide protein identification. Anal Chem 2000, 72 (14), 3349-54.
25. Spengler, B., De novo sequencing, peptide composition analysis, and composition-based sequencing: a new strategy employing accurate mass determination by fourier transform ion cyclotron resonance mass spectrometry. J Am Soc Mass Spectrom 2004, 15 (5), 703-14.
26. Ducret, A.; Van Oostveen, I.; Eng, J. K.; Yates, J. R., 3rd; Aebersold, R., High throughput protein characterization by automated reverse-phase chromatography/electrospray tandem mass spectrometry. Protein Sci 1998, 7 (3), 706-19.
27. Peng, J.; Elias, J. E.; Thoreen, C. C.; Licklider, L. J.; Gygi, S. P., Evaluation of multidimensional chromatography coupled with tandem mass spectrometry (LC/LC-MS/MS) for large-scale protein analysis: the yeast proteome. J Proteome Res 2003, 2 (1), 43-50.
28. Schirle, M.; Heurtier, M. A.; Kuster, B., Profiling core proteomes of human cell lines by one-dimensional PAGE and liquid chromatography-tandem mass spectrometry. Mol Cell Proteomics 2003, 2 (12), 1297-305.
29. Elias, J. E.; Gygi, S. P., Target-decoy search strategy for increased confidence in large-scale protein identifications by mass spectrometry. Nat Methods 2007, 4 (3), 207-14.
Elite performance evaluation | Chapter 2
51
30. Resing, K. A.; Meyer-Arendt, K.; Mendoza, A. M.; Aveline-Wolf, L. D.; Jonscher, K. R.; Pierce, K. G.; Old, W. M.; Cheung, H. T.; Russell, S.; Wattawa, J. L.; Goehle, G. R.; Knight, R. D.; Ahn, N. G., Improving reproducibility and sensitivity in identifying human proteins by shotgun proteomics. Anal Chem 2004, 76 (13), 3556-68.
31. Jedrychowski, M. P.; Huttlin, E. L.; Haas, W.; Sowa, M. E.; Rad, R.; Gygi, S. P., Evaluation of HCD- and CID-type fragmentation within their respective detection platforms for murine phosphoproteomics. Mol Cell Proteomics 2011, 10 (12), M111 009910.
32. Frese, C. K.; Altelaar, A. F.; Hennrich, M. L.; Nolting, D.; Zeller, M.; Griep-Raming, J.; Heck, A. J.; Mohammed, S., Improved peptide identification by targeted fragmentation using CID, HCD and ETD on an LTQ-Orbitrap Velos. J Proteome Res 2011, 10 (5), 2377-88.
33. Shen, Y.; Tolic, N.; Xie, F.; Zhao, R.; Purvine, S. O.; Schepmoes, A. A.; Moore, R. J.; Anderson, G. A.; Smith, R. D., Effectiveness of CID, HCD, and ETD with FT MS/MS for degradomic-peptidomic analysis: comparison of peptide identification methods. J Proteome Res 2011, 10 (9), 3929-43.
34. Nagaraj, N.; D'Souza, R. C.; Cox, J.; Olsen, J. V.; Mann, M., Correction to Feasibility of Large-Scale Phosphoproteomics with Higher Energy Collisional Dissociation Fragmentation. J Proteome Res 2012.
35. Michalski, A.; Cox, J.; Mann, M., More than 100,000 detectable peptide species elute in single shotgun proteomics runs but the majority is inaccessible to data-dependent LC-MS/MS. J Proteome Res 2011, 10 (4), 1785-93.
36. Picotti, P.; Aebersold, R.; Domon, B., The implications of proteolytic background for shotgun proteomics. Mol Cell Proteomics 2007, 6 (9), 1589-98.
37. Han, G.; Ye, M.; Liu, H.; Song, C.; Sun, D.; Wu, Y.; Jiang, X.; Chen, R.; Wang, C.; Wang, L.; Zou, H., Phosphoproteome analysis of human liver tissue by long-gradient nanoflow LC coupled with multiple stage MS analysis. Electrophoresis 2010, 31 (6), 1080-9.
38. Kocher, T.; Pichler, P.; Swart, R.; Mechtler, K., Analysis of protein mixtures from whole-cell extracts by single-run nanoLC-MS/MS using ultralong gradients. Nat Protoc 2012, 7 (5), 882-90.
39. Sandra, K.; Moshir, M.; D'Hondt, F.; Tuytten, R.; Verleysen, K.; Kas, K.; Francois, I.; Sandra, P., Highly efficient peptide separations in proteomics. Part 2: bi- and multidimensional liquid-based separation techniques. J Chromatogr B Analyt Technol Biomed Life Sci 2009, 877 (11-12), 1019-39.
40. Tabb, D. L.; Vega-Montoto, L.; Rudnick, P. A.; Variyath, A. M.; Ham, A. J.; Bunk, D. M.; Kilpatrick, L. E.; Billheimer, D. D.; Blackman, R. K.; Cardasis, H. L.; Carr, S. A.; Clauser, K. R.; Jaffe, J. D.; Kowalski, K. A.; Neubert, T. A.; Regnier, F. E.; Schilling, B.; Tegeler, T. J.; Wang, M.; Wang, P.; Whiteaker, J. R.; Zimmerman, L. J.; Fisher, S. J.; Gibson, B. W.; Kinsinger, C. R.; Mesri, M.; Rodriguez, H.; Stein, S. E.; Tempst, P.; Paulovich, A. G.; Liebler, D. C.; Spiegelman, C., Repeatability and reproducibility in proteomic identifications by liquid chromatography-tandem mass spectrometry. J Proteome Res 2010, 9 (2), 761-76.
41. Hsieh, E. J.; Bereman, M. S.; Durand, S.; Valaskovic, G. A.; Maccoss, M. J., Effects of Column and Gradient Lengths on Peak Capacity and Peptide Identification in Nanoflow LC-MS/MS of Complex Proteomic Samples. J Am Soc Mass Spectrom 2013, 24 (1), 148-53.
42. Makarov, A.; Denisov, E.; Lange, O., Performance evaluation of a high-field Orbitrap mass analyzer. J Am Soc Mass Spectrom 2009, 20 (8), 1391-6.
43. Kelstrup, C. D.; Young, C.; Lavallee, R.; Nielsen, M. L.; Olsen, J. V., Optimized Fast and

Chapter 2 | Elite performance evaluation
52
Sensitive Acquisition Methods for Shotgun Proteomics on a Quadrupole Orbitrap Mass Spectrometer. J Proteome Res 2012.
Chapter 3
Ultra-high intra spectrum mass accuracy enables
unambiguous identification of fragment reporter ions in
isobaric multiplexed quantitative proteomics

Quantitative mass spectrometry | Chapter 3
55
Introduction
Mass spectrometry (MS) based proteomics has become increasingly quantitative and a multitude of techniques have been developed for this purpose, such as label-free or stable isotope labeling approaches [1] [2, 3]. Chemical labeling using isobaric reagents, such as isobaric tags for relative and absolute quantification (iTRAQ) [4] and tandem mass tags (TMT) [5], have gained popularity because they enable multiplexed quantification of peptides and proteins (up to eight for iTRAQ and six for TMT labels). A particularity of this type of stable isotope labelling is that the quantification information is derived from differentially labelled peptide reporter ions present in the fragment ion rather than the precursor ion spectra. When isobaric peptide labelling was introduced, the mass spectrometric analysis mainly utilized collision induced dissociation (CID) on hybrid quadrupole time of flight (qTOF), TOF-TOF or triple quadrupole instruments because these mass analysers cover the mass range in which isobaric labelling reporter ions are found. This capability was later extended to ion traps which are important work horses of MS-based proteomics using the so-called pulsed q dissociation (PQD) technique [1, 6] and using beam-type CID (also referred to higher energy collision induced dissociation, HCD) in a multipole collision cell on recent versions of hybrid ion trap-Orbitrap instruments [7-9]. However both PQD and HCD have their shortcomings. The fragmentation efficiency of PQD is rather low and reporter ion mass precision in ion traps is only moderate which negatively impacts on sensitivity for peptide identification and precision of peptide quantification. At least for the commonly used LTQ Orbitrap XL instrument, HCD also suffers from rather low sensitivity for peptide identification compared to the classical ion trap CID experiment but HCD enables efficient reporter ion generation in conjunction with high mass accuracy detection. Several groups have therefore recently reported data acquisition schemes that combine the benefits of both methods by alternating the acquisition of CID and HCD spectra from the same peptide precursors [7, 10]. The two tandem MS spectra are then combined by software and allow peptide identification and quantification from the same spectrum.
Recent reports [1, 11] have shown that the accuracy of isobaric tagging based quantification is impaired by co-elution peptides which are co-fragmented when within the isolation window for selection. This results in the underestimation of accurate protein abundance, so-called ‘ratio compression’, and several attempts for a solution have been suggested [12-15]. In contrast, MS intensity-based label-free quantification approaches do not suffer from such a systematic bias. More over label-free strategies can provide a higher analytical depth with no principle limit in dynamic range or number of experiments to be compared. However, they tend to be less precise and a robust LC-MS setup is highly required. Regarding quantification with isobaric tags, it has furthermore been observed that high collision energy HCD spectra collected on an LTQ-Orbitrap XL instrument also contain many non-TMT signals that are nearly isobaric with TMT reporter ions which in turn may distort quantification accuracy depending on the mass tolerance used for picking and integrating TMT signals from the spectrum. In this study, it is shown that this signal interference issue can be easily eliminated by identifying TMT reporter
Chapter 3 | Quantitative mass spectrometry
56
ions in HCD spectra not by their measured m/z values but by using the known mass differences between TMT reporter ions present within the same tandem mass spectrum. This leads to i) removal of all non-TMT signals from the spectra and ii) sub-ppm fragment ion mass errors at which the TMT reporter masses become unique in terms of chemical composition. The data on the quantification of proteins of a complex E. coli proteome as well as in a chemoproteomic binding assay for the kinase inhibitor lapatinib shows that the quality of peptide and protein quantification can be improved. This data analysis strategy is generically applicable for any tandem mass spectrometer and is easily implemented in software. Besides, protein quantification results from the improved isobaric tags were compared to results obtained with label-free quantification for a selectivity assay using the kinase inhibitor erlotinib in order to estimate the impact of ratio compression on the determination of dose-response curves of target proteins. Here, the label-free approach showed superior performance over TMT-based quantification by a higher coverage of the kinome as well as a more accurate determination of inhibitor potencies suggesting to use intensity-based label-free quantification for that particular kind of application.
Quantitative mass spectrometry | Chapter 3
57
Material and Methods
Standard laboratory reagents were purchased from Sigma, Roth and Merck unless otherwise noted. The commercial bovine serum albumin digest was purchased from Michrom Bioresources. Lapatinib and erlotinib were purchased from LC laboratories and TMT 6-plex reagent from Thermo Scientific.
Sample preparation
Post-delivery human placenta tissue (obtained from Freising hospital following informed consent) was thoroughly washed with cold phosphate buffered saline (PBS) and homogenized in lysis buffer (50 mM Tris/HCl pH 7.5, 5% Glycerol, 1.5 mM MgCl2, 150 mM NaCl, 0.8% NP-40, 1 mM dithiothreitol and 25 mM NaF with freshly added protease inhibitors and phosphatase inhibitors) using a tissue grinder. Lysates were incubated for 30 min at 4 °C and protein extracts were clarified by ultracentrifugation for 1 h at 145,000 x g at 4 °C. Protein concentration was determined by the Bradford method.
E.coli K1β DH5α was grown aerobically at γ7 °C in LB medium. Exponentially growing cells were lysed by sonication in 50 mM Tris-HCl (pH 7.5) containing protease inhibitors (SIGMAFAST, Sigma-Aldrich, Munich, Germany). The cytosolic protein extract was reduced using 20 mM dithiothreitol, alkylated with 100 mM iodoacetamide and digested in solution with trypsin (1:50 w/w enzyme:substrate ratio, Promega Corp., Madison, WI, USA). Peptides were purified prior to LC-MS/MS analyses using C18 μZipTips (Millipore Corporation, Billerica, MA, USA) according to the manufacturer’s protocol.
Affinity purification
Kinobead pulldowns were performed as described previously [6]. Briefly, placenta lysates were diluted with equal volumes of 1x compound pulldown (CP) buffer (50 mM Tris/HCl pH 7.5, 5% glycerol, 1.5 mM MgCl2, 150 mM NaCl, 25 mM NaF, 1 mM dithiothreitol and freshly added protease inhibitors (SIGMAFAST, Sigma-Aldrich) and phosphatase inhibitors (5x phosphatase inhibitor cocktail1, Sigma-Aldrich, Munich, Germany, 5x phosphatase inhibitor cocktail 2, Sigma-Aldrich, Munich, Germany, 1 mM sodium ortho-vanadate and 20 nM Calyculin A, LC Laboratories, Woburn, MA, USA)). If necessary, lysates were further diluted to a final protein concentration of 5 mg/ml using 1x CP buffer supplemented with 0.4% NP-40.
For selectivity profiling experiments, the placenta lysates (10 mg total protein each) were pre-incubated with 0 nM (DMSO control), 1 nM, 10 nM, 100 nM, 1 µM or 10 µM of free compound (lapatinib, erlotinib) on an end-over-end shaker for 45 min at 4°C. Subsequently, lysates were incubated with kinobeads for 1 h at 4°C. The beads were washed with 1x CP buffer and collected by centrifugation. Bound proteins were eluted with 2x NuPAGE LDS Sample Buffer (Invitrogen, Darmstadt, Germany) and eluates were reduced and alkylated by 50 mM dithiothreitol and 55 mM iodoacetamide.
Chapter 3 | Quantitative mass spectrometry
58
Samples were then run into a 4–12% NuPAGE gel (Invitrogen, Darmstadt, Germany) for about 0.5 cm to concentrate the sample prior to in-gel tryptic digestion. In-gel trypsin digestion was performed according to standard procedures.
TMT labeling of tryptic peptides
TMT labeling was performed as described previously [6]. Briefly, tryptic peptides were labeled by adding 50 μL labeling buffer (20 mM TEAB, 60% acetonitrile) containing 0.1 mg of TMT reagent and incubation for 1 h at room temperature. For selectivity profiles, DMSO control was labeled with TMT131 reagent, 1 nM, 10 nM, 100 nM, 1 µM and 10 µM conditions with TMT130, TMT129, TMT128, TMT127 and TMT 126, respectively. Then, 8 μL of hydroxylamine (5%) was added and incubated for additional 15 min to quench the reaction. 30 ng of TMT labeled BSA digest (TMT 126:127:128:129:130:131 = 1:2:4:8:16:32) was spiked into 6 μg TMT-labeled E.coli digest (1:1:1:1:1:1). For selectivity assays, equal amounts of differently labeled peptide extracts were mixed. Priot to LC-MS/MS analysis, peptides were purified using C18 μZipTips (Millipore Corporation, Billerica, MA, USA) according to the manufacturer’s protocol.
SAX separation
For in-depth analysis of the TMT labeled chemoproteomic sample, peptides were first separated to 6 fractions using strong anion exchange chromatography (SAX) prior to LC-MS/MS measurement [16]. Briefly, TMT-labeled peptides were separated on a pipet-based anion exchanger, which was prepared by stacking 6 layers of a 3M Empore Anion Exchange disk (Sigma-Aldrich, Germany) in a β00 μl pipet tip.
Columns were equilibrated with 100 μl MeOH, followed by 100 μl 1M NaOH and 100 μl Britton & Robinson (BR) buffer pH 11 (20mM acetic acid, 20mM phosphoric acid 85 %, 20mM boric acid titrated with NaOH to the desired pH). Peptides were loaded in BR buffer pH 11 (flow-through equals first fraction) and fractions were subsequently eluted with BR buffer solutions of pH 8, 6, 5, 4 and 3, respectively. Each flow-through was captured on a StageTip containing three layers of C18 One Empore disk (Sigma-Aldrich, Germany) and purified as described [17].
LC-MS/MS measurements
Mass spectrometry was performed on a LTQ Orbitrap XL mass spectrometer (Thermo Fisher Scientific, Germany) coupled to a nanoLC Ultra 1D+ liquid chromatography system (Eksigent, CA). Peptides were separated using an in house packed trap column (β0 mm x 75 μm RepoSil-Pur C18, Dr. Maisch, Germany) in line with an analytical column (β00 mm x 75 μm RepoSil-Pur C18, Dr. Maisch, Germany). Gradient elution of TMT-labeled peptides was performed from 2 to 28% solvent B (0.1 M formic acid in 100% acetonitrile) within 180 min or 225 min at a flowrate of 300 nL/min. Non-labeled peptides were separated using a linear gradient from 2% to 35% solvent B within 225 min. The eluent was sprayed via emitter tips (PicoTip, New Objective, MA) using a nano-electrospray ion source (Proxeon Biosystems, DK).
Quantitative mass spectrometry | Chapter 3
59
The mass spectrometer was operated in positive ion mode. Full scan MS spectra were acquired in the orbitrap recording a window between 300 and 1200 m/z at a resolution of 60,000 (at m/z 400) after accumulation to a target value of 1,000,000.
The TMT-labeled samples were analyzed using a CID-HCD dual scan approach [7, 18]. CID of the five most intense ions was performed in the LTQ at a normalized collision energy of 35% after accumulation to a target value of 5000 for a maximum of 500 ms. Subsequently, HCD tandem mass spectra were triggered from the same five precursor ions. HCD ions were generated in the HCD collision cell using a normalized collision energy of 75%, a target value of 30,000 and 750 ms maximal accumulation time and subsequently detected in the orbitrap at a resolution of 7500. Precursor ions were put on a dynamic exclusion list for 30 s. Internal calibration was enabled for both MS and MS/MS mode using the ion signal of (Si(CH3)2O)6 as a lock mass.
Analysis of the label-free samples was performed with a top 8 CID approach using the same parameter settings as for TMT-labeled samples.
Data processing
The raw CID-HCD data was processed into Mascot searchable files (mgf) using Mascot Distiller (Matrix Science, UK). Two separate .mgf files were generated, each with peak processing and picking optimized for either peptide identification by CID or TMT quantification by HCD spectra. Briefly, uncentroiding of tandem MS spectra and isotope fitting was enabled for optimal CID scan processing (_CID.mgf). For HCD scans, peak lists were generated without further peak processing (_HCD.mgf). Then, the two .mgf files were merged into a single .mgf file using the provided Perl script (CID-HCDmerge). In short, for each HCD spectrum the TMT reporter ions were detected by their characteristic mass differences. The intensities of the reporter ions were extracted and their mass offset corrected. Further processing and visualization of the TMT intensities was done in MATLAB (The MathWorks, Germany). The processed reporter signals were pasted into the corresponding CID spectrum of the _CID.mgf file, deleting the respective m/z window at the same time. Resulting peak lists (_CID_cut_HCD.mgf) were searched using the Mascot search engine version 2.3.01 (Matrix Science, UK). Data from the BSA/E.coli experiment was searched against the SwissProt database version 57.15 (515,203 entries). Data from the human samples were searched against the human International Protein Index (IPI) database version 3.68 (87,061 entries). A precursor tolerance of 10 ppm and a fragment tolerance of 0.6 Da was used in all cases. Enzyme specificity was set to trypsin and up to two missed cleavage sites were allowed. TMT 6plex at N-termini and lysine residues was set as fixed modification and, for the lapatinib selectivity data set, also carbamidomethylation at cystein. Variable modifications included N-terminal acetylation, oxidation of methionine, phosphorylation of serine, threonine and tyrosine and pyroglutamic acid formation of glutamine and glutamic acid, for the BSA/E.coli experiment in addition carboxy- (BSA) and carbamido- (E.coli) methylation at cystein. Quantification of TMT-labeled peptides was performed by Mascot without any further isotope corrections or normalization (already done within the pearl script).

Chapter 3 | Quantitative mass spectrometry
60
Quantitative analysis using intensity-based label-free quantification was performed by the Progenesis software (version 3.1; Nonlinear Dynamics, Newcastle, UK) Briefly, after selecting one sample as a reference, the retention times of all eluting precursor m/z values in all other samples within the experiment were aligned creating a large list of “features” representing the same peptide in each sample. Features with two to five charges were included for further analysis. Features with two or less isotopes were excluded. After alignment and feature filtering, replicate samples were grouped together, and raw abundances of all features were normalized to determine a global scaling factor for correcting experimental variation such as differences in the quantity of protein loaded into the instrument. Briefly, for each sample, one unique factor is calculated and used to correct all features in the sample for experimental variation as described previously [19]. MS/MS spectra were transformed into peak lists and exported to generate Mascot generic files. The Mascot generic files were searched against the protein sequence database IPI human (v. 3.68, 87,061 sequences) using Mascot (version 2.3.01, Matrix Science, London, UK). Search parameters were as follows: precursor tolerance 10 ppm, fragment tolerance 0.02 Da, full tryptic specificity with up to two missed cleavage sites, miss-assignment of the monoisotopic peak to the first 13C peak, fixed modification of carbamidomethylation of cysteine residues and variable modification of N-terminal protein acetylation and methionine oxidation. Search results for spectrum to peptide matches were exported in .xml format and then imported into Progenesis software to enable the combination of peptide quantification and identification. Peptides with mascot ion scores ≤γβ (p = 0.05 identity threshold) were filtered out, and only unique peptides for corresponding proteins were used for identification and quantification. In dose response measurements, protein quantification was performed by summing, the feature intensities of all unique peptides of a protein.

Quantitative mass spectrometry | Chapter 3
61
Results and Discussion
In a typical dual CID-HCD data acquisition workflow is shown in Figure 1 including data obtained from a LTQ-Orbitrap XL. TMT labeled peptides are fragmented first by ion trap CID (Figure 1 A) and second by collision cell HCD (Figure 1 B). While the CID spectra are rich in peptide sequence ions, the HCD spectrum shows intense TMT reporter ion signals. The information from the two spectra can be combined by extracting the TMT ions from the HCD spectra and inserting them into the CID spectra. The resulting chimeric HCD/CID spectrum (panel C) can then be used for both peptide identification and quantification.
Figure 1 | Tandem mass spectra of the TMT-labeled tryptic peptide EISDGDVIISGNK.
Panel A: resonance type CID spectrum collected in the ion trap part of the LTQ-Orbitrap XL used in this study. The
typical range of b- and y-type fragment ions indicative of the peptide sequence are shown. No TMT ions are
detected owing to the so-called low mass cut-off of ion trap spectra. Panel B: high energy HCD spectrum (75%
normalized collision energy) of the same peptide collected in the Orbitrap. Only few sequence ions are detected
under these conditions but instead, intense TMT reporter signals are present in the low mass part of the spectrum.
Panel C: combined CID/HCD spectrum in which the TMT ions from panel B are inserted into the CID spectrum to
allow peptide identification and quantification from the same spectrum. Note that it generally requires first to
remove all ions from the TMT range of the CID spectrum prior to inserting these ions from the HCD spectrum. The
intensity of the inserted HCD ions also needs adjusting because the intensity scales of HCD and CID spectra are
different. Both these steps are performed by the script provided. BPI: base peak intensity.
BPI: 2.88E4
BPI: 3.61E3
BPI: 3.61E3
Chapter 3 | Quantitative mass spectrometry
62
Interference of reporter ion signals
In order to obtain high TMT reporter ion intensities, relatively high collision energies are often used (here 75% normalized collision energy). When integrating data across an LC-MS/MS experiment of a complex proteome, many ion signals in addition to the expected TMT reporter ions can be detected in this m/z range (Figure 2 A). These interfering signals are generally weaker than the TMT ions but still span three orders of magnitude in intensity. A noticeable but relatively small population of ions can be identified as TMT-labeled peptides from poorly calibrated HCD spectra (when using the lock mass option for calibrating MS/MS spectra which fails in a number of cases [10]). Another, also small population of ions can be attributed to ordinary peptide fragment ions with similar masses to those of TMT reporter ions (e.g. the a2 ion of GV at 129.10288 and others). Similar ions are also observed on qTOF systems (data – not shown - kindly provided by Christian Frese, Marco Hennrich and Shabaz Mohammed, Netherlands Proteomics Centre). However, a large proportion of the observed signals in the TMT region of Orbitrap HCD spectra do not correspond to any plausible chemical compositions and may in part be attributed to artifacts related to amplifying and processing the transient signal of the Orbitrap [20]. Particularly puzzling is by the large ion population between m/z 126 and 127 for which cannot be explained at present in part because it is not very reproducible and most of the signals do not correspond to plausible chemical compositions. When analyzing data from a different sample, which was labeled with a different batch of TMT, the dense ion population is observed between m/z 128 and 129 (data not shown).
Enhanced reporter ion peak picking for accurate quantification
From the observations made above, the considerable danger thus arises that the presence of near isobaric but non-TMT signals may distort quantification results. This source of quantification error is different to ones reported earlier which arise from co-selection of several TMT labeled peptides of similar precursor ion m/z values for fragmentation. The latter can be (partially) overcome by narrow precursor selection, MS3 experiments or by estimating the contribution of each co-selected precursor to the total TMT signal [1, 9, 21]. In order to overcome the separate issue of near isobaric signal interference, it was evaluated if TMT ions can not only be identified in tandem mass spectra by their expected m/z value (+/- a tolerated error) but instead by the precisely known mass differences between the individual TMT channels (Figure 2 A). The simple rational behind this approach, and which is also often used in de-novo peptide sequencing [22], is that the observed mass differences within a single tandem mass spectrum are often more accurate than the actual calibration of this spectrum. In this case, TMT ions can be identified from even very poorly calibrated spectra. The only prerequisite for this to work is the detection of at least two TMT channels in one tandem MS spectrum.
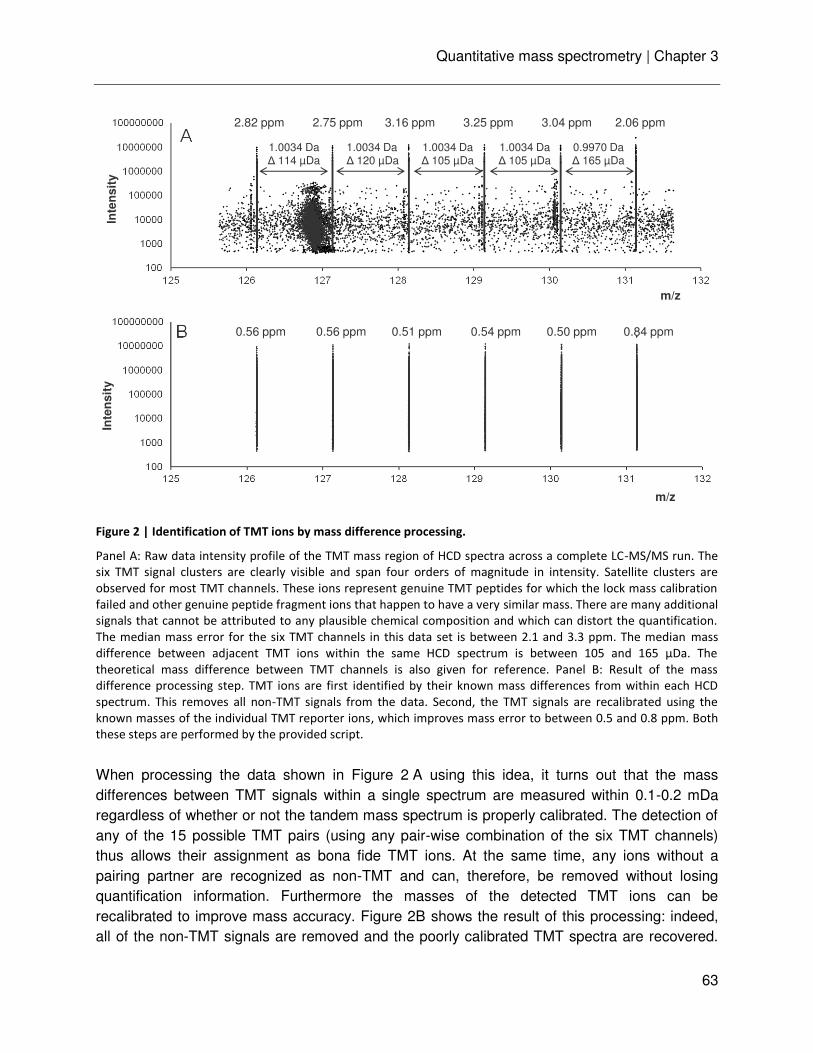
Quantitative mass spectrometry | Chapter 3
63
Figure 2 | Identification of TMT ions by mass difference processing.
Panel A: Raw data intensity profile of the TMT mass region of HCD spectra across a complete LC-MS/MS run. The
six TMT signal clusters are clearly visible and span four orders of magnitude in intensity. Satellite clusters are
observed for most TMT channels. These ions represent genuine TMT peptides for which the lock mass calibration
failed and other genuine peptide fragment ions that happen to have a very similar mass. There are many additional
signals that cannot be attributed to any plausible chemical composition and which can distort the quantification.
The median mass error for the six TMT channels in this data set is between 2.1 and 3.3 ppm. The median mass
difference between adjacent TMT ions within the same HCD spectrum is between 105 and 165 µDa. The
theoretical mass difference between TMT channels is also given for reference. Panel B: Result of the mass
difference processing step. TMT ions are first identified by their known mass differences from within each HCD
spectrum. This removes all non-TMT signals from the data. Second, the TMT signals are recalibrated using the
known masses of the individual TMT reporter ions, which improves mass error to between 0.5 and 0.8 ppm. Both
these steps are performed by the provided script.
When processing the data shown in Figure 2 A using this idea, it turns out that the mass differences between TMT signals within a single spectrum are measured within 0.1-0.2 mDa regardless of whether or not the tandem mass spectrum is properly calibrated. The detection of any of the 15 possible TMT pairs (using any pair-wise combination of the six TMT channels) thus allows their assignment as bona fide TMT ions. At the same time, any ions without a pairing partner are recognized as non-TMT and can, therefore, be removed without losing quantification information. Furthermore the masses of the detected TMT ions can be recalibrated to improve mass accuracy. Figure 2B shows the result of this processing: indeed, all of the non-TMT signals are removed and the poorly calibrated TMT spectra are recovered.
2.82 ppm 2.75 ppm 3.16 ppm 3.25 ppm 3.04 ppm 2.06 ppm
1.0034 DaΔ 114 µDa
1.0034 DaΔ 105 µDa
1.0034 DaΔ 120 µDa
1.0034 DaΔ 105 µDa
0.9970 DaΔ 165 µDa
Inte
ns
ity
m/z
0.56 ppm 0.56 ppm 0.51 ppm 0.54 ppm 0.50 ppm 0.84 ppm
Inte
ns
ity
m/z
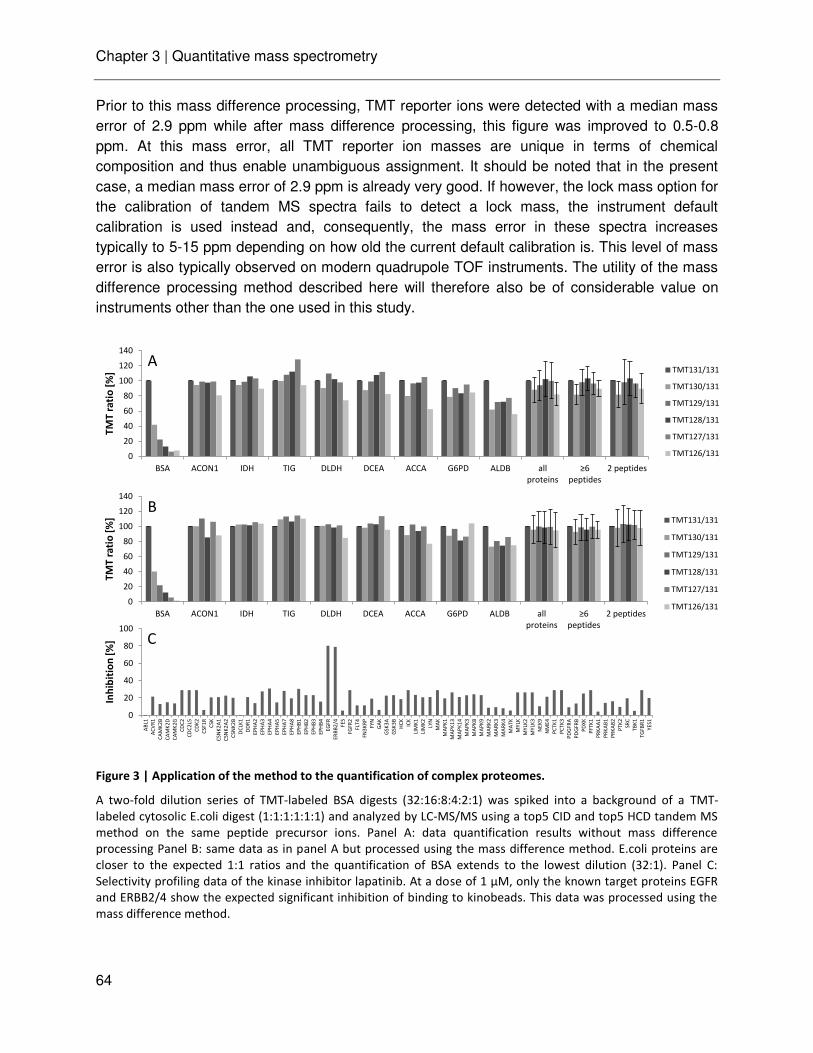
Chapter 3 | Quantitative mass spectrometry
64
Prior to this mass difference processing, TMT reporter ions were detected with a median mass error of 2.9 ppm while after mass difference processing, this figure was improved to 0.5-0.8 ppm. At this mass error, all TMT reporter ion masses are unique in terms of chemical composition and thus enable unambiguous assignment. It should be noted that in the present case, a median mass error of 2.9 ppm is already very good. If however, the lock mass option for the calibration of tandem MS spectra fails to detect a lock mass, the instrument default calibration is used instead and, consequently, the mass error in these spectra increases typically to 5-15 ppm depending on how old the current default calibration is. This level of mass error is also typically observed on modern quadrupole TOF instruments. The utility of the mass difference processing method described here will therefore also be of considerable value on instruments other than the one used in this study.
Figure 3 | Application of the method to the quantification of complex proteomes.
A two-fold dilution series of TMT-labeled BSA digests (32:16:8:4:2:1) was spiked into a background of a TMT-
labeled cytosolic E.coli digest (1:1:1:1:1:1) and analyzed by LC-MS/MS using a top5 CID and top5 HCD tandem MS
method on the same peptide precursor ions. Panel A: data quantification results without mass difference
processing Panel B: same data as in panel A but processed using the mass difference method. E.coli proteins are
closer to the expected 1:1 ratios and the quantification of BSA extends to the lowest dilution (32:1). Panel C:
Selectivity profiling data of the kinase inhibitor lapatinib. At a dose of 1 µM, only the known target proteins EGFR
and ERBB2/4 show the expected significant inhibition of binding to kinobeads. This data was processed using the
mass difference method.
0
20
40
60
80
100
120
140
BSA ACON1 IDH TIG DLDH DCEA ACCA G6PD ALDB all
proteins
≥6 peptides
2 peptides
TM
T r
ati
o [
%] TMT131/131
TMT130/131
TMT129/131
TMT128/131
TMT127/131
TMT126/131
0
20
40
60
80
100
120
140
BSA ACON1 IDH TIG DLDH DCEA ACCA G6PD ALDB all
proteins
≥6 peptides
2 peptides
TM
T r
ati
o [
%] TMT131/131
TMT130/131
TMT129/131
TMT128/131
TMT127/131
TMT126/131
0
20
40
60
80
100
AB
L1
AC
VR
1
CA
MK
2B
CA
MK
2D
CA
MK
2G
CD
C2
CD
C2
L5
CD
K2
CS
F1
R
CS
K
CS
NK
2A
1
CS
NK
2A
2
CS
NK
2B
DC
LK1
DD
R1
EP
HA
2
EP
HA
3
EP
HA
4
EP
HA
5
EP
HA
7
EP
HA
8
EP
HB
1
EP
HB
2
EP
HB
3
EP
HB
4
EG
FR
ER
BB
2/4
FE
S
FG
FR
2
FLT
4
FN
3K
RP
FY
N
GA
K
GS
K3
A
GS
K3
B
HC
K
ICK
LIM
K1
LIM
K2
LYN
MA
K
MA
PK
1
MA
PK
13
MA
PK
14
MA
PK
3
MA
PK
8
MA
PK
9
MA
RK
2
MA
RK
3
MA
RK
4
MA
TK
MY
LK
MY
LK2
MY
LK3
NE
K9
NM
E4
PC
TK
1
PC
TK
3
PD
GF
RA
PD
GF
RB
PD
XK
PF
TK
1
PR
KA
A1
PR
KA
B1
PR
KA
B2
PT
K2
SR
C
TB
K1
TG
FB
R1
YE
S1
Inh
ibit
ion
[%
]
A
B
C
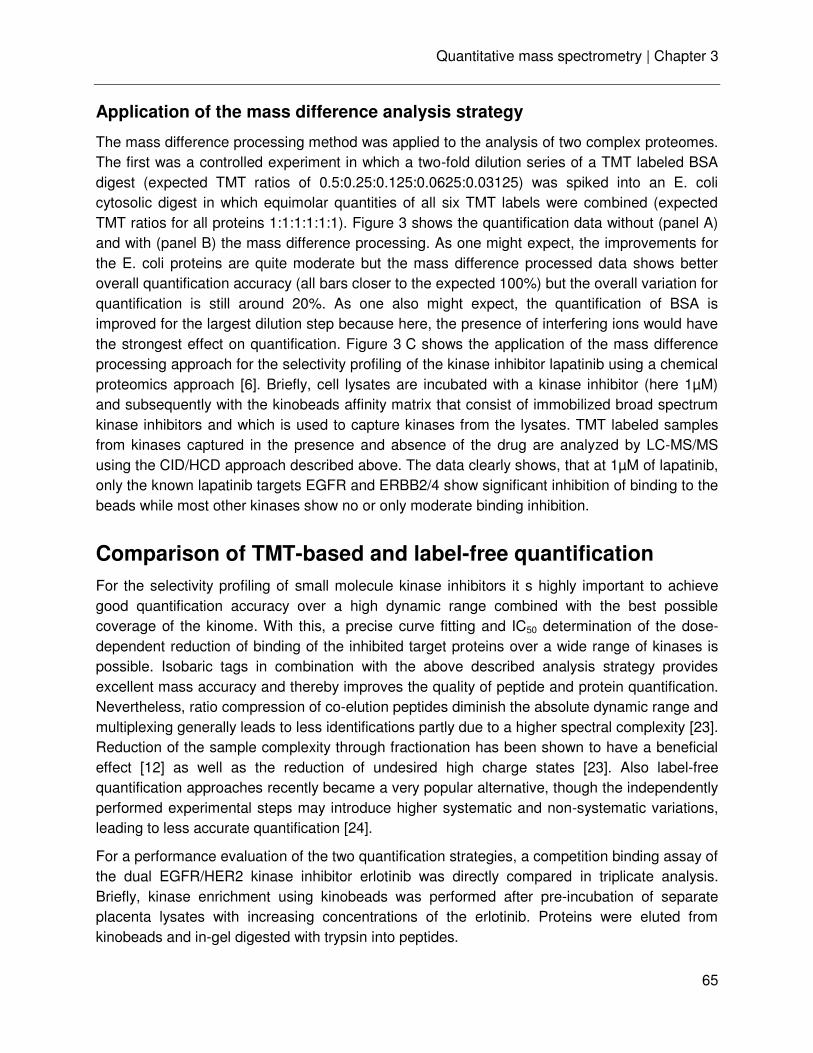
Quantitative mass spectrometry | Chapter 3
65
Application of the mass difference analysis strategy
The mass difference processing method was applied to the analysis of two complex proteomes. The first was a controlled experiment in which a two-fold dilution series of a TMT labeled BSA digest (expected TMT ratios of 0.5:0.25:0.125:0.0625:0.03125) was spiked into an E. coli cytosolic digest in which equimolar quantities of all six TMT labels were combined (expected TMT ratios for all proteins 1:1:1:1:1:1). Figure 3 shows the quantification data without (panel A) and with (panel B) the mass difference processing. As one might expect, the improvements for the E. coli proteins are quite moderate but the mass difference processed data shows better overall quantification accuracy (all bars closer to the expected 100%) but the overall variation for quantification is still around 20%. As one also might expect, the quantification of BSA is improved for the largest dilution step because here, the presence of interfering ions would have the strongest effect on quantification. Figure 3 C shows the application of the mass difference processing approach for the selectivity profiling of the kinase inhibitor lapatinib using a chemical proteomics approach [6]. Briefly, cell lysates are incubated with a kinase inhibitor (here 1µM) and subsequently with the kinobeads affinity matrix that consist of immobilized broad spectrum kinase inhibitors and which is used to capture kinases from the lysates. TMT labeled samples from kinases captured in the presence and absence of the drug are analyzed by LC-MS/MS using the CID/HCD approach described above. The data clearly shows, that at 1µM of lapatinib, only the known lapatinib targets EGFR and ERBB2/4 show significant inhibition of binding to the beads while most other kinases show no or only moderate binding inhibition.
Comparison of TMT-based and label-free quantification
For the selectivity profiling of small molecule kinase inhibitors it s highly important to achieve good quantification accuracy over a high dynamic range combined with the best possible coverage of the kinome. With this, a precise curve fitting and IC50 determination of the dose-dependent reduction of binding of the inhibited target proteins over a wide range of kinases is possible. Isobaric tags in combination with the above described analysis strategy provides excellent mass accuracy and thereby improves the quality of peptide and protein quantification. Nevertheless, ratio compression of co-elution peptides diminish the absolute dynamic range and multiplexing generally leads to less identifications partly due to a higher spectral complexity [23]. Reduction of the sample complexity through fractionation has been shown to have a beneficial effect [12] as well as the reduction of undesired high charge states [23]. Also label-free quantification approaches recently became a very popular alternative, though the independently performed experimental steps may introduce higher systematic and non-systematic variations, leading to less accurate quantification [24].
For a performance evaluation of the two quantification strategies, a competition binding assay of the dual EGFR/HER2 kinase inhibitor erlotinib was directly compared in triplicate analysis. Briefly, kinase enrichment using kinobeads was performed after pre-incubation of separate placenta lysates with increasing concentrations of the erlotinib. Proteins were eluted from kinobeads and in-gel digested with trypsin into peptides.
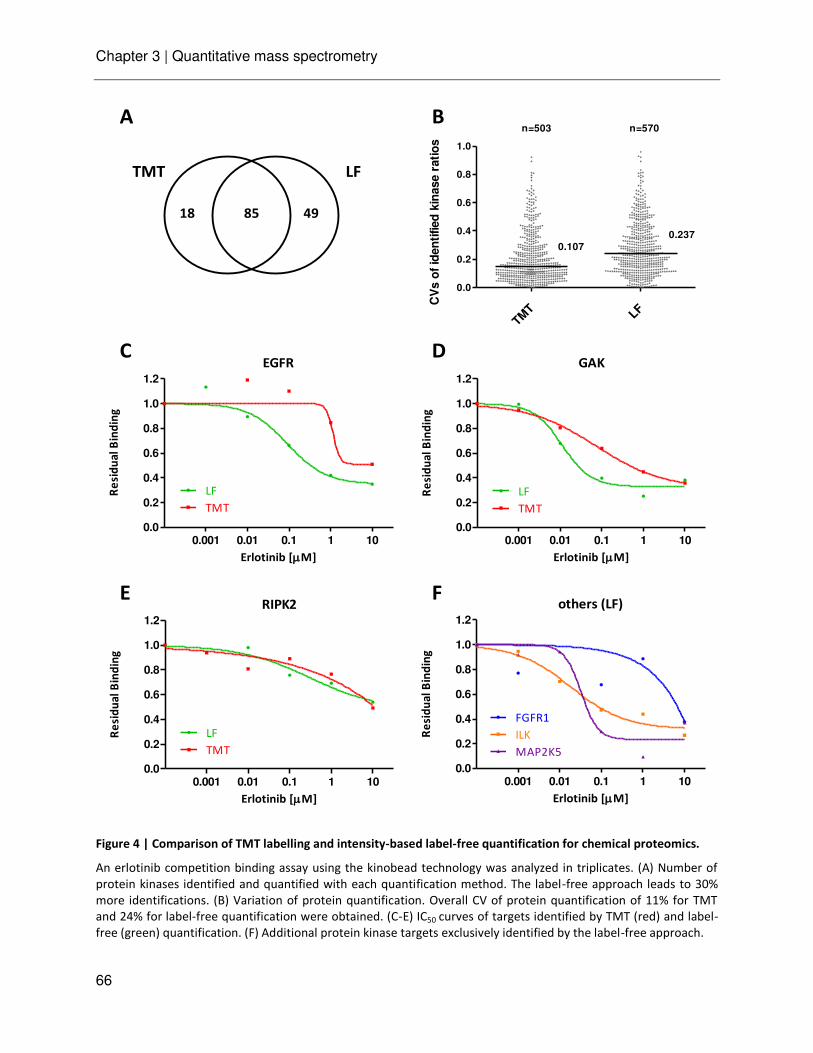
Chapter 3 | Quantitative mass spectrometry
66
Figure 4 | Comparison of TMT labelling and intensity-based label-free quantification for chemical proteomics.
An erlotinib competition binding assay using the kinobead technology was analyzed in triplicates. (A) Number of
protein kinases identified and quantified with each quantification method. The label-free approach leads to 30%
more identifications. (B) Variation of protein quantification. Overall CV of protein quantification of 11% for TMT
and 24% for label-free quantification were obtained. (C-E) IC50 curves of targets identified by TMT (red) and label-
free (green) quantification. (F) Additional protein kinase targets exclusively identified by the label-free approach.
8518 49
LFTMT
TMT LF
0.0
0.2
0.4
0.6
0.8
1.0
CV
s o
f id
en
tified
kin
ase r
ati
os
n=503
0.107
0.237
n=570
EGFR
0.0
0.2
0.4
0.6
0.8
1.0
1.2
LF
TMT
0.001 0.01 0.1 1 10
Erlotinib [M]
Re
sid
ua
l B
ind
ing
GAK
0.0
0.2
0.4
0.6
0.8
1.0
1.2
LF
TMT
0.01 0.1 1 100.001
Erlotinib [M]
Re
sid
ua
l B
ind
ing
RIPK2
0.0
0.2
0.4
0.6
0.8
1.0
1.2
LF
TMT
0.001 0.01 0.1 1 10
Erlotinib [M]
Re
sid
ua
l B
ind
ing
others (LF)
0.0
0.2
0.4
0.6
0.8
1.0
1.2
FGFR1
ILK
MAP2K5
0.001 0.01 0.1 1 10
Erlotinib [M]
Re
sid
ua
l B
ind
ing
A B
C D
E F
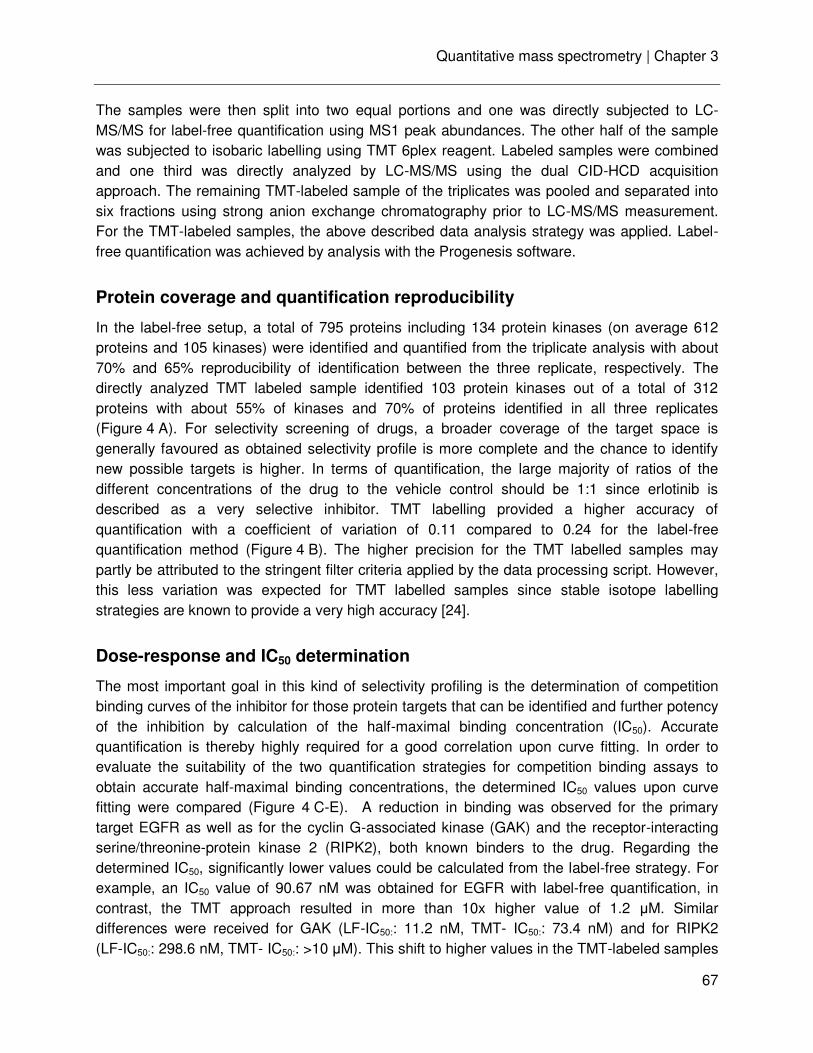
Quantitative mass spectrometry | Chapter 3
67
The samples were then split into two equal portions and one was directly subjected to LC-MS/MS for label-free quantification using MS1 peak abundances. The other half of the sample was subjected to isobaric labelling using TMT 6plex reagent. Labeled samples were combined and one third was directly analyzed by LC-MS/MS using the dual CID-HCD acquisition approach. The remaining TMT-labeled sample of the triplicates was pooled and separated into six fractions using strong anion exchange chromatography prior to LC-MS/MS measurement. For the TMT-labeled samples, the above described data analysis strategy was applied. Label-free quantification was achieved by analysis with the Progenesis software.
Protein coverage and quantification reproducibility
In the label-free setup, a total of 795 proteins including 134 protein kinases (on average 612 proteins and 105 kinases) were identified and quantified from the triplicate analysis with about 70% and 65% reproducibility of identification between the three replicate, respectively. The directly analyzed TMT labeled sample identified 103 protein kinases out of a total of 312 proteins with about 55% of kinases and 70% of proteins identified in all three replicates (Figure 4 A). For selectivity screening of drugs, a broader coverage of the target space is generally favoured as obtained selectivity profile is more complete and the chance to identify new possible targets is higher. In terms of quantification, the large majority of ratios of the different concentrations of the drug to the vehicle control should be 1:1 since erlotinib is described as a very selective inhibitor. TMT labelling provided a higher accuracy of quantification with a coefficient of variation of 0.11 compared to 0.24 for the label-free quantification method (Figure 4 B). The higher precision for the TMT labelled samples may partly be attributed to the stringent filter criteria applied by the data processing script. However, this less variation was expected for TMT labelled samples since stable isotope labelling strategies are known to provide a very high accuracy [24].
Dose-response and IC50 determination
The most important goal in this kind of selectivity profiling is the determination of competition binding curves of the inhibitor for those protein targets that can be identified and further potency of the inhibition by calculation of the half-maximal binding concentration (IC50). Accurate quantification is thereby highly required for a good correlation upon curve fitting. In order to evaluate the suitability of the two quantification strategies for competition binding assays to obtain accurate half-maximal binding concentrations, the determined IC50 values upon curve fitting were compared (Figure 4 C-E). A reduction in binding was observed for the primary target EGFR as well as for the cyclin G-associated kinase (GAK) and the receptor-interacting serine/threonine-protein kinase 2 (RIPK2), both known binders to the drug. Regarding the determined IC50, significantly lower values could be calculated from the label-free strategy. For example, an IC50 value of 90.67 nM was obtained for EGFR with label-free quantification, in contrast, the TMT approach resulted in more than 10x higher value of 1.2 μM. Similar differences were received for GAK (LF-IC50:: 11.2 nM, TMT- IC50:: 73.4 nM) and for RIPK2 (LF-IC50:: 298.6 nM, TMT- IC50:: >10 μM). This shift to higher values in the TMT-labeled samples
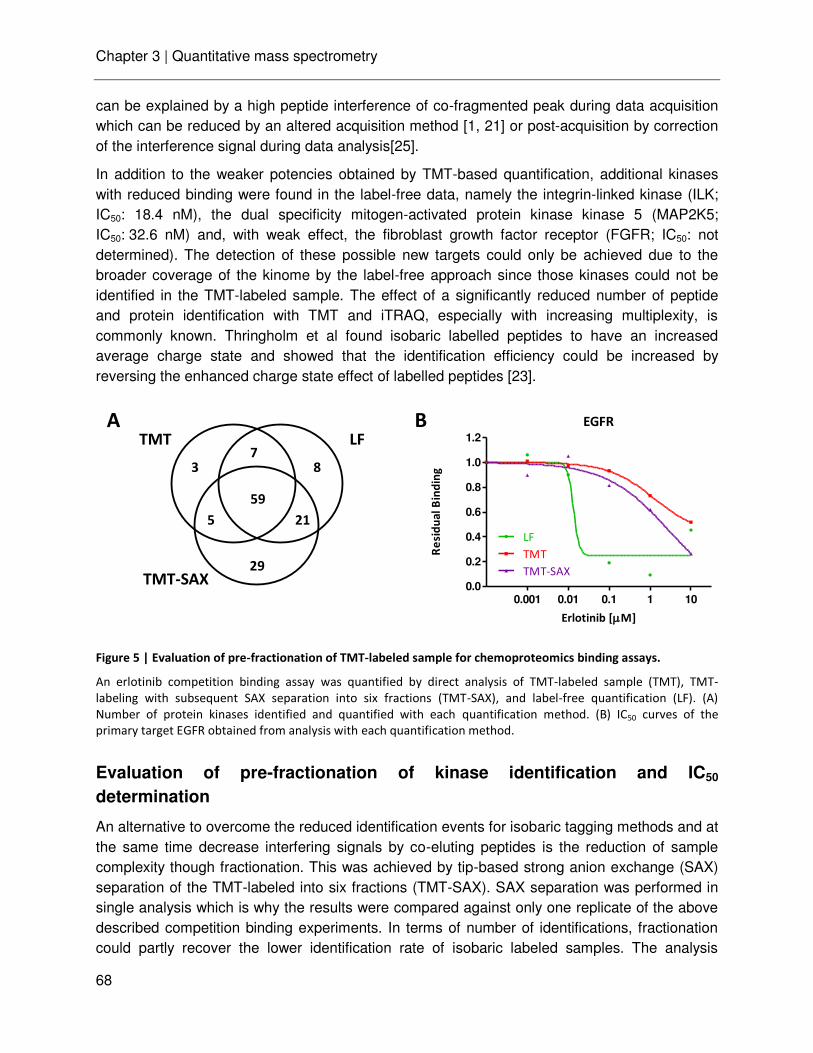
Chapter 3 | Quantitative mass spectrometry
68
can be explained by a high peptide interference of co-fragmented peak during data acquisition which can be reduced by an altered acquisition method [1, 21] or post-acquisition by correction of the interference signal during data analysis[25].
In addition to the weaker potencies obtained by TMT-based quantification, additional kinases with reduced binding were found in the label-free data, namely the integrin-linked kinase (ILK; IC50: 18.4 nM), the dual specificity mitogen-activated protein kinase kinase 5 (MAP2K5; IC50: 32.6 nM) and, with weak effect, the fibroblast growth factor receptor (FGFR; IC50: not determined). The detection of these possible new targets could only be achieved due to the broader coverage of the kinome by the label-free approach since those kinases could not be identified in the TMT-labeled sample. The effect of a significantly reduced number of peptide and protein identification with TMT and iTRAQ, especially with increasing multiplexity, is commonly known. Thringholm et al found isobaric labelled peptides to have an increased average charge state and showed that the identification efficiency could be increased by reversing the enhanced charge state effect of labelled peptides [23].
Figure 5 | Evaluation of pre-fractionation of TMT-labeled sample for chemoproteomics binding assays.
An erlotinib competition binding assay was quantified by direct analysis of TMT-labeled sample (TMT), TMT-
labeling with subsequent SAX separation into six fractions (TMT-SAX), and label-free quantification (LF). (A)
Number of protein kinases identified and quantified with each quantification method. (B) IC50 curves of the
primary target EGFR obtained from analysis with each quantification method.
Evaluation of pre-fractionation of kinase identification and IC50
determination
An alternative to overcome the reduced identification events for isobaric tagging methods and at the same time decrease interfering signals by co-eluting peptides is the reduction of sample complexity though fractionation. This was achieved by tip-based strong anion exchange (SAX) separation of the TMT-labeled into six fractions (TMT-SAX). SAX separation was performed in single analysis which is why the results were compared against only one replicate of the above described competition binding experiments. In terms of number of identifications, fractionation could partly recover the lower identification rate of isobaric labeled samples. The analysis
EGFR
0.0
0.2
0.4
0.6
0.8
1.0
1.2
LF
TMT
TMT-SAX
0.001 0.01 0.1 1 10
Erlotinib [M]
Re
sid
ua
l B
ind
ing
59
3 87
LFTMT
5 21
29TMT-SAX
A B

Quantitative mass spectrometry | Chapter 3
69
resulted in the identification of 74 kinases (194 proteins) for TMT, 95 kinases (363 proteins) for TMT-SAX and 114 kinases (605 proteins) for label-free (Figure 5 A). Unfortunately the issue of ratio compression remained almost the same and no obvious improvements in obtained binding curves and subsequent IC50 determination have been received (Figure 5 B).
Chapter 3 | Quantitative mass spectrometry
70
Concluding remarks
Collectively, the data shows that the identification of TMT reporter ions in high energy HCD spectra by intra-spectrum mass differences has merit because it eliminates all non-TMT ions from such spectra, improves the mass accuracy of the resulting data and leads to some improvement for the quantification of proteins in complex proteomes. The same approach can also be taken for iTRAQ labeled samples or indeed for any isobaric tagging strategy. In addition, this data processing idea is generically useful for high-resolution mass spectrometry platforms and can easily be extended to other applications (e.g. the detection of post-translationally modified peptides such as glycopeptides using specific fragment ion combinations, identification of immonium ions etc.). The processing is also easily implemented in software. In fact, the vendor of the Orbitrap mass spectrometry system used in this study has agreed to incorporate the mass difference processing in one of the upcoming versions of the Proteome Discoverer (Bernard Delange, personal communication).
Besides, a general comparison of TMT-based and label-free quantification for the use in selectivity profiling of kinase inhibitors by chemoproteomic competition binding assays revealed a higher better coverage and more accurate determination of binding potencies in the investigated setup.
Quantitative mass spectrometry | Chapter 3
71
Acknowledgments
I am indebted to Kurt Fellenberg for writing the CID-HCD processing script and to Corinna Wagner for support in optimizing TMT data processing and to Hannes Hahne for valuable support in aspects of data analysis.
Abbreviations
BSA bovine serum albumin
CID collision induced dissociation
HCD higher energy collision induced dissociation
IC50 half maximal inhibitory concentration
iTRAQ isobaric tags for relative and absolute quantification
LC-MS/MS liquid chromatography coupled to tandem mass spectrometry
MS mass spectrometry
ppm parts per million
PQD pulsed Q dissociation
qTOF quadrupole time-of-flight mass spectrometer
SAX strong anion exchange chromatography
TMT tandem mass tag
TOF time-of-flight
Chapter 3 | Quantitative mass spectrometry
72
References
1. Bantscheff, M.; Boesche, M.; Eberhard, D.; Matthieson, T.; Sweetman, G.; Kuster, B., Robust and sensitive iTRAQ quantification on an LTQ Orbitrap mass spectrometer. Mol Cell Proteomics 2008, 7 (9), 1702-13.
2. Mallick, P.; Kuster, B., Proteomics: a pragmatic perspective. Nat Biotechnol 2010, 28 (7), 695-709.
3. Bantscheff, M.; Schirle, M.; Sweetman, G.; Rick, J.; Kuster, B., Quantitative mass spectrometry in proteomics: a critical review. Anal Bioanal Chem 2007, 389 (4), 1017-31.
4. Ross, P. L.; Huang, Y. N.; Marchese, J. N.; Williamson, B.; Parker, K.; Hattan, S.; Khainovski, N.; Pillai, S.; Dey, S.; Daniels, S.; Purkayastha, S.; Juhasz, P.; Martin, S.; Bartlet-Jones, M.; He, F.; Jacobson, A.; Pappin, D. J., Multiplexed protein quantitation in Saccharomyces cerevisiae using amine-reactive isobaric tagging reagents. Mol Cell Proteomics 2004, 3 (12), 1154-69.
5. Thompson, A.; Schafer, J.; Kuhn, K.; Kienle, S.; Schwarz, J.; Schmidt, G.; Neumann, T.; Johnstone, R.; Mohammed, A. K.; Hamon, C., Tandem mass tags: a novel quantification strategy for comparative analysis of complex protein mixtures by MS/MS. Anal Chem 2003, 75 (8), 1895-904.
6. Bantscheff, M.; Eberhard, D.; Abraham, Y.; Bastuck, S.; Boesche, M.; Hobson, S.; Mathieson, T.; Perrin, J.; Raida, M.; Rau, C.; Reader, V.; Sweetman, G.; Bauer, A.; Bouwmeester, T.; Hopf, C.; Kruse, U.; Neubauer, G.; Ramsden, N.; Rick, J.; Kuster, B.; Drewes, G., Quantitative chemical proteomics reveals mechanisms of action of clinical ABL kinase inhibitors. Nat Biotechnol 2007, 25 (9), 1035-44.
7. Kocher, T.; Pichler, P.; Schutzbier, M.; Stingl, C.; Kaul, A.; Teucher, N.; Hasenfuss, G.; Penninger, J. M.; Mechtler, K., High precision quantitative proteomics using iTRAQ on an LTQ Orbitrap: a new mass spectrometric method combining the benefits of all. J Proteome Res 2009, 8 (10), 4743-52.
8. Pichler, P.; Kocher, T.; Holzmann, J.; Mohring, T.; Ammerer, G.; Mechtler, K., Improved precision of iTRAQ and TMT quantification by an axial extraction field in an Orbitrap HCD cell. Anal Chem 2011, 83 (4), 1469-74.
9. Savitski, M. M.; Fischer, F.; Mathieson, T.; Sweetman, G.; Lang, M.; Bantscheff, M., Targeted data acquisition for improved reproducibility and robustness of proteomic mass spectrometry assays. J Am Soc Mass Spectrom 2010, 21 (10), 1668-79.
10. Olsen, J. V.; de Godoy, L. M.; Li, G.; Macek, B.; Mortensen, P.; Pesch, R.; Makarov, A.; Lange, O.; Horning, S.; Mann, M., Parts per million mass accuracy on an Orbitrap mass spectrometer via lock mass injection into a C-trap. Mol Cell Proteomics 2005, 4 (12), 2010-21.
11. Ow, S. Y.; Salim, M.; Noirel, J.; Evans, C.; Rehman, I.; Wright, P. C., iTRAQ underestimation in simple and complex mixtures: "the good, the bad and the ugly". J Proteome Res 2009, 8 (11), 5347-55.
12. Ow, S. Y.; Salim, M.; Noirel, J.; Evans, C.; Wright, P. C., Minimising iTRAQ ratio compression through understanding LC-MS elution dependence and high-resolution HILIC fractionation. Proteomics 2011, 11 (11), 2341-6.
13. Wenger, C. D.; Lee, M. V.; Hebert, A. S.; McAlister, G. C.; Phanstiel, D. H.; Westphall, M.
Quantitative mass spectrometry | Chapter 3
73
S.; Coon, J. J., Gas-phase purification enables accurate, multiplexed proteome quantification with isobaric tagging. Nat Methods 2011, 8 (11), 933-5.
14. Wuhr, M.; Haas, W.; McAlister, G. C.; Peshkin, L.; Rad, R.; Kirschner, M. W.; Gygi, S. P., Accurate multiplexed proteomics at the MS2 level using the complement reporter ion cluster. Anal Chem 2012, 84 (21), 9214-21.
15. Savitski, M. M.; Sweetman, G.; Askenazi, M.; Marto, J. A.; Lang, M.; Zinn, N.; Bantscheff, M., Delayed fragmentation and optimized isolation width settings for improvement of protein identification and accuracy of isobaric mass tag quantification on Orbitrap-type mass spectrometers. Anal Chem 2011, 83 (23), 8959-67.
16. Wisniewski, J. R.; Zougman, A.; Mann, M., Combination of FASP and StageTip-based fractionation allows in-depth analysis of the hippocampal membrane proteome. J Proteome Res 2009, 8 (12), 5674-8.
17. Rappsilber, J.; Mann, M.; Ishihama, Y., Protocol for micro-purification, enrichment, pre-fractionation and storage of peptides for proteomics using StageTips. Nat Protoc 2007, 2 (8), 1896-906.
18. Dayon, L.; Pasquarello, C.; Hoogland, C.; Sanchez, J. C.; Scherl, A., Combining low- and high-energy tandem mass spectra for optimized peptide quantification with isobaric tags. J Proteomics 2010, 73 (4), 769-77.
19. Hauck, S. M.; Dietter, J.; Kramer, R. L.; Hofmaier, F.; Zipplies, J. K.; Amann, B.; Feuchtinger, A.; Deeg, C. A.; Ueffing, M., Deciphering membrane-associated molecular processes in target tissue of autoimmune uveitis by label-free quantitative mass spectrometry. Mol Cell Proteomics 2010, 9 (10), 2292-305.
20. Mathur, R.; O'Connor, P. B., Artifacts in Fourier transform mass spectrometry. Rapid Commun Mass Spectrom 2009, 23 (4), 523-9.
21. Ting, L.; Rad, R.; Gygi, S. P.; Haas, W., MS3 eliminates ratio distortion in isobaric multiplexed quantitative proteomics. Nat Methods 2011, 8 (11), 937-40.
22. Ma, B.; Johnson, R., De Novo sequencing and homology searching. Mol Cell Proteomics 2011.
23. Thingholm, T. E.; Palmisano, G.; Kjeldsen, F.; Larsen, M. R., Undesirable charge-enhancement of isobaric tagged phosphopeptides leads to reduced identification efficiency. J Proteome Res 2010, 9 (8), 4045-52.
24. Bantscheff, M.; Lemeer, S.; Savitski, M. M.; Kuster, B., Quantitative mass spectrometry in proteomics: critical review update from 2007 to the present. Anal Bioanal Chem 2012, 404 (4), 939-65.
25. Savitski, M. M.; Mathieson, T.; Zinn, N.; Sweetman, G.; Doce, C.; Becher, I.; Pachl, F.; Kuster, B.; Bantscheff, M., Measuring and Managing Ratio Compression for Accurate iTRAQ/TMT Quantification. J Proteome Res 2013.

Chapter 3 | Quantitative mass spectrometry
74
Chapter 4
Characterization of a chemical affinity probe targeting
AKT kinases

Characterization of chemical affinity probes | Chapter 4
77
Introduction
Protein kinases play a pivotal role in signal transduction and therefore are attractive drug targets in diseases such as cancer and inflammation [1-5]. To date, about 20 small molecule drugs are approved for clinical use (all in oncology) and several hundred further compounds are under investigation in clinical trials [6]. Most of these agents exert their inhibitory effects via binding to the structural highly conserved ATP-binding pocket within the kinase domain. As a result, kinase inhibitors (KIs) are likely to target multiple protein kinases or ATP-hydrolysing/binding enzymes making the discovery of truly selective inhibitors a formidable challenge. In a physiological context, off-targets may lead to undesired side effects but may also increase the therapeutic potential of a drug. Hence, determining an inhibitor’s full protein selectivity profile is important for the correct interpretation of its biological effects on a cellular and organismal level. Traditional methods to assess the selectivity of kinase inhibitors are based on in vitro kinase activity assays using large panels of recombinant kinases [7-9]. Despite being powerful and widely used, these panels have shortcomings: notably, they mostly utilize an exogenously expressed catalytic kinase domain thus ignoring regulatory sequence elements present in the full length protein, activity regulating post-translational modifications and the influence of further proteins and co-factors present in cells [10, 11].
To complement such in-vitro assays, affinity based chemical proteomic methods have been developed to allow for a more unbiased analysis of a drug’s potential to interact with kinases or other cellular proteins. One of such successful approaches makes use of immobilized low selectivity kinase inhibitors for the specific enrichment of a large subset of the native kinome and other nucleotide binding proteins directly from cell or tissue extracts of biological significance (exemplified by the kinobead technology) [12-16]. Kinobeads enable differential profiling of kinase expression in cells and tissues and, when configured as a competition binding assay in conjunction with quantitative mass spectrometry, allows for the determination of the selectivity of a small molecule kinase inhibitor against hundreds of proteins in a single experiment [17-20]. Despite conceptual advantages, chemical proteomic methods also have shortcomings, notably incomplete coverage of the kinome. For example, the published kinobead method [12], which uses a mixture of seven immobilized kinase inhibitors, does not effectively address AKT kinases due to the lack of suitable affinity probes. The serine/threonine kinase AKT, also known as protein kinase B, belongs to the AGC subfamily of protein kinases and is a key mediator of cell growth, proliferation and apoptosis [21, 22]. Aberrant activation of the AKT pathway has been identified in a wide variety of human cancers including tumours of the breast, prostate, ovaries and skin [23-26]. Therefore, inhibiting AKT activity is viewed as an attractive therapeutic approach and several small molecule inhibitors targeting this enzyme have been reported and are being tested in the clinic [27-29]. Given the above shortcomings, developing a chemical affinity probe targeting AKT and structurally related kinases is desirable in order to expand the kinome coverage of kinobeads. This was achieved by retro engineering the potent and reasonably selective AKT inhibitor GSK690693 [27] into a broad kinase binder. In combination with the previous version of kinobeads, the new AKT probe enabled the

Chapter 4 | Characterization of chemical affinity probes
78
determination of selectivity profiles of the ATP-competitive AKT inhibitors GSK690693 and GSK2141795 [30] and to identify a number of off-targets which may be responsible for desired and undesired biological effects. In addition, the target profile of the allosteric AKT inhibitors perifosine [31] and MK-2206 [32], both targeting the pleckstin homology (PH) domain of AKT, were determined in a kinobead competition assay exhibiting a direct inhibitory effect on AKT and some possible off-targets.
Characterization of chemical affinity probes | Chapter 4
79
Material and Methods
Sample preparation
Post-delivery human placenta tissue (obtained from Freising hospital following informed consent) was thoroughly washed with cold phosphate buffered saline (PBS) and homogenized in lysis buffer (50 mM Tris/HCl pH 7.5, 5% Glycerol, 1.5 mM MgCl2, 150 mM NaCl, 0.8% NP-40, 1 mM dithiothreitol and 25 mM NaF with freshly added protease inhibitors and phosphatase inhibitors) using a tissue grinder. Lysates were incubated for 30 min at 4 °C and protein extracts were clarified by ultracentrifugation for 1 h at 145,000 x g at 4 °C. Protein concentration was determined by the Bradford method.
K562, Colo205, HCC827 and SR cells were cultured in Roswell Park Memorial Institute 1640 medium (RPMI1640) medium, SKNBE2 and SKOV3 cells were cultured in Dulbecco’s modified Eagle’s medium (DMEM) and OVCAR8 and Malme3M cells were cultured in Iscove´s modified Dulbecco´s medium (IMDM), all supplemented with 10% fetal bovine serum (FBS). Cells were cultured in humidified air supplemented with 5% CO2 at 37 °C. Cells were washed with cold phosphate buffered saline (PBS) and harvested by lysis using 50 mM Tris/HCl pH 7.5, 5% Glycerol, 1.5 mM MgCl2, 150 mM NaCl, 0.8% NP-40, 1 mM dithiothreitol and 25 mM NaF with freshly added protease inhibitors and phosphatase inhibitors (5x phosphatase inhibitor cocktail1, Sigma-Aldrich, Munich, Germany, 5x phosphatase inhibitor cocktail 2, Sigma-Aldrich, Munich, Germany, 1 mM Na3VO4 and 20 nM Calyculin A, LC Laboratories, Woburn, MA, USA). Protein extracts were clarified by ultracentrifugation for 1 h at 145,000 x g at 4 °C and protein concentration was determined by the Bradford method.
Compound coupling
Compounds were immobilized on sepharose beads through covalent linkage using primary amino (compound) and carboxyl groups as described previously [12]. One ml of NHS-activated sepharose (GE Healthcare, Freiburg, Germany) and the compound (2µmol/mL) were equilibrated in DMSO. 15 μl of triethylamine was added to start the coupling reaction and the mixture was incubated on an end-over-end shaker for 16-20 h in the dark. Free NHS-groups on the beads were blocked by adding 50 μl amino ethanol and incubation on an end-over-end shaker for 16-20 h in the dark. Coupled beads were washed and stored in isopropanol at 4°C in the dark. The coupling reaction was monitored by HPLC.
Compound deprotection
Sepharose beads (2 µmol/mL; 1mL) functionalized with oNBS protected compound were washed and equilibrated in DMF. For the deprotection reaction, NMP (2 mL), DBU (1.5 mL) and mercapto ethanol (1.5 mL) were added and incubated on an end-over-end shaker for 15 min at room temperature. Subsequently, beads were washed and stored in isopropanol at 4°C in the
Chapter 4 | Characterization of chemical affinity probes
80
dark.
Affinity purification
AKT probe and kinobead pulldowns were performed as described previously [12]. Briefly, lysates of a cell mix were diluted with equal volumes of 1x compound pulldown (CP) buffer (50 mM Tris/HCl pH 7.5, 5% glycerol, 1.5 mM MgCl2, 150 mM NaCl, 25 mM NaF, 1 mM dithiothreitol and freshly added protease inhibitors and phosphatase inhibitors (5x phosphatase inhibitor cocktail1, Sigma-Aldrich, Munich, Germany, 5x phosphatase inhibitor cocktail 2, Sigma-Aldrich, Munich, Germany, 1 mM sodium ortho-vanadate and 20 nM Calyculin A, LC Laboratories, Woburn, MA, USA)). If necessary, lysates were further diluted to a final protein concentration of 5 mg/ml using 1x CP buffer supplemented with 0.4% NP-40.
For selectivity profiling experiments, the lysates (5 mg total protein each) were pre-incubated with 0 nM (DMSO control), 2.5 nM, 25 nM, 250 nM, 2.5 µM or 25 µM of free compound (GSK690693, GSK2141795) on an end-over-end shaker for 45 min at 4°C. Subsequently, lysates were incubated with beads (coupled AKT probe or kinobeads) for 1 h at 4°C, for both qualitative and quantitative experiments. The beads were washed with 1x CP buffer and collected by centrifugation. Bound proteins were eluted with 2x NuPAGE LDS Sample Buffer (Invitrogen, Darmstadt, Germany) and eluates were reduced and alkylated by 50 mM dithiothreitol and 55 mM iodoacetamide.
Samples were then run into a 4–12% NuPAGE gel (Invitrogen, Darmstadt, Germany) for about 0.5 cm to concentrate the sample prior to in-gel tryptic digestion. In-gel trypsin digestion was performed according to standard procedures.
LC-MS/MS measurements
Nanoflow LC-MS/MS was performed by coupling an Eksigent nanoLC-Ultra 1D+ (Eksigent, Dublin, CA) to a LTQ-Orbitrap XL ETD (Thermo Scientific, Bremen, Germany). Peptides were delivered to a trap column (100 μm×β cm, packed in-house with Reprosil-Pur C18-AQ 5 µm resin, Dr. Maisch, Ammerbuch, Germany) at a flow rate of 5 µL/min in 100% solvent A (0.1% formic acid in HPLC grade water). After 10 min of loading and washing, peptides were transferred to an analytical column (75µm×40 cm, packed in-house with Reprosil-Pur C18-AQ, 3 µm resin, Dr. Maisch, Ammerbuch, Germany) and separated using a 210 min gradient from 7% to 35% of solvent B (0.1% formic acid in acetonitrile) at 300 nL/minute flow rate. The LTQ Orbitrap XL was operated in data dependent mode, automatically switching between MS and MS2. Full scan MS spectra were acquired in the Orbitrap at 60,000 (m/z 400) resolution after accumulation to a target value of 1,000,000. Internal calibration was performed using the ion signal (Si(CH3)2O)6 H+ at m/z 445.120025 present in ambient laboratory air. Tandem mass spectra were generated for up to eight peptide precursors in the linear ion trap for fragment by using collision-induced dissociation at a normalized collision energy of 35% after accumulation to a target value of 5,000 for max 500 ms.
Measurements using the Orbitrap Elite (Thermo Scientific, Bremen, Germany) employed the
Characterization of chemical affinity probes | Chapter 4
81
same LC conditions as described and similar data acquisition parameters. Full scan MS spectra were acquired in the Orbitrap at 30,000 resolution. Tandem mass spectra were generated for up to 15 peptide precursors for fragment by using higher energy collisional dissociation (HCD) at normalized collision energy of 30% and a resolution of 15,000 with a target value of 100,000 charges after accumulation for max 100 ms.
Peptide and protein identification and quantification
For qualitative analysis, raw MS data files were converted to peak lists using Mascot Distiller (version 2.3.0, Matrix Science, London, UK) and searched against the IPI human database (v3.68, 87,061 sequences) using the Mascot search engine (version 2.3.0, Matrix Science, London, UK) and the following parameters: precursor tolerance 10 ppm, fragment tolerance 0.6(0.02) Da (for CID (HCD) data), full tryptic specificity with up to two missed cleavage sites, miss-assignment of the monoisotopic peak to the first 13C peak, carbamidomethylation of cysteine residues was set as fixed modification and methionine oxidation as a variable modification. The database search results were imported into Scaffold (version 3.6.2, Proteome Software, Portland, OR) for further evaluation.
Quantitative analysis using intensity-based label-free quantification was performed by the Progenesis software (version 3.1; Nonlinear Dynamics, Newcastle, UK) Briefly, after selecting one sample as a reference, the retention times of all eluting precursor m/z values in all other samples within the experiment were aligned creating a large list of “features” representing the same peptide in each sample. Features with two to five charges were included for further analysis. Features with two or less isotopes were excluded. After alignment and feature filtering, replicate samples were grouped together, and raw abundances of all features were normalized to determine a global scaling factor for correcting experimental variation such as differences in the quantity of protein loaded into the instrument. Briefly, for each sample, one unique factor is calculated and used to correct all features in the sample for experimental variation according to Hauck et al. [33]. MS/MS spectra were transformed into peak lists and exported to generate Mascot generic files. The Mascot generic files were searched against the protein sequence database IPI human (v. 3.68, 87,061 sequences) using Mascot (version 2.3.0, Matrix Science, London, UK). Search parameters were as follows: precursor tolerance 10 ppm, fragment tolerance 0.02 Da, full tryptic specificity with up to two missed cleavage sites, miss-assignment of the monoisotopic peak to the first 13C peak, fixed modification of carbamidomethylation of cysteine residues and variable modification of N-terminal protein acetylation and methionine oxidation. Search results for spectrum to peptide matches were exported in .xml format and then imported into Progenesis software to enable the combination of peptide quantification and identification. Peptides with mascot ion scores ≤γβ (p = 0.05 identity threshold) were filtered out, and only unique peptides for corresponding proteins were used for identification and quantification. In dose response measurements, protein quantification was performed by summing, the feature intensities of all unique peptides of a protein.
Chapter 4 | Characterization of chemical affinity probes
82
Results and Discussion
Design and synthesis of affinity probes targeting AKT and AGC family
kinases
The potent ATP-competitive AKT inhibitor GSK690693 (Figure 1 A) was chosen as starting point for the design of chemical affinity probes as this compound inhibits all three isoforms of AKT (1, 2, 3) at low nanomolar concentrations and further shows potent activity against a number of AGC family members as well as other protein kinases [27]. For affinity probes intended for KI selectivity profiling, low kinase selectivity (but potent binding) is desirable in order to enable the measurement of many kinases simultaneously. The merits of three linkable compounds were therefore explored (Figure 1 A): probe 1 corresponds to the parental compound which can be immobilized via its secondary amine. Considerations leading to the design and synthesis of probe 2 and probe 3 (Synthetic schemes, detailed procedures and characterization of synthesized compounds can be found online in the Supporting Information: (http://pubs.acs.org/doi/suppl/10.1021/pr400455j) were based on the co-crystal structure of GSK690693 and the kinase domain of AKT2 (PDB code: 3DOE) as well as the described structure activity relationship (SAR) of GSK690693 [27]. The inhibitor occupies the ATP binding pocket with the 1,2,5-oxidazole moiety located in the hinge region. Several inter- and intramolecular hydrogen bonds of the 1,2,5-oxidazole and the imidazopyridine ring, together with hydrophobic interactions with the glycine rich loop, provide strong interactions between the kinase and the inhibitor. Furthermore, the alkynol group at position C4 of the imidazopyridine core is located in the back cleft pocket and improves potency for AKT and, importantly, selectivity against other kinases of the AGC family [27]. The piperidinyl side chain is exposed to the solvent and also provides hydrogen bonding to the carboxylic acid side chain of Glu 236 in the substrate binding area of AKT. This feature makes this side of the molecule attractive for modification with a linker provided that the basicity of the amino group can be kept intact. Structural and SAR information together would predict that probe 3 should be more selective for AKT than probe 2.
Protein binding profiles of AKT probes
The protein binding profiles of the three immobilized compounds (probe 1, 2 and 3) were assessed in pulldown experiments using lysates of human placenta followed by mass spectrometry for protein identification. A triplicate analysis resulted in the identification of 204 proteins (6 kinases) for probe 1, 347 proteins (50 kinases) for probe 2 and 458 proteins (11 kinases) for probe 3. This clearly identified probe 2 as the most effective kinase binder, and in fact the only one capable of capturing all three isoforms of AKT. Visualization of the identified kinases on the phylogenetic kinome tree (Figure 1 B) revealed that probe 2 captures a considerable number of further AGC kinases as well as members of the CMGC and CAMK kinase families.
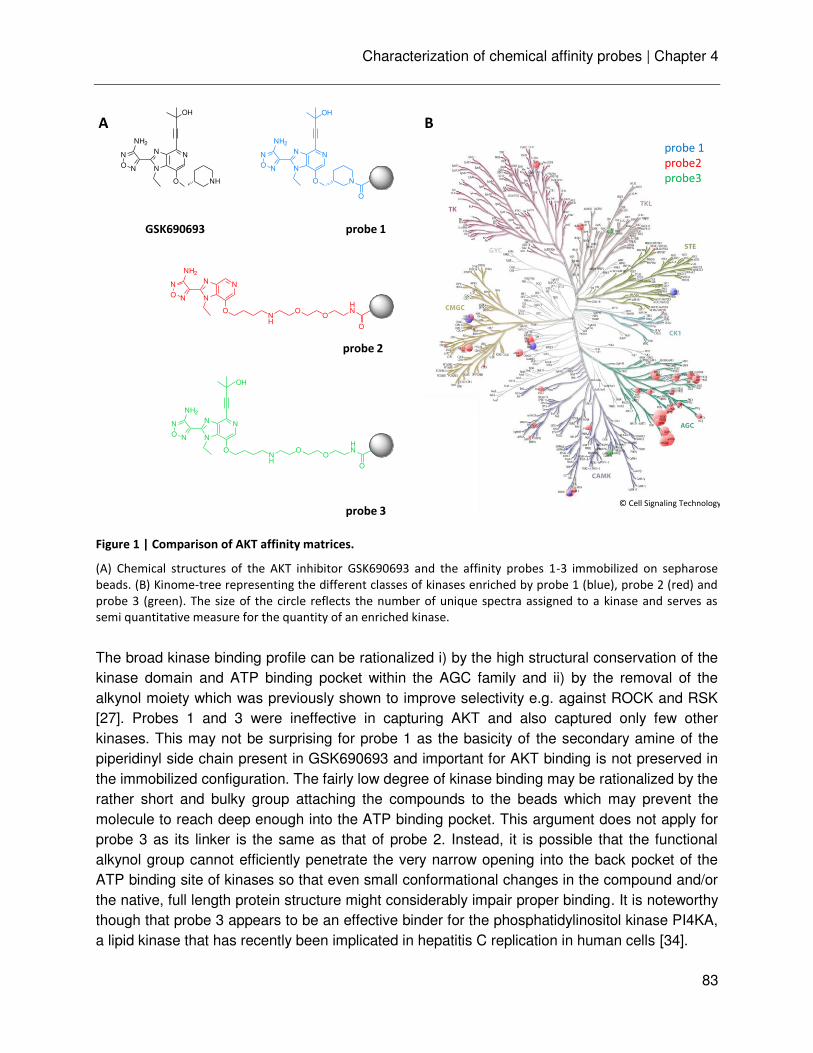
Characterization of chemical affinity probes | Chapter 4
83
Figure 1 | Comparison of AKT affinity matrices.
(A) Chemical structures of the AKT inhibitor GSK690693 and the affinity probes 1-3 immobilized on sepharose
beads. (B) Kinome-tree representing the different classes of kinases enriched by probe 1 (blue), probe 2 (red) and
probe 3 (green). The size of the circle reflects the number of unique spectra assigned to a kinase and serves as
semi quantitative measure for the quantity of an enriched kinase.
The broad kinase binding profile can be rationalized i) by the high structural conservation of the kinase domain and ATP binding pocket within the AGC family and ii) by the removal of the alkynol moiety which was previously shown to improve selectivity e.g. against ROCK and RSK [27]. Probes 1 and 3 were ineffective in capturing AKT and also captured only few other kinases. This may not be surprising for probe 1 as the basicity of the secondary amine of the piperidinyl side chain present in GSK690693 and important for AKT binding is not preserved in the immobilized configuration. The fairly low degree of kinase binding may be rationalized by the rather short and bulky group attaching the compounds to the beads which may prevent the molecule to reach deep enough into the ATP binding pocket. This argument does not apply for probe 3 as its linker is the same as that of probe 2. Instead, it is possible that the functional alkynol group cannot efficiently penetrate the very narrow opening into the back pocket of the ATP binding site of kinases so that even small conformational changes in the compound and/or the native, full length protein structure might considerably impair proper binding. It is noteworthy though that probe 3 appears to be an effective binder for the phosphatidylinositol kinase PI4KA, a lipid kinase that has recently been implicated in hepatitis C replication in human cells [34].
N
O N
NH2
N
N N
O
OH
N
O
N
O N
NH2
N
N N
ONH
OO
HN
O
N
O N
NH2
N
N N
ONH
OO
HN
OH
O
probe 1
probe2
probe3
© Cell Signaling Technology
probe 1
probe 2
probe 3
A B
N
O N
NH2
N
N N
O
OH
NH
GSK690693
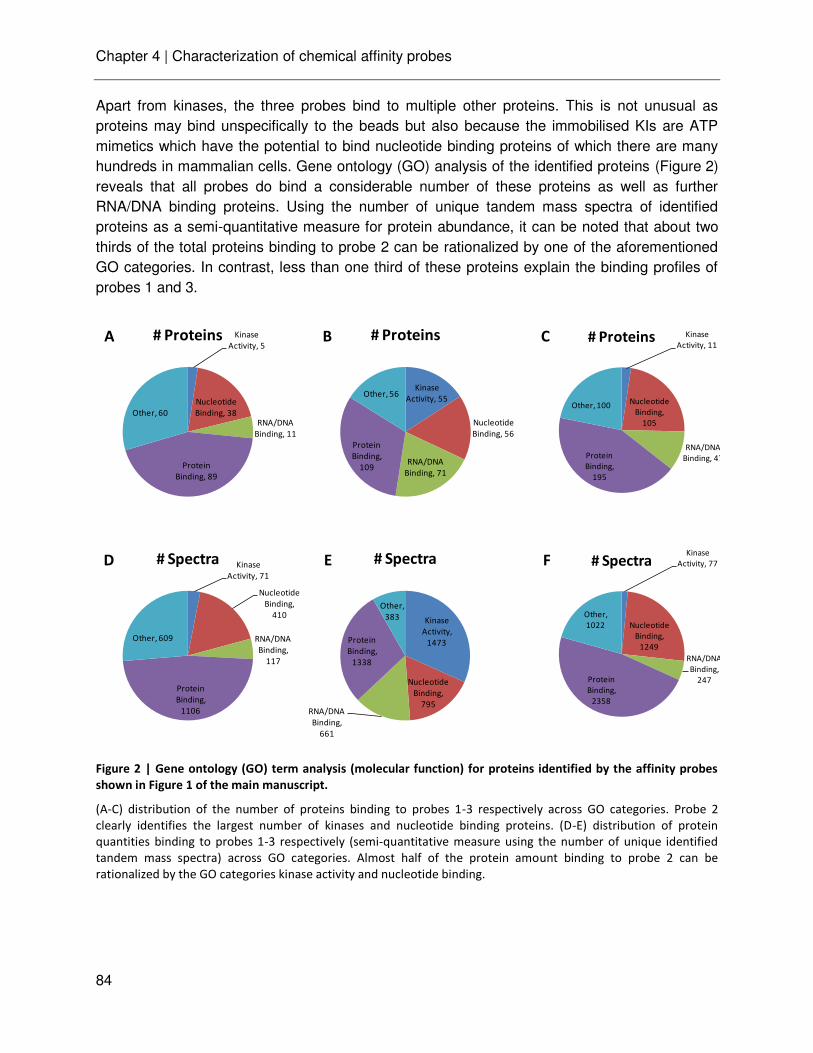
Chapter 4 | Characterization of chemical affinity probes
84
Apart from kinases, the three probes bind to multiple other proteins. This is not unusual as proteins may bind unspecifically to the beads but also because the immobilised KIs are ATP mimetics which have the potential to bind nucleotide binding proteins of which there are many hundreds in mammalian cells. Gene ontology (GO) analysis of the identified proteins (Figure 2) reveals that all probes do bind a considerable number of these proteins as well as further RNA/DNA binding proteins. Using the number of unique tandem mass spectra of identified proteins as a semi-quantitative measure for protein abundance, it can be noted that about two thirds of the total proteins binding to probe 2 can be rationalized by one of the aforementioned GO categories. In contrast, less than one third of these proteins explain the binding profiles of probes 1 and 3.
Figure 2 | Gene ontology (GO) term analysis (molecular function) for proteins identified by the affinity probes
shown in Figure 1 of the main manuscript.
(A-C) distribution of the number of proteins binding to probes 1-3 respectively across GO categories. Probe 2
clearly identifies the largest number of kinases and nucleotide binding proteins. (D-E) distribution of protein
quantities binding to probes 1-3 respectively (semi-quantitative measure using the number of unique identified
tandem mass spectra) across GO categories. Almost half of the protein amount binding to probe 2 can be
rationalized by the GO categories kinase activity and nucleotide binding.
Kinase
Activity, 11
Nucleotide
Binding,
105
RNA/DNA
Binding, 47Protein
Binding,
195
Other, 100
# Proteins
Kinase
Activity, 77
Nucleotide
Binding,
1249
RNA/DNA
Binding,
247Protein
Binding,
2358
Other,
1022
# Spectra
A B C
FED
Kinase
Activity, 55
Nucleotide
Binding, 56
RNA/DNA
Binding, 71
Protein
Binding,
109
Other, 56
# Proteins
Kinase
Activity,
1473
Nucleotide
Binding,
795RNA/DNA
Binding,
661
Protein
Binding,
1338
Other,
383
# Spectra
Kinase
Activity, 5
Nucleotide
Binding, 38RNA/DNA
Binding, 11
Protein
Binding, 89
Other, 60
# Proteins
Kinase
Activity, 71
Nucleotide
Binding,
410
RNA/DNA
Binding,
117
Protein
Binding,
1106
Other, 609
# Spectra
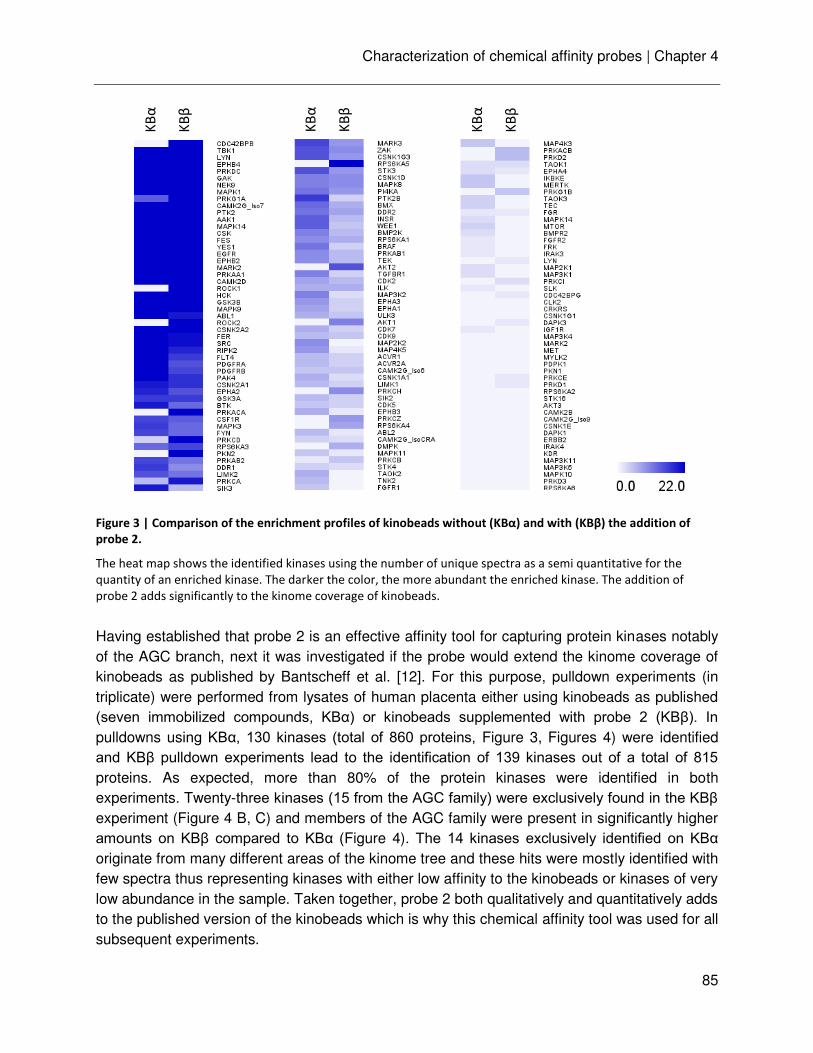
Characterization of chemical affinity probes | Chapter 4
85
Figure 3 | Co pariso of the e ri h e t profiles of ki o eads without KBα a d with KBβ the additio of probe 2.
The heat map shows the identified kinases using the number of unique spectra as a semi quantitative for the
quantity of an enriched kinase. The darker the color, the more abundant the enriched kinase. The addition of
probe 2 adds significantly to the kinome coverage of kinobeads.
Having established that probe 2 is an effective affinity tool for capturing protein kinases notably of the AGC branch, next it was investigated if the probe would extend the kinome coverage of kinobeads as published by Bantscheff et al. [12]. For this purpose, pulldown experiments (in triplicate) were performed from lysates of human placenta either using kinobeads as published (seven immobilized compounds, KBα) or kinobeads supplemented with probe β (KB ). In pulldowns using KBα, 1γ0 kinases (total of 860 proteins, Figure 3, Figures 4) were identified and KB pulldown experiments lead to the identification of 1γ9 kinases out of a total of 815 proteins. As expected, more than 80% of the protein kinases were identified in both experiments. Twenty-three kinases (15 from the AGC family) were exclusively found in the KB experiment (Figure 4 B, C) and members of the AGC family were present in significantly higher amounts on KB compared to KBα (Figure 4). The 14 kinases exclusively identified on KBα originate from many different areas of the kinome tree and these hits were mostly identified with few spectra thus representing kinases with either low affinity to the kinobeads or kinases of very low abundance in the sample. Taken together, probe 2 both qualitatively and quantitatively adds to the published version of the kinobeads which is why this chemical affinity tool was used for all subsequent experiments.
KB
α
KB
β
KB
α
KB
β
KB
α
KB
β
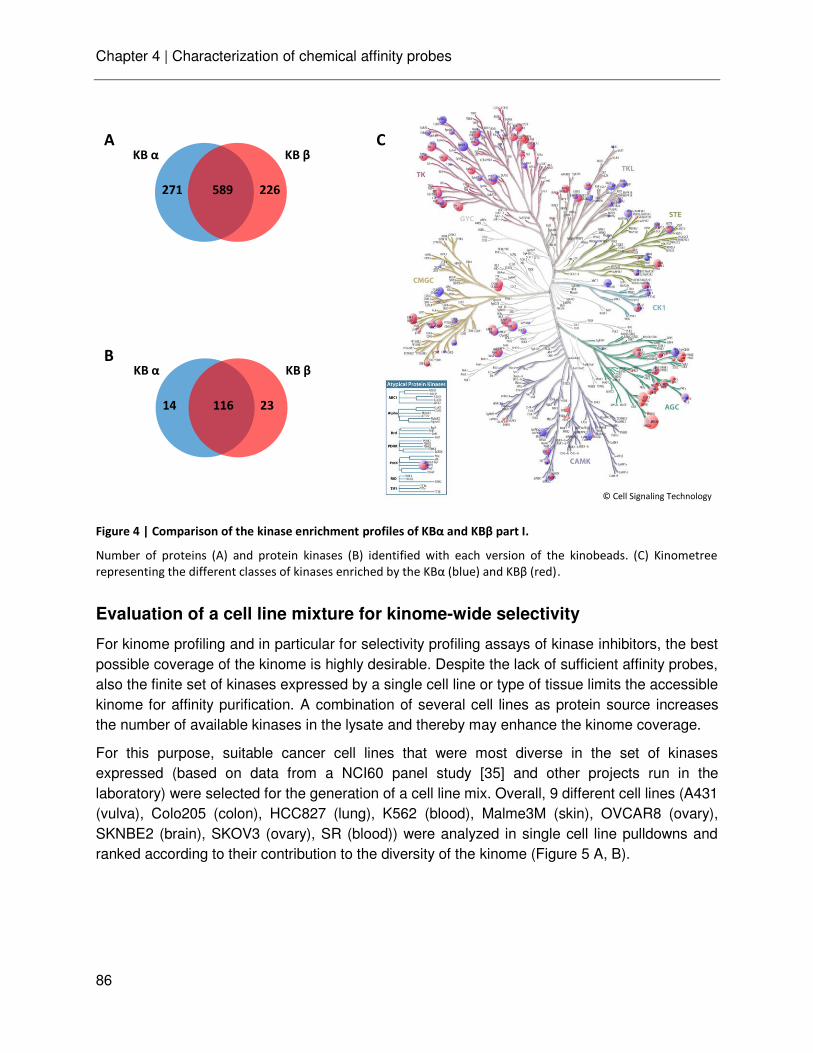
Chapter 4 | Characterization of chemical affinity probes
86
Figure 4 | Comparison of the kinase enrichment profiles of KBα a d KBβ part I.
Number of proteins (A) and protein kinases (B) identified with each version of the kinobeads. (C) Kinometree
representing the different classes of kinases enriched y the KBα ( lue and KBβ (red .
Evaluation of a cell line mixture for kinome-wide selectivity
For kinome profiling and in particular for selectivity profiling assays of kinase inhibitors, the best possible coverage of the kinome is highly desirable. Despite the lack of sufficient affinity probes, also the finite set of kinases expressed by a single cell line or type of tissue limits the accessible kinome for affinity purification. A combination of several cell lines as protein source increases the number of available kinases in the lysate and thereby may enhance the kinome coverage.
For this purpose, suitable cancer cell lines that were most diverse in the set of kinases expressed (based on data from a NCI60 panel study [35] and other projects run in the laboratory) were selected for the generation of a cell line mix. Overall, 9 different cell lines (A431 (vulva), Colo205 (colon), HCC827 (lung), K562 (blood), Malme3M (skin), OVCAR8 (ovary), SKNBE2 (brain), SKOV3 (ovary), SR (blood)) were analyzed in single cell line pulldowns and ranked according to their contribution to the diversity of the kinome (Figure 5 A, B).
589 226271
KB α KB β
116 2314
KB α KB β
© Cell Signaling Technology
A
B
C
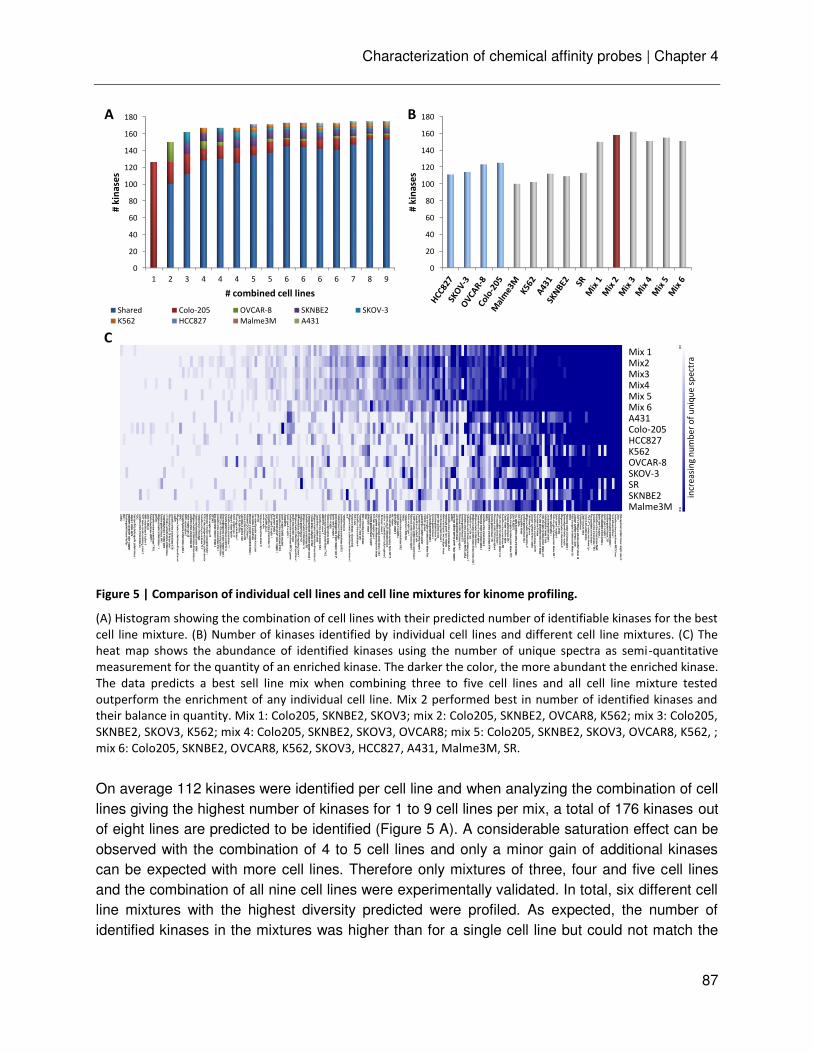
Characterization of chemical affinity probes | Chapter 4
87
Figure 5 | Comparison of individual cell lines and cell line mixtures for kinome profiling.
(A) Histogram showing the combination of cell lines with their predicted number of identifiable kinases for the best
cell line mixture. (B) Number of kinases identified by individual cell lines and different cell line mixtures. (C) The
heat map shows the abundance of identified kinases using the number of unique spectra as semi-quantitative
measurement for the quantity of an enriched kinase. The darker the color, the more abundant the enriched kinase.
The data predicts a best sell line mix when combining three to five cell lines and all cell line mixture tested
outperform the enrichment of any individual cell line. Mix 2 performed best in number of identified kinases and
their balance in quantity. Mix 1: Colo205, SKNBE2, SKOV3; mix 2: Colo205, SKNBE2, OVCAR8, K562; mix 3: Colo205,
SKNBE2, SKOV3, K562; mix 4: Colo205, SKNBE2, SKOV3, OVCAR8; mix 5: Colo205, SKNBE2, SKOV3, OVCAR8, K562, ;
mix 6: Colo205, SKNBE2, OVCAR8, K562, SKOV3, HCC827, A431, Malme3M, SR.
On average 112 kinases were identified per cell line and when analyzing the combination of cell lines giving the highest number of kinases for 1 to 9 cell lines per mix, a total of 176 kinases out of eight lines are predicted to be identified (Figure 5 A). A considerable saturation effect can be observed with the combination of 4 to 5 cell lines and only a minor gain of additional kinases can be expected with more cell lines. Therefore only mixtures of three, four and five cell lines and the combination of all nine cell lines were experimentally validated. In total, six different cell line mixtures with the highest diversity predicted were profiled. As expected, the number of identified kinases in the mixtures was higher than for a single cell line but could not match the
Mix 1Mix2Mix3Mix4Mix 5Mix 6A431Colo-205HCC827K562OVCAR-8SKOV-3SRSKNBE2Malme3M
incr
ea
sin
g n
um
be
r o
f u
niq
ue
sp
ect
ra
0
20
40
60
80
100
120
140
160
180
1 2 3 4 4 4 5 5 6 6 6 6 7 8 9
# k
ina
ses
# combined cell lines
Shared Colo-205 OVCAR-8 SKNBE2 SKOV-3
K562 HCC827 Malme3M A431
0
20
40
60
80
100
120
140
160
180
# k
ina
ses
A B
C
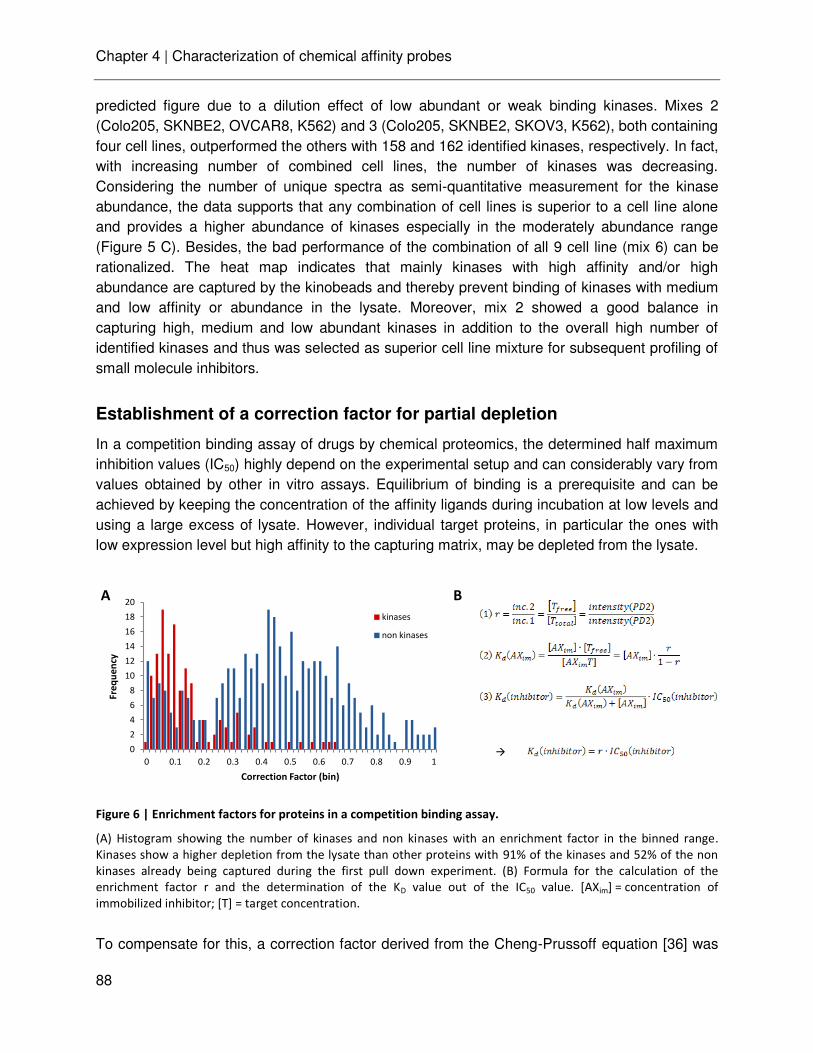
Chapter 4 | Characterization of chemical affinity probes
88
predicted figure due to a dilution effect of low abundant or weak binding kinases. Mixes 2 (Colo205, SKNBE2, OVCAR8, K562) and 3 (Colo205, SKNBE2, SKOV3, K562), both containing four cell lines, outperformed the others with 158 and 162 identified kinases, respectively. In fact, with increasing number of combined cell lines, the number of kinases was decreasing. Considering the number of unique spectra as semi-quantitative measurement for the kinase abundance, the data supports that any combination of cell lines is superior to a cell line alone and provides a higher abundance of kinases especially in the moderately abundance range (Figure 5 C). Besides, the bad performance of the combination of all 9 cell line (mix 6) can be rationalized. The heat map indicates that mainly kinases with high affinity and/or high abundance are captured by the kinobeads and thereby prevent binding of kinases with medium and low affinity or abundance in the lysate. Moreover, mix 2 showed a good balance in capturing high, medium and low abundant kinases in addition to the overall high number of identified kinases and thus was selected as superior cell line mixture for subsequent profiling of small molecule inhibitors.
Establishment of a correction factor for partial depletion
In a competition binding assay of drugs by chemical proteomics, the determined half maximum inhibition values (IC50) highly depend on the experimental setup and can considerably vary from values obtained by other in vitro assays. Equilibrium of binding is a prerequisite and can be achieved by keeping the concentration of the affinity ligands during incubation at low levels and using a large excess of lysate. However, individual target proteins, in particular the ones with low expression level but high affinity to the capturing matrix, may be depleted from the lysate.
Figure 6 | Enrichment factors for proteins in a competition binding assay.
(A) Histogram showing the number of kinases and non kinases with an enrichment factor in the binned range.
Kinases show a higher depletion from the lysate than other proteins with 91% of the kinases and 52% of the non
kinases already being captured during the first pull down experiment. (B) Formula for the calculation of the
enrichment factor r and the determination of the KD value out of the IC50 value. [AXim] = concentration of
immobilized inhibitor; [T] = target concentration.
To compensate for this, a correction factor derived from the Cheng-Prussoff equation [36] was
0
2
4
6
8
10
12
14
16
18
20
0 0.1 0.2 0.3 0.4 0.5 0.6 0.7 0.8 0.9 1
Fre
qu
en
cy
Correction Factor (bin)
kinases
non kinases
A B
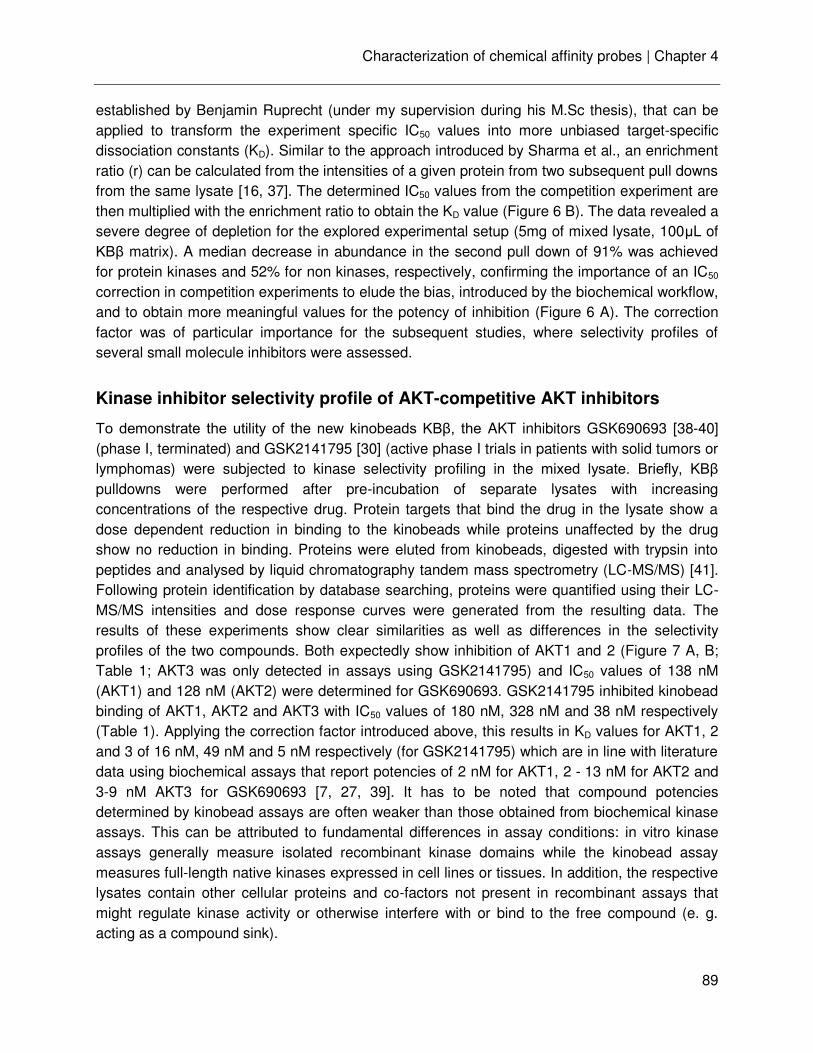
Characterization of chemical affinity probes | Chapter 4
89
established by Benjamin Ruprecht (under my supervision during his M.Sc thesis), that can be applied to transform the experiment specific IC50 values into more unbiased target-specific dissociation constants (KD). Similar to the approach introduced by Sharma et al., an enrichment ratio (r) can be calculated from the intensities of a given protein from two subsequent pull downs from the same lysate [16, 37]. The determined IC50 values from the competition experiment are then multiplied with the enrichment ratio to obtain the KD value (Figure 6 B). The data revealed a severe degree of depletion for the explored experimental setup (5mg of mixed lysate, 100μL of KB matrix). A median decrease in abundance in the second pull down of 91% was achieved for protein kinases and 52% for non kinases, respectively, confirming the importance of an IC50 correction in competition experiments to elude the bias, introduced by the biochemical workflow, and to obtain more meaningful values for the potency of inhibition (Figure 6 A). The correction factor was of particular importance for the subsequent studies, where selectivity profiles of several small molecule inhibitors were assessed.
Kinase inhibitor selectivity profile of AKT-competitive AKT inhibitors
To demonstrate the utility of the new kinobeads KB , the AKT inhibitors GSK690693 [38-40] (phase I, terminated) and GSK2141795 [30] (active phase I trials in patients with solid tumors or lymphomas) were subjected to kinase selectivity profiling in the mixed lysate. Briefly, KB pulldowns were performed after pre-incubation of separate lysates with increasing concentrations of the respective drug. Protein targets that bind the drug in the lysate show a dose dependent reduction in binding to the kinobeads while proteins unaffected by the drug show no reduction in binding. Proteins were eluted from kinobeads, digested with trypsin into peptides and analysed by liquid chromatography tandem mass spectrometry (LC-MS/MS) [41]. Following protein identification by database searching, proteins were quantified using their LC-MS/MS intensities and dose response curves were generated from the resulting data. The results of these experiments show clear similarities as well as differences in the selectivity profiles of the two compounds. Both expectedly show inhibition of AKT1 and 2 (Figure 7 A, B; Table 1; AKT3 was only detected in assays using GSK2141795) and IC50 values of 138 nM (AKT1) and 128 nM (AKT2) were determined for GSK690693. GSK2141795 inhibited kinobead binding of AKT1, AKT2 and AKT3 with IC50 values of 180 nM, 328 nM and 38 nM respectively (Table 1). Applying the correction factor introduced above, this results in KD values for AKT1, 2 and 3 of 16 nM, 49 nM and 5 nM respectively (for GSK2141795) which are in line with literature data using biochemical assays that report potencies of 2 nM for AKT1, 2 - 13 nM for AKT2 and 3-9 nM AKT3 for GSK690693 [7, 27, 39]. It has to be noted that compound potencies determined by kinobead assays are often weaker than those obtained from biochemical kinase assays. This can be attributed to fundamental differences in assay conditions: in vitro kinase assays generally measure isolated recombinant kinase domains while the kinobead assay measures full-length native kinases expressed in cell lines or tissues. In addition, the respective lysates contain other cellular proteins and co-factors not present in recombinant assays that might regulate kinase activity or otherwise interfere with or bind to the free compound (e. g. acting as a compound sink).
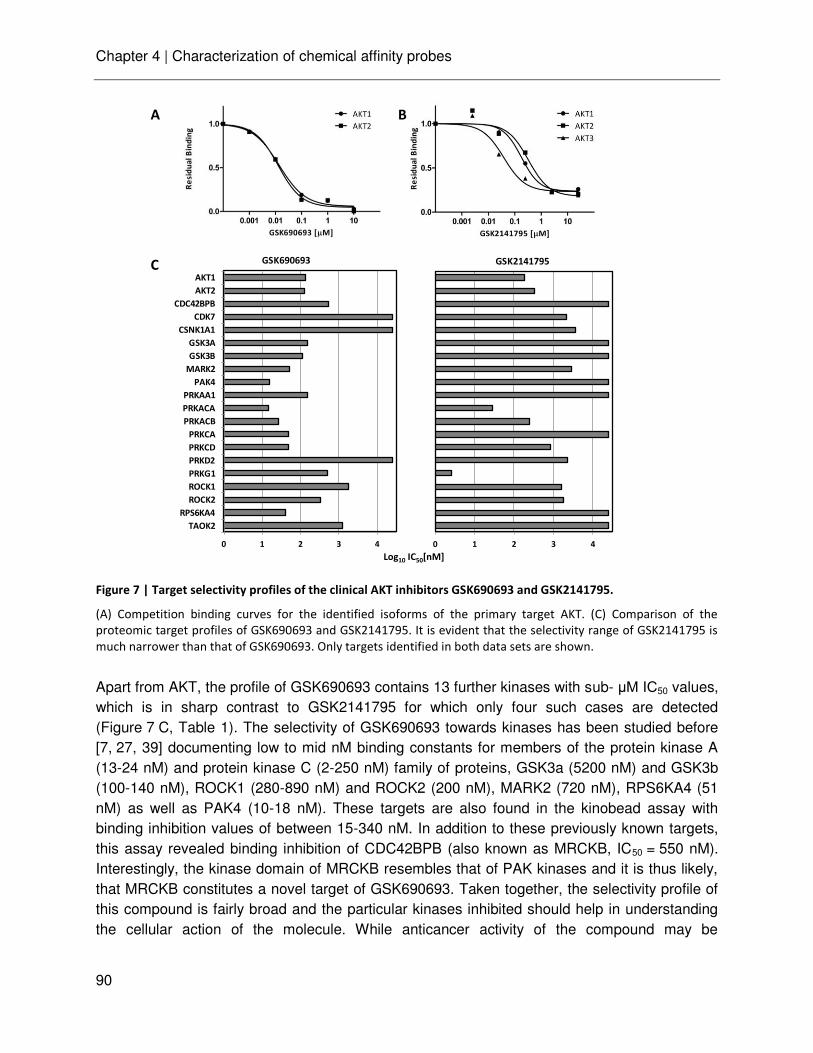
Chapter 4 | Characterization of chemical affinity probes
90
Figure 7 | Target selectivity profiles of the clinical AKT inhibitors GSK690693 and GSK2141795.
(A) Competition binding curves for the identified isoforms of the primary target AKT. (C) Comparison of the
proteomic target profiles of GSK690693 and GSK2141795. It is evident that the selectivity range of GSK2141795 is
much narrower than that of GSK690693. Only targets identified in both data sets are shown.
Apart from AKT, the profile of GSK690693 contains 13 further kinases with sub- μM IC50 values, which is in sharp contrast to GSK2141795 for which only four such cases are detected (Figure 7 C, Table 1). The selectivity of GSK690693 towards kinases has been studied before [7, 27, 39] documenting low to mid nM binding constants for members of the protein kinase A (13-24 nM) and protein kinase C (2-250 nM) family of proteins, GSK3a (5200 nM) and GSK3b (100-140 nM), ROCK1 (280-890 nM) and ROCK2 (200 nM), MARK2 (720 nM), RPS6KA4 (51 nM) as well as PAK4 (10-18 nM). These targets are also found in the kinobead assay with binding inhibition values of between 15-340 nM. In addition to these previously known targets, this assay revealed binding inhibition of CDC42BPB (also known as MRCKB, IC50 = 550 nM). Interestingly, the kinase domain of MRCKB resembles that of PAK kinases and it is thus likely, that MRCKB constitutes a novel target of GSK690693. Taken together, the selectivity profile of this compound is fairly broad and the particular kinases inhibited should help in understanding the cellular action of the molecule. While anticancer activity of the compound may be
A
C
Log10 IC50[nM]
0 1 2 3 4
TAOK2
RPS6KA4
ROCK2
ROCK1
PRKG1
PRKD2
PRKCD
PRKCA
PRKACB
PRKACA
PRKAA1
PAK4
MARK2
GSK3B
GSK3A
CSNK1A1
CDK7
CDC42BPB
AKT2
AKT1
GSK690693
0 1 2 3 4
GSK2141795
B
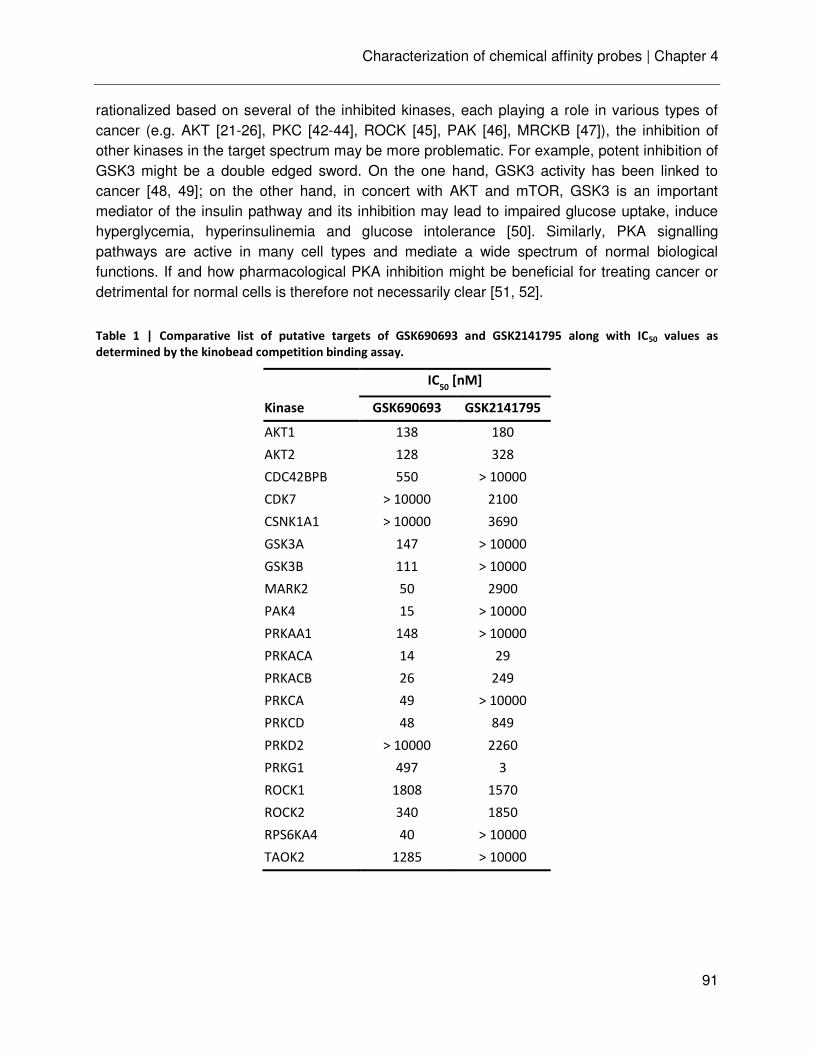
Characterization of chemical affinity probes | Chapter 4
91
rationalized based on several of the inhibited kinases, each playing a role in various types of cancer (e.g. AKT [21-26], PKC [42-44], ROCK [45], PAK [46], MRCKB [47]), the inhibition of other kinases in the target spectrum may be more problematic. For example, potent inhibition of GSK3 might be a double edged sword. On the one hand, GSK3 activity has been linked to cancer [48, 49]; on the other hand, in concert with AKT and mTOR, GSK3 is an important mediator of the insulin pathway and its inhibition may lead to impaired glucose uptake, induce hyperglycemia, hyperinsulinemia and glucose intolerance [50]. Similarly, PKA signalling pathways are active in many cell types and mediate a wide spectrum of normal biological functions. If and how pharmacological PKA inhibition might be beneficial for treating cancer or detrimental for normal cells is therefore not necessarily clear [51, 52].
Table 1 | Comparative list of putative targets of GSK690693 and GSK2141795 along with IC50 values as
determined by the kinobead competition binding assay.
IC
50 [nM]
Kinase GSK690693 GSK2141795
AKT1 138 180
AKT2 128 328
CDC42BPB 550 > 10000
CDK7 > 10000 2100
CSNK1A1 > 10000 3690
GSK3A 147 > 10000
GSK3B 111 > 10000
MARK2 50 2900
PAK4 15 > 10000
PRKAA1 148 > 10000
PRKACA 14 29
PRKACB 26 249
PRKCA 49 > 10000
PRKCD 48 849
PRKD2 > 10000 2260
PRKG1 497 3
ROCK1 1808 1570
ROCK2 340 1850
RPS6KA4 40 > 10000
TAOK2 1285 > 10000
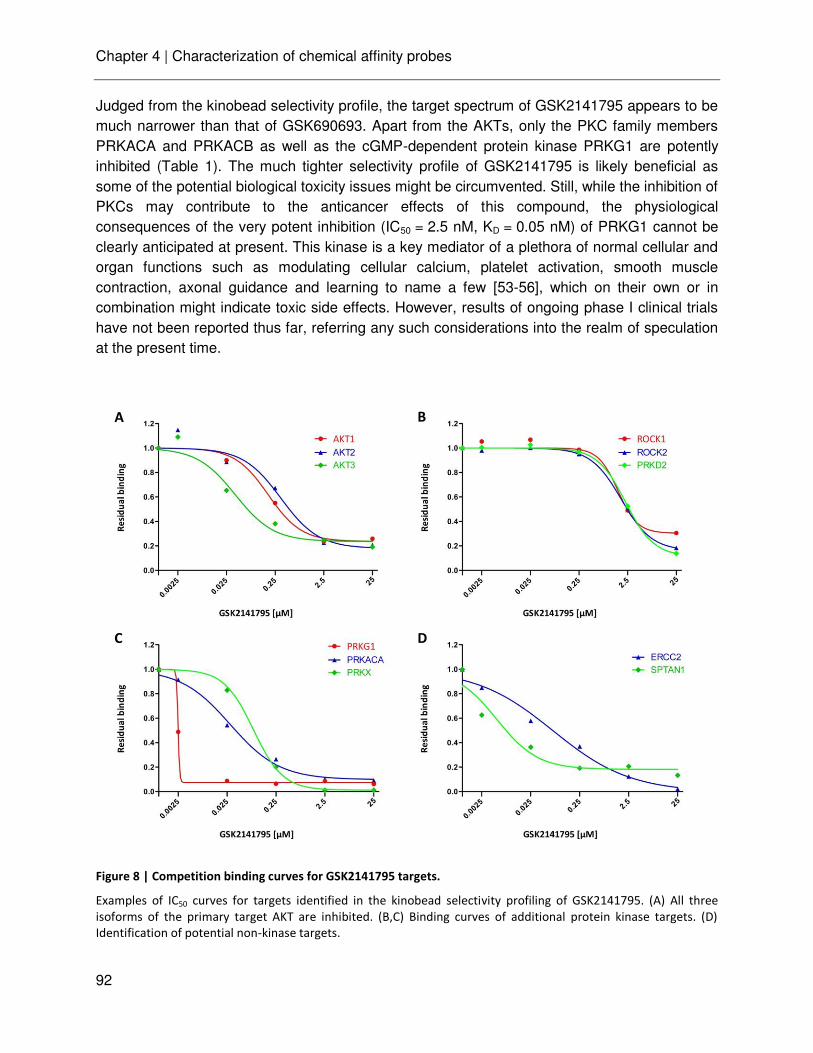
Chapter 4 | Characterization of chemical affinity probes
92
Judged from the kinobead selectivity profile, the target spectrum of GSK2141795 appears to be much narrower than that of GSK690693. Apart from the AKTs, only the PKC family members PRKACA and PRKACB as well as the cGMP-dependent protein kinase PRKG1 are potently inhibited (Table 1). The much tighter selectivity profile of GSK2141795 is likely beneficial as some of the potential biological toxicity issues might be circumvented. Still, while the inhibition of PKCs may contribute to the anticancer effects of this compound, the physiological consequences of the very potent inhibition (IC50 = 2.5 nM, KD = 0.05 nM) of PRKG1 cannot be clearly anticipated at present. This kinase is a key mediator of a plethora of normal cellular and organ functions such as modulating cellular calcium, platelet activation, smooth muscle contraction, axonal guidance and learning to name a few [53-56], which on their own or in combination might indicate toxic side effects. However, results of ongoing phase I clinical trials have not been reported thus far, referring any such considerations into the realm of speculation at the present time.
Figure 8 | Competition binding curves for GSK2141795 targets.
Examples of IC50 curves for targets identified in the kinobead selectivity profiling of GSK2141795. (A) All three
isoforms of the primary target AKT are inhibited. (B,C) Binding curves of additional protein kinase targets. (D)
Identification of potential non-kinase targets.
A B
C D
Characterization of chemical affinity probes | Chapter 4
93
Given that kinobeads not only bind kinases and other nucleotide binding proteins but also capture binding proteins from cell lysates under denaturing conditions, one frequently observes non-kinase targets and co-purification of interacting proteins in competition binding experiments (Figure 8). For example, spectrin alpha 1 (SPTAN1) shows a dose dependent reduction in binding to kinobeads. This protein contains an SH3 domain suggesting that it might co-purify with a phosphorylated kinase that itself is inhibited by GSK2141795. The ATP-dependent 5’-γ’ DNA helicase ERCC2 also shows a dose dependent reduction of kinobead binding in response to drug treatment. Given the ATP-hydrolysing activity of this enzyme, which is involved in nucleotide excision repair following DNA damage, it is tempting to speculate that it might be a non-kinase off-target of GSK2141795. How this might impact the phenotype of cells treated with the compound remains to be investigated.
Kinase inhibitor selectivity profile of allosteric AKT inhibitors
Although the kinase inhibitor selectivity profiling by chemical proteomics is primarily suitable for ATP-competitive inhibitors, as both, affinity matrix and inhibitor, compete in binding to the conserved ATP-binding pocket within the kinase domain, this approach was further applied to the profiling of the allosteric AKT inhibitors perifosine [31] and MK-2206 [32]. Perifosine belongs to the class of alkylophospholipids and decreases AKT phosphorylation in vivo in a dose dependent manner via interaction with the PH-domain of AKT [31]. MK-2206 is a highly potent allosteric inhibitor that binds to and inhibits the activity of AKT in a non-ATP competitive manner probably by binding to a regulatory domain within AKT, but the exact mechanism of action remains to be elucidated [32, 57]. Both compounds surprisingly showed direct reduction in kinobead binding of the AKT family with IC50 values of 120 nM and 44 nM for AKT1 and 2 for perifosine (Figure 9 A; AKT3 could not be detected). IC50 values for AKT1, 2 and 3 of 19 nM, 20 nM and 18 nM, respectively, were determined for MK-2206 (Figure 9 D). This data suggests that binding of the inhibitor to the PH- or regulatory domain induces a conformational change in the ATP-pocket of AKT, thus leading to decreased binding to the kinobeads, or the inhibition of AKT activity by a mechanism independent from phosphorylation prevention. As the PH-domain is suspected to be the primary binding site of the two compounds, also other proteins containing this domain are likely to show an effect. However, no inhibition was observed for these kinases identified in the screen.
Apart from AKT, mitogen activated protein kinases (MAPKs) represent important off-targets of perifosine (Figure 9 B, C). MAPK pathways are evolutionary conserved signalling cascades that control fundamental cellular processes such as growth, proliferation, differentiation, migration and apoptosis [58]. They compromise several levels in which a MAP kinase (MAPK, ERK) is activated by a MAP kinase kinase (MAP2K, MEK), which in turn is activated by a MAP kinase kinase kinase (MAP3K). Regarding the importance of MAPK pathways, it is not surprising that the play a critical role in the development and progression of a broad spectrum of cancer types [58-61]. Most prominent is the Raf/MEK/ERK pathway, which is deregulated in approximately one third of human tumors. The effect of perifosine on the MEK/ERK pathway was investigated in various studies and different cancer types leading to controversial results.
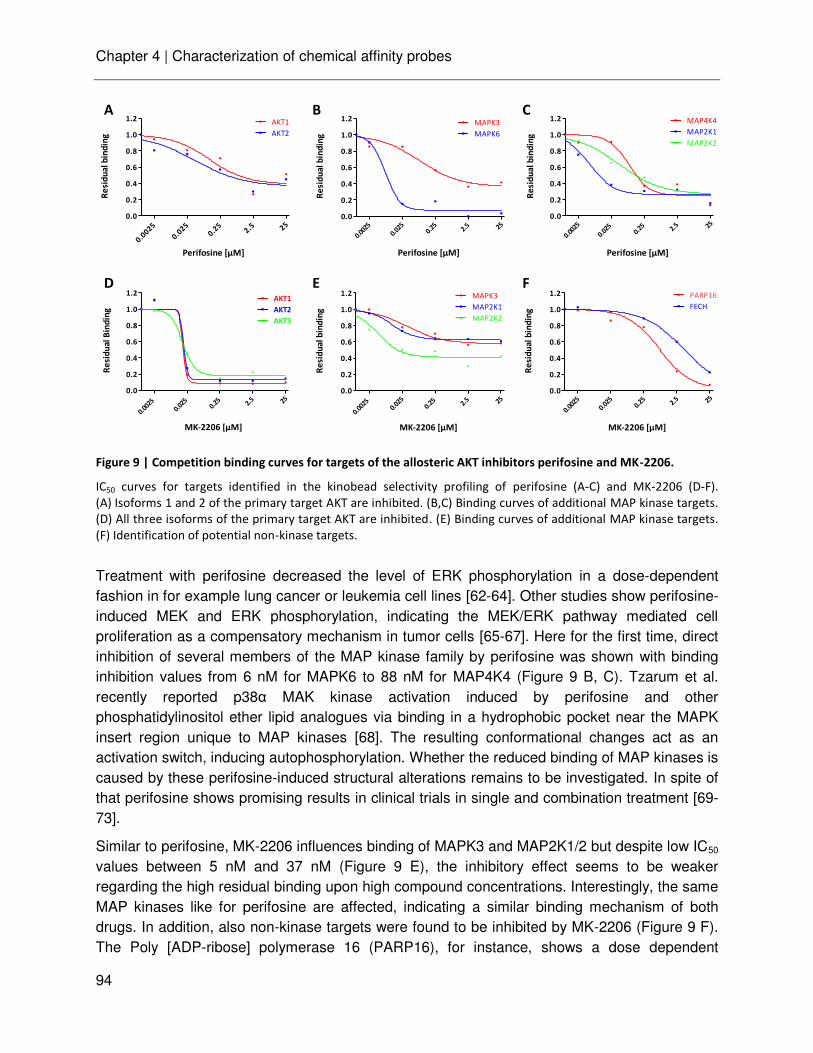
Chapter 4 | Characterization of chemical affinity probes
94
Figure 9 | Competition binding curves for targets of the allosteric AKT inhibitors perifosine and MK-2206.
IC50 curves for targets identified in the kinobead selectivity profiling of perifosine (A-C) and MK-2206 (D-F).
(A) Isoforms 1 and 2 of the primary target AKT are inhibited. (B,C) Binding curves of additional MAP kinase targets.
(D) All three isoforms of the primary target AKT are inhibited. (E) Binding curves of additional MAP kinase targets.
(F) Identification of potential non-kinase targets.
Treatment with perifosine decreased the level of ERK phosphorylation in a dose-dependent fashion in for example lung cancer or leukemia cell lines [62-64]. Other studies show perifosine-induced MEK and ERK phosphorylation, indicating the MEK/ERK pathway mediated cell proliferation as a compensatory mechanism in tumor cells [65-67]. Here for the first time, direct inhibition of several members of the MAP kinase family by perifosine was shown with binding inhibition values from 6 nM for MAPK6 to 88 nM for MAP4K4 (Figure 9 B, C). Tzarum et al. recently reported p38α MAK kinase activation induced by perifosine and other phosphatidylinositol ether lipid analogues via binding in a hydrophobic pocket near the MAPK insert region unique to MAP kinases [68]. The resulting conformational changes act as an activation switch, inducing autophosphorylation. Whether the reduced binding of MAP kinases is caused by these perifosine-induced structural alterations remains to be investigated. In spite of that perifosine shows promising results in clinical trials in single and combination treatment [69-73].
Similar to perifosine, MK-2206 influences binding of MAPK3 and MAP2K1/2 but despite low IC50 values between 5 nM and 37 nM (Figure 9 E), the inhibitory effect seems to be weaker regarding the high residual binding upon high compound concentrations. Interestingly, the same MAP kinases like for perifosine are affected, indicating a similar binding mechanism of both drugs. In addition, also non-kinase targets were found to be inhibited by MK-2206 (Figure 9 F). The Poly [ADP-ribose] polymerase 16 (PARP16), for instance, shows a dose dependent
0.0
0.2
0.4
0.6
0.8
1.0
1.2 PARP16
FECH
0.00
25
0.02
50.
25 2.5 25
MK-2206 [µM]
Re
sid
ua
l b
ind
ing
0.0
0.2
0.4
0.6
0.8
1.0
1.2 MAP4K4
MAP2K1
MAP2K2
0.00
25
0.02
50.
25 2.5 25
Perifosine [µM]
Re
sid
ua
l b
ind
ing
0.0
0.2
0.4
0.6
0.8
1.0
1.2 AKT1
AKT2
0.0025
0.025
0.25
2.5 25
Perifosine [µM]
Re
sid
ua
l b
ind
ing
0.0
0.2
0.4
0.6
0.8
1.0
1.2MAPK3
MAPK6
0.00
25
0.02
50.
25 2.5 25
Perifosine [µM]
Re
sid
ua
l b
ind
ing
0.0
0.2
0.4
0.6
0.8
1.0
1.2AKT1
AKT2
AKT3
0.00
250.
025
0.25 2.
5 25
MK-2206 [µM]
Re
sid
ua
l B
ind
ing
0.0
0.2
0.4
0.6
0.8
1.0
1.2 MAPK3
MAP2K1
MAP2K2
0.00
250.
025
0.25 2.
5 25
MK-2206 [µM]
Re
sid
ua
l b
ind
ing
A
D
B
E
C
F
Characterization of chemical affinity probes | Chapter 4
95
reduction of binding to the kinobeads. PARP16 has a DNA-binding domain and is mainly involved in the detection and initiation of single-strand DNA breaks (SSB) within DNA repair and programmed cell death. As transient PARP inhibition causes impaired DNA damage detection or repair, this could be effective in cancer therapy and many PARP inhibitors are currently in clinical trials [74-76]. Given the nucleotide binding activity of the protein, it is likely that it might be a direct target of the nucleotide analogue MK-2206. In addition, also the ferrochelatase FECH shows a weak inhibition upon drug treatment. Given that defects in this enzyme are associated with erythropoietic protoporphyria, the inhibition might cause skin irritations as side effect upon drug treatment [77].
Chapter 4 | Characterization of chemical affinity probes
96
Concluding remarks
In summary, a novel chemical affinity probe was described for capturing AKT isoforms and about 50 further kinases primarily from the AGC branch of the kinome phylogenetic tree. This not only increases the range of kinases that can be assayed by the established kinobead technology, it also substantially reduces the bias of kinobeads towards the representation of tyrosine and tyrosine like kinases. The application of the new probes to the selectivity profiling of AKT kinase inhibitors confirmed the broad selectivity of GSK690693 and, for the first time, established the much narrower profile of GSK2141795 generating new hypothesis as to how this clinical AKT inhibitor exerts its cellular effects. Moreover, it was successfully demonstrated that selectivity profiling by kinobeads can also be applied to allosteric inhibitors as shown by the screening of perifosine and MK-2206. This work shows that retro-engineering kinase inhibitors into broad kinase binders works and it is entirely feasible to apply the same or a similar strategy to other kinase families should reasonable chemical starting points exist. In light of the current chemoproteomic literature [37, 78, 79] it is unlikely that a single true pan-kinase compound probe can be developed but continuing efforts by this lab and others in the field [5, 80] will likely eventually fill the remaining gaps.
Characterization of chemical affinity probes | Chapter 4
97
Acknowledgments
I am indebted to Patrik Plattner from the Department of Chemistry at Bielefeld University who performed the synthesis of the AKT affinity probe and to Benjamin Ruprecht who established the cell line mix and correction factor and performed most of the kinase inhibitor profiles during his MSc thesis under my supervision.
Abbreviations
CID collision induced dissociation
DMEM Dulbecco’s modified Eagle’s medium
FBS fetal bovine serum
GO gene ontology
HCD higher energy collision induced dissociation
IC50 half maximal inhibitory concentration
IMDM Iscove´s modified Dulbecco´s medium
KD dissociation constant
KB kinobeads
KI kinase inhibitor
LC-MS/MS liquid chromatography coupled to tandem mass spectrometry
PBS phosphate buffered saline
PH pleckstrin homology domain
RPMI1640 Roswell Park Memorial Institute 1640 medium
SAR structure activity relationship
Chapter 4 | Characterization of chemical affinity probes
98
References
1. Manning, G.; Whyte, D. B.; Martinez, R.; Hunter, T.; Sudarsanam, S., The protein kinase complement of the human genome. Science 2002, 298 (5600), 1912-34.
2. Cohen, P., Protein kinases--the major drug targets of the twenty-first century? Nat Rev Drug Discov 2002, 1 (4), 309-15.
3. Fedorov, O.; Muller, S.; Knapp, S., The (un)targeted cancer kinome. Nat Chem Biol 2010, 6 (3), 166-169.
4. Page, T. H.; Smolinska, M.; Gillespie, J.; Urbaniak, A. M.; Foxwell, B. M., Tyrosine kinases and inflammatory signalling. Curr Mol Med 2009, 9 (1), 69-85.
5. Knapp, S.; Arruda, P.; Blagg, J.; Burley, S.; Drewry, D. H.; Edwards, A.; Fabbro, D.; Gillespie, P.; Gray, N. S.; Kuster, B.; Lackey, K. E.; Mazzafera, P.; Tomkinson, N. C.; Willson, T. M.; Workman, P.; Zuercher, W. J., A public-private partnership to unlock the untargeted kinome. Nat Chem Biol 2013, 9 (1), 3-6.
6. Cohen, P.; Alessi, D. R., Kinase drug discovery--what's next in the field? ACS Chem Biol 2013, 8 (1), 96-104.
7. Davis, M. I.; Hunt, J. P.; Herrgard, S.; Ciceri, P.; Wodicka, L. M.; Pallares, G.; Hocker, M.; Treiber, D. K.; Zarrinkar, P. P., Comprehensive analysis of kinase inhibitor selectivity. Nat Biotechnol 2011, 29 (11), 1046-51.
8. Karaman, M. W.; Herrgard, S.; Treiber, D. K.; Gallant, P.; Atteridge, C. E.; Campbell, B. T.; Chan, K. W.; Ciceri, P.; Davis, M. I.; Edeen, P. T.; Faraoni, R.; Floyd, M.; Hunt, J. P.; Lockhart, D. J.; Milanov, Z. V.; Morrison, M. J.; Pallares, G.; Patel, H. K.; Pritchard, S.; Wodicka, L. M.; Zarrinkar, P. P., A quantitative analysis of kinase inhibitor selectivity. Nat Biotechnol 2008, 26 (1), 127-32.
9. Anastassiadis, T.; Deacon, S. W.; Devarajan, K.; Ma, H.; Peterson, J. R., Comprehensive assay of kinase catalytic activity reveals features of kinase inhibitor selectivity. Nat Biotechnol 2011, 29 (11), 1039-45.
10. Nolen, B.; Taylor, S.; Ghosh, G., Regulation of protein kinases; controlling activity through activation segment conformation. Mol Cell 2004, 15 (5), 661-75.
11. Shi, Z.; Resing, K. A.; Ahn, N. G., Networks for the allosteric control of protein kinases. Curr Opin Struct Biol 2006, 16 (6), 686-92.
12. Bantscheff, M.; Eberhard, D.; Abraham, Y.; Bastuck, S.; Boesche, M.; Hobson, S.; Mathieson, T.; Perrin, J.; Raida, M.; Rau, C.; Reader, V.; Sweetman, G.; Bauer, A.; Bouwmeester, T.; Hopf, C.; Kruse, U.; Neubauer, G.; Ramsden, N.; Rick, J.; Kuster, B.; Drewes, G., Quantitative chemical proteomics reveals mechanisms of action of clinical ABL kinase inhibitors. Nat Biotechnol 2007, 25 (9), 1035-44.
13. Brehmer, D.; Greff, Z.; Godl, K.; Blencke, S.; Kurtenbach, A.; Weber, M.; Muller, S.; Klebl, B.; Cotten, M.; Keri, G.; Wissing, J.; Daub, H., Cellular targets of gefitinib. Cancer Res 2005, 65 (2), 379-82.
14. Godl, K.; Gruss, O. J.; Eickhoff, J.; Wissing, J.; Blencke, S.; Weber, M.; Degen, H.; Brehmer, D.; Orfi, L.; Horvath, Z.; Keri, G.; Muller, S.; Cotten, M.; Ullrich, A.; Daub, H., Proteomic characterization of the angiogenesis inhibitor SU6668 reveals multiple impacts on cellular kinase signaling. Cancer Res 2005, 65 (15), 6919-26.
Characterization of chemical affinity probes | Chapter 4
99
15. Wissing, J.; Jansch, L.; Nimtz, M.; Dieterich, G.; Hornberger, R.; Keri, G.; Wehland, J.; Daub, H., Proteomics analysis of protein kinases by target class-selective prefractionation and tandem mass spectrometry. Mol Cell Proteomics 2007, 6 (3), 537-47.
16. Sharma, K.; Weber, C.; Bairlein, M.; Greff, Z.; Keri, G.; Cox, J.; Olsen, J. V.; Daub, H., Proteomics strategy for quantitative protein interaction profiling in cell extracts. Nat Methods 2009, 6 (10), 741-4.
17. Wu, Z.; Doondeea, J. B.; Gholami, A. M.; Janning, M. C.; Lemeer, S.; Kramer, K.; Eccles, S. A.; Gollin, S. M.; Grenman, R.; Walch, A.; Feller, S. M.; Kuster, B., Quantitative chemical proteomics reveals new potential drug targets in head and neck cancer. Mol Cell Proteomics 2011, 10 (12), M111 011635.
18. Kruse, U.; Bantscheff, M.; Drewes, G.; Hopf, C., Chemical and pathway proteomics: powerful tools for oncology drug discovery and personalized health care. Mol Cell Proteomics 2008, 7 (10), 1887-901.
19. Rix, U.; Hantschel, O.; Durnberger, G.; Remsing Rix, L. L.; Planyavsky, M.; Fernbach, N. V.; Kaupe, I.; Bennett, K. L.; Valent, P.; Colinge, J.; Kocher, T.; Superti-Furga, G., Chemical proteomic profiles of the BCR-ABL inhibitors imatinib, nilotinib, and dasatinib reveal novel kinase and nonkinase targets. Blood 2007, 110 (12), 4055-63.
20. Daub, H.; Olsen, J. V.; Bairlein, M.; Gnad, F.; Oppermann, F. S.; Korner, R.; Greff, Z.; Keri, G.; Stemmann, O.; Mann, M., Kinase-selective enrichment enables quantitative phosphoproteomics of the kinome across the cell cycle. Mol Cell 2008, 31 (3), 438-48.
21. Manning, B. D.; Cantley, L. C., AKT/PKB signaling: navigating downstream. Cell 2007, 129 (7), 1261-74.
22. Garcia-Echeverria, C.; Sellers, W. R., Drug discovery approaches targeting the PI3K/Akt pathway in cancer. Oncogene 2008, 27 (41), 5511-26.
23. Altomare, D. A.; Testa, J. R., Perturbations of the AKT signaling pathway in human cancer. Oncogene 2005, 24 (50), 7455-64.
24. Vivanco, I.; Sawyers, C. L., The phosphatidylinositol 3-Kinase AKT pathway in human cancer. Nat Rev Cancer 2002, 2 (7), 489-501.
25. Franke, T. F., PI3K/Akt: getting it right matters. Oncogene 2008, 27 (50), 6473-88.
26. Lu, Y.; Wang, H.; Mills, G. B., Targeting PI3K-AKT pathway for cancer therapy. Rev Clin Exp Hematol 2003, 7 (2), 205-28.
27. Heerding, D. A.; Rhodes, N.; Leber, J. D.; Clark, T. J.; Keenan, R. M.; Lafrance, L. V.; Li, M.; Safonov, I. G.; Takata, D. T.; Venslavsky, J. W.; Yamashita, D. S.; Choudhry, A. E.; Copeland, R. A.; Lai, Z.; Schaber, M. D.; Tummino, P. J.; Strum, S. L.; Wood, E. R.; Duckett, D. R.; Eberwein, D.; Knick, V. B.; Lansing, T. J.; McConnell, R. T.; Zhang, S.; Minthorn, E. A.; Concha, N. O.; Warren, G. L.; Kumar, R., Identification of 4-(2-(4-amino-1,2,5-oxadiazol-3-yl)-1-ethyl-7-{[(3S)-3-piperidinylmethyl]oxy}-1H- imidazo[4,5-c]pyridin-4-yl)-2-methyl-3-butyn-2-ol (GSK690693), a novel inhibitor of AKT kinase. J Med Chem 2008, 51 (18), 5663-79.
28. Pal, S. K.; Reckamp, K.; Yu, H.; Figlin, R. A., Akt inhibitors in clinical development for the treatment of cancer. Expert Opin Investig Drugs 2010, 19 (11), 1355-66.
29. Blake, J. F.; Xu, R.; Bencsik, J. R.; Xiao, D.; Kallan, N. C.; Schlachter, S.; Mitchell, I. S.; Spencer, K. L.; Banka, A. L.; Wallace, E. M.; Gloor, S. L.; Martinson, M.; Woessner, R. D.; Vigers, G. P.; Brandhuber, B. J.; Liang, J.; Safina, B. S.; Li, J.; Zhang, B.; Chabot, C.; Do,
Chapter 4 | Characterization of chemical affinity probes
100
S.; Lee, L.; Oeh, J.; Sampath, D.; Lee, B. B.; Lin, K.; Liederer, B. M.; Skelton, N. J., Discovery and preclinical pharmacology of a selective ATP-competitive Akt inhibitor (GDC-0068) for the treatment of human tumors. J Med Chem 2012, 55 (18), 8110-27.
30. Kumar, R. In Discovery of an oral AKT kinase inhibitor., American Association for Cancer Research Annual Meeting, Washington, DC, April 6-10; Washington, DC, 2013.
31. Kondapaka, S. B.; Singh, S. S.; Dasmahapatra, G. P.; Sausville, E. A.; Roy, K. K., Perifosine, a novel alkylphospholipid, inhibits protein kinase B activation. Mol Cancer Ther 2003, 2 (11), 1093-103.
32. Yan, L. In MK-2206: a potent oral allosteric AKT inhibitor. , AACR Annual Meeting 2009.
33. Hauck, S. M.; Dietter, J.; Kramer, R. L.; Hofmaier, F.; Zipplies, J. K.; Amann, B.; Feuchtinger, A.; Deeg, C. A.; Ueffing, M., Deciphering membrane-associated molecular processes in target tissue of autoimmune uveitis by label-free quantitative mass spectrometry. Mol Cell Proteomics 2010, 9 (10), 2292-305.
34. Tai, A. W.; Salloum, S., The role of the phosphatidylinositol 4-kinase PI4KA in hepatitis C virus-induced host membrane rearrangement. PLoS One 2011, 6 (10), e26300.
35. Moghaddas Gholami, A.; Hahne, H.; Wu, Z.; Auer, F. J.; Meng, C.; Wilhelm, M.; Kuster, B., Global Proteome Analysis of the NCI-60 Cell Line Panel. Cell Rep 2013, 4 (3), 609-20.
36. Cheng, Y.; Prusoff, W. H., Relationship between the inhibition constant (K1) and the concentration of inhibitor which causes 50 per cent inhibition (I50) of an enzymatic reaction. Biochem Pharmacol 1973, 22 (23), 3099-108.
37. Lemeer, S.; Ruprecht, B.; Zorgiebel, C.; Kohl, K.; Kuster, B., Comparing immobilized kinase inhibitors and covalent ATP probes for proteomic profiling of kinase expression and drug selectivity. J Proteome Res 2013.
38. Levy, D. S.; Kahana, J. A.; Kumar, R., AKT inhibitor, GSK690693, induces growth inhibition and apoptosis in acute lymphoblastic leukemia cell lines. Blood 2009, 113 (8), 1723-9.
39. Rhodes, N.; Heerding, D. A.; Duckett, D. R.; Eberwein, D. J.; Knick, V. B.; Lansing, T. J.; McConnell, R. T.; Gilmer, T. M.; Zhang, S. Y.; Robell, K.; Kahana, J. A.; Geske, R. S.; Kleymenova, E. V.; Choudhry, A. E.; Lai, Z.; Leber, J. D.; Minthorn, E. A.; Strum, S. L.; Wood, E. R.; Huang, P. S.; Copeland, R. A.; Kumar, R., Characterization of an Akt kinase inhibitor with potent pharmacodynamic and antitumor activity. Cancer Res 2008, 68 (7), 2366-74.
40. Altomare, D. A.; Zhang, L.; Deng, J.; Di Cristofano, A.; Klein-Szanto, A. J.; Kumar, R.; Testa, J. R., GSK690693 delays tumor onset and progression in genetically defined mouse models expressing activated Akt. Clin Cancer Res 2010, 16 (2), 486-96.
41. Mallick, P.; Kuster, B., Proteomics: a pragmatic perspective. Nat Biotechnol 2010, 28 (7), 695-709.
42. Carter, C. A.; Kane, C. J., Therapeutic potential of natural compounds that regulate the activity of protein kinase C. Curr Med Chem 2004, 11 (21), 2883-902.
43. Hofmann, J., Protein kinase C isozymes as potential targets for anticancer therapy. Curr Cancer Drug Targets 2004, 4 (2), 125-46.
44. Teicher, B. A., Protein kinase C as a therapeutic target. Clin Cancer Res 2006, 12 (18), 5336-45.
45. Riento, K.; Ridley, A. J., Rocks: multifunctional kinases in cell behaviour. Nat Rev Mol Cell
Characterization of chemical affinity probes | Chapter 4
101
Biol 2003, 4 (6), 446-56.
46. Dummler, B.; Ohshiro, K.; Kumar, R.; Field, J., Pak protein kinases and their role in cancer. Cancer Metastasis Rev 2009, 28 (1-2), 51-63.
47. Heikkila, T.; Wheatley, E.; Crighton, D.; Schroder, E.; Boakes, A.; Kaye, S. J.; Mezna, M.; Pang, L.; Rushbrooke, M.; Turnbull, A.; Olson, M. F., Co-crystal structures of inhibitors with MRCKbeta, a key regulator of tumor cell invasion. PLoS One 2011, 6 (9), e24825.
48. Piazza, F.; Manni, S.; Semenzato, G., Novel players in multiple myeloma pathogenesis: role of protein kinases CK2 and GSK3. Leuk Res 2013, 37 (2), 221-7.
49. Kim, H. M.; Kim, C. S.; Lee, J. H.; Jang, S. J.; Hwang, J. J.; Ro, S.; Choi, J., CG0009, a Novel Glycogen Synthase Kinase 3 Inhibitor, Induces Cell Death through Cyclin D1 Depletion in Breast Cancer Cells. PLoS One 2013, 8 (4), e60383.
50. Crouthamel, M. C.; Kahana, J. A.; Korenchuk, S.; Zhang, S. Y.; Sundaresan, G.; Eberwein, D. J.; Brown, K. K.; Kumar, R., Mechanism and management of AKT inhibitor-induced hyperglycemia. Clin Cancer Res 2009, 15 (1), 217-25.
51. Assie, G., One single signaling pathway for so many different biological functions: lessons from the cyclic adenosine monophosphate/protein kinase A pathway-related diseases. J Clin Endocrinol Metab 2012, 97 (12), 4355-7.
52. Pearce, L. R.; Komander, D.; Alessi, D. R., The nuts and bolts of AGC protein kinases. Nat Rev Mol Cell Biol 2010, 11 (1), 9-22.
53. Hofmann, F., The biology of cyclic GMP-dependent protein kinases. J Biol Chem 2005, 280 (1), 1-4.
54. Lincoln, T. M.; Dey, N.; Sellak, H., Invited review: cGMP-dependent protein kinase signaling mechanisms in smooth muscle: from the regulation of tone to gene expression. J Appl Physiol 2001, 91 (3), 1421-30.
55. Lohmann, S. M.; Vaandrager, A. B.; Smolenski, A.; Walter, U.; De Jonge, H. R., Distinct and specific functions of cGMP-dependent protein kinases. Trends Biochem Sci 1997, 22 (8), 307-12.
56. Orstavik, S.; Natarajan, V.; Tasken, K.; Jahnsen, T.; Sandberg, M., Characterization of the human gene encoding the type I alpha and type I beta cGMP-dependent protein kinase (PRKG1). Genomics 1997, 42 (2), 311-8.
57. Hirai, H.; Sootome, H.; Nakatsuru, Y.; Miyama, K.; Taguchi, S.; Tsujioka, K.; Ueno, Y.; Hatch, H.; Majumder, P. K.; Pan, B. S.; Kotani, H., MK-2206, an allosteric Akt inhibitor, enhances antitumor efficacy by standard chemotherapeutic agents or molecular targeted drugs in vitro and in vivo. Mol Cancer Ther 2010, 9 (7), 1956-67.
58. Dhillon, A. S.; Hagan, S.; Rath, O.; Kolch, W., MAP kinase signalling pathways in cancer. Oncogene 2007, 26 (22), 3279-90.
59. Cossa, G.; Gatti, L.; Cassinelli, G.; Lanzi, C.; Zaffaroni, N.; Perego, P., Modulation of sensitivity to antitumor agents by targeting the MAPK survival pathway. Curr Pharm Des 2013, 19 (5), 883-94.
60. Kohno, M.; Tanimura, S.; Ozaki, K., Targeting the extracellular signal-regulated kinase pathway in cancer therapy. Biol Pharm Bull 2011, 34 (12), 1781-4.
61. Sebolt-Leopold, J. S.; Herrera, R., Targeting the mitogen-activated protein kinase cascade to treat cancer. Nat Rev Cancer 2004, 4 (12), 937-47.
Chapter 4 | Characterization of chemical affinity probes
102
62. Elrod, H. A.; Lin, Y. D.; Yue, P.; Wang, X.; Lonial, S.; Khuri, F. R.; Sun, S. Y., The alkylphospholipid perifosine induces apoptosis of human lung cancer cells requiring inhibition of Akt and activation of the extrinsic apoptotic pathway. Mol Cancer Ther 2007, 6 (7), 2029-38.
63. Papa, V.; Tazzari, P. L.; Chiarini, F.; Cappellini, A.; Ricci, F.; Billi, A. M.; Evangelisti, C.; Ottaviani, E.; Martinelli, G.; Testoni, N.; McCubrey, J. A.; Martelli, A. M., Proapoptotic activity and chemosensitizing effect of the novel Akt inhibitor perifosine in acute myelogenous leukemia cells. Leukemia 2008, 22 (1), 147-60.
64. Wang, F. Z.; Fei, H. R.; Li, X. Q.; Shi, R.; Wang de, C., Perifosine as potential anti-cancer agent inhibits proliferation, migration, and tube formation of human umbilical vein endothelial cells. Mol Cell Biochem 2012, 368 (1-2), 1-8.
65. Hideshima, T.; Catley, L.; Yasui, H.; Ishitsuka, K.; Raje, N.; Mitsiades, C.; Podar, K.; Munshi, N. C.; Chauhan, D.; Richardson, P. G.; Anderson, K. C., Perifosine, an oral bioactive novel alkylphospholipid, inhibits Akt and induces in vitro and in vivo cytotoxicity in human multiple myeloma cells. Blood 2006, 107 (10), 4053-62.
66. Rahmani, M.; Reese, E.; Dai, Y.; Bauer, C.; Payne, S. G.; Dent, P.; Spiegel, S.; Grant, S., Coadministration of histone deacetylase inhibitors and perifosine synergistically induces apoptosis in human leukemia cells through Akt and ERK1/2 inactivation and the generation of ceramide and reactive oxygen species. Cancer Res 2005, 65 (6), 2422-32.
67. Gills, J. J.; Castillo, S. S.; Zhang, C.; Petukhov, P. A.; Memmott, R. M.; Hollingshead, M.; Warfel, N.; Han, J.; Kozikowski, A. P.; Dennis, P. A., Phosphatidylinositol ether lipid analogues that inhibit AKT also independently activate the stress kinase, p38alpha, through MKK3/6-independent and -dependent mechanisms. J Biol Chem 2007, 282 (37), 27020-9.
68. Tzarum, N.; Eisenberg-Domovich, Y.; Gills, J. J.; Dennis, P. A.; Livnah, O., Lipid molecules induce p38alpha activation via a novel molecular switch. J Mol Biol 2012, 424 (5), 339-53.
69. Bendell, J. C.; Nemunaitis, J.; Vukelja, S. J.; Hagenstad, C.; Campos, L. T.; Hermann, R. C.; Sportelli, P.; Gardner, L.; Richards, D. A., Randomized placebo-controlled phase II trial of perifosine plus capecitabine as second- or third-line therapy in patients with metastatic colorectal cancer. J Clin Oncol 2011, 29 (33), 4394-400.
70. Fu, S.; Hennessy, B. T.; Ng, C. S.; Ju, Z.; Coombes, K. R.; Wolf, J. K.; Sood, A. K.; Levenback, C. F.; Coleman, R. L.; Kavanagh, J. J.; Gershenson, D. M.; Markman, M.; Dice, K.; Howard, A.; Li, J.; Li, Y.; Stemke-Hale, K.; Dyer, M.; Atkinson, E.; Jackson, E.; Kundra, V.; Kurzrock, R.; Bast, R. C., Jr.; Mills, G. B., Perifosine plus docetaxel in patients with platinum and taxane resistant or refractory high-grade epithelial ovarian cancer. Gynecol Oncol 2012, 126 (1), 47-53.
71. Ghobrial, I. M.; Roccaro, A.; Hong, F.; Weller, E.; Rubin, N.; Leduc, R.; Rourke, M.; Chuma, S.; Sacco, A.; Jia, X.; Azab, F.; Azab, A. K.; Rodig, S.; Warren, D.; Harris, B.; Varticovski, L.; Sportelli, P.; Leleu, X.; Anderson, K. C.; Richardson, P. G., Clinical and translational studies of a phase II trial of the novel oral Akt inhibitor perifosine in relapsed or relapsed/refractory Waldenstrom's macroglobulinemia. Clin Cancer Res 2010, 16 (3), 1033-41.
72. Jakubowiak, A. J.; Richardson, P. G.; Zimmerman, T.; Alsina, M.; Kaufman, J. L.; Kandarpa, M.; Kraftson, S.; Ross, C. W.; Harvey, C.; Hideshima, T.; Sportelli, P.; Poradosu, E.; Gardner, L.; Giusti, K.; Anderson, K. C., Perifosine plus lenalidomide and dexamethasone in relapsed and relapsed/refractory multiple myeloma: a Phase I Multiple Myeloma Research Consortium study. Br J Haematol 2012, 158 (4), 472-80.
Characterization of chemical affinity probes | Chapter 4
103
73. Richardson, P. G.; Wolf, J.; Jakubowiak, A.; Zonder, J.; Lonial, S.; Irwin, D.; Densmore, J.; Krishnan, A.; Raje, N.; Bar, M.; Martin, T.; Schlossman, R.; Ghobrial, I. M.; Munshi, N.; Laubach, J.; Allerton, J.; Hideshima, T.; Colson, K.; Poradosu, E.; Gardner, L.; Sportelli, P.; Anderson, K. C., Perifosine plus bortezomib and dexamethasone in patients with relapsed/refractory multiple myeloma previously treated with bortezomib: results of a multicenter phase I/II trial. J Clin Oncol 2011, 29 (32), 4243-9.
74. Isabelle, M.; Moreel, X.; Gagne, J. P.; Rouleau, M.; Ethier, C.; Gagne, P.; Hendzel, M. J.; Poirier, G. G., Investigation of PARP-1, PARP-2, and PARG interactomes by affinity-purification mass spectrometry. Proteome Sci 2010, 8, 22.
75. Kleine, H.; Poreba, E.; Lesniewicz, K.; Hassa, P. O.; Hottiger, M. O.; Litchfield, D. W.; Shilton, B. H.; Luscher, B., Substrate-assisted catalysis by PARP10 limits its activity to mono-ADP-ribosylation. Mol Cell 2008, 32 (1), 57-69.
76. Haince, J. F.; Rouleau, M.; Hendzel, M. J.; Masson, J. Y.; Poirier, G. G., Targeting poly(ADP-ribosyl)ation: a promising approach in cancer therapy. Trends Mol Med 2005, 11 (10), 456-63.
77. Lecha, M.; Puy, H.; Deybach, J. C., Erythropoietic protoporphyria. Orphanet J Rare Dis 2009, 4, 19.
78. McAllister, F. E.; Niepel, M.; Haas, W.; Huttlin, E.; Sorger, P. K.; Gygi, S. P., Mass spectrometry based method to increase throughput for kinome analyses using ATP probes. Anal Chem 2013, 85 (9), 4666-74.
79. Schirle, M.; Bantscheff, M.; Kuster, B., Mass spectrometry-based proteomics in preclinical drug discovery. Chem Biol 2012, 19 (1), 72-84.
80. Zhang, L.; Holmes, I. P.; Hochgrafe, F.; Walker, S. R.; Ali, N. A.; Humphrey, E. S.; Wu, J.; de Silva, M.; Kersten, W. J.; Connor, T.; Falk, H.; Allan, L.; Street, I. P.; Bentley, J. D.; Pilling, P. A.; Monahan, B. J.; Peat, T. S.; Daly, R. J., Characterization of the novel broad-spectrum kinase inhibitor CTx-0294885 as an affinity reagent for mass spectrometry-based kinome profiling. J Proteome Res 2013.

Chapter 4 | Characterization of chemical affinity probes
104

Chapter 5
Chemical and phosphoproteomic characterization of
triciribine action in pancreatic cancer

Chemical and phosphoproteomic characterization of triciribine action | Chapter 5
107
Introduction
Pancreatic ductal adenocarcinoma (PDAC) is a dismal disease with a median survival rate below 6 months and an overall 5 year survival rate below 5%. Risk factors for pancreatic cancer are mainly increased age, family history, smoking and diabetes [1, 2]. The bad prognosis is due to aggressive malignancy, lack of effective therapies and delayed diagnosis. Although surgery offers the only effective cure for pancreatic cancer, patients relapse in over 80% of cases [3]. These facts reflect the aggressive nature of this disease and the insufficiency of current therapy. To improve the prognosis, it is important to better understand the molecular basis of the disease.
Regarding morphological characteristics, PDAC gradually evolves through precursor lesions, the so-called intraepithelial neoplasias (PanIN), stages I to III to invasive PDAC [4]. The genetic hallmark of PDAC is mutation in the proto-oncogene Kras, which is one of the earliest genetic events seen in human PanIN progression [5]. Besides Kras, mutations in the tumor suppressor genes CDKN2A/p16, TP53/p53 and SMAD4/DPC4 add to the progression of PDAC [6]. While the contribution of the latter mutations is well understood, Kras-dependent effector pathways in PDAC signaling are still poorly described [4]. Kras belongs to the small GTPase family and transmits growth factor induced signaling. Activated Kras engages multiple effector pathways, notably the Raf/MEK/ERK, the PI3K/AKT and RalGDS pathways, which control proliferation and survival [7]. In PDAC, the PI3K/AKT pathway is activated in approximately 60% of cases and regulates chemotherapeutic and apoptotic resistance, proliferation and angiogenesis of cells [8, 9]. Although this suggests the importance of the pathway in PDAC, it is not clear, to what extend the effector and downstream pathways contribute to PDAC carcinogenesis.
The PI3K/AKT pathway is uniformly activated in human PDAC and mouse models of Kras-driven pancreatic cancer [7, 10] and has been introduced as an attractive target for cancer therapy [11-13]. Noteworthy, AKT phosphorylation is inversely correlated with survival of PDAC patients [7, 14].
Due to the frequent activation of the PI3K/AKT pathway, AKT inhibitors seem to be promising therapeutic targets and several drugs targeting AKT have been developed by now [15-19]. One of them is the small molecule inhibitor triciribine, which inhibits all three isoforms of AKT [20]. Triciribine (TCN) is a tricyclic nucleoside, which, once inside cells, gets converted to its active metabolite triciribine monophosphate (TCN-P) by the adenosine kinase (ADK) [21]. TCN-P is able to bind the pleckstrin homology (PH) domain of AKT. Activation of AKT is thereby inhibited in an allosteric manner, since AKT translocation to the plasma membrane via the PH domain is a prerequisite for phosphorylation of AKT [22]. Triciribine has been subject of various clinical trials and is currently in phase I studies for metastatic breast cancer and ovarian cancer. However the efficiency of AKT inhibitors in pancreatic cancer has not yet been evaluated.
Proteomics approaches have shown to be powerful tools in cancer research. In pancreatic cancer studies, mass spectrometry-based proteomics was used for the proteomic profiling of diseased tissue, juice or cell lines and the identification of several promising biomarkers [11, 23-
Chapter 5 | Chemical and phosphoproteomic characterization of triciribine action
108
28]. Quantitative proteomics methods are increasingly used to address signaling in a systematic fashion. Recently developed chemical proteomics screening methods allow the examination of many kinase mediated signaling pathways in parallel [29]. The Kinobead approach allows the purification of several hundred kinases and other ATP-binding proteins from cell lines or tissues (see also chapter 4) [29, 30]. In combination with quantitative mass spectrometry, it enables the identification and relative quantification of the purified proteins across many biological samples. Although initially developed to profile the selectivity of small molecule kinase inhibitors, the Kinobead approach can be used to profile the expression of kinases in cells or tissues as well as to examine the effect of kinase inhibitors in cancer signaling in vivo.
In the following study, the potency of triciribine in eight murine cell lines of Kras-driven pancreatic cancer with different growth characteristics was evaluated. Triciribine-induced growth inhibition was accessed to evaluate the impact of AKT signaling on cell survival and progression in the individual pancreatic cell lines. In addition, a systematic selectivity profile of the active metabolite of the inhibitor, TCN-P, was determined in vivo and identified numerous off-targets. Moreover, chemical proteomic and phosphoproteomic approaches combined with quantitative mass spectrometry was applied to understand the effect of triciribine on signaling networks of pancreatic cancer cells differing in response to the drug. The results demonstrate a clear dependency on the AKT-mTOR signaling pathway of drug sensitive cells, whereas in more resistant pancreatic cells, increased Ras-Erk1/2 signaling is observed.
Chemical and phosphoproteomic characterization of triciribine action | Chapter 5
109
Material and Methods
Sample preparation
Primary dispersed murine pancreatic cancer cells were established from genetically engineered KrasG12D-based mouse models of PDAC and kindly provided by the group of Prof. Dr. Schneider (II. Medizinische Klinik und Poliklinik, Klinikum rechts der Isar, Technische Universität München).
All eight cell lines were cultured in Dulbecco’s modified Eagle’s medium (DMEM) supplemented with 10% fetal bovine serum (FBS). Cells were cultured in humidified air supplemented with 5% CO2 at 37 °C. Cells were washed with cold phosphate buffered saline (PBS) and harvested by lysis using 50 mM Tris/HCl pH 7.5, 5% Glycerol, 1.5 mM MgCl2, 150 mM NaCl, 0.8% NP-40, 1 mM dithiothreitol and 25 mM NaF with freshly added protease inhibitors and phosphatase inhibitors (5x phosphatase inhibitor cocktail1, Sigma-Aldrich, Munich, Germany, 5x phosphatase inhibitor cocktail 2, Sigma-Aldrich, Munich, Germany, 1 mM Na3VO4 and 20 nM Calyculin A, LC Laboratories, Woburn, MA, USA). Protein extracts were clarified by ultracentrifugation for 1 h at 145,000 x g at 4 °C and protein concentration was determined by the Bradford method.
Kinase inhibitor treatment
The AKT inhibitor triciribine (ENZO Life Science, Lörrach, Germany) was dissolved as 10 mM stock solution in DMSO and stored at -20 °C. For the cell viability assay, PDAC cells were seeded in 96-well plates at 2 x 10³ cells/well and grown in 175 µL DMEM supplemented with 10% (v/v) FBS for 12 h prior to experimental treatment. Next, 50 µL of fresh medium
supplemented with different concentrations of kinase inhibitor (10 nM, 50 nM, 100 nM, 1 µM, 5 µM and 25 µM in 0,1% DMSO; control cells were treated with 0,1% DMSO as vehicle) were added to the cells. Cell viability was monitored after 96 h of treatment using the XTT cell proliferation kit II (Roche Applied Science) according to manufacturer’s protocol.
For the in vivo selectivity profile, 1.8 x 10⁶ cells of cell line 7662 were seeded in 150mm dishes and grown in 20mL medium. Upon 80-90% confluence, cells were treated with 100μl medium supplemented with different concentrations of triciribine (2.5 nM, 25 nM, 250 nM, 2.5 μM in 0.1% DMSO; control cells were treated with 0.1% DMSO as vehicle) and incubated for 4h. After that cells were lyzed as described in the section before.
For comparison of sensitive and resistant cell lines upon drug treatment, 7662 and 53631 cells were seeded in 150mm dishes and grown in 20 mL medium to 80-90% confluence. Next, cells were treated for 1 h with 1 µM inhibitor in 0.1% DMSO or 0.1% DMSO as vehicle control. For kinase enrichment, cells were lysed as described in the section before. For phosphopeptide enrichment, cells were washed with cold phosphate buffered saline (PBS) and harvested in lysis buffer (50 mM TEAB pH 7.5, 8 M urea, 5 mM NaH2PO4 and 25 mM NaF with freshly added
Chapter 5 | Chemical and phosphoproteomic characterization of triciribine action
110
protease inhibitors and phosphatase inhibitors (5x phosphatase inhibitor cocktail1, Sigma-Aldrich, Munich, Germany, 5x phosphatase inhibitor cocktail 2, Sigma-Aldrich, Munich, Germany, 1 mM Na3VO4 and 20 nM Calyculin A, LC Laboratories, Woburn, MA, USA) and subjected to ultrasonication. Protein extracts were clarified by centrifugation for 1 h at 20,000 x g at 4 °C and protein concentration was determined by the Bradford method.
Immunoblot Analysis
Anti-AKT, p-AKT and -actin antibodies were purchased from Cell Signaling Technology (provided by New England Biolabs Inc., Ipswich, MA). For immunoblot analysis, cell lysates from in vivo triciribine selectivity profile experiments were used. 50 µg of lysate was mixed with an equal volume of 2 x Nu-PAGE LDS sample buffer containing 10 mM dithiothreitol and boiled for 5 min at 95 °C. Proteins were subsequently separated by 4–12% NuPAGE gel and transferred onto to polyvinylidene difluoride membranes (Invitrogen, Darmstadt, Germany). Membranes were blocked for 1 h in blocking solution (2% bovine serum albumin in 1 x Tris Buffered Saline, TBS, 20 mM Tris-HCl, pH 7.4, 150 mM NaCl, and 0.1% Tween-20) at room temperature and probed overnight at 4 °C with the respective primary antibody. Immunoreactivity was detected using IRDye conjugated secondary antibody (LI-COR, Nebraska) and visualized by Odyssey imaging system (LI-COR).
Affinity purification
Kinobead pulldowns were performed as described previously [29]. Briefly, lysates of a cell mix were diluted with equal volumes of 1x compound pulldown (CP) buffer (50 mM Tris/HCl pH 7.5, 5% glycerol, 1.5 mM MgCl2, 150 mM NaCl, 25 mM NaF, 1 mM dithiothreitol and freshly added protease inhibitors and phosphatase inhibitors (5x phosphatase inhibitor cocktail1, Sigma-Aldrich, Munich, Germany, 5x phosphatase inhibitor cocktail 2, Sigma-Aldrich, Munich, Germany, 1 mM sodium ortho-vanadate and 20 nM Calyculin A, LC Laboratories, Woburn, MA, USA)). If necessary, lysates were further diluted to a final protein concentration of 5 mg/ml using 1x CP buffer supplemented with 0.4% NP-40.
Kinobeads (100 µL settles beads) were incubated with lysates (total of 5 mg of protein) for 1 h at 4°C. Subsequently, beads were washed with 1x CP buffer and collected by centrifugation. Bound proteins were eluted with 2x NuPAGE LDS Sample Buffer (Invitrogen, Darmstadt, Germany) and eluates were reduced and alkylated by 50 mM dithiothreitol and 55 mM iodoacetamide. Samples were then run into a 4–12% NuPAGE gel (Invitrogen, Darmstadt, Germany) for about 0.5 cm to concentrate the sample prior to in-gel tryptic digestion. In-gel trypsin digestion was performed according to standard procedures.
Dimethyl labeling for phospho-analysis
For each condition 2 mg of protein was reduced and alkylated using 50 mM dithiothreitol and 55 mM iodoacetamide. Next, the initial digestion was performed by adding Lys-C (Wako Pure Chemical Industries, Ltd., Osaka, Japan) at an enzyme/ protein ratio of 1:100 and incubation for
Chemical and phosphoproteomic characterization of triciribine action | Chapter 5
111
4 h at 37 °C. The sample was diluted 4-fold to a final urea concentration of 2 M using 50 mM TEAB buffer. The final digestion was performed by adding trypsin (sequencing grade; Promega, Madison, WI) at an enzyme/protein ratio of 1:100 and incubation overnight at 37 °C. Formic acid (FA) was added to a final concentration of 5%, after which the peptide mixtures were desalted using Sep-Pak Vac C18 cartridges (50 mg; Waters, Eschborn, Germany). Subsequently, on-column stable isotope dimethyl labeling was performed as described previously [31]. Briefly, 5 mL of labeling solution (11.3 mM NaH2PO4, 38.7 mM Na2PO4, 9 mM NaBH3CN and 4% H-formaldehyde for light label or 4% D-formaldehyde for intermediate label, respectively) was added to the sample on column. The peptides from the triciribine treated sample were labeled with light dimethyl labels and those from the untreated control sample with intermediate dimethyl labels. Samples were washed 4 mL 0.1% FA and eluted using 1 mL 0.1% FA in 60% acetonitrile. Finally, corresponding eluates were mixed in a 1:1 ratio, dried in vacuo and stored at -20 °C. Labeling incorporation and mixing accuracy were assessed by LC-MS/MS.
Phosphopeptide enrichment
Online Fe3+-IMAC was used as first phosphopeptide enrichment step. The mixture of dimethyl labeled peptides with 1:1 ratio were dissolved in solvent A (0.07% TFA in 30% acetonitrile, pH 2.1) and loaded onto a ProPac IMAC 10 column (Thermo Fisher Scientific Inc., Waltham, USA) using an ÄKTA explorer FPLC system (Amersham Pharmacia, Little Chalfont, UK) at a flow rate of 100 µL/min for 10 min. Separation of peptides was performed using a nonlinear 80 min gradient at a flow rate of 300 µL: from 0 to 15 min, 100% solvent A; from 15 to 75 min, to 45% solvent B (0.5% NH4OH, pH 11.6); from 75 to 80 min, to 100% solvent B. The column was subsequently washed for 5 min with 100% solvent B and finally equilibrated with 100% solvent A for 5 min. Peptide elution was monitored by UV absorption at 216 and 280 nm. The flow-through and peak containing phosphopeptides were collected separately and dried in vacuo and stored at -20 °C.
For subsequent phosphopeptide enrichment from the IMAC flow-through sample, Ti4+-IMAC was employed. Ti4+-IMAC material was prepared and used essentially as previously described previously [32, 33]. 25 mg prepared Ti4+-IMAC beads were loaded onto Sep-Pak Vac C18 cartridges (50 mg; Waters, Eschborn, Germany). The enrichment procedure was as follows: the Ti4+-IMAC material was pre-equilibrated five times with 1 mL of loading buffer (80% ACN, 6% TFA). Next, dried IMAC flow-through sample was resuspended in 1 mL of loading buffer and loaded onto the equilibrated column. Then the Ti4+-IMAC material was washed with ten times 1 mL washing buffer A (50% ACN, 0.5% TFA, 200 mM NaCl) and subsequently with ten times 1 mL washing buffer B (50% ACN, 0.1% TFA). Bound peptides were first eluted by 800 µL of 10% ammonia in water. Finally, the remaining peptides were eluted with 800 µL of 2% FA in 80% acetonitrile into a second tube. The collected eluates were dried in vacuo and stored at -20 °C for LC-MS/MS analysis.
Chapter 5 | Chemical and phosphoproteomic characterization of triciribine action
112
LC-MS/MS measurements
The kinase enriched peptide samples were analyzed on an Orbitrap Elite mass spectrometer (Thermo Scientific, Bremen, Germany), phospho-proteome analysis was performed on an LTQ-Orbitrap Velos (Thermo Scientific, Bremen, Germany).
Nanoflow LC-MS/MS was performed by coupling an Eksigent nanoLC-Ultra 1D+ (Eksigent, Dublin, CA) to an Orbitrap Elite. Peptides were delivered to a trap column (100 μm×β cm, packed in-house with Reprosil-Pur C18-AQ 5 µm resin, Dr. Maisch, Ammerbuch, Germany) at a flow rate of 5 µL/min in 100% solvent A (0.1% formic acid in HPLC grade water). After 10 min of loading and washing, peptides were transferred to an analytical column (75µm×40 cm, packed in-house with Reprosil-Pur C18-GOLD, 3 µm resin, Dr. Maisch, Ammerbuch, Germany) and separated using a 210 min gradient from 4% to 32% of solvent B (0.1% formic acid, 5% DMSO in acetonitrile; solvent A: 0.1% formic acid, 5% DMSO in water) at 300 nL/minute flow rate. The Orbitrap Elite was operated in data dependent mode, automatically switching between MS and MS2. Full scan MS spectra were acquired in the Orbitrap at 30,000 (m/z 400) resolution after accumulation to a target value of 1,000,000. Internal calibration was performed using a DMSO derivate at m/z 401.92272. Tandem mass spectra were generated for up to 15 peptide precursors in the orbitrap for fragmentation using higher energy collision induced dissociation (HCD) at normalized collision energy of 30% and a resolution of 15,000 with a target value of 20,000 charges after accumulation for max 100 ms.
Measurements using the LTQ-Orbitrap Velos employed equal LC conditions as described and similar data acquisition parameters. Sample loading and washing was performed for 12 min at a flow rate of 2 µL/min, followed by 13 min at a flow rate of 5 µL/min. Peptides were separated using a 210 min gradient from 3% to 27% of solvent A. Full scan MS spectra were acquired in the Orbitrap at 30,000 resolution. Tandem mass spectra were generated for up to 10 peptide precursors for fragmentation using higher energy collision induced dissociation (HCD) at normalized collision energy of 35% and a resolution of 7,500 with a target value of 40,000 charges after accumulation for max 250 ms.
Peptide and protein identification and quantification
The raw mass spectral data were processed using the MaxQuant software (version 1.2.7.3) for
peak detection and quantification [34]. MS/MS spectra were searched against the IPI human database (v3.68, 87,061 sequences, supplemented with 262 common contaminants) using the Andromeda search engine [35].
Search parameters for kinase enrichment data were the following: full tryptic specificity, up to two missed cleavage sites, carbamidomethylation of cystein residues was set as a fixed modification and N-terminal protein acetylation, methionine oxidation and phosphorylation of serine, threonine, and tyrosine residues as variable modifications. Mass spectra were re-calibrated within MaxQuant (first search 20 ppm precursor tolerance) and subsequently re-searched with a mass tolerance of 6 ppm, fragment ion mass tolerance was set to 20 ppm.
Search results were filtered to a maximum false discovery rate (FDR) of 0.01 for proteins and
Chemical and phosphoproteomic characterization of triciribine action | Chapter 5
113
peptides and a peptide length of at least six amino acids was required.
Search parameters for phosphopeptide enrichment data were similar to parameters for kinase enrichment data with the following exceptions: up to four missed cleavage sites, dimethylation and dimethylation:2 H(4) of lysines and protein N-termini was set as labels for quantification. Mass spectra were re-calibrated within MaxQuant (first search 20 ppm precursor tolerance) and subsequently re-searched with a mass tolerance of 6 ppm, fragment ion mass tolerance was set
to 20 ppm. Search results were filtered to a maximum false discovery rate (FDR) of 0.05 for proteins and peptides and a peptide length of at least six amino acids was required.
Statistical analysis
Statistical analysis of quantified proteins was performed using Microsoft Excel and Multiple Experiment Viewer (MeV, version 4.5.1). Differential kinase expression between the different cell lines was assessed based on the iBAQ normalized intensities provided by MaxQuant analysis with adjusted one-way ANOVA. P-values were adjusted for multiple testing to control the false discover rate at 5%. Differences in kinase expression and phosphorylation status between “treated” and “control” samples were tested with Student’s t-statistic via the empirical Bayesian statistics (p < 0.05).
Kinase motif analysis
The significantly enriched phosphorylation motifs set was extracted from the phosphopeptide data using the Motif-X algorithm [36]. All phosphorylated peptides with confidently identified phosphorylation sites and significant changes were used as the data set to extract significantly enriched phosphorylation motifs. The phosphopeptides were centered at the phosphorylated amino acid residues and aligned, and six positions upstream and downstream of the phosphorylation site were included. The IPImouse database was used as background data set. The occurrence threshold was set to a minimum of six peptides, and the significance threshold was set to 0.01. Sequence logos were generated with Weblogo [37] (available at http://weblogo.berkeley.edu).
Pathway and complex analysis
Pathway membership of the identified proteins were analyzed by the Ingenuity Pathway Analysis (IPA) tool (Ingenuity Systems, Redwood City, CA, USA) for their functional significance and in the context of biological association networks. To investigate effects of triciribine treatment of many macromolecular complexes, the list of significantly expressed proteins (p < 0.05) was analyzed using Comprehensive Resource of Mammalian protein complexes [38], a database of manually curated and validated mammalian protein complexes.
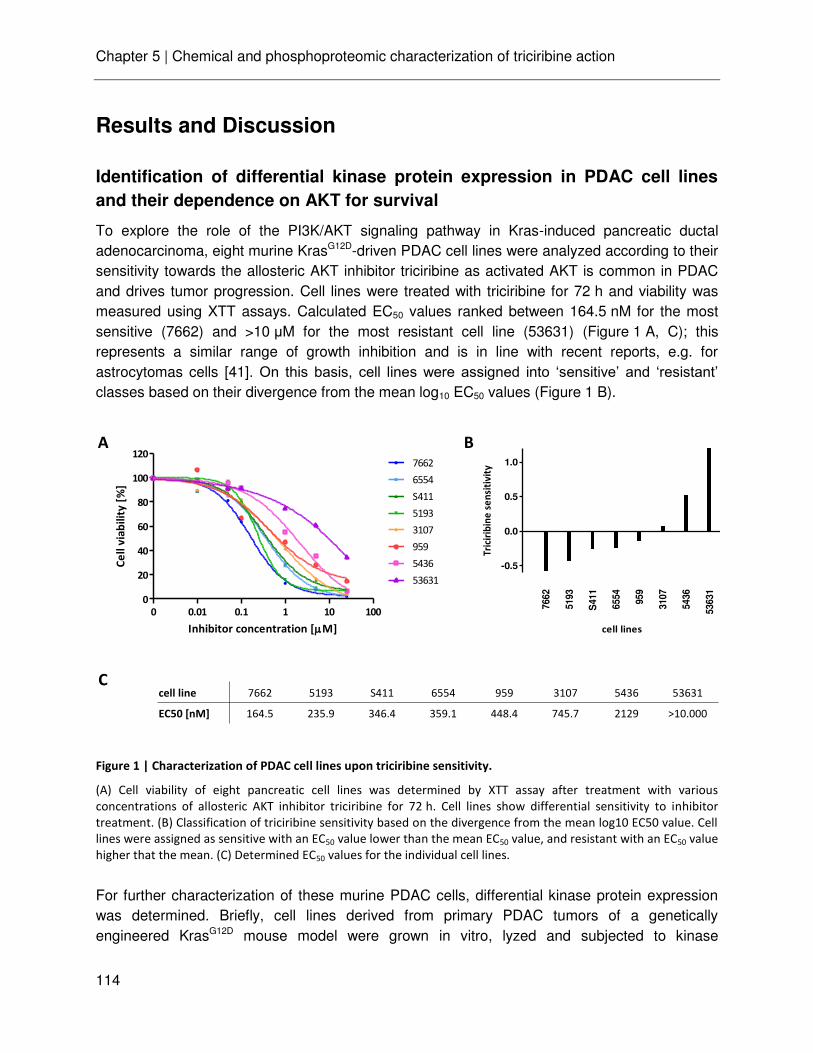
Chapter 5 | Chemical and phosphoproteomic characterization of triciribine action
114
Results and Discussion
Identification of differential kinase protein expression in PDAC cell lines
and their dependence on AKT for survival
To explore the role of the PI3K/AKT signaling pathway in Kras-induced pancreatic ductal adenocarcinoma, eight murine KrasG12D-driven PDAC cell lines were analyzed according to their sensitivity towards the allosteric AKT inhibitor triciribine as activated AKT is common in PDAC and drives tumor progression. Cell lines were treated with triciribine for 72 h and viability was measured using XTT assays. Calculated EC50 values ranked between 164.5 nM for the most sensitive (7662) and >10 μM for the most resistant cell line (53631) (Figure 1 A, C); this represents a similar range of growth inhibition and is in line with recent reports, e.g. for astrocytomas cells [41]. On this basis, cell lines were assigned into ‘sensitive’ and ‘resistant’ classes based on their divergence from the mean log10 EC50 values (Figure 1 B).
Figure 1 | Characterization of PDAC cell lines upon triciribine sensitivity.
(A) Cell viability of eight pancreatic cell lines was determined by XTT assay after treatment with various
concentrations of allosteric AKT inhibitor triciribine for 72 h. Cell lines show differential sensitivity to inhibitor
treatment. (B) Classification of triciribine sensitivity based on the divergence from the mean log10 EC50 value. Cell
lines were assigned as sensitive with an EC50 value lower than the mean EC50 value, and resistant with an EC50 value
higher that the mean. (C) Determined EC50 values for the individual cell lines.
For further characterization of these murine PDAC cells, differential kinase protein expression was determined. Briefly, cell lines derived from primary PDAC tumors of a genetically engineered KrasG12D mouse model were grown in vitro, lyzed and subjected to kinase
-0.5
0.0
0.5
1.0
7662
5193
S411
6554
959
3107
5436
53631
cell lines
Tric
irib
ine
se
nsi
tivi
ty
0
20
40
60
80
100
1207662
6554
S411
5193
3107
959
5436
53631
0 0.01 0.1 1 10 100
Inhibitor concentration [M]
Ce
ll v
iab
ilit
y [
%]
cell line 7662 5193 S411 6554 959 3107 5436 53631
EC50 [nM] 164.5 235.9 346.4 359.1 448.4 745.7 2129 >10.000
A B
C
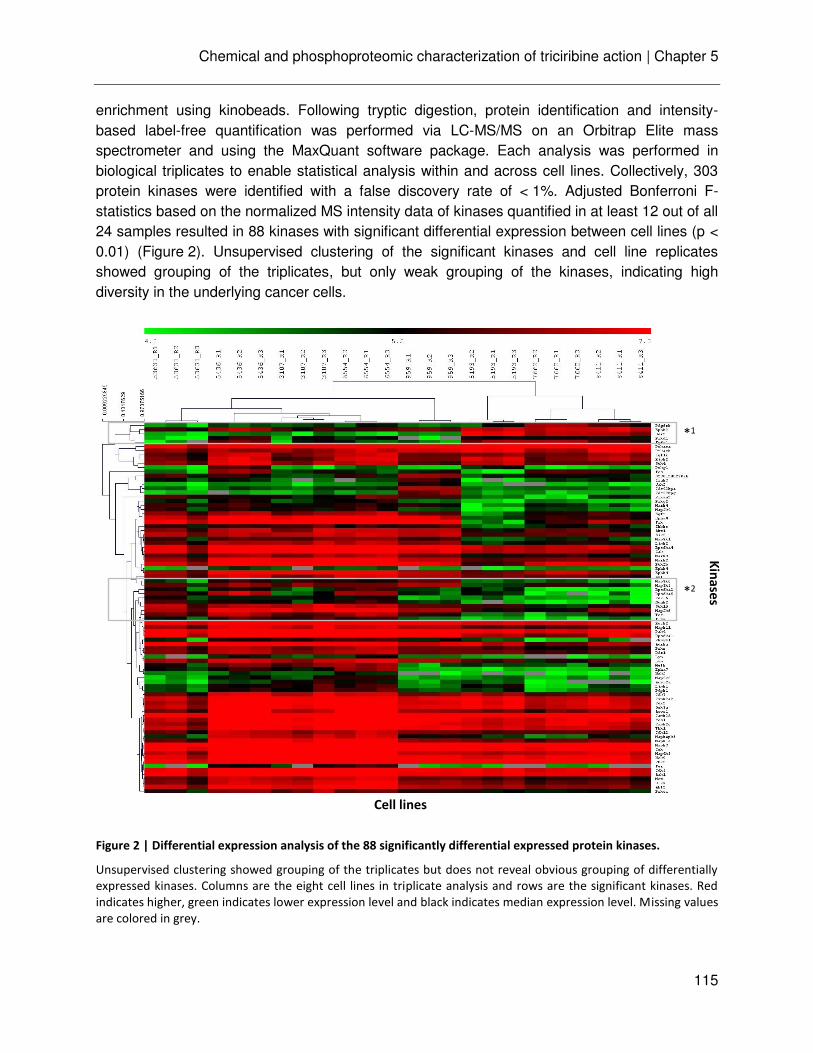
Chemical and phosphoproteomic characterization of triciribine action | Chapter 5
115
enrichment using kinobeads. Following tryptic digestion, protein identification and intensity-based label-free quantification was performed via LC-MS/MS on an Orbitrap Elite mass spectrometer and using the MaxQuant software package. Each analysis was performed in biological triplicates to enable statistical analysis within and across cell lines. Collectively, 303 protein kinases were identified with a false discovery rate of < 1%. Adjusted Bonferroni F-statistics based on the normalized MS intensity data of kinases quantified in at least 12 out of all 24 samples resulted in 88 kinases with significant differential expression between cell lines (p < 0.01) (Figure 2). Unsupervised clustering of the significant kinases and cell line replicates showed grouping of the triplicates, but only weak grouping of the kinases, indicating high diversity in the underlying cancer cells.
Figure 2 | Differential expression analysis of the 88 significantly differential expressed protein kinases.
Unsupervised clustering showed grouping of the triplicates but does not reveal obvious grouping of differentially
expressed kinases. Columns are the eight cell lines in triplicate analysis and rows are the significant kinases. Red
indicates higher, green indicates lower expression level and black indicates median expression level. Missing values
are colored in grey.
*1
*2
Kin
ase
s
Cell lines
Chapter 5 | Chemical and phosphoproteomic characterization of triciribine action
116
Interestingly, the expression analysis of the kinome profiles show a similar behaviour in grouping of the cell lines since the more resistance cell lines (53631, 5436, 31107, 6552) are in the same cluster as well as the sensitive lines (5139, 7662, S411) display a higher similarity. Two groups within the cluster analysis are of notice as their differential expression pattern correlates very well with the viability data (Figure 1). One group (*1) mainly contains receptor tyrosine kinases (PDGFRb, EphB2, DDR2, FGFR1) and is highly expressed in the sensitive cell lines. Tyrosine kinases have been shown to be overexpressed in pancreatic cancer and are associated with an aggressive tumor phenotype [42-46]. Especially the growth factor receptors, such as fibroblast growth factor receptor (FGFR) and platelet-derived growth factor receptor (PDGFR) are particularly interesting as they represent upstream targets of AKT and mediate PI3K/AKT signaling in pancreatic cancer [47, 48]. An increased level of these receptors may lead to aberrant activation of AKT signaling yielding in a higher sensitivity to triciribine. This is consistent with studies from Berndt et al. [22] that showed higher efficiency of triciribine in tumors expressing persistently phosphorylated AKT. The other group (*2) shows a higher expression level in the group of resistant cell lines. The group contains several MAP3 kinases and ribosomal protein S6 kinases (RSK) which are downstream signaling proteins of the Ras-Erk1/2 pathway that has shown to play a pivotal role in cancer cell migration and invasion and, hence, may provide an alternative AKT-independent signaling pathway in these cells reasonable for the resistance to AKT inhibition [49-52].
Kinase inhibitor selectivity profile of the AKT inhibitor triciribine
Triciribine (TCN) has shown to be an inhibitor of AKT phosphorylation by binding to the PH domain in vivo but does not inhibit AKT kinase activity per se [20, 22]. It is important to point out that triciribine, a tricyclic nucleotide, has to be phosphorylated in cell by the adenosine kinase to be transformed into its active metabolite TCN-P. The study of Yang et al. [20] has shown that triciribine inhibits potently proliferation and induces apoptosis in tumor models that contain hyper-phosphorylated AKT, but does not inhibit activation of upstream activators of AKT, such as PI3K and PDK1, or other members of the AGC family, suggesting that triciribine is a selective AKT activation inhibitor. Apart from that, not much is known about the selectivity of triciribine and potential direct off-targets. Therefore a selectivity screening by quantitative chemical proteomics using the kinobead technology [29] was performed with in vivo inhibitor treatment of the most sensitive PDAC cell line (7662) to identify possible (direct) off-targets of the active metabolite of triciribine. Briefly, cells were treated for 4h with increasing concentrations of triciribine. After cell lysis, kinases were enriched using kinobeads. Following digestion and analysis by LC-MS/MS, proteins identification and label-free quantification was performed by the Progenesis software and Mascot search engine. As expected, no reduction in abundance of AKT was detected in the kinobead assay, but dose-dependent inhibition of phosphorylated AKT could be detected via immunoblot analysis (Figure 3 A, B) with a determined IC50 value of 24 nM, which is about five times lower compared to a previously reported value of 130 nM determined from studies in astrocytoma cells [41], and almost 30 fold lower than the described KD value of 690 nM for binding of AKT to the PH domain [22].

Chemical and phosphoproteomic characterization of triciribine action | Chapter 5
117
Figure 3| Competition binding curves for targets of the allosteric AKT inhibitors triciribine.
Selectivity profile of triciribine was assessed in vivo by treatment of 7662 cells with increasing concentrations of
inhibitor (range of 2.5 nM to 25 μM; 0.1% DMSO as vehicle control). (A, B) Western blot analysis and of the
primary target AKT. Triciribine treatment does not affect the expression level of AKT, whereas the phospho-AKT
level decreases in a dose-dependent manner. (C-E) Binding curves of potential protein kinase targets.
Apart from AKT, the profile of triciribine revealed nine kinases with dose-dependent inhibition in response to drug treatment (Figure 3 C-E). The determined IC50 values rank between 28.6 nM and 406 nM. As none of the identified targets contain a PH domain, they are likely to be off-targets that bind the activated inhibitor in an ATP-competitive manner. The potently inhibited bone morphogenic protein receptors (BMPR1a and BMPR2) play an important role in oocytosis but have also been linked to cell growth and metastasis in prostate cancer where these cells frequently have reduced levels of BMPRs [53]. Therefore, one could speculate that the inhibition of these receptors would negatively affect triciribine therapy. On the other hand, anticancer activity of the drug may be enhanced by several other inhibited kinases that are associated with positive regulation of cell proliferation and each playing a role in various types of cancer (FGFR1 [42, 54], DDR2 [46], Ilk [55], Axl [56, 57]). However, it cannot be ruled out, that the observed reduced binding of some kinases are due to secondary effects upon in vivo drug treatment which cannot be distinguished by the kinobead technology [58]. For example, as some of the targets are involved in cell proliferation processes, the observed regulation might be a side-effect to triciribine-induced cell death.
0.0
0.2
0.4
0.6
0.8
1.0
1.2 Rps6ka5
Bmpr2
Bmpr1a
0.0025
0.025
0.25
2.5 25
Triciribine [µM]
Re
sid
ua
l b
ind
ing
0.0
0.2
0.4
0.6
0.8
1.0
1.2 Tgfbr2
Fgfr1
Dddr2
0.00
25
0.02
50.
25 2.5 25
Triciribine [µM]
Re
sid
ua
l b
ind
ing
0.0
0.2
0.4
0.6
0.8
1.0
1.2 Axl
Ilk
Jak1
0.0025
0.025
0.25
2.5 25
Triciribine [µM]
Re
sid
ua
l b
ind
ing
β-actin
pan-AKT
p-AKT (Ser-473)
0.0
0.5
1.0
DMSO
0.00
250.
025
0.25 2.
5
pan-AKT
pAKT
Triciribine [µM]
Re
lati
ve
sig
na
l in
ten
sity
C D E
A B
Triciribine [μM]
Chapter 5 | Chemical and phosphoproteomic characterization of triciribine action
118
Characterization of the kinome of PDAC cell lines upon drug treatment
The cell viability studies on Kras-induced pancreatic cell lines revealed a differential sensitivity to the AKT inhibitor triciribine which was most dominant at an inhibitor concentration of 1 µM. Hence, a quantitative comparison of the kinome expression profile upon drug treatment was performed on the two cell lines characterized as most sensitive (7662) and most resistant (53631) to identify differentially regulated kinases and signaling pathways. Briefly, cells were treated with 1 µM triciribine or DMSO vehicle for 1 h, following lysis and kinase enrichment using kinobeads. Experiments were performed in triplicates to allow statistical analysis within and across cell lines. In total, 244 and 239 protein kinases were identified and quantified in at least two replicates in the resistant and sensitive cell line with an overlap of 214 kinases (80%). Paired students t-test based on the normalized intensity data resulted in almost no significant changes in kinases expression upon triciribine treatment (p < 0.05; log2 fold change >1) for both, resistant and sensitive, cell lines (Figure 4 A, B). This was partly expected as drug treatment over a short time period (1h) initially influences the activity status of a protein but a response on gene expression level can mainly be detected after long-term treatment.
Hence, an additional detailed comparison of the kinome expression level of the untreated cells was performed to identify general differences that may be indicative for individual tumor biology in the two pancreatic cell lines. Indeed, the analysis revealed 93 significant protein kinases (p < 0.05). To define a robust difference in kinase level, a cutoff of a minimal 2-fold change was set, leading to 55 kinases highly expressed in the resistant cell line (7662) and 22 kinases with higher expression level in the sensitive cells (Figure 4 C). Kinases more abundant in the sensitive line predominantly were receptor tyrosine kinases, such as ephrin receptor family members, growth factor receptors and DDR2, whereas serine/ threonine protein kinases, such as ribosomal protein S6 kinases (S6Ks), NUAK2 and MAP kinases, showed higher abundance in the resistant cell line. These differences in abundance are also confirm with the global differential kinome expression analysis of all eight PDAC cell lines.
In order to explore the cellular signaling pathways overrepresented in either of the two cell lines, a molecular pathway analysis was performed. Expectedly, differential tumor biology affected multiple pathways, mainly dependent on Ras and PI3K signaling, such as ephrin receptor signaling, NFκB signaling and PTEN signaling, and highly affected cancer progression. For example, ephrin receptors are strongly expressed in the sensitive cell line and have been functionally implicated in a number of tumors with role in cell proliferation, tumor metastasis and angiogenesis [59-61]. Ephrin signaling mediates cell proliferation and migration via the PI3K/AKT cascade, indicating that tumor progression is driven by that pathway in this cell line and therefore they are likely to respond more quickly to the drug treatment than pancreatic tumor cells dependent on other pathways. On the other hand, kinases with a role in NFκB signaling are more abundant in the resistant cell line. The NFκB pathway mediates survival and cell proliferation, and although being a common downstream pathway of AKT, it can as well be activated in an AKT-independent fashion via MAP2 kinases and JNK1. Moreover, it has been shown that the IKBKE kinase (2-fold higher abundance in 53631 cells) activates AKT independent of PI3K/PDK1/mTORC2 and the pleckstrin homology domain leading to sustained

Chemical and phosphoproteomic characterization of triciribine action | Chapter 5
119
malignant transformation [43]. These results indicate that the resistant cell line is driven by alternative activation mechanisms of AKT downstream signaling pathways. Collectively, Figure 5 shows the similarities and differences in the general signaling of the two different cell lines within a regulated molecular network involved in cell death and survival, cellular development and cellular growth and proliferation. The identified network highlights the PI3K and NFκB complexes as key nodes whereby upstream proteins again show higher expression in the sensitive cell line and downstream targets are more dominant in the resistant one.
Figure 4| Quantitative protein kinase expression profiles of the sensitive and resistant cell lines in response to
triciribine treatment and in comparison among each other.
The volcano plots illustrate the differences in mean log intensity levels and the associated significance to
determine kinase profiles. The y-axis is the probability that the protein is differentially expressed. The x-axis
indicates the log2 value of fold changes between the two conditions. Treatment with 1 µM triciribine was
performed on the sensitive 7662 cell line (A) and the resistant 53631 cell line (B). Proteins which are significantly
down-regulated in the treatment compared to the control are located in the upper left of the graphs, up-regulated
proteins are located in the upper right. The p-values shown were obtained from paired Student s t-tests. Dashed
lines represent p=0.05 and fold-change > 2.
7662
-2 -1 0 1 2 3
0.001
0.01
0.1
1
Map2k3Jak3
Tesk2
Akt3
Map3k13
Limk1
Csnk1a1
Aurkb
Pask
Plk4
Ulk1
Pik3cb
log2 (T/D)
p-v
alu
e
53631
-3 -2 -1 0 1 2
0.001
0.01
0.1
1
Rnasel
Map3k12
Mapk6
Cdk2
Map2k5
Ikbke
Insr
Met
Irak4Tgfbr2Stk16
Ttn
Lyn
log2 (T/D)
p-v
alu
e
-15 -10 -5 0 5 10 15
0.0001
0.001
0.01
0.1
1
Ephb2Ephb6
Ilk
Dclk1Nuak2
Epha1
Prkd1Prkaa2
Tgfbr2
Ddr2
Rps6ka2
Fgfr1
Rps6ka6
Flt4
Ephb3Irak1
Pdgfra
Mark1
log2 (7662/53631)
p-v
alu
e
A B
C
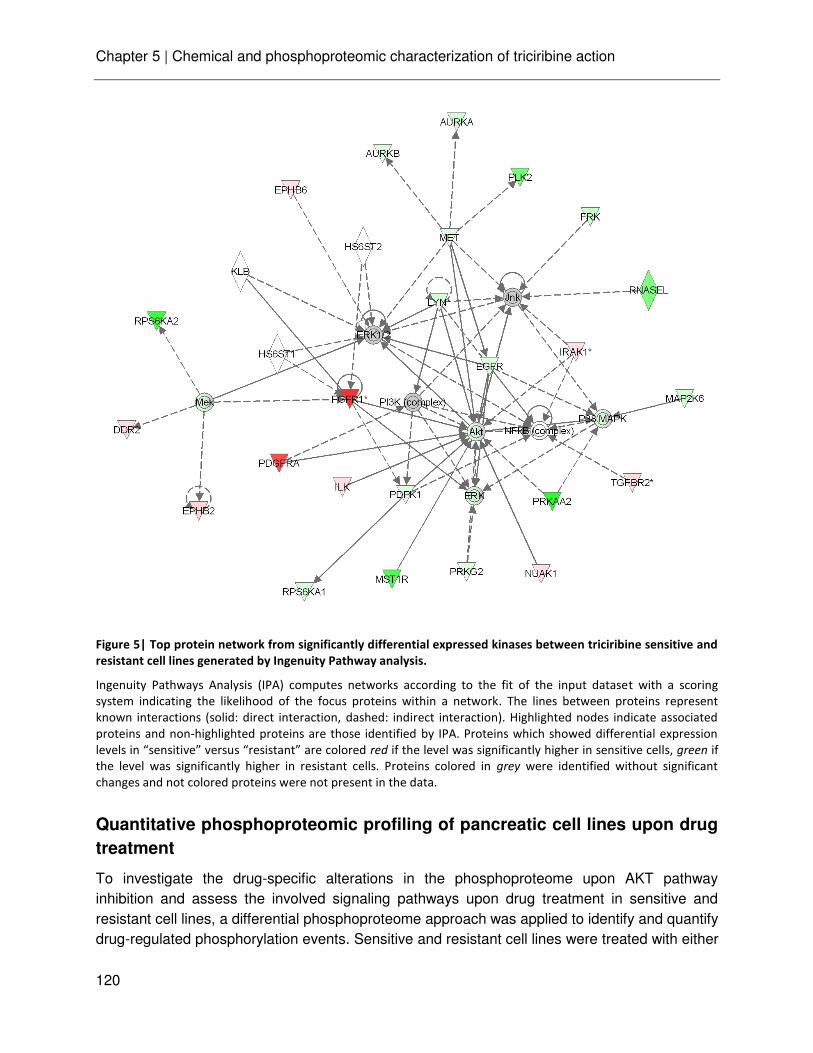
Chapter 5 | Chemical and phosphoproteomic characterization of triciribine action
120
Figure 5| Top protein network from significantly differential expressed kinases between triciribine sensitive and
resistant cell lines generated by Ingenuity Pathway analysis.
Ingenuity Pathways Analysis (IPA) computes networks according to the fit of the input dataset with a scoring
system indicating the likelihood of the focus proteins within a network. The lines between proteins represent
known interactions (solid: direct interaction, dashed: indirect interaction). Highlighted nodes indicate associated
proteins and non-highlighted proteins are those identified by IPA. Proteins which showed differential expression
le els in sensiti e ersus resistant are colored red if the level was significantly higher in sensitive cells, green if
the level was significantly higher in resistant cells. Proteins colored in grey were identified without significant
changes and not colored proteins were not present in the data.
Quantitative phosphoproteomic profiling of pancreatic cell lines upon drug
treatment
To investigate the drug-specific alterations in the phosphoproteome upon AKT pathway inhibition and assess the involved signaling pathways upon drug treatment in sensitive and resistant cell lines, a differential phosphoproteome approach was applied to identify and quantify drug-regulated phosphorylation events. Sensitive and resistant cell lines were treated with either

Chemical and phosphoproteomic characterization of triciribine action | Chapter 5
121
vehicle control or inhibitor for 1 h, followed by cell lysis and digestion into peptides. To quantitatively compare phosphorylation changes, tryptic peptides were isotopically labeled by reductive dimethylation using the light dimethyl label for the triciribine treated condition and the intermediate dimethyl label for the control. Equal peptide amounts were mixed and subjected to a global phosphoproteomics workflow using immobilized metal ion affinity (IMAC) followed by Ti (IV) based IMAC enrichment and LC-MS/MS analysis (see “Material and Methods” for details). To ensure robustness and reproducibility of the measured changes, experiments were performed in triplicate analysis. In total, 8,322 phosphorylation sites from 2,380 phosphoproteins were identified over all experiments with and FDR of less than 1% on peptide and protein level using MaxQuant. When considering the two separate cell lines, 3,399 unique phosphosites from 1,585 phosphoproteins were reliably quantified (in at least two independent experiments) in the sensitive cell line, the respective numbers for the resistant cell line are 1,951 unique phosphosites and 1037 phosphoproteins (Figure 6 A). The frequency distribution of the phosphorylated residues (serine: 82.9%; threonine: 15.9%; tyrosine: 1.2%) is similar to frequency distributions obtained before [62] indicating no bias of the applied phospho-enrichment towards a certain type of phosphorylation.
Kinase motif classification and amino acid frequency analysis
The amino acid sequence surrounding a given phosphosite may provide insight into kinases, phosphatases and phospho-binding domains involved into in its regulation and signaling. In order to classify the phosphorylation sites, the Motif-X algorithm [36, 63] was used to identify phosphorylation-specific motifs among the up- or downregulated phosphopeptides in both cell lines. Analysis of 79 significantly regulated unique phosphopeptides (63 downregulated and 16 upregulated sites based on the Significance B test of the MaxQuant module Perseus) (Figure 6 B) of the sensitive cell line revealed six specific motifs for pS sites (Figure 6 D). For the resistant cell line, only one acidic motif could be identified from the analysis of 22 significantly regulated unique phosphopeptides (18 downregulated and 4 upregulated sites) (Figure 6 C). Interestingly, the highest scoring motif (RxxsxxxE) from the sensitive data set has been associated with AKT kinase activity; further motifs could be associated with MAPK (xxsPxx) and PKA (Rxsxx) kinase activity. One population of peptides was significantly regulated in both data sets and could be assigned to a motif containing a high number of acidic residues (sxxE). Such acidic motifs are typically correlated with casein kinase 2 (CK2), although no known CK2 substrates could be identified.
Taken together, the kinase sequence motif analysis indicate specific response of the sensitive cell line upon triciribine treatment, with affected phosphorylation sites that are target sites of kinases downstream of Kras-mediated signaling, such as AKT and MAP kinases.
Pathway network analysis of triciribine regulated phosphoproteins
The vast majority of identified phosphoproteins showed a 1:1 ratio between control and treated groups. However, 272 phosphoproteins were quantified significantly in the sensitive cell line

Chapter 5 | Chemical and phosphoproteomic characterization of triciribine action
122
(p < 0.05), 65 of them downregulated and 30 upregulated in response to drug treatment (fold-change > 1.5). The respective numbers for the resistant cell line are 139 significant phosphoproteins with downregulation of 7 and upregulation of 17 phosphoproteins. For the known primary triciribine target AKT, no phosphopeptides could be detected in any of the experiments, thus no direct evaluation of the activity status of AKT was possible. The sensitive and resistant cell line shared only three regulated phosphoproteins (Ilf3, Bbx and Gnl1), all of them with regulation in the same direction and therefore most likely without a pivotal role in differential triciribine response.
Figure 6 | Phosphorylation consensus motif analysis of cell lines sensitive and resistant to AKT inhibitor
triciribine.
Number of (A) identified and (B) upon triciribine treatment significantly regulated unique phosphosites in the
sensitive (7662) and resistant (53631) pancreatic cell line. Phosphorylation-specific motifs for (C) the resistant and
(D) the sensitive cell line using the Motif-X algorithm. Significantly regulated phosphorylation sites were analyzed
against the IPI mouse background with a minimum occurrence of 6 matches per motif. Scores (in brackets)
represent the sum of the negative log of the probabilities used for generating a single motif. Sequence motifs were
classified according to know recognition motifs.
7662
53631
MAPKs
AKT
PKA
CK2CK2
(9.13)
(10.77)
(5.31)
(5.05)
(4.91)
(4.66)(4.18)
474 1477 1922
11 11 68
D
C
A
B
53631 7662
53631 7662
Chemical and phosphoproteomic characterization of triciribine action | Chapter 5
123
To assess the extent to which the set of differential phosphoproteins are enriched in any pathway module, significantly up-/ down-regulated phosphosites were analyzed with Ingenuity Pathway Analysis. For the resistant cell line, pathways around cell death and survival, and cellular development are enriched. Nevertheless, no distinct regulatory direction could be associated with AKT signaling, indicating minor dependence on this pathway node for cell survival and tumor progression in this pancreatic cell line. In the sensitive cell line, the most prominent network related to protein synthesis, cancer and infectious disease, and downregulated DNA methylation and transcriptional repression signaling, cell cycle regulation, and mTOR signaling were among the top significantly enriched pathways. Specifically interesting in that content is the mTOR signaling pathway (Figure 7), with several transcription factors (eIFs) as well as tumor suppressor genes (TSC1 and 2) and oncogenes (ULK1) with known relevance to cancer.
TSC1 and TSC1 are tumor suppressor genes that form a heterodimeric complex TSC1-TSC2. This complex acts within the PI3K-AKT downstream pathway via the suppression of mTORC1 complex activity and hence mTOR signaling [64-66]. AKT directly phosphorylates TSC2 on 4 or 5 distinct residues [65, 67, 68] leading to the inhibition of the complex and hence initiation of TOR-dependent signaling [69, 70], and resulting in increased protein synthesis capacity driving cell growth and proliferation [71]. Phosphorylation of both TSC1 and TSC2 is moderately upregulated upon drug treatment, initially suggesting inhibitory regulation of the TSC1-TSC2 complex. However, none of the detected phosphosites matches to described regulatory residues and whether these other known phosphorylation sites on TSC1 or TSC2 bear a physiological significance and differentially affect downstream regulation is yet to be discovered [65, 72]. Therefore it is conceivable that the here robust quantified phosphosites for TSC1 (Ser-110) and TSC2 (Ser-937, Ser-1309) promote complex stability and hence inhibit activation of mTORC1 complex and TOR-dependent signaling. In the present study, several of the best-characterized targets of mTOR are regulated, for example, S6K2 as well as eIF4B (including the crucial Ser-422 phosphopeptide) and eIF3, showed decreased phosphorylation level when treated with triciribine inhibitor, indicating downregulation of mTOR signaling due to AKT inhibition [73-77]. mTOR activity leads to S6K1/2 phosphorylation and activation, which in turn act on eIFs and eIF-binding proteins, and results in ribosomal biogenesis and the activation of specific mRNA populations For example, Ser-422 on eIF4B can be phosphorylated by S6 kinases through an mTOR-sensitive pathway [73, 78]. Significance of eIF4B Ser-422 for eIF3 binding and stimulation of cap-dependent translation was in turn confirmed by several groups [79-82]. It has further been shown that overexpression of eIF4B in Drosophila cultured cells stimulates cell proliferation, whereas eIF4B silencing by RNAi or knockdown leads to polysome depletion, translational repression, and decreased cell survival and proliferation [83, 84]. Noteworthy in this context is also the eIF4E-binding protein (4EBP) with almost 1.7 fold decreased phosphorylation level, which inhibits the translation of eIF4E-bound mRNAs. 4EBP phosphorylation by mTOR relieves its inhibitory activity, hence resulting in increased translation, and it has been shown that accumulation of dephosphorylated 4EBP upon mTOR inhibition limits the eiF4E-dependent translation of mRNAs required for vGPCR-induced cell proliferation [85]. Another indication for decreased mTOR signaling after AKT inhibition provides the target

Chapter 5 | Chemical and phosphoproteomic characterization of triciribine action
124
ULK1, which was upregulated in the data set. It has been shown that the serine/ threonine-protein kinase ULK1 is activated upon nutrient starvation or mTOR inhibition, and induces autophagy by phosphorylating Beclin-1, eventually causing apoptosis [86, 87].
Figure 7 | Effects of triciribine on the mTOR signaling pathway.
Pathway analysis of the significantly regulated phosphoproteins using Ingenuity Pathway Analysis (IPA) upon
triciribine treatment in the sensitive cell line revealed mTOR signaling as one of the top regulated pathways.
Proteins hich sho ed differential regulated le els in treat ent ersus control are colored red if the le el as significantly lower upon treatment, green if the level was significantly higher. Proteins not colored were not
present in the data.
Taken together, the present phosphoproteomic study provides evidence for a strong dependence on the PI3K/AKT-mediated mTOR signaling pathway for cell survival and tumor progression in the triciribine sensitive 7662 pancreatic cell line. The mTORC complex represented a key node for several significantly regulated phosphoproteins, all of them with a pivotal role in fundamental biological processes and described connection to various cancer types.
Chemical and phosphoproteomic characterization of triciribine action | Chapter 5
125
Concluding remarks
In this study, chemoproteomic and phosphoproteomic analysis in combination with quantitative mass spectrometry using isotopic labeling and label-free intensity-based approaches were applied to comprehensively characterize several pancreatic cancer cell lines for their responsiveness to the allosteric AKT inhibitor triciribine. Such an experimental strategy enables the study of dynamic drug targets behaviour in a particular cell line, or, as shown in the present work, the comparison of target expression and posttranslational modifications in different cell lines characterized by differential biological sensitivity to a certain drug of interest, such as triciribine. The results offer additional explanations for the pharmacological effects seen in these cells with triciribine, and especially the, for the first time, established selectivity profile of the clinical phase I drug triciribine highlights the potential of the drug in specific subgroups of pancreatic cancer and other tumor types. The data supports that in a subset of the tested cell lines, tumor progression is clearly driven by PI3K/AKT/mTOR signaling, while others seem to be more dependent on other Ras-mediated pathways, such as ERK signaling. The present study provides evidence for the sensitivity of a specific group of pancreatic cancer cell lines and may pave the way for additional triciribine studies on a large PDAC cell line platform or a number of primary tissues as well as eventually in vivo studies.
Chapter 5 | Chemical and phosphoproteomic characterization of triciribine action
126
Acknowledgments
I am indebted to Fong-Chin Huang who performed the initial cell-based characterization of the pancreatic cell lines during an internship under my supervision and to Scarlet Beck who validated the cell-based triciribine sensitivity and performed most of the kinase-centric and initial phosphoproteomic studies during her MSc thesis under my supervision.
Abbreviations
DMEM Dulbecco’s modified Eagle’s medium
DMSO dimethylsulfoxide
FBS fetal bovine serum
FDR false discovery rate
HCD higher energy collision induced dissociation
IMAC immobilized metal ion affinity
IPA Ingenuity Pathway Analysis
LC-MS/MS liquid chromatography coupled to tandem mass spectrometry
PanIN pancreatic intraepithelial neoplasias
PBS phosphate buffered saline
PDAC pancreatic ductal adenocarcinoma
PH pleckstrin homology domain
TCN triciribine
TCN-P triciribine monophosphate
XTT Sodium 3`-[1-(phenylaminocarbonyl)- 3,4-tetrazolium]-bis (4-methoxy-6-
nitro) benzene sulfonic acid hydrate
Chemical and phosphoproteomic characterization of triciribine action | Chapter 5
127
References
1. Vincent, A.; Herman, J.; Schulick, R.; Hruban, R. H.; Goggins, M., Pancreatic cancer. Lancet 2011, 378 (9791), 607-20.
2. Li, D.; Xie, K.; Wolff, R.; Abbruzzese, J. L., Pancreatic cancer. Lancet 2004, 363 (9414), 1049-57.
3. Paulson, A. S.; Tran Cao, H. S.; Tempero, M. A.; Lowy, A. M., Therapeutic advances in pancreatic cancer. Gastroenterology 2013, 144 (6), 1316-26.
4. Hezel, A. F.; Kimmelman, A. C.; Stanger, B. Z.; Bardeesy, N.; Depinho, R. A., Genetics and biology of pancreatic ductal adenocarcinoma. Genes Dev 2006, 20 (10), 1218-49.
5. Moskaluk, C. A.; Hruban, R. H.; Kern, S. E., p16 and K-ras gene mutations in the intraductal precursors of human pancreatic adenocarcinoma. Cancer Res 1997, 57 (11), 2140-3.
6. Ottenhof, N. A.; de Wilde, R. F.; Maitra, A.; Hruban, R. H.; Offerhaus, G. J., Molecular characteristics of pancreatic ductal adenocarcinoma. Patholog Res Int 2011, 2011, 620601.
7. Kennedy, A. L.; Morton, J. P.; Manoharan, I.; Nelson, D. M.; Jamieson, N. B.; Pawlikowski, J. S.; McBryan, T.; Doyle, B.; McKay, C.; Oien, K. A.; Enders, G. H.; Zhang, R.; Sansom, O. J.; Adams, P. D., Activation of the PIK3CA/AKT pathway suppresses senescence induced by an activated RAS oncogene to promote tumorigenesis. Mol Cell 2011, 42 (1), 36-49.
8. Pham, N. A.; Schwock, J.; Iakovlev, V.; Pond, G.; Hedley, D. W.; Tsao, M. S., Immunohistochemical analysis of changes in signaling pathway activation downstream of growth factor receptors in pancreatic duct cell carcinogenesis. BMC Cancer 2008, 8, 43.
9. Asano, T.; Yao, Y.; Zhu, J.; Li, D.; Abbruzzese, J. L.; Reddy, S. A., The PI 3-kinase/Akt signaling pathway is activated due to aberrant Pten expression and targets transcription factors NF-kappaB and c-Myc in pancreatic cancer cells. Oncogene 2004, 23 (53), 8571-80.
10. Ying, H.; Elpek, K. G.; Vinjamoori, A.; Zimmerman, S. M.; Chu, G. C.; Yan, H.; Fletcher-Sananikone, E.; Zhang, H.; Liu, Y.; Wang, W.; Ren, X.; Zheng, H.; Kimmelman, A. C.; Paik, J. H.; Lim, C.; Perry, S. R.; Jiang, S.; Malinn, B.; Protopopov, A.; Colla, S.; Xiao, Y.; Hezel, A. F.; Bardeesy, N.; Turley, S. J.; Wang, Y. A.; Chin, L.; Thayer, S. P.; DePinho, R. A., PTEN is a major tumor suppressor in pancreatic ductal adenocarcinoma and regulates an NF-kappaB-cytokine network. Cancer Discov 2011, 1 (2), 158-69.
11. Sun, C.; Rosendahl, A. H.; Ansari, D.; Andersson, R., Proteome-based biomarkers in pancreatic cancer. World J Gastroenterol 2011, 17 (44), 4845-52.
12. Bellacosa, A.; Kumar, C. C.; Di Cristofano, A.; Testa, J. R., Activation of AKT kinases in cancer: implications for therapeutic targeting. Adv Cancer Res 2005, 94, 29-86.
13. Liu, W.; Bagaitkar, J.; Watabe, K., Roles of AKT signal in breast cancer. Front Biosci 2007, 12, 4011-9.
14. Yamamoto, S.; Tomita, Y.; Hoshida, Y.; Morooka, T.; Nagano, H.; Dono, K.; Umeshita, K.; Sakon, M.; Ishikawa, O.; Ohigashi, H.; Nakamori, S.; Monden, M.; Aozasa, K., Prognostic significance of activated Akt expression in pancreatic ductal adenocarcinoma. Clin Cancer Res 2004, 10 (8), 2846-50.
Chapter 5 | Chemical and phosphoproteomic characterization of triciribine action
128
15. Mattmann, M. E.; Stoops, S. L.; Lindsley, C. W., Inhibition of Akt with small molecules and biologics: historical perspective and current status of the patent landscape. Expert Opin Ther Pat 2011, 21 (9), 1309-38.
16. Pal, S. K.; Reckamp, K.; Yu, H.; Figlin, R. A., Akt inhibitors in clinical development for the treatment of cancer. Expert Opin Investig Drugs 2010, 19 (11), 1355-66.
17. Hirai, H.; Sootome, H.; Nakatsuru, Y.; Miyama, K.; Taguchi, S.; Tsujioka, K.; Ueno, Y.; Hatch, H.; Majumder, P. K.; Pan, B. S.; Kotani, H., MK-2206, an allosteric Akt inhibitor, enhances antitumor efficacy by standard chemotherapeutic agents or molecular targeted drugs in vitro and in vivo. Mol Cancer Ther 2010, 9 (7), 1956-67.
18. Blake, J. F.; Xu, R.; Bencsik, J. R.; Xiao, D.; Kallan, N. C.; Schlachter, S.; Mitchell, I. S.; Spencer, K. L.; Banka, A. L.; Wallace, E. M.; Gloor, S. L.; Martinson, M.; Woessner, R. D.; Vigers, G. P.; Brandhuber, B. J.; Liang, J.; Safina, B. S.; Li, J.; Zhang, B.; Chabot, C.; Do, S.; Lee, L.; Oeh, J.; Sampath, D.; Lee, B. B.; Lin, K.; Liederer, B. M.; Skelton, N. J., Discovery and preclinical pharmacology of a selective ATP-competitive Akt inhibitor (GDC-0068) for the treatment of human tumors. J Med Chem 2012, 55 (18), 8110-27.
19. Addie, M.; Ballard, P.; Buttar, D.; Crafter, C.; Currie, G.; Davies, B. R.; Debreczeni, J.; Dry, H.; Dudley, P.; Greenwood, R.; Johnson, P. D.; Kettle, J. G.; Lane, C.; Lamont, G.; Leach, A.; Luke, R. W.; Morris, J.; Ogilvie, D.; Page, K.; Pass, M.; Pearson, S.; Ruston, L., Discovery of 4-amino-N-[(1S)-1-(4-chlorophenyl)-3-hydroxypropyl]-1-(7H-pyrrolo[2,3-d]pyrimidin -4-yl)piperidine-4-carboxamide (AZD5363), an orally bioavailable, potent inhibitor of Akt kinases. J Med Chem 2013, 56 (5), 2059-73.
20. Yang, L.; Dan, H. C.; Sun, M.; Liu, Q.; Sun, X. M.; Feldman, R. I.; Hamilton, A. D.; Polokoff, M.; Nicosia, S. V.; Herlyn, M.; Sebti, S. M.; Cheng, J. Q., Akt/protein kinase B signaling inhibitor-2, a selective small molecule inhibitor of Akt signaling with antitumor activity in cancer cells overexpressing Akt. Cancer Res 2004, 64 (13), 4394-9.
21. Wotring, L. L.; Crabtree, G. W.; Edwards, N. L.; Parks, R. E., Jr.; Townsend, L. B., Mechanism of activation of triciribine phosphate (TCN-P) as a prodrug form of TCN. Cancer Treat Rep 1986, 70 (4), 491-7.
22. Berndt, N.; Yang, H.; Trinczek, B.; Betzi, S.; Zhang, Z.; Wu, B.; Lawrence, N. J.; Pellecchia, M.; Schonbrunn, E.; Cheng, J. Q.; Sebti, S. M., The Akt activation inhibitor TCN-P inhibits Akt phosphorylation by binding to the PH domain of Akt and blocking its recruitment to the plasma membrane. Cell Death Differ 2010, 17 (11), 1795-804.
23. Pawa, N.; Wright, J. M.; Arulampalam, T. H., Mass spectrometry based proteomic profiling for pancreatic cancer. JOP 2010, 11 (5), 423-6.
24. Lu, Z.; Hu, L.; Evers, S.; Chen, J.; Shen, Y., Differential expression profiling of human pancreatic adenocarcinoma and healthy pancreatic tissue. Proteomics 2004, 4 (12), 3975-88.
25. Chen, R.; Pan, S.; Yi, E. C.; Donohoe, S.; Bronner, M. P.; Potter, J. D.; Goodlett, D. R.; Aebersold, R.; Brentnall, T. A., Quantitative proteomic profiling of pancreatic cancer juice. Proteomics 2006, 6 (13), 3871-9.
26. Makawita, S.; Smith, C.; Batruch, I.; Zheng, Y.; Ruckert, F.; Grutzmann, R.; Pilarsky, C.; Gallinger, S.; Diamandis, E. P., Integrated proteomic profiling of cell line conditioned media and pancreatic juice for the identification of pancreatic cancer biomarkers. Mol Cell Proteomics 2011, 10 (10), M111 008599.
27. Hocker, J. R.; Mohammed, A.; Aston, C. E.; Brewer, M.; Lightfoot, S. A.; Rao, C. V.; Hanas,
Chemical and phosphoproteomic characterization of triciribine action | Chapter 5
129
J. S., Mass profiling of serum to distinguish mice with pancreatic cancer induced by a transgenic Kras mutation. Int J Cancer 2013.
28. Kosanam, H.; Prassas, I.; Chrystoja, C. C.; Soleas, I.; Chan, A.; Dimitromanolakis, A.; Blasutig, I. M.; Ruckert, F.; Gruetzmann, R.; Pilarsky, C.; Maekawa, M.; Brand, R.; Diamandis, E. P., LAMC2: A promising new pancreatic cancer biomarker identified by proteomic analysis of pancreatic adenocarcinoma tissues. Mol Cell Proteomics 2013.
29. Bantscheff, M.; Eberhard, D.; Abraham, Y.; Bastuck, S.; Boesche, M.; Hobson, S.; Mathieson, T.; Perrin, J.; Raida, M.; Rau, C.; Reader, V.; Sweetman, G.; Bauer, A.; Bouwmeester, T.; Hopf, C.; Kruse, U.; Neubauer, G.; Ramsden, N.; Rick, J.; Kuster, B.; Drewes, G., Quantitative chemical proteomics reveals mechanisms of action of clinical ABL kinase inhibitors. Nat Biotechnol 2007, 25 (9), 1035-44.
30. Kruse, U.; Pallasch, C. P.; Bantscheff, M.; Eberhard, D.; Frenzel, L.; Ghidelli, S.; Maier, S. K.; Werner, T.; Wendtner, C. M.; Drewes, G., Chemoproteomics-based kinome profiling and target deconvolution of clinical multi-kinase inhibitors in primary chronic lymphocytic leukemia cells. Leukemia 2011, 25 (1), 89-100.
31. Boersema, P. J.; Raijmakers, R.; Lemeer, S.; Mohammed, S.; Heck, A. J., Multiplex peptide stable isotope dimethyl labeling for quantitative proteomics. Nat Protoc 2009, 4 (4), 484-94.
32. Zhou, H.; Low, T. Y.; Hennrich, M. L.; van der Toorn, H.; Schwend, T.; Zou, H.; Mohammed, S.; Heck, A. J., Enhancing the identification of phosphopeptides from putative basophilic kinase substrates using Ti (IV) based IMAC enrichment. Mol Cell Proteomics 2011, 10 (10), M110 006452.
33. Zhou, H.; Ye, M.; Dong, J.; Corradini, E.; Cristobal, A.; Heck, A. J.; Zou, H.; Mohammed, S., Robust phosphoproteome enrichment using monodisperse microsphere-based immobilized titanium (IV) ion affinity chromatography. Nat Protoc 2013, 8 (3), 461-80.
34. Cox, J.; Mann, M., MaxQuant enables high peptide identification rates, individualized p.p.b.-range mass accuracies and proteome-wide protein quantification. Nat Biotechnol 2008, 26 (12), 1367-72.
35. Cox, J.; Neuhauser, N.; Michalski, A.; Scheltema, R. A.; Olsen, J. V.; Mann, M., Andromeda: a peptide search engine integrated into the MaxQuant environment. J Proteome Res 2011, 10 (4), 1794-805.
36. Schwartz, D.; Gygi, S. P., An iterative statistical approach to the identification of protein phosphorylation motifs from large-scale data sets. Nat Biotechnol 2005, 23 (11), 1391-8.
37. Crooks, G. E.; Hon, G.; Chandonia, J. M.; Brenner, S. E., WebLogo: a sequence logo generator. Genome Res 2004, 14 (6), 1188-90.
38. Ruepp, A.; Brauner, B.; Dunger-Kaltenbach, I.; Frishman, G.; Montrone, C.; Stransky, M.; Waegele, B.; Schmidt, T.; Doudieu, O. N.; Stumpflen, V.; Mewes, H. W., CORUM: the comprehensive resource of mammalian protein complexes. Nucleic Acids Res 2008, 36 (Database issue), D646-50.
39. McDermott, U.; Settleman, J., Personalized cancer therapy with selective kinase inhibitors: an emerging paradigm in medical oncology. J Clin Oncol 2009, 27 (33), 5650-9.
40. Diersch, S.; Wenzel, P.; Szameitat, M.; Eser, P.; Paul, M. C.; Seidler, B.; Eser, S.; Messer, M.; Reichert, M.; Pagel, P.; Esposito, I.; Schmid, R. M.; Saur, D.; Schneider, G., Efemp1 and p27(Kip1) modulate responsiveness of pancreatic cancer cells towards a dual PI3K/mTOR inhibitor in preclinical models. Oncotarget 2013, 4 (2), 277-88.
Chapter 5 | Chemical and phosphoproteomic characterization of triciribine action
130
41. Gursel, D. B.; Connell-Albert, Y. S.; Tuskan, R. G.; Anastassiadis, T.; Walrath, J. C.; Hawes, J. J.; Amlin-Van Schaick, J. C.; Reilly, K. M., Control of proliferation in astrocytoma cells by the receptor tyrosine kinase/PI3K/AKT signaling axis and the use of PI-103 and TCN as potential anti-astrocytoma therapies. Neuro Oncol 2011, 13 (6), 610-21.
42. Taeger, J.; Moser, C.; Hellerbrand, C.; Mycielska, M. E.; Glockzin, G.; Schlitt, H. J.; Geissler, E. K.; Stoeltzing, O.; Lang, S. A., Targeting FGFR/PDGFR/VEGFR impairs tumor growth, angiogenesis, and metastasis by effects on tumor cells, endothelial cells, and pericytes in pancreatic cancer. Mol Cancer Ther 2011, 10 (11), 2157-67.
43. Gu, T. L.; Deng, X.; Huang, F.; Tucker, M.; Crosby, K.; Rimkunas, V.; Wang, Y.; Deng, G.; Zhu, L.; Tan, Z.; Hu, Y.; Wu, C.; Nardone, J.; MacNeill, J.; Ren, J.; Reeves, C.; Innocenti, G.; Norris, B.; Yuan, J.; Yu, J.; Haack, H.; Shen, B.; Peng, C.; Li, H.; Zhou, X.; Liu, X.; Rush, J.; Comb, M. J., Survey of tyrosine kinase signaling reveals ROS kinase fusions in human cholangiocarcinoma. PLoS One 2011, 6 (1), e15640.
44. Lu, Z.; Zhang, Y.; Li, Z.; Yu, S.; Zhao, G.; Li, M.; Wang, Z.; Wang, Q.; Yang, Y., Overexpression of the B-type Eph and ephrin genes correlates with progression and pain in human pancreatic cancer. Oncol Lett 2012, 3 (6), 1207-1212.
45. Corbo, V.; Ritelli, R.; Barbi, S.; Funel, N.; Campani, D.; Bardelli, A.; Scarpa, A., Mutational profiling of kinases in human tumours of pancreatic origin identifies candidate cancer genes in ductal and ampulla of vater carcinomas. PLoS One 2010, 5 (9), e12653.
46. Valiathan, R. R.; Marco, M.; Leitinger, B.; Kleer, C. G.; Fridman, R., Discoidin domain receptor tyrosine kinases: new players in cancer progression. Cancer Metastasis Rev 2012, 31 (1-2), 295-321.
47. Katoh, M.; Nakagama, H., FGF Receptors: Cancer Biology and Therapeutics. Med Res Rev 2013.
48. Baker, C. H.; Trevino, J. G.; Summy, J. M.; Zhang, F.; Caron, A.; Nesbit, M.; Gallick, G. E.; Fidler, I. J., Inhibition of PDGFR phosphorylation and Src and Akt activity by GN963 leads to therapy of human pancreatic cancer growing orthotopically in nude mice. Int J Oncol 2006, 29 (1), 125-38.
49. Zhang, J.; Wang, P.; Ouyang, H.; Yin, J.; Liu, A.; Ma, C.; Liu, L., Targeting Cancer-Related Inflammation: Chinese Herbal Medicine Inhibits Epithelial-to-Mesenchymal Transition in Pancreatic Cancer. PLoS One 2013, 8 (7), e70334.
50. Ma, Q.; Guin, S.; Padhye, S. S.; Zhou, Y. Q.; Zhang, R. W.; Wang, M. H., Ribosomal protein S6 kinase (RSK)-2 as a central effector molecule in RON receptor tyrosine kinase mediated epithelial to mesenchymal transition induced by macrophage-stimulating protein. Mol Cancer 2011, 10, 66.
51. Wagner, E. F.; Nebreda, A. R., Signal integration by JNK and p38 MAPK pathways in cancer development. Nat Rev Cancer 2009, 9 (8), 537-549.
52. Hirano, T.; Shino, Y.; Saito, T.; Komoda, F.; Okutomi, Y.; Takeda, A.; Ishihara, T.; Yamaguchi, T.; Saisho, H.; Shirasawa, H., Dominant negative MEKK1 inhibits survival of pancreatic cancer cells. Oncogene 2002, 21 (38), 5923-8.
53. Kim, I. Y.; Lee, D.-H.; Ahn, H.-J.; Tokunaga, H.; Song, W.; Devereaux, L. M.; Jin, D.; Sampath, T. K.; Morton, R. A., Expression of Bone Morphogenetic Protein Receptors Type-IA, -IB, and -II Correlates with Tumor Grade in Human Prostate Cancer Tissues. Cancer Research 2000, 60 (11), 2840-2844.
Chemical and phosphoproteomic characterization of triciribine action | Chapter 5
131
54. Ahmad, I.; Iwata, T.; Leung, H. Y., Mechanisms of FGFR-mediated carcinogenesis. Biochim Biophys Acta 2012, 1823 (4), 850-60.
55. Persad, S.; Dedhar, S., The role of integrin-linked kinase (ILK) in cancer progression. Cancer Metastasis Rev 2003, 22 (4), 375-84.
56. Verma, A.; Warner, S. L.; Vankayalapati, H.; Bearss, D. J.; Sharma, S., Targeting Axl and Mer kinases in cancer. Mol Cancer Ther 2011, 10 (10), 1763-73.
57. Korshunov, V. A., Axl-dependent signalling: a clinical update. Clin Sci (Lond) 2012, 122 (8), 361-8.
58. Bantscheff, M.; Scholten, A.; Heck, A. J., Revealing promiscuous drug-target interactions by chemical proteomics. Drug Discov Today 2009, 14 (21-22), 1021-9.
59. Pasquale, E. B., Eph receptors and ephrins in cancer: bidirectional signalling and beyond. Nat Rev Cancer 2010, 10 (3), 165-180.
60. Surawska, H.; Ma, P. C.; Salgia, R., The role of ephrins and Eph receptors in cancer. Cytokine & Growth Factor Reviews 2004, 15 (6), 419-433.
61. Hafner, C.; Schmitz, G.; Meyer, S.; Bataille, F.; Hau, P.; Langmann, T.; Dietmaier, W.; Landthaler, M.; Vogt, T., Differential Gene Expression of Eph Receptors and Ephrins in Benign Human Tissues and Cancers. Clinical Chemistry 2004, 50 (3), 490-499.
62. Olsen, J. V.; Blagoev, B.; Gnad, F.; Macek, B.; Kumar, C.; Mortensen, P.; Mann, M., Global, in vivo, and site-specific phosphorylation dynamics in signaling networks. Cell 2006, 127 (3), 635-48.
63. Chou, M. F.; Schwartz, D., Biological sequence motif discovery using motif-x. Curr Protoc Bioinformatics 2011, Chapter 13, Unit 13 15-24.
64. Crino, P. B.; Nathanson, K. L.; Henske, E. P., The tuberous sclerosis complex. N Engl J Med 2006, 355 (13), 1345-56.
65. Huang, J.; Manning, B. D., A complex interplay between Akt, TSC2 and the two mTOR complexes. Biochem Soc Trans 2009, 37 (Pt 1), 217-22.
66. Huang, J.; Manning, B. D., The TSC1-TSC2 complex: a molecular switchboard controlling cell growth. Biochem J 2008, 412 (2), 179-90.
67. Manning, B. D.; Tee, A. R.; Logsdon, M. N.; Blenis, J.; Cantley, L. C., Identification of the Tuberous Sclerosis Complex-2 Tumor Suppressor Gene Product Tuberin as a Target of the Phosphoinositide 3-Kinase/Akt Pathway. Molecular Cell 2002, 10 (1), 151-162.
68. Inoki, K.; Li, Y.; Zhu, T.; Wu, J.; Guan, K. L., TSC2 is phosphorylated and inhibited by Akt and suppresses mTOR signalling. Nat Cell Biol 2002, 4 (9), 648-57.
69. Manning, B. D., Balancing Akt with S6K: implications for both metabolic diseases and tumorigenesis. J Cell Biol 2004, 167 (3), 399-403.
70. Han, J. M.; Sahin, M., TSC1/TSC2 signaling in the CNS. FEBS Lett 2011, 585 (7), 973-80.
71. Fingar, D. C.; Blenis, J., Target of rapamycin (TOR): an integrator of nutrient and growth factor signals and coordinator of cell growth and cell cycle progression. Oncogene 2004, 23 (18), 3151-71.
72. Cai, S. L.; Tee, A. R.; Short, J. D.; Bergeron, J. M.; Kim, J.; Shen, J.; Guo, R.; Johnson, C. L.; Kiguchi, K.; Walker, C. L., Activity of TSC2 is inhibited by AKT-mediated phosphorylation and membrane partitioning. J Cell Biol 2006, 173 (2), 279-89.
Chapter 5 | Chemical and phosphoproteomic characterization of triciribine action
132
73. Raught, B.; Peiretti, F.; Gingras, A. C.; Livingstone, M.; Shahbazian, D.; Mayeur, G. L.; Polakiewicz, R. D.; Sonenberg, N.; Hershey, J. W., Phosphorylation of eucaryotic translation initiation factor 4B Ser422 is modulated by S6 kinases. EMBO J 2004, 23 (8), 1761-9.
74. Dowling, R. J.; Topisirovic, I.; Alain, T.; Bidinosti, M.; Fonseca, B. D.; Petroulakis, E.; Wang, X.; Larsson, O.; Selvaraj, A.; Liu, Y.; Kozma, S. C.; Thomas, G.; Sonenberg, N., mTORC1-mediated cell proliferation, but not cell growth, controlled by the 4E-BPs. Science 2010, 328 (5982), 1172-6.
75. Ruvinsky, I.; Sharon, N.; Lerer, T.; Cohen, H.; Stolovich-Rain, M.; Nir, T.; Dor, Y.; Zisman, P.; Meyuhas, O., Ribosomal protein S6 phosphorylation is a determinant of cell size and glucose homeostasis. Genes Dev 2005, 19 (18), 2199-211.
76. Ma, X. M.; Blenis, J., Molecular mechanisms of mTOR-mediated translational control. Nat Rev Mol Cell Biol 2009, 10 (5), 307-18.
77. Wang, X.; Li, W.; Williams, M.; Terada, N.; Alessi, D. R.; Proud, C. G., Regulation of elongation factor 2 kinase by p90(RSK1) and p70 S6 kinase. EMBO J 2001, 20 (16), 4370-9.
78. Shahbazian, D.; Parsyan, A.; Petroulakis, E.; Hershey, J.; Sonenberg, N., eIF4B controls survival and proliferation and is regulated by proto-oncogenic signaling pathways. Cell Cycle 2010, 9 (20), 4106-9.
79. Holz, M. K.; Ballif, B. A.; Gygi, S. P.; Blenis, J., mTOR and S6K1 mediate assembly of the translation preinitiation complex through dynamic protein interchange and ordered phosphorylation events. Cell 2005, 123 (4), 569-80.
80. van Gorp, A. G.; van der Vos, K. E.; Brenkman, A. B.; Bremer, A.; van den Broek, N.; Zwartkruis, F.; Hershey, J. W.; Burgering, B. M.; Calkhoven, C. F.; Coffer, P. J., AGC kinases regulate phosphorylation and activation of eukaryotic translation initiation factor 4B. Oncogene 2009, 28 (1), 95-106.
81. Shahbazian, D.; Roux, P. P.; Mieulet, V.; Cohen, M. S.; Raught, B.; Taunton, J.; Hershey, J. W.; Blenis, J.; Pende, M.; Sonenberg, N., The mTOR/PI3K and MAPK pathways converge on eIF4B to control its phosphorylation and activity. EMBO J 2006, 25 (12), 2781-91.
82. Kroczynska, B.; Kaur, S.; Katsoulidis, E.; Majchrzak-Kita, B.; Sassano, A.; Kozma, S. C.; Fish, E. N.; Platanias, L. C., Interferon-dependent engagement of eukaryotic initiation factor 4B via S6 kinase (S6K)- and ribosomal protein S6K-mediated signals. Mol Cell Biol 2009, 29 (10), 2865-75.
83. Hernandez, G.; Vazquez-Pianzola, P.; Zurbriggen, A.; Altmann, M.; Sierra, J. M.; Rivera-Pomar, R., Two functionally redundant isoforms of Drosophila melanogaster eukaryotic initiation factor 4B are involved in cap-dependent translation, cell survival, and proliferation. Eur J Biochem 2004, 271 (14), 2923-36.
84. Shahbazian, D.; Parsyan, A.; Petroulakis, E.; Topisirovic, I.; Martineau, Y.; Gibbs, B. F.; Svitkin, Y.; Sonenberg, N., Control of cell survival and proliferation by mammalian eukaryotic initiation factor 4B. Mol Cell Biol 2010, 30 (6), 1478-85.
85. Martin, D.; Nguyen, Q.; Molinolo, A.; Gutkind, J. S., Accumulation of dephosphorylated 4EBP after mTOR inhibition with rapamycin is sufficient to disrupt paracrine transformation by the KSHV vGPCR oncogene. Oncogene 2013.

Chemical and phosphoproteomic characterization of triciribine action | Chapter 5
133
86. Russell, R. C.; Tian, Y.; Yuan, H.; Park, H. W.; Chang, Y. Y.; Kim, J.; Kim, H.; Neufeld, T. P.; Dillin, A.; Guan, K. L., ULK1 induces autophagy by phosphorylating Beclin-1 and activating VPS34 lipid kinase. Nat Cell Biol 2013, 15 (7), 741-50.
87. Wirth, M.; Joachim, J.; Tooze, S. A., Autophagosome formation-The role of ULK1 and Beclin1-PI3KC3 complexes in setting the stage. Semin Cancer Biol 2013.

Chapter 5 | Chemical and phosphoproteomic characterization of triciribine action
134

Summary
Zusammenfassung

137
Summary
Protein kinases are key regulators of major biological signaling processes in cell and a variety of diseases like cancer have been associated with deregulation of kinase activity. As a consequence, protein kinases are among the most intensively studied signaling molecules in pathophysiological biology and received considerable attention as therapeutic targets. So far, numerous aberrant kinases have been identified to play a pivotal role in all states of tumorigenesis and about 20 small molecule kinase inhibitor drugs are in clinical use today (all in oncology). Therefore, the kinome-wide characterization of cancer signaling as well as the true target spectrum of small molecule drugs may offer new insight in the therapeutic potential. However, challenges in assessing kinase function and drug selectivity in a more physiological context is often hampered by the generally low expression level of kinases and the extensive post-translation modification in vivo.
Over the last years, chemical proteomics and phosphorylation profiling technologies based on quantitative mass spectrometry have emerged as a powerful tool of choice to study (drug-dependent) kinase signaling. However, additional technical improvements can still be made and novel instrumentations and methods continue to be developed. The primary objective of this thesis was to develop and optimize quantitative mass spectrometry-based chemoproteomic approaches to study kinase activity in cancer in a global and systematic fashion.
Undoubtedly, state of the art mass spectrometric technology, as the analytical technique of choice, is one prerequisite. Therefore, the performance of the Orbitrap Elite, a novel hybrid linear ion trap high field Orbitrap mass spectrometer, was first systematically evaluated for proteomic application. The very high resolution available on this instrument allows 95% of all peptide masses to be measured with sub-ppm accuracy which in turn improves protein identification by database searching. It was further confirmed that mass accuracy in tandem mass spectra is a valuable parameter for improving the success of protein identification. The new CID rapid scan type of the Orbitrap Elite achieves similar performance as HCD fragmentation and both allow the identification of hundreds of proteins from as little as 0.1 ng of protein digest on column. The considerably improved performance makes the instrument a valuable and versatile tool for mass spectrometry based proteomics. As quantitative measurements became increasingly important for proteomics studies, a robust quantification method for the analysis of kinase inhibitor selectivity assays using kinobeads was established. A novel mode of data processing was developed that identifies reporter ions from isobaric labeling tags via the accurate mass differences within a single tandem mass spectrum instead of applying fixed mass error tolerances for all tandem mass spectra. This approach leads to unambiguous reporter ion identification and complete removal of common interfering signals and thereby considerably improves mass accuracy and protein quantification. However, intensity-based label-free approaches have shown to be more suitable for selectivity profiling as kinome coverage was significantly improved and determination of binding potencies were more accurate compared to literature evidence.
Improvements of the biochemical workflow were mainly achieved by the design and synthesis of
138
a new chemical affinity probe targeting AKT and about 50 other kinases and, thus, expending the general scope of the previously published kinobeads. In combination with kinobeads, the synthesized probe was applied to the selectivity profiling of the ATP-competitive AKT inhibitors GSK690693 and GSK2141795, and the allosteric AKT inhibitors perifosine and MK-2206 in human cell lines. The results confirmed the inhibition of all AKT isoforms and of a number of known, as well as CDC42BPB as a novel, putative target for GSK690693. This work also established, for the first time, the kinase selectivity profile of the clinical phase I drug GSK2141795 and identified PRKG1 as a low nanomolar kinase target as well as the ATP-dependent 5’-γ’ DNA helicase ERCCβ as a potential new non-kinase off-target. Besides, it was shown that selectivity profiling by kinobeads can also be applied to allosteric inhibitors. Several MAP kinases have shown to be off-targets for perifosine. Profiling of MK-2206 revealed the DNA binding PARP16 and also the ferrochelatase FECH as putative non-kinase off-targets.
Last, but not least, the established instrumental and biochemical methods were applied to the characterization of murine Kras-induced pancreatic ductual adenocarcinoma (PDAC) cell lines according to their sensitivity to the AKT inhibitor triciribine. Phosphoproteomics analysis identified about 270 significantly regulated phosphoproteins in a triciribine sensitive cell line, suggesting the dependence of this PDAC cell lines on the AKT-mTOR signaling pathway. In contrast, growth of resistant cell lines seems to be driven by other Ras-mediated pathways, such as Ras-ERK signaling. These findings confirm the high diversity of the underlying molecular biology in cancerous diseases, in particular in pancreatic cancer.
139
Zusammenfassung
Proteinkinasen sind Schlüsselregulatoren der wesentlichen Signalprozesse in Zellen und eine Vielzahl an Krankheiten, wie Krebs, wurden mit deregulierter Kinaseaktivität assoziiert. Infolgedessen gehören Proteinkinasen zu den am besten erforschten Signalmolekülen in der pathophysiologischen Biologie und erlangten erhebliche Aufmerksamkeit als therapeutische Zielproteine. Bislang wurden zahlreiche aberrante Kinasen mit zentraler Rolle in allen Stadien der Tumorentstehung identifiziert und etwa β0 ‚small molecule‘ Kinaseinhibitoren sind gegenwärtig in klinischer Anwendung (alle im Bereich der Onkologie). Die gezielte, Kinase-zentrierte Untersuchung von Signalkomplexen in Krebs sowie des tatsächlichen Wirkspektrums der ‚small molecule inhbiitor‘ Medikamente bietet daher die Möglichkeit, neue Erkenntnisse mit therapeutischem Protential zu gewinnen. Einblicke in Kinasefunktion und Arzneiselektivität in einem physiologischeren Kontext zu erlangen, ist jedoch durch das generell niedrige Expressionslevel von Kinasen und deren umfangreiche posttranslationale Modifikationen erschwert.
In den letzten Jahren haben sich Technologien der chemischen Proteomik und Erstellung von Phosphorylierungsprofilen als wirksame Werkzeuge herausgestellt, um (Medikamenten-abhängige) Kinasesignalwege zu untersuchen. Durch die stete Entwicklung neuartiger Instrumente und Methoden koennen auch weiterhin technische Fortschritte erzielt werden. Die vorrangige Zielsetzung dieser Arbeit war die Entwicklung und Optimierung quantitativer Massenspektrometrie basierender chemoproteomischer Ansätze zur globalen und systematischen Untersuchung von Krebs-abhängiger Kinaseaktivität.
Modernste massenspektrometrische Technologie, als Analysetechnik der Wahl, ist zweifellos eine Grundvorraussetzung. Daher wurde die Leistungsfähigkeit der Orbitrap Elite, eines neuen hybriden Ionenfallen Hochfrequenz-Orbitrap Massenspektrometer, systematisch auf die proteomische Anwendbarkeit beurteilt. Die auf dem Instrument verfügbare sehr hohe Auflösung erlaubt die Messung von 90% aller Peptidmassen innerhalb sub-ppm Genauigkeit, was wiederum die Proteinidentifikation bei der Datenbanksuche verbessert. Es wurde neuerlich bestätigt, dass Massengenauigkeit in Tandemmassenspektren ein nützlicher Parameter zur Erfolgssteigerung der Proteinidentifikation ist. Der neuartige ‚CID rapid‘ Scantyp der Orbitrap Elite erzielt vergleichbare Leistung wie HCD Fragmentation und beide ermöglichen die Identifizierung von Hunderten Proteinen in nur 0,1 ng an Proteinverdau auf der Säule. Die beträchtlich verbesserte Leistung macht das Instrument zu einem wertvollen und vielseitigen Werkzeug der Massenspektrometrie-basierten Proteomik. Da quantitative Messungen in proteomischen Studien zunehmend an Bedeutung gewonnen haben, wurde eine robuste Quantifizierungsmethode zur Analyse von Selektivitätsbestimmungen von Kinaseinhibitoren etabliert. Eine neuartige Methode der Identifizierung von Reporterionen isobarer Massentags wurde entwickelt, welche mittels der exakten Massendifferenzen innerhalb eines einzigen Tandemmassenspektrums anstelle einer festen Massentoleranz für alle Tandemmassenspektren arbeitet. Dieser Ansatz führt zur eindeutigen Identifizierung von Reporterionen und kompletten Beseitigung häufig auftretender Störsignale, und verbessert dadurch erheblich die Massengenauigkeit und Proteinquantifizierung. Intensitäts-basierte
140
markierungsfreie Ansätze erwiesen sich jedoch als geeigneter zur Selektivitätsbestimmung, da die Abdeckung des Kinoms ma geblich erhöht war und die bestimmten Bindungsaffinitäten stärker den Literaturwerten glichen.
Der biochemischen Arbeitsablaufs wurden vorwiegend durch Design und Synthese einer neuen chemischen Affinitätssonde verbessert, welche AKT und etwa 50 weitere Kinases anreichert und dadurch die Bandbreite der zuvor publizierten Kinobeads erweitert wird. In Kombination mit Kinobeads wurde die synthetisierte Sonde zur Selektivitätsbestimmung der ATP-kompetitiven AKT Inhibitoren GSK690693 und GSK2141795, sowie der allosterischen AKT Inhibitoren Perifosine und MK-2206 in humanen Zelllinien herangezogen. Die Ergebnisse bestätigten die Inhibierung aller Isoformen von AKT und zahlreicher bekannter Zielproteine von GSK690693, sowie CDC42BPB als potentiell neues Zielprotein. Diese Arbeit etablierte zudem erstmalig das Selektivitätsprofil des, in klinischer Phase I befindlichen, Medikaments GSK2141795 und identifizierte PRKG1 als Zielkinase im geringen nanomolaren Bereich, ebenso wie die ATP-abhängige DNA Helikase ERCC2 als vermeintlich neues nicht-Kinase Zielprotein. Ferner konnte gezeigt werden, dass die Selektivitätsbestimmung mittels Kinobeads ebenfalls auf allosterische Inhibitoren anwendbar ist. Mehrere MAP Kinasen erwiesen sich als zusätzliche Zielproteine von Perifosine. Das Profil von MK-2206 zeigte das DNA-bindende PARP16 sowie die Ferrochelatase FECH als vermeintliche nicht-Kinase Zielproteine auf.
Zuletzt wurden die etablierten instrumentellen und biochemischen Methoden herangezogen, um murine Zelllinien von Kras-induzierten duktalen Adenokarzinomen des Pankreas (PDAC) entsprechend ihrer Sensitivität gegenüber des AKT Inhibitors Triciribine zu charakterisieren. Eine phosphoproteomische Analyse identifizierte circa 270 signifikant regulierte Phosphoproteine in einer Triciribine-sensitiven Zelllinie, welche die Abhängigkeit dieser PDAC-Zelllinie von dem AKT-mTOR Signalweg nahe legt. Im Gegensatz dazu scheint das Wachstum resistenter Zellinien von anderen Ras-vermittelten Signalwegen, wie Ras-ERK Signalisierung, angetrieben zu werden. Diese Resultate bestätigen die hohe Diversität der zugrundeliegenden Molekularbiologie in kanzerösen Krankheiten, besonders in Pankreaskrebs.

List of publications
Danksagung
Curriculum vitae

143
List of publications
Pachl F, Fellenberg K, Wagner C, Kuster B. (2012) Ultra-high intra-spectrum mass accuracy enables unambiguous identification of fragment reporter ions in isobaric multiplexed quantitative proteomics. Proteomics. 12(9):1328-32.
Pachl F, Ruprecht B, Lemeer S, Kuster B. (2013) Characterization of a high field Orbitrap mass spectrometer for proteome analysis. Proteomics. Jul 8 [Epub ahead of print]
Pachl F, Plattner P, Ruprecht B, Médard G, Sewald N, Kuster B. (2013) Characterization of a Chemical Affinity Probe Targeting Akt Kinases. J Proteome Res. 12(8):3792-800.
Publications not included in this thesis:
Hahne H, Pachl F, Ruprecht B, Maier SK, Klaeger S, Helm D, Médard G, Wilm M, Lemeer S, Kuster B. (2013) DMSO enhances electrospray response boosting sensitivity of proteomic experiments. Nat. Methods. Aug 25 [Epud ahead of print]
Weis C, Pfeilmeier S, Glawischnig E, Isono E, Pachl F, Hahne H, Kuster B, Eichmann R, Hückelhoven R. (2013) Co-immunoprecipitation-based identification of putative BAX INHIBITOR-1-interacting proteins involved in cell death regulation and plant-powdery mildew interactions. Mol Plant Pathol. Jun 19 [Epub ahead of print]
Savitski MM, Mathieson T, Zinn N, Sweetman G, Doce C, Becher I, Pachl F, Kuster B, Bantscheff M (2013) Measuring and Managing Ratio Compression for Accurate iTRAQ/TMT Quantification. J Proteome Res. 12(8):3586-98.
Thiele K, Wanner G, Kindzierski V, Jürgens G, Mayer U, Pachl F, Assaad FF. (2009) The timely deposition of callose is essential for cytokinesis in Arabidopsis. Plant J. 58(1):13-26.

144

145
Danksagung | Acknowledgment
Keiner promoviert alleine und auch ich habe während meiner Promotionszeit enorme Unterstützung bekommen, in professioneller sowie privater Hinsicht. Dafür möchte ich mich an dieser Stelle herzlich bei alldenjenigen bedanken, die in den letzten dreieinhalb Jahren zu dieser Dissertation einen der vielfältigen Beiträge geleistet haben.
Zuallererst gilt mein besonderer Dank natürlich Bernhard, der mir als Doktorvater die Arbeit überhaupt erst ermöglicht hat. Diese Dissertation wäre ohne seine hervorragende Betreuung, vielen guten Ideen und steter Unterstützung nicht möglich gewesen.
Desweiteren gilt mein Dank auch Prof. Dr. Ralph Hückelhoven und Prof. Dr. Dieter Langosch; dafür, dass sie sich bereiterklärt haben, das Zweitgutachten und den Prüfungsvorsitzt zu übernehmen.
Naturlich gilt mein Dank auch meinen ehemaligen Studenten, die in ihrem Forschungspraktikum oder während ihrer Masterarbeit einen wichtigen Betrag zu dieser Arbeit geleistet haben. Ben hat mit deiner hervorragenden Arbeit einen erheblichen Beitrag zur Charakterisierung der Kinaseinhibitoren geleistet, die aus gutem Grund ihren Weg in diese Arbeit und eine gemeinsame Publikation gefunden haben. Scarlett hat mit ihrer Arbeit die Grundlage für Kapitel 5 geschaffen und wird dafür hoffentlich noch mit einer kleinen Publikation belohnt. Die Ergebnisse meiner anderen Studenten sind zwar nicht in diese Dissertation eingeflossen, haben jedoch auch einen nützlichen Beitrag zu meiner Arbeit geleistet.
Vielen Dank auch an meine Kooperationspartner für die interessanten Projekte und gute Zusammenarbeit.
Mein Dank gilt auch dem Sonderforschungsbereich SFB 824 für die finanzielle Förderung meines Promotionsprojekts sowie dem Graduiertenzentrum Weihenstephan der TUM Graduate School fuer die finanzielle Förderung von Tagungsreisen in In- und Ausland.
Mein ganz besonderer Dank gilt all meinen Kollegen am Lehrstuhl, die immer für hilfreiche Diskussionen zu haben sind und jeder auf seine Art zu der fantastischen Atmosphäre am Lehrstuhl beträgt: Hannes, Stefan, Susan, Steffi, Ben, Dominic, Simone, Guillaume, Amin und alle die anderen, au erdem Andrea, Michaela und Andi.
Zu guter Letz möchte ich meiner Familie von ganzem Herzen für ihre fortwährende gro e Unterstützung danken. Ihr seid immer für mich da, glaubt an mich und unterstützt mich in allem was ich mache!

146
147
Curriculum vitae
Personal Details
Address Attachinger Weg 37, 85356 Freising, Germany
Phone +49 160 6352977 (mobile)
E-mail [email protected]
Date of birth 27.07.1984
Place of birth Erlenbach am Main
Civil status single
Professional Experience
Since 03/2010 Doctoral candidate at the Chair of Proteomics and Bioanalytics, Technische Universität München
Thesis in biochemistry under the supervision of Prof. Dr. Bernhard Küster
Quantitative chemical and phosphoproteomics for studying signaling in cancer
Education
04/2009 – 02/2010 Masters thesis at the Chair of Proteomics and Bioanalytics, Technische Universität München
Thesis in biochemistry under the supervision of Prof. Dr. Bernhard Küster
Systematic selectivity profiling of kinase inhibitor drugs by chemical proteomics
10/2007 – 03/2009 Student assistant at the Botany Department, Technische Universität München
10/2004 – 09/2007 Bachelor in Molecular Biotechnology at the Technische Universität München
07/2004 Graduated from Friedrich-Dessauer-Gymnasium in Aschaffenburg