techno-economical study of biogas production improved by steam explosion pretreatment
TRANSCRIPT
Accepted Manuscript
Techno-economical study of biogas production improved by steam explosion
pretreatment
Marzieh Shafiei, Maryam Mohseni Kabir, Hamid Ziluei, Ilona Sárvári Horváth,
Keikhosro Karimi
PII: S0960-8524(13)01362-X
DOI: http://dx.doi.org/10.1016/j.biortech.2013.08.111
Reference: BITE 12310
To appear in: Bioresource Technology
Received Date: 20 June 2013
Revised Date: 16 August 2013
Accepted Date: 19 August 2013
Please cite this article as: Shafiei, M., Kabir, M.M., Ziluei, H., Horváth, I.S., Karimi, K., Techno-economical study
of biogas production improved by steam explosion pretreatment, Bioresource Technology (2013), doi: http://
dx.doi.org/10.1016/j.biortech.2013.08.111
This is a PDF file of an unedited manuscript that has been accepted for publication. As a service to our customers
we are providing this early version of the manuscript. The manuscript will undergo copyediting, typesetting, and
review of the resulting proof before it is published in its final form. Please note that during the production process
errors may be discovered which could affect the content, and all legal disclaimers that apply to the journal pertain.
1
Techno-economical study of biogas production improved by
steam explosion pretreatment
Marzieh Shafiei1, Maryam Mohseni Kabir2, Hamid Ziluei1, Ilona Sárvári Horváth2,
Keikhosro Karimi1
1 Department of Chemical Engineering, Isfahan University of Technology,
Isfahan 84156-83111, Iran
2 School of Engineering, University of Borås, 50190 Borås, Sweden
Corresponding author:
Email: [email protected]
Tel: +983113915623
Fax: +983113912677
2
Abstract
Economic feasibility of steam explosion pretreatment for improvement of biogas production
from wheat straw and paper tube residuals was investigated. The process was simulated by
Aspen plus®, and the economical feasibility of five different plant capacities was studied by
Aspen Process Economic Analyzer. Total project investment of a plant using paper tube
residuals or wheat straw was 63.9 or 61.8 million Euros, respectively. The manufacturing
cost of raw biogas for these two feedstocks was calculated to 0.36 or 0.48 € per m3 of
methane, respectively. Applying steam explosion pretreatment resulted in 13% higher total
capital investment while significantly improved the economy of the biogas plant and
decreased the manufacturing cost of methane by 36%. The sensitivity analysis showed that
5% improvement in the methane yield and 20% decrease in the raw material price resulted
in 5.5 and 8% decrease in the manufacturing cost of methane, respectively.
Keywords: Biogas; Pretreatment; Simulation; Steam explosion; Techno-economical
analysis.
3
1 Introduction
Currently, one of the most important fundamentals for sustainable development is
production of fuels from biomass, as an alternative to fossil fuels. Bioethanol and biogas are
the two common biofuels (Börjesson and Mattiasson, 2008; Klass, 1998). While bioethanol
is currently produced from sugar or starch-containing materials, biogas is produced from
industrial or municipal wastes. The use of sugar or starch based materials for fuel
production has led to a “food vs. fuel” conflict. Therefore, several research and pilot scale
studies were performed using lignocellulosic biomass instead of food driven biofuels.
Lignocellulosic materials have the advantage of being available in very large quantities at
relatively low prices (Saddler, 1993; Taherzadeh and Karimi, 2008a).
The main drawback of using lignocellulosic materials is their rigid structure which is
resistant to enzymatic and microbial attacks. Therefore, a pretreatment step is required to
open up the structure and reduce the crystallinity of lignocelluloses (Taherzadeh and
Karimi, 2008a). Among the pretreatment methods, steam explosion, with or without
addition of a catalyst. This is one of the most thoroughly investigated methods, and it has
been reported to successfully increase the methane yield of different lignocellulosic
materials (Dereix, 2006; Dererie et al., 2011; Take et al., 2006). Steam explosion typically
operates within a temperature range of 160–260 °C for a few seconds to several minutes
(Taherzadeh and Karimi, 2008a; Vivekanand et al., 2013). This method produces low
amounts of waste and consumes moderate amounts of energy (Taherzadeh and Karimi,
2008a).
4
Biogas production from lignocelluloses has several advantages compared to bioethanol
production. Compared to ethanol, the overall energy efficiency is much higher in biogas
production (Murphy and Power, 2009). Furthermore, conversion of lignocellulosic pentoses
to ethanol is one of the obstacles in the process, since the ordinary industrial yeast species
are unable to assimilate pentoses (Karimi and Zamani, 2013). Therefore, one of the best
economical solutions is the assimilation of pentoses in a separate biogas production process
after bioethanol production (Shafiei et al. (2011). However, all suggested processes have
their own difficulties (Taherzadeh and Karimi, 2008b), hence the best solution could be to
produce biogas as the only product from lignocellulosic biomass. The advantage of this
single step process is the simultaneous hydrolysis and biogas production, which can be
applied principally for all types of fermentable materials. The produced biogas can be then
utilized in generation of power and heat, and it can also be upgraded to gaseous vehicle
fuels (Murphy and Power, 2009; Taherzadeh and Karimi, 2008b).
Techno-economical analysis is a useful tool to examine the profitability and performance of
the proposed process by combining process simulation with economic calculation. The
application of techno-economical analysis allows comparing alternative processes and
optimizing the process parameters such as capacity of the plant and composition of the raw
materials. Ekman et al. (2012) and Sassner et al. (2008) proved that steam treatment of
straw, spruce (a softwood), salix (a hardwood), and corn stover is economically feasible for
ethanol production. On the other hand, technical and economical analyses for biogas
production in the Netherland from different wastes showed that biogas production is not
5
economically feasible unless subsidies are provided from the government (Gebrezgabher et
al., 2010). Nevertheless, to our knowledge, there is no reference detected in the literature on
techno-economical processes evaluating lignocellulosic biomass for biogas production.
The current study evaluates the economic feasibility of steam explosion pretreatment
applied for improvement of biogas production from wheat straw and paper tube residuals.
The process was simulated using Aspen Plus® simulation software (Aspen Tech, USA)
based on experimental data provided by previous studies (Bauer et al., 2009; Teghammar et
al., 2010). A process including a continuous pretreatment system combined with solid state
digestion was examined. Economical evaluations were conducted by Aspen PEA (Process
Economic Analyzer). The effects of plant capacity and price of raw materials and
byproducts on the economy of the process were also investigated.
2 Process development
Production of biogas from easily digestible materials is a well-developed technology, and
the solid state technology for utilizing the energy crops such as corn is already used in many
countries, e.g., Germany (Yliopisto, 2009). However, an efficient process for biogas
production from cellulose containing materials which are resistant to biodegradation is still
under development. An overview of a biogas production plant from paper tube residuals and
wheat straw using steam explosion pretreatment is presented in Fig. 1. The process includes
feedstock handling, steam explosion pretreatment, and anaerobic digestion. In order to
provide steam and electricity, it is assumed that the plant is located close to an existing
6
power plant, and the byproducts, i.e., steam and solid residues as a fuel, considered as
valuable by-products in the main plant.
2.1 Plant size and feedstocks
Lignocellulosic wastes, e.g., straw, wood chips, paper residues, and grass as well as forest
and agricultural residues, can supply as the most abundant raw materials (Lin and Tanaka,
2006). The average of 5 year production of barely, oat and wheat in Sweden is 1.5, 0.7 and
2.3 million tons, respectively (FAO, 2013). The amount of produced straw is 1-1.2 fold of
the weight of these cereal grains. This amount is cultivated in the estimated area of 914,000
hectares.
Choosing the correct capacity for a plant depends on several parameters including
availability of raw materials, technical bottle necks, transportation costs for both raw
materials and products, as well as market demands for the products. In recent studies, the
capacity of plants for production of biogas (Murphy and Power, 2009) and bioethanol (Aden
and Foust, 2009; Aden et al., 2002; Ekman et al., 2012; Lohrasbi et al., 2010; Shafiei et al.,
2011) was selected to treat raw materials within the range of 100,000 to 600,000 tons
annually. An example of using lower capacity is found in a study evaluating the production
of biogas in the Netherlands using 70,000 ton/year of farm originated wastes. However, this
study showed that the process is not economically feasible unless subsidies are provided
from the government (Gebrezgabher et al., 2010). Therefore, a plant with a capacity of
200,000 ton/year of raw material (dry basis) was chosen as a base case for the present
investigations, which is similar to the one used in a previous study evaluating bioethanol
7
production from wood in Sweden (Shafiei et al., 2011). Furthermore, different capacities
ranging from 50,000 to 600,000 tons/year were also evaluated. It was assumed that the plant
would be in full operation for 8,000 h/year (Shafiei et al., 2011).
An important aspect in the choice for the capacity of a plant is the availability and
transportation cost of raw materials. The required amount of straw for the base case is only
4% of the total amount of produced straw in Sweden. In the case of paper tube residuals, the
required amount for the biogas plant is less than half of the total amount of collected paper
from households in Sweden, which is 383,000 tons (Weine, 2012). However, in Sweden,
besides recycled paper from households, recycling companies collect paper with different
qualities from industries too (STENA, 2013). This recycled paper can also serve as another
source for further biogas production.
In this study, the raw materials were considered for a plant with a single feedstock, and the
manufacturing cost was evaluated; however, running a plant with only one type of raw
material is practically questionable. Therefore, the design of the plant should be flexible
enough, so that primarily a raw material with higher profitability is used and the more
expensive raw material will only be used when the other one is not sufficient.
The composition of raw materials was defined based on previous experimental data (Bauer
et al., 2009; Teghammar et al., 2010). Moisture content of paper tube residuals and wheat
straw was 5% and 15%, respectively. Major components of paper tube residuals were 23%
8
lignin, 60% cellulose, and 17% hemicellulose. Wheat straw contained 50% cellulose, 27%
hemicellulose, and 23% lignin.
2.2 Feedstock handling and pretreatment unit
After transportation of the raw materials to the plant, they are weighed and unloaded from
truck trailers. The received materials are reduced in size as a preliminary treatment, and then
dumped into storage piles. Conveyor belts are used for transporting the materials to a
continuous pretreatment system. The pretreatment process modifies the structure of the
cellulose, lignin, and hemicellulose. Thus, the carbohydrate bonds can be easily exposed by
the hydrolytic bacteria during the following anaerobic digestion process (Taherzadeh and
Karimi, 2008a). The pretreatment method is based on a steam explosion process developed
by Aden et al. (2002). This process was used for pretreatment of corn stover for
improvement of ethanol production. In this pretreatment unit, the feedstock is conveyed to a
pre-steamer. The pre-steamer is a horizontal vessel which is fed with variable frequency
drive set of screw conveyors. Low pressure steam is injected to the pre-steamer which
increases the temperature to 100°C and removes the non-condensable gases. Screw
conveyors are used for discharging the preheated materials to a flash vessel as well as for
discharging the material from the flash vessel to a continuous pretreatment reactor. This
reactor is a high pressure horizontal extruder using steam as a motive force. High pressure
steam is used to increase the pressure (Aden et al., 2002). Since continuous process is used
for the pretreatment, the retention time for heating-up to the desired temperature would be
reduced, two minutes residence time was therefore assumed for the treatment.
9
2.3 Biogas production
The pretreated materials are subjected to the biogas production unit where solid state
digestion is used for biogas production based on the technology presented by DRANCO
(Germany). This technology is a well-established and reliable technology used for treatment
of solid organic wastes. Each digester has 3150 m3 volume, and the retention time of the
materials in the reactor is 2 to 4 days. The overall residence time before the materials are
fully digested is about 20 days (Baere, 2010). The digesters are continuous vertical plug
flow reactors with cone bottom shape. The semi-digested materials are extracted from the
middle of the digester by screw pumps, and mixed with the pretreated materials at ratio of
about 5:1 and then returned to the top of the digester. Gravity is the driving force for
movement of the solids toward the bottom of the digester. The fully digested materials are
extracted from the bottom of the digester and sent to the dewatering unit (Baere, 2010).
2.4 Process simulation and economic calculations
Mass and energy balances were calculated for the process (Fig. 1 and 2) using the Aspen
Plus® program. This software was chosen because of its high ability to handle solid state
materials. This feature together with its broad property data base makes this software the
best tool for simulation, design, and optimization of the processes (Aspen-Tech, 2013). The
results of rigorous evaluations, using detailed equipment models, are presented in Table 1
and 2. A data bank prepared by NREL (National Renewable Energy Laboratory, USA)
(Wooley and Putsche, 1996) for the calculation of physical and thermodynamic properties
of biomass components was introduced to Aspen Plus®.
10
In the next step, Aspen PEA was used for the economical evaluations. Key features in
Aspen PEA include interactive equipment sizing to determine operating costs and
investment analysis as well as automatic generation of block and process flow diagrams. It
also has interfaces to all major process simulation tools, including Aspen Plus (Aspen-Tech,
2013). Based on the results from simulation, the sizes of equipments were calculated using
Aspen Plus® or Aspen PEA, and then the costs of all major equipments were estimated
using Aspen PEA. The main equipments were crusher, flash vessels, conveyor belts, biogas
digester, belt press, pumps, vessels, and heat exchangers as well as auxiliary equipments
including piping, insulation, electrical equipment, and instrumentation. The costs for
pretreatment vessels were calculated according to an NREL report (Aden et al., 2002). The
main assumptions for all process scenarios are as follows:
The plant capacity is 200,000 tons/year of raw materials (based on dry weight).
The plant is located in Sweden.
Cost indexes at 2013 are used for equipments, chemicals, and labor costs estimations.
Straight line depreciation for 7 years with zero salvage value was used for calculation
of the plant depreciation.
The project is one hundred percent equity financed.
In the project investment, 15% contingency was considered.
The construction period is 64 weeks followed by 40 weeks start-up period.
Working capital is based on 5% of the total investment cost.
The desired internal rate of return in the process is 10%.
Project life is 15 years.
11
Operating supplies and laboratory charges are respectively 18% and 15% of the
operating labor cost.
Taxation rate value is 30%.
These values were chosen based on the data available in the literature (Peters and
Timmerhaus, 1991; Turton et al., 2009). The prices of the raw materials and products are
presented in Table 3. The cost for production of methane was calculated based on the total
capital investment of the project and the annual operating costs. A discounted cash flow
analysis was used to evaluate the payback period of the plant.
2.5 Sensitivity analysis
The plant capacity affects the manufacturing cost as well as the total capital investment.
Therefore, plant capacities ranging from 50,000 to 600,000 tons/year of dry raw material
were evaluated using Aspen PEA program and compared with the base case (200,000
tons/year). In order to investigate the effect of pretreatment on the economy of the process,
simulation and economic evaluation for a plant without a pretreatment unit were also
conducted. Quality and type of feedstock as well as transportation costs of feedstock may
affect the manufacturing cost of the product. Thus, a sensitivity analysis was performed to
investigate the effect of feedstock price on the manufacturing cost. Changes in the
manufacturing cost with respect to other required materials and to the byproduct’s prices
were also evaluated.
12
3 Results and Discussion
The economic feasibility of biogas production from wheat straw and paper tube residuals
improved by steam explosion pretreatment was studied. For this purpose, the process was
simulated using Aspen Plus® and the economical evaluation was performed by Aspen PEA.
3.1 Pretreatment process
The block flow diagram and process flow diagram of the steam explosion process for
production of biogas are presented in Figs 1 and 2, respectively. Based on the simulation
results (Fig. 2) and capacities suggested by Aden et al (2002), two identical units for
unwrapping and preparation of the raw materials are required. The amounts of material to
feed each unit were calculated to 26.3 and 29.4 ton/h for paper tube residuals and wheat
straw, respectively. Each of these units has bale unwrap and shredder feed conveyor, truck
scale, and truck unloading forklift, bale moving forklift, shredder, and magnetic separator.
Pretreatment temperatures of 180 and 190 °C are considered for pretreatment of wheat straw
and paper tube residuals , respectively (Bauer et al., 2009; Teghammar et al., 2010). After
pretreatment, 7-8% of the hexosan and 50% of the pentosan are hydrolyzed to their
corresponding monomers (Tables 1 and 2). The heat loss from the reactor was not accounted
in the energy balance calculations (Aden et al., 2002). Based on the simulation results, three
identical units for pretreatment consisting of pre-hydrolysis equipments, screw reactor
cyclone, conveyor belts and expansion tanks are required. Each of these units has the
capacity of 37.3 ton/h.
13
After completion of the pretreatment, the material is conveyed to an expansion tank. The
tank is a cyclone with atmospheric pressure in which over 90% of the steam used for heating
is recovered as a vapor. Beside major changes in the structure of cellulose, a portion of
holocellulose is converted to glucose and xylose monomers and then degrades to
hydroxymethylfurfural (HMF) and furfural. About 70% of the furans are separated from the
pretreated solid and moved to the vapor phase (Aden et al., 2002). This steam is a low
pressure steam contains over 98% water; however, presence of furans decreases its value
compared to pure low pressure steam. The pretreated materials contain less than 0.05% of
furans.
Based on the simulation results, the moisture content of the raw material as well as the
amount of water added to the feedstock prior to the pretreatment are key factors that affect
the amount of steam required for the pretreatment. The amount of water and steam used in
the pretreatment process affects the size of the pretreatment equipment as well as the size of
the expansion tank. Therefore, in the simulation, the amounts of water and low pressure
steam are calculated in such a way that the preheated materials would contain 30% total
solids in all cases. For paper tube residuals with 5% moisture content, 108 and 59 kton/year
water and low pressure steam were required, whereas these amounts for wheat straw
(containing15% moisture) were 81.7 and 61.4 kton/year, respectively (Tables 1 and 2). The
pretreated material contained 70% moisture when they were fed to the digesters.
14
3.2 Biogas production
The biogas digester was also simulated by Aspen plus® and the amount of produced
methane was calculated by the program. Totally, fifteen digesters with 3150 m3 capacity
containing all auxiliary equipments as well as feed pumps and screw pumps are required.
The input flow rate to each digester is 6.1 ton/h. A package for supplementation of nutrients
and control of pH was considered in the biogas production unit. The solid residue from the
digesters is dewatered and contains 30% dry matter. This residue mainly consists of lignin
(75% of dry weight) which remains intact during the digestion process and is considered as
a valuable byproduct for production of heat.
The most important advantage of solid state biogas production is less digester volume
required. Another advantage of this technology is the production of no or limited amount of
excess wastewater (Baere, 2010). The results from simulation have shown that the process
can run with 100% water recycling. The water inside the solid residue (70%) contains
excess soluble materials which will be purged from the process. Furthermore, the furans are
flashed out from the process in the pretreatment unit.
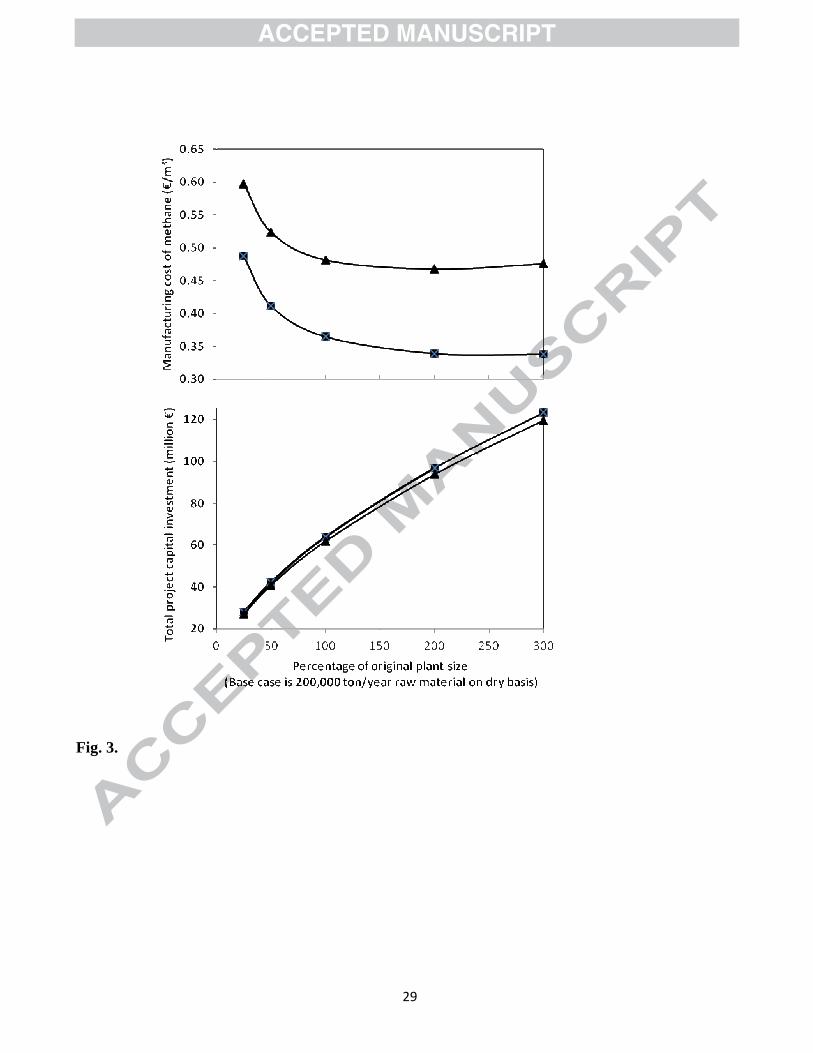
3.3 Total project investment and manufacturing costs
Five different plant sizes were analyzed for the total project investment as well as for the
manufacturing cost of the methane from the pretreated materials. Total project investment
for a biogas production plant with 200,000 tons/year of dry paper tube residuals and wheat
straw as feedstocks was calculated to be 63.9 and 61.8 million Euros, respectively, and the
corresponding manufacturing cost of methane was 0.36 and 0.48 €/m3 of methane (or 0.18
15
and 0.23 €/m3 of biogas). Investments for feedstock handling, pretreatment, and biogas
production units were contributed to 5, 13, and 82% of the total project investment,
respectively. Additionally, 0.10-0.21 €/m3 and 0.10 €/m3 are suggested to be able to cover
the costs for upgrading and pressurizing the raw biogas, respectively (Yliopisto, 2009).
Therefore, the manufacturing cost of pressurized methane from paper tube residuals and
wheat straw would be 0.56-0.67 €/m3 and 0.68-0.79 €/m3, respectively. These results are
comparable with the results of other studies producing biogas from easily degradable raw
materials. The price for upgraded and pressurized biogas from organic waste was reported to
be 0.55- 0.65 €/m3, while the price for biogas production using energy crops was 0.53-0.74
€/m3 (Mårtensson, 2007). The cost of biogas from energy crops were estimated to be 0.68-
0.85 €/m3 including addition of 0.16-0.27 €/m3 for the gas distribution.
In Table 4, comparison of some biogas production processes and their yearly profits are
presented. Yearly profit was defined according to the following equation:
(1)
The yearly profit were 0.27 and 0.14 (€/€.year) for paper tube residuals and wheat straw in
the current work (Table 4). In another study, the price for the production of biomethane
utilizing wheat grains and other crops in Ireland were estimated to be 0.83-0.90 €/m3;
however, this manufacturing price was not low enough to be economically feasible (Murphy
and Power, 2009). The yearly profit for the process presented by Tricase and Lombardi
(2009) was 0.13( €/€.year), while this value was 0.2 ( €/€.year) only if governmental support
is available for the process presented by Gebrezgabher et al (2010).
16
The results of changes in manufacturing and total project investment’s cost for different
biogas plant sizes using paper tube residuals or wheat straw as feedstock are presented in
Fig. 3. Although the total project investment for both of these substrates were in the same
order, the manufacturing costs of methane from wheat straw was higher than that from
paper tube residuals, due to the higher price of the raw material in the case of wheat straw.
However, there might be limitations in availability of paper tube residuals; thus,
construction of a flexible plant with ability to use several types of raw materials is
inevitable. On the other hand, the price of the feedstock for plants with 2 and 3 folds
capacities compared with the base case was increased by 10 and 20%, respectively, because
of the increase in the transportation cost. As a result of this increase, the manufacturing cost
of methane for plants with 3 fold capacity using wheat straw as a raw material showed a
slight increase. The total project investment required for a plant does not increase linearly
with the plant size, but is believed to increase according to the “six-tenth” rule (Turton et al.,
2009). Total project investments for plants with different capacities were calculated by
Aspen PEA (Figure 3). Generally, a plant with larger size requires less investment per each
unit of product. Therefore, larger plants are more economically feasible unless technical or
logistical problems occur. However, there are some limitations that should be considered
here, e.g., technical bottle necks, availability of raw materials, transportation costs for both
raw materials and products, and market demands for the products.
In the construction of the plant, 42% of the fixed capital investment (FCI) is attributed to the
purchased equipment cost. In biogas production plants, large size for digesters are required
17
in order to provide sufficient retention time for the materials, and beside the costs for the
equipments, the civil costs of the digesters is also high (10% of FCI). Moreover, since a
biogas production plant using lignocellulosic materials with the pretreatment is not a proven
technology yet, 15% of FCI was chosen for the contingencies and unpredicted charges. The
rest of the FCI is attributed for piping, instrumentation, electrical works, painting, contract
fee, and general and administrator over heads.
The total project investment for a plant without a pretreatment unit was 56.4 million Euros.
The average annual production of methane from these feedstocks and in the base case (i.e.,
200,000 tons/year capacity) was 70.5 million Nm3; however, if no pretreatment is used, this
amount reduces to 36.8 million Nm3/year. Although the total operating costs for
pretreatment and steam requirement are reduced from the methane manufacturing cost, it
will still increase to 0.56 €/m3 when pretreatment is not introduced. Thus, the results showed
that while the application of a pretreatment unit requires 13% increase in the total capital
investment, it reduces the manufacturing cost of the produced methane by 35.7%.
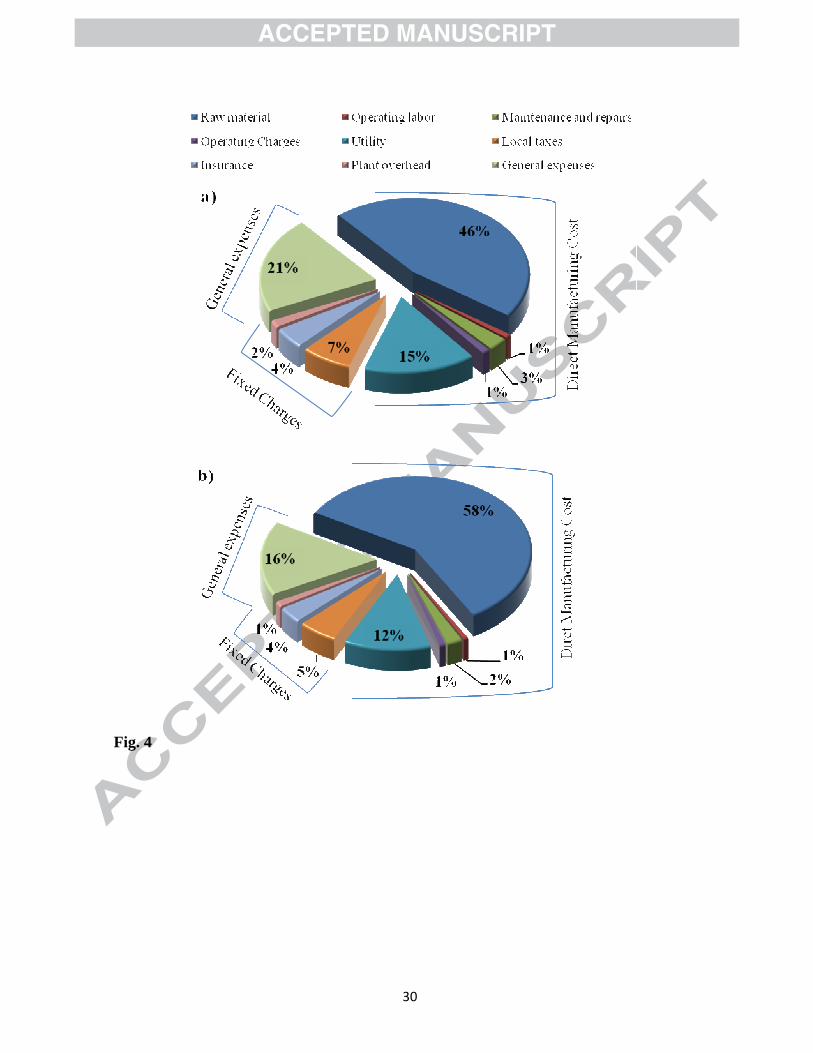
3.3.1 Cost distribution
Total manufacturing cost from paper tube residuals and wheat straw was 24.1 and 32.4
million €, respectively. These numbers were calculated by considering the credit of low
pressure steam and solid residue as byproducts of the pretreatment. The respective values
for the credit of by products were -1.20 and -1.54 million €. Figure 4 shows the breakdown
of the methane manufacturing cost. The most significant fraction of this cost is attributed to
the raw materials, mainly to the cost of lignocellulosic substrate. Utility cost, mainly due to
18
the consumption of high pressure steam, is the second highest cost within the manufacturing
cost for the process.
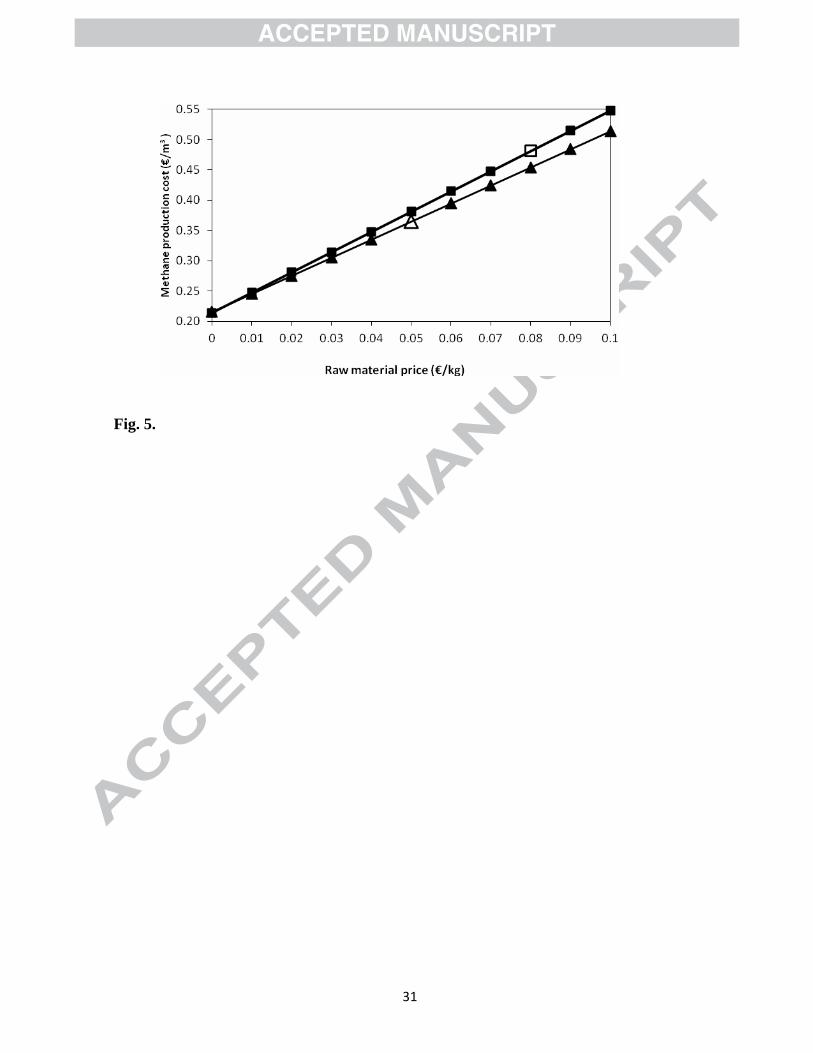
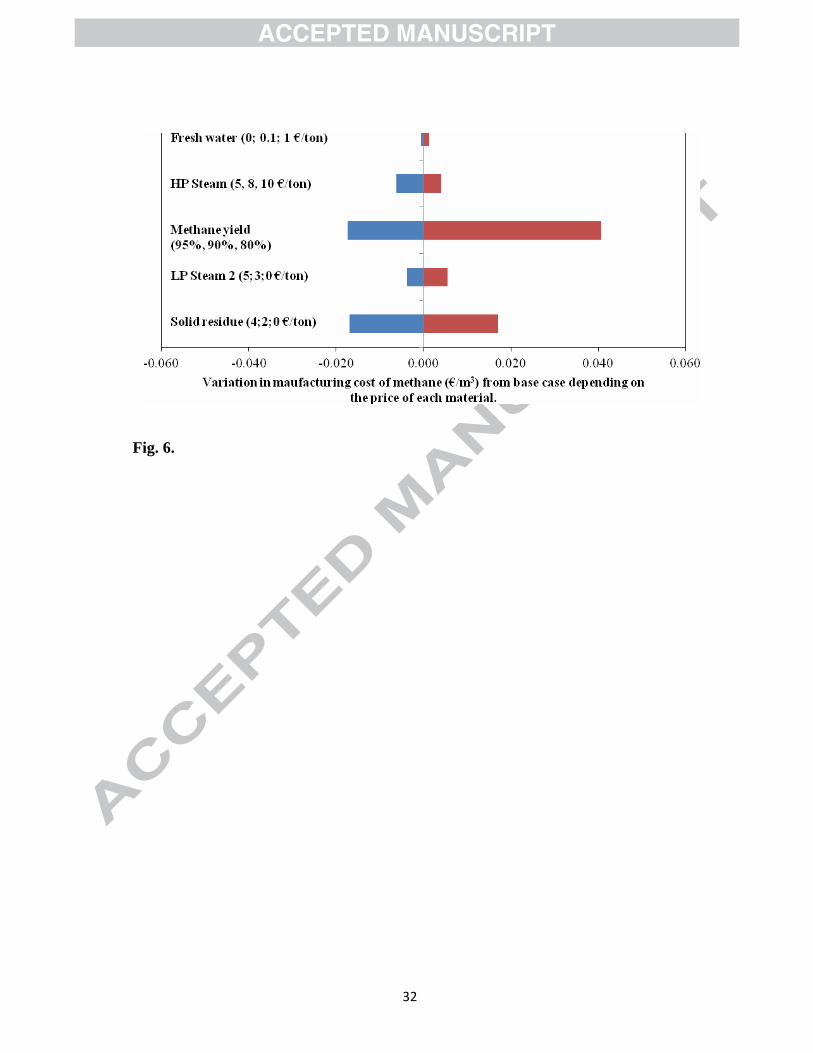
3.3.2 Sensitivity analysis
Effect of feedstock price on the manufacturing cost of methane was evaluated and is
presented in Fig. 5. Furthermore, effect of prices for fresh water and high pressure steam
(HPS) as well as low pressure steam (LPS) and solid residue as products was also
investigated (Fig. 6). Moreover, effect of methane production yield on the manufacturing
cost of methane is presented in Fig. 6. The results of sensitivity analysis showed that
manufacturing cost was highly sensitive to the price of the cellulosic raw material. For
instance, 20% decrease in the price of these raw materials resulted in 7-8% reduction in the
manufacturing cost of methane, whereas the price of other raw materials used in the process
does not highly affect the manufacturing cost of the produced methane. This is in line of
previous studies (Murphy and Power, 2009). Furthermore, the yield of methane production
is a critical parameter affecting the economy of the process, whereas the value of the
additional byproducts has a minor effect on the profitability. When the yield improved from
90% to 95%, the manufacturing cost increased by 5.5%. Yield of methane production is
directly related to the amount of cellulose and hemicellulose in the raw materials as well as
the process operation conditions. Further development for purification and utilization of
furfural and HMF as valuable byproducts of the process can improve the profitability, and
as a result providing a clean steam free from the chemical contaminations, which can be
reused in the process.
19
By selling the raw methane for 0.42 and 0.53 €/m3 from paper tube residuals and wheat
straw, respectively, the payback period of the plant would be 5 years. Accordingly, when the
selling price increases to 0.45 and 0.57 €/m3, the payback period would be 3 years.
3.3.3 Energy balance
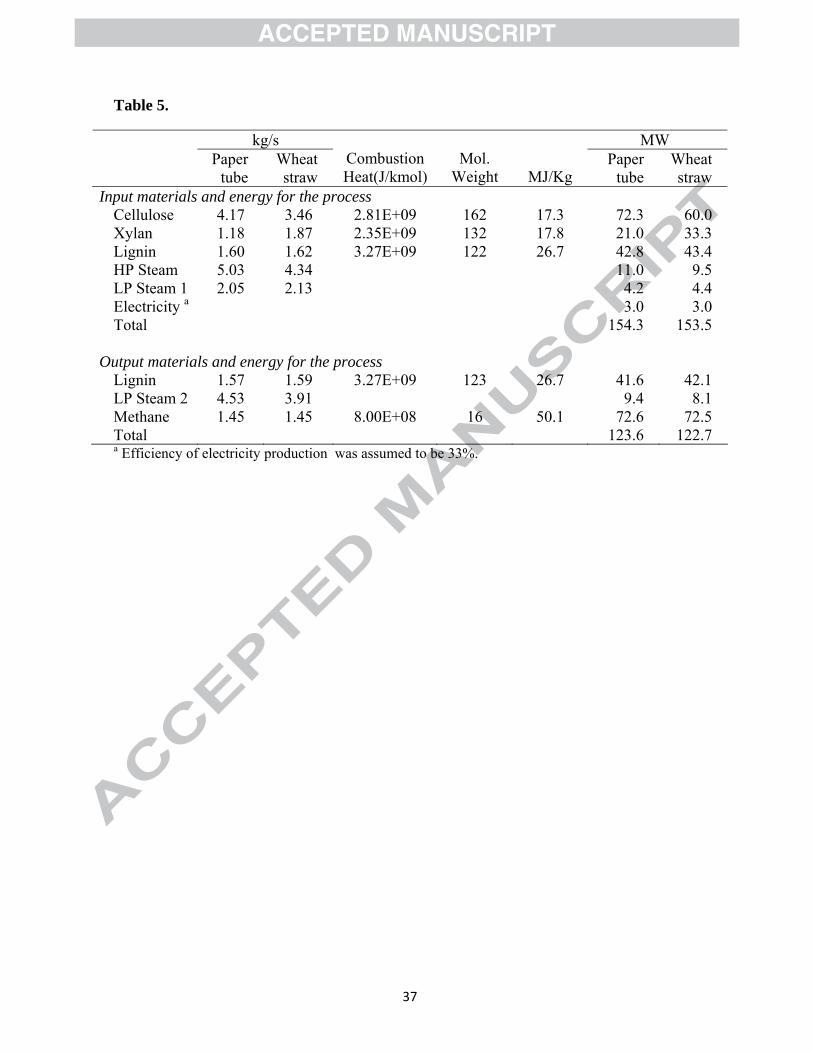
Energy efficiency was calculated by dividing energy outputs with the energy inputs of the
process (Sassner et al., 2008) (Table 5). The energy is produced in forms of methane, solid
residues, and low pressure steam. The energy input includes steam and electricity
requirements of the process as well as the energy available in the raw materials. The energy
balance of the plant is presented in Table 5. Total energy input of the base case is 153.9±0.4
MW. Total energy output is 123.1±0.5 MW in the form of lignin, low pressure steam, and
methane (Table 5). Therefore, total energy efficiency of the process is 80%. In another
study, it was shown that the energy efficiency of a biorefinery for production of bioethanol
and biogas from spruce wood was 79% (Shafiei et al., 2011). Furthermore, it was shown
that the overall energy efficiency of biogas production is much higher than that of ethanol
production (Murphy and Power, 2009). The total required energy for the processes utilizing
paper tube residues and wheat straw were 18.2 and 16.9 MW, respectively, which were 25%
and 23% of the fuel energy of the produced methane (72.6 and 72.5 MW) (Table 5).
Therefore, it can be concluded that methane production by the process evaluated in this
study can be a promising and economically feasible alternative for renewable energy
production.
20
4 Conclusions
This study shows that steam explosion pretreatment of wheat straw and paper tube residuals
can significantly improve the economy of biogas production plants. The sensitivity analysis
shows that the methane yield and the raw material price were the most important parameters
affecting the manufacturing cost.
References
1. Aden, A., Foust, T., 2009. Technoeconomic analysis of the dilute sulfuric acid and
enzymatic hydrolysis process for the conversion of corn stover to ethanol. Cellulose.
16, 535-545.
2. Aden, A., Ruth, M.I., bsen, K., Jechura, J., Neeves, K.S., heehan, J., et al., 2002.
Lignocellulosic biomass to ethanol process design and economics utilizing co-
current dilute acid prehydrolysis and enzymatic hydrolysis for corn stover,
NREL/TP-510-32438. National Renewable Energy Laboratory. US Department of
Energy Laboratory.
3. Aspen-Tech, 2013. Optimize design and operations with AspenONE Engineering,
(http://www.aspentech.com/products/aspenone-engineering/), [Accessed
10/08/2013].
4. Baere, L.D., 2010. The Dranco technology: A unique digestion technology for solid
organic waste,
(http://www.ows.be/pages/index.php?menu=89&submenu=145&choose_lang=EN),
[Accessed 07/06/2013].
21
5. Bauer, A., Bosch, P., Friedl, A., Amon, T., 2009. Analysis of methane potentials of
steam-exploded wheat straw and estimation of energy yields of combined ethanol
and methane production. J. Biotechnol. 142, 50-5.
6. Börjesson, P., Mattiasson, B., 2008. Biogas as a resource-efficient vehicle fuel.
Trends Biotechnol. 26, 7-13.
7. Dereix, M., Parker, W. and Kennedy, K, 2006. Steam-explosion pretreatment for
enhancing anaerobic digestion of municipal wastewater sludge. Water Environ. Res.
78, 474-485.
8. Dererie, D.Y., Trobro, S., Momeni, M.H., Hansson, H., Blomqvist, J., Passoth, V., et
al., 2011. Improved bio-energy yields via sequential ethanol fermentation and biogas
digestion of steam exploded oat straw. Bioresour. Technol. 102, 4449-4455.
9. Ekman, A., Wallberg, O., Joelsson, E., Börjesson, P., 2012. Possibilities for
sustainable biorefineries based on agricultural residues – A case study of potential
straw-based ethanol production in Sweden. Appl. Energy. 102, 299-308.
10. FAO, 2013. FAOSTAT, , Food and Agriculture Organization of The United Nations,
(http://faostat.fao.org/site/567/DesktopDefault.aspx?PageID=567#ancor),[Accessed
14/06/ 2013].
11. Gebrezgabher, S.A., Meuwissen, M.P.M., Prins, B.A.M., Lansink, A.G.J.M.O.,
2010. Economic analysis of anaerobic digestion—A case of Green power biogas
plant in The Netherlands. NJAS - Wagening J. Life Sci. 57, 109-115.
12. Karimi, K., Zamani, A., 2013. Mucor indicus: Biology and industrial application
perspectives: A review. Biotechnol. Adv. 31, 466-481.
22
13. Klass, D.L., 1998. Biomass for Renewable Energy, Fuels, and Chemicals. Academic
Press.
14. Lin, Y., Tanaka, S., 2006. Ethanol fermentation from biomass resources: current
state and prospects. Appl. Microbiol. Biotechnol. 69, 627-642.
15. Lohrasbi, M., Pourbafrani, M., Niklasson, C., Taherzadeh, M.J., 2010. Process
design and economic analysis of a citrus waste biorefinery with biofuels and
limonene as products. Bioresour. Technol. 101, 7382-8.
16. Mårtensson, E., 2007. Biogas as vehicle fuel in the Stockholm region – Scenario
2020. in: Chemical Engineering and Technology, Vol. Master Degree Thesis, the
Royal Institute of Technology (KTH), Sweden.
17. Murphy, J.D., Power, N., 2009. Technical and economic analysis of biogas
production in Ireland utilizing three different crop rotations. Appl. Energy. 86, 25-
36.
18. Odhner, P.B., Horváth, I.S., Kabir, M.M., Schabbauer, A., 2012. Biogas from
lignocellulosic biomass. Svenskt Gastekniskt Center,
(http://www.sgc.se/ckfinder/userfiles/files/SGC247.pdf).
19. Peters, M.S., Timmerhaus, K.D., 1991. Plant design and economics for chemical
engineers. Fourth ed. McGraw Hill international editions.
20. Saddler, J.N., 1993. Bioconversion of Forest and Agricultural Plant Residues:
Biotechnology in Agriculture, Vol. 9, CAB International. Wallingford, UK.
21. Sassner, P., Galbe, M., Zacchi, G., 2008. Techno-economic evaluation of bioethanol
production from three different lignocellulosic materials. Biomass Bioenergy. 32,
422-430.
23
22. Shafiei, M., Karimi, K., Taherzadeh, M.J., 2011. Techno-economical study of
ethanol and biogas from spruce wood by NMMO-pretreatment and rapid
fermentation and digestion. Bioresour. Technol. 102, 7879-86.
23. STENA, 2013. Recovered paper, (http://stenarecycling.se/en/All-types-of-
waste/RECOVERED-PAPER/), [Acceeed: 06/06/2013].
24. Taherzadeh, M., Karimi, K., 2008a. Pretreatment of lignocellulosic wastes to
improve ethanol and biogas production: A review. Int. J. Mol. Sci. 9, 1621-1651.
25. Taherzadeh, M.J., Karimi, K., 2008b. Bioethanol: market and production processes.
in: A. Nag, Biofuels refining and performance, Mc Graw Hill, pp. 69-106.
26. Take, H., Andou, Y., Nakamura, Y., Kobayashi, F., Kurimoto, Y., Kuwahara, M.,
2006. Production of methane gas from Japanese cedar chips pretreated by various
delignification methods. Biochem. Eng. J. 28, 30-35.
27. Teghammar, A., Yngvesson, J., Lundin, M., Taherzadeh, M.J., Horváth, I.S., 2010.
Pretreatment of paper tube residuals for improved biogas production. Bioresour.
Technol. 101, 1206-1212.
28. Tricase, C., Lombardi, M., 2009. State of the art and prospects of Italian biogas
production from animal sewage: Technical-economic considerations. Renew. Energ.
34, 477-485.
29. Turton, R., Bailie, R.C., Whiting, W.B., 2009. Analysis, synthesis, and design of
chemical processes. Third ed. Prentice Hall, Upper Saddle River.
30. Vivekanand, V., Olsen, E.F., Eijsink, V.G., Horn, S.J., 2013. Effect of different
steam explosion conditions on methane potential and enzymatic saccharification of
birch. Bioresour. Technol. 127, 343-9.
24
31. Weine, W., 2012. Svensk avfallshantering Avfall Severige,
(http://www.avfallsverige.se/fileadmin/uploads/Rapporter/Utveckling/Rapporter_20
12/SAH_2012.pdf), [Accessed 01/06/2013].
32. Wooley, R.J., Putsche, V., 1996. Development of an Aspen Plus® physical property
database for biofuels components, NREL/MP-425-20685. National renewable
energy laboratory, US Department of Energy Laboratory.
33. Yliopisto, J., 2009. Evaluation of potential technologies and operational scales
reflecting market needs for low-cost gas upgrading systems. Seventh framework
program theme energy, Biowaste as feedstock for 2nd generation,
(http://www.valorgas.soton.ac.uk/deliverables.htm).
25
Figure Captions
Fig. 1. Block flow diagram of the process for biogas production from lignocellulosic raw materials using
steam explosion pretreatment
Fig. 2. Simplified process flow diagram for biogas production from lignocellulosic raw materials
improved by a steam explosion pretreatment step.
Fig. 3. Variation of the total project investment as well as manufacturing cost of methane with the
project capacity when paper tube residuals ( ) and wheat straw (▲) are pretreated by steam explosion
prior to anaerobic digestion.
Fig. 4. Breakdown of manufacturing cost of methane from paper tube residuals (a) and wheat straw (b).
Fig. 5. Effect of raw material price on manufacturing cost of methane from paper tube residuals
(triangles) and wheat straw (squares). For each raw material the base case is presented by empty points.
Fig. 6. Effect of prices for fresh water, high pressure steam (HPS), low pressure steam (LPS), and solid
residue price as well as the methane production yield on the manufacturing cost of methane from
pretreated paper tube residuals (colored bars), wheat straw (empty bars). Methane price for base case is
0.36 €/Nm3 of methane for paper tube residuals and 0.48 €/Nm3 of methane for wheat straw.
Table Captions
Table 1. Stream components in the process presented on Fig. 1. using paper tube residuals as feedstock.
Table 2. Stream components in the process presented on Fig. 1. using wheat straw as feedstock.
Table 3. Prices used in the economical evaluation for the raw materials and for the products.
Table 4. Comparison of results obtained during the current work results with results from similar
studies.
Table 5. Energy requirements for the process utilizing 200,000 tons/year raw material.
HPSteam
Pretreated MaterialsRaw Materials
Anaerobic DigestionFeedstock Handling
2
LP Steam 1
Water
8Pretreatment1
37
Biogas
Solid Residue
Water Recirculation
4
LP Steam 2
5
Nutrients
6
Fig. 1.
Figure 1
28
Fig. 2.
29
Fig. 3.
30
Fig. 4
31
Fig. 5.
32
Fig. 6.
33
Table 1.
Component Mass fraction 1 2 3 4 5 6 7 8
Water 0.050 1.000 1.000 1.000 0.996 0.713 0.095 0.701 Hexoses - - - - - 0.013 - - Pentoses - - - - - 0.024 - - Hexosan 0.570 - - - - 0.151 - 0.028 Pentosan 0.162 - - - - 0.024 - 0.004 Lignin 0.218 - - - - 0.061 - 0.224
Methane - - - - - - 0.242 - CO2 - - - - - - 0.663 -
Biomass - - - - - 0.011 - 0.041 Othera - - - - 0.004 0.003 - 0.002 Total
(Kton/year) 210.5 108.0 59.0 145.0 149.5 737.7 172.7 200.3 aOther components are mainly furfural, hydroxymethyl furfural and solubilized lignin
34
Table 2.
Component Mass fraction 1 2 3 4 5 6 7 8
Water 0.150 1.000 1.000 1.000 0.993 0.715 0.095 0.702 Hexoses - - - - - 0.010 - - Pentoses - - - - - 0.037 - - Hexosan 0.423 - - - - 0.125 - 0.023 Pentosan 0.229 - - - - 0.038 - 0.007 Lignin 0.198 - - - - 0.061 - 0.225
Methane - - - - - - 0.242 - CO2 - - - - - - 0.663 -
Biomass - - - - - 0.011 - 0.041 Othera - - - - 0.007 0.003 - 0.002 Total
(Kton/year) 235.3 81.7 61.4 125.0 128.8 743.5 172.5 202.1 a Other components are mainly furfural, hydroxymethyl furfural and solubilized lignin
35
Table 3.
Materials Price (€/kg)
Raw materials
Fresh water 0.0001a
Wheat straw 0.08b Paper tube 0.05b High pressure steam 0.008c Low pressure steam 0.004c Nutrients/ pH control materials 0.6d
Products Steam 0.003e Solid fuel 0.02f
a Data from Turton et al (2009) corrected by cost index of 2013. b Data from Odhner et al (2012). c Data from Peters and Timmerhaus (1991) corrected by cost index of 2013. d Data from Lohrasbi et al (2010). e Estimated based on the data for low and high pressure steam. f Estimated based on the data from Shafiei et al (2011).
36
Table 4.
Raw materials Pretreatment Biogas
production
Total Capital
Investment
(M€)
Capacity
of raw
material
Production cost Yearly profit
(€/€.year)
Paper tube 63.9 0.56-0.67 b,c 0.27 e Base case
Wheat straw
Steam
explosion
Solid state
fermentation 61.8 200 ktpy a
0.68-0.79 c,d 0.14 e
Wheat, sugar beet yes 205.6 988 ktpy a 0.9 c Murphy and
Power (2009) Wheat yes
Solid state
fermentation 220.3 714 ktpy a 0.84 c
Not
profitable f
Tricase and
Lombardi
(2009)
Animal sewage +
co-substrates no Conventional 0.237
5000 m3
1000 m3
43 kW electricity +
1295 GJ/year heat
38,868 €/year Total
cost
0.13
Gebrezgabher
et al. (2010)
Animal manure +
energy maize +
other
no Conventional
6.7 (for all
additional
units to an
existing plant)
70 ktpy a Electricity sales:
900,000 €/year.
Not
profitable
(0.2 if
subsidies are
provided) a ktpy: kilo ton per year. b The production cost of raw biogas is 0.18 €/m3 of biogas (or 0.36 €/m3 of methane). c Upgraded and pressurized methane. d The production cost of raw biogas is 0.23 €/m3 of biogas (or 0.48 €/m3 of methane). e The calculation are based on selling raw biogas at the price of 0.57 €/m3 of methane. f The project was not profitable with selling the pressurized methane at price of 1€/m3.
37
Table 5.
kg/s MW
Paper
tube Wheat straw
Combustion Heat(J/kmol)
Mol. Weight MJ/Kg
Paper tube
Wheat straw
Input materials and energy for the process Cellulose 4.17 3.46 2.81E+09 162 17.3 72.3 60.0 Xylan 1.18 1.87 2.35E+09 132 17.8 21.0 33.3 Lignin 1.60 1.62 3.27E+09 122 26.7 42.8 43.4 HP Steam 5.03 4.34 11.0 9.5 LP Steam 1 2.05 2.13 4.2 4.4 Electricity a 3.0 3.0 Total 154.3 153.5
Output materials and energy for the process Lignin 1.57 1.59 3.27E+09 123 26.7 41.6 42.1 LP Steam 2 4.53 3.91 9.4 8.1 Methane 1.45 1.45 8.00E+08 16 50.1 72.6 72.5 Total 123.6 122.7 a Efficiency of electricity production was assumed to be 33%.
38
39
Highlights
The economy of steam explosion pretreatment for biogas production was studied.
Aspen plus and Aspen Process Economic Analyzer was used for the evaluation.
Total energy efficiency of the process is calculated to 80%.
Production cost of methane from wheat straw and paper tube was 0.36-0.48 €/m3.
The production cost of methane decreased by 36% using the pretreatment.