technological advance, social fragmentation and welfare
TRANSCRIPT

8842 2021
January 2021
Technological Advance, Social Fragmentation and Welfare Steven J. Bosworth, Dennis J. Snower

Impressum:
CESifo Working Papers ISSN 2364-1428 (electronic version) Publisher and distributor: Munich Society for the Promotion of Economic Research - CESifo GmbH The international platform of Ludwigs-Maximilians University’s Center for Economic Studies and the ifo Institute Poschingerstr. 5, 81679 Munich, Germany Telephone +49 (0)89 2180-2740, Telefax +49 (0)89 2180-17845, email [email protected] Editor: Clemens Fuest https://www.cesifo.org/en/wp An electronic version of the paper may be downloaded · from the SSRN website: www.SSRN.com · from the RePEc website: www.RePEc.org · from the CESifo website: https://www.cesifo.org/en/wp

CESifo Working Paper No. 8842
Technological Advance, Social Fragmentation and Welfare
Abstract
This paper models the welfare consequences of social fragmentation arising from technological advance. We start from the premise that technological progress falls primarily on market-traded commodities rather than prosocial relationships, since the latter intrinsically require the expenditure of time and thus are less amenable to productivity increases. Since prosocial relationships require individuals to identify with others in their social group whereas marketable commodities are commonly the objects of social status comparisons, a tradeoff arises between in-group affiliation and inter-group status comparisons. People consequently narrow the bounds of their social groups, reducing their prosocial relationships and extending their status-seeking activities. As prosocial relationships generate positive externalities whereas status-seeking activities generate negative preference externalities, technological advance may lead to a particular type of “decoupling” of social welfare from material prosperity. Once the share of status goods in total production exceeds a crucial threshold, techno-logical advance is shown to be welfare-reducing.
Steven J. Bosworth University of Reading / United Kingdom
Dennis Snower Global Solutions Initiative Foundation
gGmbH / Berlin / Germany [email protected]
01 December 2020 We are deeply grateful to Paul Collier for his valuable insights.

1 Introduction
This paper explores how productivity-enhancing economic forces – by increasing material prosperity –can give rise to social fragmentation and how this affects social welfare. People are assumed to be morecooperative within a social group (such as a family, a friendship circle or a workplace team) than betweengroups. The reason is that people commonly identify their wellbeing with other members of their socialgroup, but do not do so with regard to out-group members. We investigate how productivity increasesthat fall on marketable goods and services – rather than on prosocial relationships within social groups– can reduce the size of social groups by raising the return to positional comparisons across groupsand thereby influence social welfare. Productivity increases therefore not only raise people’s materialstandard of living, but also increase social fragmentation as measured by the size of social groups withinthe economy. We examine the conditions under which the second effect dominates the first, whereuponthe productivity increases become welfare-reducing.
Our paper seeks to capture a phenomenon that is receiving growing attention in the public debate, butis largely ignored in conventional economic analysis, namely, that around the world – in both developedand emerging market economies – we are witnessing how economic growth can be destructive of local,regional and national communities. In particular, we focus on the decline in people’s close relationshipsdocumented by McPherson et al. (2006). Material progress may shrink the scope of our social ties andthus have an ambiguous influence on social welfare – raising welfare by promoting the production of moregoods and services for a given set of factor inputs, while reducing welfare through the disintegration ofsocial relationships.
For this purpose, we need to extend macroeconomic analysis beyond individualistic microfoundationsto recognize to broad categories of economic activities that characterise humans as social creatures:positionally competitive activities (satisfying status-seeking motives, for which one’s welfare is assessedrelative to the welfare of others) and cooperative activities within prosocial relationships (in which one’swelfare depends positively on the welfare of others). The three activities differ in terms of their preferenceexternalities: individualistic activities are associated with no such externalities; positionally competitiveactivities have negative externalities; and prosocial relationships have positive externalities.
Our analysis of how productivity growth affects on social fragmentation and welfare rests on two sim-plifying premises. First, the productivity growth from technological advance falls more on market-tradedcommodities associated with individualistic and positionally competitive activities than on prosocial rela-tionships. Though prosocial relationships often benefit from technological innovations, their goals tend tobe less closely associated with market commodities than are the goals of individualistic and positionallycompetitive activities. The reason is that these socially cooperative relationships typically, often intrin-sically, require time spent in supportive social interactions and this time input cannot be substantiallyreduced through technological advance. The second premise is that prosocial relationships are more com-mon for the relations within social groups than across social groups. Though many prosocial activitiesoccur across social groups, prosocial relationships occur preferentially within social groups defined by a“we” (R. Akerlof, 2016). The choice of whom to extend “we” rather than “you” and “I” has two naturalimplications: it defines the relevant group within which one is able to most easily overcome cooperationproblems, and without which social comparisons become more salient.
Under these two premises, we analyse how productivity growth promotes individualistic and position-ally competitive activities at the expense of prosocial activities. We examine how these incentives reducethe size of social groups, thereby generating social fragmentation. Consequently, productivity growth hasan ambiguous influence on social welfare, since it promotes negative preference externalities (associatedwith positionally competitive activities) at the expense of positive preference externalities (associatedwith prosocial relationships). On the one hand, productivity growth promotes the production of indi-vidualistically want-satisfying commodities (thereby raising welfare); on the other, it promotes activitiesin which one person’s welfare gain is another’s welfare loss and discourages activities in which peoplegain from one another’s welfare. In this context, we derive a condition under which productivity growthreduces aggregate welfare.1 In these respects, this paper draws on and significantly extends the analy-sis of Snower and Bosworth (2016), which does not derive conditions for welfare-reducing technologicaladvance. We also assess the empirical plausibility of this condition. In particular, we provide a roughcalibration of our model for the United Kingdom, which indicates that welfare-reducing growth is indeedan empirical possibility, worthy of further examination.
1Our paper is certainly not the only to introduce a model wherein growth can be welfare-reducing. See Peng (2008)for a model in which envy can outstrip consumption utility. Our focus is rather specifically on the phenomenon of socialfragmentation, and our results hold for an arbitrarily small disutility from envy.
2

In this light, technological advance and globalization can be associated with a well-known aspect ofrising individualism (as described, for example, by Putnam, 2000 and McPherson et al., 2006), manifestedthrough declining willingness to engage in civic activities, to contribute to public goods and to makecontributions to social allegiances. The technologically-driven rise in social fragmentation can lead to a“decoupling” of social welfare from material progress.
Our analysis points to the need for further investigation of the consequences of productivity growthfor social communities and the need to bring macroeconomic policy and innovation policy into closerassociation with social policy. As indicated below, the possibility of welfare-reducing growth is not anargument for stopping technological advance and structural economic change, but rather for designingpublic policies and business strategies that sustain and nourish social communities.
The rest of our paper is organised as follows. Section 2 summarises the motivational foundationsof decision making in our analysis. Section 3 presents our analysis of comparative, individualistic andcooperative activities. Section 4 describes the general equilibrium. Section 5 derives the effect of pro-ductivity growth on aggregate production, social fragmentation and welfare. Section 6 calibrates theparameters of the model to existing stylised facts. Section 7 derives additional welfare implications whenthe proportion of positionally competitive activities rises in response to productivity growth and whenthere are diminishing returns to the production of market goods. Section 8 concludes.
2 Motivational foundations of decision making
The individualistic, comparative and prosocial activities in our analysis are generally recognised to bedriven by distinct human motives:
• Self-interested wanting, whereby an individual’s utility depends exclusively on her own payoff,
• Positional competition,2 whereby her utility depends on her payoff relative to her relevant referencegroup, and
• Prosociality, whereby her utility depends positively on the utility of her in-group.
2.1 Motives in economic decision making
The underlying insight is taken from motivation psychology,3 namely, that people have access to multiple“motives”, which are psychological forces that give direction and energy to one’s behaviour. Differentmotives can be associated with different utility functions. Which motives are active at any point in timedepends on one’s social context. Prosocial motives engender group cohesion, whereas positionally com-petitive motives delineate and secure the individual’s place within social hierarchies. The self-interestedwanting motive drives the satisfaction of wants that pertain to oneself, without reference to any socialrelations.
All three motives are common in practice. Prosociality generates the desire to promote the wellbeingof others and to alleviate their suffering. It includes acts of benevolence, altruism, sympathy, as well as theneed to be liked and the need for interpersonal relatedness. It occurs naturally among kin and is frequentlyextended to friends and other non-kin groups with whom one identifies. Positional competition takes awide variety of forms in market economies, including concern with one’s wealth, physical appearance,possessions, political clout, business success, intellectual prowess, sports achievements, etc. relative tothe other members of one’s reference group. It is manifested as ostentatious consumption, keeping upwith the Jones’s, tournament contracts in the labour market, rankings of fund managers, tennis seeds,football leagues, and much more.
Our analysis focuses on positional competition and prosociality since these motives exemplify twocommon, yet contrasting economic objectives. Under Status-seeking, one’s payoff is diminished by thepayoff of one’s competitors; whereas under prosociality, one’s payoff is enhanced by the payoff of themembers of one’s reference group.
Non-positional activities arise when we satisfy our basic needs for food, shelter, clothing, and otheressentials for the maintenance of life. Except for people living in extreme poverty, most of our consumptionactivities satisfy “wants” rather than “needs,” and many of these wants arise from positional battles insocial settings. The prevalence of such positional battles is clarified through evolution-based theoriesdescribing how survival and procreation depends on one’s social ranking. Prosociality is common within
2For example, H. Heckhausen (1989); J. Heckhausen (2000); Heckhausen and Heckhausen (2010).3Heckhausen and Heckhausen (2010) provide an excellent survey.
3

families; no child would survive without it. Much of the evolutionary success of homo sapiens is due toour ability to extend prosociality to non-kin groups.
2.2 Motives pertaining to social groups
Both positional competition and prosociality take place with respect to pre-existing reference groups,defined by our social identities. For the purposes of our analysis, we restrict our conception of socialidentity to the formation of social class groups. Specifically, each identity describes an in-group, thepayoff of whose members we seek to promote, and a “competing out-group,” the payoff of whose memberswe seek to surpass.4
People are assumed to be motivated by prosociality toward their in-group and by positional competi-tion toward their out-group. These assumptions are admittedly drastic simplifications of people’s actualrelationships, but they provide a simple analytical framework for exploring something important, whichhas received little if any attention in traditional economic analysis. In particular, the Care and Affiliationmotives generate positive externalities, whereas the positional competition motive generates negative ex-ternalities. This turns out to have potentially important implications for the influence of productivitygrowth on social welfare.
There is substantial psychological evidence that positionally competitive and prosocial motives are infundamental conflict due to their opposing internalisations of others’ welfare. This conflict is mediatedby identification: other people are categorised as “us”, with whom we affiliate or “them”, with whom wedifferentiate (R. Akerlof, 2016). Aron et al. (1991) characterise close relationships as featuring a highdegree of overlap between conceptions of the self and the other person.5 Galinski, Ku and Wang (2005)show that this self-other overlap explains why close relationships foster social cooperation (prosocialmotives). McFarland, Buehler and MacKay (2001) find muted affective responses to social comparisonswith close others. Gardner, Gabriel, and Hochschild (2002) experimentally prime interdependent self-constual (close identification with others) and find that unfavourable social comparisons become causefor celebration rather than envy, and favourable social comparisons cease to be cause for pride. Chenand Li (2009) induce group identity and measure social preferences using a number of strategic economicgames, finding that in-group members display greater altruism and lower envy toward one another.Similarly, Oveis, Horberg and Keltner (2010) show that both trait- and state-induced compassion isassociated with increased perceived self-other similarity, while pride is associated with a decreased senseof similarity to weak others. Our assumption that there is more prosociality within groups and morepositional competition between groups is therefore well founded.
2.3 Technological market bias
Our analysis rests on the hypothesis that productivity growth arising from technological advance fallsmore on market activities than on non-market, prosocial relationships – what we shall call the “tech-nological market-bias hypothesis”. The reason underlying this hypothesis akin to the “Baumol effect.”6
The amount of time input required by social relationships powered by prosociality – such as sociallysupportive relationships with one’s spouse and children – has changed much less over the past centurythan the huge technology-driven productivity improvements in the production of goods and services.
To be a good friend or good relative generally calls for substantial unmediated personal exchanges. Weargue that though these social interactions can be promoted through technological advances, the latitudefor doing so is far more limited than for goods and services devoted to the purposes of positional compe-tition and materialistic consumption. Though goods and services can serve many goals – comparative,
4In practice, people also have “non-competing out-groups,” the payoff of whose members is irrelevant to their decisions.For analytical simplicity, however, we ignore this category in our analysis. Genicot and Ray (2017) for example study themotivating effects of social comparisons with those of very close incomes. Our analysis is consistent with the view that socialcomparisons with out-group members of similar income are most important since our model’s results hinge on optimisationwith respect to who the marginal in-group member is.
5Gachter, Starmer and Tufano (2015) review an experimentally tractable and validated measure of perceived self-othercloseness.
6Baumol’s “cost disease of the services” refers to service sector jobs that experience wage growth though they donot benefit from technological progress. These service sector jobs are market activities, to be distinguished from non-market relationships. Like many services, the labour productivity of non-market relationships – such as playing tag withone’s children, dancing with loved ones, playing tennis with friends – cannot be raised significantly through technologicalprogress, since the time input of the participants is central to these activities. Unlike Baumol’s phenomenon however, thisproductivity difference between socially cooperative relationships and competitive and individualistic activities does notarise from the distinction between goods and services. Our distinction is rather between goods and services that meetcompetitive and individualistic goals versus those that meet socially cooperative goals.
4

individualistic and socially supportive relationships – we claim that the prosocial relationships invariablyrequire much time to be spent together and technological advance cannot significantly reduce this timeinput without degrading the relationships. Goods and services are often consumed in the process ofconducting socially supportive relationships and although these goods and services are complementaryto these relationships, technological advances in the production of these goods and services do not signif-icantly reduce people’s time spent in tending to the relationships, at least in comparison to the effect oftechnology on positionally competitive and individualistic pursuits. For example, advances in computertechnologies have given rise to vast productivity improvements in the production of positional goods suchas automobiles and jets, but we still require much the same amount of time to give socially supportivecare to friends, children and the elderly.
Maintaining socially cooperative relationships may be aided by technological developments – such asadvances in communication technology – but these are incidental to the relationships themselves and mustcombine with time and attention devoted to others. This latter ingredient by its nature can hardly beeconomised on.7 Dealing specifically with a technology complementary to social relationships, Rotondi,Stanca, and Tomasuolo (2017) show that smartphone adoption degrades the overall quality of one’s socialinteractions and resulting wellbeing. Furthermore, socially cooperative relationships cannot typically bere-framed into material transactions without significantly diminishing the nature of the exchange.8 Thequest for positional status on the other hand, is very much tied in with material plenty. Showing othersthat one commands plentiful material resources generally promotes one’s place in a social hierarchy.Conspicuous consumption is a prime example of a market activity, whose productivity is strongly affectedby technological progress. But the domain of positionally competitive activities amenable to technologicalprogress is far wider than this, because the benefits of technological progress fall more on high-earnersthan on low-earners and high earnings are a common source of positional status.
In our analysis, market-traded goods are divided into positional and non-positional consumption. Forparsimony, we first assume that this fraction remains constant as society becomes more prosperous. Thisis a conservative assumption, as diminishing marginal utility for non-positional consumption implies thatincome growth is most likely to be spent on positional consumption at the margin. People first satisfytheir basic needs for nutrition, clothing, shelter and transportation, and only then seek out artisanal food,designer clothing, large houses for their possessions, and luxury cars.9
In this context, our analysis shows how productivity growth has an ambiguous influence on socialwelfare. This influence may be decomposed into a first- and second-order effect. In the first-ordereffect, productivity growth raises welfare by enabling the production of more non-positional commoditieswith given factor inputs, but it reduces welfare by reducing the scope of people’s in-group identification,thereby promoting positionally competitive relationships (which are zero-sum) at the expense of prosocialrelationships (which are positive-sum). Whether this first-order effect is positive or negative depends onthe relative strength of these two forces.
The second-order effect depends on preference and production changes that occur once positionalcompetition has increased at the expense of prosociality. More positional competition may be expectedto give rise to increased sensitivity to the gains from positional competition and diminishing returns inthe production of positional and non-positional goods. Each of these effects further reduces the socialwelfare generated by productivity growth.
2.4 Positional competition and individualism
There is a large literature on the rise of individualism, particularly in the West (e.g. Rahn and Transue,1998; Putnam, 2000; McPherson et al., 2006). Of particular concern for us is the time series evidenceshowing a narrowing of social relations in terms of socioeconomic heterogeneity. Paxton (1999) documentsa decline in evenings spent with neighbours over a 20 year period in the United States, with somesubstitution towards other friends. Li, Savage and Pickles (2003) document increasing class polarisationof friendship networks in the United Kingdom from 1972 to 1998. This corroborates McPherson et al.(2006) who find that the number of people with whom General Social Survey respondents in the UnitedStates discuss personal matters has shrunk between 1985 and 2004, and that the average educationalheterogeneity of these close friendship networks has also fallen. McPherson et al. also show that the
7This holds intrinsically, since the non-market, prosocial relationships rest centrally on the expenditure of time withothers.
8For example, we do not show our appreciation for a friend’s dinner party by paying the friend at the end of the party.9We consider this extension in Section 7, where our quantitative conclusions are strengthened while our qualitative
results remain unchanged. The rebalancing of consumption towards more positional goods exacerbates, but is not anecessary condition for, the welfare-reducing effects of growth.
5

reason why time spent with close ones has not fallen by as much is that people socialise more intenselywith a narrower range of people (pp. 361). There is also evidence that these trends are associated withrising levels of economic growth. Panel regressions show that even though interpersonal trust promotesgrowth (Algan and Cahuc, 2010), growth degrades interpersonal trust (Roth, 2009; see also Mahdavi,2013).
The implications of individualism for well-being have also been studied extensively, with much evidenceindicating that a decline in social ties is inversely associated with self-reported happiness and variousobjective measures of well-being (e.g. Ogihara and Uchida, 2014). Bartolini and Bilancini (2010) trackchanges in socialisation and income across a panel of countries and find that income per capita predictsmodest increases in subjective wellbeing, but only when controlling for the quality of people’s socialrelations. A straightforward application of omitted variable bias means that these changes in income arecorrelated with drops in sociality. The reasons adduced for why individualism can reduce well-being arediverse: an erosion of trust, a decline in the sense of connectedness to others, and a rise in narcissism(e.g. Bosson et al., 2008; Putnam, 2000; Twenge, 2006; Twenge and Campbell, 2010).
There is much evidence that well-being depends significantly and substantially on personal relation-ships, starting with psychologists’ recognition of such relationships as a basic human need (e.g. Baumeisterand Leary, 1995; Kasser and Ryan, 1999; Ryff and Singer, 2000; Deci and Ryan, 2001) and proceedingto economists’ studies on the correlation between self-reported happiness and personal relationships (e.g.Uhlaner, 1989; Gui, 2000; Frey and Stutzer, 2002; Helliwell, 2002; Bruni and Stanca, 2008; Becchetti etal., 2008; 2009; Gui and Stanca, 2010).
The importance of positional competition in market economies has received substantial empiricalattention. For example, on the basis of social surveys and contingent choice studies, Easterlin (1974),Kahneman et al. (1999) and others have found that people’s subjective well-being and life satisfactionwere more closely associated with their relative material status than their absolute income. These findingsare consonant with survey evidence that people voluntarily accept reductions in their absolute incomesin return for improvements in their rank within the income distribution (e.g. Solnick and Hemenway,1998).
The first major investigation of how economic growth is associated with a proportional growth ofpositional goods relative to non-positional goods was conducted by Hirsch (1976). He argued that risingaffluence is associated with a rising proportion of expenditure devoted to positionally competitive pursuits.Much corroborating evidence was found by subsequent contributors (e.g. Frank, 1999).10
The adverse welfare consequences of positional competition have been investigated by contributors toecological economics (e.g. Daly, 1977; 1996; and Durning, 1992), who explore how positional concerns arelinked to environmental problems and resource depletion. Adverse welfare consequences of status seekingare one of the important rationales for the “hedonic treadmill” phenomenon (e.g. Kahneman et al.,1999; Frank, 2000; Frey and Stutzer, 2002). There is also a class of models in microeconomics exploringthe static inefficiency arising from excessive consumption of positional goods (Frank, 1985; Corneo andJeanne, 1997; Hopkins and Kornienko, 2004). Our paper highlights a different kind of inefficiency, sincewe consider the consumption of positional relative to non-positional goods to be exogenous in our modeland focus on the welfare effects arising from agents’ changes in affiliations with in- and out-groups. Ouranalysis shows how the rise of positional competition and the rise of individualism are related, how theyare influenced by productivity growth, and the resulting social welfare consequences.
3 Cooperative, individualistic, and positionally competitive ac-tivities
We now construct a simple model of prosocially-driven cooperation and positional competition. Considera population of agents with measure 1. Each agent i is characterised by an ability index ai, which isdistributed uniformly on the unit interval: ai ∼ UNIF [0, 1]. A social group is a subset of the abilitydistribution G ⊆ [0, 1] such that agents i with ai ∈ G are able to produce a public good, and only comparethemselves with agents outside of the group. Formally, groups must be real intervals in G = 2[0,1] whichare mutually exclusive and together span the ability distribution: ∪G∈GG = [0, 1] and ∩G∈GG = ∅. Thisis meant to capture that groups are commonly understood social entities: no agent can enjoy the benefitsof being in a group which does not recognise her, nor can she suffer the costs of being in a group which
10This time-series evidence is not necessarily matched by cross-section evidence, as there is much anthropological andhistorical data indicating that positional competition is prevalent in various low-income societies (e.g. Boas, 1897; Mauss,1954). Only the time-series evidence, however, is relevant to our analysis.
6

she does not recognise. Denote by Gi the group which contains i as a member: ai ∈ Gi. Furthermore,let ai = inf Gi and ai = supGi.
3.1 Non-market activities
The members of each group together produce a non-market club good through socially cooperative rela-tionships. Individual i in group Gi derives the following utility from her socially cooperative relationshipswith her other in-group members
U ci = αNi, (1)
where Ni is the size of individual i’s in-group:
Ni =
ˆ ai
ai
1 · daj = ai − ai (2)
and α > 0 parametrises the productivity of the common good.
3.2 Market activities
Each individual i produces xi market goods according to the production function
xi (ai, Ni) = β (1 + ai)− λNi, (3)
where ai represents i’s individual ability; β > 0 is a productivity parameter; and λ is the “production sub-stitution parameter,” measuring the degree of substitutability between market commodities and prosocialrelationships: for every unit increase in prosocial activities, the production of market goods falls by λ.11
The smaller is individual i’s social group Ni, the less prosocial relationships are generated and the moremarket goods the individual i is able to produce.12
For the xi market goods produced by individual i, γxi are non-positional and (1− γ)xi are positional,where γ is a constant (0 < γ < 1). The individual’s utility from the non-positional good is
Uni = γxi. (4)
She also compares herself with a random member from her out-group. Her utility from positionalcompetition with the outsider j is
Usi,j ≡ πmax (xi − xj , 0)− εmax (xj − xi, 0)− λNi − Us, (5)
where π is a pride parameter, ε is an envy parameter, and Us
=´ 1
0Ej [U
si,j ] : dai is the average level of
positional utility in the population.13 Boyce et al. (2010) suggest that ε > π, but our qualitative resultsdo not hinge on this assumption.
Her expected utility from comparing herself with a random outsider is
aiUsi + (1− ai)Usi − U
s(6)
where ai is the probability of encountering an inferior-ability outsider and Usi is i’s pride-driven utility
from this encounter, whereas (1− ai) is the probability of encountering a superior-ability outsider andUsi is i’s envy-driven utility from that encounter. Denote by
Usi ≡ (1− γ)E(Usi,j
)= (1− γ)
(aiU
si + (1− ai)Usi − U
s)
(7)
i’s overall expected utility from competition.
11Corneo (2005) shows how increasing the returns to market production may reduce socialisation in the presence of leisurecomplementarities and a time constraint. The parameter λ encompasses his framework in reduced form, though this is notour main focus. Our main point concerns the extent of social connections across people and not their time use.
12Given the linear functional form of our utility functions below, we prefer to interpret x as units of material satisfactionrather than these goods’ value at market prices. Money should produce material satisfaction at a diminishing rate, andeven a highly skewed distribution of monetary income is likely to produce a much flatter dispersion of consumption utility.In the calibration of Section 6 we assume that monetary income m corresponds to a market production of x = mρ with0 < ρ < 1.
13This is made for normalisation purposes. We assume that there is a fixed pie of status to account for the fact thatsocial status is zero-sum and that the total level of social status cannot change over time. Note also that i gains more statusutility the more intensely she is engaged in goods production vs. caring activities.
7

The utility from market goods production Usi and Uni are therefore equal to
Usi = (1− γ)(β(π
2ai (2ai − ai)−
ε
2(1− ai) (1 + ai − 2ai)
)− λNi − U
s)
andUni = γ (β (1 + ai)− λNi) . (8)
4 The general equilibrium
Individual i encounters in- and out-group members with probabilities proportional to the number of in-and out-group members, respectively. Each individual i derives utility from three sources: non-marketactivities, positional status, and market-oriented private consumption. The expected utility of individuali is
Ui = U ci + Usi + Uni . (9)
We can now stipulate two conditions that characterise an equilibrium distribution of social groups:
1. A group G ∈ F ⊆ 2[0,1] is feasible if and only if, assuming all other prospective members of higherknowledge-biased join, each member’s utility from joining the group is greater than the maximumutility achievable outside the group.
G ∈ F : iff : ∀ai ∈ G, : Ui (G) ≥ maxG′
Ui (G′ |G′ ⊆ [0, ai])
2. A group G ∈ S ⊆ F is stable if and only if it is feasible and no proper subset of the group is alsofeasible.
G ∈ S iff 2G ∩ F = {G}
Lemma 1
Feasible groups cannot be smaller than
N∗ (α, β, γ, λ, π) =α− λ
βπ (1− γ). (10)
.Proof: Suppose that a feasible group Gi was such that ai − ai = N∗ − ω < N∗.14 The quantity
limai→ai
(Ui ([ai −N∗, ai])− Ui ([ai, ai))) =β
2(1− γ)πω2 > 0. (11)
Then for some ai = ai − ε, Ui ([ai −N∗, ai]) − Ui ([ai, ai]) = β2 (1− γ)πω2 − δ > 0 by continuity of
U in ai for appropriately small ε. But this is a contradiction as the group Gi is feasible and as suchUi (Gi) ≥ maxG′ Ui (G′ |G′ ⊆ [0, ai]) by definition.
Lemma 2
No group larger than N∗ can be stable.Proof: Suppose that a feasible group Gi was such that ai − ai = N∗ + ω > N∗. Let ai − ω < ai < ai.We will now proceed to show that the group [ai −N∗, ai] ( Gi is feasible. Differentiating Ui ([a′i, ai])with respect to a′i we get
dUi ([a′i, ai])
da′i= βπ (1− γ) (ai − a′i)− α+ λ. (12)
Setting equal to zero and solving for a′i gives us
a′i = ai −α− λ
βπ (1− γ)= ai −N∗ (13)
with d2Ui/da′2i < 0. The group [ai −N∗, ai] therefore satisfies the definition of feasibility meaning that
Gi cannot be stable.
14We assume that λ < α, in order to ensure that people sort into groups of size greater than zero.
8

020
4060
8010
0ab
out h
ow m
any
good
frie
nds
do y
ou h
ave
0 5 10 15 20 25respondents income
Figure 1: Number of close friends by income category from 1998 General Social Survey
Lemma 3
Any feasible group must include all available members of higher ability rank.Proof: The quantity
Ui ([ai, ai))− Ui ([ai −N∗, ai]) =1
2(ai − ai) (β (1− γ) (ai − ai) (ε− π) + 2 (α− λ)) . (14)
Case 1 (ε > π): Ui ([ai, ai))− Ui ([ai −N∗, ai]) > 0 trivially.Case 2 (ε < π):
Ui ([ai, ai))− Ui ([ai −N∗, ai]) ≥1
2(ai − ai) (β (1− γ)N∗ (ε− π) + 2 (α− λ))
=1
2(ai − ai) ((α− λ) (ε− π) /π + 2 (α− λ))
=1
2(ai − ai) (α− λ) ((ε− π) /π + 2)
=1
2(ai − ai) (α− λ) (ε/π + 1) ≥ 0.
For a group containing individual i, the ability of its lowest-ranked member is ai and includes allagents with ability less than ai, though ai herself is a member of the next-highest group (unless ai = 1,as the upper bound of the highest-ability group is the upper bound of the ability distribution). Theboundaries of each group may be derived recursively, moving down the ability ladder. Note that groupsup and down the ability distribution have the same size, i.e. N∗ does not depend on ai. This result iscontingent on the model’s linearity assumptions, though it does however match the data. The 1998 waveof the General Social Survey asked respondents how many close friends they had. Figure 1 shows how thisquestion varies by the survey’s income categories (increasing). There is no discernible pattern by income,and a linear regression of number of close friends by income does not yield a coefficient statisticallydifferent from zero.
5 The effect of productivity growth on social fragmentation,aggregate production, and welfare
In this context, we now investigate the effect of productivity growth on social fragmentation (measuredin terms of social group size N∗), aggregate production xi (where i denotes individual i and the numberof individuals in the economy is normalised to 1) and social welfare W . Our analysis will show that(i) under the technological market-bias hypothesis, productivity growth promotes social fragmentation,
9

which in turn (ii) raises the production of positional commodities at the expense of prosocial relationshipsand thereby (iii) leads to a “decoupling” of aggregate production from social welfare. In short, thoughproductivity growth increases the aggregate production of positional and non-positional commodities,productivity growth has an ambiguous effect on social welfare due to the rise in positional commoditiesand the fall in prosocial relationships. The resulting increase in negative preference externalities fromincreased positional consumption and the fall in positive preference externalities from reduced prosocialrelationships are the two sources of the decoupling phenomenon.
A productivity increase in the production of the market good is represented by a rise in the produc-tivity parameter β. By Equation (10), this increase in productivity β reduces the equilibrium size ofsocial groups, implying a rise in social fragmentation:
∂N∗
∂β= − α− λ
β2π (1− γ)< 0, (15)
By increasing the productivity of engaging in positional competition, technological advance and global-isation induce individuals to substitute status relationships for socially cooperative relationships, whichexplains the decline in group size.
Furthermore, the increase in productivity leads to a rise in the production of commodities xi. Thereis a direct effect (the rise in market good production for a given amount of effort) and an indirect effectthat operates via the rise in social fragmentation):
dxidβ
= (1 + ai)−(λ∂N∗
∂β
)= 1 + ai +
λ (α− λ)
β2π (1− γ)> 0 (16)
The direct effect is denoted by the first term (1 + ai) and the indirect effect is denoted by the the second
term −(λ∂N
∗
∂β
). Since both effects are positive, note that the rise in social fragmentation augments the
production-enhancing effect of the initial productivity stimulus from technological advance.Next, we consider the welfare implications of productivity growth, accompanied by a growing quest
for positional status, whereby people can gain only at each other’s expense. These welfare implicationsmay be assessed in terms of the following social welfare function
W =
K+1∑k=1
ˆ ak
ak
Uidai, (17)
i.e. the sum of the utilities of all social groups. The economy contains K+1 social groups, with the upperK groups having equilibrium size N∗ and a smaller “rump group,” of size size 1−KN∗ at the bottom ofthe ability distribution, that is left over once the highest-ranking members of all the other groups havemade their choices of group members.
The welfare effect of productivity growth is the sum of a direct effect ∂W∂β (holding group size constant)
and an indirect effect ∂N∗
∂βdWdN∗ (via the change in group size N∗):
dW
dβ=∂W
∂β+∂N∗
∂β· dWdN∗
. (18)
The direct effect (by Eq. (4)) is
∂W
∂β= γ
The indirect effect represents the influence of a rise in productivity β on group size N∗ and therebyon the three components of welfare: U c from socially cooperative relationships , Un from non-positionalcommodities, and Us from positional commodities.
We begin by calculating the effect of a rise in group size on positional utility: dUs/dN∗. We firstconsider discrete changes in group size, and then take a limit to derive the differential effect on welfare.The process of individualisation leads to a cascade of social demotions down the ladder of positionalstatus, starting with a shrinking top-status group and rippling down to the progressively shrinking lower-status groups. Each step in the individualisation process generates “demotees” (who are relegated to thenext-lower social position) and remaining “incumbents” (who maintain their previous social position). Inour analysis, each social group is of equal size, comprising the incumbents and demotees from a higher-status group. This implies however that groups’ lower membership boundaries will shift by more than
10

ai
0 1
a1a2a3
Δa1Δa2Δa3
Figure 2: Visualising the cascade of social demotions
their upper membership boundaries, and in fact the lower down the social stratum, the more demoteesrelative to incumbents there will be. Figure 2 illustrates. The highest-status group 1 shrinks by ∆a1. Thenext-highest-status group both shrinks in size by ∆a1 but also shifts to incorporate all the demotees fromthe first group. Therefore the lower membership boundary for this second group shifts by ∆a2 = 2∆a1.Likewise ∆a3 = 3∆a1. Taking the limit of ∆ak/∆ak as ∆y → 0, we know that dak/dak = k/k + 1 < 1.
As noted, people are envious of higher-status groups and proud regarding lower-status groups, butthey experience neither pride nor envy regarding members of their own social group. Suppose that thegroup size changes by ∆N∗ and that this implies changes in group boundaries by ∆ak, ak+1 by ∆ak+1,and so on. Then the change in the aggregate positional status-driven utility Us may be expressed
∆Us =∑k
ˆ ak
ak+∆ak
∆Usi dai︸ ︷︷ ︸incumbents
+
ˆ ak+∆ak
ak
∆Usi dai︸ ︷︷ ︸demotees
(19)
where the first term represents the change in utility of the people who have not switched groups, and thesecond term represents the change in utility of all those who have switched groups (i.e. those, for positive∆k, who were members of group k but are now members of group k + 1).
Taking the limit of ∆Us/∆N∗ as ∆N∗ approaches zero, we derive the effect of group size on welfarefrom positional commodities:15
dUs
dN∗=β
2(1− γ)K
(N∗2 − (1−KN∗)2
)(ε− π) . (20)
On this basis, the indirect effect may be derived as follows. By Eq. (15), the effect of productivitygrowth on group size is negative. Furthermore, it can be shown that the effect of group size on welfareis positive:16
dW
dN∗= α− γλ+
β
2(1− γ)K
(N∗2 − (1−KN∗)2
)(ε− π) > 0. (21)
Intuitively, only the highest-ability member of each group has a marginal utility from prosocial relation-ships equal to the marginal utility from commodity production. For all other members of the group, themarginal utility of prosocial relationships is greater than the marginal utility from commodity production.Thus for the group as a whole, welfare falls as group size falls.17
15A full derivation may be found in the attached workings.16The positive effect follows from three conditions: (i) Eq. (10), (ii) the rump group is smaller than the other groups:
(K + 1)N∗ > 1 (for otherwise the rump group would have formed as another social group), and (iii) the number of peoplein the rump group is positive: KN∗ < 1. For a formal proof, see Workings in the supplementary materials.
17Note that as π →∞, N∗ → 0, meaning that this result holds for arbitrarily large values of π.
11

Thus the effect of productivity growth on social welfare may be expressed as follows:
dW
dβ= γ︸︷︷︸
direct effect
+γλ (α− λ)
β2π (1− γ)︸ ︷︷ ︸effort effect︸ ︷︷ ︸
increased non-positional commodities
− α (α− λ)
β2π (1− γ)︸ ︷︷ ︸lost prosocial relationships
(22)
−(α− λ)K
(N∗2 − (1−KN∗)2
)(ε− π)
2βπ︸ ︷︷ ︸increased positional commodities
.
As this equation shows, technology-driven growth affects social welfare via three channels:
1. Non-positional commodities: The productivity increase raises the production of non-positionalcommodities (i.e. the ones captured in conventional utility functions). This effect can be decom-posed into a direct effect (more non-positional commodities produced for the same amount of effort)and effort-related effect (more effort is devoted to non-positional commodities, at the expense ofprosocial relationships).
(a) Direct effect (first term): productivity growth permits the production of non-positionalcommodities for the same amount of effort input. This is the effect in the absence of a changein effort on non-positional production and on prosocial relationships. In other words, it can bethought of as the traditional “manna from heaven” portrayal of productivity growth: peoplegain additional consumption at the margin from the effort they were already putting in. Theresulting social welfare effect is, not surprisingly, unambiguously positive. The magnitude ofthis effect depends on γ, the proportion of non-positional commodities relative to GDP.
(b) Effort-related effect (second term): productivity growth also leads people to substitute moretime into market activities, away from socially cooperative relationships. This generates morenon-positional commodities, both on account of the greater labour input and the increasedproductivity of this input.18
2. Socially cooperative relationships (third term): productivity growth favours market activitiesrelative to the non-market prosocial ones. Thereby it leads to increased individualisation, in theform of smaller social groups, which hurts socially cooperative relationships since these relationships
are club goods. This resulting social welfare effect is unambiguously negative: − α2
βπ(1−γ) < 0. Note
that the standard microeconomic result that an increase in the productivity of one private goodrelative to another has substitution effects which sum to zero19 does not obtain here, due to theclub-good nature of prosocial relationships.20
3. Positional commodities (fourth term): The formation of smaller social groups leads to a rise inpositionally competitive activities. When ε > π (Boyce et al., 2010 provide empirical support forthis claim) increased positional competition has an unambiguously negative effect on social welfare.However, even under the assumption π > ε, the increased pride utility and effort-related goodsproduction will not on net exceed the lost utility from socially cooperative relationships. Thisfollows from the result in Eq. 21. While it is true that for every person who gains from a relativerise in positional status, there is another person who loses from a relative loss in status, this doesnot mean that status seeking is socially neutral. The reason is that increased individualisationleaves the the worst-off group worse off than it was before (i.e. there is a rump group which getsbigger).21
The “welfare implications of growth” equation has implications given in the following propositions:
18If individuals were not allowed to change their effort, or if there were no tradeoff between goods production and caringrelationships (when the production substitutability parameter is λ = 0), this term is zero.
19This would be justified by an application of the envelope theorem to U in the case of private goods. Note that hereonly a measure-zero subset of agents have their first-order conditions satisfied.
20The substitution effect away from caring activities may be greater or less than the substitution effect towards non-positional commodities, depending on the parameters of the model, including the production substitutability parameterλ.
21Recall that the total amount of status in society must remain constant, as indicated through the normalisation of statusutility (subtracting U
sfrom Usi,j) in Eq (5): This means there is no direct effect from the increased productivity of status
production.
12

Welfare
Productivity
Output
β1 β2
Figure 3: Effects of growth – Output vs. welfare for fixed γ
1 When the proportion γ of non-positional goods is lower than γ, then productivity growth unambiguouslyreduces social welfare, where the proportion of non-positional goods is approximately
γ (α, β, λ, ε, π) ' 12 + λ(α−λ)
2β2π+√
(α−λ)(α(ε+π)−λ(ε−π))
2β2π+(
12−
λ(α−λ)2β2π
)2(23)
In general there is not a closed-form solution for γ since N∗ depends on the share (1− γ) of positionalgoods in consumption. We can however use the edge cases K = 1/N∗ (population exactly partitionedinto equal size groups, so that there is no rump group) as an approximation of γ. In these cases, N∗ dropsout of the expression for Wβ . By implication, if productivity growth is generating a higher proportion ofpositional goods than γ, then the welfare effects of growth must be negative. We consider this possibilityempirically plausible (See Section 6 below for a rough calibration).
Note that Condition (24), under which economic growth (a rise in productivity level β) reduceswelfare (W ), is itself dependent on the current productivity β. Figure 3 illustrates how welfare dependson growth, under three scenarios.
(i) When β is small (β < β1), there is no social fragmentation (N∗ = 1) and thus growth in the levelof productivity β raises welfare, since it raises the consumption of non-positional goods withoutraising social fragmentation. However welfare does not rises as fast as output, since the share ofnon-positional consumption is γ < 1.
(ii) When β is large (β1 ≤ β < β2), increases in the level of productivity β lead to increased socialfragmentation (K rises as N∗ falls) and then correspondingly welfare falls, provided that Condition(24) is fulfilled (i.e., γ is sufficiently low).
(iii) When β is very large (β ≥ β2), there is hardly any social capital left to depreciate and then anyrise in the level of productivity β again leads to an increase in the consumption of non-positionalgoods without further raising social fragmentation. Thus welfare starts to rise again, with a limitingslope limβ→∞ dW/dβ = γ. This upward-sloping region has little if any practical relevance, sinceit describes an economy in which social groups have virtually disappeared. Since social belongingis a fundamental human need (otherwise solitary confinement in prison would not be punishment),such an economy would be psychologically unbearable, leading social upheaval, associated with achange in the other parameters of our model.
Thus far, we have consider only the effect of productivity growth on social welfare, via reductions in thesize of social groups (increased individualism). This of course is a comparative static analysis – assumingall other parameters remain constant. The model’s other parameters will not in practise remain fixedas β increases. Recall that group size can be reduced even more through the consequences of the gainsfrom increased positional competition (rises in π), and diminishing returns to the production of marketgoods relative to prosocial relationships (falls in λ). Obviously, in the presence of these changes, the
13

lower bound on the proportion of non-positional goods (γ) is even lower than that given by Eq. (23).Furthermore since the limiting slope of the welfare function W is equal to the share of non-positionalgoods γ in total output, the evolution of this share has important implications for the dynamics of growthand welfare, as explored in Section 7.
6 Calibration
As indicated above, productivity growth becomes welfare-reducing once the proportion of non-positionalgoods falls beneath the threshold level γ. We now make a rough assessment of the empirical plausibilityof reaching this threshold level with regard to key data from published research.
For this purpose, we start with a simplifying assumption. We make the conservative assumption thatthe production substitution parameter is λ = 0, i.e. increases in prosocial activities does not reduce theproduction of market commodities.
Under these conditions, by Equation (10), the equilibrium group size is N∗ = αβπ(1−γ) and the
threshold proportion of non-positional goods γ simplifies to
γ =αN∗
β· ε+ π
2π(24)
Our analysis indicates that if the proportion of non-positional goods fall beneath this threshold value γ,productivity growth become welfare-reducing. Note that the threshold proportion γ is the product of twoterms: (i) the interaction-weighted “productivity ratio” (αN∗/β) is , i.e. the ratio of prosocial output(αN∗) to market productivity (β) and (ii) the “envy-pride parameter” (ε+ π) /2π.22
The parameter ε can be normalised to 1. Boyce et al. (2010) suggest that π is equal to 1/1.75. While αis the productivity of an individual’s contribution to maintaining her social relationships, αN∗ is her totalutility, which is the output of her prosocial relationships. Naturally, both individual productivity andgroup size matter for how much individuals choose to invest in public/club goods – individual productivitybecause people consider the opportunity cost of their investment, and group size because contributing tothe public good benefits everyone in the group.23 In order to match the parameters with a moment fromthe data then, we need to know the total value that people place on their social relationships and set thisequal to αN∗.
Wendner & Goulder (2008) suggest that positional consumption is at least 20% of total consumption,24
so that γ is at most 0.8.The median income in the United Kingdom in 2017 is £42,515. Social relationships may be valued
along the following lines laid out by Powdthavee (2008): using data from the British Household PanelSurvey, changes in life satisfaction arising from meeting with friends and family and speaking withneighbours are compared with the same changes arising from changes in income. Powdthavee assumesas his base category people who meet with their friends and relatives and speak to their neighbours lessthan once a month. Relative to these people, those who meet with friends or relatives once or twice amonth (11% of the sample) experience an increase in life satisfaction equivalent to £57,500; those whomeet with friends or relatives once or twice a week (40% of the sample) experience an increase in lifesatisfaction equivalent to £69,500; and those who meet with friends or relatives on most days (47% ofthe sample) experience an increase in life satisfaction equivalent to £85,000 of annual income (in 1996pounds Sterling). Furthermore those who talk to their neighbours once or twice a week (40% of thesample) experience an increase in life satisfaction equivalent to £22,500; and those who talk to theirneighbours on most days (36% of the sample) experience an increase in life satisfaction equivalent to£37,000 in annual income. We take these numbers to mean that the average value of each Briton’s socialrelations is equal to £172,019 in 2017 pounds Sterling.
In the analysis above, we do not interpret the relative valuation of income and social relationshipsin monetary terms (refer to sec. 3.2, footnote 12). The estimates above however are given in monetaryterms. To transform this ratio back into utility terms, we make reference to the elasticity of social groupsize with respect to income. McPherson, Smith-Lovin and Brashears (2006) document a 33% reductionin the extent of people’s close social groups over 1985-2004 in the United States. Real income per capitagrew by 132% over this period however. Note that our model is equivalent to Cobb-Douglas utility and
22Note d(ε+π2π
)/dε > 0 and d
(ε+π2π
)/dπ < 0.
23Weimann et al. (2018) provide evidence that both matter to experimental subjects.24Wendner and Goulder (2008) provide a range of estimates.
14

as such the elasticity of group size N∗ with respect to β is
dN∗
dβ· βN∗
= −1.
This means we need to map a 132% growth in income into a 33% growth in consumption utility. Thesimplest way to do this is with an exponential consumption utility of money function:
xi = mρ
where m is the value of consumption at market prices with 0 < ρ < 1. We therefore set ρ = 33/132 andset the ratio of social relationship utility (u (£172, 019)) to income (u (£42, 515)) equal to
αN∗
β=
(172, 019)33/132
(42, 515)33/132
≈ 1.42.
Setting π = 1/1.75, and ε = 1, we obtain the condition γ < 0.64 in order for productivity growthto be welfare-reducing. This is well within the range identified by Wendner & Goulder. This exerciseshows that the phenomenon of welfare-reducing growth is an empirically plausible possibility; and meritsfurther investigation by empirical economists.
7 Further welfare effects of productivity growth
In Section 5, we have seen how productivity growth leads to a reduction in the size of social groups,thereby promoting people’s positionally competitive activities with regard to those outside their socialgroups and reducing prosocial relationships within their social groups. Since the positionally competitiveactivities are associated with negative preference externalities whereas the prosocial relationships areassociated with positive preference externalities, productivity growth leads to a “decoupling” of socialwelfare from GDP (the sum of all market production). This decoupling phenomenon can be reinforcedthrough the effect of productivity growth on the following phenomena.
7.1 Rising proportion of positionally competitive activities
Productivity growth increases GDP per capita and may thereby raise the share of positional goods intotal production. The reason is that while the satisfaction of basic individual material needs is finite,the satisfaction of positional status needs is inherently infinite, since one individual’s status needs mustalways be satisfied relative to those of others.25
In the context of our model, a rise in the share of positional goods reduces the size of social groups:
dN∗
d (1− γ)= − α− λ
πβ (1− γ)2 < 0 (25)
The associated welfare effect is also negative:
dW
d (1− γ)= −β − α− λ
πβ (1− γ)2 ·
dW
dN∗< 0. (see above)
In accordance with our hypothesis that productivity growth raises the share of positional goods, wenow assume that the proportion of non-positional goods γ (β) is inversely related to the productivityparameter β:
γ (0) = 1
limβ→+∞
γ (β) = 0
anddγ
dβ≡ γβ ≤ 0
for γ (·) continuous on [0,+∞). Figure 4a provides an example. These assumptions formalise the hypoth-esis that positional consumption rises in importance as people’s basic material needs become increasinglysatisfied.
25Hopkins and Kornienko (2004) provide a theory for how this might arise endogenously.
15

Firstly, we re-express the aggregate marginal utility of growth (i.e. the welfare effects of increasing βholding group size fixed) as
∂W
∂β= γ + γββ +
λ (1− γ − βγβ) (α− λ)
β2π (1− γ)2 . (26)
Note that, in comparison with the base case, there are effects on both the direct and effort-related effectsof growth on non-positional consumption. The direct effect becomes γ + γββ ≤ γ, meaning that eachadditional £/€/$ of production will consist of |γβ | · β fewer non-positional goods. Secondly however, theeffort-related substitution effect increases because the tradeoff between group size and goods productionbecomes steeper.
As before we then express the total welfare implications of technology-driven economic growth byusing the expression for the total derivative:
dW
dβ=∂W
∂β+∂N∗
∂β· dWdN∗
,
now taking into account that knock-on effects from changes in γ:
dW
dβ= γ + γββ︸ ︷︷ ︸direct effect
+λ (γ (1− γ)− βγβ) (α− λ)
β2π (1− γ)2︸ ︷︷ ︸
effort effect︸ ︷︷ ︸increased non-positional commodities
(27)
− α (1− γ − βγβ) (α− λ)
β2π (1− γ)2︸ ︷︷ ︸
lost prosocial relationships
−(α− λ) (1− γ − βγβ)K
(N∗2 − (1−KN∗)2
)(ε− π)
2βπ (1− γ)︸ ︷︷ ︸increased positional commodities
.
As above, technology-driven growth affects social welfare via three channels. We compare the differ-ences with the baseline model below:
1. Non-positional commodities: The productivity increase raises the production of non-positionalcommodities (i.e. the ones captured in conventional utility functions). This effect can be decom-posed into a direct effect (more non-positional commodities produced for the same amount of effort)and effort-related effect.
(a) Direct effect (first term): The direct effect, which is positive, becomes smaller if γβ < 0, asfewer and fewer extra non-positional commodities are made with the same inputs.
(b) Effort-related effect (second term): The effort-related substitution effect, also positive, be-comes larger, since we have assumed λ < α (positive group sizes in equilibrium). This isbecause the tradeoff between positional goods production and relationship maintenance be-comes more tilted towards positional goods, decreasing the equilibrium group size and thereforeincreasing production.
2. Socially cooperative relationships (third term): Note that in contrast to the base, there is moresubstitution away from prosocial activities as γ shrinks. Therefore the effect on socially cooperativerelationships becomes more negative.
3. Positional commodities (fourth term): The formation of smaller social groups leads to a rise inpositionally competitive activities. The increasing share of positional commodities in consumptionmakes the pivotal group members narrow their groups to be more exclusive, such that the rumpgroup increases faster with β.
Figure 4 revises the analysis of welfare-growth dynamics to account for a shrinking proportion of non-positional goods. In panel a. γ (·) is plotted as a function of β.26 Panel b. again shows the path of
26The form γ = 1− 1/ (1 + exp (2− β)) was chosen as an example which satisfied the above assumptions.
16
a. Productivity
Non-positional consumption share
b.
Welfare
Productivity
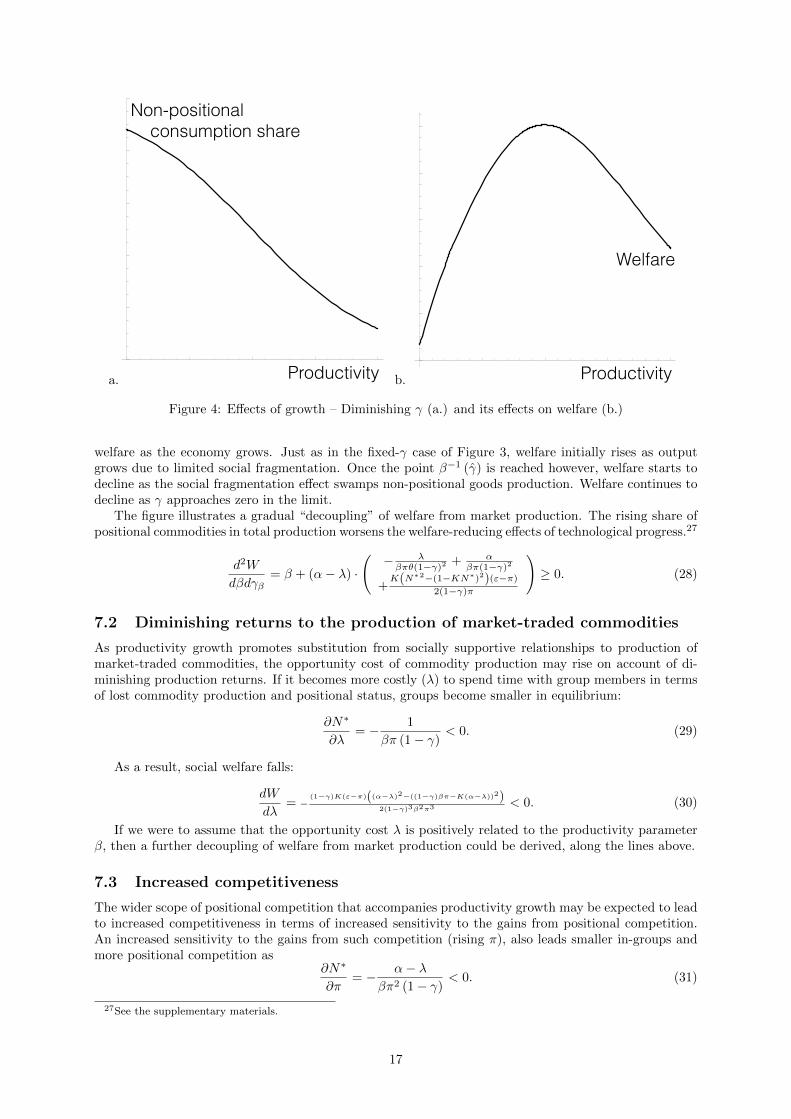
Figure 4: Effects of growth – Diminishing γ (a.) and its effects on welfare (b.)
welfare as the economy grows. Just as in the fixed-γ case of Figure 3, welfare initially rises as outputgrows due to limited social fragmentation. Once the point β−1 (γ) is reached however, welfare starts todecline as the social fragmentation effect swamps non-positional goods production. Welfare continues todecline as γ approaches zero in the limit.
The figure illustrates a gradual “decoupling” of welfare from market production. The rising share ofpositional commodities in total production worsens the welfare-reducing effects of technological progress.27
d2W
dβdγβ= β + (α− λ) ·
(− λβπθ(1−γ)2
+ αβπ(1−γ)2
+K(N∗2−(1−KN∗)2)(ε−π)
2(1−γ)π
)≥ 0. (28)
7.2 Diminishing returns to the production of market-traded commodities
As productivity growth promotes substitution from socially supportive relationships to production ofmarket-traded commodities, the opportunity cost of commodity production may rise on account of di-minishing production returns. If it becomes more costly (λ) to spend time with group members in termsof lost commodity production and positional status, groups become smaller in equilibrium:
∂N∗
∂λ= − 1
βπ (1− γ)< 0. (29)
As a result, social welfare falls:
dW
dλ= −
(1−γ)K(ε−π)((α−λ)2−((1−γ)βπ−K(α−λ))2)2(1−γ)3β2π3 < 0. (30)
If we were to assume that the opportunity cost λ is positively related to the productivity parameterβ, then a further decoupling of welfare from market production could be derived, along the lines above.
7.3 Increased competitiveness
The wider scope of positional competition that accompanies productivity growth may be expected to leadto increased competitiveness in terms of increased sensitivity to the gains from positional competition.An increased sensitivity to the gains from such competition (rising π), also leads smaller in-groups andmore positional competition as
∂N∗
∂π= − α− λ
βπ2 (1− γ)< 0. (31)
27See the supplementary materials.
17

The resulting welfare effect is again negative:
dW
dπ= −
(1−γ)K(ε−π)(α−λ)((α−λ)2−((1−γ)βπ−K(α−λ))2)2(1−γ)3β2π4 < 0
If we were to assume that the sensitivity π are positively related to the productivity parameter β, thedecoupling of social welfare from market production could once again be derived.
8 Conclusion
This paper addresses social consequences of productivity growth. In particular, it shows how produc-tivity growth can lead to greater social fragmentation, associated with unfavourable consequences forsocial welfare. When productivity growth falls primarily on market activities involving individualisticconsumption and positional competition, but less on socially supportive relationships, then productivitygrowth narrows people’s bounds of social affiliation and extends their positionally competitive activities.Since positional competition has negative preference externalities whereas socially supportive activitieshave positive preference externalities, productivity growth need not necessarily raise social welfare. Infact, we show that once the share of positional goods in total production exceeds a particular threshold,productivity growth becomes welfare-reducing.
In this sense, the paper makes a contribution to the analysis of the social implications of economicactivities. This analysis has a long history, although it appears to have fallen into disregard since theadvent of neoclassical economics, reaching its culmination with the publication of Samuelson’s Foun-dations of Economic Analysis (1947). Ferdinand Tonnies (1887) formalised a distinction between thetraditional Gemeinschaft, in which social relations are mediated primarily through personal relation-ships and the Gesellschaft emerging from the 19th century wherein more and more human needs aremet through instrumental, transactional and often impersonal institutions. Weber (1922) articulatedthe role that command of material resources had in establishing status hierarchies in modern societiesorganised around impersonal market and bureaucratic institutions. The reorganisation of society aroundimpersonal, third-party mediated exchange has without doubt improved human welfare in innumerableways. Whereas these material gains are easily recognisable through conventional economic analysis, thisanalysis has been largely blind to the possibility of accompanying social costs. Though Durkheim (1895)was already worried about social disintegration, welfare economics has given little formal treatment ofthis phenomenon.
Research into the determinants of life satisfaction reveal that primarily relative, not absolute, incomeincreases life satisfaction in developed countries (e.g. Boyce et al., 2010); higher materialism is associatedwith lower well-being (e.g. Roberts and Clement, 2007); and improvements in the quality of socialrelations yield welfare gains comparable to very large changes in relative income (e.g. Powdthavee,2008). In this context, our analysis makes the following contributions. First, we extend the conventionalmacroeconomic analysis, which is rigidly individualistic, to consider two vitally important aspects ofpeople as social creatures: their prosocial and positionally competitive abilities. The prosocial abilitiessatisfy people’s need for care and social affiliation, primarily within their social in-groups, generatingpositive preference externalities. Their positionally competitive abilities satisfy their need for achievingpositional goals, generating negative preference externalities.
Second, we explicitly model the process of social fragmentation, elucidating the mechanisms wherebythis process affects economic decisions, in terms of easily-interpretable parameters. In highlighting socialconsequences of market activities, the analysis bridges the gap between conventional economic theoryand sociology and motivation psychology. Understanding the links between social fragmentation andeconomic policy is of critical interest to economic policy makers concerned with social problems arisingfrom economic growth (such as the dissatisfactions which fuelled the election of Donald Trump andBrexit).
Finally, our analysis points to the need for further investigation of how productivity growth affectssocial communities. It is commonly observed, in both developed and developing countries, that global-ization, as well as technological changes such as automation and AI, have promoted low-wage jobs andunemployment and undermined social communities. The material losses suffered as a result of low-wagejob creation and unemployment are linked to, but distinct from, the welfare losses suffered on account ofsocial fragmentation. The latter welfare losses are commonly implicated as explanations of the populardissatisfactions that have lead to nationalist and populist swings in many countries around the world.Our analysis is a step towards understanding the economic causes and welfare consequences of such socialfragmentation.
18

Needless to say, the possibility that social welfare may be reduced by productivity growth is notan argument for stopping technological advance. Each of the model’s parameters is amenable to policyintervention. More empirical research needs to be done on the determinants of positional status-biasedgrowth and consumers’ response to status incentives. Corneo and Jeanne (1998) for example show thatthe price elasticity of demand for positional goods may be either negative or positive depending on theshape of consumers’ marginal status utility. Policymakers could correspondingly raise gamma by taxing,or allowing mass reproduction of luxury goods respectively. Within the domain of productivity growth,our analysis points to the need for a combination of economic and social policies to strengthen socialcommunities and to pursue innovation policies28 that promote social integration. Government policiesaimed at regenerating local communities, support for SMEs with strong local ties, social enterprise,Certified B Corporations, Social License to Operate, and other social initiatives may have the potentialto redress the socially destructive implications of technological advance, enabling us to reap the rewardsof productivity growth without paying the social costs.
References
[1] Advani, A., & Reich, B. (2015). Melting pot or salad bowl: The formation of heterogeneous com-munities. IFS Working paper W15/30.
[2] Akerlof, G. A., & Kranton, R. E. (2010). Identity Economics. Princeton: Princeton University Press.
[3] Akerlof, G. A., & Kranton, R. E. (2000). Economics and identity. Quarterly Journal of Economics,115(3), 715-753.
[4] Akerlof, R. (2016). ’We thinking’ and its consequences. American Economic Review, 106(5), 415-419.
[5] Algan, Y. & Cahuc, P. (2010). Inherited trust and growth. American Economic Review, 100(5),2060-2092.
[6] Aron, A., Aron, E. N., Tudor, M., & Nelson, G. (1991). Close relationships as including the otherin the self. Journal of Personality and Social Psychology, 60(2), 241-253.
[7] Atkinson, J. W. (1964). An Introduction to Motivation. Princeton: Van Nostrand.
[8] Atkinson, J. W., & Feather, N. T. (eds.). (1966). A theory of achievement motivation. New York:Wiley.
[9] Bakan, D. (1966). The Duality of Human Existence. Reading, PA: Addison Wesley.
[10] Bartolini, S. & Bilancini, E. (2010). If not only GDP, what else? Using relational goods to predictthe trends of subjective well-being. International Review of Economics, 57(2), 199-213.
[11] Baumeister, R. F., and Leary, M. R. (1995). The need to belong: The desire for interpersonalattachments as a fundamental human motivation. Psychological Bulletin, 117, 497-529.
[12] Becchetti, L., Pelloni, A., & Rossetti, F. (2008). Relational goods, sociability and happiness. Kyklos,61(3), 343-363.
[13] Becchetti, L, Trovato, Gl, & Bedoya, D. A. L. (2009). Income, relational goods and happiness.Applied Economics, 43(3), 1466-1483.
[14] Boas, F. (1897). Kwakuitl Ehtnolgraphy. Chicago: University of Chicago Press.
[15] Bosson, J. K., Lakey, C. E., Campbell, W. K., Zeigler-Hill, V., Jordan, C. H., & Kernis, M. H.(2008). Untangling the links between narcissism and self-esteem: A theoretical and empirical review.Social and Personality Psychology Compass, 2(3), 1415-1439.
[16] Bosworth, S. J. & Snower, D. J. (2019). The interplay of economic, social, and political fragmentation.Mimeo.
[17] Boyce, C. J., Brown, G. D. A., & Moore, S. C. (2010). Money and happiness: Rank of income, notincome, affects life satisfaction. Psychological Science, 21(4), 471-475.
28There are numerous examples, such as European Commission (2013), Norden (2015), and OECD (2011).
19

[18] Bruni, L., & Stanca, L. (2008). Watching alone: Relational goods, television and happiness. Journalof Economic Behavior and Organization, 65 (3-4), 506-528.
[19] Chen, Y. & Li, S. X. (2009). Group identity and social preferences. American Economic Review,99(1), 431-457.
[20] Corneo, G. (2005). Work and television. European Journal of Political Economy, 21(1), 99-113.
[21] Corneo, G. & Jeanne, O. (1997). Conspicuous consumption, snobbism and conformism. Journal ofPublic Economics, 66(1), 55-71.
[22] Daly, H. E. (1977). Steady-state Economics. San Francisco: W. H. Freeman.
[23] Daly, H. E. (1996), Beyond Growth: The Economics of Sustainable Development. Boston: BeaconPress.
[24] Deci, R. M., & Ryan, E. L. (2001). On happiness and human potentials: A review of research onhedonic and eudaimonic well-being. Annual Review of Psychology, 52, 141-166.
[25] Durkheim, E. (1895). The Rules of Sociological Method. W. D. Halls (Trans., 1982). New York: FreePress.
[26] Durning, A. T. (1992). How Much is Enough? The Consumer Society and the Future of the Earth.New York: London.
[27] Easterlin, R. (1974). Does economic growth improve the human lot? In: P. David & M. Reder(Eds.), Nations and Households in Economic Growth, pp. 89-125. New York: Academic Press.
[28] Elliot, A. J., & Covington, M. V. (2001). Approach and avoidance motivation. Educational Psychol-ogy Review, 13(2), 73-92.
[29] European Commission. (2013). Guide to Social Innovation. http://s3platform.jrc.ec.europa.eu/documents/20182/84453/Guide to Social Innovation.pdf.
[30] Frank, R. H. (1985). The demand for unobservable and other nonpositional goods. American Eco-nomic Review, 75(1), 101-116.
[31] Frank, R. H. (1999). Luxury Fever: Why money fails to satisfy in an era of excess. New York: FreePress.
[32] Frey, B. S., & Stutzer, A. (2002), Happiness and Economics. Princeton: Princeton University Press.
[33] Gachter, S., Starmer, C., & Tufano, F. (2015). Measuring the closeness of relationships: A compre-hensive evaluation of the ’Inclusion of the Other in the Self’ scale. PLoS ONE, 10(6), e0129478.
[34] Galinski, A. D., Ku, G., & Wang, C. S. (2005). Perspective-taking and self–other overlap: Fosteringsocial bonds and facilitating social coordination. Group Processes & Intergroup Relations, 8(2),109-124.
[35] Gardner, W. L., Gabriel, S., & Hochschild, L. (2002). When you and I are “we,” you are not threat-ening: The role of self-expansion in social comparison. Journal of Personality and Social Psychology,82(2), 239-251.
[36] Genicot, G. & Ray, D. (2017). Aspirations and inequality. Econometrica, 85(2), 489-519.
[37] Gilbert, P. (2014). The origins and nature of compassion focused therapy. British Journal of ClinicalPsychology, 53(1), 6-41.
[38] Gui, B. (2000). Beyond transaction: On the interpersonal dimension of economic reality. Annals ofPublic and Cooperative Economics, 71(2), 139-169.
[39] Gui, B., & Stanca, L. (2010). Happiness and relational goods: Well-being and interpersonal relationsin the economic sphere. International Review of Economics, 57(2), 105-118.
[40] Heckhausen, H. (1989). Motivation und Handlung. Berlin: Springer.
[41] Heckhausen, J. (2000). Evolutionary perspectives on human motivation. American Behavioral Sci-entist, 43(6), 1015-1029.
20

[42] Heckhausen, J., & Heckhausen, H. (2010). Motivation und Handeln. Berlin: Springer.
[43] Helliwell, J. F. (2002). How’s life? Combining individual and national variables to explain subjectivewell-being. NBER Working Paper No. 9065. Cambridge, MA: NBER.
[44] Hirsch, F. (1976), Social Limits to Growth. Cambridge, MA: Harvard University Press.
[45] Hopkins, E. & Kornienko, T. (2004). Running to keep in the same place: Consumer choice as a gameof status. American Economic Review, 94(4), 1085-1107.
[46] Hull, C. L. (1943). Principles of behavior: An introduction to behavior theory. Oxford: Appleton-Century.
[47] Iannaccone, L. R. (1992). Sacrifice and stigma: Reducing free-riding in cults, communes and othercollectives. Journal of Political Economy, 100(2), 271-297.
[48] Kahneman, D., Diener, E., & Schwarz, N. (1999). Well-being: The Foundations of Hedonic Psychol-ogy. New York: Russell Sage Foundation.
[49] Kasser, V. M., & Ryan, R. M. (1999). The relation of psychological needs for autonomy and re-latedness to health, vitality, well-being and mortality in a nursing home. Journal of Applied SocialPsychology, 29(5), 935-954.
[50] Kasser, V. M., & Ryan, R. M. (2001). Be careful what you wish for: Optimal functioning and therelative attainment of intrinsic and extrinsic goals. In: P. Schmuck & K. M. Sheldon (Eds.), LifeGoals and Wellbeing: Towards Positive Psychology of Human Striving, pp. 116-131. Gottingen:Hogrefe and Huber.
[51] Lewin, K. (1935). A Dynamic Theory of Personality. New York: McGraw-Hill.
[52] Li, Y., Savage, M., & Pickles, A. (2003). Social change, friendship and civic participation. SociologicalResearch Online, 8(4).
[53] Mahdavi, A. & Azizmohammadlou, H. (2013). The effects of industrialization on social capital: Thecase of Iran. International Journal of Social Economics, 40(9), 777-796.
[54] Mauss, M. (1954). The Gift. New York: Macmillan
[55] McAdams, D. P. (1980). A thematic coding system for the intimacy motive. Journal of Research inPersonality, 14(4), 413-432.
[56] McClelland, D. C. (1967). Achieving Society. New York: Free Press.
[57] McDougall, W. (1932). The Energies of Men. London: Methuen.
[58] McFarland, C., Buehler, R., & MacKay, L. (2001). Affective responses to social comparisons withextremely close others. Social Cognition, 19(5), 547-586.
[59] McPherson, M., Smith-Lovin, L., and Brashears, M. E. (2006). Social isolation in America: Changesin core discussion networks over two decades. American Sociological Review, 71(3), 353-375.
[60] Murray, H. A. (1938). Explorations in Personality. New York: Oxford University Press.
[61] Norden. (2015). Social entrepreneurship and social innovation: Initiatives to promote social en-trepreneurship and social innovation in the Nordic countries. doi:10.6027/TN2015-562
[62] OECD. (2011). Fostering innovation to address social challenges.https://www.oecd.org/sti/inno/47861327.pdf
[63] Ogihara, Y., & Uchida, Y. (2014). Does individualism bring happiness? Negative effects of individ-ualism on interpersonal relationships and happiness. Frontiers in Psychology, 5, 135.
[64] Oveis, C., Horberg, E. J., & Keltner, D. (2010). Compassion, pride, and social intuitions of self-othersimilarity. Journal of Personality and Social Psychology, 98(4), 618-630.
21

[65] Pang, J. S. (2010). The achievement motive: a review of theory and assessment of n Achievement,hope of success, and fear of failure. In: O. Schultheiss & J. Brunstein (eds.), Implicit Motives, pp.30-71. Oxford: Oxford University Press.
[66] Paxton, P. (1999). Is social capital declining in the United States? A multiple indicator assessment.American Journal of Sociology, 105(1), 88-127.
[67] Peng, B. (2008). Relative deprivation, wealth inequality and economic growth. Journal of Economics,94(3), 223-229.
[68] Powdthavee, N. (2008). Putting a price tag on friends, relatives, and neighbours: Using surveys oflife satisfaction to value social relationships. Journal of Socio-Economics, 37(4), 1459-1480.
[69] Putnam, R. D. (2000). Bowling Alone: The Collapse and Revival of American Community. Chicago:Simon and Schuster.
[70] Rahn, W. M., and Transue, J. E. (1998). Social trust and value change: The decline of social capitalin American Youth, 1976-1995. Political Psychology, 19(3), 545-565.
[71] Reiss, S. (2004). Multifaceted nature of intrinsic motivation: The theory of 16 basic desires. Reviewof General Psychology, 8(3), 179-193.
[72] Roberts, J. A. & Clement, A. (2007). Materialism and satisfaction with over-all quality of life andeight life domains. Social Indicators Research, 82(1), 79-92.
[73] Roth, F. (2009). Does too much trust hamper economic growth? Kyklos, 62(1), 103-128.
[74] Rotondi, V., Stanca, L., & Tomasuolo, M. (2017). Connecting alone: Smartphone use, quality ofsocial interactions and well-being. Journal of Economic Psychology, 63, 17-26.
[75] Ryff, C. D., & Singer, B. (2000). Interpersonal flourishing: A positive health agenda for the newmillennium. Personality and Social Psychology Review, 4(1), 30-44.
[76] Samuelson, P. A. (1947). Foundations of Economic Analysis. Cambridge, MA: Harvard UniversityPress.
[77] Snower, D. J. & Bosworth, S. J. (2016). Identity-driven cooperation vs. competition. AmericanEconomic Review, 106(5), 420-424.
[78] Solnick, S. J., & Hemenway, D. (1998). Is more always better? A survey on positional concerns.Journal of Economic Behavior and Organization, 37(3), 373-383.
[79] Thorndike, E. L. (1898). Animal intelligence: An experimental study of the associative processes inanimals. Psychological Monographs: General and Applied, 2(4), i-109.
[80] Tonnies, F. (1887). Gemeinschaft und Gesellschaft, Leipzig: Fues’s Verlag.
[81] Trudewind, C. (2000). Curiosity and anxiety as motivational determinants of cognitive development.J. Heckhausen (Ed.), Motivational Psychology of Human Development: Developing Motivation andMotivating Development. Advances in Psychology, 131, (pp. 15-38). New York: Elsevier Science.
[82] Twenge, J. M. (2006). Generation Me. New York: Free Press.
[83] Twenge, J. M., & Campbell, W. K. (2010). The Narcissism Epidemic. New York: Free Press.
[84] Uhlaner, C. J. (1989). “Relational goods” and participation: Incorporating sociability into a theoryof rational action. Public Choice, 62(3), 253-285.
[85] Weber, M. (1922). Wirtschaft und Gesellschaft, Tubingen: Mohr.
[86] Weimann, J., Brosig-Koch, J., Heinrich, T., Hennig-Schmidt, H., & Keser, C. (2018). The Logic ofCollective Action revisited. CESifo Working Paper Series, 6962.
[87] Weinberger, J. Cotler, T., & Fishman, D. (2010). The duality of affiliative motivation. In: O.Schultheiss & J. Brunstein (Eds.), Implicit Motives. Oxford: Oxford University Press.
[88] Wender, R. & Goulder, L. H. (2008). Status effects, public goods provision, and excess burden.Journal of Public Economics, 92(10-11), 1968-1985.
22

Extended workings
1. Derivation of the aggregate status utility from group realignment
We must take the limit of ∆Us/∆N∗ as ∆N∗ approaches zero:
dUs
dN∗= lim
∆N∗→0
∆Us
∆N∗
= lim∆N∗→0
∑k
ˆ ak
ak+∆ak
(∆Usi∆ak
· ∆ak∆N∗
+∆Usi∆ak
· ∆ak∆N∗
)dai
+
ˆ ak+∆ak
ak
(∆Usi∆ak
· ∆ak∆N∗
)dai.
Now consider the determinants of the term ∆ak/∆N∗. Since the upper boundary of the highest-status
group, a1, is equal to 1, we know that ∆a1/∆N∗ = 0, as it does not depend on N∗. The lower boundary of
this group, a1, is equal to 1−N∗ and therefore ∆a1/∆N∗ = −1. Equivalently, ∆a2/∆N
∗ = −1. Similarly,the lower boundary of the second-highest group, a2, is equal to 1− 2N∗ and therefore ∆a2/∆N
∗ = −2.We can see in general that ∆ak/∆N
∗ = −k and ∆ak/∆N∗ = − (k − 1). Finally, since the lower bound
of the rump group, aK+1, is equal to zero we therefore know that ∆aK+1/∆N∗ = 0.
This allows us to express the above:
dUs
dN∗=
ˆ 1
a1
(−∂U
si
∂ak
)dai + ∆Usa1
+
K−1∑k=2
(ˆ ak
ak
(− (k − 1)
∂Usi∂ak
− k · ∂Usi
∂ak
)dai + k ·∆Usak
)
+
ˆ aK
aK
(− (K − 1)
∂Usi∂aK
−K · ∂Usi
∂aK
)dai +K ·∆UsaK
+
ˆ aK+1
0
(−K · ∂U
si
∂ak
)dai
where
∆Usak =β
2(1− γ) (π + ε)N∗2
was the discrete jump in utility experienced by the marginal group member by moving from group k+ 1to group k; and ∆UsaK+1
= 0 as the rump group has no expellees. We can further simplify the above to
23

dUs
dN∗=− β
2(1− γ)N∗2π +
β
2(1− γ)N∗2 (π + ε)
+
K−1∑k=2
(−β
2(1− γ)N∗2 (kπ + (k − 1) ε) +
β
2(1− γ)N∗2k (π + ε)
)− β
2(1− γ)N∗2 (Kπ + (K − 1) ε) +
β
2(1− γ)K
((1−KN∗)2
π +N∗2ε)
− β
2(1− γ)K (1−KN∗)2
ε
=β
2(1− γ)N∗2ε
+β
2(1− γ)N∗2
K−1∑k=2
(−kπ + (1− k) ε+ k (π + ε))
− β
2(1− γ)K (1−KN∗)2
ε
=β
2(1− γ)N∗2ε
+β
2(1− γ)N∗2 (K − 2) ε
+β
2(1− γ)N∗2ε− 1
2(1− γ)K
(N∗2 − (1−KN∗)2
)π
− β
2(1− γ)K (1−KN∗)2
ε
=β
2(1− γ)K
(N∗2 − (1−KN∗)2
)(ε− π) .
2. Proof that dW/dN∗ > 0
We must show that
dW
dN∗= α− γλ+
β
2(1− γ)K
(N∗2 − (1−KN∗)2
)(ε− π) > 0
given the equilibrium group size condition N∗ = (α− λ) /βπ (1− γ) and the definition of the number ofgroups K, with KN∗ ≤ 1 and (K + 1)N∗ > 1. We know that the first term α = N∗βπ (1− γ) + λ, somaking this substitution and collecting terms we have
dW
dN∗= (1− γ)λ+ β (1− γ)
(πN∗ +
1
2K(N∗2 − (1−KN∗)2
)(ε− π)
)≥ βπ (1− γ)
(N∗ − 1
2K(N∗2 − (1−KN∗)2
))= βπ (1− γ)
(N∗ − 1
2K (N∗ − (1−KN∗)) (N∗ + (1−KN∗))
)≥ βπ (1− γ)
(N∗ − 1
2K (N∗ − (1−KN∗)) (N∗ +N∗)
)= βπ (1− γ)N∗ (1−K (N∗ − (1−KN∗)))= βπ (1− γ)N∗
(1−KN∗ +K2N∗
)≥ βπ (1− γ) (KN∗)
2
> 0.
24

3. Derivation of γ
Recall that the expression dW/dβ involved an expression for the number of groups K+1 which depends onγ in a non-linear fashion. For this reason, we evaluate this expression at the edge case where K = 1/N∗:
dW
dβ
∣∣∣∣K=1/N∗
= γ +γλ (α− λ)
β2π (1− γ)− α (α− λ)
β2π (1− γ)− (α− λ)N∗ (ε− π)
2βπ.
= γ +γλ
βN∗ − α
βN∗ − (α− λ)N∗ (ε− π)
2βπ
= γ −(α− γλβ
)N∗ −
(ε− π2πβ
)(α− λ)N∗
= γ −(α− λβ
)N∗(
1 +ε− π
2π
)− (1− γ)λ
βN∗
= γ − (N∗)2
(1− γ)
(π + ε
2
)− (1− γ)λ
βN∗
= γ −N∗ (1− γ)
(N∗(π + ε
2
)− λ
β
)= γ − N∗
2πβ((α− λ) (π + ε)− 2π (1− γ)λ)
γ − N∗
2πβ(α (π + ε)− λε− λπ (2γ − 1)) .
Setting dW/dβ
∣∣∣∣K=1/N∗
= 0 and solving for γ gives us
γ =N∗
2πβ(α (π + ε)− λε− λπ (2γ − 1))
→ γ
(1 + 2πλ · N
∗
2πβ
)=
N∗
2πβ(α (π + ε) + λ (π − ε))
→ γ
(1
N∗+λ
β
)=
1
2πβ(α (π + ε) + λ (π − ε))
→ γ ·(βπ (1− γ)
α− λ+λ
β
)=
1
2πβ(α (π + ε) + λ (π − ε))
→ − βπ
Aα− λγ2 +
(βπ
Aα− λ+λ
β
)γ =
1
2πβ(α (π + ε) + λ (π − ε)) .
An application of the quadratic formula gives us
γ = 12 + λ(α−λ)
2β2π+√
(α−λ)(α(ε+π)−λ(ε−π))
2β2π+(
12−
λ(α−λ)2β2π
)2.
4. Proof that dW/dπ, dW/dλ < 0
Note that both of these quotients are trivially negative if the quantity
(α− λ)2 − ((1− γ)βπ −K (α− λ))
2> 0.
Let us divide the above expression by (α− λ)2> 0:
1−(
1
N∗−K
)2
> 0
as K ≤ 1/N∗ < K + 1 by definition.
25

5. Proof that d2W/dβ dγβ ≥ 0
Recall the cross-partial derivative of welfare with respect to technological progress β and the gradient ofthe share of status goods with respect to technological progress γβ was
d2W
dβdγβ= β + (α− λ) ·
(− λβπ(1−γ)2
+ αβπ(1−γ)2
+K(N∗2−(1−KN∗)2)(ε−π)
2(1−γ)π
)
= β + (α− λ) ·
N∗
1− γ+K(N∗2 − (1−KN∗)2
)(ε− π)
2 (1− γ)π
≥ (α− λ) ·
N∗
1− γ−K(N∗2 − (1−KN∗)2
)2 (1− γ)
=α− λ1− γ
·(N∗ − 1
2K(N∗2 − (1−KN∗)2
))≥ 0 (see above).
26