technological progress - wiley
TRANSCRIPT
116
C H A P T E R 6
Technological Progress
Overview
Technological progress enables output to rise even if the capital stock or hours worked do not increase; it has
been the major force behind economic growth over time. Technical progress boosts output directly through the
production function and also by increasing the steady state capital stock. Foreign direct investment (FDI) is in-
creasingly important for transferring advanced technology from advanced nations to the emerging world and for
fostering convergence. In this chapter we examine each of these issues and consider how research and develop-
ment spending (R&D) generates technological progress. We also investigate how government policy for R&D af-
fects market failure.
Technological progress is often blamed for higher unemployment. We consider the theoretical and empirical
arguments and conclude that while technological progress does not cause higher aggregate unemployment, it can
have important distributional effects. We consider the sharp slowdown in productivity growth that the world econ-
omy experienced in the early 1970s. We then focus on the substantial increase in investment in the 1980s and the
advent of the “computer revolution.”
6.1. Introduction: What Is Technological Progress?
The production function tells us that we can boost output in three ways: by increas-ing the capital stock, by increasing employment, or by boosting total factor productivity(TFP). The problem with the first of these is that to increase the capital stock, invest-
ment has to increase, so that consumption, at least in the short run, has to be reduced.A similar disadvantage relates to the second—to boost output, hours worked have toincrease and leisure time decrease. But if we can increase TFP, we can boost outputwithout having to lower consumption even temporarily or work harder.
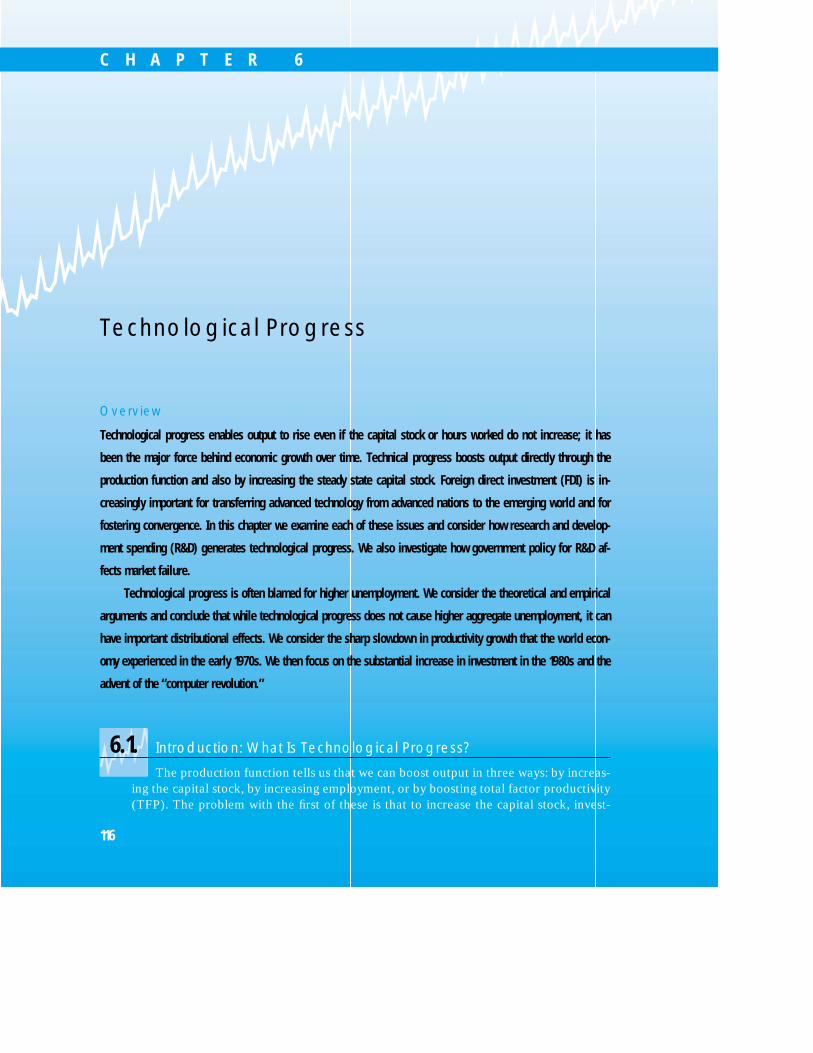
A key component of TFP is technological progress—through technologicalprogress, we can produce more output from the same level of employment and capital.We illustrate the benefits of technological progress in Figure 6.1. The solid line showsthe original production function; after technological progress, the production functionshifts out. For a given level of factor input (whether capital or labor) the economy cannow produce more output (B instead of A) without spending less or saving more. Truly,technological progress is wonderful.
Technological progress can and has taken many different forms.1 One useful dis-tinction is between invention and innovation. Invention is the discovery of new ideas,while innovation is about implementing them. Although we give inventions a higher so-cial status, historically innovations account for most of economic growth. When newtechnologies are invented, it is often impossible or too costly to implement them (for in-stance, Leonardo da Vinci allegedly designed the world’s first submarine and helicopterlong before people could construct such machines). Further, the first implementationsof a new invention are often not efficient or productive. For instance, during the Indus-trial Revolution in the UK in the eighteenth century, technological progress led to sub-stantial increases in productivity in the textile industry. However, even here innovationand improvement had more impact than invention. In 1738, Lewis Paul invented andpatented the use of rollers to replace fingers in spinning wool, but the technique was toounreliable to be widely adapted. The technology did not begin to be successful until1768 when Sir Richard Arkwright introduced a machine that used two rollers in spin-ning. Even then production did not soar until after 1779 when these techniques were in-corporated into the mule—41 years after the original invention.
In reviewing the history of technological change Mokyr distinguishes between“macroinventions” and “microinventions.” Macroinventions are radical changes in thenature of technology—such as the use of animals to provide power, and the shift first to
6.1 Introduction: What is Technological Progress? 117
New technology
Old technology
Capital or labor
Out
put
A
B
F I G U R E 6 . 1 Technological progressand output. An improvement intechnolgical knowledge increasesoutput for a given capital stock.
1See Mokyr The Lever of Riches (Oxford: Oxford University Press, 1990) for a fascinating tale oftechnological development and its causes and influences over the last 2000 years.
wind power, then to steam, and then to electricity. In each case a new and better way oforganizing production was discovered, and the discovery set in motion a widespreadprocess of adoption that boosted investment and output. By contrast, microinventionsimprove existing processes within the existing technological paradigm. For instance, theintroduction of wind power and the use of windmills were a macroinvention, but pro-ductivity could still improve through microinventions—selecting the optimal number ofblades on the windmill, angling these blades, making the windmill moveable to maxi-mize wind power, and so forth.
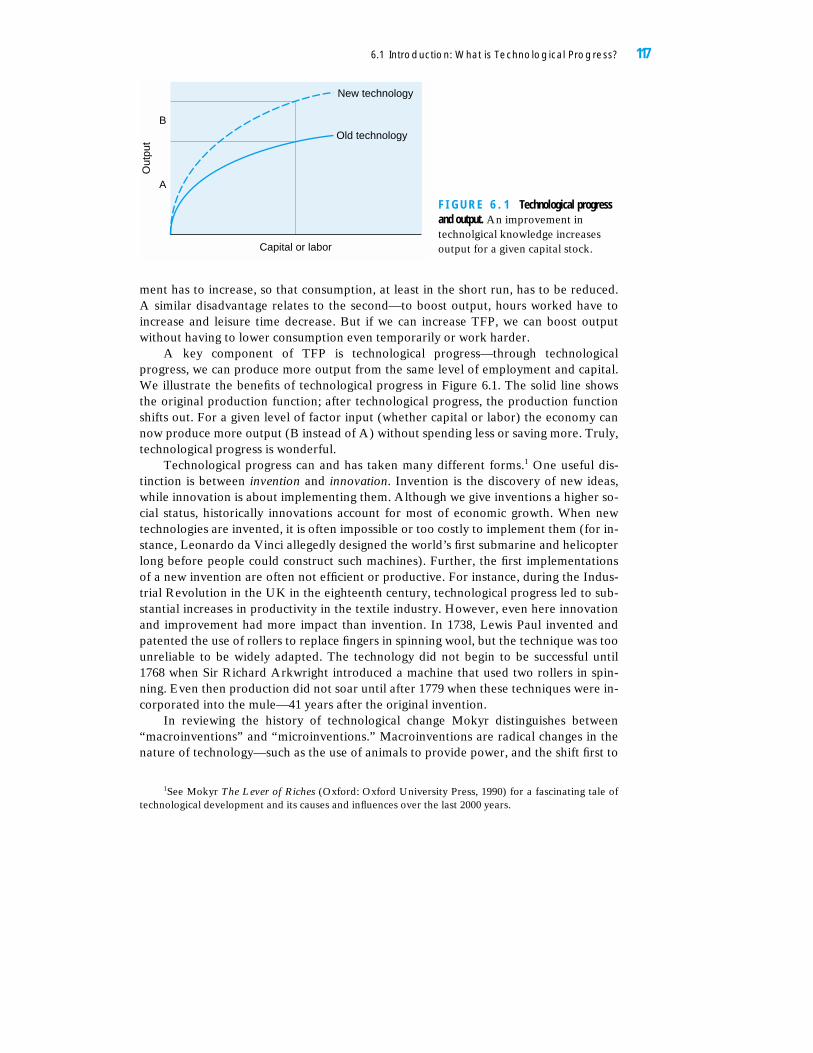
This distinction between macro-and microinventions suggests that economic devel-opment follows the process shown in Figure 6.2. Over time the marginal product of cap-ital varies considerably. When a macroinvention occurs, the productivity of capital risesand continues to increase as a sequence of microinventions boosts its effectiveness.However, eventually the marginal product of capital starts to decline as future microin-ventions, while profitable, boost output less and less. This process of declining return tocapital continues until a new macroinvention renews the process. At the end of thischapter, we shall return to this distinction between macro-and microinventions andconsider which category best describes recent developments in information technology.
6.2. Technological Progress and the Steady State
In Chapter 5 we showed that if the marginal product of capital declines with thelevel of the capital stock, eventually the economy must reach a steady state in which in-vestment equals depreciation and the capital stock is constant. At this point outputceases to grow through capital accumulation.
We now show that technological progress can produce continual growth in theeconomy through two channels. First, technological progress enables more output to beproduced from a given stock of capital and labor—as we saw in Figure 6.1. Second,technological progress enables a country to support a larger steady state capital stockand thus a higher level of output. In terms of the growth accounting of Chapter 5, we
118 C H A P T E R 6 Technological Progress
Innovation improveseffectiveness. . . buteventually returns
decline again
Microinventions exploit macroinventionbut ever lower return until. . .
Time
New macroinvention happens but atfirst new technology not very
polished or effective
Ret
urn
on c
apita
l
F I G U R E 6 . 2 Macro and microinventions over time. The return oncapital increasea after a majorinvention as its implications arerealized and it is incorporated innew investment.
will find that both TFP and capital accumulation have contributed to growth, althoughcapital accumulation would be lower without technological progress. Thus, technologi-cal progress means that a steady state is not fixed but changes over time.
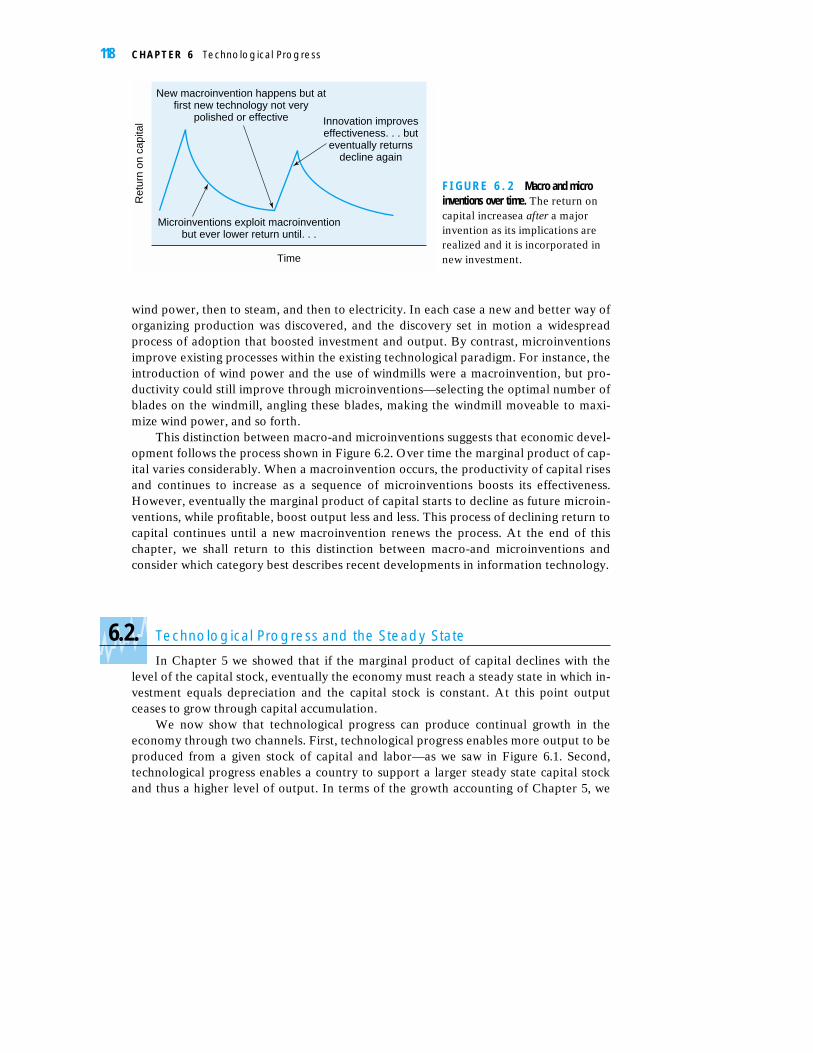
In Figure 6.3a we consider the same model used in Chapter 5 in which investmentequals 20% of output leading to steady state capital stock KA. Technological progressleads the production function to shift up, so that more output can be produced for agiven level of capital, which in turn means more investment. But at KA this higher levelof investment exceeds the amount needed to cover depreciation, so that net investmentis positive. Therefore the capital stock increases until it reaches a new steady statewhere investment equals depreciation—KB in Figure 6.3a
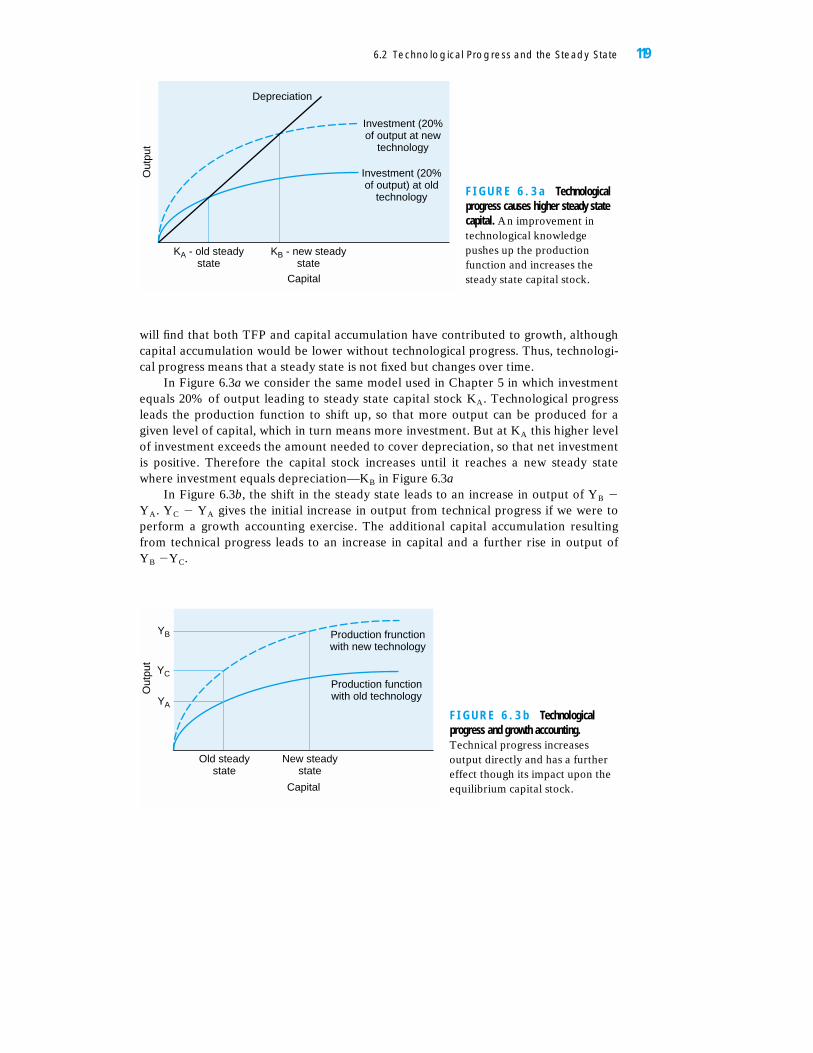
In Figure 6.3b, the shift in the steady state leads to an increase in output of YB �
YA. YC � YA gives the initial increase in output from technical progress if we were toperform a growth accounting exercise. The additional capital accumulation resultingfrom technical progress leads to an increase in capital and a further rise in output of YB �YC.
6.2 Technological Progress and the Steady State 119
KA - old steadystate
KB - new steadystate
Capital
Investment (20%of output at new
technology
Depreciation
Investment (20%of output) at old
technology
Out
put
F I G U R E 6 . 3 a Technologicalprogress causes higher steady statecapital. An improvement intechnological knowledgepushes up the productionfunction and increases thesteady state capital stock.
Old steadystate
New steadystate
Capital
Production frunctionwith new technology
Production functionwith old technologyO
utpu
t
YB
YC
YA
F I G U R E 6 . 3 b Technologicalprogress and growth accounting.Technical progress increasesoutput directly and has a furthereffect though its impact upon theequilibrium capital stock.

This analysis suggests that the incentives for firms to engage in R&D increase asfirms approach their steady state. We would therefore expect mature economies tofocus more on R&D than emerging markets, which will focus more on capital accumu-lation. Figures 6.4 and 6.5 support this hypothesis by showing increasing levels of R&Damong OECD economies and a substantive increase in South Korea as a rapid processof capital accumulation led to falling marginal product of capital.
6.3 Foreign Direct Investment and Technological Progress
Consider Figure 6.3b again and assume that YA is the level of GDP in an emergingeconomy and YB GDP in an OECD (i.e. developed) country. For convergence to occur,the emerging market needs both to increase its capital stock and gain access to thenew technology. Capital market flows can accelerate this process—if the advancednations invest funds in the emerging market, the funds can be used to finance capitalaccumulation.
Whether these capital flows occur depends on the relative return to investing in theadvanced and emerging markets. Figure 6.6 shows the marginal product of capital curve
120 C H A P T E R 6 Technological Progress
1971–75 1975–80 1980–85 1985–90 1990–960
0.5
1
1.5
2
2.5
0
10
20
30
40
50
60
70
R&
D a
s pe
rcen
t of G
DP
Per
cent
of R
&D
fina
nced
by b
usin
ess
Gross R&D (percent of GDP)
Percent of R&D financed bybusiness
F I G U R E 6 . 4 R&D aspercentage of OECD GDP.Research and developmentspending has risen inimportance in thedeveloped economies.Source: OECD, MainScience and TechnologyIndictors (1998).
0
1%
2%
3%
1967 1972 1977 1982 1984 1986R&D percent of GDP
1990 1992 1994 1996
0.47% 0.36%
1.09%1.44%
2.58% 2.79%
0.88%
1.83%2.08%
1.69%
F I G U R E 6 . 5 South Korean R&D as percentage of GDP. As the Korean economy developed and itscapital stock rose, R&D spending became important. Source: OECD, Main Science andTechnology Indictors (1998).
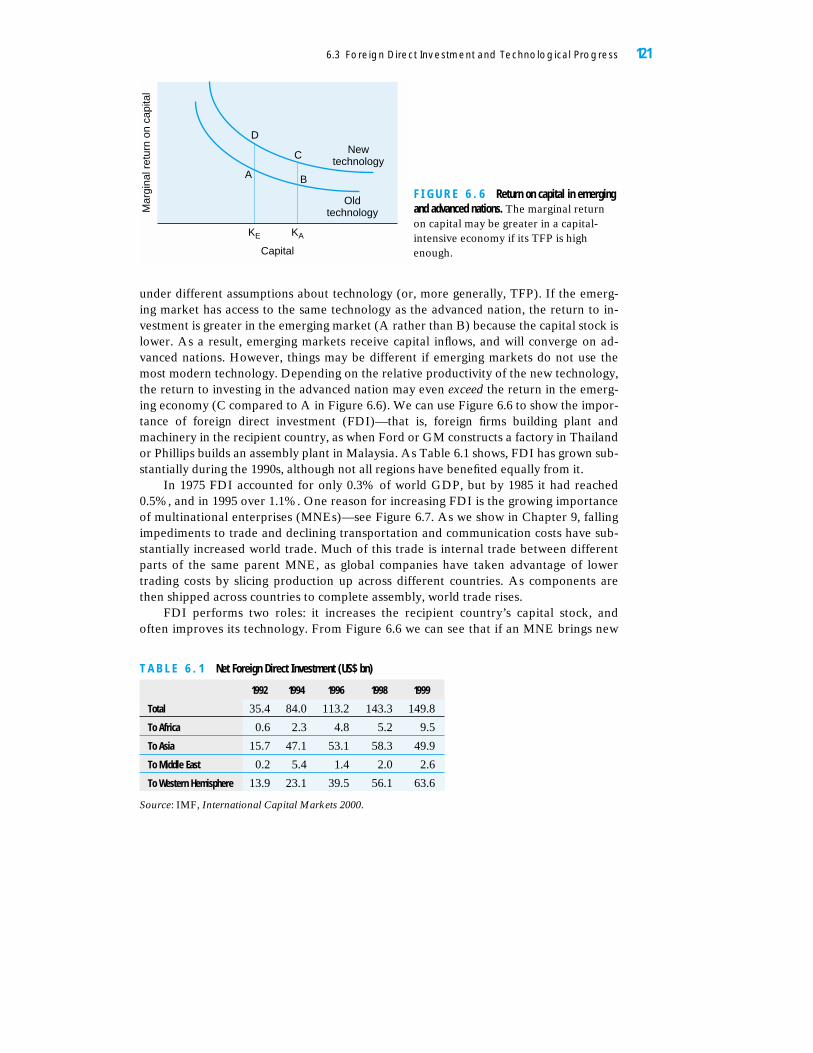
under different assumptions about technology (or, more generally, TFP). If the emerg-ing market has access to the same technology as the advanced nation, the return to in-vestment is greater in the emerging market (A rather than B) because the capital stock islower. As a result, emerging markets receive capital inflows, and will converge on ad-vanced nations. However, things may be different if emerging markets do not use themost modern technology. Depending on the relative productivity of the new technology,the return to investing in the advanced nation may even exceed the return in the emerg-ing economy (C compared to A in Figure 6.6). We can use Figure 6.6 to show the impor-tance of foreign direct investment (FDI)—that is, foreign firms building plant andmachinery in the recipient country, as when Ford or GM constructs a factory in Thailandor Phillips builds an assembly plant in Malaysia. As Table 6.1 shows, FDI has grown sub-stantially during the 1990s, although not all regions have benefited equally from it.
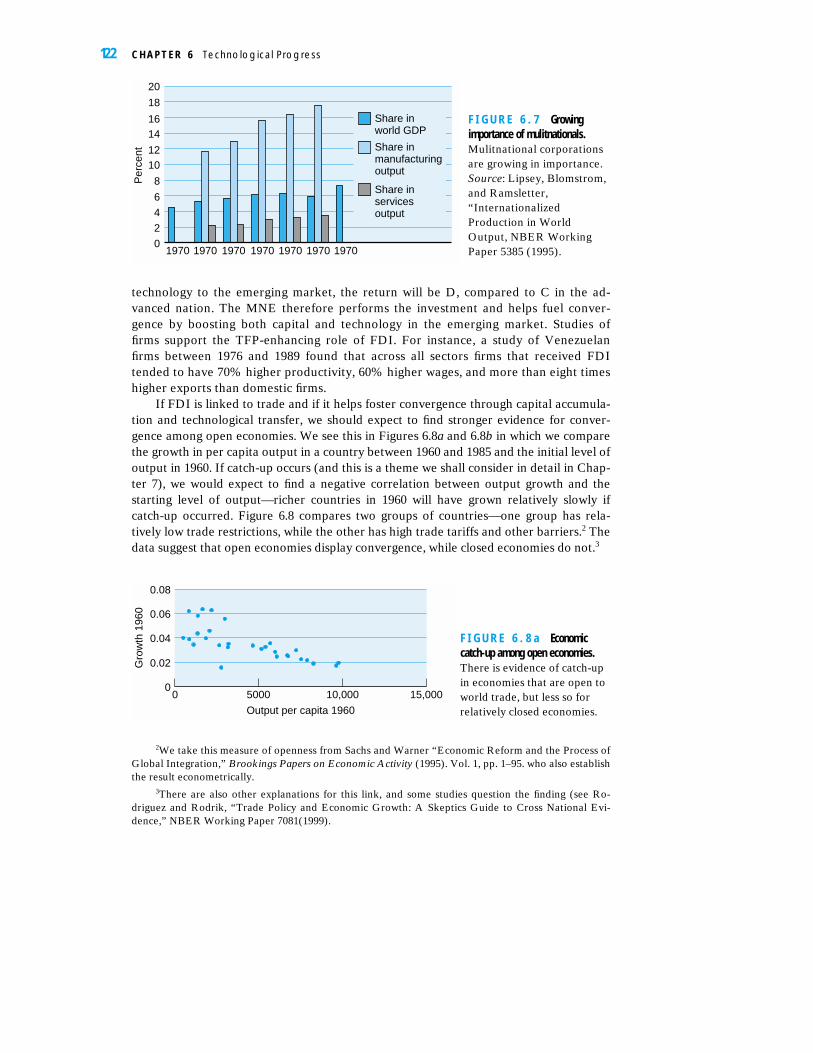
In 1975 FDI accounted for only 0.3% of world GDP, but by 1985 it had reached0.5%, and in 1995 over 1.1%. One reason for increasing FDI is the growing importanceof multinational enterprises (MNEs)—see Figure 6.7. As we show in Chapter 9, fallingimpediments to trade and declining transportation and communication costs have sub-stantially increased world trade. Much of this trade is internal trade between differentparts of the same parent MNE, as global companies have taken advantage of lowertrading costs by slicing production up across different countries. As components arethen shipped across countries to complete assembly, world trade rises.
FDI performs two roles: it increases the recipient country’s capital stock, andoften improves its technology. From Figure 6.6 we can see that if an MNE brings new
6.3 Foreign Direct Investment and Technological Progress 121
A
D
C
B
Capital
Mar
gina
l ret
urn
on c
apita
lNew
technology
Oldtechnology
KE KA
F I G U R E 6 . 6 Return on capital in emergingand advanced nations. The marginal returnon capital may be greater in a capital-intensive economy if its TFP is highenough.
T A B L E 6 . 1 Net Foreign Direct Investment (US$ bn)
1992 1994 1996 1998 1999
Total 35.4 84.0 113.2 143.3 149.8
To Africa 0.6 2.3 4.8 5.2 9.5
To Asia 15.7 47.1 53.1 58.3 49.9
To Middle East 0.2 5.4 1.4 2.0 2.6
To Western Hemisphere 13.9 23.1 39.5 56.1 63.6
Source: IMF, International Capital Markets 2000.
technology to the emerging market, the return will be D, compared to C in the ad-vanced nation. The MNE therefore performs the investment and helps fuel conver-gence by boosting both capital and technology in the emerging market. Studies offirms support the TFP-enhancing role of FDI. For instance, a study of Venezuelanfirms between 1976 and 1989 found that across all sectors firms that received FDItended to have 70% higher productivity, 60% higher wages, and more than eight timeshigher exports than domestic firms.
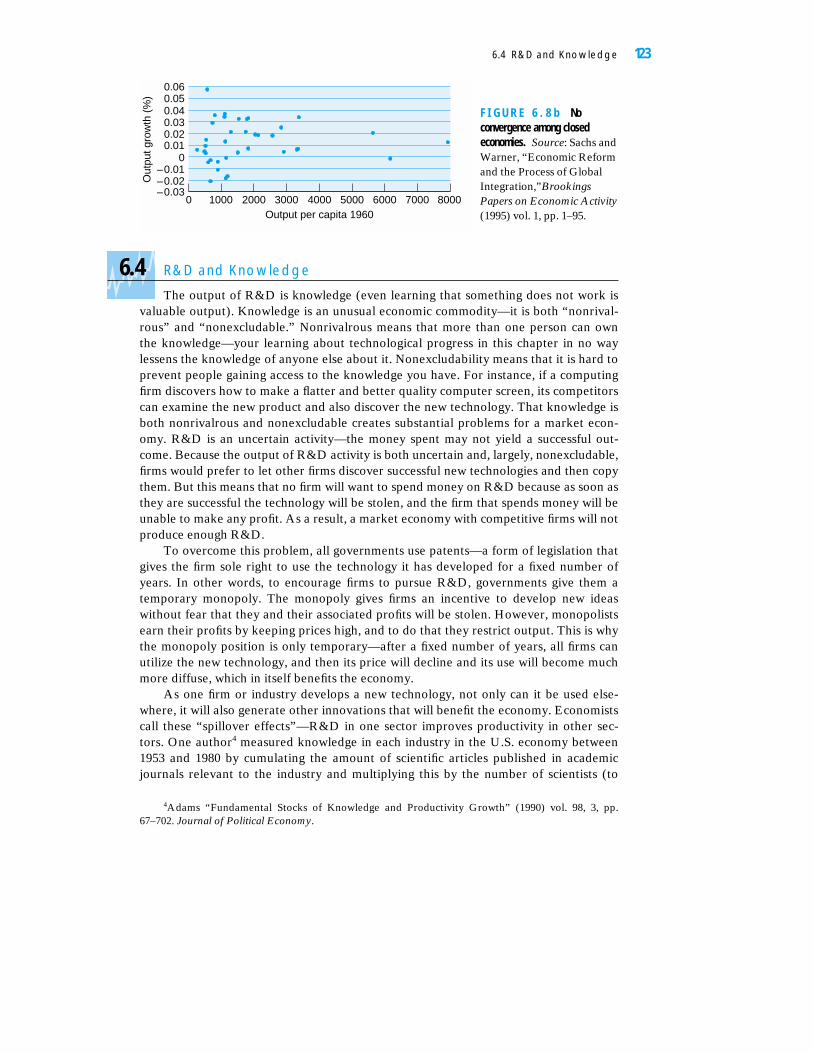
If FDI is linked to trade and if it helps foster convergence through capital accumula-tion and technological transfer, we should expect to find stronger evidence for conver-gence among open economies. We see this in Figures 6.8a and 6.8b in which we comparethe growth in per capita output in a country between 1960 and 1985 and the initial level ofoutput in 1960. If catch-up occurs (and this is a theme we shall consider in detail in Chap-ter 7), we would expect to find a negative correlation between output growth and thestarting level of output—richer countries in 1960 will have grown relatively slowly ifcatch-up occurred. Figure 6.8 compares two groups of countries—one group has rela-tively low trade restrictions, while the other has high trade tariffs and other barriers.2 Thedata suggest that open economies display convergence, while closed economies do not.3
122 C H A P T E R 6 Technological Progress
0
2
4
6
8
1012
1416
18
20
1970 1970 1970 1970 1970 1970 1970
Per
cent
Share inworld GDP
Share inmanufacturingoutput
Share inservicesoutput
F I G U R E 6 . 7 Growingimportance of mulitnationals.Mulitnational corporationsare growing in importance.Source: Lipsey, Blomstrom,and Ramsletter,“InternationalizedProduction in WorldOutput, NBER WorkingPaper 5385 (1995).
00 5000 10,000 15,000
0.02
0.04
0.06
0.08
Gro
wth
196
0
Output per capita 1960
F I G U R E 6 . 8 a Economiccatch-up among open economies.There is evidence of catch-upin economies that are open toworld trade, but less so forrelatively closed economies.
2We take this measure of openness from Sachs and Warner “Economic Reform and the Process ofGlobal Integration,” Brookings Papers on Economic Activity (1995). Vol. 1, pp. 1–95. who also establishthe result econometrically.
3There are also other explanations for this link, and some studies question the finding (see Ro-driguez and Rodrik, “Trade Policy and Economic Growth: A Skeptics Guide to Cross National Evi-dence,” NBER Working Paper 7081(1999).
6.4 R&D and Knowledge
The output of R&D is knowledge (even learning that something does not work isvaluable output). Knowledge is an unusual economic commodity—it is both “nonrival-rous” and “nonexcludable.” Nonrivalrous means that more than one person can ownthe knowledge—your learning about technological progress in this chapter in no waylessens the knowledge of anyone else about it. Nonexcludability means that it is hard toprevent people gaining access to the knowledge you have. For instance, if a computingfirm discovers how to make a flatter and better quality computer screen, its competitorscan examine the new product and also discover the new technology. That knowledge isboth nonrivalrous and nonexcludable creates substantial problems for a market econ-omy. R&D is an uncertain activity—the money spent may not yield a successful out-come. Because the output of R&D activity is both uncertain and, largely, nonexcludable,firms would prefer to let other firms discover successful new technologies and then copythem. But this means that no firm will want to spend money on R&D because as soon asthey are successful the technology will be stolen, and the firm that spends money will beunable to make any profit. As a result, a market economy with competitive firms will notproduce enough R&D.
To overcome this problem, all governments use patents—a form of legislation thatgives the firm sole right to use the technology it has developed for a fixed number ofyears. In other words, to encourage firms to pursue R&D, governments give them atemporary monopoly. The monopoly gives firms an incentive to develop new ideaswithout fear that they and their associated profits will be stolen. However, monopolistsearn their profits by keeping prices high, and to do that they restrict output. This is whythe monopoly position is only temporary—after a fixed number of years, all firms canutilize the new technology, and then its price will decline and its use will become muchmore diffuse, which in itself benefits the economy.
As one firm or industry develops a new technology, not only can it be used else-where, it will also generate other innovations that will benefit the economy. Economistscall these “spillover effects”—R&D in one sector improves productivity in other sec-tors. One author4 measured knowledge in each industry in the U.S. economy between1953 and 1980 by cumulating the amount of scientific articles published in academicjournals relevant to the industry and multiplying this by the number of scientists (to
6.4 R&D and Knowledge 123
–0.03–0.02–0.01
00.010.020.030.040.050.06
0 1000 2000 3000 4000 5000 6000 7000 8000Output per capita 1960
Out
put g
row
th (
%)
F I G U R E 6 . 8 b Noconvergence among closedeconomies. Source: Sachs andWarner, “Economic Reformand the Process of GlobalIntegration,”BrookingsPapers on Economic Activity(1995) vol. 1, pp. 1–95.
4Adams “Fundamental Stocks of Knowledge and Productivity Growth” (1990) vol. 98, 3, pp.67–702. Journal of Political Economy.
give an indicator of the number of people with access to technological knowledge multi-plied by the amount of knowledge).
He found that between 1953 and 1990 increases in this stock of industry-relevantknowledge accounted for around 0.35% growth in output per year. However, he alsofound that spillover effects from increased knowledge elsewhere in the economy gener-ated an additional 0.25% growth per year. Moreover, these spillovers can also occuracross countries, although their extent depends on how open an economy is to trade—the more closed the economy is, the less benefit it receives from R&D in other coun-tries. These spillover effects can be substantial—it has been estimated that a 1%increase in U.S. R&D leads to a 0.23% increase in U.S. TFP and, on average, a 0.04%boost to TFP in other OECD countries.5
6.5 Technological Progress and Unemployment
Ever since the Industrial Revolution gathered momentum, there has been concernthat technological progress causes unemployment. The most famous example is theLuddites who in nineteeth-century England smashed the machinery that they felt wouldmake them unemployed. Suspicion of technological progress is a recurrent theme. Onecommentator on the impact of information technology (IT) states:
While the entrepreneurial, managerial, professional and technical elites will be neces-sary to run the formal economy of the future, fewer and fewer workers will be re-quired to assist in the production of goods and services.6
We now consider the links between technological progress and unemploymentboth in theory and practice.
THE LUMP OF OUTPUT ARGUMENT
The basic argument for why technological progress creates unemployment runs like this:
Firms need to produce a certain amount of output to meet demand.Technological progress boosts productivity and means that less labor is required toproduce a given output.Unemployment therefore has to increase in response to technological progress.
The logic of this argument is impeccable—to deny its conclusions, we have to deny itsstarting point—that firms have to produce a given level of output. We show in the fol-lowing pages that this assumption is unlikely to be true. In response to technologicalprogress, output is not likely to remain fixed.
Before proceeding with our analysis, we should consider the historical evidencethat technological progress creates unemployment. Figures 6.9a–d show aggregate
124 C H A P T E R 6 Technological Progress
5Coe and Helpman, “International R&D Spillovers,” European Economic Review (1995) vol. 35,pp. 859–887.
6Rifkin, The End of Work Harmondsworth: Penguin, 2000.
125
1920
1920 1925 1930 1935 1950 1955 1960 1965 1970 1975 1980 1985
1926 1932 1938 1954 1960 1966 1972 1978 1984
0
02468
1012141618
2468
101214161820
Per
cent
Per
cent
Unemployment Rate
Unemployment Rate
Australia
Austria
Belgium
Canada
Denmark
Finland
France
Germany
1926 1932 1938 1954 1960 1966 1972 1978 1984 19900
2
4
6
8
10
12
14
1925 1930 1935 1950 1955 1960 1965 1970 1975 1980 1985 19900
5
10
15
20
25
30Unemployment Rate
Unemployment Rate
Italy
Japan
Netherlands
Norway
Sweden
Switzerland
U.K.
U.S.
Per
cent
Per
cent
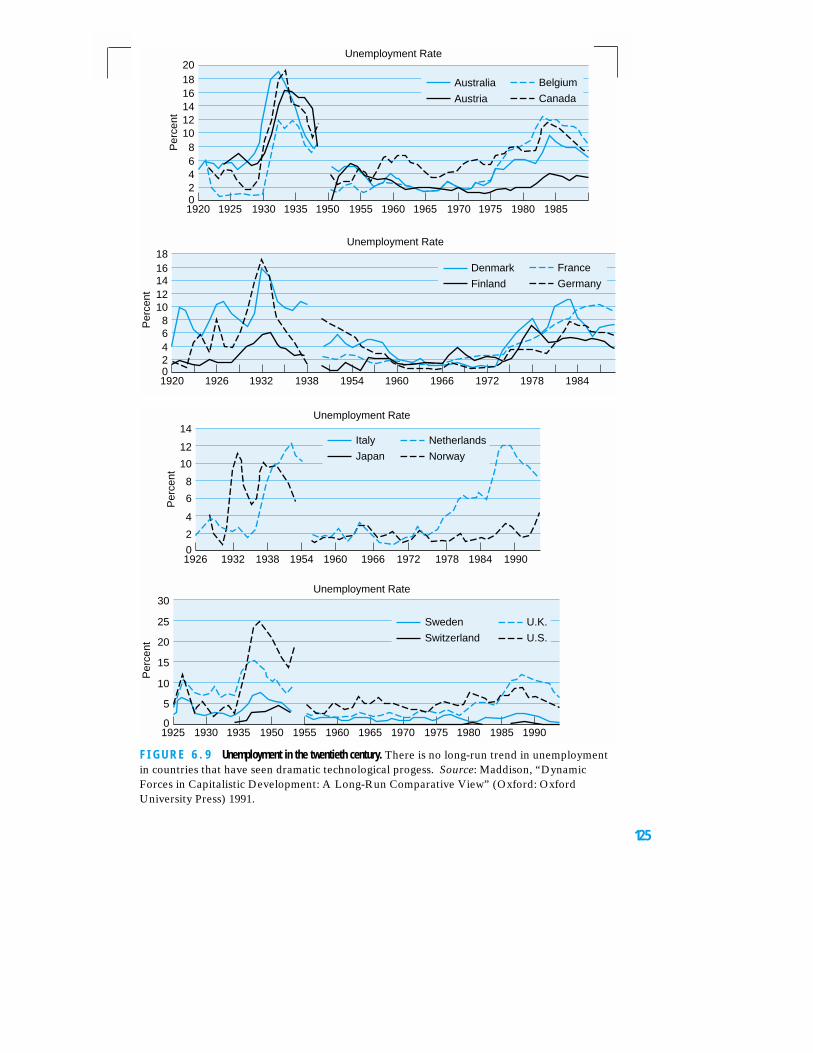
F I G U R E 6 . 9 Unemployment in the twentieth century. There is no long-run trend in unemploymentin countries that have seen dramatic technological progess. Source: Maddison, “DynamicForces in Capitalistic Development: A Long-Run Comparative View” (Oxford: OxfordUniversity Press) 1991.
unemployment in a range of countries between 1920 and 1989 (with missing data for thewar years 1939–1945). During this period substantial technological progress occurred,but no sustained increase in unemployment—for most countries the level of unemploy-ment is similar at the beginning and at the end of the sample. The twentieth century of-fers little support for the idea that technological progress creates unemployment.
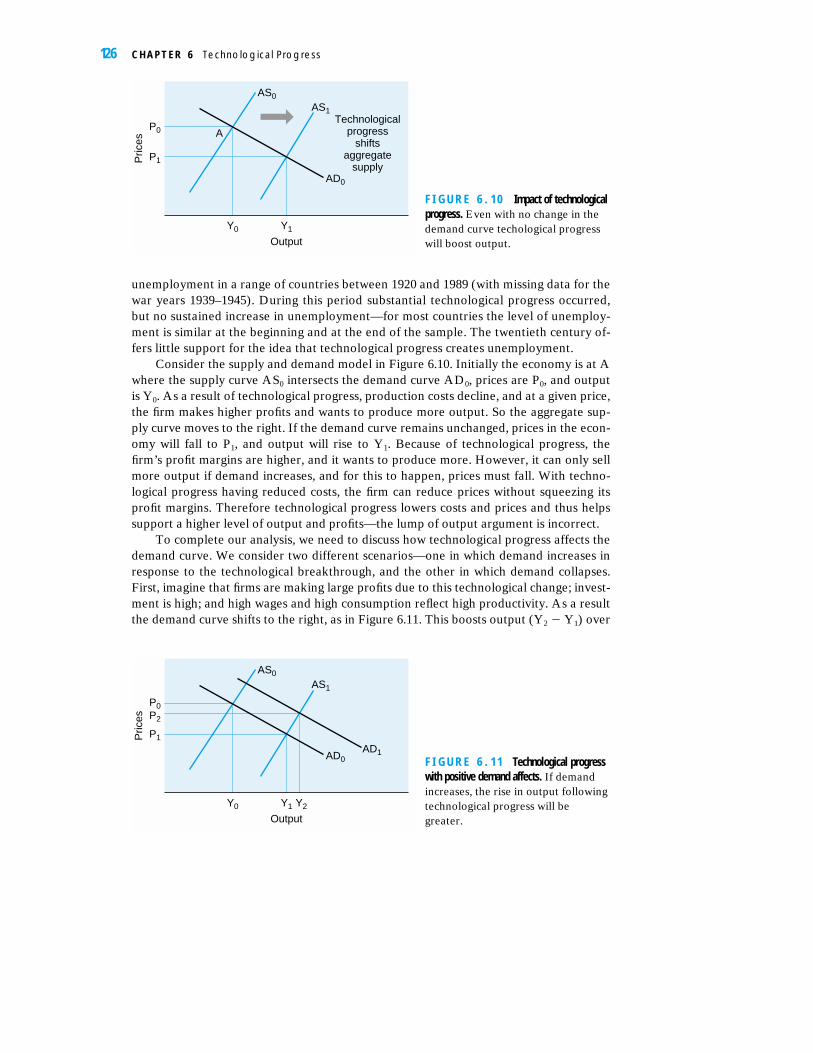
Consider the supply and demand model in Figure 6.10. Initially the economy is at Awhere the supply curve AS0 intersects the demand curve AD0, prices are P0, and outputis Y0. As a result of technological progress, production costs decline, and at a given price,the firm makes higher profits and wants to produce more output. So the aggregate sup-ply curve moves to the right. If the demand curve remains unchanged, prices in the econ-omy will fall to P1, and output will rise to Y1. Because of technological progress, thefirm’s profit margins are higher, and it wants to produce more. However, it can only sellmore output if demand increases, and for this to happen, prices must fall. With techno-logical progress having reduced costs, the firm can reduce prices without squeezing itsprofit margins. Therefore technological progress lowers costs and prices and thus helpssupport a higher level of output and profits—the lump of output argument is incorrect.
To complete our analysis, we need to discuss how technological progress affects thedemand curve. We consider two different scenarios—one in which demand increases inresponse to the technological breakthrough, and the other in which demand collapses.First, imagine that firms are making large profits due to this technological change; invest-ment is high; and high wages and high consumption reflect high productivity. As a resultthe demand curve shifts to the right, as in Figure 6.11. This boosts output (Y2 � Y1) over
126 C H A P T E R 6 Technological Progress
A
AS0
AS1
AD0
Y0
Output
Y1
P1
P0P
rices
Technologicalprogress
shiftsaggregate
supply
F I G U R E 6 . 1 0 Impact of technologicalprogress. Even with no change in thedemand curve techological progresswill boost output.
AS0
AS1
AD0AD1
Y0
Output
Y1 Y2
P1
P0P2
Pric
es
F I G U R E 6 . 1 1 Technological progresswith positive demand affects. If demandincreases, the rise in output followingtechnological progress will begreater.
and above that which comes from the shift in the supply curve (Y1 � Y0). Again in re-sponse to technical progress, an increase in output benefits the economy—in contradic-tion to the lump of output argument. Note that while the effect on output isunambiguous, prices may rise or fall depending on the relative strength of the supply anddemand shift.
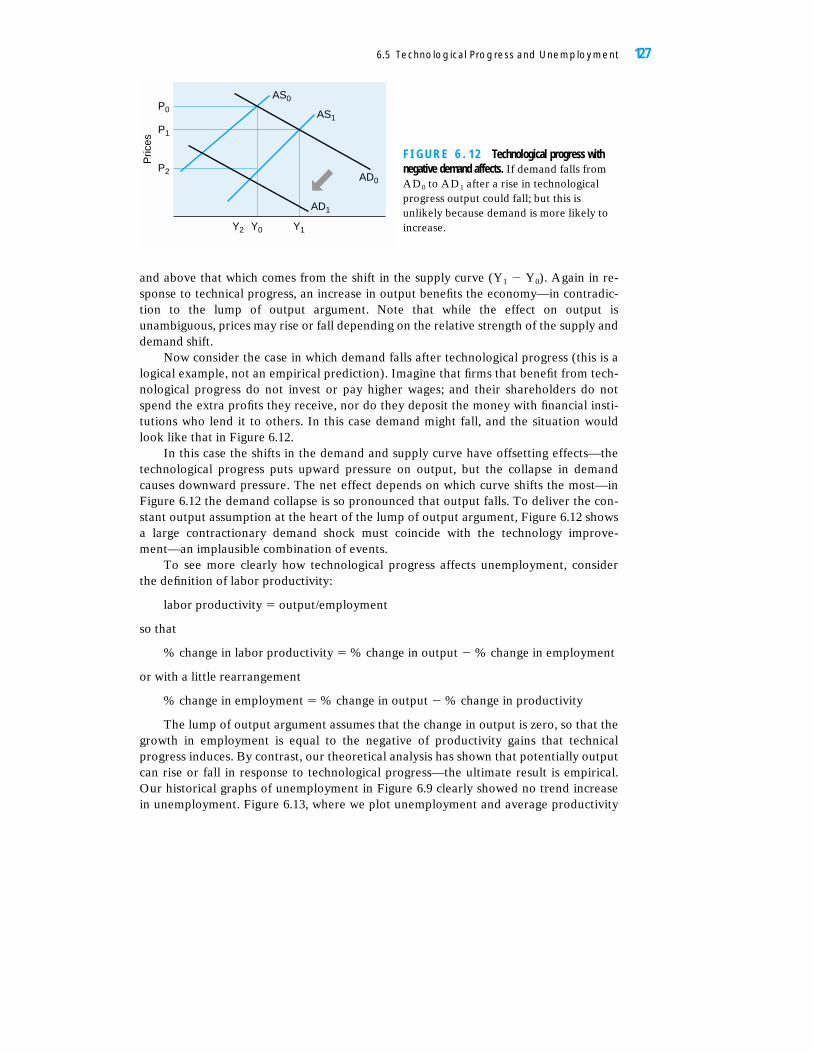
Now consider the case in which demand falls after technological progress (this is alogical example, not an empirical prediction). Imagine that firms that benefit from tech-nological progress do not invest or pay higher wages; and their shareholders do notspend the extra profits they receive, nor do they deposit the money with financial insti-tutions who lend it to others. In this case demand might fall, and the situation wouldlook like that in Figure 6.12.
In this case the shifts in the demand and supply curve have offsetting effects—thetechnological progress puts upward pressure on output, but the collapse in demandcauses downward pressure. The net effect depends on which curve shifts the most—inFigure 6.12 the demand collapse is so pronounced that output falls. To deliver the con-stant output assumption at the heart of the lump of output argument, Figure 6.12 showsa large contractionary demand shock must coincide with the technology improve-ment—an implausible combination of events.
To see more clearly how technological progress affects unemployment, considerthe definition of labor productivity:
labor productivity � output/employment
so that
% change in labor productivity � % change in output � % change in employment
or with a little rearrangement
% change in employment � % change in output � % change in productivity
The lump of output argument assumes that the change in output is zero, so that thegrowth in employment is equal to the negative of productivity gains that technicalprogress induces. By contrast, our theoretical analysis has shown that potentially outputcan rise or fall in response to technological progress—the ultimate result is empirical.Our historical graphs of unemployment in Figure 6.9 clearly showed no trend increasein unemployment. Figure 6.13, where we plot unemployment and average productivity
6.5 Technological Progress and Unemployment 127
P2
Y2
AS0
AS1
AD0
AD1
Y0 Y1
P1
P0
Pric
esF I G U R E 6 . 1 2 Technological progress withnegative demand affects. If demand falls fromAD0 to AD1 after a rise in technologicalprogress output could fall; but this isunlikely because demand is more likely toincrease.
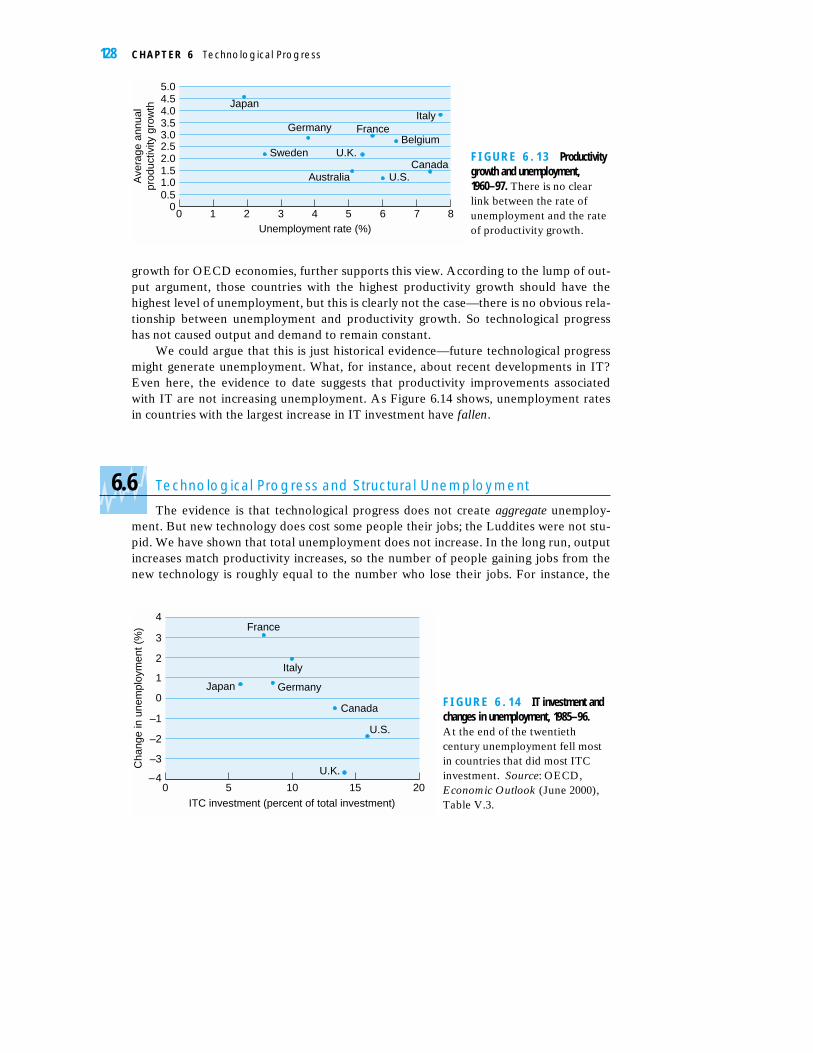
growth for OECD economies, further supports this view. According to the lump of out-put argument, those countries with the highest productivity growth should have thehighest level of unemployment, but this is clearly not the case—there is no obvious rela-tionship between unemployment and productivity growth. So technological progresshas not caused output and demand to remain constant.
We could argue that this is just historical evidence—future technological progressmight generate unemployment. What, for instance, about recent developments in IT?Even here, the evidence to date suggests that productivity improvements associatedwith IT are not increasing unemployment. As Figure 6.14 shows, unemployment ratesin countries with the largest increase in IT investment have fallen.
6.6 Technological Progress and Structural Unemployment
The evidence is that technological progress does not create aggregate unemploy-ment. But new technology does cost some people their jobs; the Luddites were not stu-pid. We have shown that total unemployment does not increase. In the long run, outputincreases match productivity increases, so the number of people gaining jobs from thenew technology is roughly equal to the number who lose their jobs. For instance, the
128 C H A P T E R 6 Technological Progress
Japan
Germany
Sweden
France
U.K.
Australia U.S.Canada
Italy
Belgium
0 1 2 3 4 5 6 7 80
0.51.01.52.02.53.03.54.04.55.0
Unemployment rate (%)
Ave
rage
ann
ual
prod
uctiv
ity g
row
thF I G U R E 6 . 1 3 Productivitygrowth and unemployment,1960–97. There is no clearlink between the rate ofunemployment and the rateof productivity growth.
0–4
–3
–2
–1
0
1
2
3
4
5 10 15 20
ITC investment (percent of total investment)
Cha
nge
in u
nem
ploy
men
t (%
) France
Italy
GermanyJapan
Canada
U.S.
U.K.
F I G U R E 6 . 1 4 IT investment andchanges in unemployment, 1985–96. At the end of the twentiethcentury unemployment fell mostin countries that did most ITCinvestment. Source: OECD,Economic Outlook (June 2000),Table V.3.
employees who used to work in the typewriting industry can get jobs in firms producingcomputer keyboards. Technological progress puts the economy through a process of“creative destruction”—some firms and industries decline, while others expand. Thepace of this process depends on how efficient the economy is. If banks tend not to lendto new businesses; if housing market restrictions mean that people tend not to movefrom high unemployment areas to low unemployment ones; if people lack the relevantskills or live where industries are not expanding, this reallocation process can take along time. In the short run, unemployment may increase before new jobs are createdand filled. This process is shown in the film The Full Monty in which a group of steel-workers are unemployed and lack the skills to find alternative employment in the areaand are unwilling to move away. It takes a while before they can retrain and find alter-native employment—albeit as a male strip act!
Therefore, while technological progress does not create additional aggregate un-employment, it does affect the composition of unemployment (across regions and skillcategories). Governments, therefore, must ensure that labor markets can deal effec-tively with this creative destruction by providing training, assistance with job applica-tions, and a safety net for those who cannot find new jobs. While in the aggregate theeconomy benefits from technological progress, it causes distributional problems.
6.7. The Impact of IT on the Economy
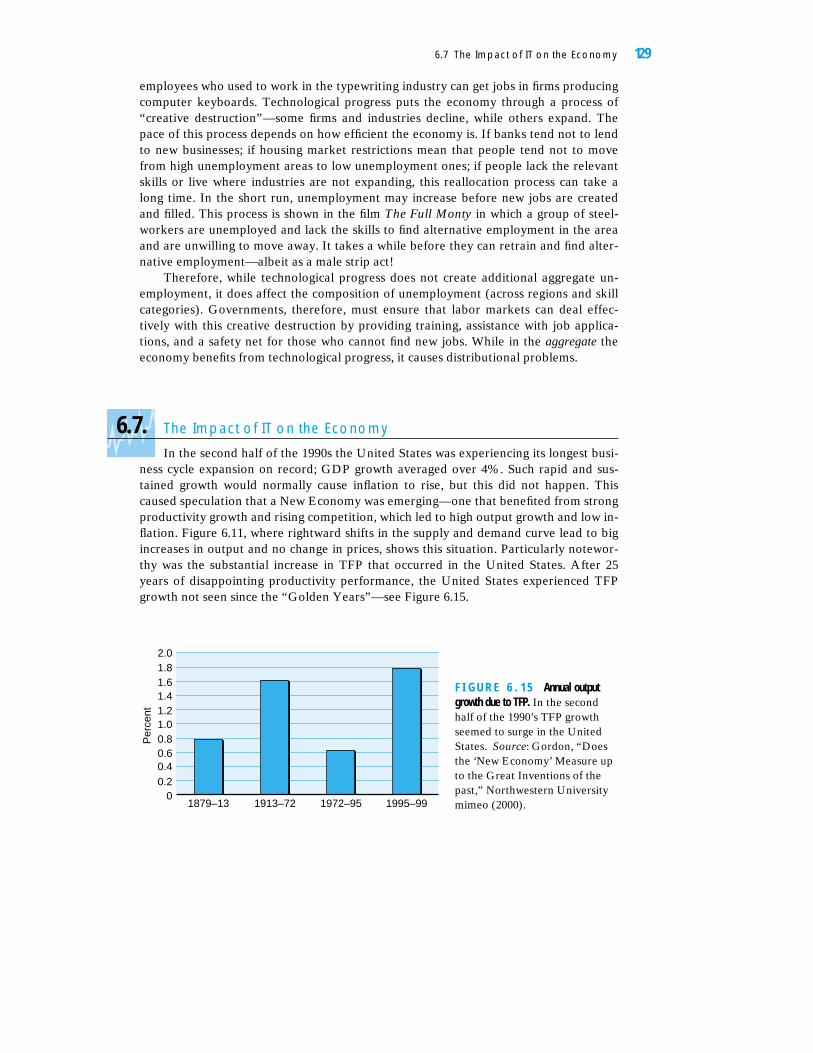
In the second half of the 1990s the United States was experiencing its longest busi-ness cycle expansion on record; GDP growth averaged over 4%. Such rapid and sus-tained growth would normally cause inflation to rise, but this did not happen. Thiscaused speculation that a New Economy was emerging—one that benefited from strongproductivity growth and rising competition, which led to high output growth and low in-flation. Figure 6.11, where rightward shifts in the supply and demand curve lead to bigincreases in output and no change in prices, shows this situation. Particularly notewor-thy was the substantial increase in TFP that occurred in the United States. After 25years of disappointing productivity performance, the United States experienced TFPgrowth not seen since the “Golden Years”—see Figure 6.15.
6.7 The Impact of IT on the Economy 129
1879–13 1913–72 1972–95 1995–990
0.20.40.60.81.01.21.41.61.82.0
Per
cent
F I G U R E 6 . 1 5 Annual outputgrowth due to TFP. In the secondhalf of the 1990’s TFP growthseemed to surge in the UnitedStates. Source: Gordon, “Doesthe ‘New Economy’ Measure upto the Great Inventions of thepast,” Northwestern Universitymimeo (2000).
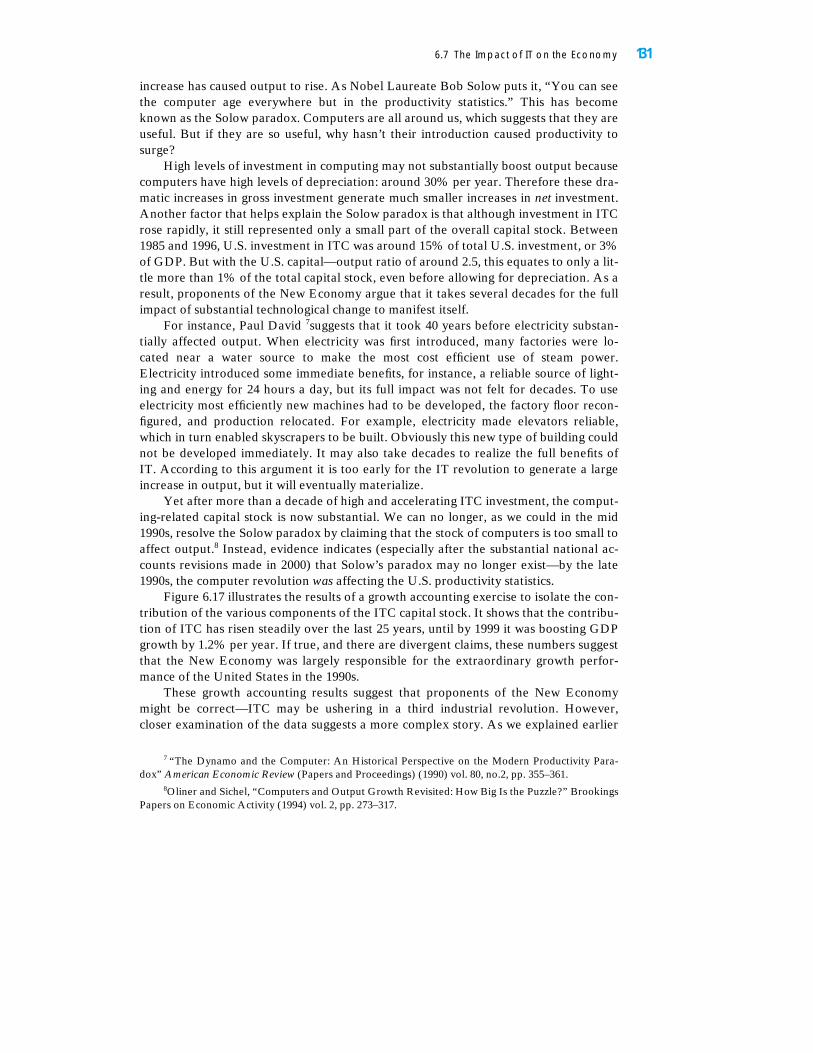
Along with these productivity gains, substantial investment was taking place in ITC(information technology and communications equipment). As Table 6.2 shows, thestock of ITC-related capital has increased dramatically since the mid 1970s but acceler-ated after 1995 with the development of the World Wide Web. Many commentatorsdate the beginnings of the New Economy to these rapid developments in ITC.
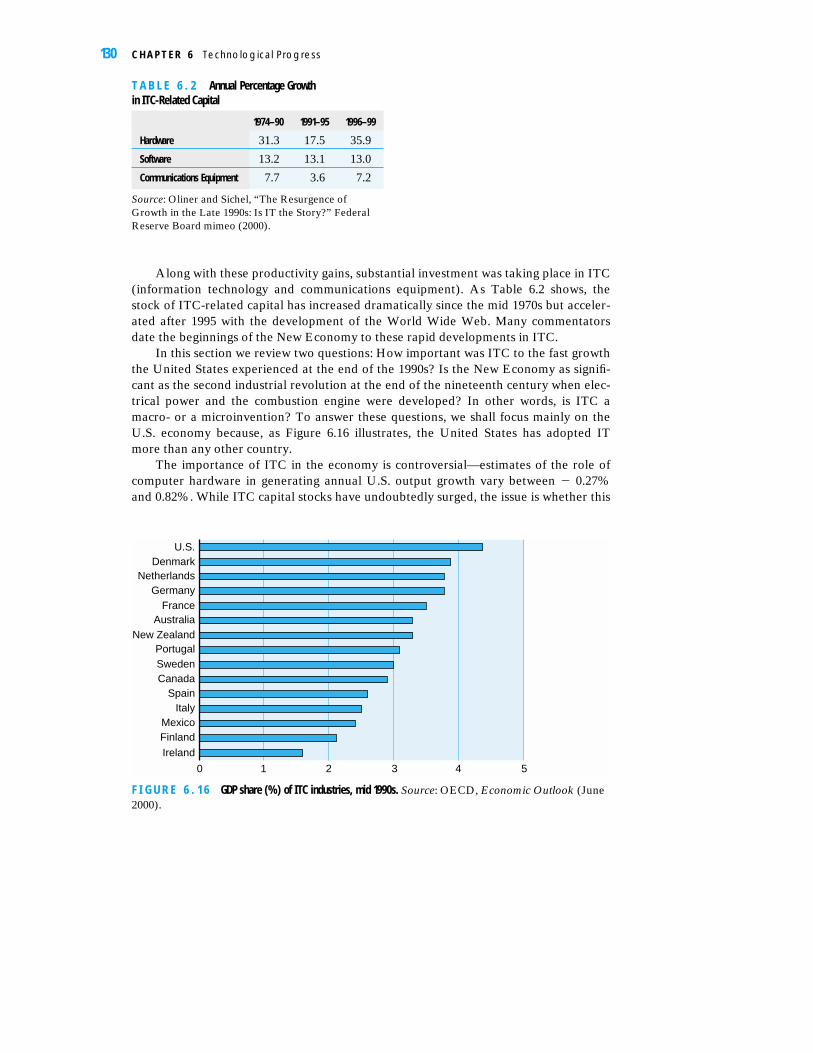
In this section we review two questions: How important was ITC to the fast growththe United States experienced at the end of the 1990s? Is the New Economy as signifi-cant as the second industrial revolution at the end of the nineteenth century when elec-trical power and the combustion engine were developed? In other words, is ITC amacro- or a microinvention? To answer these questions, we shall focus mainly on theU.S. economy because, as Figure 6.16 illustrates, the United States has adopted ITmore than any other country.
The importance of ITC in the economy is controversial—estimates of the role ofcomputer hardware in generating annual U.S. output growth vary between � 0.27%and 0.82%. While ITC capital stocks have undoubtedly surged, the issue is whether this
130 C H A P T E R 6 Technological Progress
T A B L E 6 . 2 Annual Percentage Growth in ITC-Related Capital
1974–90 1991–95 1996–99
Hardware 31.3 17.5 35.9
Software 13.2 13.1 13.0
Communications Equipment 7.7 3.6 7.2
Source: Oliner and Sichel, “The Resurgence ofGrowth in the Late 1990s: Is IT the Story?” FederalReserve Board mimeo (2000).
0 1 2 3 4 5
U.S.Denmark
NetherlandsGermany
FranceAustralia
New ZealandPortugalSwedenCanada
SpainItaly
MexicoFinland
Ireland
F I G U R E 6 . 1 6 GDP share (%) of ITC industries, mid 1990s. Source: OECD, Economic Outlook (June2000).
increase has caused output to rise. As Nobel Laureate Bob Solow puts it, “You can seethe computer age everywhere but in the productivity statistics.” This has becomeknown as the Solow paradox. Computers are all around us, which suggests that they areuseful. But if they are so useful, why hasn’t their introduction caused productivity tosurge?
High levels of investment in computing may not substantially boost output becausecomputers have high levels of depreciation: around 30% per year. Therefore these dra-matic increases in gross investment generate much smaller increases in net investment.Another factor that helps explain the Solow paradox is that although investment in ITCrose rapidly, it still represented only a small part of the overall capital stock. Between1985 and 1996, U.S. investment in ITC was around 15% of total U.S. investment, or 3%of GDP. But with the U.S. capital—output ratio of around 2.5, this equates to only a lit-tle more than 1% of the total capital stock, even before allowing for depreciation. As aresult, proponents of the New Economy argue that it takes several decades for the fullimpact of substantial technological change to manifest itself.
For instance, Paul David 7suggests that it took 40 years before electricity substan-tially affected output. When electricity was first introduced, many factories were lo-cated near a water source to make the most cost efficient use of steam power.Electricity introduced some immediate benefits, for instance, a reliable source of light-ing and energy for 24 hours a day, but its full impact was not felt for decades. To useelectricity most efficiently new machines had to be developed, the factory floor recon-figured, and production relocated. For example, electricity made elevators reliable,which in turn enabled skyscrapers to be built. Obviously this new type of building couldnot be developed immediately. It may also take decades to realize the full benefits ofIT. According to this argument it is too early for the IT revolution to generate a largeincrease in output, but it will eventually materialize.
Yet after more than a decade of high and accelerating ITC investment, the comput-ing-related capital stock is now substantial. We can no longer, as we could in the mid1990s, resolve the Solow paradox by claiming that the stock of computers is too small toaffect output.8 Instead, evidence indicates (especially after the substantial national ac-counts revisions made in 2000) that Solow’s paradox may no longer exist—by the late1990s, the computer revolution was affecting the U.S. productivity statistics.
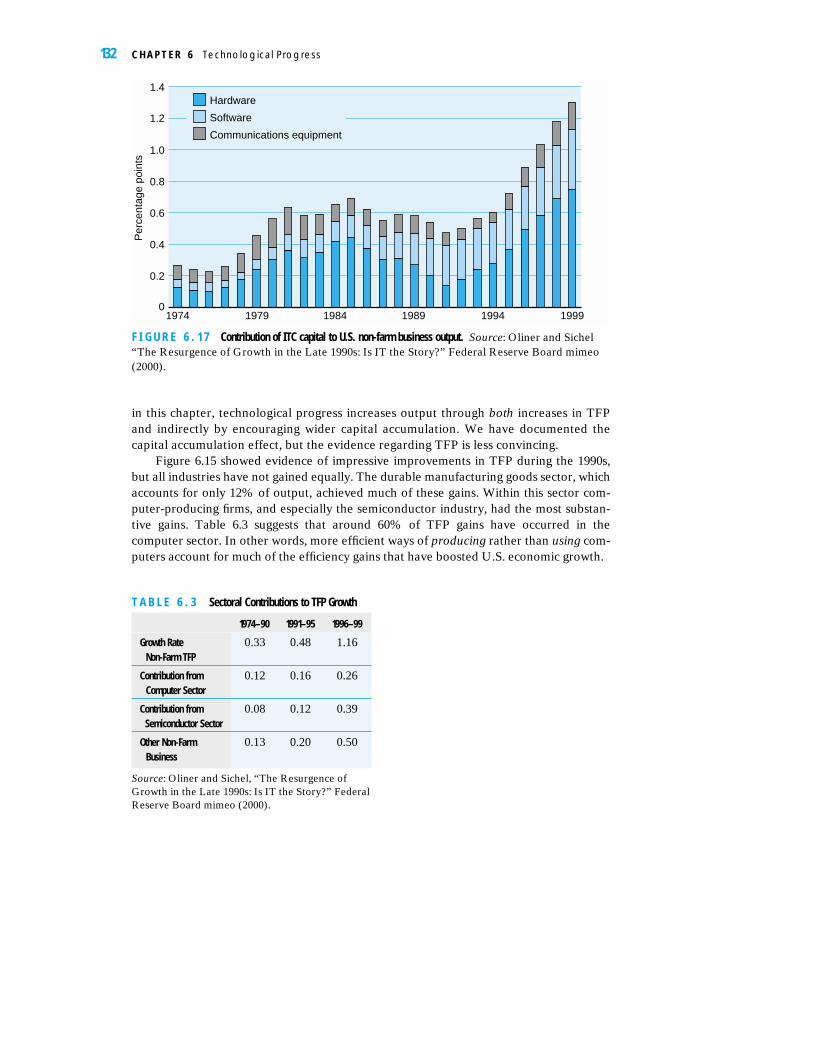
Figure 6.17 illustrates the results of a growth accounting exercise to isolate the con-tribution of the various components of the ITC capital stock. It shows that the contribu-tion of ITC has risen steadily over the last 25 years, until by 1999 it was boosting GDPgrowth by 1.2% per year. If true, and there are divergent claims, these numbers suggestthat the New Economy was largely responsible for the extraordinary growth perfor-mance of the United States in the 1990s.
These growth accounting results suggest that proponents of the New Economymight be correct—ITC may be ushering in a third industrial revolution. However,closer examination of the data suggests a more complex story. As we explained earlier
6.7 The Impact of IT on the Economy 131
7 “The Dynamo and the Computer: An Historical Perspective on the Modern Productivity Para-dox” American Economic Review (Papers and Proceedings) (1990) vol. 80, no.2, pp. 355–361.
8Oliner and Sichel, “Computers and Output Growth Revisited: How Big Is the Puzzle?” BrookingsPapers on Economic Activity (1994) vol. 2, pp. 273–317.
in this chapter, technological progress increases output through both increases in TFPand indirectly by encouraging wider capital accumulation. We have documented thecapital accumulation effect, but the evidence regarding TFP is less convincing.
Figure 6.15 showed evidence of impressive improvements in TFP during the 1990s,but all industries have not gained equally. The durable manufacturing goods sector, whichaccounts for only 12% of output, achieved much of these gains. Within this sector com-puter-producing firms, and especially the semiconductor industry, had the most substan-tive gains. Table 6.3 suggests that around 60% of TFP gains have occurred in thecomputer sector. In other words, more efficient ways of producing rather than using com-puters account for much of the efficiency gains that have boosted U.S. economic growth.
132 C H A P T E R 6 Technological Progress
1974 1979 1984 1989 1994 19990
0.2
0.4
0.6
0.8
1.0
1.2
1.4Hardware
Software
Communications equipmentP
erce
ntag
e po
ints
F I G U R E 6 . 1 7 Contribution of ITC capital to U.S. non-farm business output. Source: Oliner and Sichel“The Resurgence of Growth in the Late 1990s: Is IT the Story?” Federal Reserve Board mimeo(2000).
T A B L E 6 . 3 Sectoral Contributions to TFP Growth
1974–90 1991–95 1996–99
Growth Rate 0.33 0.48 1.16Non-Farm TFP
Contribution from 0.12 0.16 0.26Computer Sector
Contribution from 0.08 0.12 0.39Semiconductor Sector
Other Non-Farm 0.13 0.20 0.50Business
Source: Oliner and Sichel, “The Resurgence ofGrowth in the Late 1990s: Is IT the Story?” FederalReserve Board mimeo (2000).
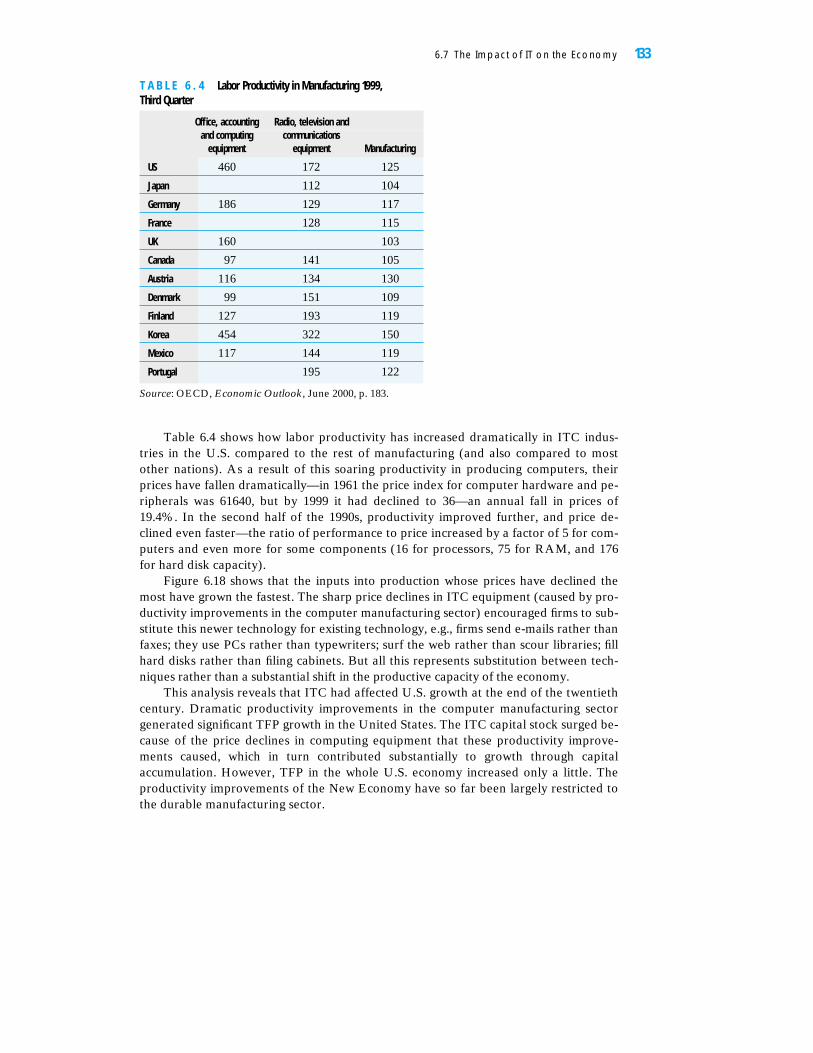
Table 6.4 shows how labor productivity has increased dramatically in ITC indus-tries in the U.S. compared to the rest of manufacturing (and also compared to mostother nations). As a result of this soaring productivity in producing computers, theirprices have fallen dramatically—in 1961 the price index for computer hardware and pe-ripherals was 61640, but by 1999 it had declined to 36—an annual fall in prices of19.4%. In the second half of the 1990s, productivity improved further, and price de-clined even faster—the ratio of performance to price increased by a factor of 5 for com-puters and even more for some components (16 for processors, 75 for RAM, and 176for hard disk capacity).
Figure 6.18 shows that the inputs into production whose prices have declined themost have grown the fastest. The sharp price declines in ITC equipment (caused by pro-ductivity improvements in the computer manufacturing sector) encouraged firms to sub-stitute this newer technology for existing technology, e.g., firms send e-mails rather thanfaxes; they use PCs rather than typewriters; surf the web rather than scour libraries; fillhard disks rather than filing cabinets. But all this represents substitution between tech-niques rather than a substantial shift in the productive capacity of the economy.
This analysis reveals that ITC had affected U.S. growth at the end of the twentiethcentury. Dramatic productivity improvements in the computer manufacturing sectorgenerated significant TFP growth in the United States. The ITC capital stock surged be-cause of the price declines in computing equipment that these productivity improve-ments caused, which in turn contributed substantially to growth through capitalaccumulation. However, TFP in the whole U.S. economy increased only a little. Theproductivity improvements of the New Economy have so far been largely restricted tothe durable manufacturing sector.
6.7 The Impact of IT on the Economy 133
T A B L E 6 . 4 Labor Productivity in Manufacturing 1999, Third Quarter
Office, accounting Radio, television andand computing communications
equipment equipment Manufacturing
US 460 172 125
Japan 112 104
Germany 186 129 117
France 128 115
UK 160 103
Canada 97 141 105
Austria 116 134 130
Denmark 99 151 109
Finland 127 193 119
Korea 454 322 150
Mexico 117 144 119
Portugal 195 122
Source: OECD, Economic Outlook, June 2000, p. 183.
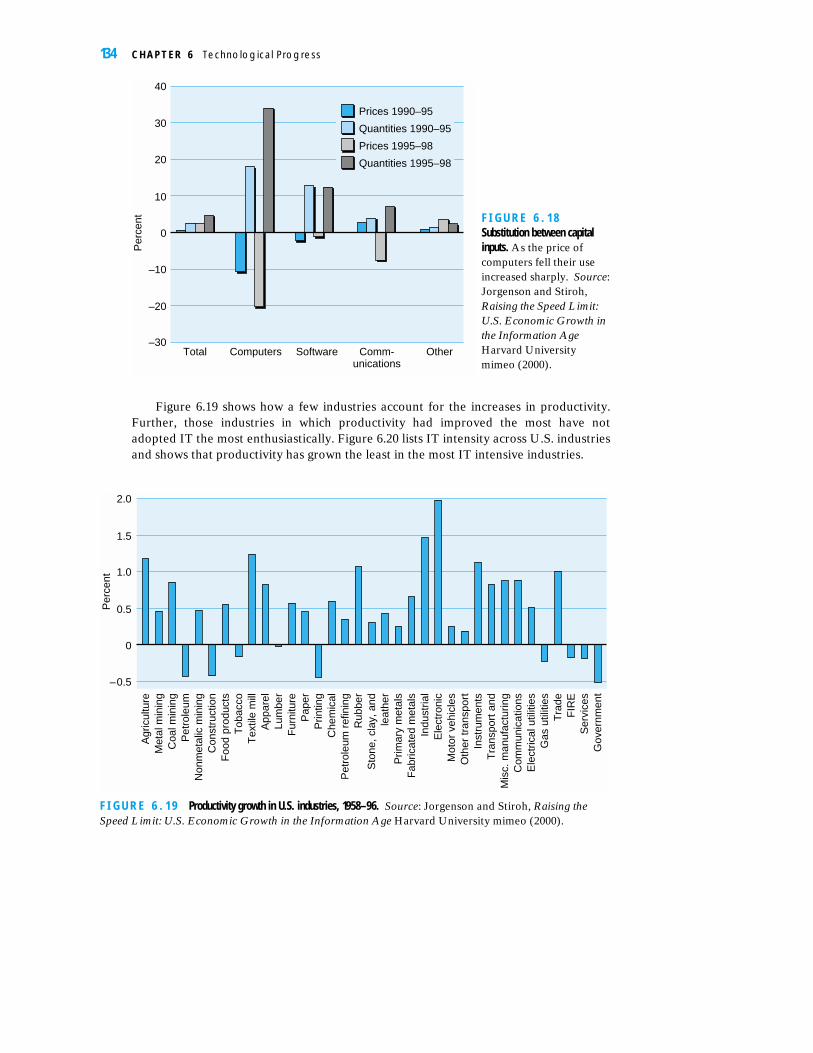
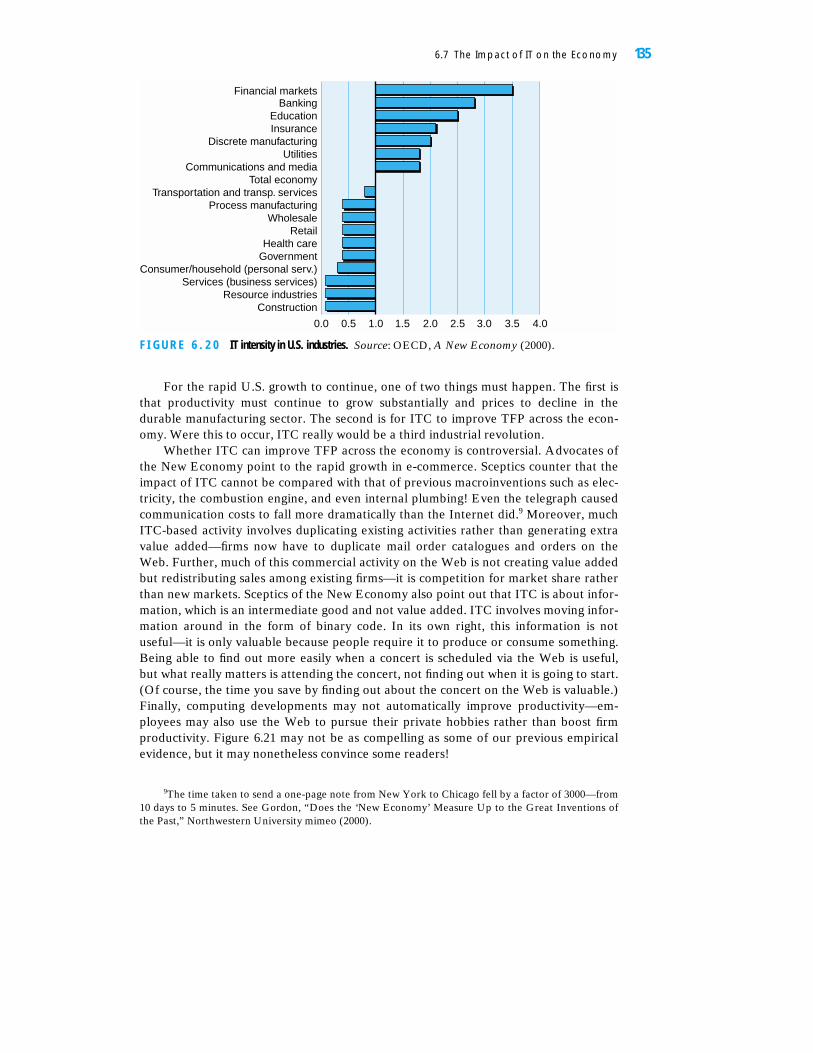
Figure 6.19 shows how a few industries account for the increases in productivity.Further, those industries in which productivity had improved the most have notadopted IT the most enthusiastically. Figure 6.20 lists IT intensity across U.S. industriesand shows that productivity has grown the least in the most IT intensive industries.
134 C H A P T E R 6 Technological Progress
–30
–20
–10
0
10
20
30
40
Per
cent
Prices 1990–95
Quantities 1990–95
Prices 1995–98
Quantities 1995–98
Total Computers Software Comm-unications
Other
F I G U R E 6 . 1 8Substitution between capitalinputs. As the price ofcomputers fell their useincreased sharply. Source:Jorgenson and Stiroh,Raising the Speed Limit:U.S. Economic Growth inthe Information AgeHarvard Universitymimeo (2000).
–0.5
0
0.5
1.0
1.5
2.0
Per
cent
Agr
icul
ture
Met
al m
inin
gC
oal m
inin
gP
etro
leum
Non
met
alic
min
ing
Con
stru
ctio
nF
ood
prod
ucts
Tob
acco
Tex
tile
mill
App
arel
Lum
ber
Fur
nitu
reP
aper
Prin
ting
Che
mic
alP
etro
leum
ref
inin
gR
ubbe
rS
tone
, cla
y, a
ndle
athe
rP
rimar
y m
etal
sF
abric
ated
met
als
Indu
stria
lE
lect
roni
cM
otor
veh
icle
sO
ther
tran
spor
tIn
stru
men
ts
Mis
c. m
anuf
actu
ring
Tra
nspo
rt a
nd
Com
mun
icat
ions
Ele
ctric
al u
tiliti
esG
as u
tiliti
esT
rade
FIR
ES
ervi
ces
Gov
ernm
ent
F I G U R E 6 . 1 9 Productivity growth in U.S. industries, 1958–96. Source: Jorgenson and Stiroh, Raising theSpeed Limit: U.S. Economic Growth in the Information Age Harvard University mimeo (2000).
For the rapid U.S. growth to continue, one of two things must happen. The first isthat productivity must continue to grow substantially and prices to decline in thedurable manufacturing sector. The second is for ITC to improve TFP across the econ-omy. Were this to occur, ITC really would be a third industrial revolution.
Whether ITC can improve TFP across the economy is controversial. Advocates ofthe New Economy point to the rapid growth in e-commerce. Sceptics counter that theimpact of ITC cannot be compared with that of previous macroinventions such as elec-tricity, the combustion engine, and even internal plumbing! Even the telegraph causedcommunication costs to fall more dramatically than the Internet did.9 Moreover, muchITC-based activity involves duplicating existing activities rather than generating extravalue added—firms now have to duplicate mail order catalogues and orders on theWeb. Further, much of this commercial activity on the Web is not creating value addedbut redistributing sales among existing firms—it is competition for market share ratherthan new markets. Sceptics of the New Economy also point out that ITC is about infor-mation, which is an intermediate good and not value added. ITC involves moving infor-mation around in the form of binary code. In its own right, this information is notuseful—it is only valuable because people require it to produce or consume something.Being able to find out more easily when a concert is scheduled via the Web is useful,but what really matters is attending the concert, not finding out when it is going to start.(Of course, the time you save by finding out about the concert on the Web is valuable.)Finally, computing developments may not automatically improve productivity—em-ployees may also use the Web to pursue their private hobbies rather than boost firmproductivity. Figure 6.21 may not be as compelling as some of our previous empiricalevidence, but it may nonetheless convince some readers!
6.7 The Impact of IT on the Economy 135
Financial markets
0.0 0.5 1.0 1.5 2.0 2.5 3.0 3.5 4.0
BankingEducationInsurance
Discrete manufacturingUtilities
Communications and mediaTotal economy
Transportation and transp. servicesProcess manufacturing
WholesaleRetail
Health careGovernment
Consumer/household (personal serv.)Services (business services)
Resource industriesConstruction
F I G U R E 6 . 2 0 IT intensity in U.S. industries. Source: OECD, A New Economy (2000).
9The time taken to send a one-page note from New York to Chicago fell by a factor of 3000—from10 days to 5 minutes. See Gordon, “Does the ‘New Economy’ Measure Up to the Great Inventions ofthe Past,” Northwestern University mimeo (2000).
We asked ourselves two questions in this section. The first was how important ITCwas in explaining the late 1990s U.S. boom—our results suggest that it was important.The second was whether developments in ITC amounted to a third industrial revolu-tion. As we write (in 2000), the data suggest that TFP improvements have been too fo-cused on specific sectors of the U.S. economy to support this argument. But, NewEconomy advocates can point to the slow diffusion of the second industrial revolutionand the increase in TFP in the late 1990s to argue that something more dramatic isoccurring.
S U M M A R Y
Technological progress enables us to produce more output for any given level of factor in-puts and thus to shift the production function upward. With no technological progress, thecapital stock reaches its steady state level, and the economy ceases to grow. Technologicalprogress provides two additional channels for growth: it produces more output from a givenlevel of factor inputs, and it boosts the desired level of capital. The higher level of outputthat technological progress produces means that for a given investment rate a higher amountof depreciation can be met, so that the steady state capital stock increases, which also in-creases output.
Foreign direct investment is increasing in importance and encourages convergenceamong countries. FDI leads both to an increase in the capital stock and a transfer of technol-ogy to the recipient country and so contributes to growth in developing nations.
R&D is one way to create technological progress. The output of R&D is knowledge,which is nonexcludable. This means that firms may not be able to capture the profits from aninnovation and so will undertake too little R&D. To overcome this problem, governmentsoffer patents, which give firms a temporary monopoly to use their inventions, which encour-ages R&D.
136 C H A P T E R 6 Technological Progress
F I G U R E 6 . 2 1 Economists Wonder . . . Source: Boston Globe(from Gordon, “Does the ‘NewEconomy’ Measure up to the Great Inventions of the Past,”Northwestern University mimeo(2000)).
The relationship between technological progress and unemployment is controversial.Theoretically unemployment can increase if output remains static or grows only weakly aftertechnological progress. However, little evidence supports the notion that technologicalprogress leads to higher aggregate unemployment. While technological progress has onlysmall effects on aggregate unemployment, it does contribute to substantial distributionalchanges, which create areas where unemployment rises.
The data suggest that the durable manufacturing sector, and in particular the com-puter/related industries, generated most of the TFP gains in the U.S. economy in the last1990s. The substantial gains in these industries have led to dramatic declines in ITC equip-ment prices, which have encouraged large increases in the ITC capital stock and substitutionaway from older forms of technology. This ITC capital accumulation has increased outputand was a factor in the late 1990s U.S. economic boom. However, the lack of widespreadTFP improvements throughout the U.S. economy means that the data do not (yet) supportthe notion of a third industrial revolution.
C O N C E P T U A L Q U E S T I O N S
1. In this chapter we have assumed that the level of technology can be adjusted independentlyof the capital stock. However, in practice investing in new technology means investing innew machines. Use Figure 6.3 to analyze the implications of this.
2. Two economies have the same investment and depreciation rates, but one has access to aninferior technology. Assuming their initial capital stock is the same, how do their outputgrowth and their steady state output and capital stock differ?
3. How would a technological development that boosted output but produced a higher depre-ciation rate affect output and capital?
4. Is it better to develop your own technological champions or to rely on foreign direct investment?
5. What advantages do industry-wide funded research institutes produce? What problems arethey likely to have?
6. If technological progress is so important for long-term increases in the standard of living,why does it make people so anxious?
7. The commercial real estate industry is concerned that IT developments and the rise of tele-working will cause the demand for office space to decline and rents to fall. Is this justified?
8. Which professional categories do you think will see the biggest changes in employment overthe next 25 years?
9. How have IT developments affected your productivity?
10. Have developments in biotechnology a better claim than IT to be a macroinvention?
A N A L Y T I C A L Q U E S T I O N S
1. Consider an economy in which output in period t is produced by the Cobb-Douglas produc-tion function:
Yt �
Yt is output at time t; Kt is capital at time t; Lt is labor employed at time t; At is TFP at time t.
At.Kbt L1�b
t
Analytical Questions 137
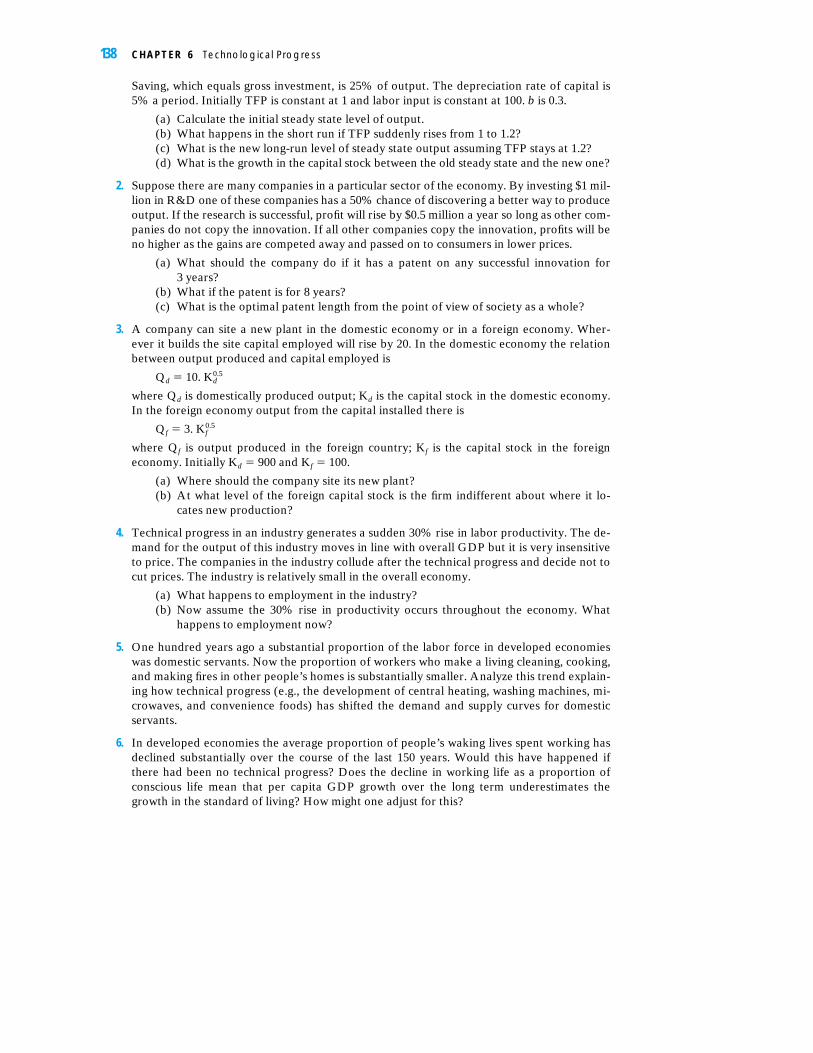
Saving, which equals gross investment, is 25% of output. The depreciation rate of capital is5% a period. Initially TFP is constant at 1 and labor input is constant at 100. b is 0.3.
(a) Calculate the initial steady state level of output.(b) What happens in the short run if TFP suddenly rises from 1 to 1.2?(c) What is the new long-run level of steady state output assuming TFP stays at 1.2?(d) What is the growth in the capital stock between the old steady state and the new one?
2. Suppose there are many companies in a particular sector of the economy. By investing $1 mil-lion in R&D one of these companies has a 50% chance of discovering a better way to produceoutput. If the research is successful, profit will rise by $0.5 million a year so long as other com-panies do not copy the innovation. If all other companies copy the innovation, profits will beno higher as the gains are competed away and passed on to consumers in lower prices.
(a) What should the company do if it has a patent on any successful innovation for 3 years?
(b) What if the patent is for 8 years?(c) What is the optimal patent length from the point of view of society as a whole?
3. A company can site a new plant in the domestic economy or in a foreign economy. Wher-ever it builds the site capital employed will rise by 20. In the domestic economy the relationbetween output produced and capital employed is
Qd � 10.
where Qd is domestically produced output; Kd is the capital stock in the domestic economy.In the foreign economy output from the capital installed there is
where Qf is output produced in the foreign country; Kf is the capital stock in the foreigneconomy. Initially Kd � 900 and Kf � 100.
(a) Where should the company site its new plant?(b) At what level of the foreign capital stock is the firm indifferent about where it lo-
cates new production?
4. Technical progress in an industry generates a sudden 30% rise in labor productivity. The de-mand for the output of this industry moves in line with overall GDP but it is very insensitiveto price. The companies in the industry collude after the technical progress and decide not tocut prices. The industry is relatively small in the overall economy.
(a) What happens to employment in the industry?(b) Now assume the 30% rise in productivity occurs throughout the economy. What
happens to employment now?
5. One hundred years ago a substantial proportion of the labor force in developed economieswas domestic servants. Now the proportion of workers who make a living cleaning, cooking,and making fires in other people’s homes is substantially smaller. Analyze this trend explain-ing how technical progress (e.g., the development of central heating, washing machines, mi-crowaves, and convenience foods) has shifted the demand and supply curves for domesticservants.
6. In developed economies the average proportion of people’s waking lives spent working hasdeclined substantially over the course of the last 150 years. Would this have happened ifthere had been no technical progress? Does the decline in working life as a proportion ofconscious life mean that per capita GDP growth over the long term underestimates thegrowth in the standard of living? How might one adjust for this?
Qf � 3. K0.5f
K0.5d
138 C H A P T E R 6 Technological Progress